Article

Rapid Assessment of Architectural Traits in Pear Rootstock Breeding Program Using Remote Sensing Techniques

1
Department of Biological System Engineering, Washington State University, Pullman, WA 99164, USA
2
WSU Tree Fruit Research and Extension Center, Wenatchee, WA 98801, USA
*
Author to whom correspondence should be addressed.
Remote Sens. 2023, 15(6), 1483; https://doi.org/10.3390/rs15061483
Submission received: 23 December 2022 / Revised: 1 March 2023 / Accepted: 1 March 2023 / Published: 7 March 2023

Abstract

:
Over the decades in the US, the introduction of rootstocks with precocity, stress tolerance, and dwarfing has increased significantly to improve the advancement in modern orchard systems for high production of tree fruits. In pear, it is difficult to establish modern high-density orchard systems due to the lack of appropriate vigor-controlling rootstocks. The measurement of traits using unmanned aerial vehicle (UAV) sensing techniques can help in identifying rootstocks suitable for higher-density plantings. The overall goal of this study is to optimize UAV flight parameters (sensor angles and direction) and preprocessing approaches to identify ideal flying parameters for data extraction and achieving maximum accuracy. In this study, five UAV missions were conducted to acquire high-resolution RGB imagery at different sensor inclination angles (90°, 65°, and 45°) and directions (forward and backward) from the pear rootstock breeding plot located at a research orchard belonging to the Washington State University (WSU) Tree Fruit Research and Extension Center in Wenatchee, WA, USA. The study evaluated the tree height and canopy volume extracted from four different integrated datasets and validated the accuracy with the ground reference data (n = 504). The results indicated that the 3D point cloud precisely measured the traits (0.89 < r < 0.92) compared to 2D datasets (0.51 < r < 0.75), especially with 95th percentile height measure. The integration of data acquired at different angles could be used to estimate the tree height and canopy volume. The integration of sensor angles during UAV flight is therefore critical for improving the accuracy of extracting architecture to account for varying tree characteristics and orchard settings and may be useful to further precision orchard management.

1. Introduction

Pear (Pyrus communis L.), a member of the family Rosaceae, is typically grown in temperate climates and is known for its delicate pleasant taste and highly valued for its edible fruit production [1]. The United States accounts for about 80 percent of the pear production in North America [2], and most of the pears in the country are produced in Washington, Oregon, and California [3]. In general, propagation of pear scion cultivars relies upon budding or grafting them onto rootstocks [4]. Size-controlling rootstocks are considered economically important to enable high-density plantings that lead to producing more fruit per hectare and larger fruit size in commercial orchards [5,6]. Rootstocks are considered a crucial factor responsible for size control, dwarfing, precocity, and stress tolerance [7]. In many parts of the world, quince (Cydonia oblonga) is considered as an effective vigor-controlling rootstock for pear. Nevertheless, it has compatibility issues with some scion cultivars (graft failure), susceptibility to fire blight and iron chlorosis, and lacks winter hardiness, an important trait required for trees grown in the Pacific Northwest region of the US [7]. Despite the rich diversity in the Pyrus germplasm, most of the rootstocks utilized in modern US pear orchards tend to be hybrids of P. communis [8,9].
In this regard, the pear rootstock breeding program at Washington State University (WSU)’s Tree Fruit Research and Extension Center, led by Dr. Kate Evans, aims to develop rootstocks for modern high-density orchard systems and easier management (pruning, thinning, harvesting, etc.) in orchards with well-defined canopy structures. The target traits of the pear rootstock breeding program include tree size control for denser planting, precocity (new trees producing fruits sooner), resistance to diseases such as fire blight, ease in propagation, and winter hardiness. In general, rootstock breeding programs can utilize overall evaluation and measurements of the geometrical and/or architectural traits of the tree crown to represent the dwarfing effect [10]. The biophysical processes such as photosynthesis, respiration, or transpiration are also influenced by the structure of the canopy [11,12]. Various studies have reported the importance of evaluating tree architectural traits [13] that influence tree vigor and productivity, crop yield, and fruit quality [14]. The size and shape of the tree also influence commercial cultivation [15], color, and quality of the fruit, as well as light absorption. Crop growth and architectural differences are also associated with the incidences of pests and pathogens [16]. Traditionally, the structural and geometrical traits such as canopy volume, area, height, and width are measured manually, and this method of sampling can be laborious, time consuming, and expensive [17].
Several sensing approaches such as digital red-green-blue (RGB) imagery, high-resolution radar imagery, light detection and ranging (LiDAR) sensors, etc., have been used to characterize geometric traits of tree species [18,19]. The use of unmanned aerial vehicles (UAVs) with different sensors (also referred to as unmanned aerial system) has been considered a powerful tool for effective monitoring given its flexibility, potential payload, and cost effectiveness [20]. For example, a UAV coupled with an RGB camera was used to measure various morphological characteristics of bush blueberry, such as bush height, extents, canopy area, volume, crown diameter, and width [21]. After systematic under-estimation correction, the mean absolute error was 5.82 cm for height and width estimation. In another study using a 2D LiDAR scanner mounted on a tractor, 3D construction of structural characteristics of fruit orchards, citrus orchards, and vineyards helped in estimating tree height, width, volume, and leaf area [22]. The volume measurements were highly correlated with manual measurements (r = 0.98). UAV-LiDAR 3D point clouds were also used to phenotype individual trees of two eucalyptus species to understand the economically significant traits and the results from this study showed the functional value and genetic diversity of tree architecture can be used to inform the management of natural resources [23]. The precise measurement of tree architectural traits can act as both robust phenotyping tools in tree fruit breeding programs as well as can assist in management decisions in precision agricultural applications. For example, prescription maps can be generated based on tree architectural traits to precisely apply water and other chemicals [18].
Several factors during UAV imaging can affect the image quality and overall results. One such factor is the imaging angle. In our previous work, the tree canopy height and canopy volume of mature peach trees in an organic orchard was evaluated [24]. These tree architectural traits were estimated using multiple approaches using UAV-RGB data and 3D LiDAR data. The UAV-RGB data were acquired at three different angles (45°, 65°, and 90°) and data were processed individually and with integrated datasets to estimate the architectural traits. The results indicated that the features extracted from the images acquired at 45° and integrated nadir and oblique images showed a strong correlation with the ground reference tree height data, while the latter (integrated dataset) was highly correlated with canopy crown volume (estimated by measuring the height, and longitudinal and transversal width of the peach tree crown). With these promising results, the findings (effect of sensor angle and integration) were validated with a larger number of younger trees in the pear rootstock breeding program. The evaluation of height and volume may be more challenging given the close plantings and lower canopy vigor than peach trees. In addition to studying the effect of sensor angles, UAV flight directions (forward and backward) on the extraction of architectural traits were also evaluated. Therefore, in this study, the application of the UAV-RGB data collected at three different sensor inclination angles (45°, 65°, and 90°) and two different flight directions (forward and backward) alongside LiDAR data to extract architectural traits of accessions in the pear rootstock breeding program was evaluated. The architectural traits (height and volume) were extracted from the canopy height model and 3D point cloud of pear trees generated from multiple integrated datasets and the 3D point cloud generated from 3D LiDAR data and compared with ground reference data.

2. Materials and Methods

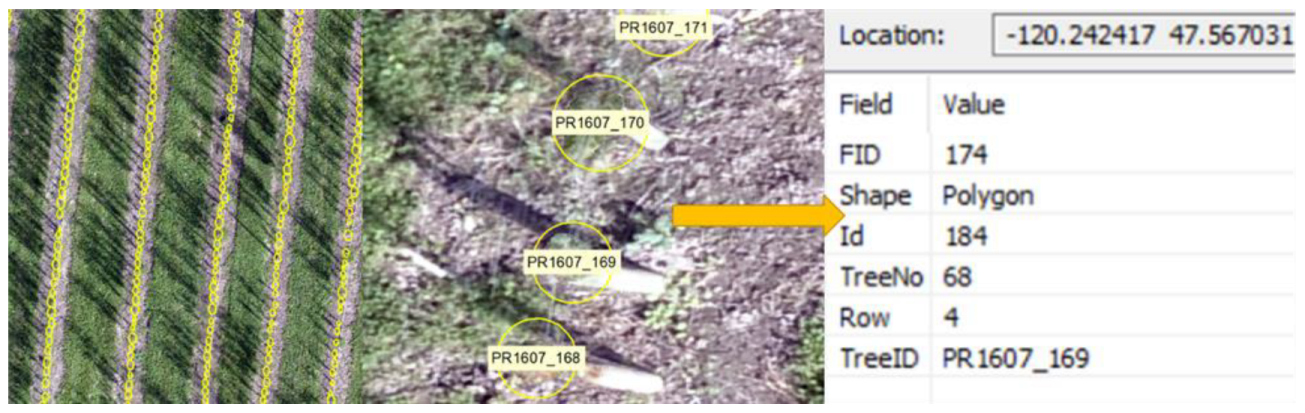
2.1. Study Area and Ground Reference Data

The study was carried out at WSU’s Tree Fruit Research and Extension Center, Columbia View orchard (120°14′32.874″W 47°34′1.571″N), in Wenatchee, WA, USA. Six rows of pear rootstock seedlings, each budded with a ‘d’Anjou’ scion, were selected for this study. The length of each row was about 55 m with an inter-row spacing of 3 m and between-tree spacing of 0.45 m. Seven wooden poles were placed as trellis support in each row.
Ground reference data were collected manually, which include total height (from the bottom to top the central leader, GT_Ht), total scion growth (all new-season growth which includes growth of central leader, new branches, and secondary branches, TSG), central leader growth (new growth of the central leader from pruning point to top, CLG), and trunk cross-sectional area of the scion (scion 10 cm and 20 cm above graft union, TCA_S10 and TCA_S20, respectively).

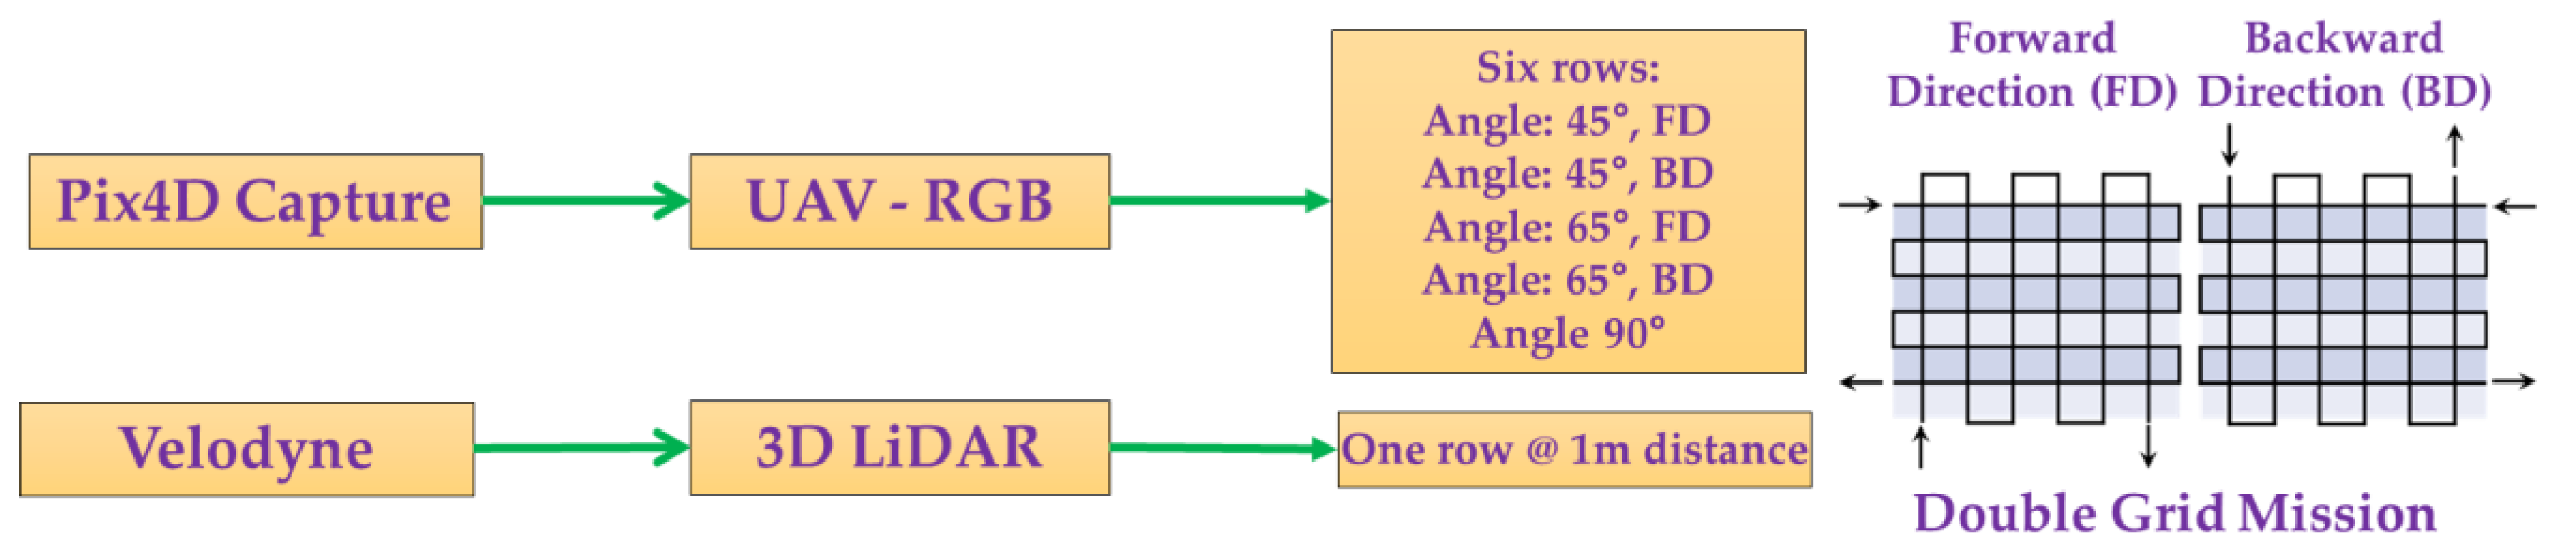
2.2. UAV and LiDAR Data Acquisition

The architectural traits of pear trees were extracted from data acquired using UAV and ground LiDAR systems under no-cloud conditions on 13 September 2021. The UAV system (Phantom 4 Pro, SZ DJI Technology Co., Ltd., Shenzhen, China) equipped with an RGB camera with 20 megapixels and 84° field of view (SZ DJI Technology Co., Ltd., Shenzhen, China) was used to collect the images. Pix4Dcapture software was used as a flight operating system to control the flight parameters. A total of five missions were conducted at an altitude of 15 m with a flight speed of 2.5 m/s and a forward and side overlap of 80% to acquire stereo-paired (images of two views of a scene side by side) images for six rows of pear trees. The images were collected with a double grid mission at three different angles that included nadir (90°) and two oblique angles (65° and 45°). The mission at nadir angle was only captured with single direction (forward/FD), while angular data were captured with two flying directions (FD and backward/BD).
A ground-based 3D LiDAR system (VLP 16, Velodyne LiDAR, San Jose, CA, USA) was used to capture point cloud data in the first row of the pear trees under evaluation. The system can acquire a 360° horizontal field of view and 30° vertical field of view at 1 m from a tree. The range of the sensor is 100 m, and it can produce up to ~600,000 points per scan. In this study, the entire pear tree row was scanned using the LiDAR system. Each tree scan took about 10–15 s, and the dead trees were excluded. The row planting included five poles that served as plant support; therefore, cardboard reference was placed on each pole to differentiate the pole from the scanned tree. The collected dataset consisted of 5199 frames that were saved in .pcap format (packet capture). The “Veloview” software was used to visualize and identify the frame number for each pear tree. Each frame comprised of two trees was exported to .csv (comma delimited). The details during data acquisition using the UAV-RGB and 3D ground LiDAR systems are illustrated in Figure 1.

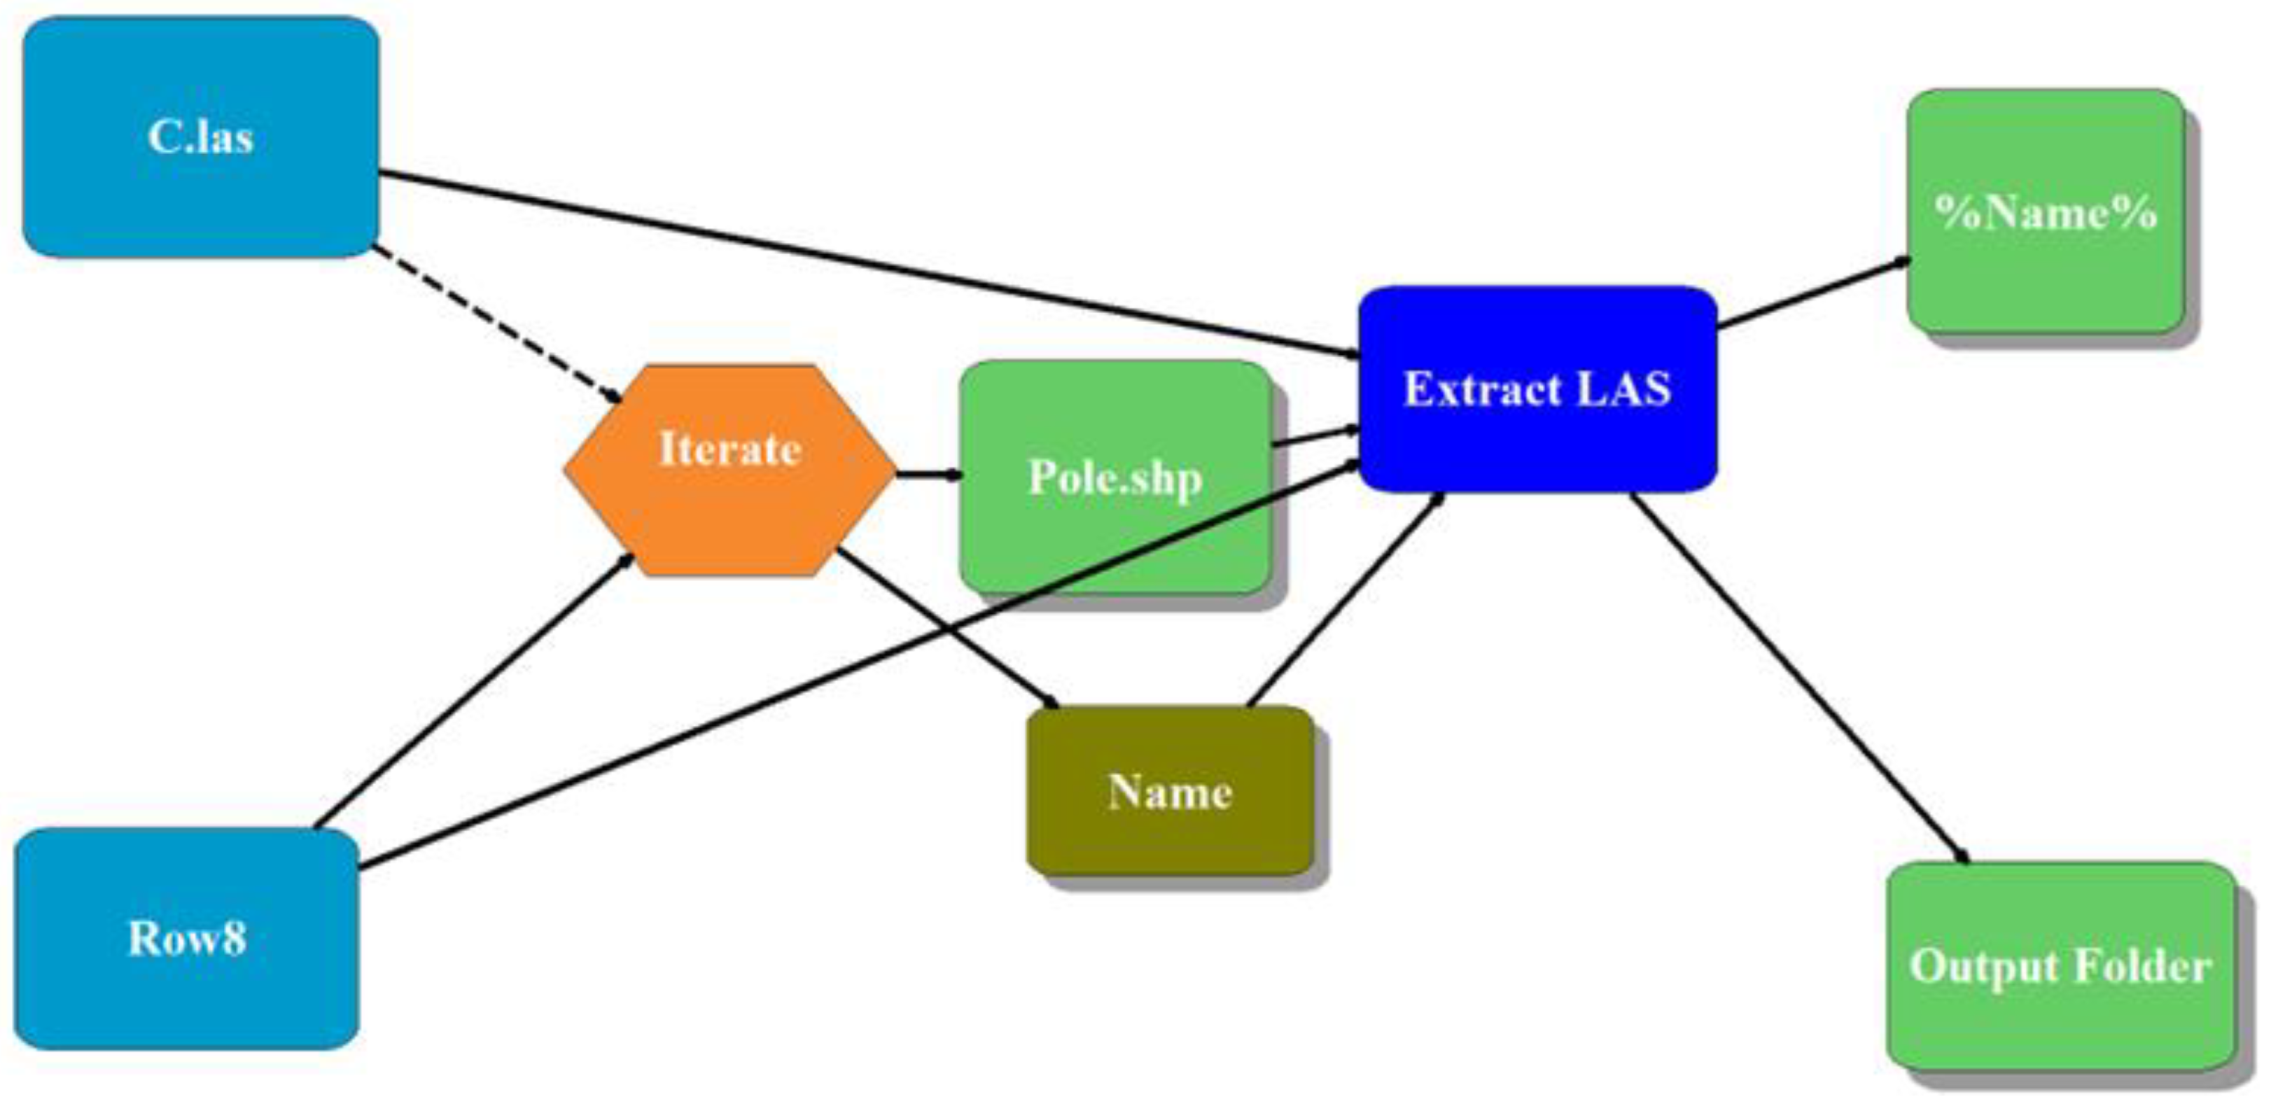
2.3. Preprocessing of the UAV-RGB and LiDAR Data

The stereo-paired geotagged images of individual angles were processed in Pix4Dmapper software (Pix4D Mapper, version 4.3.1, Pix4D, Laussane, Switzerland), which was used to generate the following products: 3D point cloud (.las file) with point cloud classification (vegetation, roads, building, and ground), digital surface model (DSM), digital terrain model (DTM), and orthomosaic images. The software computed key and matching points were calibrated by densifying the point cloud based on the exif data for each image such as longitude, latitude, and altitude of both above ground level and mean sea level from the waypoints. In addition, the datasets were integrated during preprocessing with the following combinations: (1) integration of 45° FD and BD data (I45), (2) integration of 65° FD and BD data (I65), (3) integration of all datasets (90°, 65°—FD and BD, and 45°—FD and BD; I), and (4) integration of all datasets excluding nadir (65°—FD and BD and 45°—FD and BD; Iwo90). The dead trees, poles, rootstocks (non-grafted trees), and the trees before and after poles were excluded prior to the analysis. Thus, a total of 504 trees were considered for further analysis. In regard to LiDAR data, a total of 84 trees were analyzed. The UAV generated four integrated datasets and the respective ground sampling distances are tabulated below (Table 1, derived from Pix4D Mapper). It should be noted that during the construction of the orthomosaic imagery there was a difference in canopy structure with inclusion and exclusion of the 90° dataset (Figure 2). Further evaluation on this aspect is needed.
In 3D LiDAR data acquisition, the extracted .csv file contains seven attributes comprising x, y, z coordinates and scalar fields such as laser ID, azimuth, distance, adjusted time, time stamp, vertical angle, and intensity. Each individual tree was then clipped using the CloudCompare software (https://www.danielgm.net/cc/, accessed on 15 August 2022) based on the position and the ground reference tree ID for further analysis.

2.4. Extraction of Architectural Traits from UAV-RGB and LiDAR Data

The integrated UAV-RGB and 3D LiDAR dataset were analyzed further for the extraction of architectural traits (height and volume). The process included segmentation of individual trees, adding the ground attributes to each tree, and extraction of traits. The overview of the extraction process for architectural traits using UAV and LiDAR datasets is presented in Figure 3. The first step during processing was the individual tree segmentation. The orthomosaic data were overlayed with DTM, DSM, and point cloud data to assist in segmenting individual trees. This approach was an effective way to extract individual tree 3D point cloud extraction for automated processing to extract architectural traits such as height and volume. ArcMap 10.7 and ArcScene 10.7 (ESRI—Environmental Systems Research Institute, Redlands, CA, USA) were utilized to segment the individual trees.
Orthomosaic, DSM, and DTM imagery served as references to create a circle shapefile around each tree and delineate the tree boundaries. Attributes such as individual tree ID, tree number, and row number were added into each tree shapefile (Figure 4). The shapefiles for each individual tree were then exported and saved with the tree ID as the file name.
In regard to the LiDAR data, the entire row was captured in pcap (packet capture) format and information collected during data acquisition was used to separate the trees based on frame numbers using the Veloview software (Version 4.1.3). Each frame consisted of two trees and the frame was exported to .csv format. Individual trees were segmented using the segment tool in CloudCompare. The segmented individual tree was labeled with tree ID for further analysis.
Using Model Builder from ArcScene (10.7) and ArcGIS LAS Dataset Toolset, a model was developed to automatically extract the individual tree 3D point cloud (Figure 5). The model used the individual tree shapefile and 3D classified point cloud as inputs. Export LAS function in ArcGIS Toolset has the capability to filter, clip, and reproject the collection of 3D point cloud from point cloud data referenced by a LAS dataset. Thus, with individual tree shapefile and 3D point cloud data inputs, the model used LAS function to segment individual trees as .las and .lasd files as output, with the same input shapefile names (tree ID).
The second step was the feature extraction from the segmented tree datasets. In regard to UAV-RGB data, two approaches were utilized to extract tree height, one using the DTM and DSM data (T1) and other using the 3D point cloud data (T2). In the T1 approach, the tree height was estimated by extracting the maximum height (MaxHt) and 95th percentile height (95Ht) from the canopy height model (CHM, where CHM = DSM − DTM) within the defined shape using zonal statistics from ArcMap (10.7). The tree height and tree volume were estimated from the 3D point cloud using an automated program developed in MATLAB software (R2021a, MathWorks, Inc., Natick, MA, USA), which could process 504 trees registered as .las files. In the T2 approach, the maximum height of each tree was computed by subtracting the maximum Z value and minimum Z value. In addition, 95th percentile height was also estimated.
In regard to the volume measurement from point cloud, the convex hull and voxel grid (default voxel size of 1 mm resolution) methods were used to measure the canopy volume (ConV and VoxV, respectively). The voxel grid method computes the volume by taking at least one point contained in the voxels, whereas convex hull measures the volume of each connected convex shape [25]. The convex-hull-based volume was measured using the ‘convhull’ function, while voxel grid volume was computed using the scatter function. The 3D point cloud data from LiDAR system were similarly analyzed to extract the tree height (MaxHt and 95Ht) and canopy volume (ConV and VoxV).

2.5. Statistical Analysis

The extracted architectural traits from UAV and LiDAR data were compared with the ground reference data. Using the R program (Version 4.1.1), Pearson’s correlation analysis was performed between the ground reference data and the extracted digital data. In addition, root mean square error (RMSE) was estimated to compute the errors between the extracted and ground reference data.

3. Results and Discussion

3.1. Ground Reference Data

Correlation analysis was performed between the ground reference data. In general, the tree height was highly correlated with TCA_S10 (r = 0.85) and TCA_S20 (r = 0.85) followed by TSG (r = 0.77) and had the lowest correlation with CLG (r = 0.42) (Figure 6). The CLG was less correlated with other ground reference data as well. CLG is associated with annual growth of the trunk only, while other parameters are associated with cumulative multi-year growth factors or cumulative annual growth (TSG), which could be the reason for this observation.

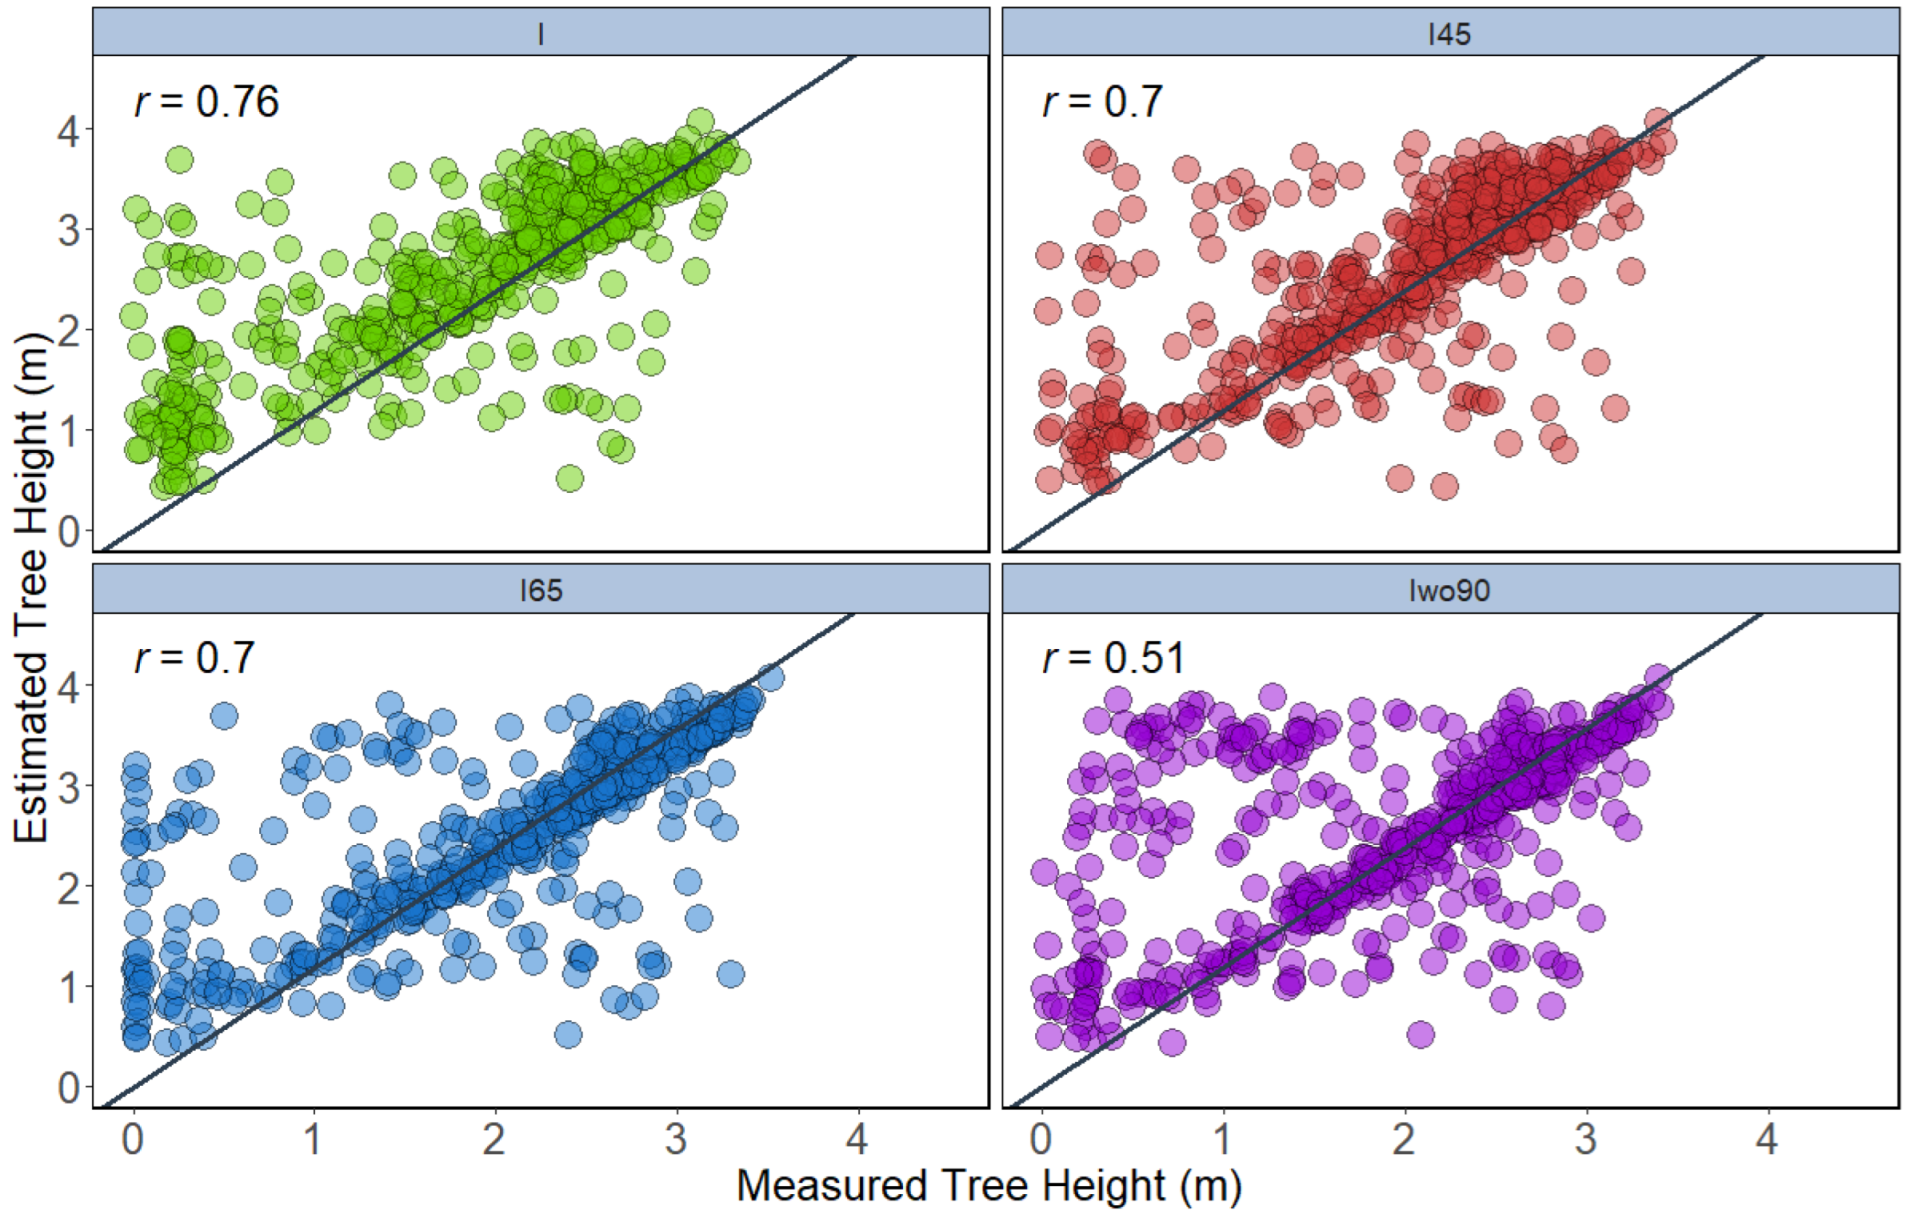
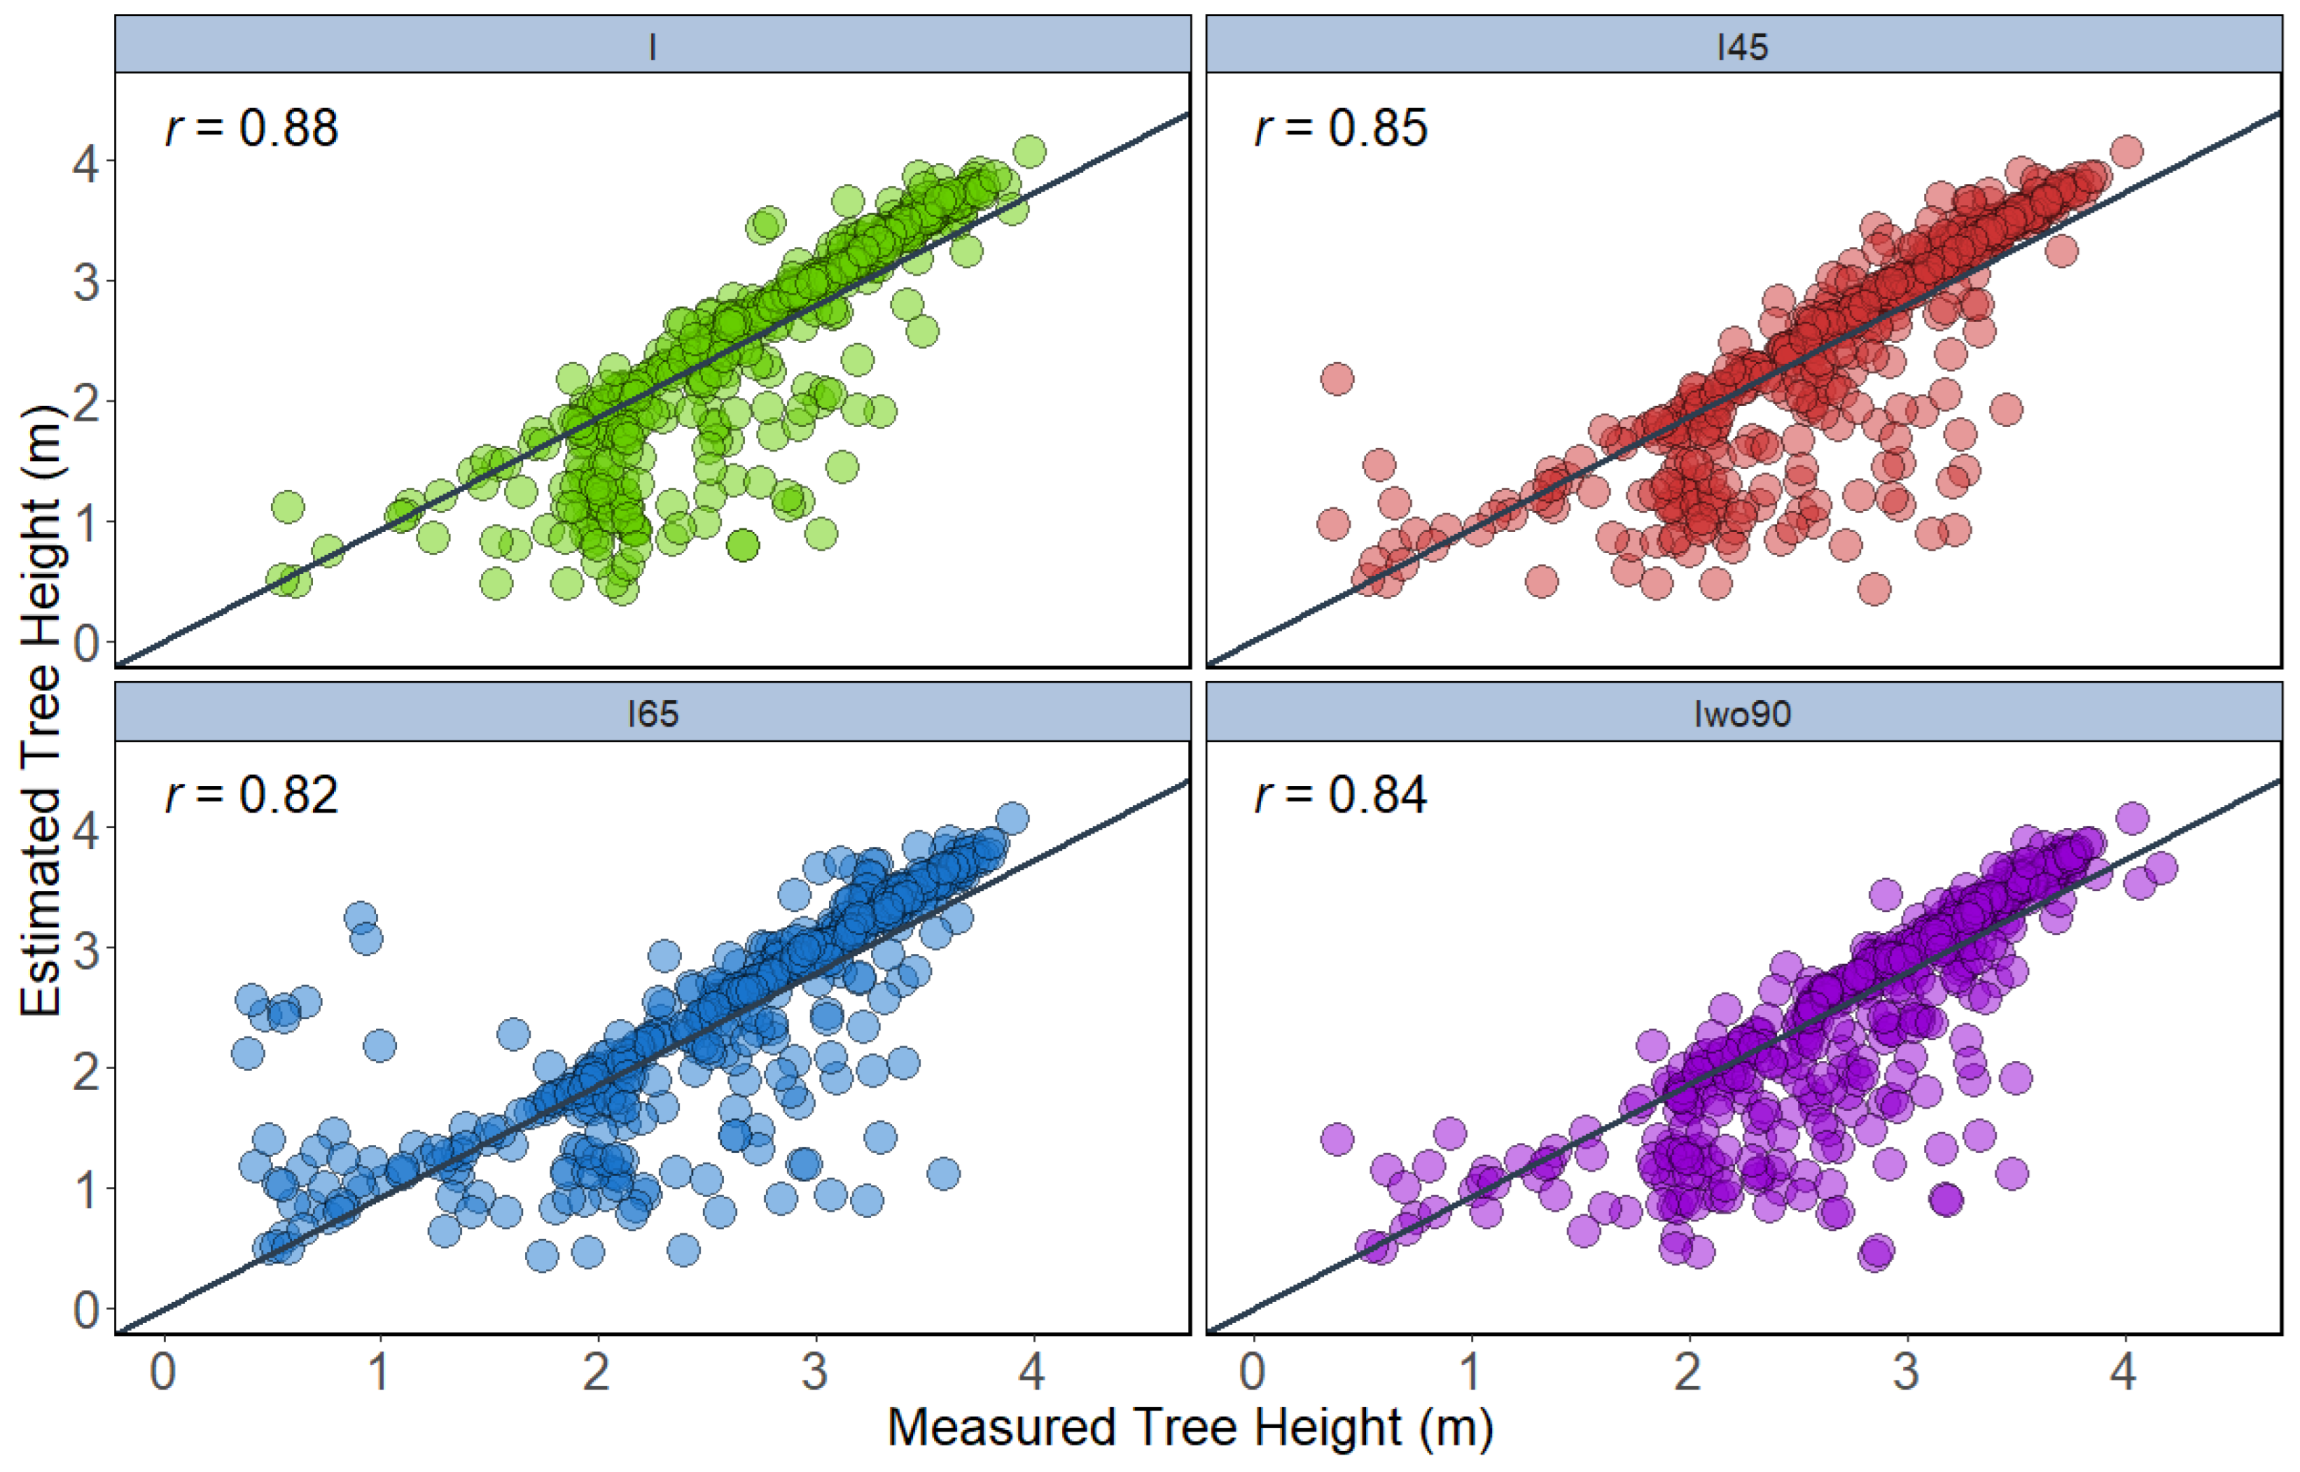
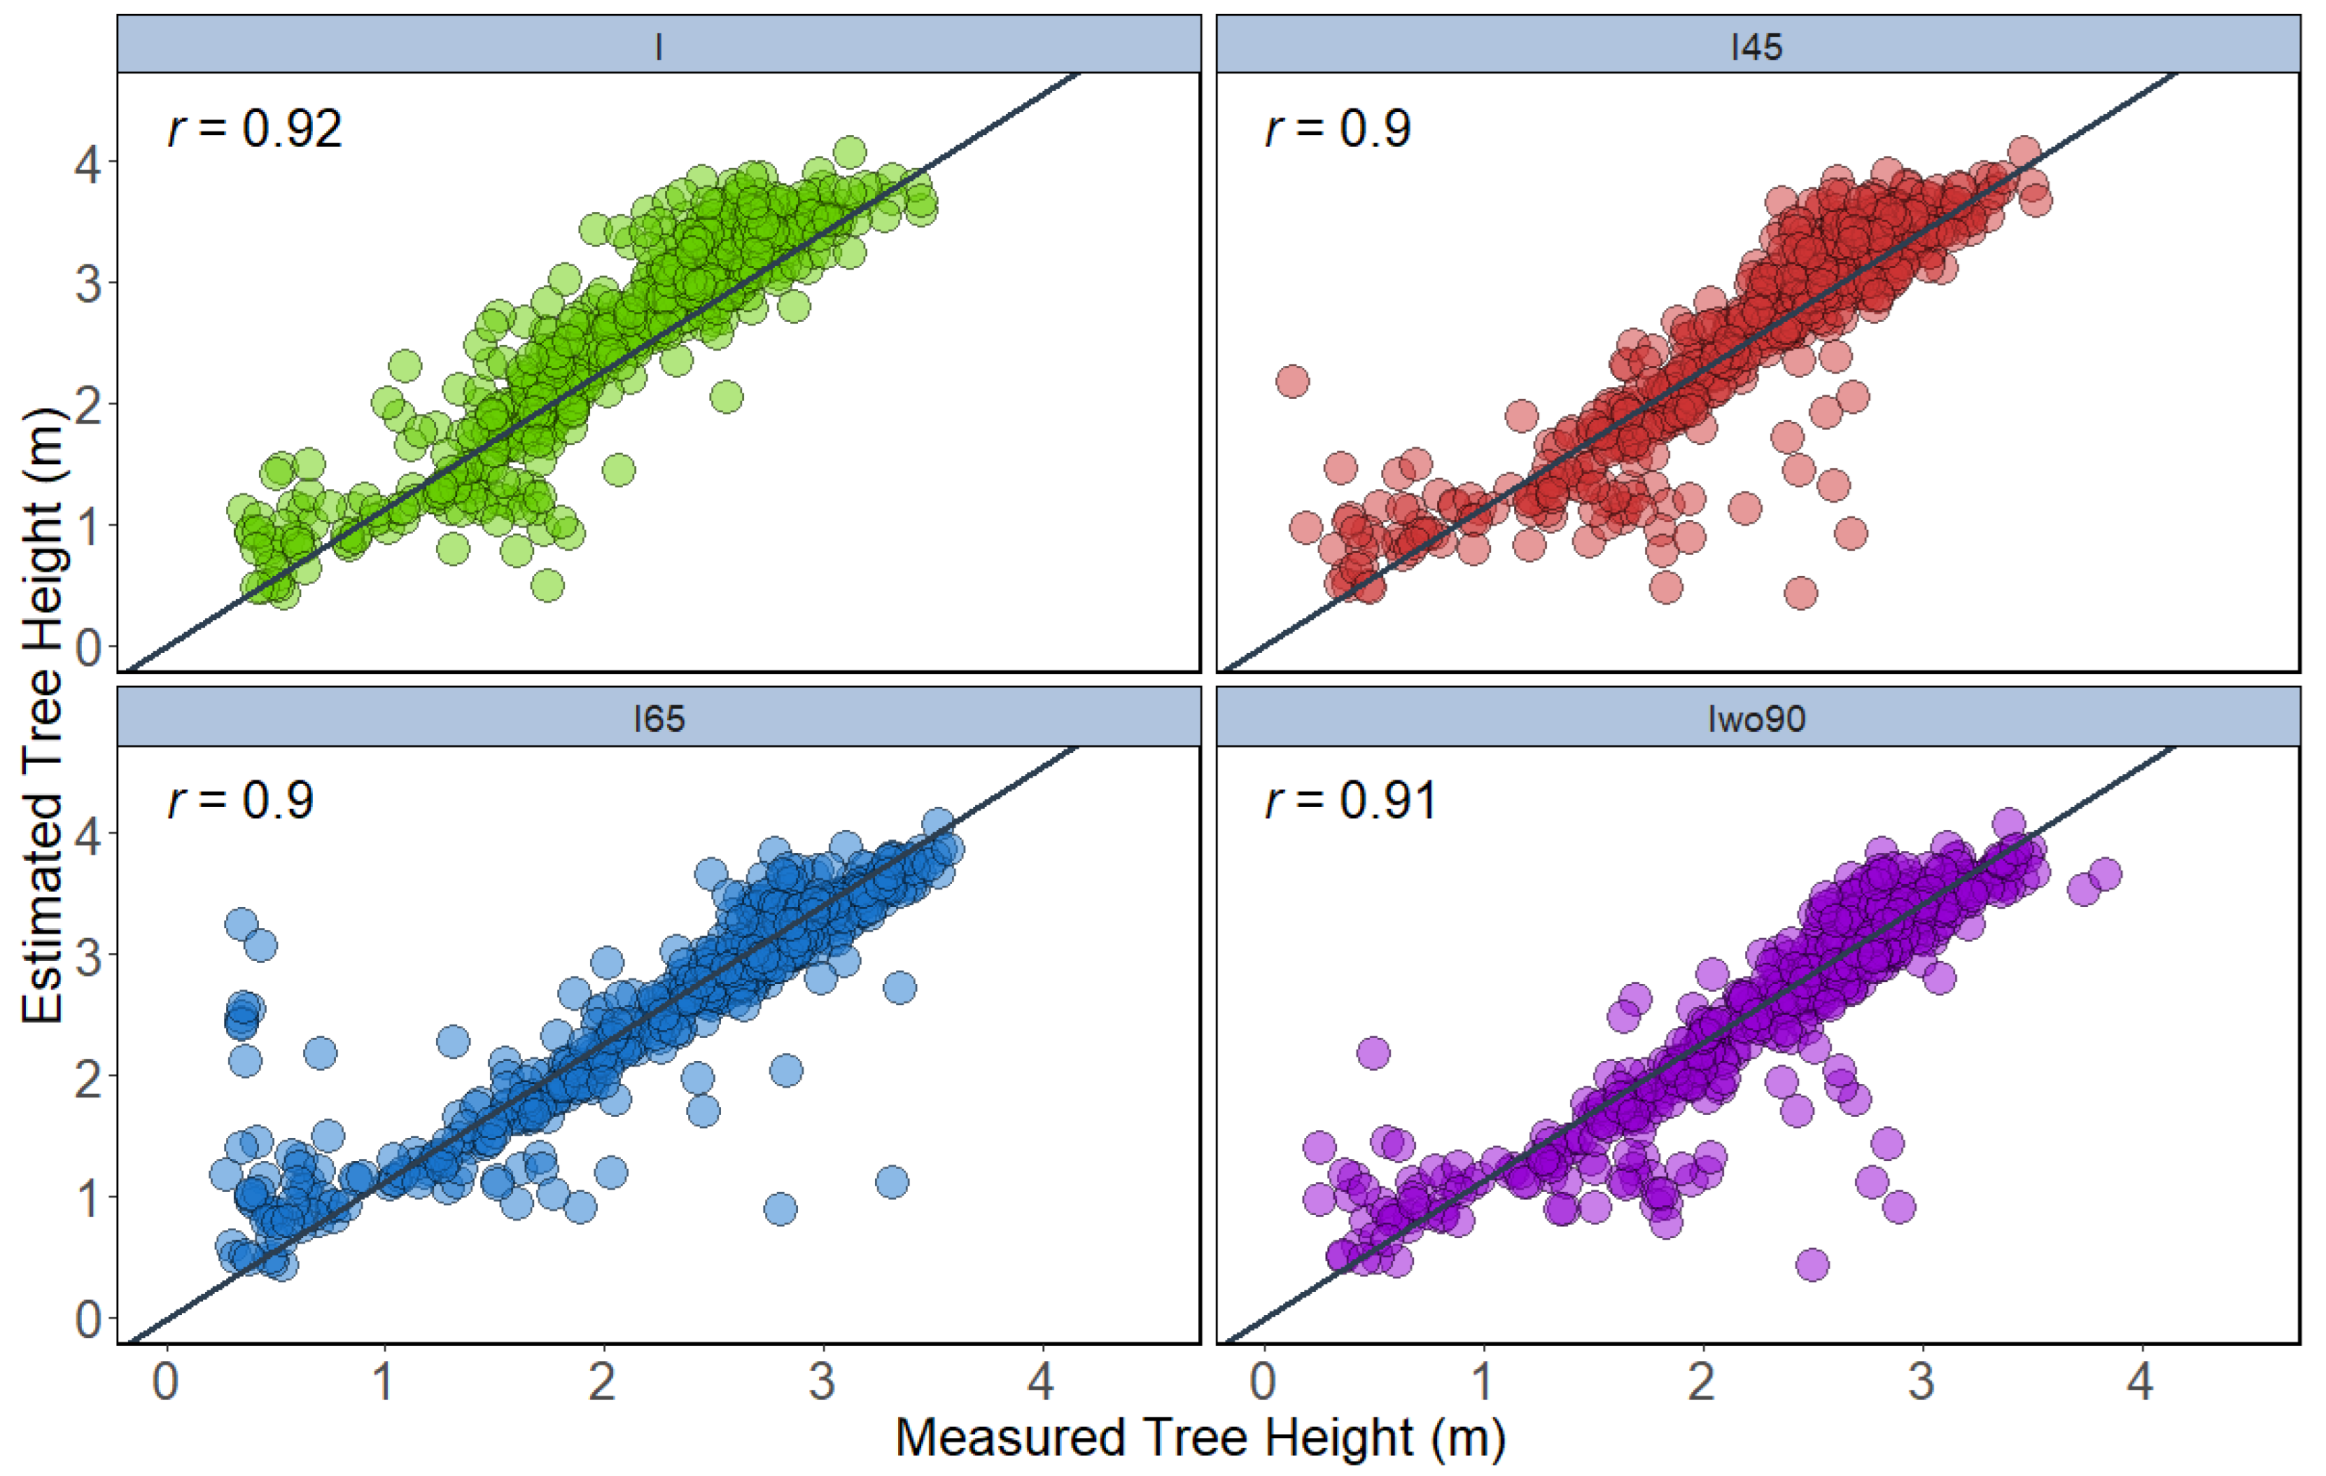
3.2. Tree Height Estimation Using UAV CHM and 3D Point Cloud Datasets

Over the last decade, researchers have started to utilize modern sensing technologies to evaluate the effect of rootstock on tree architecture. A UAV-based high-throughput phenotyping system was used to evaluate the citrus rootstock by detecting and measuring tree canopy size, and the result showed high precision (99.9%) for tree count and high correlation for tree canopy size [26]. This study utilized two sensing approaches to evaluate the accuracy of UAV-RGB and LiDAR data towards the tree height and canopy volume measurements, as indicators for overall canopy vigor. The UAV-RGB data were collected at three sensor inclination angles (45°, 65°, and 90°) and two different flight directions (forward and backward) were integrated to study the influence of sensor angle on precisely extracting the canopy vigor traits in the pear rootstocks.
Two approaches (T1 and T2) were performed to estimate tree height using 2D (CHM) and 3D datasets, respectively. Two different tree height parameters were extracted for both T1 and T2 approaches, namely the maximum height and 95th percentile height. In the T1 approach, the integration of the 45° (r = 0.77) dataset showed slightly higher correlation with the ground reference height data for maximum height, followed by integration of all angles (r = 0.76), integration of all angles except 90° (r = 0.76), and integration of 65° (r = 0.75) (Figure 7). The height extracted using 95th percentiles of height in the T1 approach showed that the integration of all angles (r = 0.76) illustrated high correlation to the ground-measured height compared to the other datasets. The integration of all angles except 90° showed the least correlation in height measurement for the T1 approach when using the 95th percentile height (Figure 8).
A correlation analysis was also performed between the extracted height traits and other ground reference data (Figure 9). The correlation coefficients between the extracted height traits and other ground reference data were similar between the four datasets (I45, I65, I, and Iwo90). In general, the digital height traits showed good correlation with TCA traits and ground-measured tree height, with extracted maximum height showing better results than the 95th percentile height. In a previous study, two vegetative traits (TCA and tree height) and seven generative traits in multiple apple cultivars on the slender spindle or the super spindle training system were measured [27]. Similar to this study, there was a strong and significant relationship (p = 0.05) between TCA and tree height. In our study, the digital traits were less correlated with CLG (new growth of the central leader from pruning point to top), which is measured annually.
In the T2 approach, the tree height traits were extracted from a 3D point cloud generated from UAV-RGB datasets. The height extracted from integration of all angles using maximum height showed the highest correlation (r = 0.88) with ground reference data, followed by integration of 45° (r = 0.85), integration of all angles except 90° (r = 0.84), and integration of 65° (r = 0.82) (Figure 10). In terms of 95th percentile height, extracted height from integration of all angles (r = 0.92) was highly correlated with the measured height. The other datasets such as integration of all angles except 90° (r = 0.91), integration of 45° (r = 0.90), and integration of 65° (r = 0.90) also showed similar correlation (Figure 11).
The point-cloud-based approach was also found to be better than the CHM-based approach, unlike our previous work [24], which could be associated with the tree status (more mature trees in our previous work). Probably, the CHM-based approach could be more suitable for orchards with mature trees with better canopy vigor. The correlation between the extracted height and other ground reference data parameters showed that 95th percentile height data from T2 approach were better correlated than the maximum height data (Figure 12). These results (95th percentile better than maximum height) are found in other research papers, especially involving point cloud data [28,29,30,31]. For example, UAV equipped with RGB and a five-band multispectral camera was used to estimate the above-ground biomass of winter pea for three breeding trials. The results showed that the pea canopy height extracted by the DSM-based approach at the 95th percentile showed high correlation (r = 0.71-0.95, p < 0.001) with ground reference data [28]. This could potentially be due to elimination of potential noises (data extremes) in point cloud data. Similar to the T1 approach, the differences between the different integrated datasets were minimal.
The results from this study are similar to those reported in the literature. For example, Ampatzidis et al. [26] found that the manually measured canopy area and UAV estimated canopy area were highly correlated (Pearson’s r = 0.84) during citrus rootstock evaluation. Similarly, Rallo et al. [17] evaluated young trees as a part of an olive breeding program and found that the Spearman’s correlation coefficient between field- and UAV-data-based tree height and canopy volume across training systems and years ranged from 0.87–0.96 and 0.68–0.91, respectively.
During linear regression analysis between digital height traits and ground reference data, RMSEs were computed. In general, the lowest RMSEs were found (<1 m) during tree height prediction, which can be expected, as the extracted digital traits were associated with the tree height. The height traits extracted from 3D point cloud data showed lower errors than those extracted from CHM data (Table 2). Overall, the minimum RMSEs in height prediction (with 95Ht) were with the integrated 3D point cloud data with all datasets and the dataset without the 90°, though height (95Ht) predicted from integrated 45° and 65° datasets showed errors with only 3–4 cm difference.

3.3. Comparison of Tree Height and Canopy Volume between UAV-RGB and LiDAR 3D Point Cloud Datasets

The extracted maximum LiDAR tree height was plotted with ground-measured height (Figure 13). The results showed that the extracted height from the 3D LiDAR using maximum height showed the highest correlation (r = 0.97) with the ground-measured height. A correlation analysis was performed for height extracted from the 3D LiDAR and 3D UAV point cloud using maximum and 95th percentile height with ground-measured height (Figure 14). The terrestrial LiDAR system has been used for evaluating tree canopy characteristics [32,33,34], mostly associated with mature trees. Wu et al. [34] compared the tree height from both terrestrial LiDAR and UAV systems in evaluating tree height of avocado and mango trees and found them to be highly correlated (R2 = 0.81–89, RMSE—0.19–0.42 m). In this study, the maximum height of LiDAR data was found to be highly correlated with 95th percentile height data from the UAV point cloud (r = 0.82–0.93).
In terms of volume measurement, both convex-hull- and voxel-grid-based methods were used. The volume extracted using convex hull and voxel grid showed high correlation (r = 0.99) between them. In convex hull, the 3D LiDAR volume was highly correlated with the integration of 65° datasets (r = 0.84). In the voxel-grid-based measurement, integration of the 65° dataset and integration without the 90° dataset volume (r = 0.84) showed high correlation with the 3D LiDAR voxel grid volume (Figure 15).

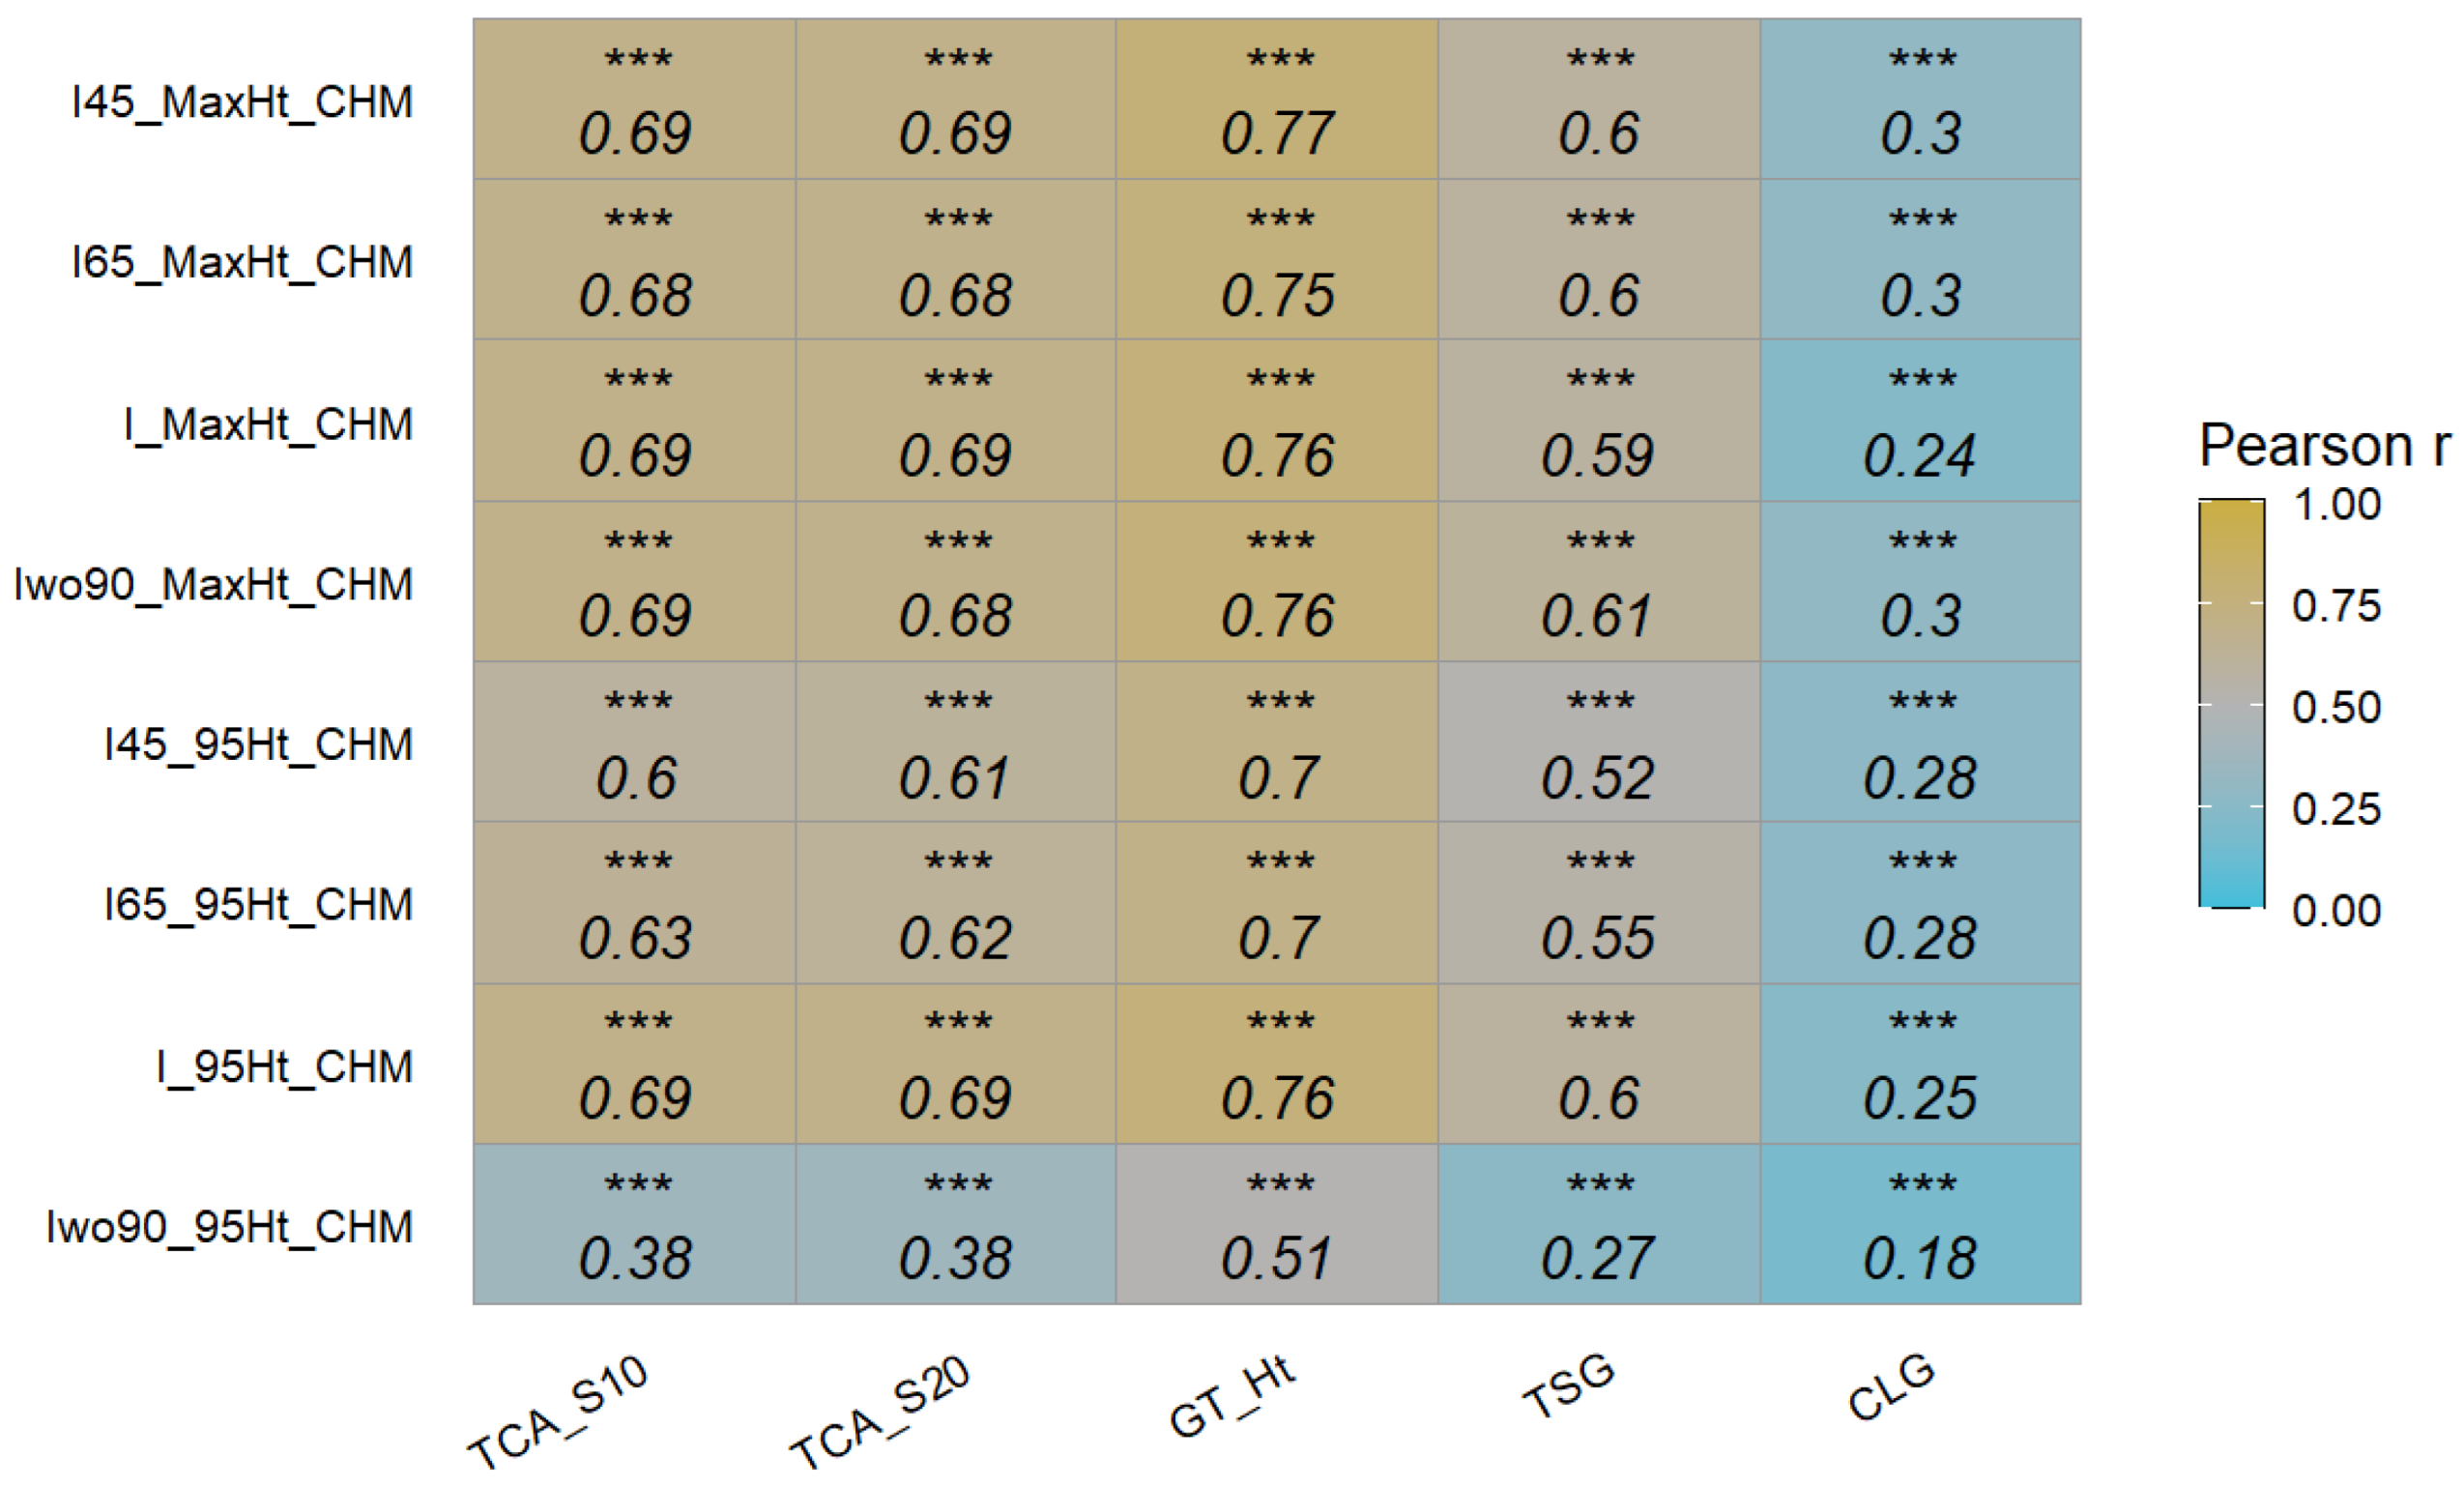
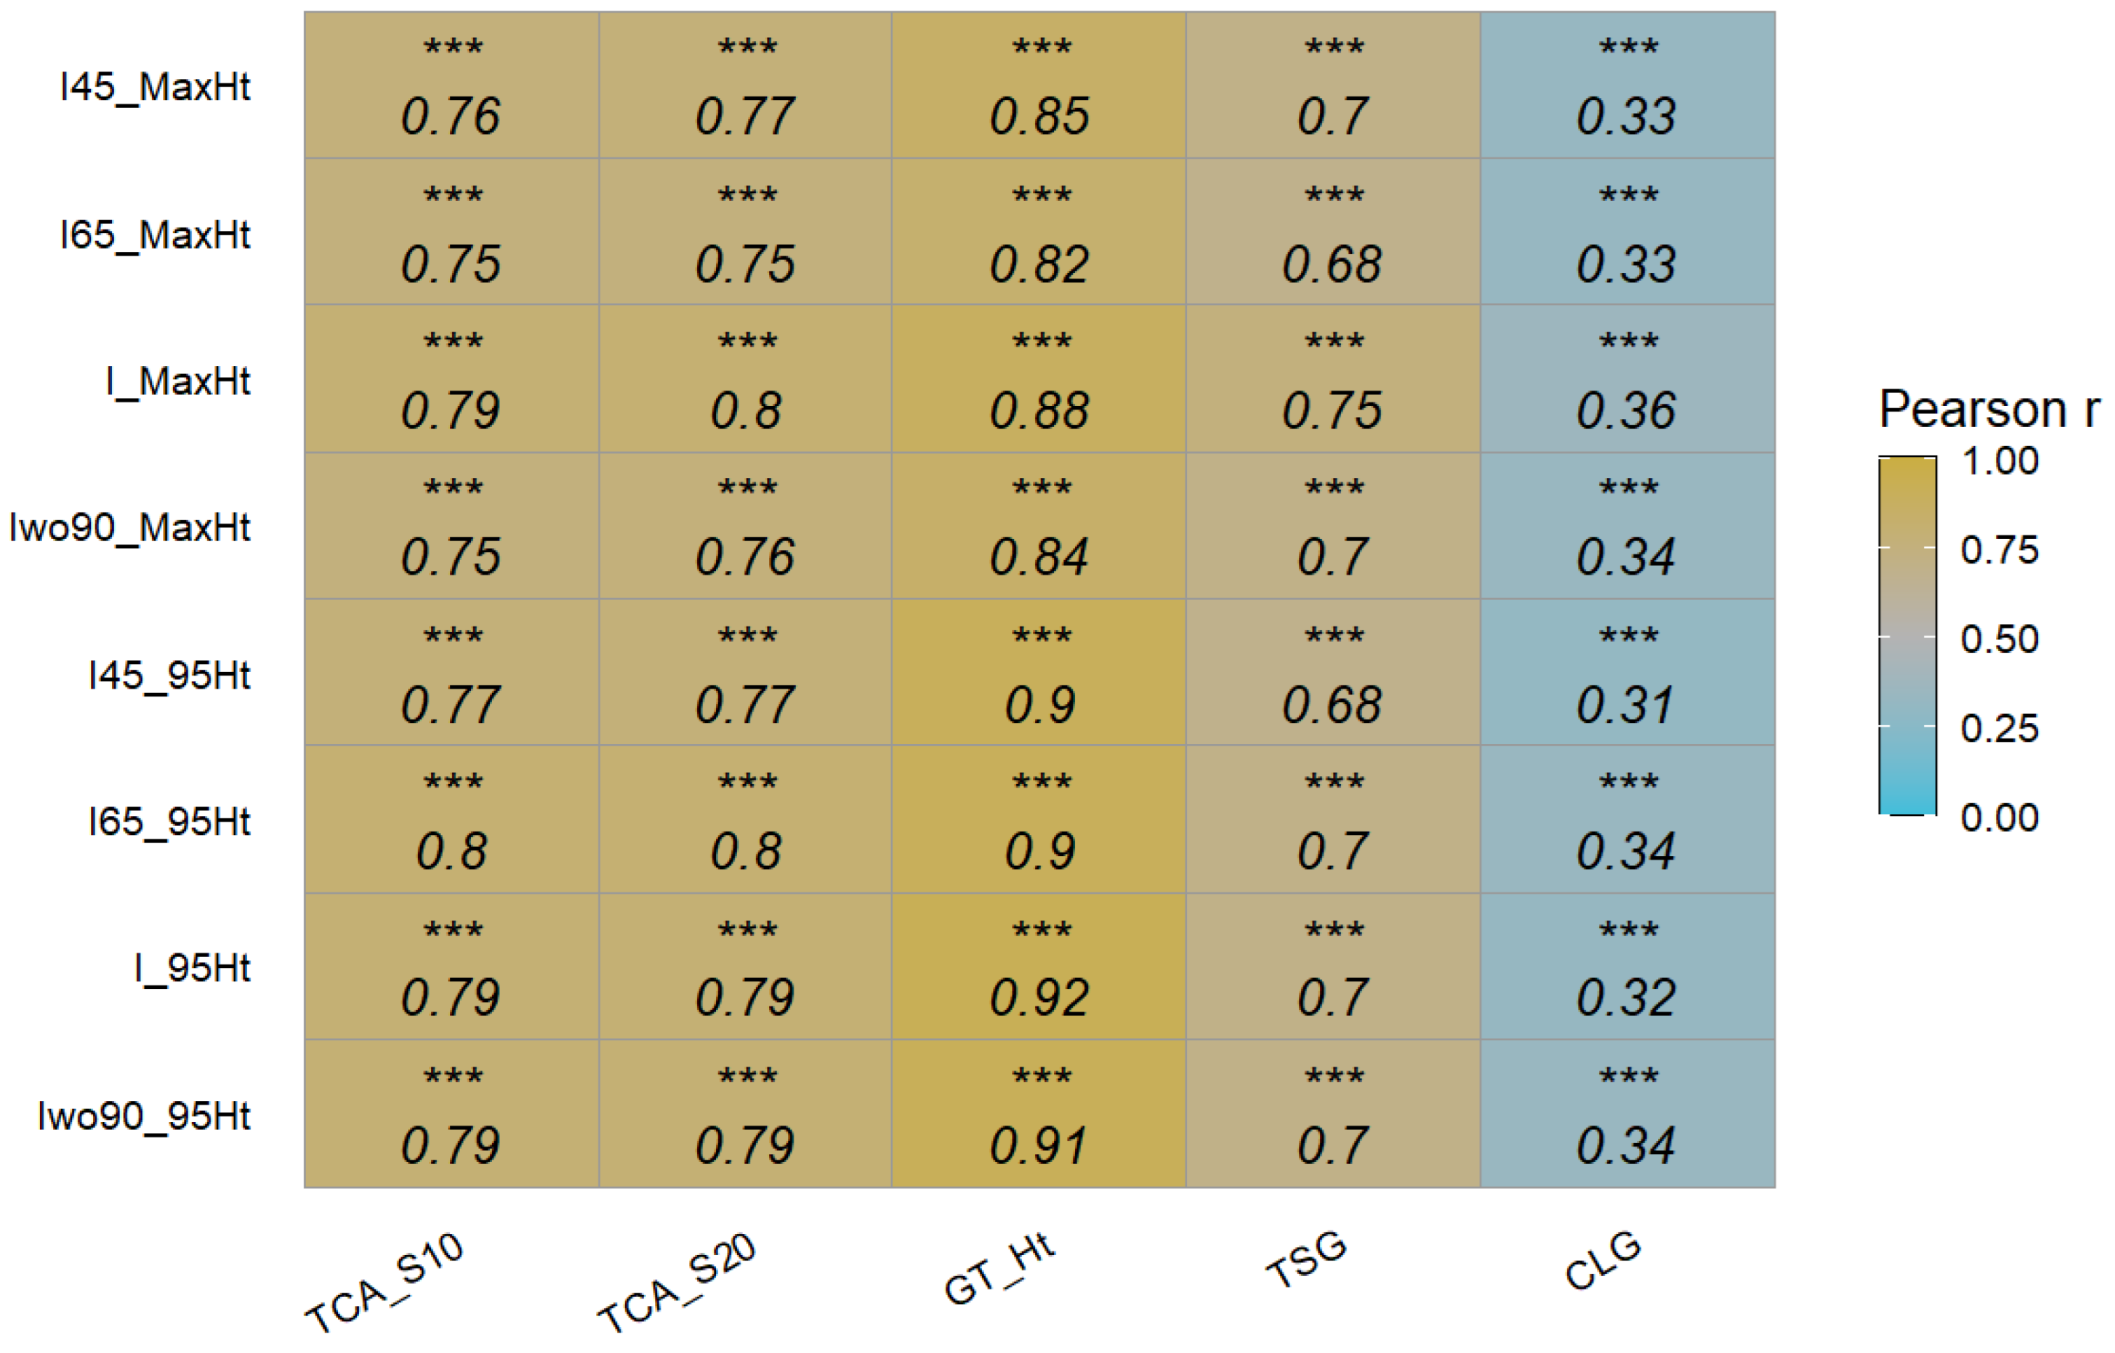
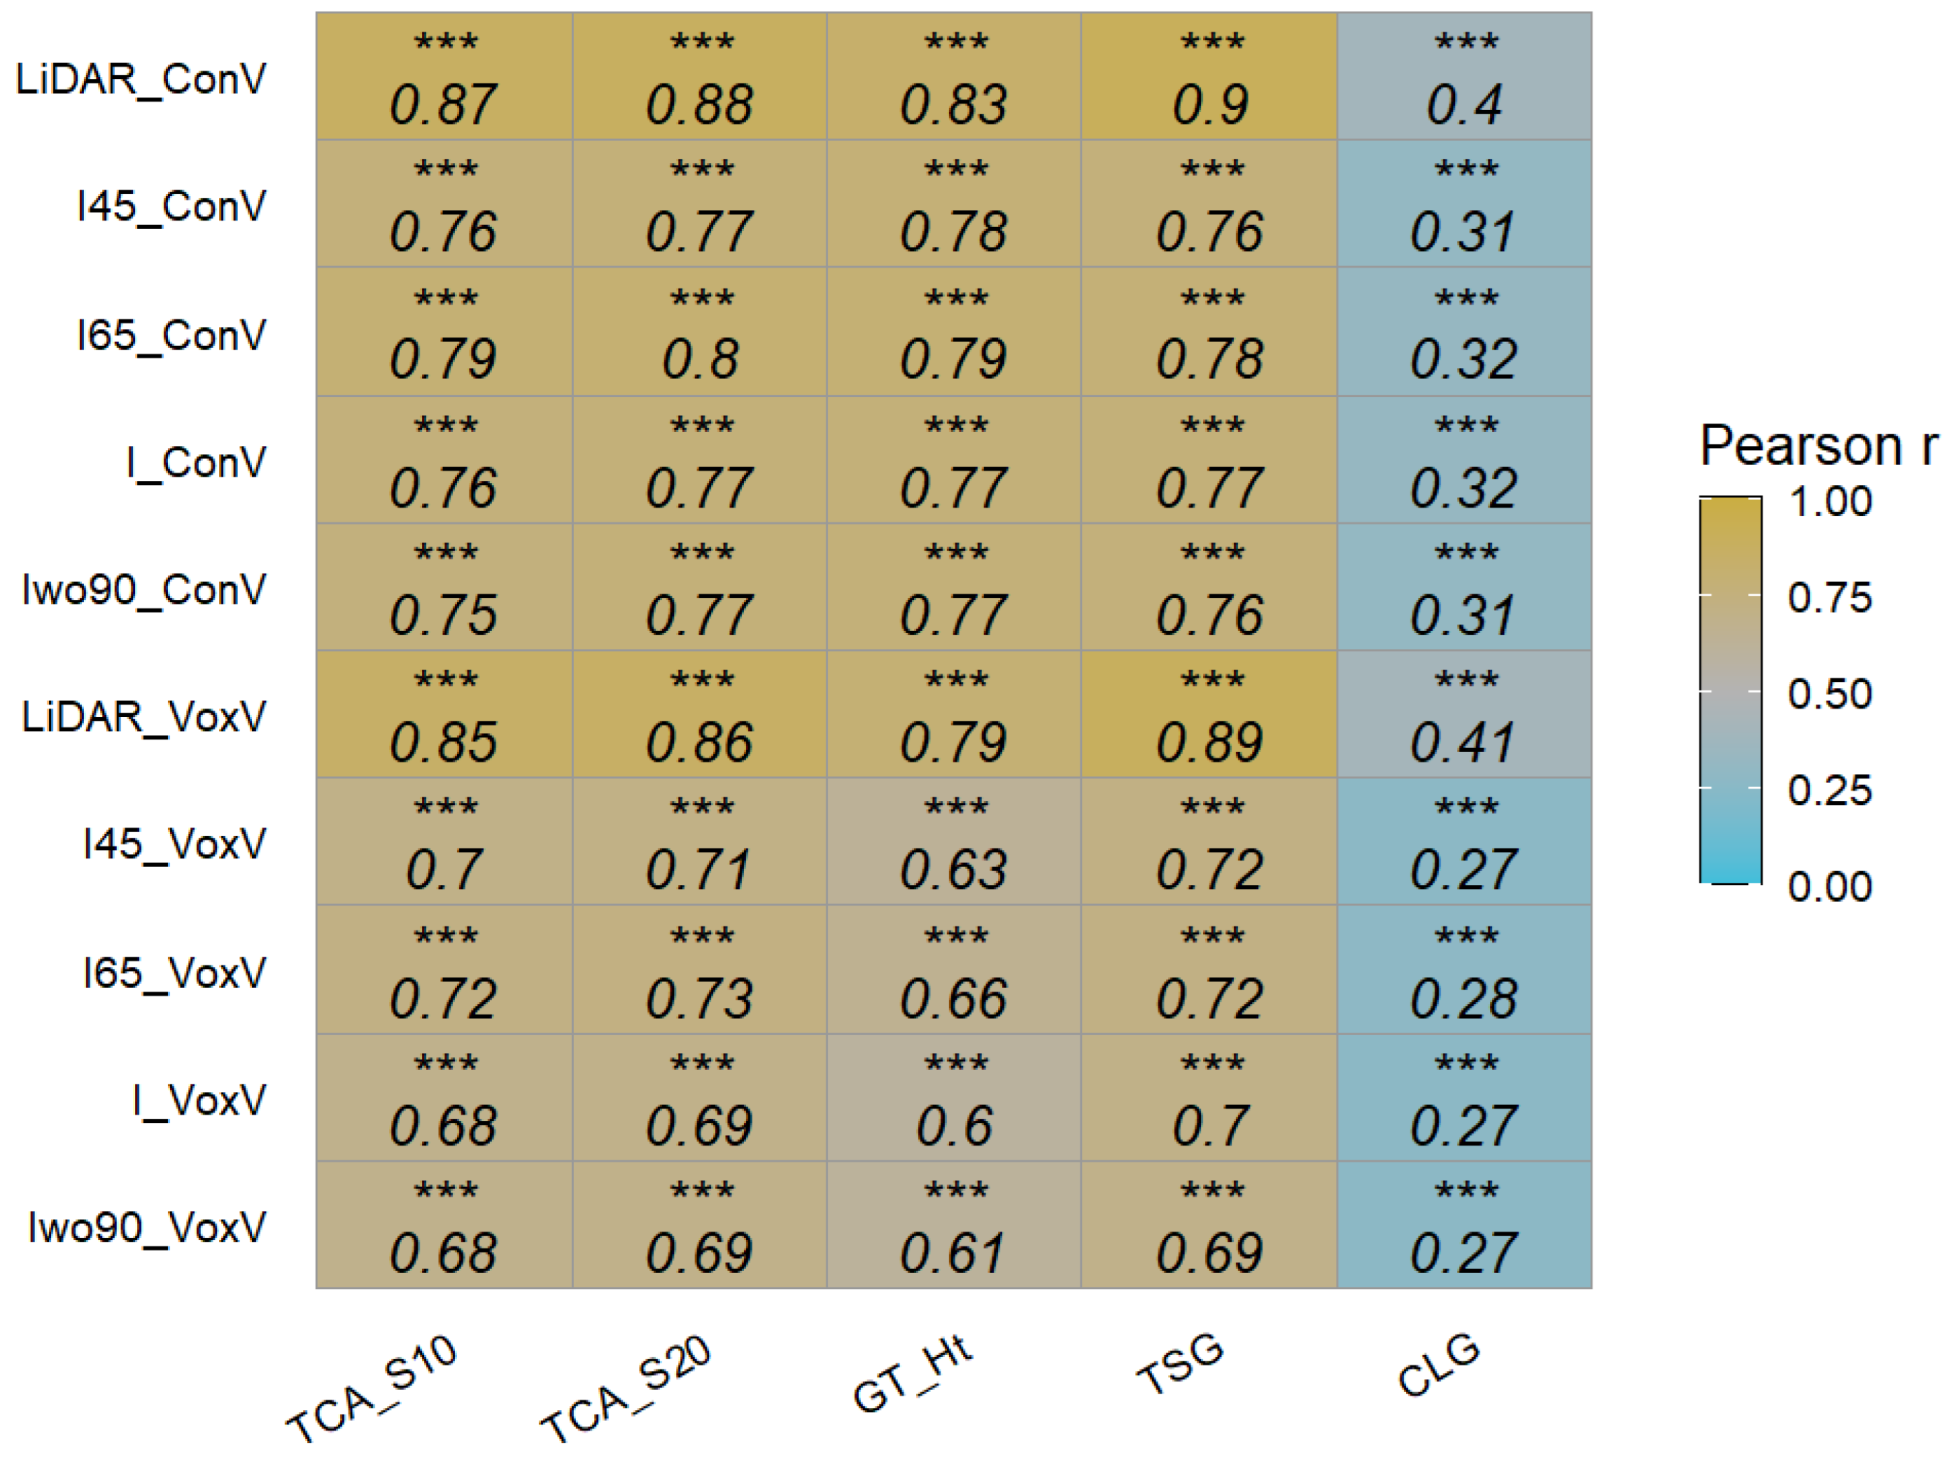
3.4. Comparison of Canopy Volume from UAV-RGB and LiDAR 3D Point Cloud Datasets with Other Traits

The canopy volume (pseudo-indicator of canopy vigor) data were estimated using the convex hull and voxel methods for the 3D point cloud from UAV-RGB and LiDAR datasets. In most cases, the convex hull and voxel grid volume were highly correlated within each dataset. The extracted volume data were correlated with other ground reference data (Figure 16). The volume extracted using convex hull from 3D LiDAR showed the highest correlation with the ground height (r = 0.83), TCA_S10 (r = 0.87), TCA_S20 (r = 0.88), and TSG (r = 0.90).
In terms of the UAV point cloud, the canopy volume extracted using convex hull from all integrated datasets showed higher correlations with ground reference data than the voxel grid method. The RMSE was computed between extracted volume and ground reference data (Table 3). In general, LiDAR data showed the lowest RMSE value between the extracted volume from the convex hull approach and measured ground parameters. In regard to UAV data, the errors in estimating ground reference data were more similar between different datasets, with convex hull estimates better than voxel grid approaches. Colaço et al. [32] used a 2D LiDAR system on citrus trees and found a good correlation between the canopy height and volume computed using a cluster analysis (r = 0.71). The correlation between tree height and volume in this study was higher (r = 0.79–0.83).

4. Conclusions

In this study, five UAV flight missions were conducted to acquire high-resolution RGB imagery at different sensor inclination angles with different directions along with ground-based 3D LiDAR to extract the architectural traits for pear rootstock seedling trees. The acquired datasets from UAVs were processed to extract CHM and 3D point cloud to extract the architectural traits such as tree height and canopy volume. The maximum and 95th percentile height and canopy volume (using convex hull and voxel grid approaches) were extracted from four different integrated datasets and validated the accuracy with the ground measurements. In general, there is no significant difference between the different integrated datasets and the ground reference data. Nevertheless, the 3D point cloud data showed good correlation (0.89 < r < 0.92) with ground-measured canopy height data compared to the CHM-based approach (0.51 < r < 0.75).
In regard to the canopy volume, both volume estimates from the convex hull and voxel grid approaches were strongly correlated with ground reference data (0.60 < r < 0.90), except central leader growth. The strongest correlation was observed between the volume extracted from the LiDAR data and total scion growth (r = 0.90), though the RMSEs were high. Thus, the 3D point cloud with integrated datasets can be used to precisely measure architectural traits in pear rootstock breeding programs. Further studies are recommended to extract other vigor-related traits, such as branching angles, number of branches, and branch diameters, which help in pear rootstock phenotyping.
UAV and LiDAR systems have been used to evaluate the tree fruit canopy characteristics, where the latter is more commonly applied for applications in orchard management. The success of these technologies in assessing the tree traits depends on the age of the tree and associated canopy vigor, training system, and planting conditions (trellis, inter tree distance, etc.), among other factors. In recent years, UAV-based approaches have advanced greatly with the improvements in the resolution of camera systems, photogrammetry software, and computational resources. The throughput of UAV technology will outweigh the accuracy and precision of LiDAR systems, especially for large-scale operations such as in the tree fruit breeding programs. The tree height and volume data extracted from such UAV technology that represents canopy vigor can be greatly beneficial to tree fruit breeders. Nevertheless, one of the challenges in this study was the segmentation of the trees. The throughput in feature extraction of the architectural features can be further improved through automation of tree segmentation.

Author Contributions

Conceptualization, M.G.R., S.S. and K.M.E.; methodology, M.G.R., A.M., S.S., S.L.T., Z.B.Y. and K.M.E.; formal analysis, M.G.R. and A.M.; investigation, M.G.R., A.M., S.S., S.L.T., Z.B.Y. and K.M.E.; resources, S.S. and K.M.E.; data curation, S.L.T., Z.B.Y. and M.G.R.; writing, M.G.R. and S.S.; writing—review and editing, A.M., S.L.T., K.M.E. and Z.B.Y.; visualization, M.G.R.; supervision, S.S. and K.M.E.; funding acquisition, S.S. and K.M.E. All authors have read and agreed to the published version of the manuscript.

Funding

This research was funded by the US Department of Agriculture National Institute of Food and Agriculture (USDA-NIFA) hatch and multistate project (accession number 1014919, NC1212), and Washington State University’s College of Agricultural, Human, and Natural Resource Sciences’ Emerging Research Issues competitive grant opportunity (ERI-20-04).

Data Availability Statement

The data presented in this study are available on request from the corresponding author.

Acknowledgments

A sincere thanks to Milton Valencia Ortiz, Worasit Sangjan, and Kesevan Veloo for their valuable help during the data collection.

Conflicts of Interest

The authors declare that the research was conducted in the absence of any commercial or financial relationships that could be construed as a potential conflict of interest.

References

  1. Silva, G.J.; Souza, T.M.; Barbieri, R.L.; Costa de Oliveira, A. Origin, domestication, and dispersing of pear (Pyrus spp.). Adv. Agric. 2014, 2014, 541097. [Google Scholar]
  2. Seavert, C.F. Pear production in the North America. In IX International Pear Symposium 671; ISHS Acta Horticulturae: Stellenbosch, South Africa, 2004; pp. 45–46. [Google Scholar]
  3. National Agricultural Statistics Service (NASS): U.S. Department of Agriculture, 2021. Press Release. Available online: https://www.nass.usda.gov/Statistics_by_State/Washington/Publications/Current_News_Release/2021/FR08_01.pdf (accessed on 10 November 2022).
  4. Webster, A.D. Breeding and selection of apple and pear rootstocks. In Proceedings of the XXVI International Horticultural Congress: Genetics and Breeding of Tree Fruits and Nuts, Toronto, ON, Canada, 31 August 2003; pp. 499–512. [Google Scholar]
  5. Einhorn, T.C. A review of recent Pyrus, Cydonia and Amelanchier rootstock selections for high-density pear plantings. In Proceedings of the XIII International Pear Symposium 1303, Montevideo, Uruguay, 3–7 December 2018; pp. 185–196. [Google Scholar]
  6. Jayswal, D.K.; Lal, N. Rootstock and Scion Relationship in Fruit Crops. Editor. Board 2020, 2, AL202114. [Google Scholar]
  7. Elkins, R.B.; Bell, R.; Einhorn, T. Needs assessment for future US pear rootstock research directions based on the current state of pear production and rootstock research. J. Am. Pomol. Soc. 2012, 66, 153–163. [Google Scholar]
  8. Postman, J.D. World Pyrus collection at USDA genebank in Corvallis, Oregon. Acta Hortic. 2008, 800, 527–534. [Google Scholar] [CrossRef]
  9. Espiau Ramírez, M.T.; Alonso Segura, J.M. Agro-morphological diversity of local and international accessions of the Spanish Pear Germplasm Bank in Zaragoza. Acta Hortic. 2021, 1303, 71–78. [Google Scholar] [CrossRef]
  10. Torres-Sánchez, J.; de la Rosa, R.; León, L.; Jiménez-Brenes, F.M.; Kharrat, A.; López-Granados, F. Quantification of dwarfing effect of different rootstocks in ‘Picual’olive cultivar using UAV-photogrammetry. Precis. Agric. 2022, 23, 178–193. [Google Scholar] [CrossRef]
  11. Li, F.; Cohen, S.; Naor, A.; Shaozong, K.; Erez, A. Studies of canopy structure and water use of apple trees on three rootstocks. Agric. Water Manag. 2002, 55, 1–14. [Google Scholar] [CrossRef]
  12. Pereira, A.R.; Green, S.; Nova NA, V. Penman–Monteith reference evapotranspiration adapted to estimate irrigated tree transpiration. Agric. Water Manag. 2006, 83, 153–161. [Google Scholar] [CrossRef]
  13. Fazio, G.; Robinson, T. Modification of nursery tree architecture with apple rootstocks: A breeding perspective. N. Y. Fruit Q. 2008, 16, 13–16. [Google Scholar]
  14. Zhang, C.; Valente, J.; Kooistra, L.; Guo, L.; Wang, W. Orchard management with small unmanned aerial vehicles: A survey of sensing and analysis approaches. Precis. Agric. 2021, 22, 2007–2052. [Google Scholar] [CrossRef]
  15. Simon, S.; Lauri, P.E.; Brun, L.; Defrance, H.; Sauphanor, B. Does manipulation of fruit-tree architecture affect the development of pests and pathogens? A case study in an organic apple orchard. J. Hortic. Sci. Biotechnol. 2006, 81, 765–773. [Google Scholar] [CrossRef]
  16. Calonnec, A.; Burie, J.B.; Langlais, M.; Guyader, S.; Saint-Jean, S.; Sache, I.; Tivoli, B. Impacts of plant growth and architecture on pathogen processes and their consequences for epidemic behaviour. Eur. J. Plant Pathol. 2013, 135, 479–497. [Google Scholar] [CrossRef]
  17. Rallo, P.; de Castro, A.I.; López-Granados, F.; Morales-Sillero, A.; Torres-Sánchez, J.; Jiménez, M.R.; Jiménez-Brenes, F.M.; Casanova, L.; Suárez, M.P. Exploring UAV-imagery to support genotype selection in olive breeding programs. Sci. Hortic. 2020, 273, 109615. [Google Scholar] [CrossRef]
  18. Rosell, J.R.; Sanz, R. A review of methods and applications of the geometric characterization of tree crops in agricultural activities. Comput. Electron. Agric. 2012, 81, 124–141. [Google Scholar] [CrossRef] [Green Version]
  19. Sangjan, W.; Sankaran, S. Phenotyping architecture traits of tree species using remote sensing techniques. Trans. ASABE 2021, 64, 1611–1624. [Google Scholar] [CrossRef]
  20. Guo, W.; Carroll, M.E.; Singh, A.; Swetnam, T.L.; Merchant, N.; Sarkar, S.; Singh, A.K.; Ganapathysubramanian, B. UAS-based plant phenotyping for research and breeding applications. Plant Phenomics 2021, 2021, 9840192. [Google Scholar] [CrossRef]
  21. Patrick, A.; Li, C. High throughput phenotyping of blueberry bush morphological traits using unmanned aerial systems. Remote Sens. 2017, 9, 1250. [Google Scholar] [CrossRef] [Green Version]
  22. Rosell, J.R.; Llorens, J.; Sanz, R.; Arno, J.; Ribes-Dasi, M.; Masip, J.; Escolà, A.; Camp, F.; Solanelles, F.; Gràcia, F.; et al. Obtaining the three-dimensional structure of tree orchards from remote 2D terrestrial LIDAR scanning. Agric. For. Meteorol. 2009, 149, 1505–1515. [Google Scholar] [CrossRef] [Green Version]
  23. Camarretta, N.A.; Harrison, P.; Lucieer, A.M.; Potts, B.; Davidson, N.; Hunt, M. From drones to phenotype: Using UAV-LiDAR to detect species and provenance variation in tree productivity and structure. Remote Sens. 2020, 12, 3184. [Google Scholar] [CrossRef]
  24. Raman, M.G.; Carlos, E.F.; Sankaran, S. Optimization and evaluation of sensor angles for precise assessment of architectural traits in peach trees. Sensors 2022, 22, 4619. [Google Scholar] [CrossRef]
  25. Kothawade, G.S.; Chandel, A.K.; Schrader, M.J.; Rathnayake, A.P.; Khot, L.R. High throughput canopy characterization of a commercial apple orchard using aerial RGB imagery. In 2021 IEEE International Workshop on Metrology for Agriculture and Forestry (MetroAgriFor); IEEE: Trento-Bolzano, Italy, 2021; pp. 177–181. [Google Scholar]
  26. Ampatzidis, Y.; Partel, V.; Meyering, B.; Albrecht, U. Citrus rootstock evaluation utilizing UAV-based remote sensing and artificial intelligence. Comput. Electron. Agric. 2019, 164, 104900. [Google Scholar] [CrossRef]
  27. Csihon, Á.; Gonda, I.; Szabó, S.; Holb, I.J. Tree vegetative and generative properties and their inter-correlations for prospective apple cultivars under two training systems for young trees. Hortic. Environ. Biotechnol. 2022, 63, 325–339. [Google Scholar] [CrossRef]
  28. Sangjan, W.; McGee, R.J.; Sankaran, S. Optimization of UAV-based imaging and image processing orthomosaic and point cloud approaches for estimating biomass in a forage crop. Remote Sens. 2022, 14, 2396. [Google Scholar] [CrossRef]
  29. Kane, V.R.; Gersonde, R.F.; Lutz, J.A.; McGaughey, R.J.; Bakker, J.D.; Franklin, J.F. Patch dynamics and the development of structural and spatial heterogeneity in Pacific Northwest forests. Can. J. For. Res. 2011, 41, 2276–2291. [Google Scholar] [CrossRef] [Green Version]
  30. Dalla Corte, A.P.; Rex, F.E.; Almeida, D.R.A.d.; Sanquetta, C.R.; Silva, C.A.; Moura, M.M.; Wilkinson, B.; Zambrano, A.M.A.; Cunha Neto, E.M.d.; Veras, H.F.P.; et al. Measuring individual tree diameter and height using GatorEye High-Density UAV-Lidar in an integrated crop-livestock-forest system. Remote Sens. 2020, 12, 863. [Google Scholar] [CrossRef] [Green Version]
  31. Zhang, C.; Craine, W.A.; McGee, R.J.; Vandemark, G.J.; Davis, J.B.; Brown, J.; Sankaran, S. High-throughput phenotyping of canopy height in cool-season crops using sensing techniques. Agron. J. 2021, 113, 3269–3280. [Google Scholar] [CrossRef]
  32. Colaço, A.F.; Trevisan, R.G.; Molin, J.P.; Rosell-Polo, J.R. A method to obtain orange crop geometry information using a mobile terrestrial laser scanner and 3D modeling. Remote Sens. 2017, 9, 763. [Google Scholar] [CrossRef] [Green Version]
  33. Estornell, J.; Velázquez-Martí, A.; Fernández-Sarría, A.; López-Cortés, I.; Martí-Gavilá, J.; Salazar, D. Estimation of structural attributes of walnut trees based on terrestrial laser scanning. Rev. Teledetección 2017, 48, 67–76. [Google Scholar] [CrossRef]
  34. Wu, D.; Johansen, K.; Phinn, S.; Robson, A.; Tu, Y.H. Inter-comparison of remote sensing platforms for height estimation of mango and avocado tree crowns. Int. J. Appl. Earth Obs. Geoinf. 2020, 89, 102091. [Google Scholar] [CrossRef]
Figure 1. Overview of the data acquisition plan using the UAV-RGB and 3D LiDAR sensing systems.
Remotesensing 15 01483 g001
Figure 2. Orthomosaic imagery comparison showing the difference in shadow and tree canopy construction for integration of all datasets with and without 90°.
Remotesensing 15 01483 g002
Figure 3. An overview of methodology involved in extracting the architectural traits using UAV and LiDAR datasets.
Remotesensing 15 01483 g003
Figure 4. Figure showing the shapefiles created for the individual trees along with the attributes added to the individual tree shapefile.
Remotesensing 15 01483 g004
Figure 5. Model builder to automatically extract the 3D point cloud of individual trees using individual tree shapefile in ArcGIS. The model builder was constructed using the 3D point cloud (C.las) and shape files of each row (e.g., Row8) as input and Iterate the process (repetition of the process automatically based on individual tree shape file, Pole.shp). The generated individual tree 3D point cloud was saved as the same input tree ID Name using the function %Name% under the designated Output Folder.
Remotesensing 15 01483 g005
Figure 6. Pearson’s correlation coefficients between different ground reference data. TCA_S10: trunk cross-sectional area of scion at 10 cm above graft union; TCA_S20: trunk cross-sectional area of scion at 20 cm above graft union; GT_Ht: measured height from ground to top of the central leader; TSG: all new-season growth, includes growth of central leader, new branches, and new secondary branches; and CLG: new growth of the central leader from pruning point to the top (n = 504). Significance of correlation coefficient values: *** (p ≤ 0.001).
Remotesensing 15 01483 g006
Figure 7. Correlation between maximum height extracted from the canopy height model of different datasets with ground reference height data (n = 504).
Remotesensing 15 01483 g007
Figure 8. Correlation between 95th percentile height extracted from the canopy height model of different datasets with ground reference height data (n = 504).
Remotesensing 15 01483 g008
Figure 9. Pearson’s correlation coefficients between height traits extracted from the canopy height model of different datasets and ground reference data. TCA_S10: trunk cross-sectional area of scion at 10 cm above graft union; TCA_S20: trunk cross-sectional area of scion at 20 cm above graft union; GT_Ht: measured height from ground to top of the central leader; TSG: all new-season growth, includes growth of central leader, new branches, and new secondary branches; CLG: new growth of the central leader from pruning point to the top; CHM: canopy height model; I45, I65, I, and Iwo90: different integrated datasets; and MaxHt and 95Ht: maximum and 95th percentile height (n = 504). Significance of correlation coefficient values: *** (p ≤ 0.001).
Remotesensing 15 01483 g009
Figure 10. Correlation between maximum height extracted from 3D point cloud of different datasets with ground reference height data (n = 504).
Remotesensing 15 01483 g010
Figure 11. Correlation between 95th percentile height extracted from 3D point cloud of different datasets with ground reference height data (n = 504).
Remotesensing 15 01483 g011
Figure 12. Pearson’s correlation coefficients between height traits extracted from 3D point cloud of different datasets and ground reference data. TCA_S10: trunk cross-sectional area of scion at 10 cm above graft union; TCA_S20: trunk cross-sectional area of scion at 20 cm above graft union; GT_Ht: measured height from ground to top of the central leader; TSG: all new-season growth, includes growth of central leader, new branches, and new secondary branches; CLG: new growth of the central leader from pruning point to the top; I45, I65, I, and Iwo90: different integrated datasets; and MaxHt and 95Ht: maximum and 95th percentile height (n = 504). Significance of correlation coefficient values: *** (p ≤ 0.001).
Remotesensing 15 01483 g012
Figure 13. Relationship between maximum tree height extracted from LiDAR and ground-measured data (n = 84).
Remotesensing 15 01483 g013
Figure 14. Pearson’s correlation coefficient between ground reference tree height and extracted height from 3D point cloud (UAV and LiDAR). GT: ground truth height data; Ht_Max and MaxHt: maximum height; Ht_Max and 95Ht: 95th percentile height; L: LiDAR data; I45, I65, I, and Iwo90: different UAV integrated datasets; and PC: 3D point cloud (n = 84). Significance of correlation coefficient values: *** (p ≤ 0.001).
Remotesensing 15 01483 g014
Figure 15. Correlation between volume extracted from UAV point cloud (integration of 65°) and 3D LiDAR using convex hull and voxel grid method (n = 84). ConV: convex hull volume; VoxV: voxel grid volume; L: LiDAR data; and I45, I65, I, and Iwo90: different UAV integrated datasets. Significance of correlation coefficient values: *** (p ≤ 0.001).
Remotesensing 15 01483 g015
Figure 16. Pearson’s correlation coefficients between extracted volume traits (convex and voxel) and ground reference data (n = 504 and 84 for UAV point cloud and 3D LiDAR point cloud, respectively). ConV: convex hull volume; VoxV: voxel grid volume; LiDAR: LiDAR data; and I45, I65, I, and Iwo90: different UAV integrated datasets. Significance of correlation coefficient values: *** (p ≤ 0.001).
Remotesensing 15 01483 g016
Table 1. UAV datasets with ground sampling distance (GSD).
DatasetsAverage GSD (cm)
Integration of 45° datasets (I45)0.82
Integration of 65° datasets (I65)0.45
Integration of all datasets (I)0.49
Integration of all datasets excluding 90° dataset (Iwo90)0.53
Table 2. Root mean square error (RMSE) during estimation of different ground reference data parameters using extracted height from canopy height model (CHM) and UAV 3D point cloud (PC). TCA_S10: trunk cross-sectional area of scion at 10 cm above graft union; TCA_S20: trunk cross-sectional area of scion at 20 cm above graft union; GT_Ht: measured height from ground to top of the central leader; TSG: all new-season growth, includes growth of central leader, new branches, and new secondary branches; I45, I65, I, and Iwo90: different integrated datasets; and MaxHt and 95Ht: maximum and 95th percentile height (n = 504). I45, I65, I, and Iwo90 represent different integrated datasets, while MaxHt and 95Ht represent maximum and 95th percentile height.
FeaturesTCA_S10
(sq. cm)
TCA_S20
(sq. cm)
GT_Ht
(m)
TSG
(m)
CLG
(cm)
I45_MaxHt_PC1.671.600.465.6632.68
I65_MaxHt_PC1.711.650.505.8732.69
I_MaxHt_PC1.581.500.415.3032.36
Iwo90_MaxHt_PC1.701.630.475.7132.66
I45_95Ht_PC1.651.590.395.8732.93
I65_95Ht_PC1.561.510.395.7232.63
I_95Ht_PC1.581.510.355.7332.83
Iwo90_95Ht_PC1.581.520.365.7032.63
I45_MaxHt_CHM1.871.800.576.3533.12
I65_MaxHt_CHM1.881.820.596.3533.04
I_MaxHt_CHM1.861.800.586.4133.68
Iwo90_MaxHt_CHM1.871.810.576.3533.09
I45_95Ht_CHM2.051.970.636.8133.29
I65_95Ht_CHM2.001.940.636.6633.23
I_95Ht_CHM1.861.810.586.4133.58
Table 3. Root mean square error (RMSE) during estimation of different ground reference data parameters using extracted volume from UAV and LiDAR 3D point cloud (PC). TCA_S10: trunk cross-sectional area of scion at 10 cm above graft union; TCA_S20: trunk cross-sectional area of scion at 20 cm above graft union; GT_Ht: measured height from ground to top of the central leader; TSG: all new-season growth, includes growth of central leader, new branches, and new secondary branches; CLG: new growth of the central leader from pruning point to the top (n = 504 and 84 for UAV point cloud and 3D LiDAR point cloud, respectively); ConV: convex hull volume; VoxV: voxel grid volume; L: LiDAR data; and I45, I65, I, and Iwo90: different UAV integrated datasets.
FeaturesTCA_S10
(sq. cm)
TCA_S20
(sq. cm)
GT_Ht
(m)
TSG
(m)
CLG
(cm)
L_ConV1.000.960.482.6332.86
I45_ConV1.681.580.565.1432.92
I65_ConV1.591.500.545.0132.79
I_ConV1.681.580.565.1032.86
Iwo90_ConV1.691.590.565.2032.90
L_VoxV1.081.050.532.6732.76
I45_VoxV1.841.580.695.5533.34
I65_VoxV1.791.500.665.5133.23
I_VoxV1.891.580.715.6633.37
Iwo90_VoxV1.881.590.705.7533.40
Disclaimer/Publisher’s Note: The statements, opinions and data contained in all publications are solely those of the individual author(s) and contributor(s) and not of MDPI and/or the editor(s). MDPI and/or the editor(s) disclaim responsibility for any injury to people or property resulting from any ideas, methods, instructions or products referred to in the content.

