Article

Spatio-Temporal Evolution and Prediction of Carbon Storage in Guilin Based on FLUS and InVEST Models

1
Key Laboratory of Ecology of Rare and Endangered Species and Environmental Protection, Ministry of Education, Guangxi Normal University, Guilin 541006, China
2
Guangxi Key Laboratory of Landscape Resources Conservation and Sustainable Utilization in Lijiang River Basin, Guilin 541006, China
3
Institute for Sustainable Development and Innovation, Guangxi Normal University, Guilin 541006, China
4
Institute of Geographic Sciences and Natural Resources Research, Chinese Academy of Sciences, Beijing 100101, China
*
Author to whom correspondence should be addressed.
Remote Sens. 2023, 15(5), 1445; https://doi.org/10.3390/rs15051445
Submission received: 31 December 2022 / Revised: 27 February 2023 / Accepted: 1 March 2023 / Published: 4 March 2023
(This article belongs to the Special Issue Remote Sensing for Advancing Nature-Based Climate Solutions)

Abstract

:
In the context of sustainable development and dual-carbon construction, to quantify the carbon storage and its spatial-temporal distribution characteristics of Guilin City and predict the carbon storage of Guilin City in 2035 under different future scenarios, this study set four future scenarios based on SDGs and the sustainable development plan of Guilin City: natural development, economic priority, ecological priority, and sustainable development. At the same time, FLUS and InVEST models and GeoDa 1.20and ArcGIS software were used to establish a coupling model of land use change and ecosystem carbon storage to simulate and predict the distribution and change of ecosystem carbon storage based on land use change in the future. The results showed that: (1) From 2005 to 2020, forest land was the main type of land use in Guilin, and cropland and impervious continued to expand. In 2035, the forest land under four different future scenarios will be an important transformation type; (2) From 2005 to 2020, the carbon storage in the northwest of Guilin was relatively high, and the carbon loss area was larger than the carbon increase area. The carbon storage in the ecological priority scenario in 2035 is the highest, reaching 874.76 × 10⁶ t. The aboveground carbon storage (ACG) is the main carbon pool in Guilin. Most of the regions with high carbon storage are located in the northwest and northeast of Guilin. No matter what scenario, the carbon storage in the main urban area is maintained at a low level; (3) In 2035, the distribution of carbon storage in Guilin has a strong spatial positive correlation, with more hot spots than cold spots. The high-value areas of carbon storage are concentrated in the northwest and east, whereas the low-value areas are concentrated in the urban area of Guilin.

1. Introduction

As a key carbon pool in the carbon cycle, terrestrial ecosystems play an important role in maintaining the global carbon cycle and mitigating global warming [1]. At the same time, carbon storage is also an important indicator of regional ecosystem service function [2]. However, due to the impact of human activities and climate change, the global ecosystem service function is decreasing [3]. Therefore, a comprehensive assessment of ecosystem carbon reserves is of great significance for regional ecological environment protection and sustainable development. Traditional carbon storage estimation methods such as soil type, life zone, sample land inventory, biomass, and other methods for real-time measurement of carbon storage [4] are more accurate and widely used [5]. However, it will inevitably take a long time and cost a lot. At the same time, it is also impossible to study the long-term and large-scale carbon stock changes and impact mechanisms [6]. The model-based carbon reserve estimation method can well compensate for traditional methods’ shortcomings and has the advantages of large amounts of information, sustainability, and high-cost performance [7]. At present, many scholars have carried out a lot of research on space-time evolution and influencing factors of ecosystem carbon storage from different scopes and angles. For example, Yang et al. [8] and Wu et al. [9] estimated the carbon reserves of the Yellow River basin and Chengdu-Chongqing Economic Zone in the regional scope. Deng et al. [10], Yao et al. [11], and Wei et al. [12] estimated the carbon storage changes of the Loess Plateau, southwest China, and northeast China from the policy protection and explored the contribution of returning farmland to forest and grassland and the construction of protected areas to the regional carbon sink. It should be noted that these studies also indicate that land use type conversion is the main driver of carbon storage change [13].
With the rapid development of global urbanization, the urban area continues to expand, the population explodes, and the ecological environment further deteriorates. In September 2015, the Sustainable Development Goals (SDGs) proposed in the “Changing Our Future: 2030 Agenda for Sustainable Development” signed by 193 countries have become the guidelines for the development of countries [14]. As a demonstration area for innovation of the national sustainable development agenda and a pilot area for low-carbon and net zero-carbon cities under the “dual carbon” goal, the research on carbon in Guilin is not deep enough at present, and most focuses on carbon density (such as Zhang Mingyang et al., based on RBFN’s research on factors affecting the spatial distribution of carbon density of vegetation in karst areas in northwest Guangxi [15]). The research scale is relatively small (such as Wei Xi et al., who analyzed carbon reserves’ temporal and spatial characteristics in the Lijiang River basin in Guilin [16]). Therefore, this study takes Guilin City as the study area. Following the clarification of the land use situation and the rule change from 2005 to 2020, the land use development scenarios and corresponding parameters of Guilin City were set for SDGs and Guilin sustainable development planning, and the land use conditions under different future scenarios were simulated using the FLUS model. Moreover, the InVEST model carbon storage module was used to assess the distribution of and change in Guilin’s carbon storage in 2005–2020 and 2035 under different future scenarios, and Geoda and ArcGIS software were used to conduct spatial autocorrelation analysis to provide a scientific basis for the construction of Guilin National Sustainable Development Agenda Innovation Demonstration Zone, and the territorial spatial planning of Guilin as a low-carbon and net zero carbon city pilot area under the guidance of the “dual carbon” goal. Moreover, this can also provide a reference for other cities.

2. Materials and Methods
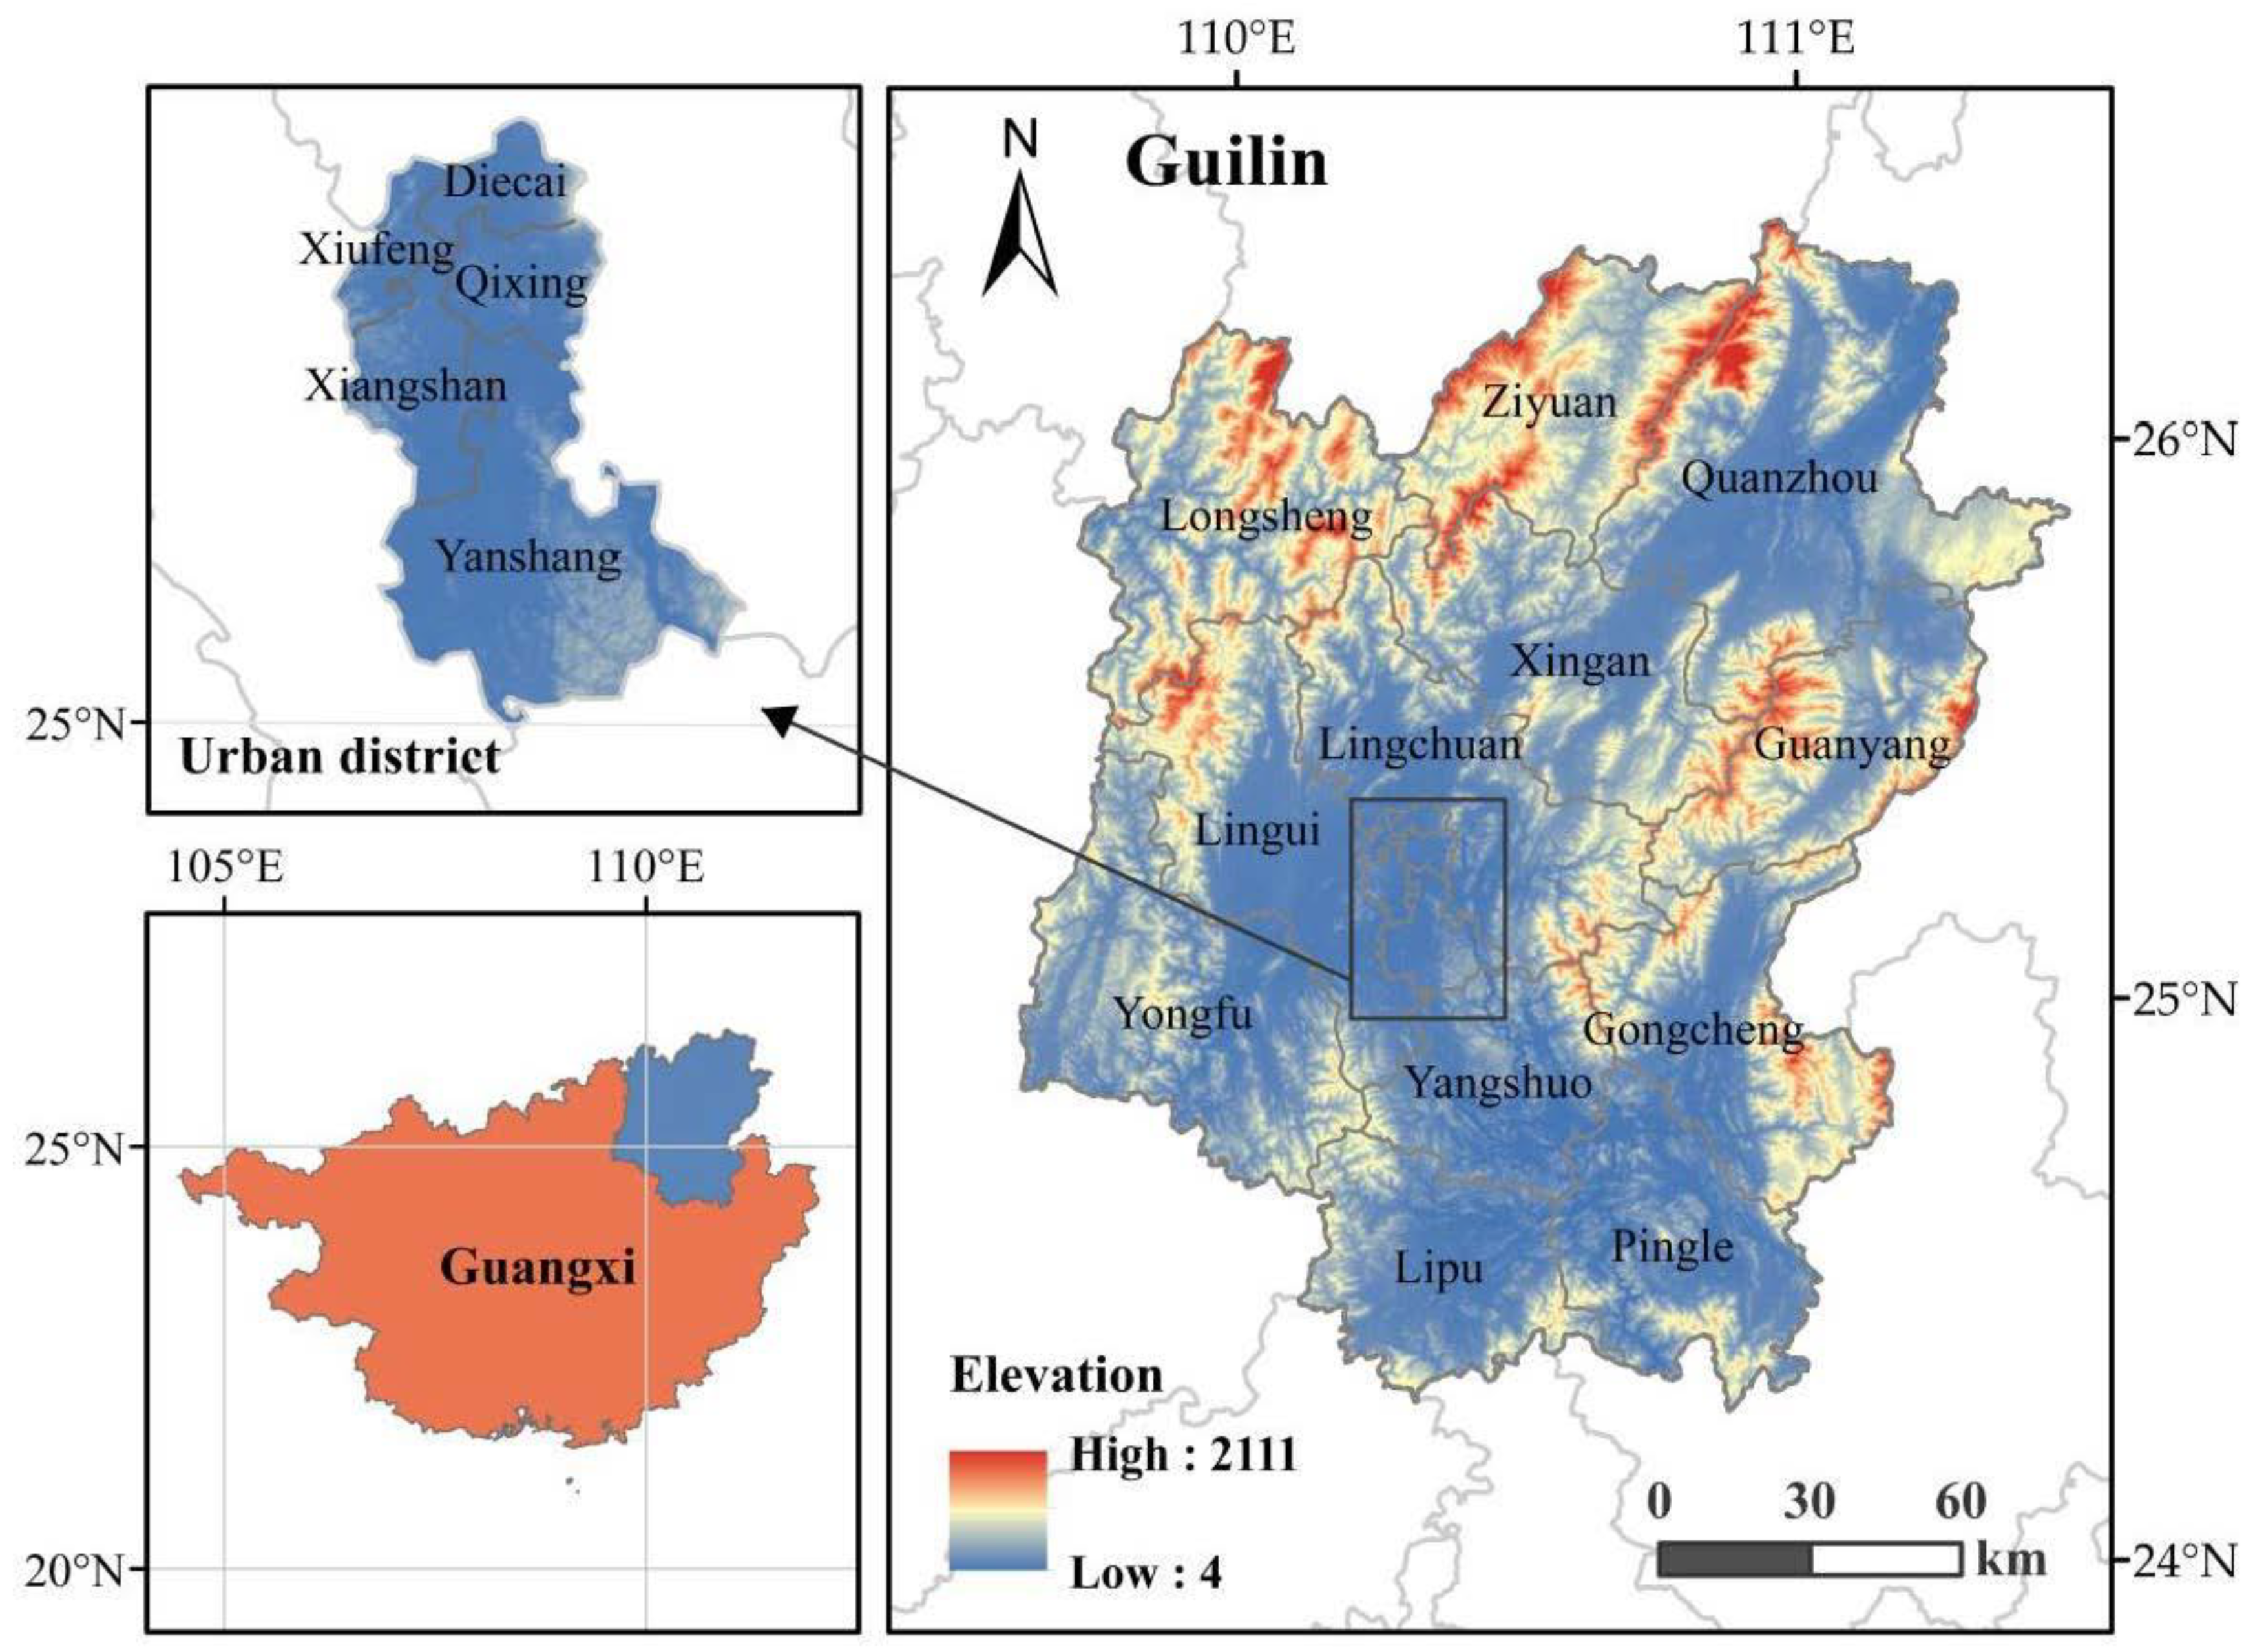
2.1. Study Area

Guilin is located in the northeast of Guangxi Zhuang Autonomous Region, with an administrative area of 2.78 × 10⁴ km2; its longitude and latitude range is (109°36′50″–111°29′30″E, 24°15′23″–26°23′30″N), and it belongs to the subtropical monsoon climate, this being mild and rainy, and is rich in tourism resources [17] (Figure 1). Guilin is an international tourism city with a unique Lijiang River landscape and ecological landscape resources and enjoys the reputation of “the best landscape in the world” [18].

2.2. Data Resources

The land use data were derived from Jie and Xin [19] for the years 2005, 2010, 2015, and 2020, with a resolution of 30 m. The land use data for Guilin City were obtained after cutting, and there are seven types of land use: cultivated land, forest land, shrubs, grassland, water area, wasteland, and construction land; the 30 m resolution DEM data comes from the Geospatial Data Cloud (http://www.gscloud.cn/ (accessed on 30 September 2022)). Then, the data of slope and aspect were obtained by using the surface analysis tool of ArcGIS; Natural environment data comes from the China Meteorological Administration and the Resources and Environment Science Data Center of the Chinese Academy of Sciences (http://www.resdc.cn/ (accessed on 12 October 2022)). National Earth System Science Data Center (http://www.geodata.cn/ (accessed on 15 October 2022)). PM2.5 data were obtained from the Social Economic Data and Application Center of Columbia University (https://sedac.ciesin.columbia.edu/ (accessed on 30 October 2022)). The social and economic data were collected from the Statistical Yearbook, the National Earth System Science Data Center, and the Resources and Environment Science Data Center of the Chinese Academy of Sciences.

2.3. Methods

2.3.1. Setting of Guilin Development Scenarios Based on SDGs

Guilin is an innovative demonstration area of China’s sustainable development agenda, an international tourism city, an important international city of regional cultural tourism facing Eurasia and connecting ASEAN, and an important gateway city for the organic connection of the “the Belt and Road”. In the sustainable development plan of Guilin, it is pointed out that we should closely focus on the 2030 sustainable development agenda and the central government’s deployment of the “three strategic positionings” of Guangxi; firmly establish the development concept of innovation, coordination, green, open and sharing; and promote the sustainable use of landscape resources and the sustainable and healthy development of the economy and society in Guilin. Based on this logical starting point and the sub-goals of SDGs [20,21,22,23], four simulation scenarios were set:
(1)
Natural development scenario (S1): Without considering the binding impact of any SDGs on land use change and changing the transfer probability between different land use types, the Markov chain was used to predict the total required area of each land use type in the study area in 2035 on the premise of following the natural development law.
(2)
Economic priority scenario (S2): The overall economic strength of Guilin is weak, the economic development is backward, and the per capita Gross Domestic Product (GDP) is far below the national average. How to achieve economic development is still the core issue of Guilin’s future development. SDGs 11 pointed out the need to build inclusive, safe, disaster-resilient, and sustainable cities and human settlements. SDG 8 also points out that it is necessary to promote economic growth and set S2 in combination with the economic development indicators mentioned in the sustainable development plan of Guilin. This scenario is based on the total required area of each land type under S1 in 2035, and the ratio of converting shrubs, grasslands, and waters into impervious was increased by 15%, and the conversion ratio of forest land was increased by 10%. At the same time, under this scenario, it is difficult for impervious to be transferred to other types of land, and other types of land can be transferred freely.
(3)
Ecological protection scenario (S3): In the process of urbanization, ecological land protection is the key to overall ecological protection. SDGs 15 pointed out that it is necessary to protect, restore, and promote the sustainable use of terrestrial ecosystems, sustainably manage forests, combat desertification, stop and reverse land degradation, and curb the loss of biodiversity. The indicator system of the sustainable development of Guilin also clearly points out that the forest coverage rate of Guilin will be improved in 2035, and the area of ecological protection red line will account for 24.2% of the regional area. Therefore, based on the total demand for various types of land under S1 in 2030, this study increased the conversion rate of impervious to cropland and forest land by 20%, respectively, whereas cropland, forest land, and grassland were not converted to impervious At the same time, to highlight the importance of Guilin’s mountains and waters, the set water area cannot be converted to other land types, and the conversion rate of forest land, shrubs, and grasslands to water area was increased by 50%, and the conversion rate of impervious to water area was increased by 200%.
(4)
Sustainable development scenario (S4): Considering the relationship between the ecological environment and economic society, we should not only meet the needs of economic development but also implement ecological protection. SDGs pointed out that we should not only protect, restore, and promote the sustainable use of terrestrial ecosystems but also eliminate all forms of poverty in the world to promote economic development. The sustainable development scenario is set based on the requirements of sustainable development. Under this scenario, the conversion probability of forest land to impervious was reduced by 40% based on natural development, the conversion rate of impervious to cropland and forest land remained unchanged, the water area could not be converted to construction land and cropland, and the conversion probability of impervious to water area was increased by 150%.

2.3.2. Land Use Transfer Matrix

The land use transfer matrix was used to express the mutual transformation of various land use types in Guilin from 2005 to 2020 [24]. The formula is as follows:
S i j = S 11 S 12 S 1 n S 21 S 22 S 23 S n 1 S n 2 S n n
S is the area; n is the number of land use types; Sij is the conversion area between land types i and j; and i and j (i, j = 1, 2, ..., n) are the land types before and after the transfer, respectively.

2.3.3. FLUS Model

FLUS (Future Land Use Stimulation) model (GeoSOS-FLUS, Sun Yat-sen University, Guangzhou, China) is an improved model developed based on the traditional cellular automata principle (CA-Markov), which can effectively simulate the land use pattern under different scenarios in the future. The ANN-based Probability of Occurrence Estimation (ANN) algorithm is used to obtain the development probability of each land use type and fit it with the Self-adaptive Inertia and Competition Mechanism Cellular Automata [25,26,27].

Selection of Driving Factors for Land Use Change

Land use change is the result of multiple factors. According to the existing research results and the specific situation of the study area, 11 impact factors [23,24,25] were selected from the natural, economic, and social dimensions (Table 1). ArcGIS 10.5 (ESRI, Redlands, CA, USA) software was used to unify the resolution of the following data to 100 m.

Conversion Cost Matrix

As one of the conditions to realize different scenarios, the cost matrix of land use type conversion can quantitatively describe whether the conversion can take place between two land use types. There are only two values in the matrix: 0 and 1. When the value is 0, it means that this land class cannot be converted to other land classes. If it becomes 1, it can be converted. In this study, four conversion cost matrices were set according to different scenarios, as shown in Table 2.

Total Land Use Demand in Different Future Scenarios

The total demand for various types of land use was estimated. Based on the real data of land use in 2005 and 2020, the FLUS model was used to estimate the demand for different types of land use in 2035 under natural conditions, and the transfer probability and proportion of each type of land use were correspondingly changed under different scenarios to estimate the demand for various types of land use under different scenarios (Table 3).

Neighborhood Weight Setting

The neighborhood weight directly reflects the expansion intensity of different land use types and also reflects the ability of each land use type to expand itself driven by external factors. The value range is 0–1. The higher the value, the stronger the expansion ability. As the expansion intensity of each land type is difficult to calculate directly, the setting of domain weight is mostly based on existing research. Some scholars also propose that the expansion degree can be quantitatively described by the difference in the total patch area (Total Area, TA) of each land use type [28]. After dimensionless processing, it is more consistent with the set requirements of neighborhood weight parameters (Table 4).

2.3.4. InVEST Model

InVEST (Integrated Valuation of Environmental Services and Trade-offs) model (InVEST, Stanford, CA, USA) is an open-source ecosystem service function assessment model jointly developed by Stanford University, the Nature Conservancy (TNC), and the World Wide Fund for Nature (WWF) [29,30,31,32]. According to the existing research results, the specific conditions of the study area, and the reference data provided by InVEST official website [33,34,35,36], this study set the carbon density of various land use types in Guilin (Table 5). The carbon storage module of InVEST model divides the carbon storage of terrestrial ecosystems into four parts, including aboveground carbon storage (AGC), underground carbon storage (BGC), soil organic carbon storage (SOC), and dead organic matter carbon storage (DOC). The calculation formula is:
C total   = C above   + C below   + C soil   + C dead  
Ctotal is the total carbon storage of all land types; Cabove is the aboveground carbon density; Cbelow is the underground carbon density; Csoil is the density of soil organic carbon; and Cdead is the density of dead organic carbon, in t/hm2.
Table 5. Carbon density of each land use cover type used in the InVEST model (t/hm2).
Land Use TypeAboveground Carbon StorageBelowground Carbon StorageSoil Organic Carbon StorageDead Organic Matter Carbon Storage
Cropland6540256
Forest140703515
Shrub8555358
Grassland1535304
Water57202
Barren55152
Impervious44120

2.3.5. Spatial Autocorrelation Analysis

Spatial autocorrelation is a common method to test whether the attribute values of a feature are spatially related and the degree of spatial correlation. It is used to measure the degree of aggregation or dispersion between attributes. It can be divided into Tocal Indicators of Spatial Association (TISA) and Local Indicators of Spatial Association (LISA) [37,38,39]. The calculation formula of TISA is:
T I = i = 1 n j = 1 n w i j x i - x - x j - x - S 2 i = 1 n j = 1 n w i j
n represents the number of subjects; 𝑥i and 𝑥𝑗 are respectively the values of the i and j observation objects in space; w𝑖𝑗 is the spatial weight matrix; and the value of TI is between −1 and 1. A positive value means that the research object has a positive spatial correlation. The larger the value is, the closer the relationship between the units is; a negative value indicates that the distribution of the research objects has a negative spatial correlation and is discrete. If the value is 0, it means that there is no spatial autocorrelation in the distribution of research objects, which is a random distribution.
Since the global spatial autocorrelation only reflects the overall distribution characteristics of spatial elements, Guilin is divided into 5000 m × 5000 m grid and adopts local spatial autocorrelation (LISA) to show the spatial concentration of carbon reserves in local areas. The formula of LISA is as follows:
L I i = X i - x - S 2 i w i j x j - x -
The value of LI is between −1 and 1, and its variable meaning is the same as that of Formula (3). In this paper, the local concentration of carbon reserves is divided into five types: High-High Cluster, Low-Low Cluster, high-low Cluster, low-high Cluster, and Not Significant.

3. Result and Analysis

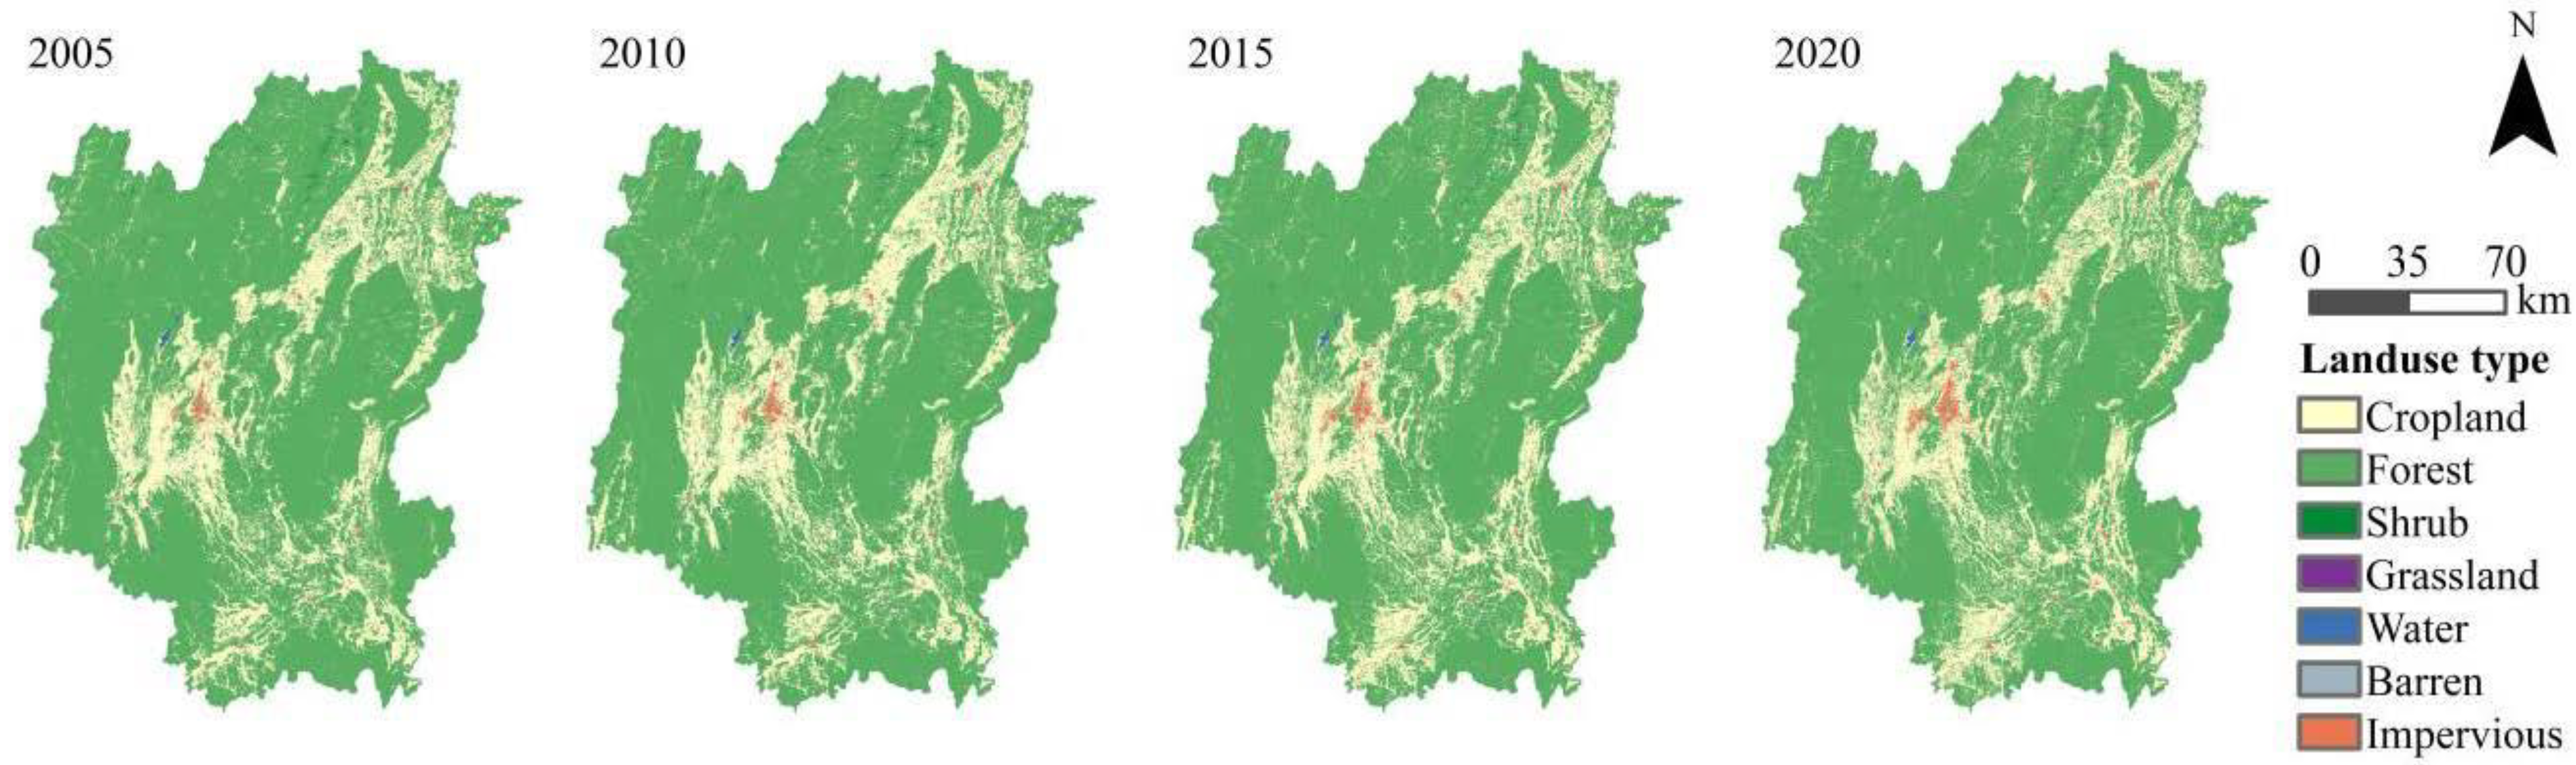
3.1. Analysis of Land Use Change

The distribution and change of land use in Guilin from 2005 to 2020 are shown in Figure 2. From the perspective of spatial distribution, forest land is the main type of land use in Guilin, with a wide range of distribution, and is relatively concentrated in the northwest. Cropland is distributed along the contour line in the lower altitude area, which is the second largest land use type. Impervious is relatively concentrated in the middle, and other land types are scattered. From the perspective of the time process, the expansion of cropland and impervious is obvious from 2005 to 2020, and the area is increased, whereas the change in other land types is not obvious. Therefore, this study further analyzed the distribution and change of land use in Guilin from 2005 to 2020 by using the change map of land use area proportion from 2005 to 2020 (Table 6) and the land use transfer matrix (Table 7). Forest land accounts for more than 76%, which is the most important type of land use, with the highest proportion in 2005, up to 77.65%. The proportion of impervious is increasing and shrubs are decreasing. From 2005 to 2020, 1141.3 km2 of forest land was converted into cropland, and 911.27 km2 of cropland was also converted into forest land. The most important transformation type of water area is cropland. Furthermore, 138.41 km2 of cropland and 11.73 km2 of forest land also became impervious, which is the inevitable result of economic growth and urban expansion.
The FLUS model was used to obtain the land use of Guilin under four different scenarios, as shown in Figure 3. From the perspective of spatial distribution, under the four future scenarios, forest land is still the main type of land use, widely distributed in the whole region of Guilin, followed by cropland and impervious. From the perspective of the transformation process (Figure 4), land use transformation in different scenarios from 2020 to 2035 has obvious differences. Under S1, the increase rate of cropland area was the largest, reaching 55.36%, followed by shrubs at 26% and impervious land at 18.39%. The forest land area decreased the most significantly, with a total of 205.01 km2, and a large amount of forest land was transformed into cropland, shrubs, and impervious. Under S2, the forest land area decreased more obviously, with a total reduction of 218.24 km2, of which 123.03 km2 of forest land was converted into cropland, whereas 6.36 km2 of water area was converted into cropland, with a significant increase in cropland. Under S3, great changes have taken place in the transformation of land use, and the increase in cropland area is still obvious, but most of the increased areas are from impervious. Moreover, the water area also increased by 15.89 km2, indicating that the environmental protection policy achieved remarkable results. Under S4, the reduction of forest land area is slower than that of S1, with 22.05 km2 of impervious being converted into cropland, and the water area increased by 3.19 km2.

3.2. Temporal and Spatial Changes of Carbon Storage

The carbon storage module in the InVEST model was used to estimate the carbon storage of Guilin from 2005 to 2020, as shown in Figure 5. From the perspective of spatial distribution, the spatial distribution pattern of carbon storage in Guilin City has significant spatial heterogeneity. The regions with high carbon storage are mainly located in the northwest of the study area, where the altitude and vegetation coverage is relatively high and the highest carbon storage density is 260 t/hm2. The area with low carbon storage is mainly located in the middle of the study area. Due to the impact of human activities, the land use type of this area is mainly construction land. From the time process (Figure 6), the total carbon storage in Guilin decreased year by year, from 638.09 Tg to 633.58 Tg, with a cumulative loss of 4.51 Tg. Among this, AGC suffered the most serious loss, with a total loss of 2.55 Tg.
To more clearly reflect the change of carbon storage in the study area from space, the carbon storage in Guilin in 2005 and 2020 were analyzed by superposition, and the results were divided into three categories, namely, reduction, stability, and increase. Finally, the change map of carbon storage in Guilin from 2005 to 2020 was obtained (Figure 7). It can be seen from the figure that the carbon storage in most regions of Guilin is relatively stable, with an area of 25,218.17 km2. However, the trend of carbon storage reduction is also very evident. The area of carbon storage reduction is 1386.16 km2, which is much higher than the area of carbon storage increase. The area of carbon stock increase is 1028.32 km2.
The InVEST model was used to analyze the carbon storage of land use under four different scenarios, and the carbon storage distribution map under different scenarios in 2035 was obtained (Figure 8). In general, the spatial distribution of carbon storage under different future scenarios in 2035 is similar to that in 2005–2020. The northwest is higher than other regions, and the highest carbon density is 260 t/hm2. In general (Figure 9), the total carbon storage under S3 is 633.71 Tg, which is higher than other future scenarios, indicating that ecological protection policies are beneficial to the increase in carbon storage. S2 is the lowest, with 630.79 Tg. As of 2005–2020, AGC is still the main carbon pool in Guilin. From the perspective of administrative regions (Figure 10), the carbon storage under the four future scenarios has some similarities. Under S1, S2, S3, and S4, the carbon storage of the whole prefecture is higher than those of other counties, with the highest value in S3, reaching 874.76 × 10⁶ t, followed by Yongfu and Longsheng. No matter what the future scenario is, the carbon storage in Xiufeng is lower than that in other counties, with the lowest value of 5.44 × 10⁶ t under S1. Most of the counties and districts with high carbon storage are located in the northwest and northeast of Guilin. In addition to the large administrative area, these regions are relatively high in altitude, with widely distributed forest land, and relatively small in cultivated land and construction land. The five districts (Xiufeng, Duocai, Xiangshan, Qixing, and Yanshan) included in the main urban area of Guilin City have kept their carbon storage at a low level due to their small area, high urbanization level, relatively concentrated population, and land use type dominated by construction land.

3.3. Autocorrelation Analysis of Carbon Storage Space

Geoda software (Geoda, Chicago, IL, USA) was used to conduct a TISA analysis on the spatial and temporal differences of carbon storage in all counties and districts of Guilin in 2035 under four future scenarios. The calculation results are shown in Figure 11. It can be seen that Moran’s I value under the four scenarios are 0.453, 0.453, 0.452, and 0.453, respectively, which are all positive spatial correlations, indicating that the regional carbon reserve distribution has a large positive spatial correlation and that the carbon storage in all counties and districts of Guilin are clustered in space. Since most regions are located in the first quadrant (hot spot area) and the third quadrant (cold spot area), their spatial correlation characteristics are: regions with high carbon storage tend to be adjacent to regions with high carbon storage, regions with low carbon storage tend to be adjacent to regions with low carbon storage, and 14 of the 17 counties and districts in Guilin have a strong spatial positive correlation.
The ArcGIS software was used to conduct LISA analysis on the carbon storage in Guilin under various scenarios (Figure 12). The results show that the spatial distribution of carbon storage in Guilin under different future scenarios is similar. The high-value areas of carbon storage are concentrated in the northwest and west of Guilin, whereas the low-value areas are concentrated in the urban area of Guilin. In the northwest and east, the higher altitude is dominated by forest land, whereas in the urban area, the lower altitude is dominated by cultivated land and construction land, and the human activity in the urban area is much higher than that in other areas. Therefore, carbon storage in Guilin is closely related to altitude, land use type, and human activities.

4. Discussion

The FLUS model generates the development probability of various types of land by inputting socio-economic data and climate and environmental data. However, land use change is a complex dynamic process, often affected by natural conditions, socio-economic and human activities, and other factors. Although this study comprehensively considers the guiding role of nature, economy, and society, for the future population, GDP, and other socio-economic factors and temperature climate factors such as precipitation are poorly considered. How to comprehensively consider such data is the focus of the next step. The InVEST model needs to input the predicted land use data and the carbon density value corresponding to each land type. Carbon density is an important input parameter for the model to accurately evaluate carbon reserves. Generally, carbon density data is obtained from field measurements, followed by literature. However, due to the current lack of uniformity in the calculation of carbon density in different regions and the differences in carbon density in different regions, the existing research mostly relies on empirical data, resulting in differences in the calculation of carbon reserves in the InVEST model. Therefore, in future research, to ensure the reliability of the output results of the model, we should strengthen the long-term monitoring of the carbon density of different land types and establish a database. This would make the evaluation result of InVEST model more accurate.
Land use change has an important impact on the carbon storage of ecosystems. When the land type with high carbon density is converted to the land type with low carbon density, the carbon storage decreases, and vice versa. The transformation process of land use type is the response process of land use form to the change of the social and economic development stage [40]. With the advancement of urbanization and the increase in population, both land use type and land cover area have changed. The changing trend of land use types in Guilin from 2005 to 2020 is that the area of woodland, shrub, and water area decreased, and the area of cultivated land and construction land increased continuously. Under the four future scenarios in this study, Guilin’s carbon reserves in 2035 are significantly different. S3 is the highest, with a total of 633.71 Tg. S2 is the lowest, with a total of 630.79 Tg. It shows that certain ecological protection measures have protected forest land and grassland and restricted the conversion of forest land, grassland, and farmland with high carbon density into construction land with low carbon density. This can slow down the trend of carbon storage reduction in terrestrial ecosystems and increase carbon storage.
To make up for the shortcomings of the single model, this paper coupled the FLUS model and the InVEST model to quantitatively assess the land use change and its impact on carbon storage under different future development scenarios driven by policies. The coupling of models makes up for the shortcomings of single models and can give full play to the advantages of the FLUS model in simulating future land changes in quantity and space and those of the InVEST model in predicting carbon reserves. Therefore, this paper establishes a coupling model of land use change and ecosystem carbon storage based on the FLUS and InVEST models and Geoda and ArcGIS software to simulate and calculate the ecosystem carbon storage based on land use change in the future. Future research should attempt to uncover the optimal solution of land use transformation under the guidance of the “double carbon” goal. This will provide a scientific basis for the construction of the Guilin National Sustainable Development Agenda Innovation Demonstration Zone and the land and space planning of Guilin as a low-carbon and net zero-carbon city pilot area under the guidance of the “Double-Carbon” goal.

5. Conclusions

Based on SDGs and the sustainable development planning of Guilin, this study sets the land use development scenarios and corresponding parameters of Guilin, uses the FLUS model to simulate the land use pattern under the scenarios of natural development, economic priority, ecological protection, and sustainable development in 2035, and uses the carbon storage module of InVEST model to assess the distribution and change of carbon storage in Guilin under different future scenarios in 2005–2020 and 2035, Finally, geo da and ArcGIS software were used for spatial autocorrelation analysis. The conclusions are as follows:
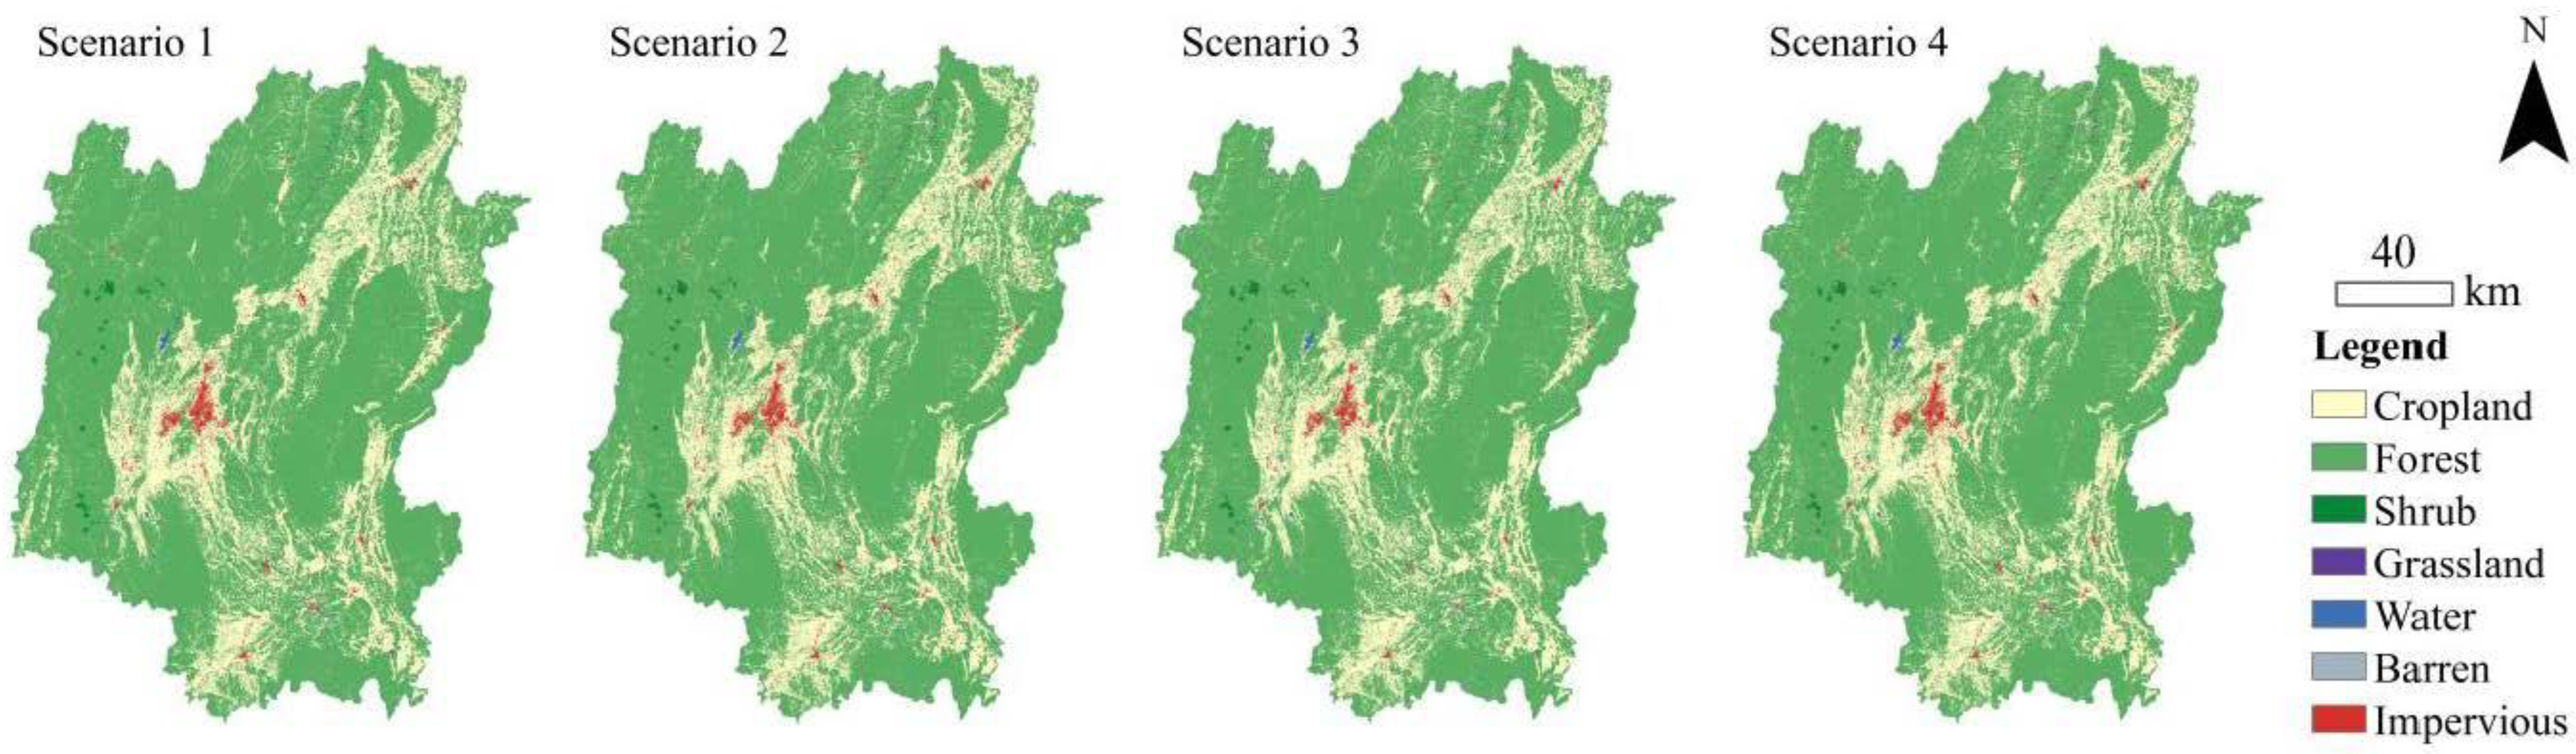
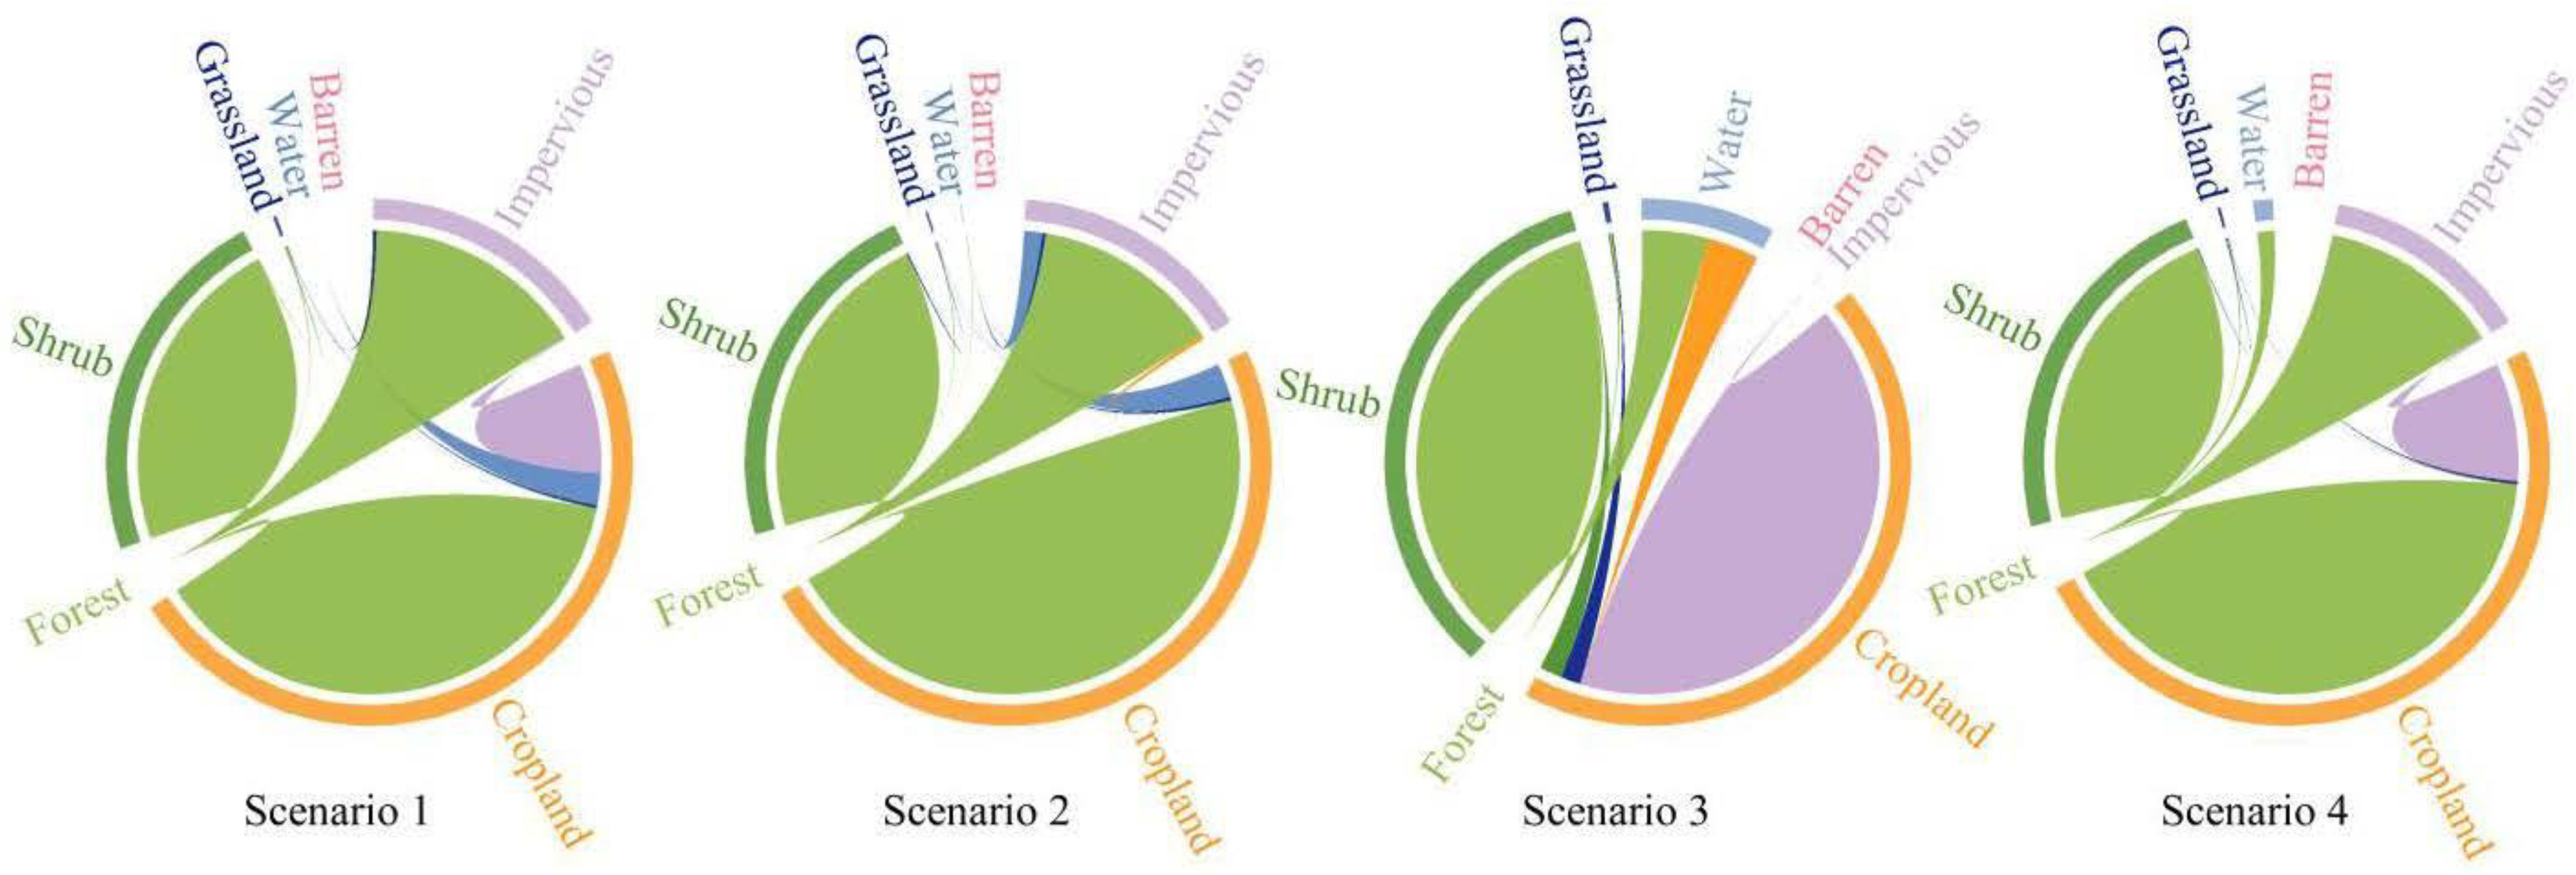
  • Change of land use in Guilin: From 2005 to 2020, the type of land use in Guilin was mainly forest land, and the changing trend showed that the area of forest land, shrubs, and water area decreased, especially the forest land. Cropland and impervious have been expanding and the area has increased. In 2035, under different future scenarios, land use will still be dominated by forest land, but the change will vary significantly. Cropland and shrubs increased significantly under S1; S2 accelerated the transformation of forest land; S3 has the most obvious protection for forest land and water area; and for S4, the water area and impervious increased. Forest land is an important transformation type in all scenarios.
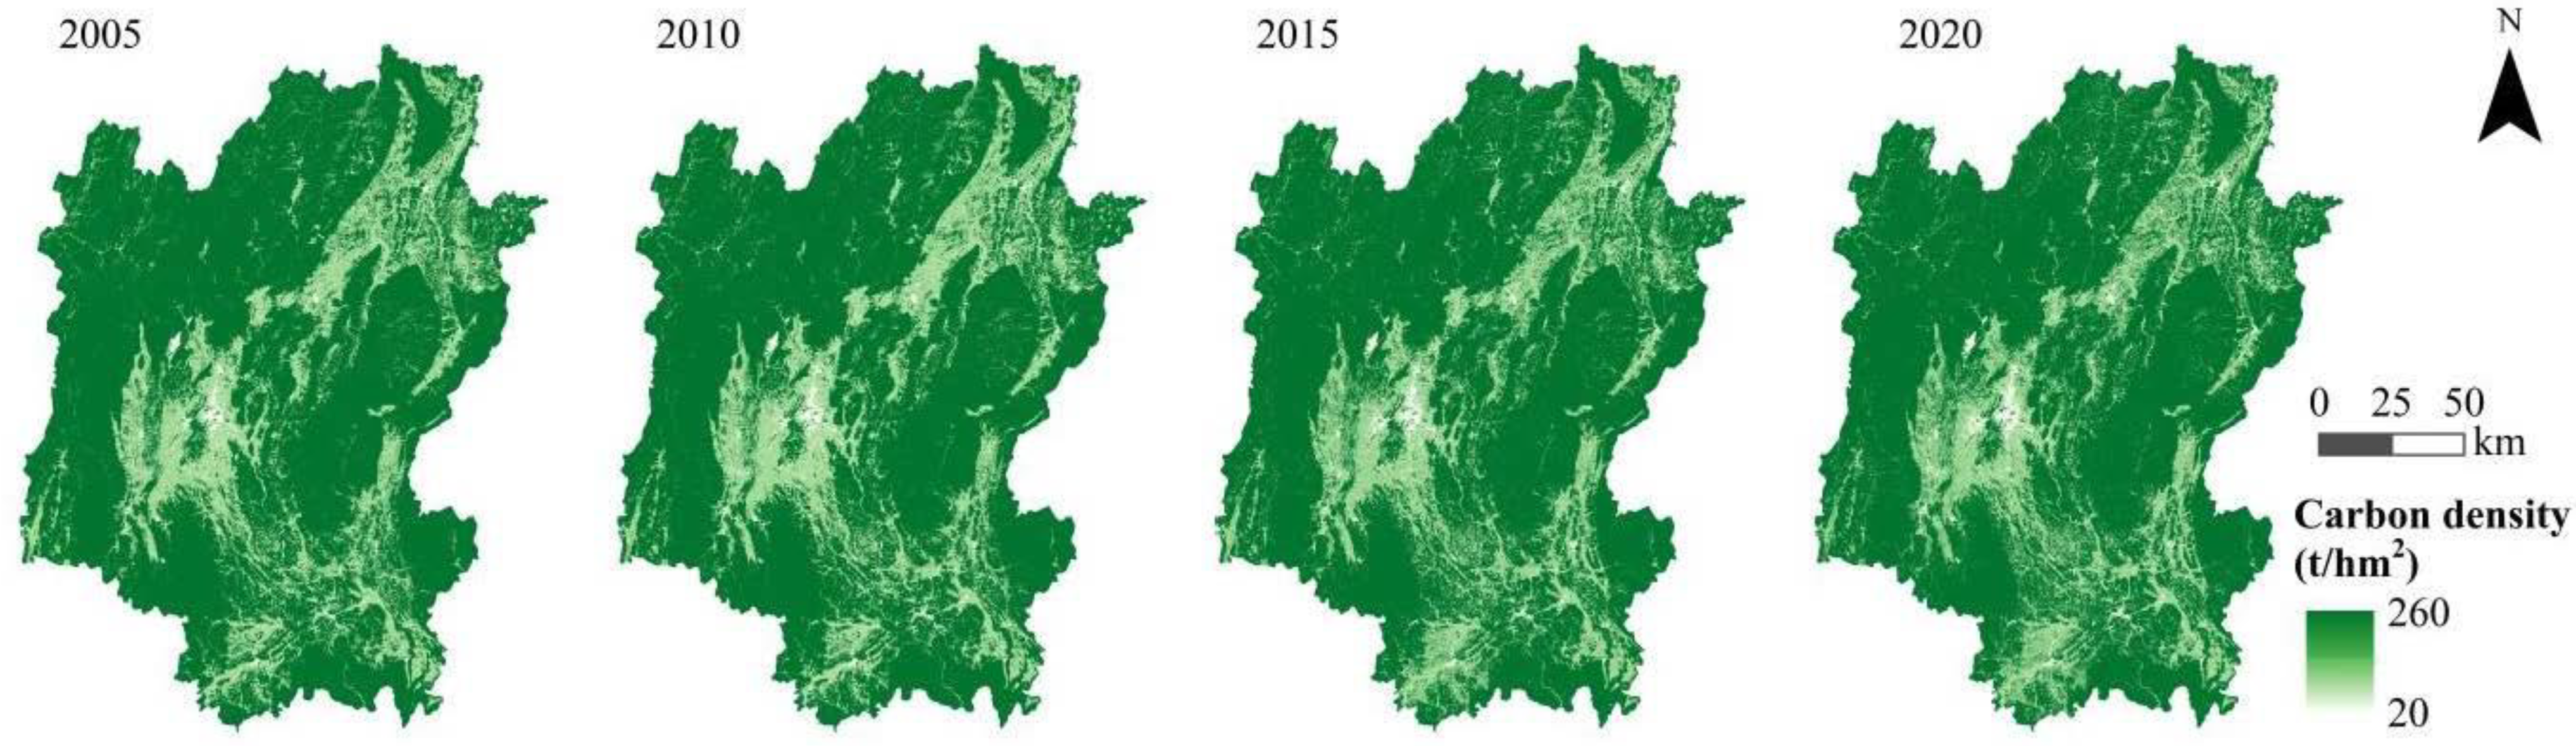
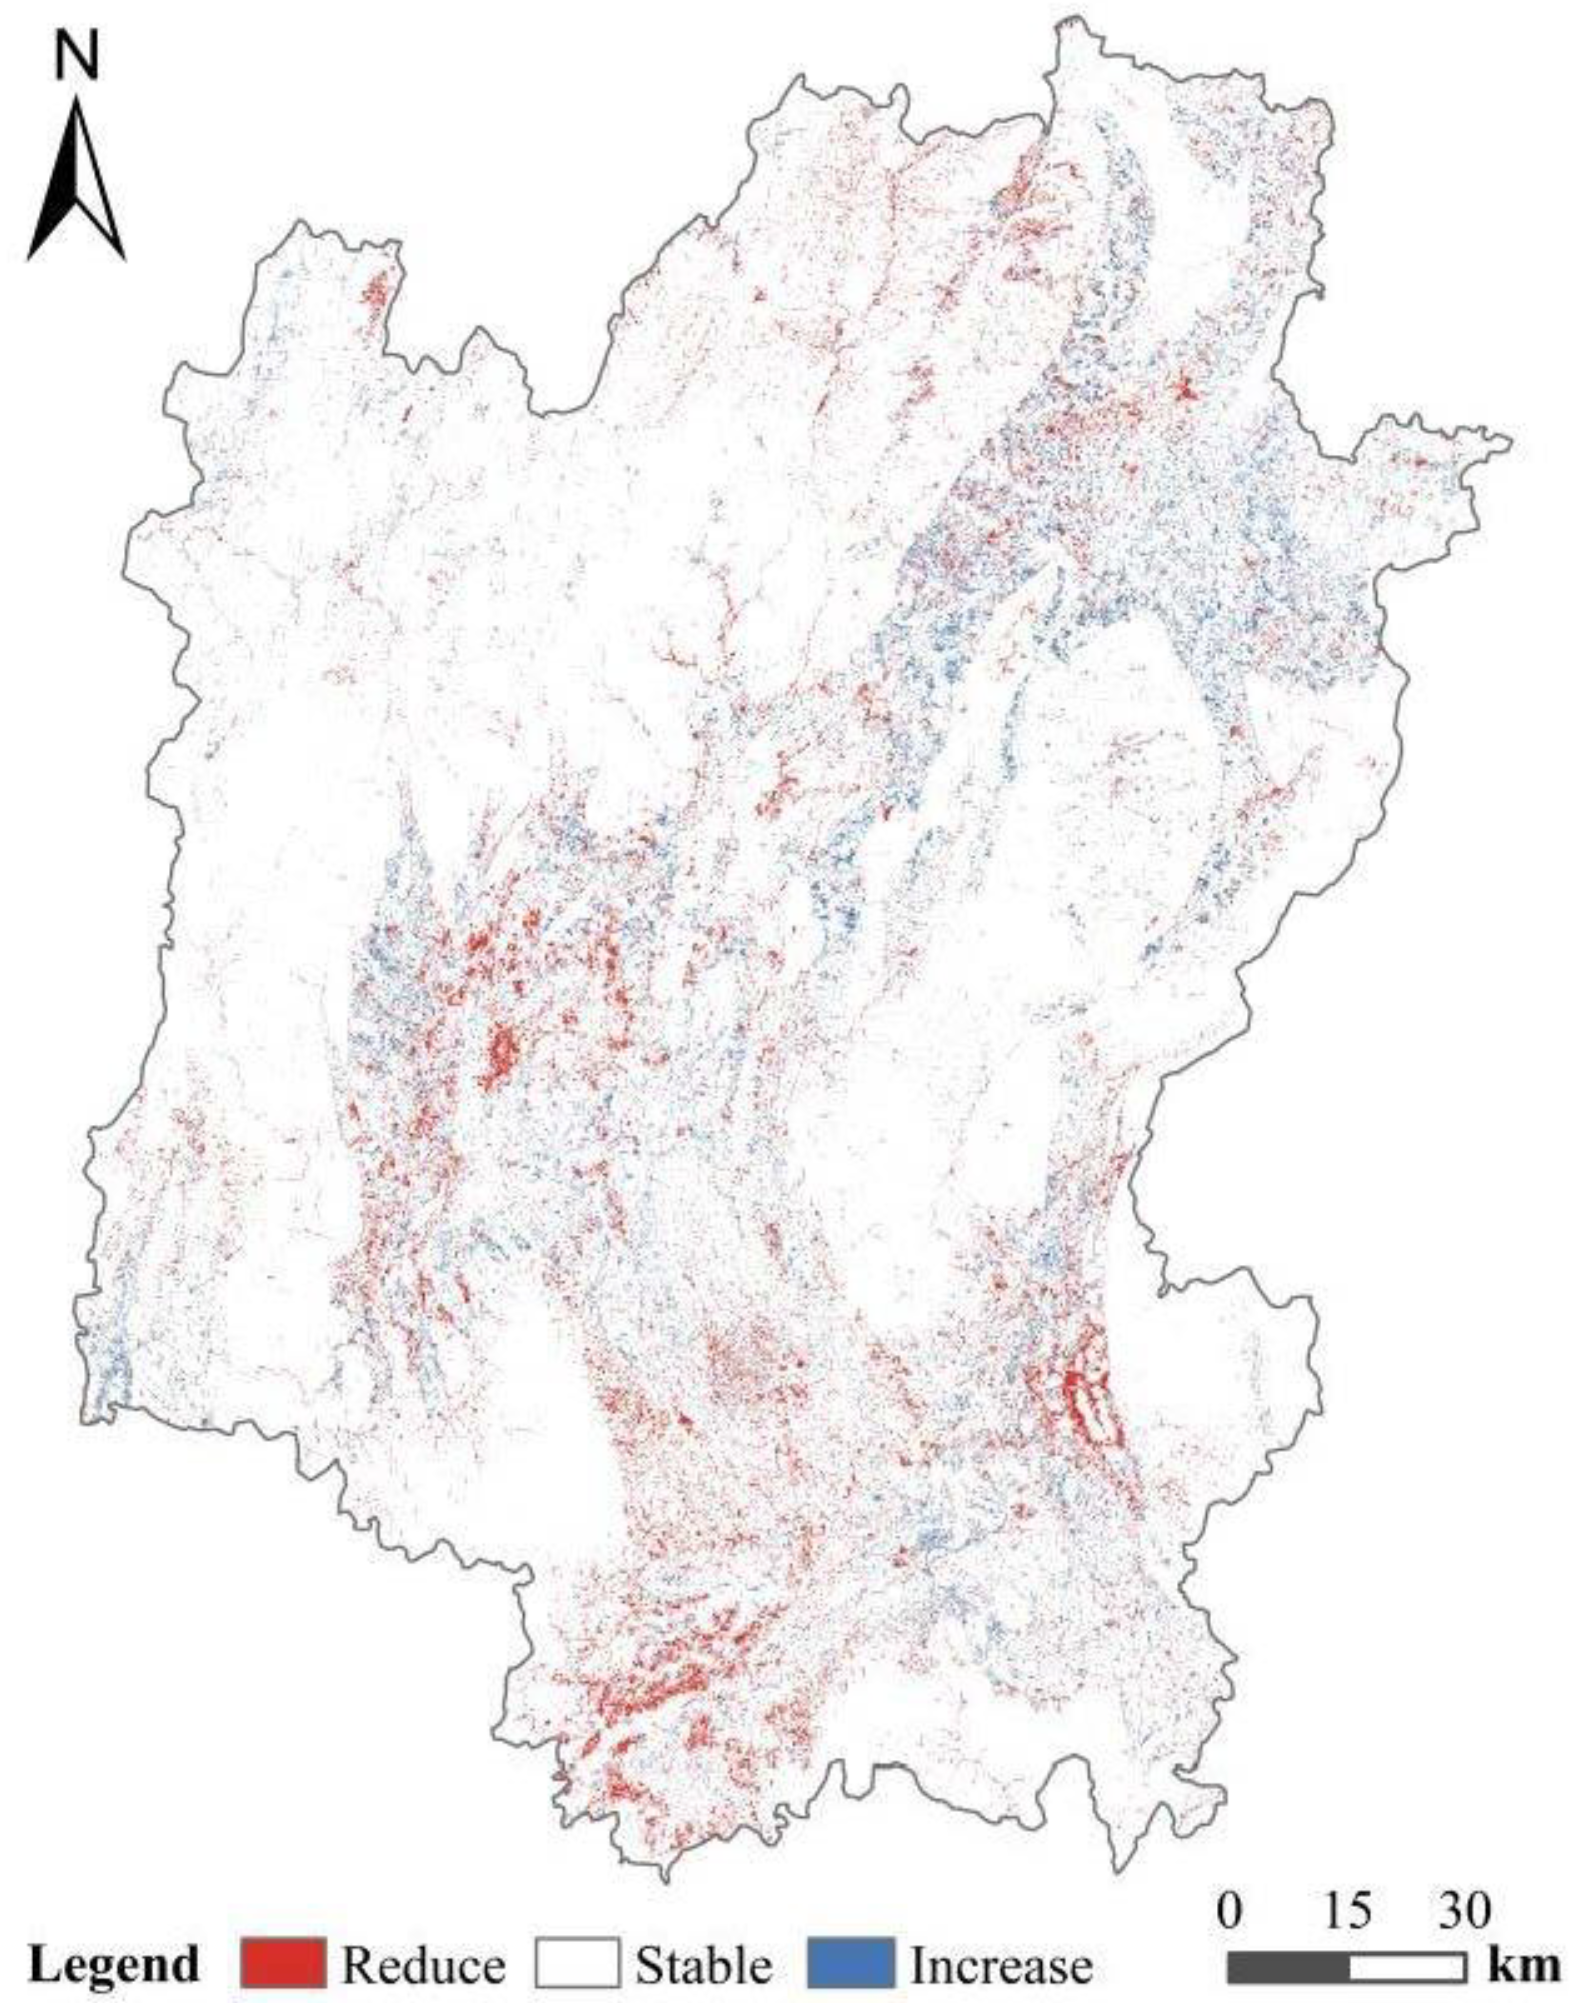
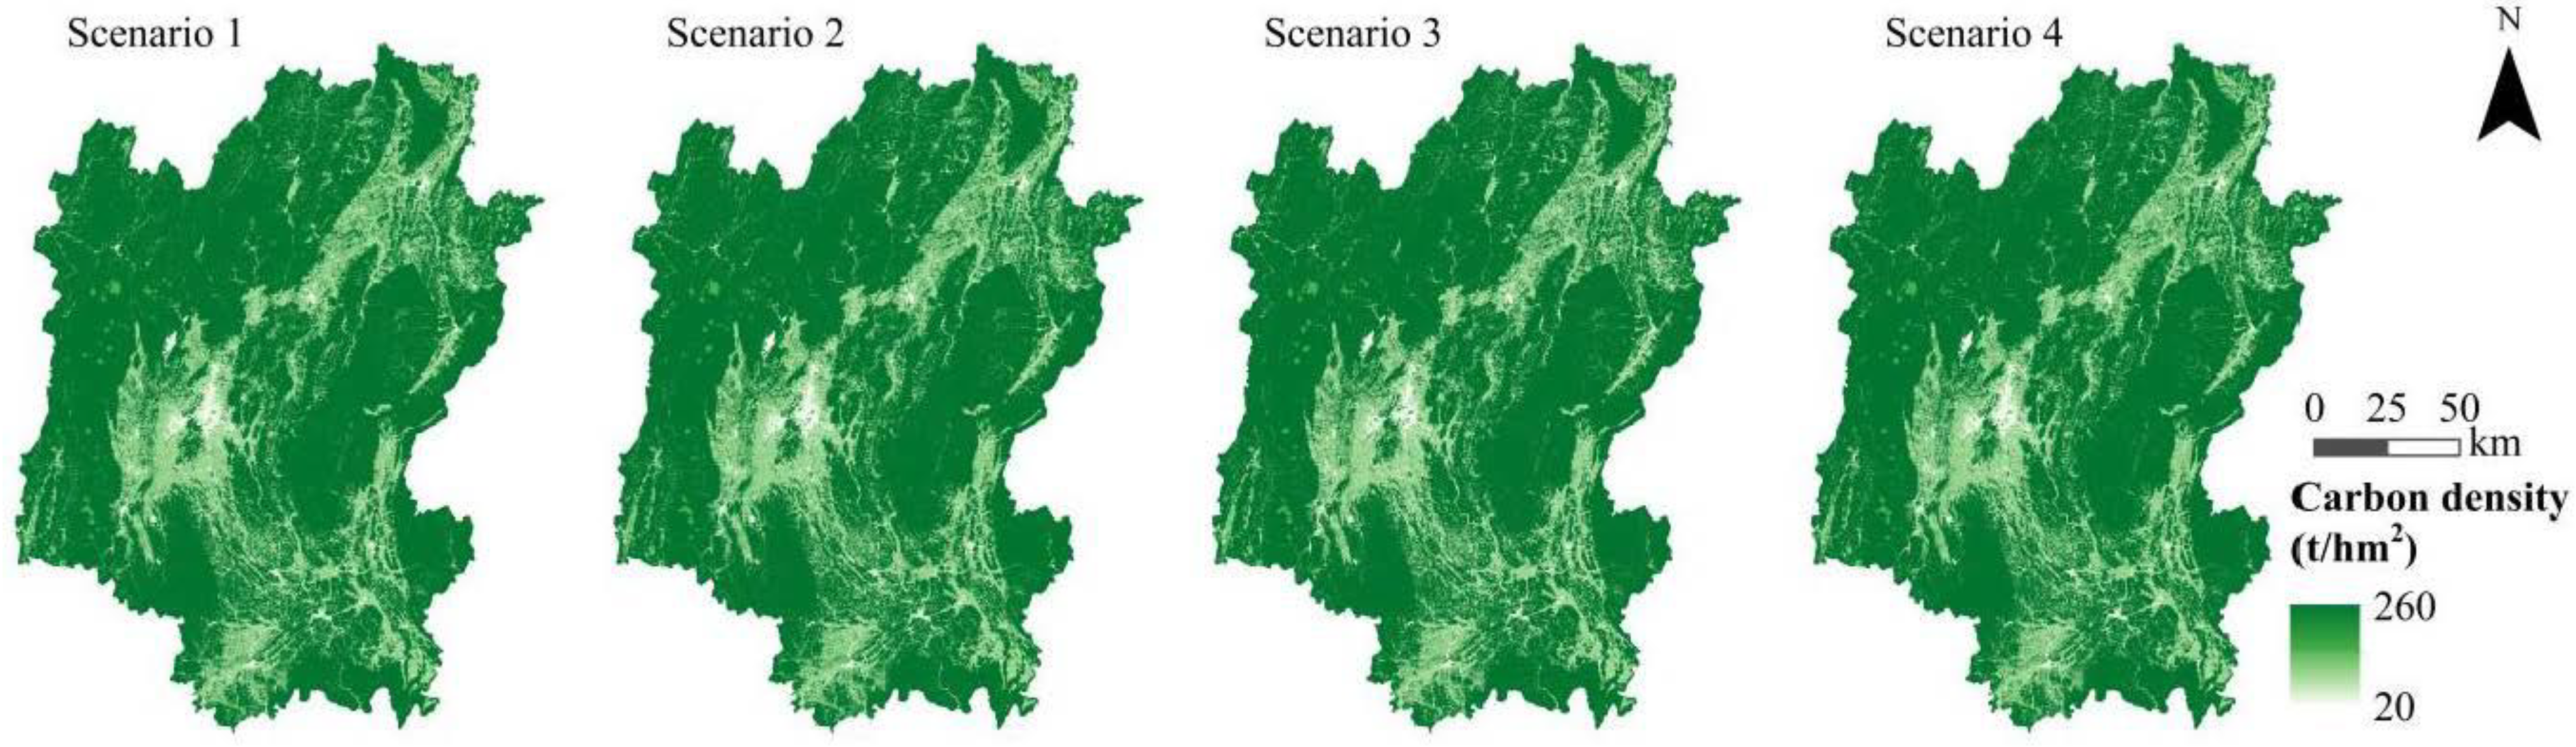
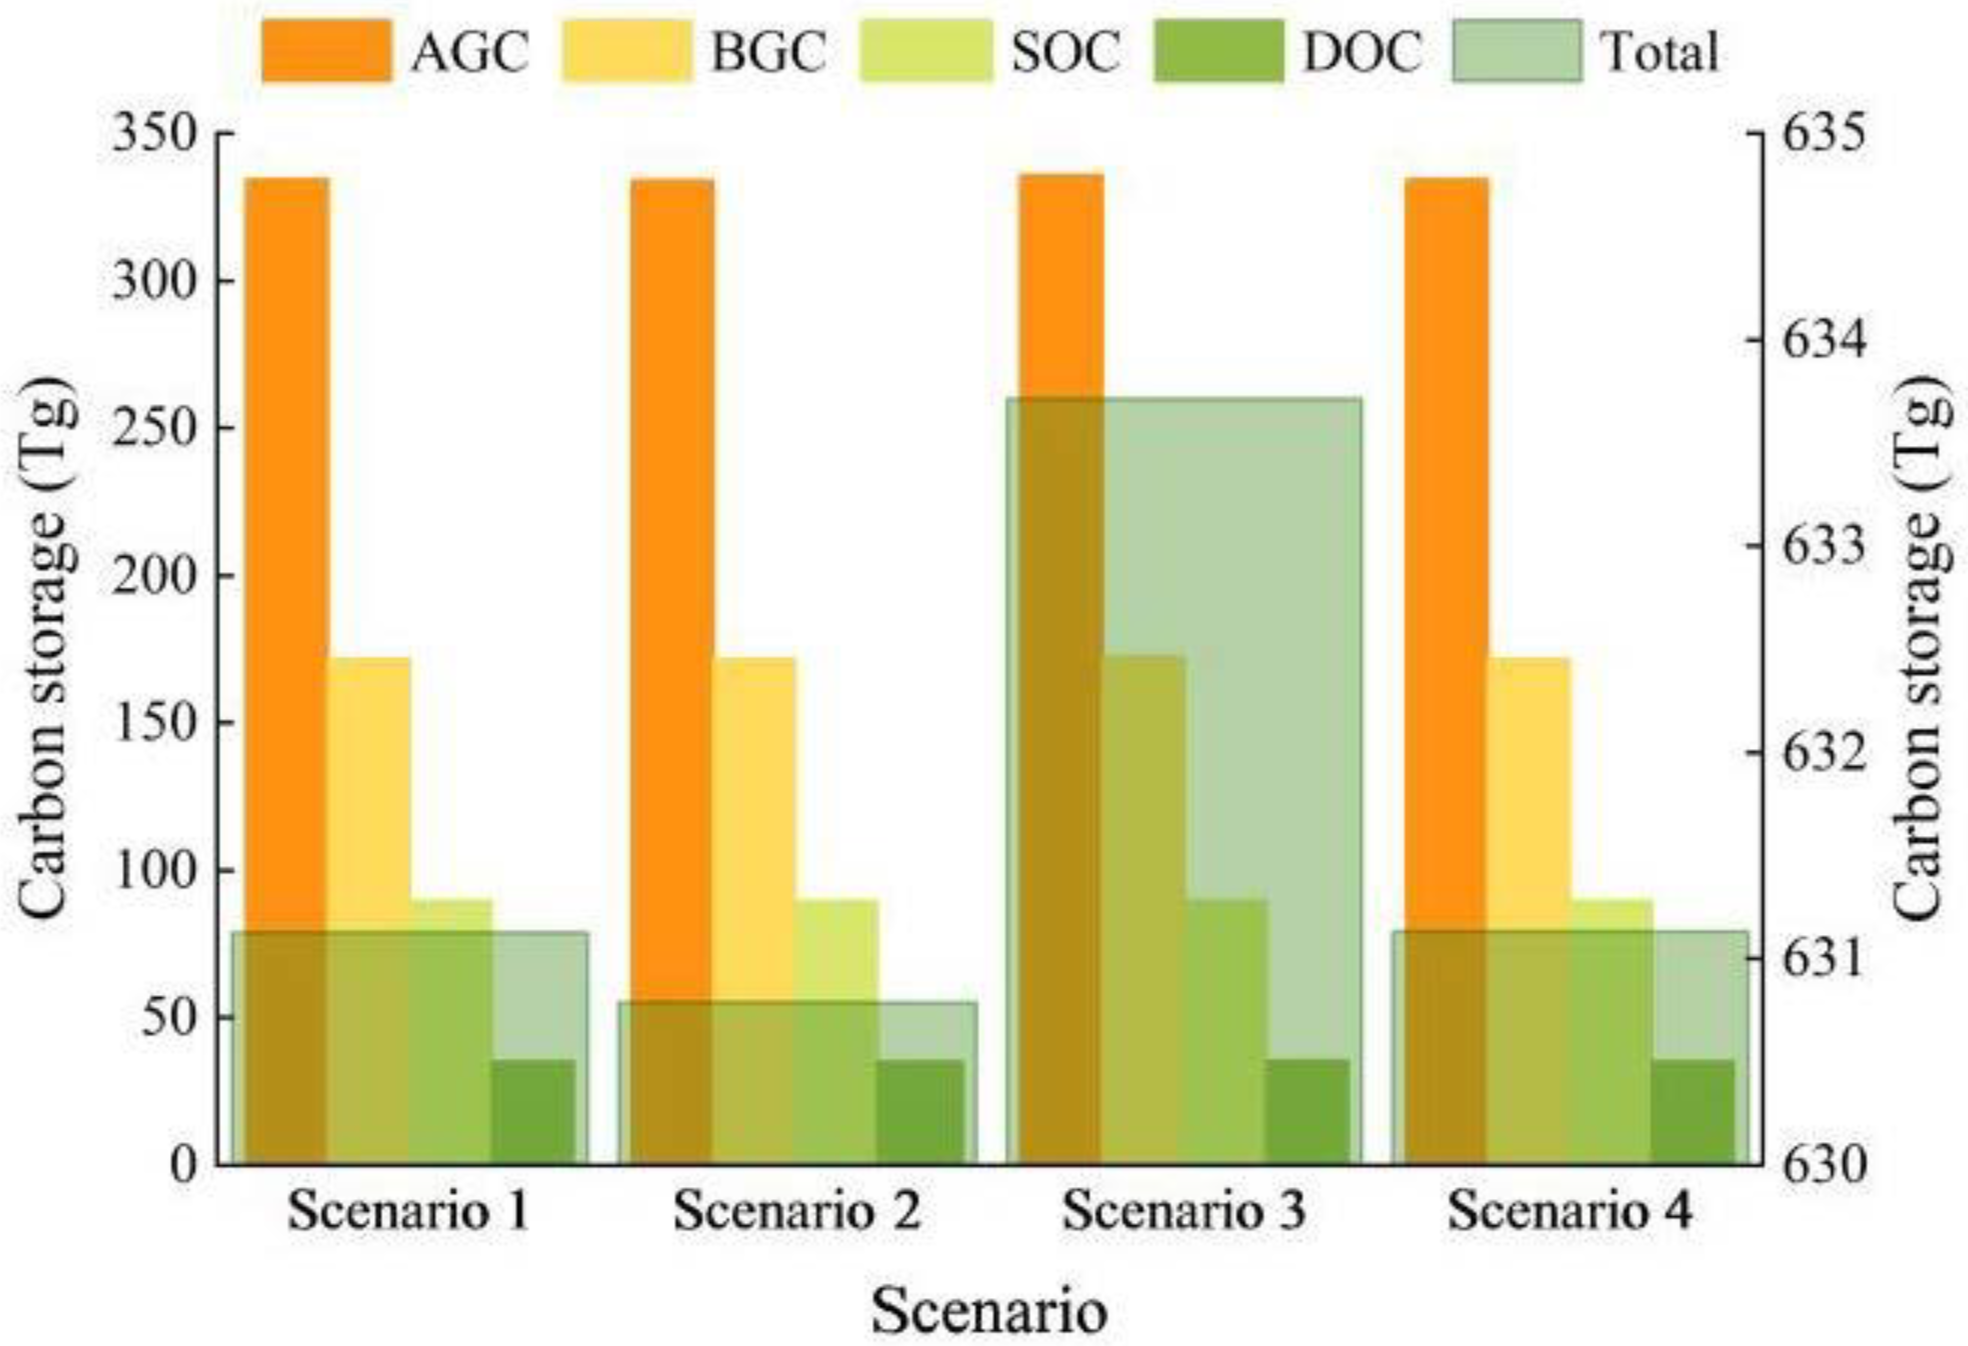
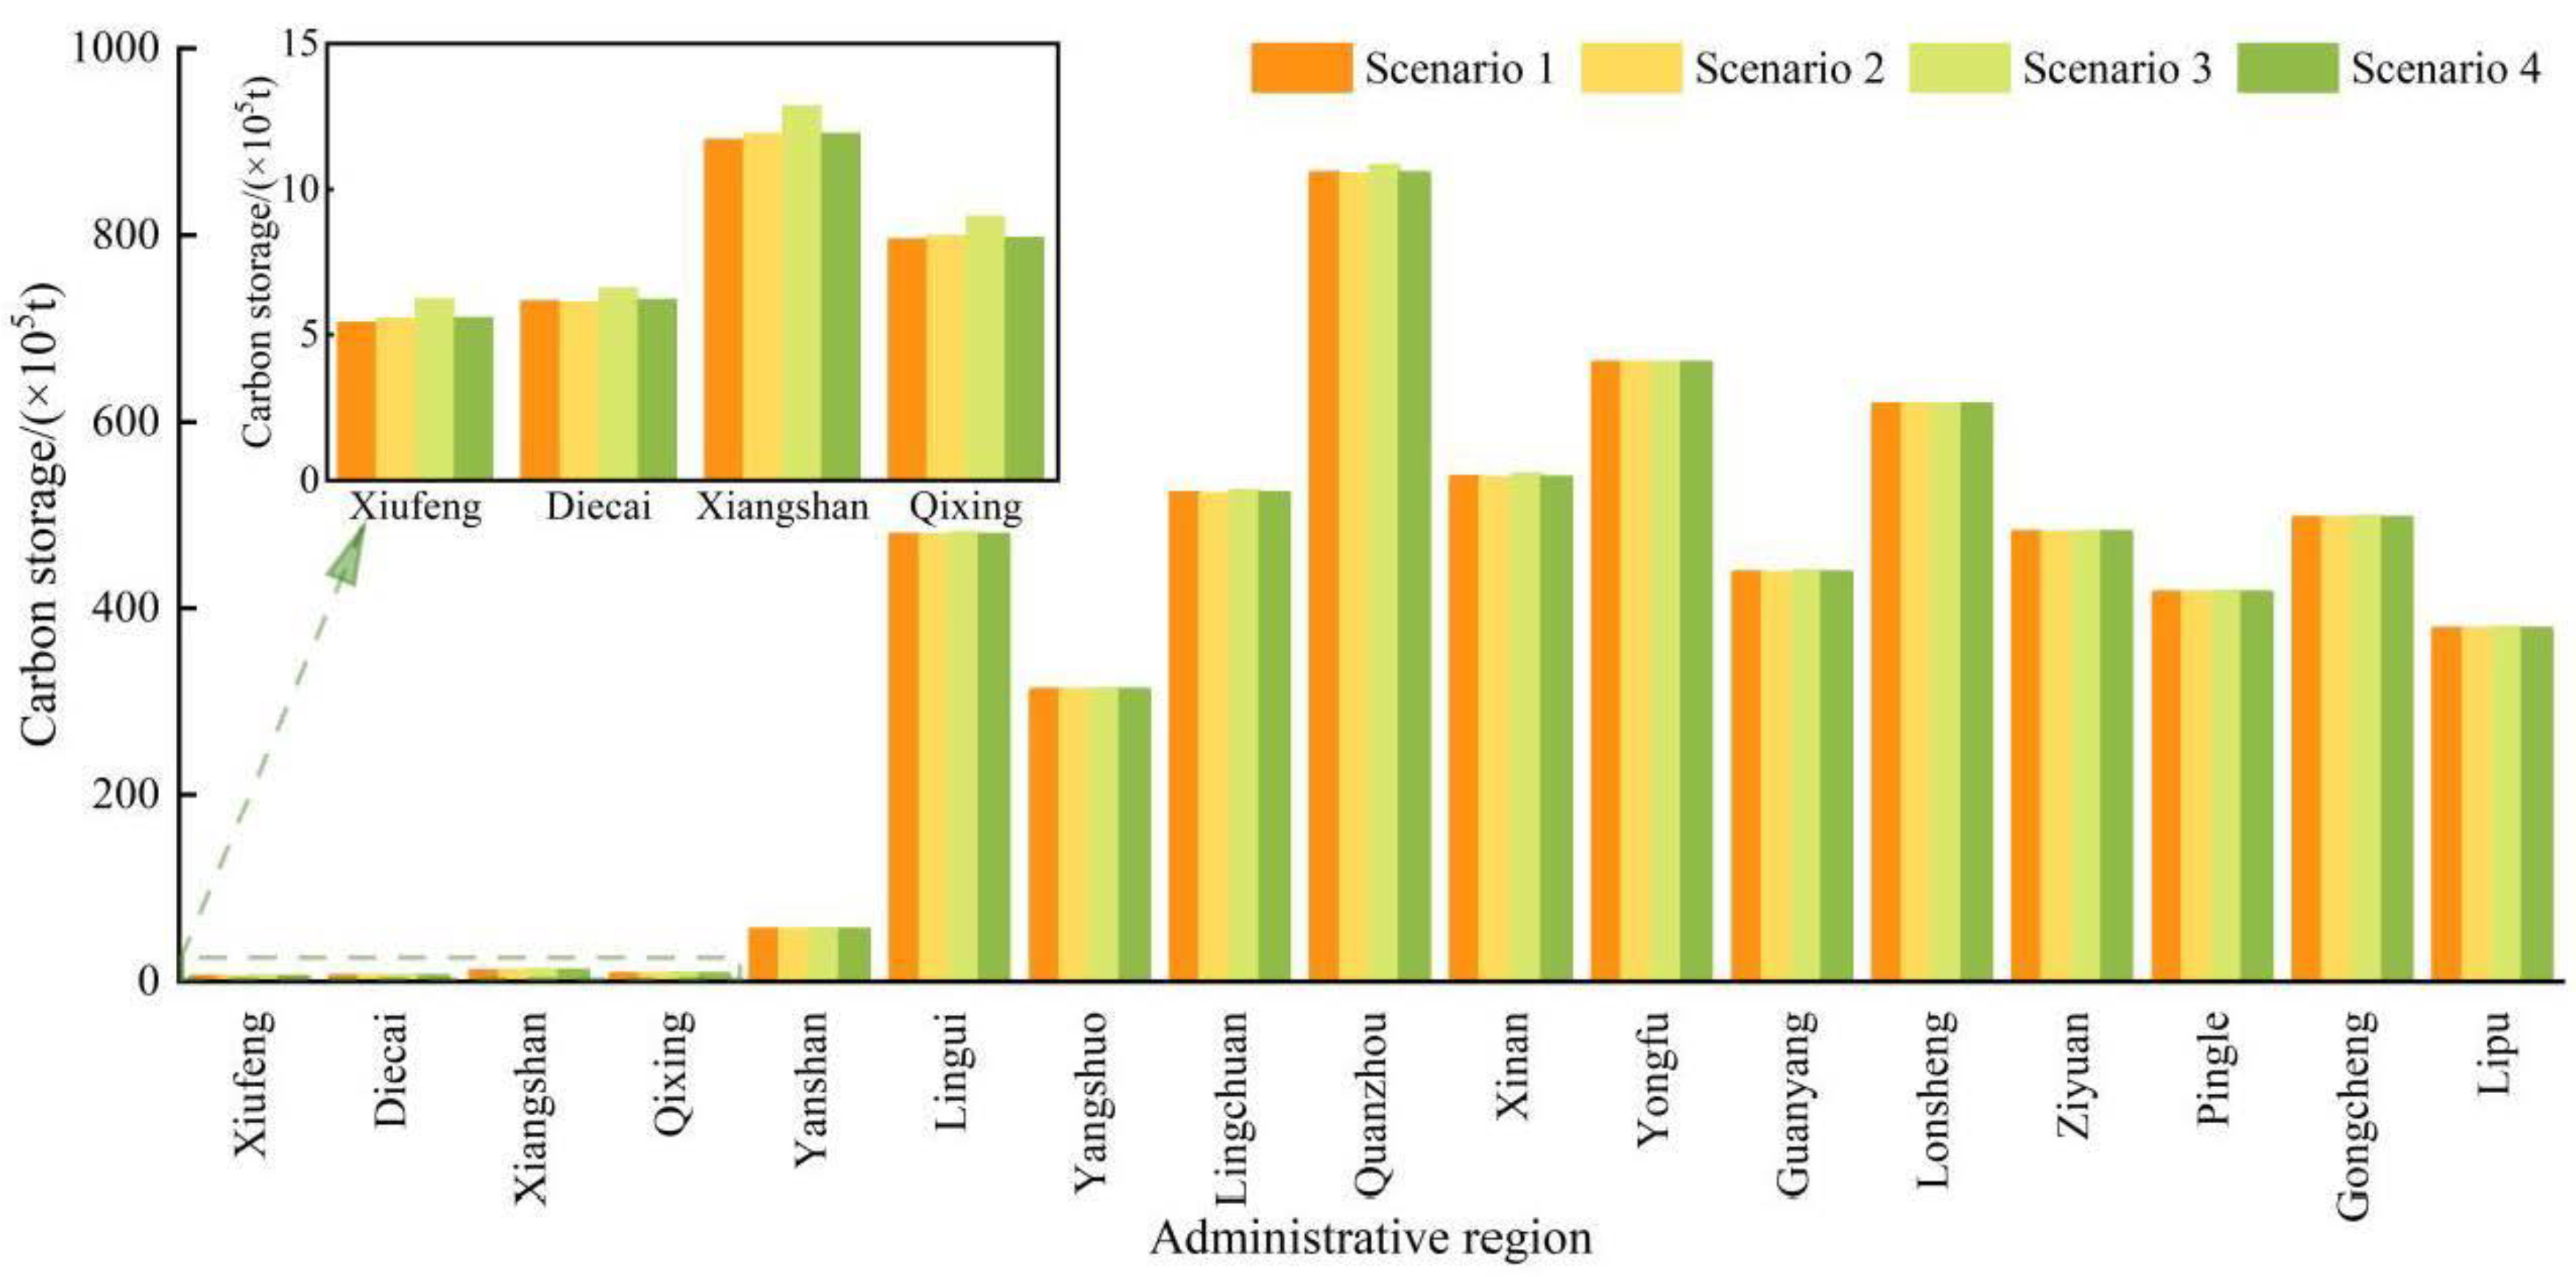
  • Temporal and spatial changes in carbon storage in Guilin: From 2005 to 2020, the area with high carbon storage in Guilin was located in the northwest of the study area, with the highest carbon density of 260 t/hm2. The total carbon storage was decreasing year by year, with a cumulative loss of 4.51 Tg, of which AGC was the most serious. In general, the area of carbon loss in Guilin from 2005 to 2020 is larger than the area of carbon increase. In 2035, S3 will have the highest carbon storage, reaching 874.76 × 10⁶ t. AGC is still the main carbon pool in Guilin. The carbon storage under the four future scenarios is similar to some extent, with the highest in Quanzhou County and the lowest in Xiufeng District. Most of the regions with high carbon storage are located in the northwest and northeast of Guilin. No matter what scenario, the carbon storage in the main urban area is maintained at a low level.
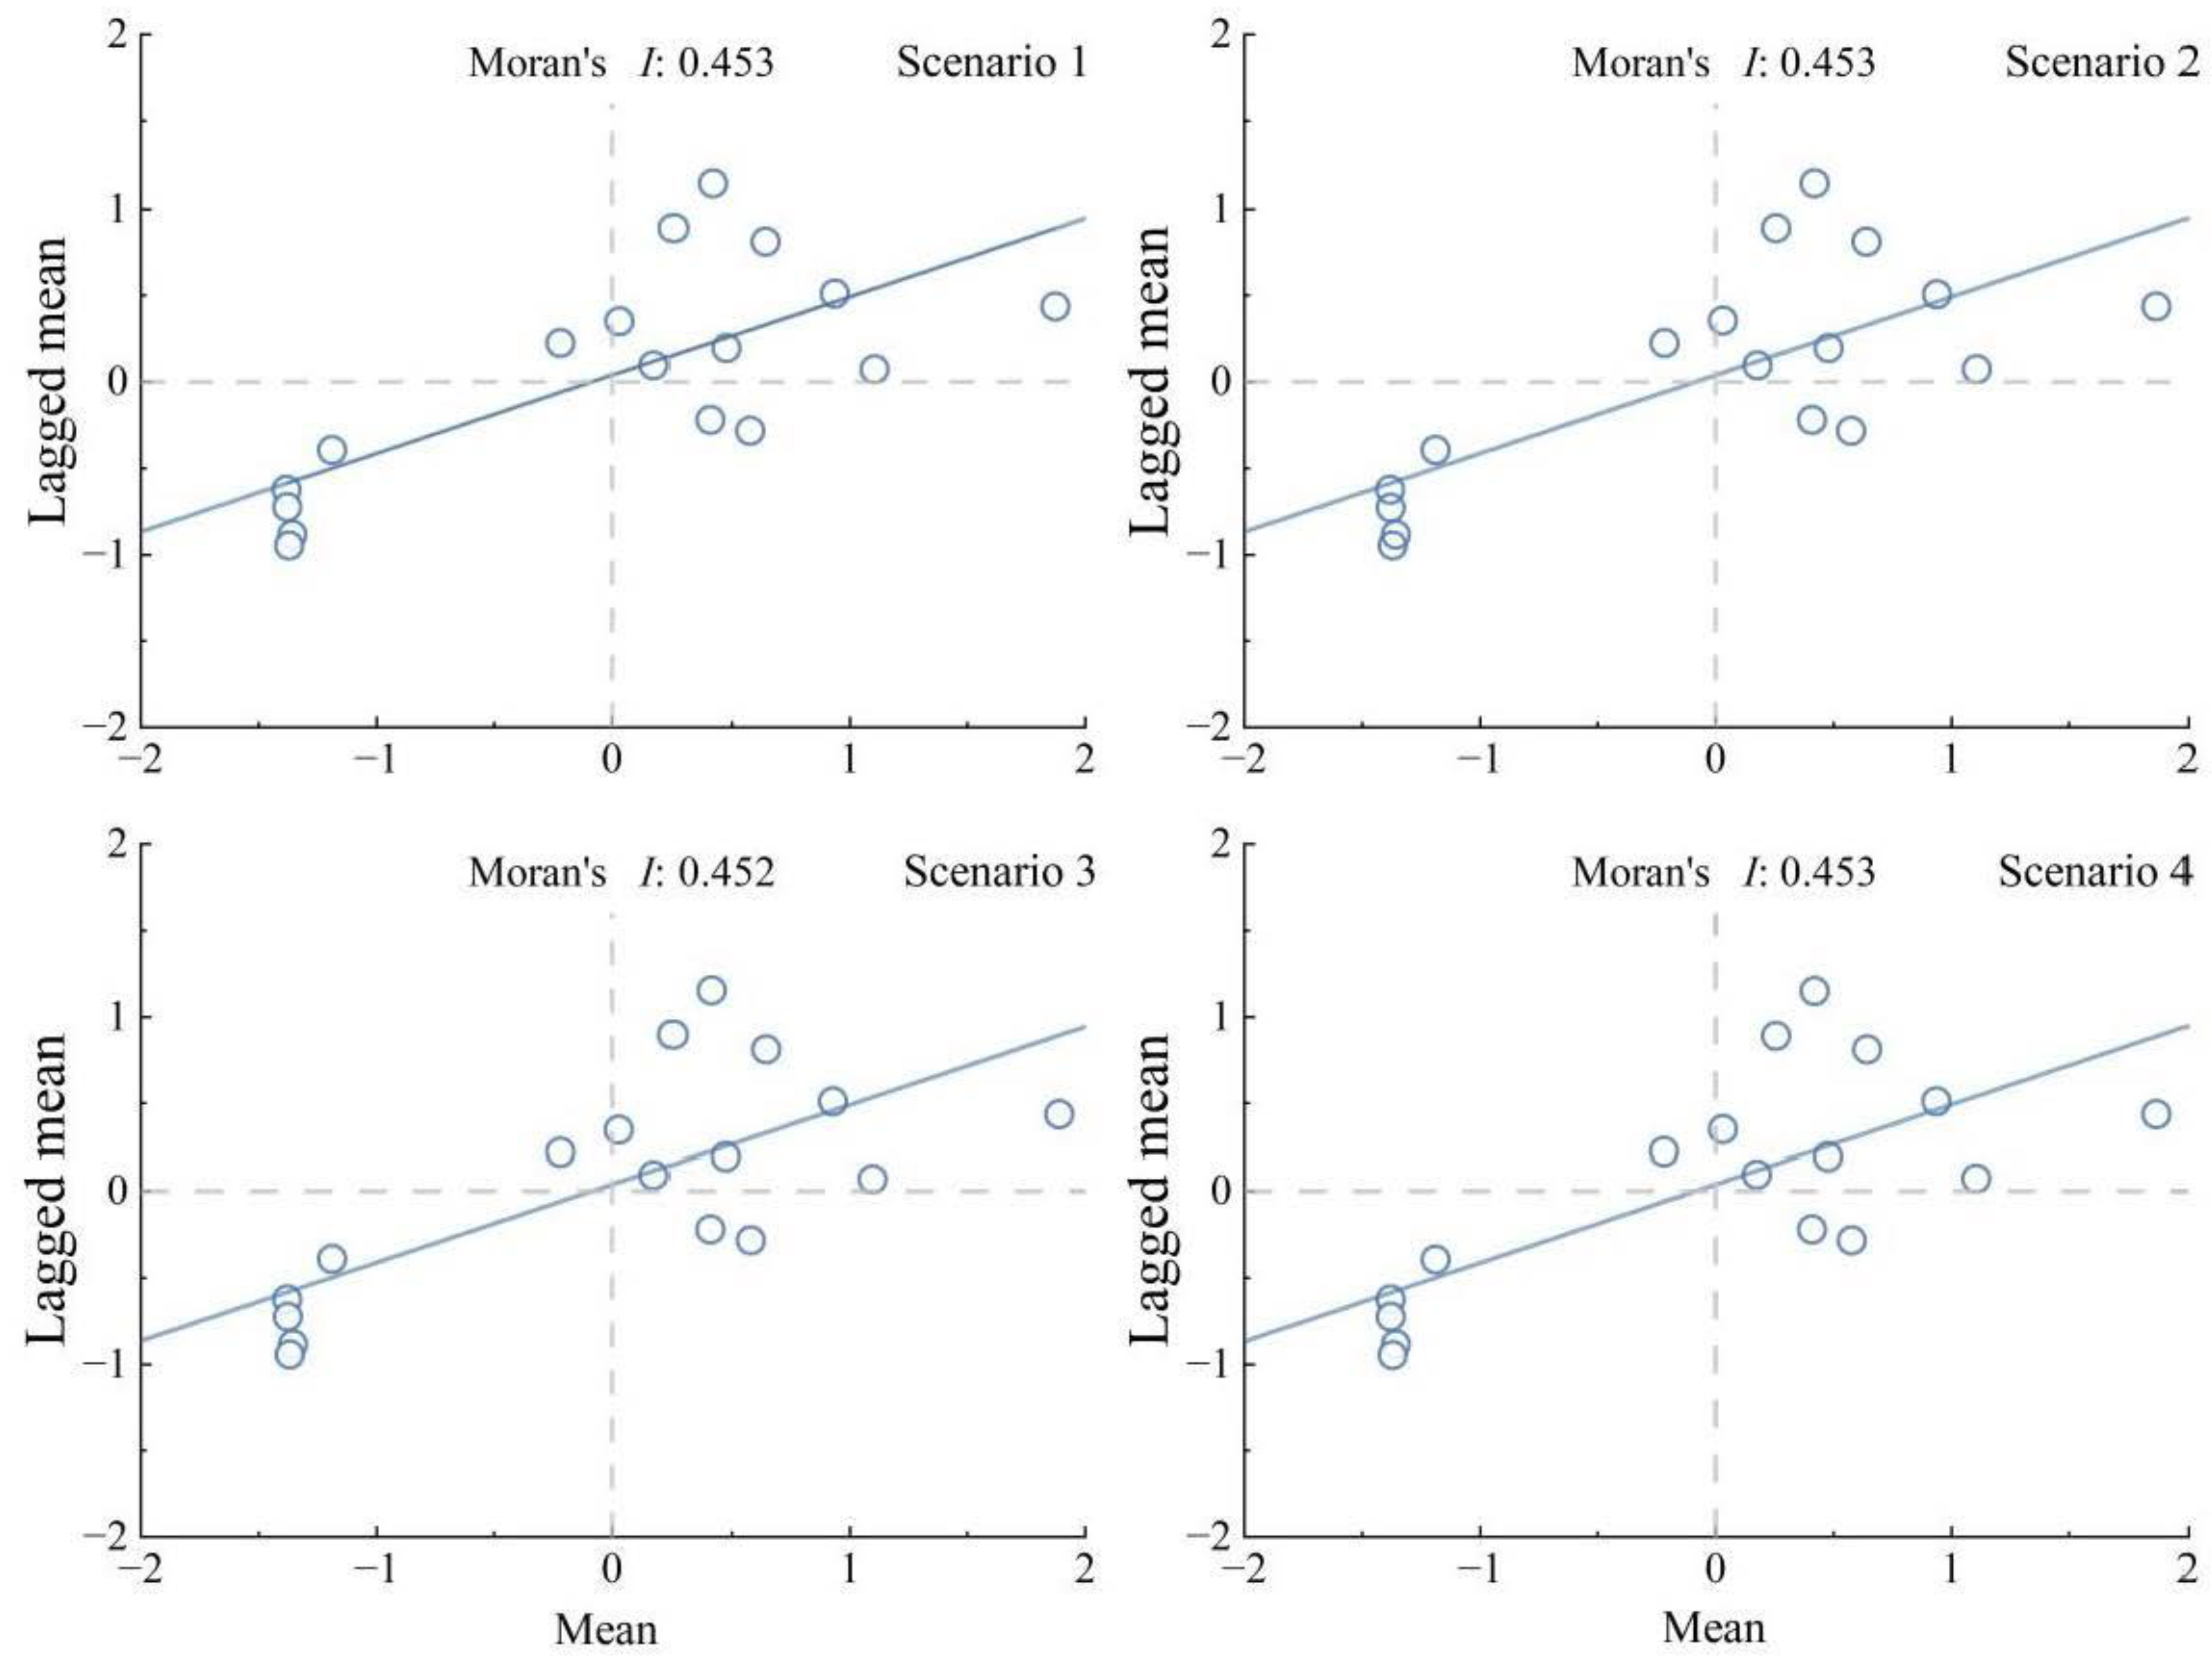
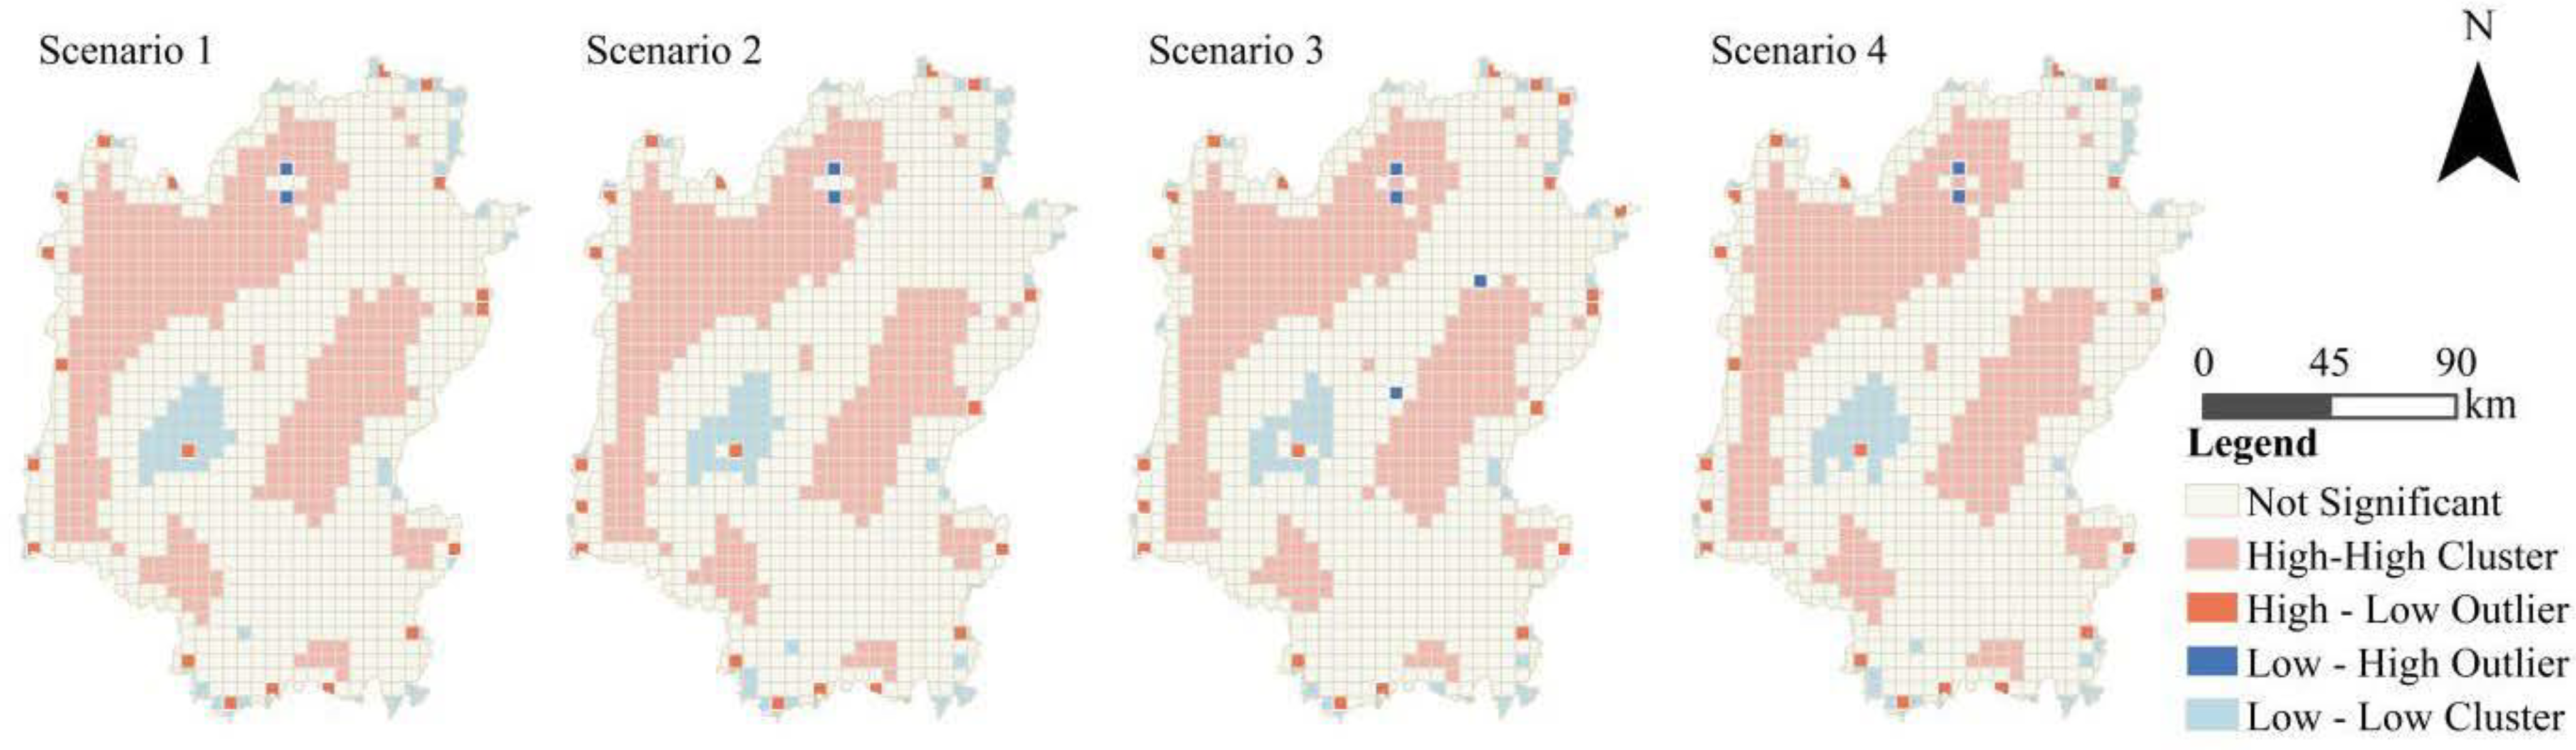
  • Autocorrelation analysis of carbon storage space: the TISA results show that 14 of the 17 counties and districts in Guilin City have a strong spatial positive correlation, among which the hot spots are more than the cold spots. LISA shows that the spatial distribution of carbon storage values under different future scenarios is similar. High carbon storage values are concentrated in the northwest and west of Guilin City, whereas low carbon storage values are concentrated in the urban area of Guilin.

Author Contributions

Conceptualization, Y.H.; methodology, Y.H.; software, Y.H.; validation, Y.H.; formal analysis, Y.H.; investigation, Y.H.; resources, Y.H.; data curation, Y.H.; writing—original draft preparation, Y.H.; writing—review and editing, Y.H., C.Z., H.Y. and J.M.; visualization, Y.H.; supervision, J.M.; project administration, J.M.; funding acquisition, J.M. All authors have read and agreed to the published version of the manuscript.

Funding

This research was funded by the Guangxi Key Research and Development Projects (Guike AB21220057 and Guike AB21196065); Guangxi Innovation-Driven Development Project (Guike AA20161002-1); and National Key R&D Program of China (2022YFC3800705).

Data Availability Statement

Data can be made available by contacting authors.

Conflicts of Interest

The authors declare no conflict of interest.

References

  1. Houghton, R.A. Revised estimates of the annual net flux of carbon to the atmosphere from changes in land use and land management 1850–2000. Tellus B Chem. Phys. Meteorol. 2003, 55, 378–390. [Google Scholar]
  2. Gong, J.; Liu, D.; Zhang, J.; Xie, Y.; Cao, E.; Li, H. Tradeoffs/synergies of multiple ecosystem services based on land use simulation in a mountain-basin area, western China. Ecol. Indic. 2019, 99, 283–293. [Google Scholar] [CrossRef]
  3. Costanza, R.; De Groot, R.; Sutton, P.; Van der Ploeg, S.; Anderson, S.J.; Kubiszewski, I.; Farber, S.; Turner, R.K. Changes in the global value of ecosystem services. Glob. Environ. Change 2014, 26, 152–158. [Google Scholar] [CrossRef]
  4. Wang, S.Q.; Liu, J.; Yu, G.R. Error analysis of estimating terrestrial soil organic carbon storage in China. Chin. J. Appl. Ecol. 2003, 5, 797–802. [Google Scholar]
  5. Zhang, Y.; Li, X.G.; Wen, Y.L. Forest carbon sequestration potential in China under the background of carbon emission peak and carbon neutralization. J. Beijing For. Univ. 2022, 44, 38–47. [Google Scholar]
  6. Sun, W.; Liu, X. Review on carbon storage estimation of forest ecosystem and applications in China. For. Ecosyst. 2020, 7, 4. [Google Scholar] [CrossRef] [Green Version]
  7. Wang, Z.; Li, X.; Mao, Y.; Li, L.; Wang, X.; Lin, Q. Dynamic simulation of land use change and assessment of carbon storage based on climate change scenarios at the city level: A case study of Bortala, China. Ecol. Indic. 2022, 134, 108499. [Google Scholar] [CrossRef]
  8. Yang, J.; Xie, B.P.; Zhang, D.G. Spatio-temporal evolution of carbon stocks in the Yellow River Basin based on InVEST and CA-Markov models. Chin. J. Eco-Agric. 2021, 29, 1018–1029. [Google Scholar]
  9. Wu, D.; Zhu, K.W.; Zhang, S.; Huang, C.Q.; Li, J. Evolution Analysis of Carbon Stock in Chengdu-Chongqing Economic Zone Based on PLUS Model and InVEST Model. Ecol. Environ. Monit. Three Gorges 2022, 7, 85–96. [Google Scholar]
  10. Deng, Y.; Yao, S.; Hou, M.; Zhang, T.; Lu, Y.; Gong, Z.; Wang, Y. Assessing the effects of the Green for Grain Program on ecosystem carbon storage service by linking the InVEST and FLUS models: A case study of Zichang county in hilly and gully region of Loess Plateau. J. Nat. Resour. 2020, 35, 826–844. [Google Scholar]
  11. Yao, P.; Chen, X.G.; Zhou, Y.F.; Zhao, W.J.; Lu, M.; Tu, J. Carbon sequestration potential of the major stands under the Grain for Green Program in Southwest China in the next 50years. Acta Ecol. Sin. 2014, 34, 3025–3037. [Google Scholar]
  12. Wei, Y.W.; Zhou, W.M.; Yu, D.P.; Zhou, L.; Fang, X.M.; Zhao, W.; Bao, Y.; Meng, Y.Y.; Dai, L.M. Carbon storage of forest vegetation under the Natural Forest Protection Program in Northeast China. Acta Ecol. Sin. 2014, 34, 5696–5705. [Google Scholar]
  13. Zhang, B.; Li, L.; Xia, Q. Land use change and its impact on carbon storage under the constraints of “three lines”: A case study of Wuhan City circle. Acta Ecol. Sin. 2022, 42, 2265–2280. [Google Scholar]
  14. Xiong, J.H.; Yue, W.Z.; Chen, Y.; Liao, R.; Fang, K. Multi-scenario urban expansion simulation for SDGs: Taking the Central Asian region along the Belt and Road as an example. J. Nat. Resour. 2021, 36, 841–853. [Google Scholar] [CrossRef]
  15. Zhang, M.Y.; Wang, K.L.; Deng, Z.H.; Liu, H.Y.; Yue, Y.M.; Duang, Y.F. Factors influencing the spatial distribution of vegetation carbon density in karst landscapes of Northwest Guangxi: A case study based on radial basis function network model. Acta Ecol. Sin. 2014, 34, 3472–3479. [Google Scholar]
  16. Wei, X.; Shao, Y.; Cai, X.W.; Lin, Z.M.; Xiao, L.G.; Liu, Z.H. Spatio-temporal characteristics and prediction about carbon storage in terrestrial ecosystems in Lijiang River Basin. J. Environ. Eng. Technol. 2022, 1–13. [Google Scholar]
  17. Wang, X.; Zhang, H.; Zhu, Q.; Wen, R.; Li, R.; Ma, J. Variation assessment of ecological carrying capacity using three-dimensional ecological footprint model in Guilin from 2000 to 2018. J. Meteorol. Environ. 2021, 37, 62–70. [Google Scholar]
  18. Jiang, Y.; Yu, Z.; Liu, G.; Chen, R.; Peng, G. Genetoxicity of water samples from the scenic Lijang river in the Guilin area, China, evaluated by Tradescantia bioassays. Mutat. Res./Fundam. Mol. Mech. Mutagen 1999, 426, 137–141. [Google Scholar] [CrossRef]
  19. Yang, J.; Huang, X. The 30 m annual land cover dataset and its dynamics in China from 1990 to 201. Earth Syst. Sci. Data 2021, 13, 3907–3925. [Google Scholar] [CrossRef]
  20. Stafford-Smith, M.; Griggs, D.; Gaffney, O. Integration: The key to implementing the Sustainable Development Goals. Sustain. Sci. 2017, 12, 911–919. [Google Scholar] [CrossRef] [Green Version]
  21. Sachs, J.D. From millennium development goals to sustainable development goals. Lancet 2012, 37, 2206–2211. [Google Scholar] [CrossRef] [PubMed]
  22. Hák, T.; Janoušková, S.; Moldan, B. Sustainable Development Goals: A need for relevant indicators. Ecol. Indic. 2016, 60, 565–573. [Google Scholar] [CrossRef]
  23. SDG, U. Sustainable development goals. In The Energy Progress Report; Tracking SDG: New York, NY, USA, 2019; p. 7. [Google Scholar]
  24. Li, C.; Wu, J. Land use transformation and eco-environmental effects based on production-living-ecological spatial synergy: Evidence from Shaanxi Province, China. Environ. Sci. Pollut. Res. 2022, 29, 41492–41504. [Google Scholar] [CrossRef]
  25. Liu, X.; Liang, X.; Li, X.; Xu, X.; Ou, J.; Chen, Y.; Li, S.; Wang, S.; Pei, F. A future land use simulation model (FLUS) for simulating multiple land use scenarios by coupling human and natural effects. Landsc. Urban Plan 2017, 168, 94–116. [Google Scholar] [CrossRef]
  26. Chen, Z.; Huang, M.; Zhu, D.; Altan, O. Integrating remote sensing and a markov-FLUS model to simulate future land use changes in Hokkaido, Japan. Remote Sens. 2021, 13, 2621. [Google Scholar] [CrossRef]
  27. Zhao, J.; Shao, Z.; Xia, C.; Fang, K.; Chen, R.; Zhou, J. Ecosystem services assessment based on land use simulation: A case study in the Heihe River Basin, China. Ecol. Indic. 2022, 143, 109402. [Google Scholar] [CrossRef]
  28. Wang, B.S.; Liao, J.F.; Zhu, W.; Qiu, Q.Y.; Wang, L.; Tang, L.N. The weight of neighborhood setting of the FLUS model based on u historical scenario: A case study of land use simulation of urban agglomeration of the Golden Triangle of Southern Fujian in 2030. Acta Ecol. Sin. 2019, 39, 4284–4298. [Google Scholar]
  29. Han, L.; Yang, M.L.; Liu, Z.; Zhao, Y.H.; Zhao, Z.L.; Zhang, Y.F. Ecosystem services trade off and synergy in typical conversion areas of the Loess Plateau: Taking Yan’an City as an example. Acta Ecol. Sin. 2022, 42, 8115–8125. [Google Scholar]
  30. Cao, Q.; Zhang, X.; Lei, D.; Guo, L.; Sun, X.; Kong, F.; Wu, J. Multi-scenario simulation of landscape ecological risk probability to facilitate different decision-making preferences. J. Clean. Prod. 2019, 227, 325–335. [Google Scholar] [CrossRef]
  31. Yang, Y.; Chen, J.; Lan, Y.; Zhou, G.; You, H.; Han, X.; Wang, Y.; Shi, X. Landscape Pattern and Ecological Risk Assessment in Guangxi Based on Land Use Change. Int. J. Environ. Res. Public Health 2022, 19, 1595. [Google Scholar] [CrossRef]
  32. Kupfer, J. Landscape ecology and biogeography, rethinking landscape metrics in a post-FRAGSTATS landscape. Prog. Phys. Geogr. 2012, 36, 400–420. [Google Scholar] [CrossRef]
  33. Shao, Z.; Chen, R.; Zhao, J.; Xia, C.Y.; He, Y.T. Spatial-temporal evolution and prediction of carbon storage in Beijing’ ecosystem based on FLUS and InVEST models. Acta Ecol. Sin. 2022, 42, 1–14. [Google Scholar]
  34. Zhang, M.; Wang, K.L.; Liu, H.Y.; Zhang, C.H.; Duan, Y.F. Spatio-temporal variation of vegetation carbon storage and density in karst areas of Northwest Guangxi based on remote sensing images. Chin. J. Eco-Agric. 2013, 21, 1545–1553. [Google Scholar] [CrossRef]
  35. Zhang, Z.M.; Zhou, Y.C.; Tian, X.; Huang, X.F. Study on spatial heterogeneity and reserve estimation of soil organic carbon in a small karst catchment. Acta Ecol. Sin. 2017, 37, 7647–7659. [Google Scholar]
  36. Zhu, B.L. Assessment on ecosystem service functions of typical karst peak-cluster depression in Guilin based on InVEST model. Chin. Acad. Geol. Sci. 2021. [Google Scholar] [CrossRef]
  37. Getis, A.; Ord, J.K. The analysis of spatial association by use of distance statistic. In Perspectives on Spatial Data Analysis; Springer: Berlin/Heidelberg, Germany, 2010; pp. 127–145. [Google Scholar]
  38. Anselin, L. The Moran scatterplot as an ESDA tool to assess local instability in spatial association. In Spatial Analytical Perspectives on GIS; Routledge: England, UK, 2019; pp. 111–126. [Google Scholar]
  39. Chen, Z.; Sarkar, A.; Rahman, A.; Li, X.; Xia, X. Exploring the drivers of green agricultural development (GAD) in China: A spatial association network structure approaches. Land Use Policy 2022, 112, 105827. [Google Scholar] [CrossRef]
  40. Yang, Q.; Liu, G.; Casazza, M.; Dumontet, S.; Yang, Z. Ecosystem restoration programs challenges under climate and land use change. Sci. Total Environ. 2022, 807, 150527. [Google Scholar] [CrossRef] [PubMed]
Figure 1. Location and terrain of the study area.
Remotesensing 15 01445 g001
Figure 2. Land use distribution and change in Guilin City From 2005 to 2020.
Remotesensing 15 01445 g002
Figure 3. Land use pattern of Guilin in 2035 under different future scenarios.
Remotesensing 15 01445 g003
Figure 4. The flowchart of land use change in Guilin City from 2020 to 2035.
Remotesensing 15 01445 g004
Figure 5. Change of carbon storage in Guilin from 2005 to 2020.
Remotesensing 15 01445 g005
Figure 6. Change of carbon stock in the basic carbon pool from 2005 to 2020. (AGC—aboveground carbon storage, BGC—underground carbon storage, SOC—soil organic carbon storage, and DOC—dead organic matter carbon storage).
Remotesensing 15 01445 g006
Figure 7. Spatial change of carbon storage in Guilin from 2005 to 2020.
Remotesensing 15 01445 g007
Figure 8. Carbon storage distribution under different future scenarios in 2035.
Remotesensing 15 01445 g008
Figure 9. Carbon storage of basic carbon stock under different future scenarios in 2035.
Remotesensing 15 01445 g009
Figure 10. Analysis and prediction of regional carbon storage in Guilin in 2035 under four future scenarios.
Remotesensing 15 01445 g010
Figure 11. Moran scatters plot of global spatial autocorrelation analysis of carbon storage in Guilin.
Remotesensing 15 01445 g011
Figure 12. Local spatial autocorrelation analysis of carbon storage in Guilin in 2035.
Remotesensing 15 01445 g012
Table 1. Selection and description of driving factors of land use change in Guilin.
Data TypeData NameFactor Description
Natural factorsElevationGeospatial Data Cloud (http://www.gscloud.cn/ (accessed on 15 October 2022)).
SlopeBased on DEM data, the surface analysis tool in ArcGIS software is used to obtain.
Aspect
Mean Annual Precipitation (MAP)China Meteorological Administration, Chinese Academy of Sciences (http://www.resdc.cn/ (accessed on 30 October 2022)).
Economic factorsPopulation (POP)Data obtained from Guilin Statistical Yearbook
Gross Domestic Product (GDP)
Night Light (NL)Earth Observation Group (https://payneinstitute.mines.edu/eog/ (accessed on 30 October 2022))
Social factorsDistance from Class I road (D1R)Gaud map (https://www.amap.com/ (accessed on 21 October 2022))
Distance from the secondary road (D2R)
Particulate matter 2.5 (PM2.5)Socioeconomic Data and Applications Center (https://sedac.ciesin.columbia.edu/ (accessed on 30 October 2022))
Distance to the river (DTR)Based on DEM data, the hydrological analysis tool in ArcGIS software is used to obtain.
Table 2. Land use conversion cost matrix under 4 scenarios.
Scenario 1Scenario 2Scenario 3Scenario 4
CFSGWBICFSGWBICFSGWBICFSGWBI
C1111111111111111111001111111
F1111111111111101111101111111
S1111111111111111111111111111
G1111111111111111111101111110
W1111111111111100001000111110
B1111111111111111111111111111
I1111111000000111111111111111
C: Cropland; F: Forest; S: Shrub; G: Grassland; W: Water; B: Barren; I: Impervious.
Table 3. Total land use demand in different future scenarios in 2035 (km2).
CroplandForestShrubGrasslandWaterBarrenImpervious
Scenario 15848.9921,040.553.522.72147.530.19519.23
Scenario 25828.3121,040.1253.4822.52146.900.19541.14
Scenario 35858.1221,056.0953.3622.21147.530.08495.27
Scenario 45858.1221,056.0953.2422.18147.430.07495.53
Table 4. The total area (TA) change of each land type and the weight parameter of the neighborhood in the Guilin area from 2005 to 2020.
CroplandForestShrubGrasslandWaterBarrenImpervious
TA change (km2)123.12−207.33−59.311.78−6.330.18147.89
Neighborhood weight0.9300.4170.5890.5660.5841
Table 6. Changes of land use type area proportion in Guilin City 2005 to 2020 (%).
Land Use Type20052010201520202005–20102010–20152015–20202005–2020
Cropland20.4220.4621.0720.880.040.61−0.190.46
Forest77.6577.4876.7976.89−0.17−0.690.1−0.89
Shrub0.470.40.30.25−0.07−0.1−0.05−0.22
Grassland0.090.090.10.100.0100.01
Water0.560.580.570.530.02−0.01−0.04−0.03
Barren00000000
Impervious0.820.981.161.350.160.180.190.53
Table 7. Transferring matrix of land use types of Guilin City from 2005–2020 (km2).
2020
CroplandForestShrubGrasslandWaterBarrenImperviousTotal
2005Cropland4570.18911.272.415.4515.380.08138.415643.17
Forest1141.3020,266.64428.895.491.460.0311.7321,455.52
Shrub21.5859.8038.3810.000.000.030.05129.83
Grassland10.445.150.685.640.820.081.2624.08
Water24.52682.935800.1269123.545703.1302154.2654
Barren0.02000.0100.000.000.02
Impervious1.080.08006.180218.55225.88
Total5769.1121,245.8770.3526.71147.380.21373.1427,632.77
Disclaimer/Publisher’s Note: The statements, opinions and data contained in all publications are solely those of the individual author(s) and contributor(s) and not of MDPI and/or the editor(s). MDPI and/or the editor(s) disclaim responsibility for any injury to people or property resulting from any ideas, methods, instructions or products referred to in the content.

