Article

Ground Deformation Monitoring over Xinjiang Coal Fire Area by an Adaptive ERA5-Corrected Stacking-InSAR Method

1
Key Laboratory of Land Environment and Disaster Monitoring, MNR, China University of Mining and Technology (CUMT), Xuzhou 221116, China
2
School of Environment Science and Spatial Informatics, China University of Mining and Technology (CUMT), Xuzhou 221116, China
3
Instituto de Geociencias (IGEO), CSIC-UCM, 7, 28040 Madrid, Spain
4
CommSensLab, Department of Signal Theory and Communications, Universitat Politecnica de Catalunya (UPC), 08034 Barcelona, Spain
5
Xinjiang Uygur Autonomous Region Mine Safety Service and Guarantee Center, Urumqi 830063, China
*
Author to whom correspondence should be addressed.
Remote Sens. 2023, 15(5), 1444; https://doi.org/10.3390/rs15051444
Submission received: 17 January 2023 / Revised: 24 February 2023 / Accepted: 2 March 2023 / Published: 4 March 2023

Abstract

:
Underground coal fire is a global geological disaster that causes the loss of resources as well as environmental pollution. Xinjiang, China, is one of the regions suffering from serious underground coal fires. The accurate monitoring of underground coal fires is critical for management and extinguishment, and many remote sensing-based approaches have been developed for monitoring over large areas. Among them, the multi-temporal interferometric synthetic aperture radar (MT-InSAR) techniques have been recently employed for underground coal fires-related ground deformation monitoring. However, MT-InSAR involves a relatively high computational cost, especially when the monitoring area is large. We propose to use a more cost-efficient Stacking-InSAR technique to monitor ground deformation over underground coal fire areas in this study. Considering the effects of atmosphere on Stacking-InSAR, an ERA5 data-based estimation model is employed to mitigate the atmospheric phase of interferograms before stacking. Thus, an adaptive ERA5-Corrected Stacking-InSAR method is proposed in this study, and it is tested over the Fukang coal fire area in Xinjiang, China. Based on original and corrected interferograms, four groups of ground deformation results were obtained, and the possible coal fire areas were identified. In this paper, the ERA5 atmospheric delay products based on the estimation model along the LOS direction (D-LOS) effectively mitigate the atmospheric phase. The accuracy of ground deformation monitoring over a coal fire area has been improved by the proposed method choosing interferograms adaptively for stacking. The proposed Adaptive ERA5-Corrected Stacking-InSAR method can be used for efficient ground deformation monitoring over large coal fire areas.

1. Introduction

Underground coal fire combustion has caused serious resource loss in many countries [1,2,3,4]. Coals burning underground change the ground environment to different degrees, causing ground high temperature anomalies, ground deformation, land destruction and other ecological environmental disturbances [5,6,7]. Xinjiang, China, is one of the regions suffering from serious underground coal fires due to the extremely dry climate, special geological conditions and large mining activities [8,9,10]. The accurate monitoring of underground coal fires is critical for management and extinguishment. At present, the methods used to detect coal fires mainly include geophysical exploration, geochemical exploration [11,12], thermal exploration, drilling exploration and remote sensing techniques [13,14,15,16]. The first four types can accurately detect coal fires in small areas but are unsuitable for multi-time synchronous identification and monitoring in large coal fire areas. Fortunately, remote sensing techniques can efficiently identify the range of coal fires in large areas by extracting and analyzing the land surface temperature anomalies, ground deformation and collapse, which makes up for the shortcomings of these detection methods [17,18,19,20].
Based on land surface temperature (LST), the thermal infrared remote sensing technique can be used to extract the surface thermal anomaly by a certain threshold determination method, so as to identify coal fire regions [21,22,23,24]. However, there are many low specific heat capacity substances on the surface of mining areas, and the surface temperature is greatly affected by the seasons. Additionally, the resolution of a thermal infrared image is low. These factors are likely to cause misidentification of some coal fire areas.
Thanks to the large-width imaging of SAR satellites and the sensitivity of radar signal to the deformation phase, differential interferometric synthetic aperture radar (D-InSAR) is an effective technique for ground deformation monitoring over large areas. However, D-InSAR is easily affected by the phase decoherence caused by system noise, orbit error and other noise sources. Therefore, multi-temporal InSAR (MT-InSAR) techniques, such as PS-InSAR [25], SBAS-InSAR [26] methods, have been proposed, which use time-series SAR images covering the same area to form interferometric pairs of different spatio-temporal baselines, to then separate the errors effectively based on redundancy observation. Therefore, MT-InSAR has been developed into a useful tool for monitoring ground deformation and has been applied in earthquakes [27], volcanoes [28], glacier movement [29], landslide [30], mining activity [31] and so on. In recent years, scholars have used this technique to monitor deformation caused by coal fires [32,33,34,35].
PS-InSAR and SBAS-InSAR techniques obtain ground deformation on coherent points. These techniques are based on permanent scatterers (PSs) for deformation monitoring, while in some regions with few strong scatters, the monitoring results will be unreliable due to the insufficient spatial density of monitoring points. The DS-InSAR technique [36] can improve the drawback, which is used to monitor the deformation of non-urban areas through distributed scatterers (DSs) obtained by homogeneous pixel identification and distributed phase optimization. Meanwhile, recently, the polarimetric information of SAR images has been employed to improve interferograms’ phase qualities, thus enhancing the density of ground deformation monitoring pixels [37,38,39]. The above time-series InSAR methods come with a relatively high computational cost, especially when the monitoring area is large. In contrast, the Stacking-InSAR, which linearly stacks the unwrapped interferograms and weights them by a relatively simple mathematical model, can efficiently and rapidly obtain accurate deformation results. It has great potential in monitoring coal fire-related ground deformation over large regions.
The atmospheric delay is caused by the difference of the atmospheric signal in the SAR image at different imaging times due to the influence of the propagating medium. The atmospheric delay includes ionospheric delay and tropospheric delay. For short wavelength SAR data, the tropospheric delay is more common in the atmospheric delay error [40,41,42,43]. Therefore, most of the current atmospheric correction studies are focused on tropospheric delay [41], including turbulence and vertical stratification. The turbulence part is independent of topography and mainly affected by atmospheric turbulence. The vertical stratification part is related to topographic relief, and the effect is more visible in mountainous areas. Coal fires in Xinjiang are often located in mountainous regions with serious atmospheric phase delays. Atmospheric delay cannot be accurately eliminated by temporal–spatial filtering based on the statistical characteristics of the tropospheric delay in space and time. The linear model of Stacking-InSAR may correct the differential phase for atmospheric contributions, but at the same time it will likely mask ground deformation signals correlated with topography [44]. Accordingly, it may not accurately divide the coal fire range based on the obtained ground deformation results. Therefore, the tropospheric error should be corrected based on the external atmospheric data [45].
Atmospheric delay (mainly tropospheric delay) correction methods based on external atmospheric data include GPS data, surface meteorological data and global weather forecast models [46,47,48]. The common approach of calculating tropospheric delay using global weather forecasting models is to integrate zenith delay first and then convert it to LOS (line-of-sight). However, the atmosphere is a dynamic and complex system. In the region of uneven atmospheric distribution, the atmospheric delay phase in the zenith distance direction is divided by an angle factor to convert to LOS (Zenithal-LOS, Z-LOS), which could produce a large error. Therefore, a precise atmospheric phase delay estimation model along the LOS direction (D-LOS) has been proposed [48,49,50]. The high-precision atmospheric phase delay results based on this model have been verified in many regions [51,52]. It is expected to be useful for the accurate extraction of ground deformation over spontaneous coal fire areas.
To this end, an Adaptive ERA5-Corrected Stacking-InSAR method is proposed in this study. In this method, the ERA5 atmospheric phase delay product generated by an accurate model based on the D-LOS direction is used, and the interferograms with better phase quality after correction are adaptively selected for stacking. It has been applied to monitor ground deformation of coal fires over the Fukang coal fire area in Xinjiang, China. Firstly, precise atmospheric phase delay products were obtained based on ERA5 reanalysis data, and 57 small baseline interferograms were generated using Sentinel-1 data. Then, the atmospheric phase term in the interferogram was removed by using ERA5 data, and the quality of the original interferogram and the corrected interferogram was compared and analyzed. Finally, based on original and corrected interferograms, ground deformation results were obtained by adaptively choosing the interferograms with better quality for stacking, and the possible coal fire areas were identified.
This paper is organized as follows. Section 2 introduces the study area and datasets. Section 3 gives the details of the methods used in this study. In Section 4, the results are described and analyzed. In Section 5, the accuracy and validity of the results are discussed. Section 6 provides the conclusion.

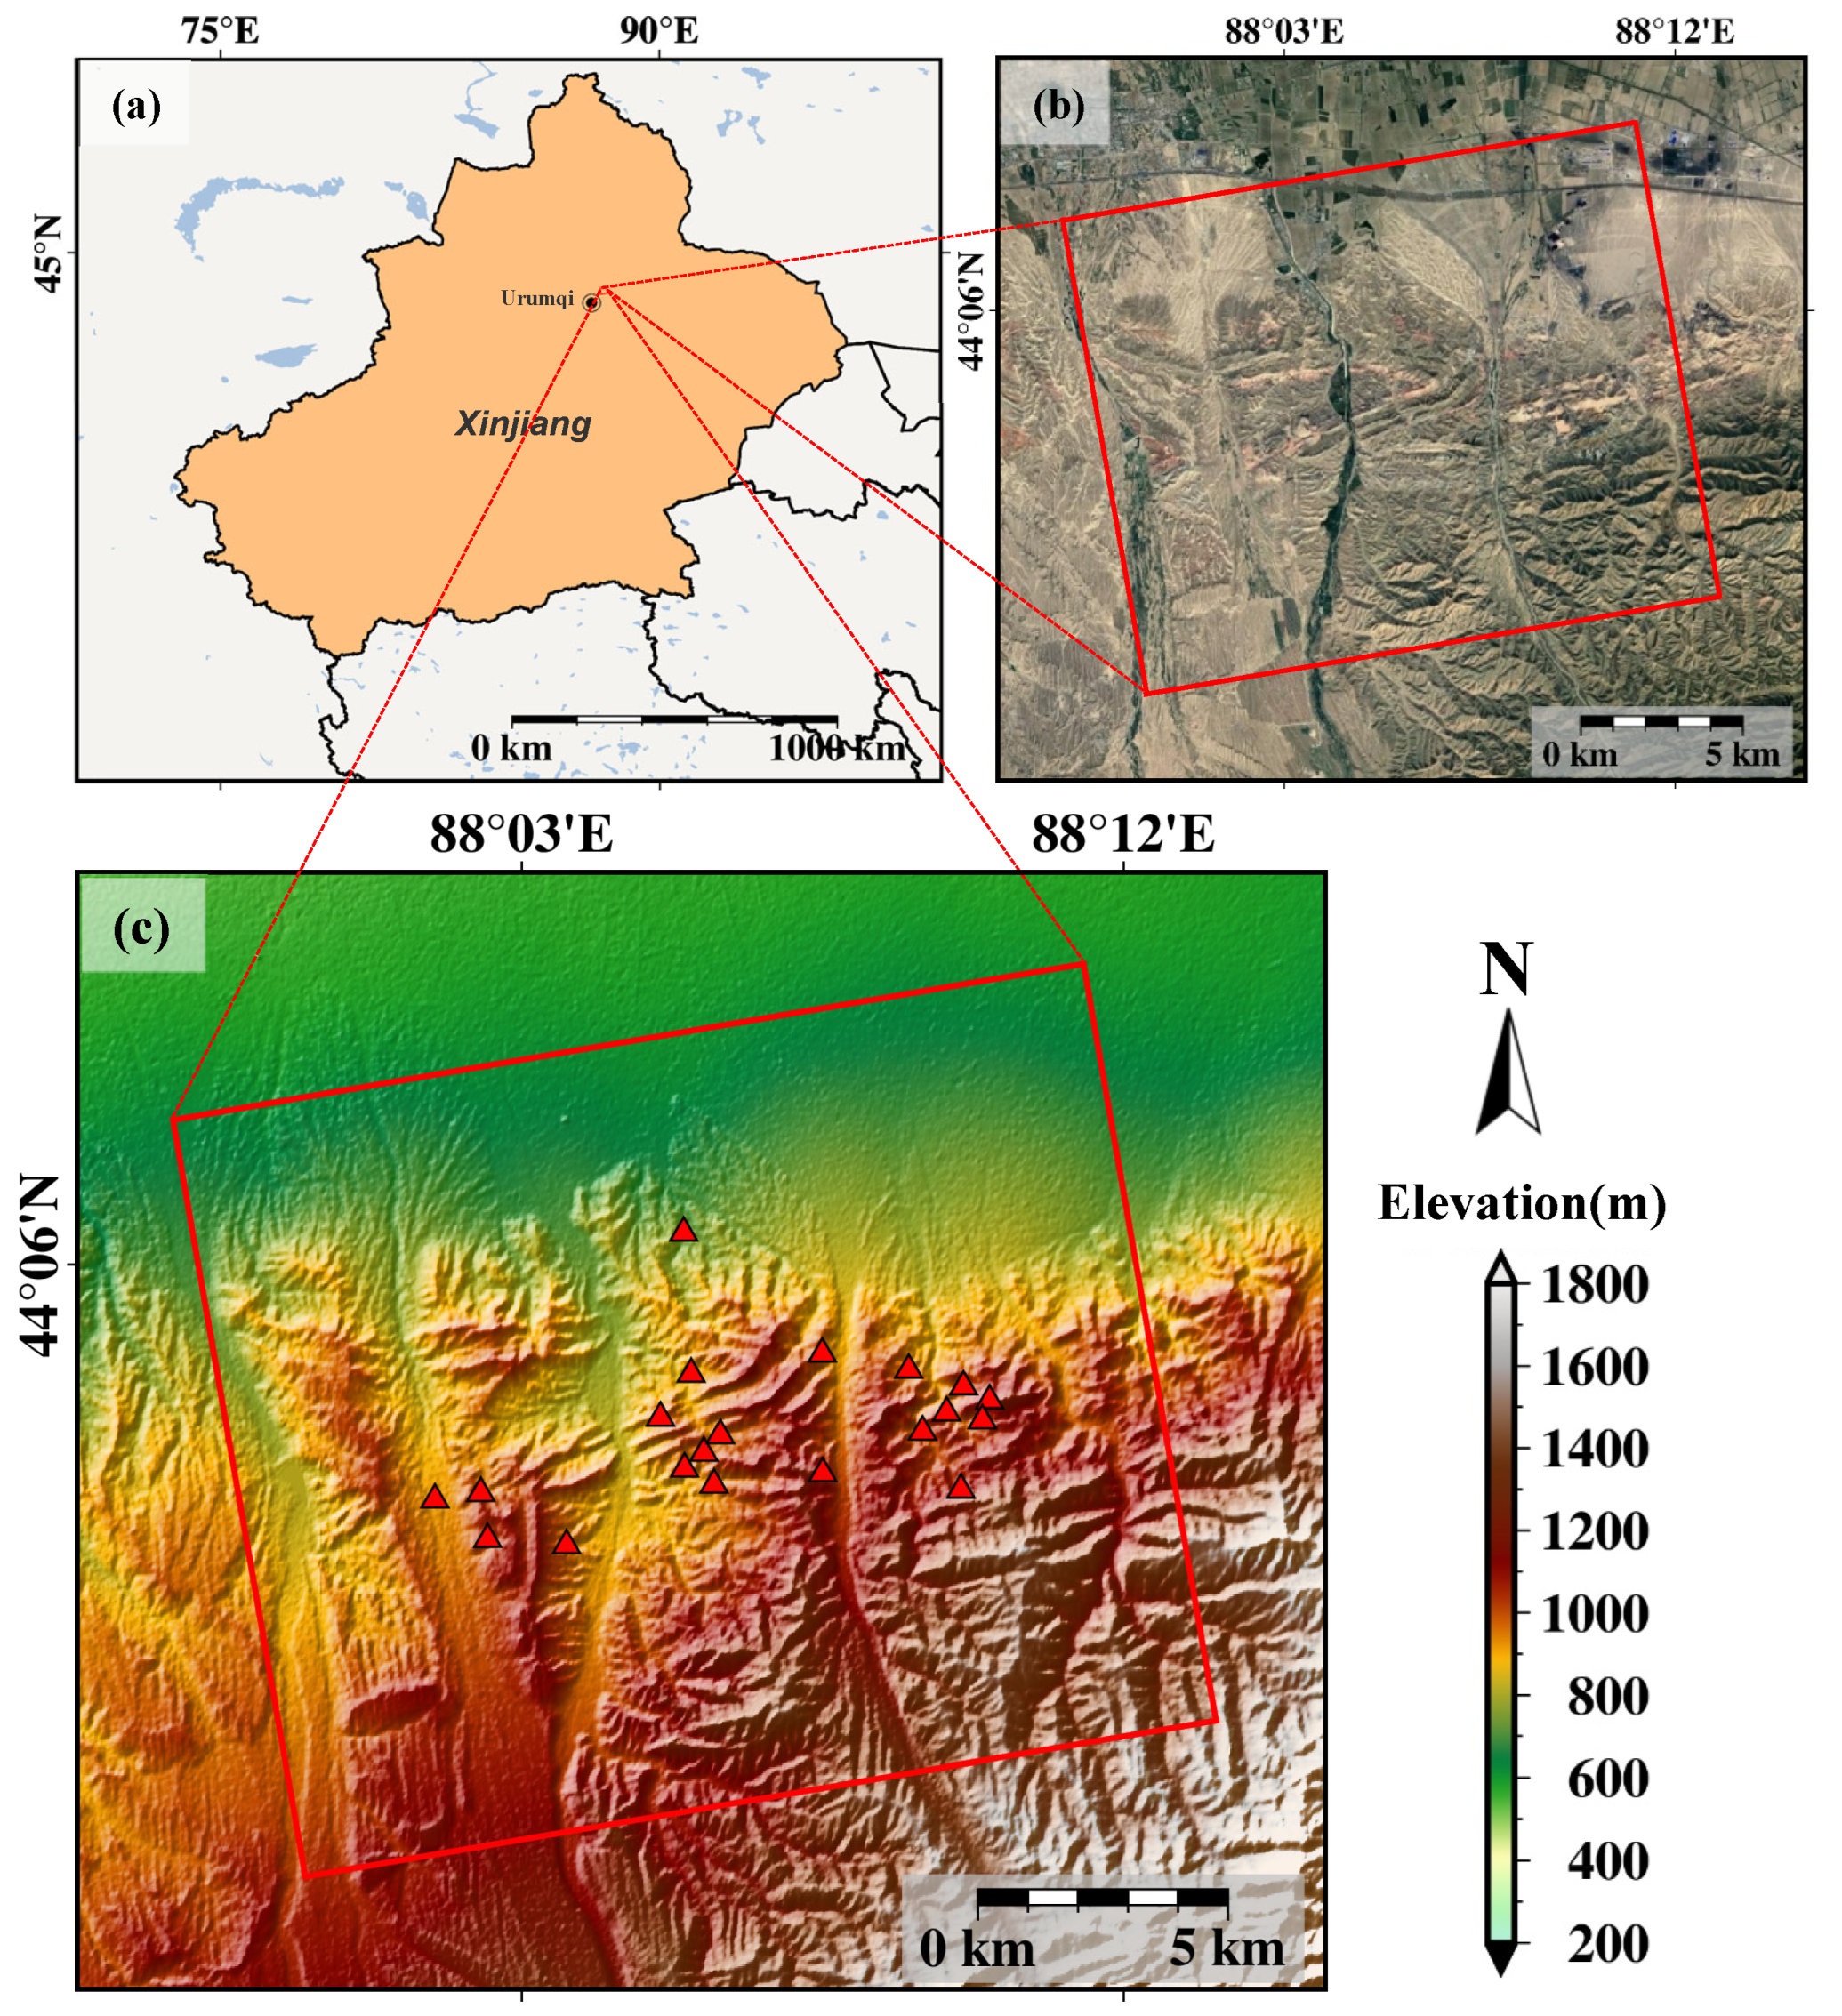
2. Study Area and Datasets

2.1. Study Area

As shown in Figure 1, the Fukang coalfield, the study area selected in this paper, is located in the north-central part of the Xinjiang Uygur Autonomous Region, China, at the northern foot of Bogda and the southern part of Junggar Basin. The geomorphic features of the region can be divided into three units from south to north: southern mountainous area, central plain and northern desert. The height varies greatly and the average altitude is high. The temperature difference between day and night is in the tens of degrees range. This belongs to a typical continental arid climate in the medium temperate zone. The coal in this region is of good quality, low metamorphism and high calorific value. Moreover, the unique climate conditions and important mining activities aggravate the weathering and rupture of coal outcrops and surrounding rocks. This leads to the surface collapse and prominent coal fire problems [9].

2.2. Datasets

2.2.1. ERA5 Dataset

The ERA5 dataset comprises the fifth-generation atmospheric reanalysis of global climate provided by the European Center for Medium-Range Weather Forecasts (ECMWF). It combines model data with observations from around the world into a globally complete and consistent dataset. The dataset provides hour-by-hour observations of atmospheric, land and ocean climate variables, spanning from 1979 to near real-time [53,54]. The ERA5 dataset has a higher resolution in time and space than the ERA-Interim dataset, with a horizontal resolution of 31 km per hour. Moreover, the ERA5 dataset has a shorter temporal sampling than Generic Atmospheric Correction Online Service for InSAR (GACOS) [55]. The higher temporal resolution reduces the acquisition error between SAR data and meteorological data. It is worth noting that although the spatial scale of the study area in this paper is slightly smaller than the spatial resolution of ERA5, we will obtain more accurate atmospheric parameters through interpolation. The selection of the scope of the study area is to some extent a priority, so we sample the ERA5 atmospheric delay products to a smaller spatial scale according to the study area. The effect of tropospheric noise related to topography on smaller spatial scales can be reduced in certain case. Accordingly, the ERA5 data with the closest acquisition time to SAR images have been selected in this study.

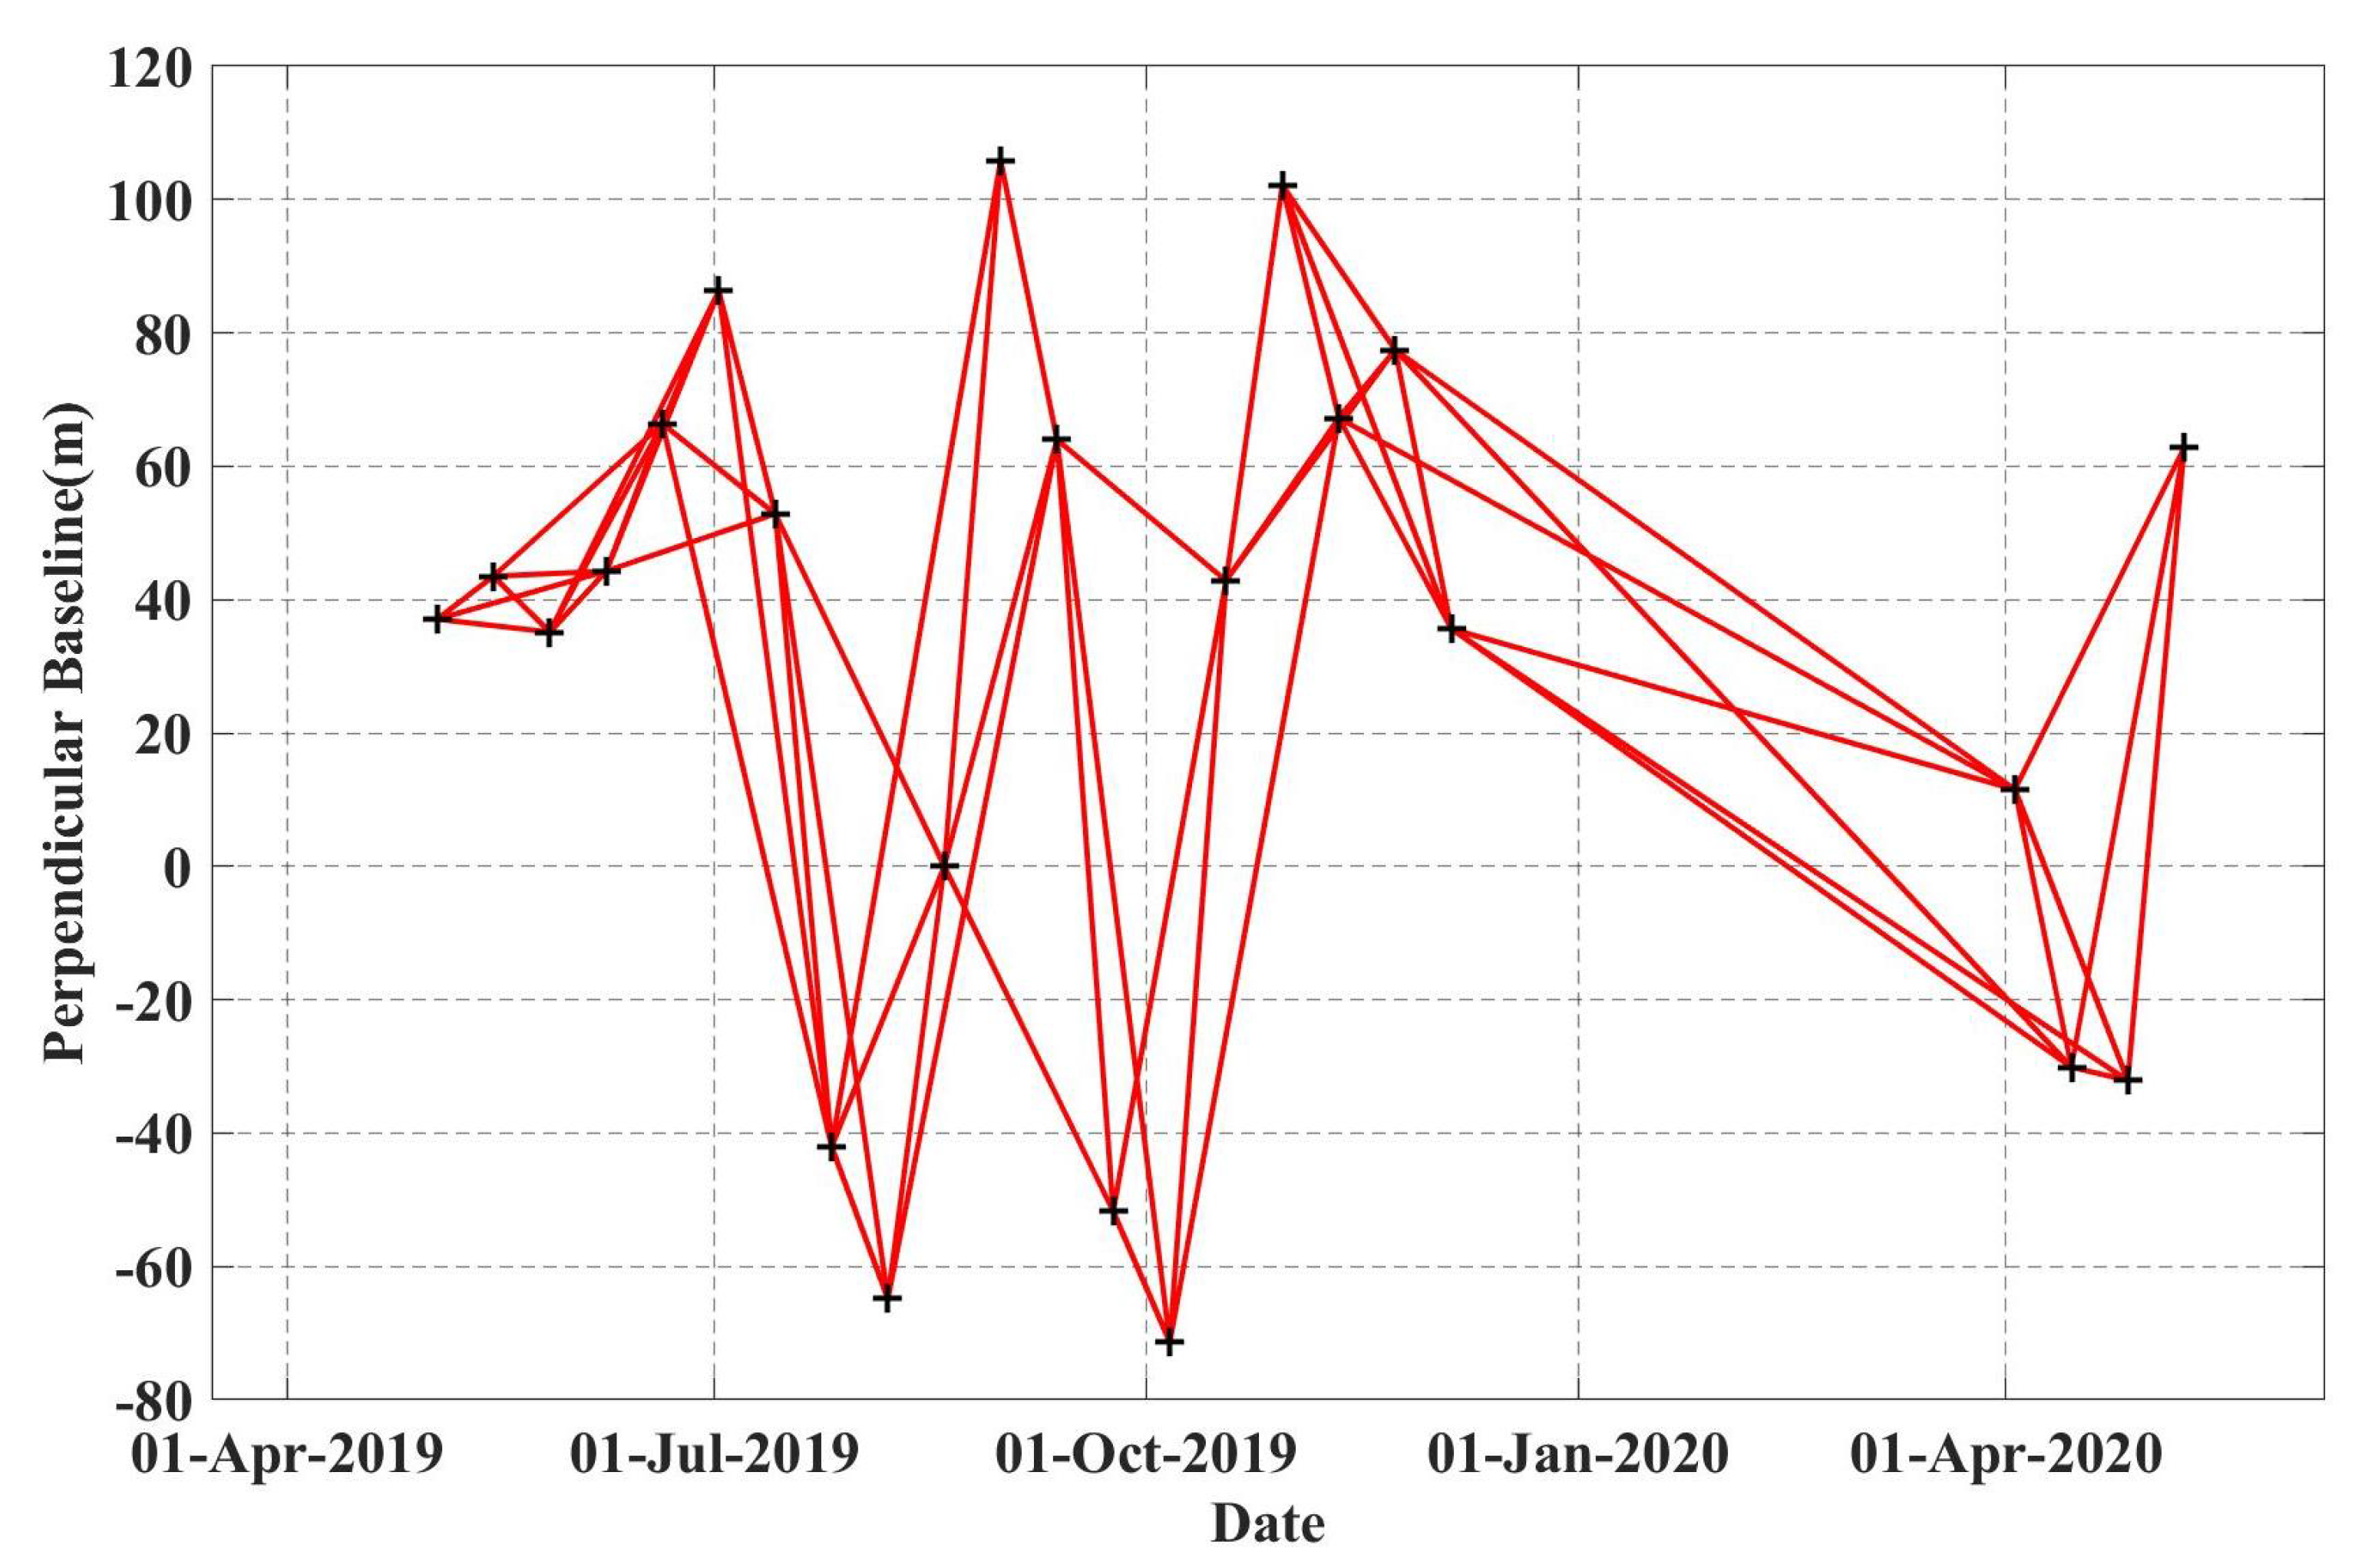
2.2.2. Sentinel-1 Dataset

This study used Sentinel-1A data provided by the European Space Agency (ESA). It is a C-band satellite with a 12-day revisit period. The standard acquisition mode of Sentinel-1, Interferometric Wide (IW), provides a ground resolution of about 5 m × 20 m (Range × Azimuth) with a footprint of 250 kilometers width. The Sentinel-1A satellite provides high-quality data with a low revisit time and global coverage that are freely available to use for ground deformation monitoring over a wide range of areas. In this study, 23 images from 3 May 2019 to 9 May 2020 were selected. A 30 meter resolution DEM, derived from the Shuttle Radar Topography Mission (SRTM) data, was used to remove the topographic contribution to the phase in the differential interferometric processing chain. Based on the SBAS-InSAR technique, 57 small baseline interferograms were obtained, and their spatio-temporal baseline distributions are shown in Figure 2.

3. Methods

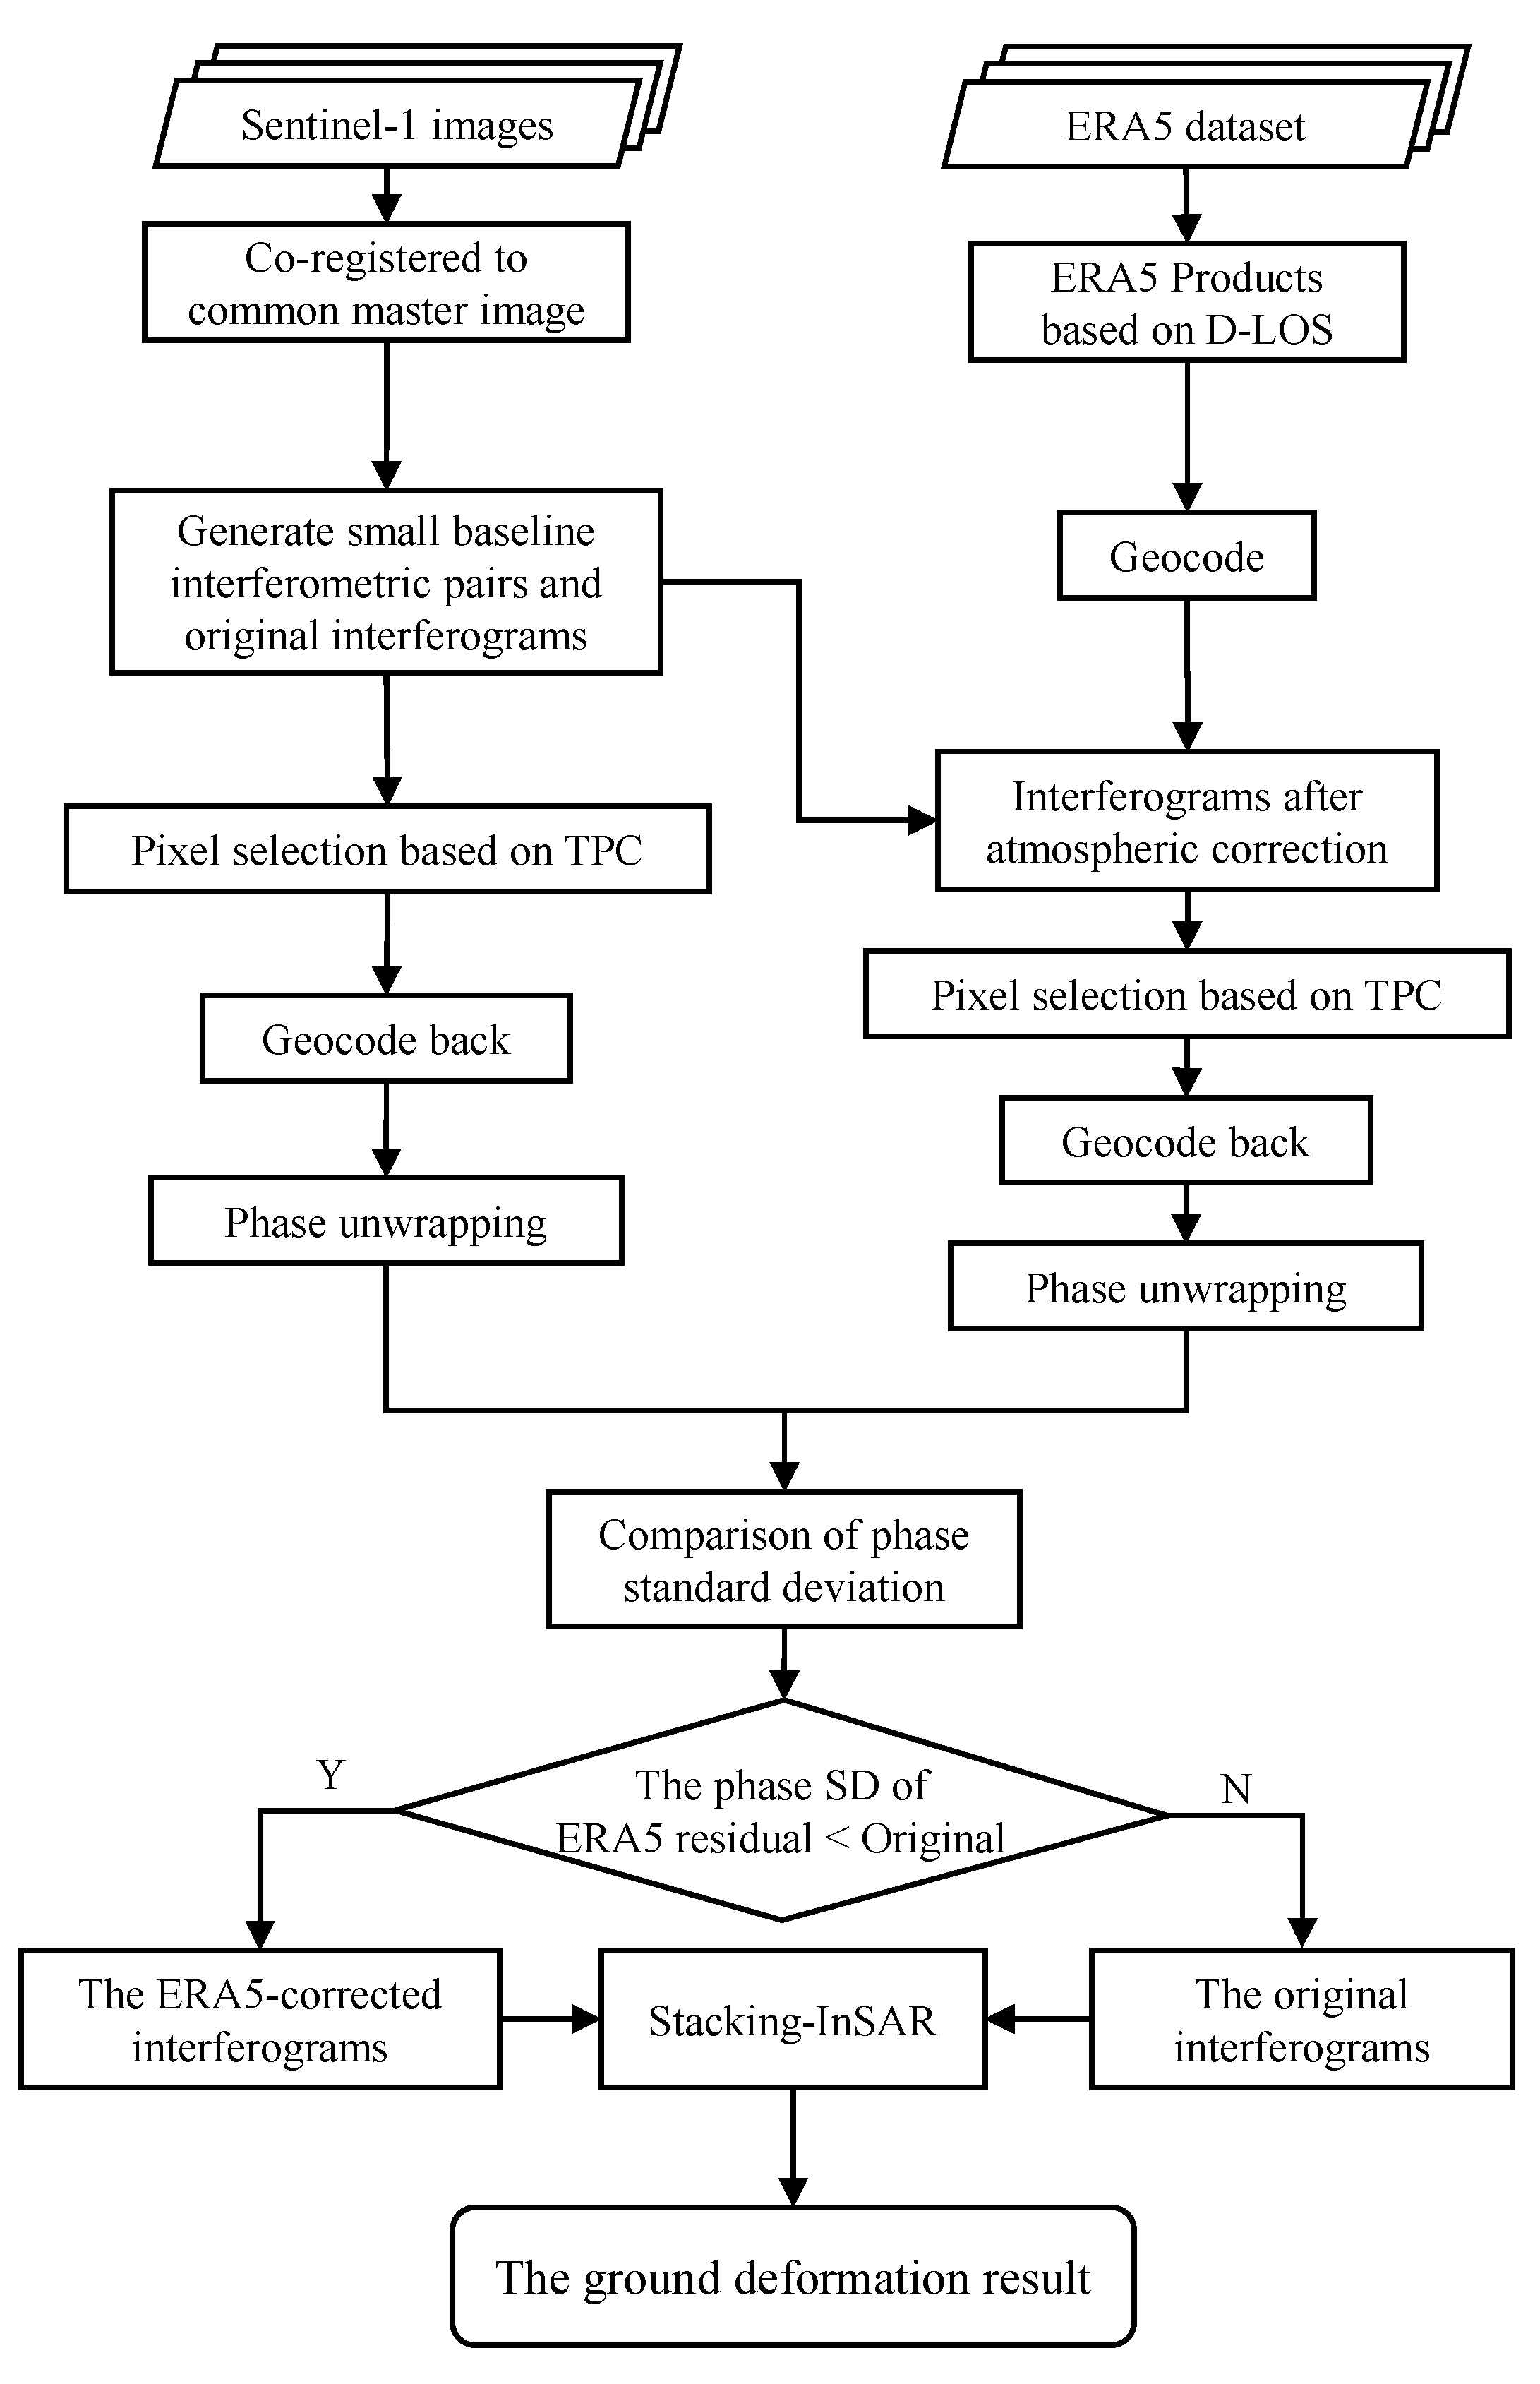
3.1. Direction-LOS (D-LOS) Phase Delay Calculation

Variations of temperature, pressure and humidity in the troposphere make the atmospheric refractive index N not constant, which includes the dry component N d r y and the wet component N w e t . The delay of the atmosphere to the radar signal can be expressed as the atmospheric refractive index N [56]:
N ( T , P , e ) = k 1 P T + k 2 e T + k 3 e T 2 = N d r y + N w e t
where T is the temperature, P is the partial pressure of dry air, e is the partial pressure of water vapor, k1 = 0.776 KPa−1, k2 = 0.716 KPa−1 and k3 = 3.75e3 K2Pa−1.
For a specific position between h1 and h2, the atmospheric phase delay term is
φ a t m = 4 π λ 10 6 h 1 h 2 [ N d r y ( h ) + N w e t ( h ) ] d h = 4 π λ 10 6 h g r o u n d h s a t [ N d r y ( h ) + N w e t ( h ) ] d h
where λ is the radar wavelength. For an orbital SAR image, h 2 will be the location of the satellite when the image was acquired, h s a t , and h 1 will be the ground location of the pixel for which the atmospheric artifacts are calculated, h g r o u n d . For the interferogram, the differential atmospheric delay Δ φ a t m is the difference between the atmospheric delay at two acquisition times. Unlike the phase delay obtained by integrating along the zenith direction and then transforming to the LOS direction, a more accurate phase delay can be obtained by integrating along the LOS direction directly through the above equation. Therefore, this method is denoted as D-LOS [49]. The steps are as follows:
a.
Determination of the sampling locations along the LOS path.
The LOS vector, L O S , is calculated from the Cartesian coordinates of the ground point and the satellite,
L O S = γ s a t γ g r o u n d
The direction vector, μ L O S ^ , which describes the LOS direction, is calculated from the unit vector,
μ L O S ^ = L O S L O S = μ x ^ , μ y ^ , μ z ^
Once the direction vector is determined, the coordinates of any point on the LOS path can be obtained:
P i x = G x + ( Δ L O S · i ) μ x ^ P i y = G y + ( Δ L O S · i ) μ y ^ P i z = G z + ( Δ L O S · i ) μ z ^
where the required sampling data are based on the available global atmospheric model data resolution. In general, the LOS spatial sampling resolution is set to 200 m for efficient calculation without loss of reliability [50].
b.
Interpolation of atmospheric parameters.
After obtaining the position of any point in the LOS direction according to Equation (5), the atmospheric parameters at these positions could be obtained from the existing global atmospheric model data. For the ERA5 data used in this paper, raster sampling values are 37 pressure levels at altitude and 31 km horizontally. To obtain more accurate spatial sampling values of atmospheric state parameters at the desired location, cubic spline and bilinear interpolation are employed for interpolating the vertical and horizontal directions, respectively. It should be noted that the atmospheric parameters are consistent with the datum for DEM data in the case of vertical interpolation.

3.2. Stacking-InSAR

The Stacking-InSAR, namely interferogram stacking, is a kind of InSAR time-series technique. In 1998, the Stacking-InSAR technique was first proposed by Sandwell and applied to the post-earthquake deformation analysis of the Landers earthquake area [57]. Subsequently, many researchers used it to monitor ground deformation of large magnitudes, such as earthquake [58], landslide [59,60,61,62] and volcanoes [44]. It assumes that the ground deformation in the study area is linear in the Stacking-InSAR technique. To improve the signal-to-noise ratio (SNR) in the stacked phase and reduce the influence of noise, the unwrapped phases of a series of interferograms are stacked and average weighted. Its model can be simply expressed as Equation (6):
V m e a n = λ 4 π · i = 1 N φ i Δ T i i = 1 N Δ T i 2
where V m e a n is the annual average deformation rate in the LOS direction; φ i is the unwrapped phase of the interferogram and Δ T is the time baseline corresponding to the interferogram. N is the number of stacked interferograms. The standard deviation of the average deformation rate can be expressed as Equation (7):
s t d ( V m e a n ) = 1 n · i = 1 n Δ T i 2 · φ i T i V m e a n 2 i = 1 n Δ T i 2

3.3. An Adaptive ERA5-Corrected Stacking-InSAR

As shown in Figure 3, an adaptive ERA5-Corrected Stacking-InSAR method is proposed in this paper. Its main steps include:
(1) In order to ensure the quality of the interferograms and reduce the influence of spatio-temporal incoherence as much as possible, the small baseline principle is used to generate interferometric pairs;
(2) According to Equations (2)–(5), an ERA5 atmospheric delay product based on D-LOS model is generated;
(3) The atmospheric delay product in the radar coordinate system after geocoding is removed from the original interferogram to obtain the atmospheric corrected interferogram;
(4) To ensure the precision and reliability of the unwrapped results, the temporal phase coherence (TPC) index is used to select pixels with high interferometric phase quality [63]. Its basic principle is shown in Equation (8):
γ T P C = 1 M i = 1 M e j · ψ n o i s e , i
where M is the number of interferograms and ψ n o i s e , i is the noise phase corresponding to the first interferogram. The larger the TPC, the higher the pixel’s quality;
(5) The interferogram phase is unwrapped on the coherent pixels selected by the TPC index;
(6) The quality of the interferograms is compared and evaluated by standard deviation (SD) of the unwrapped phase;
(7) The interferograms with lower phase SD than the original interferogram and the high-quality original interferograms (generally lower than the average phase SD) are selected for stacking. The ground deformation result of the study area is obtained.

4. Results and Analysis

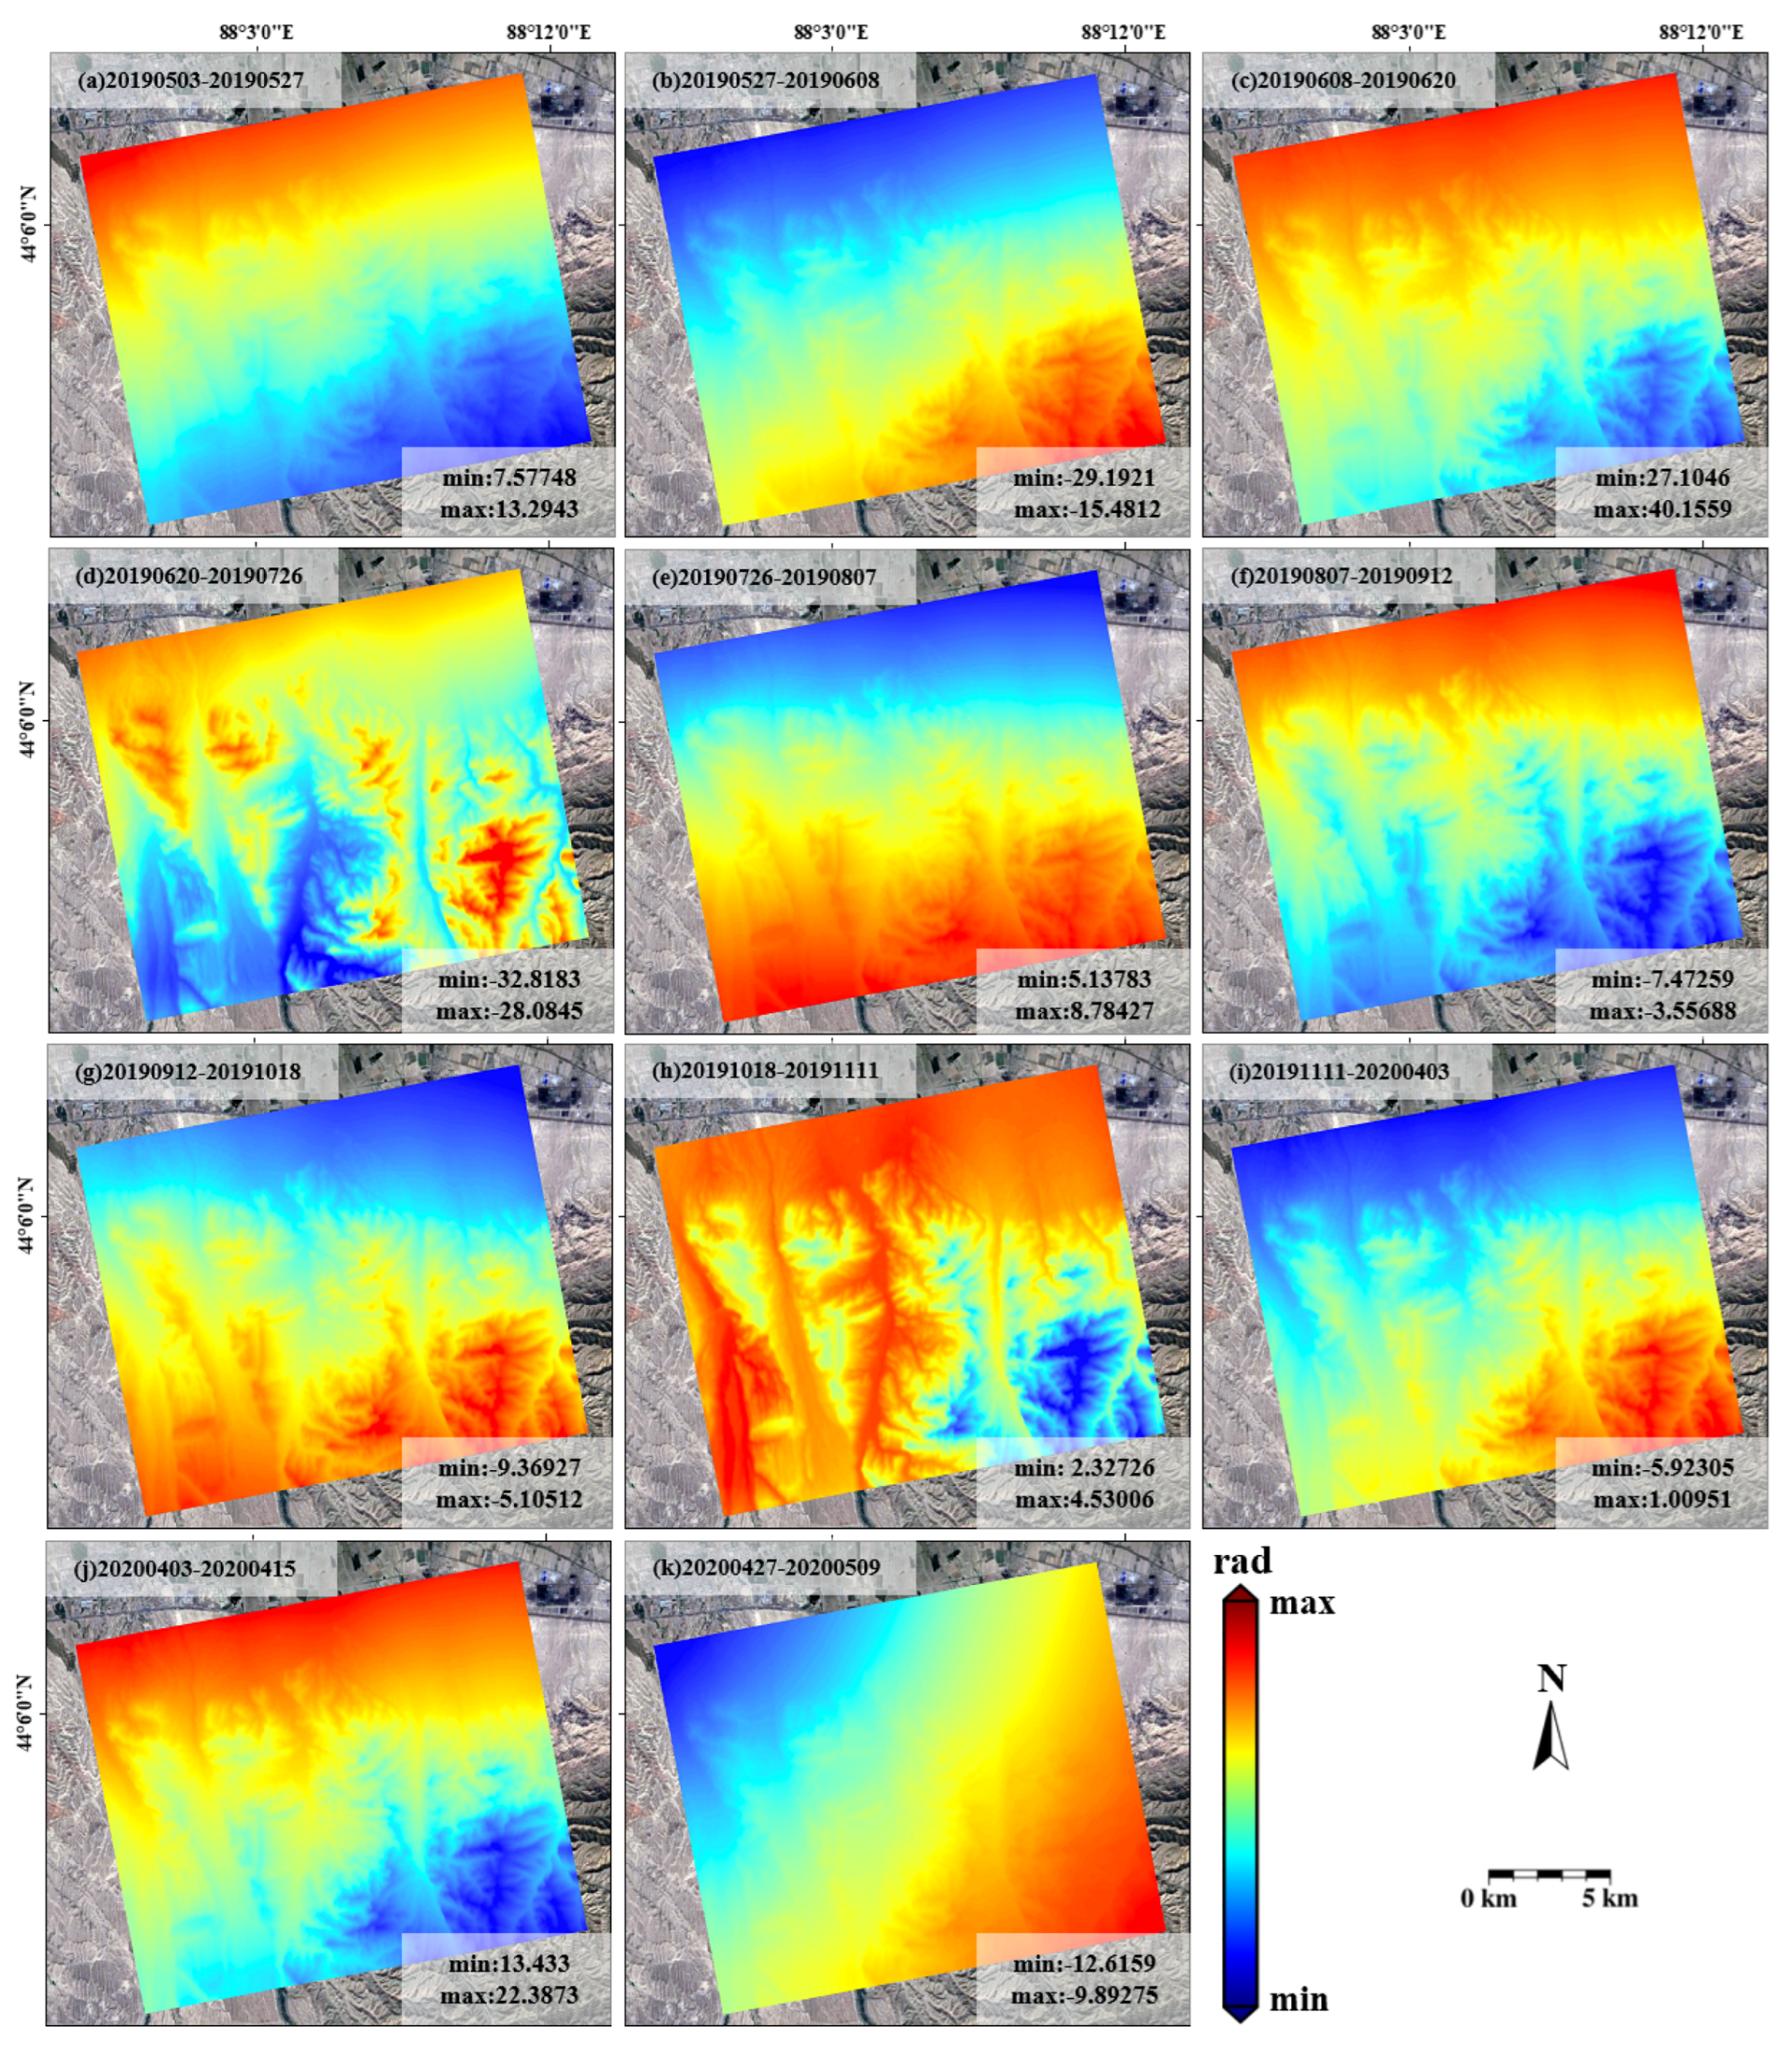
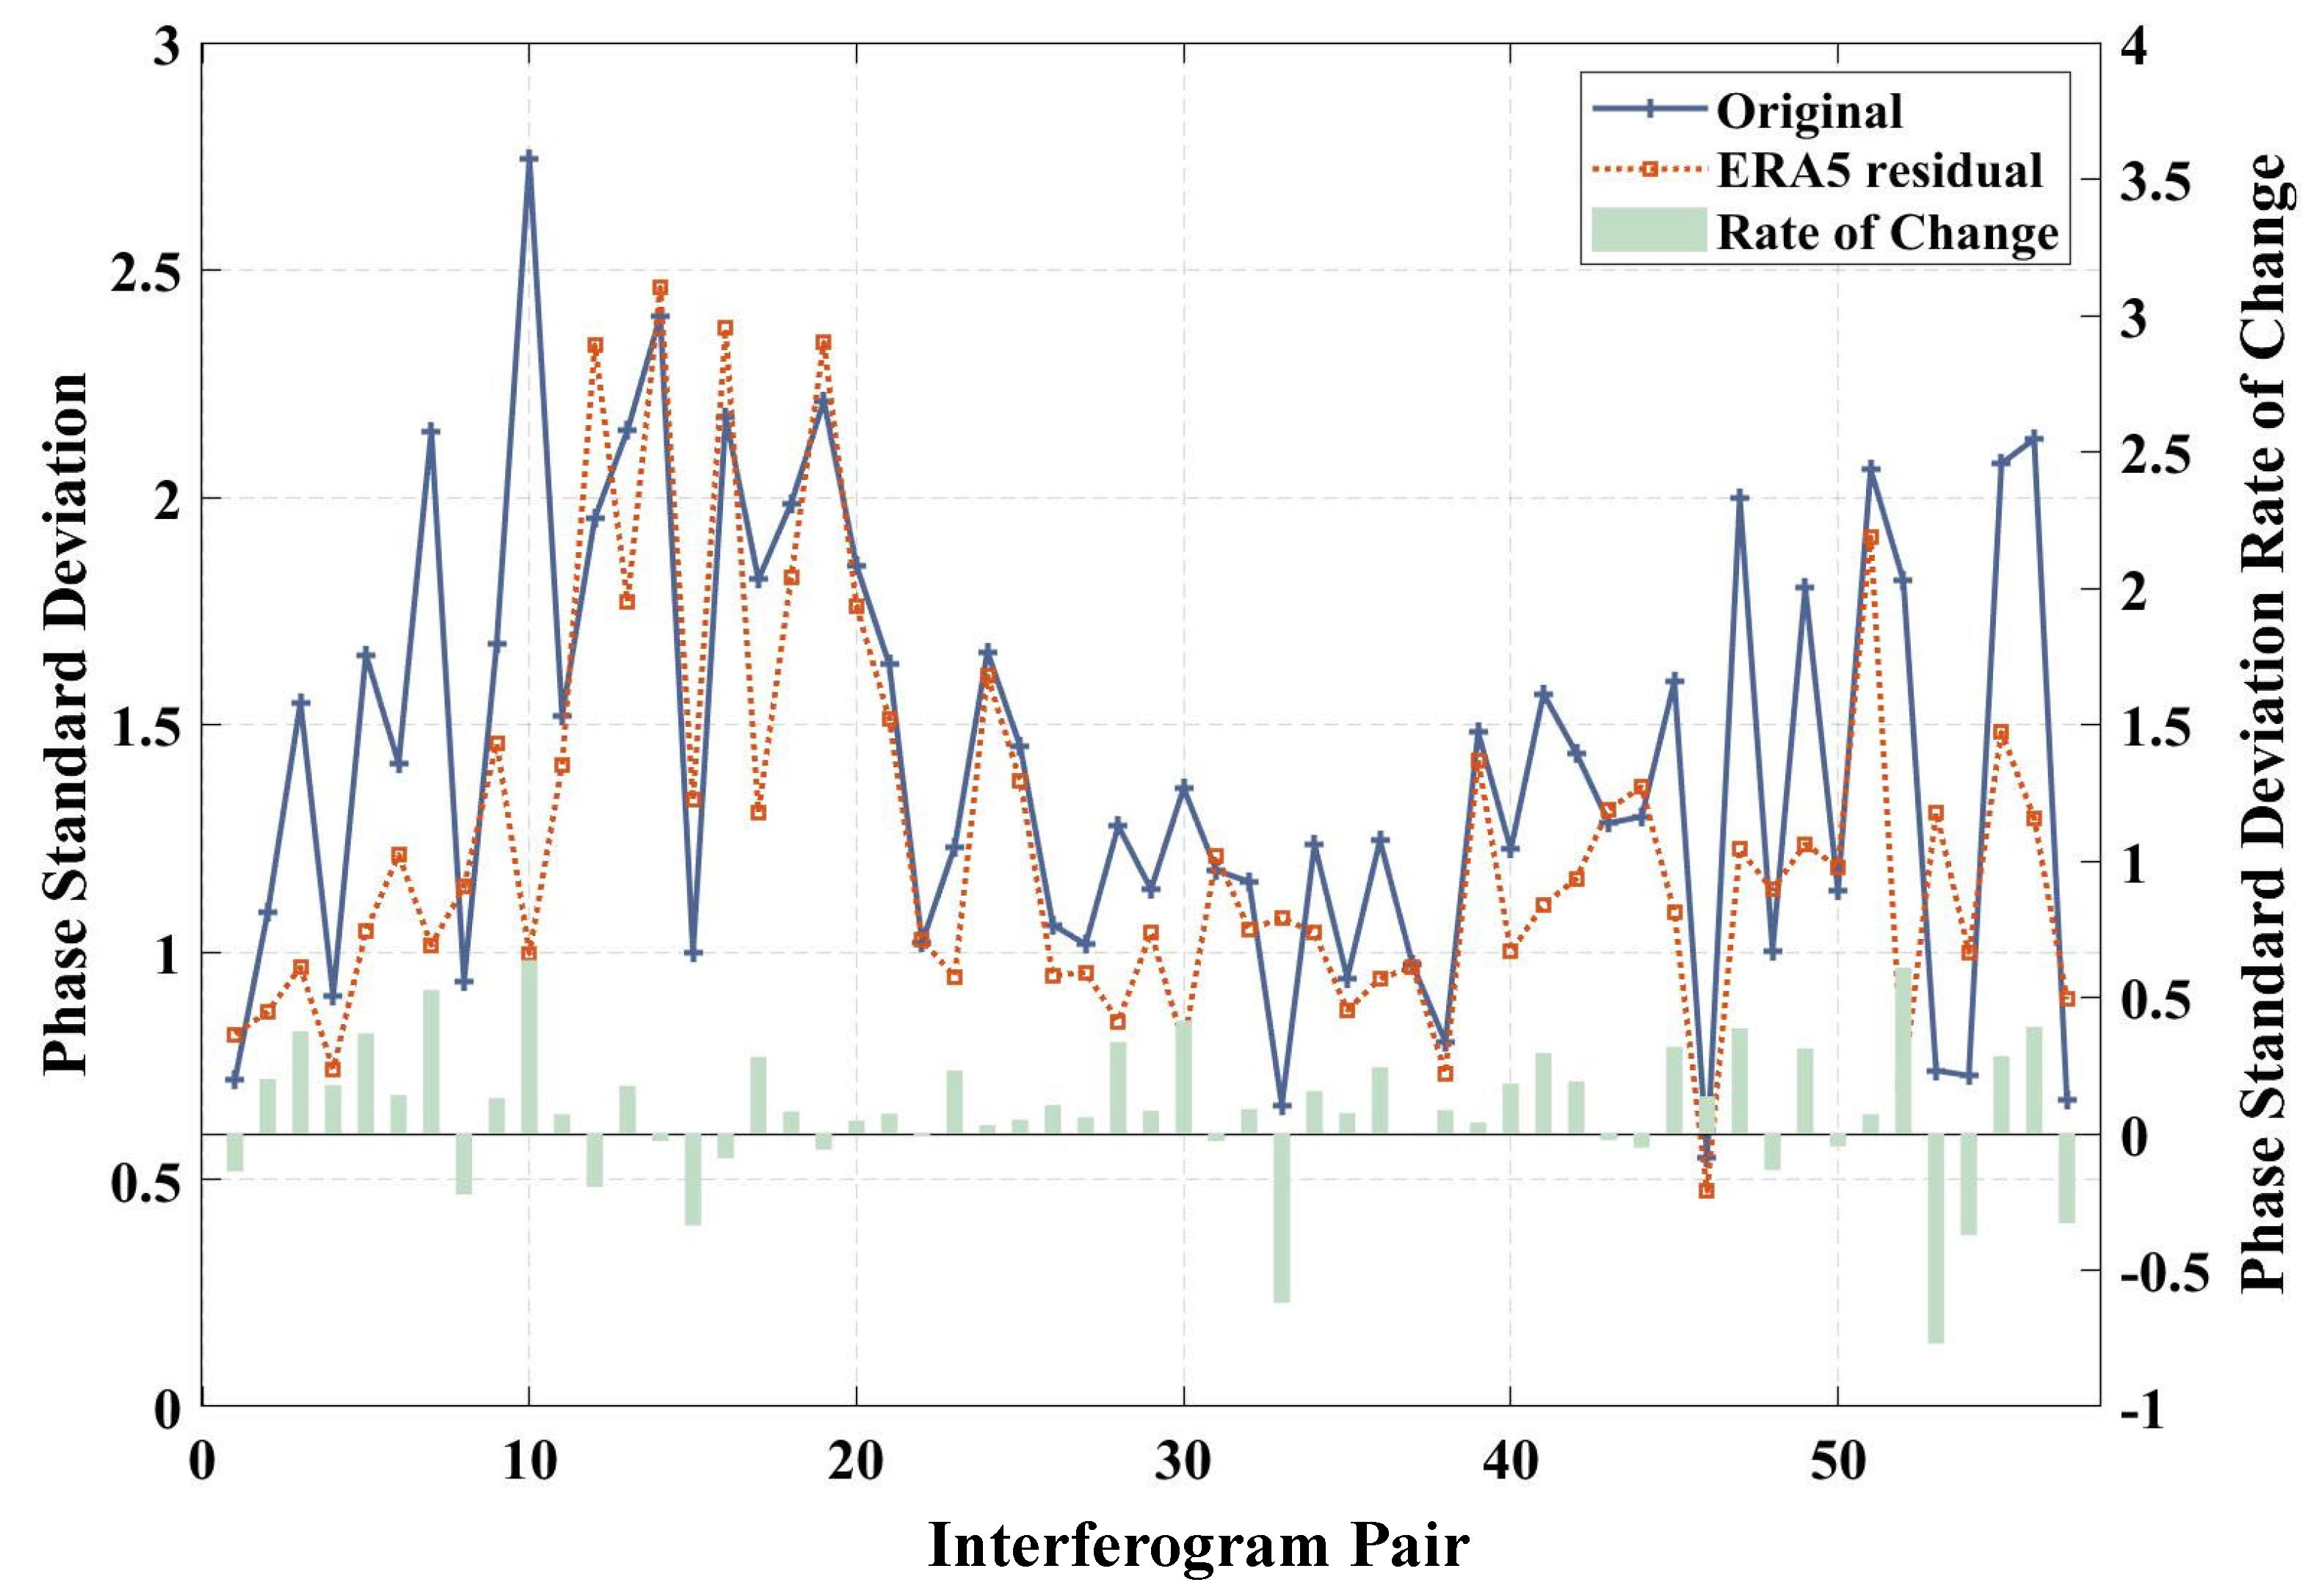
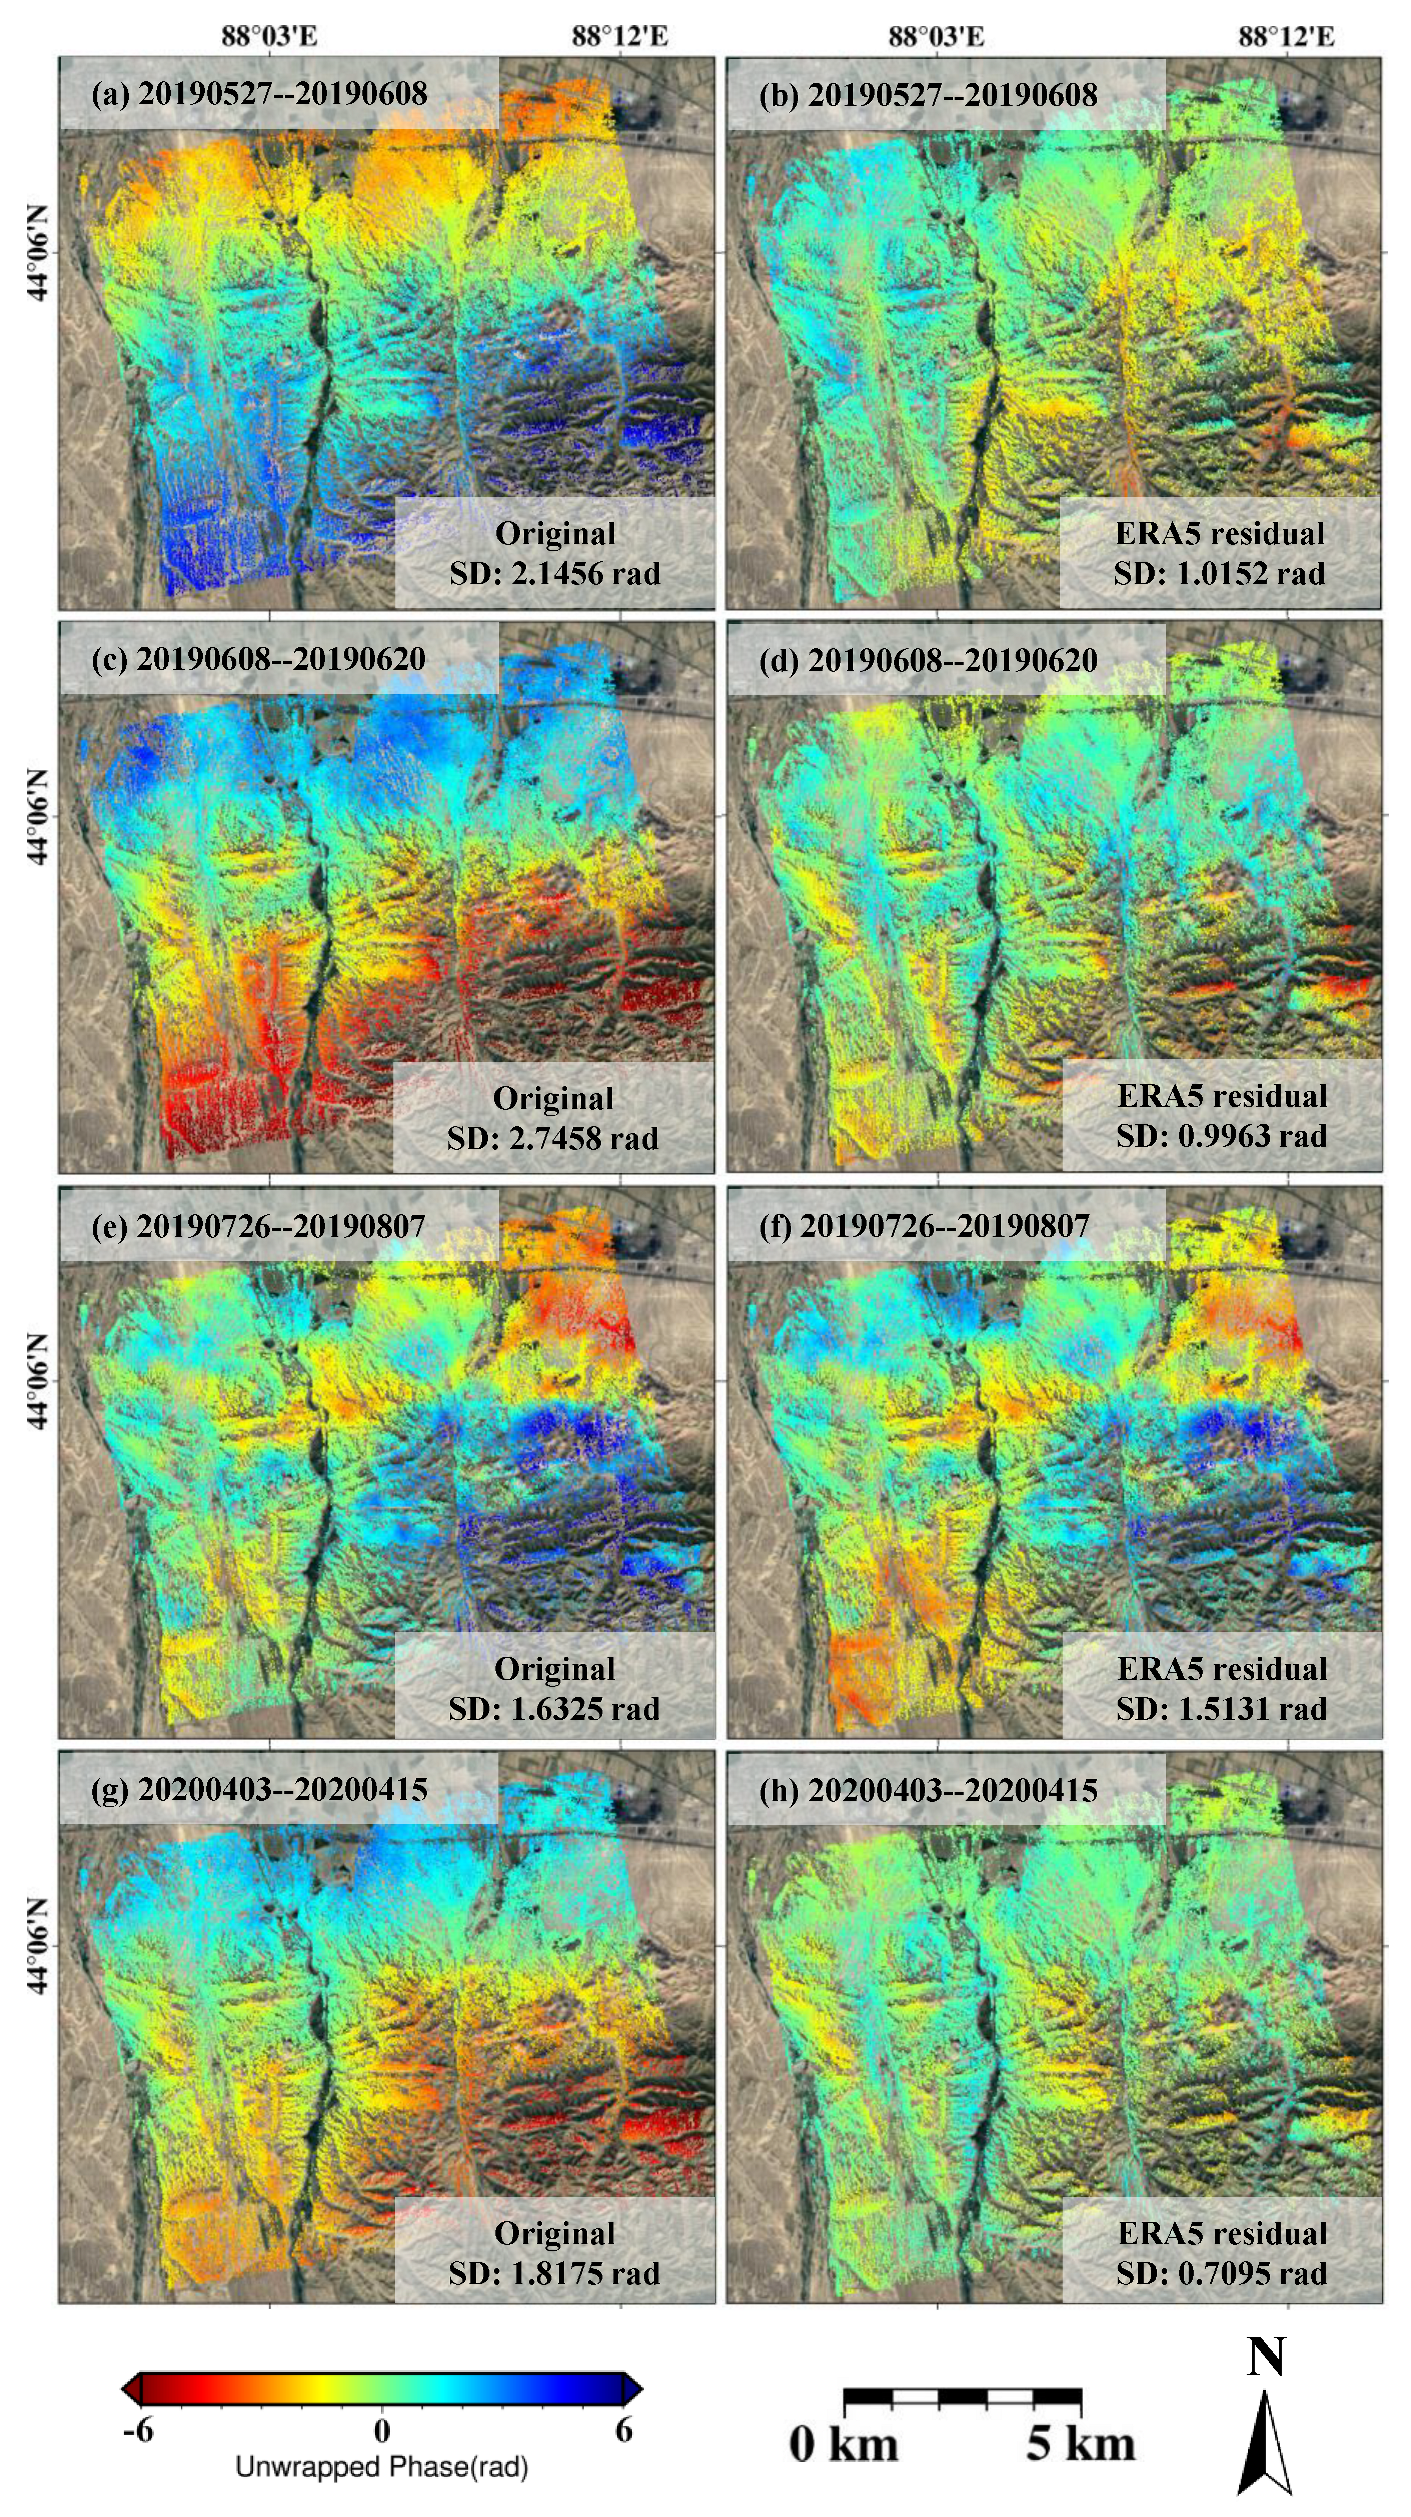
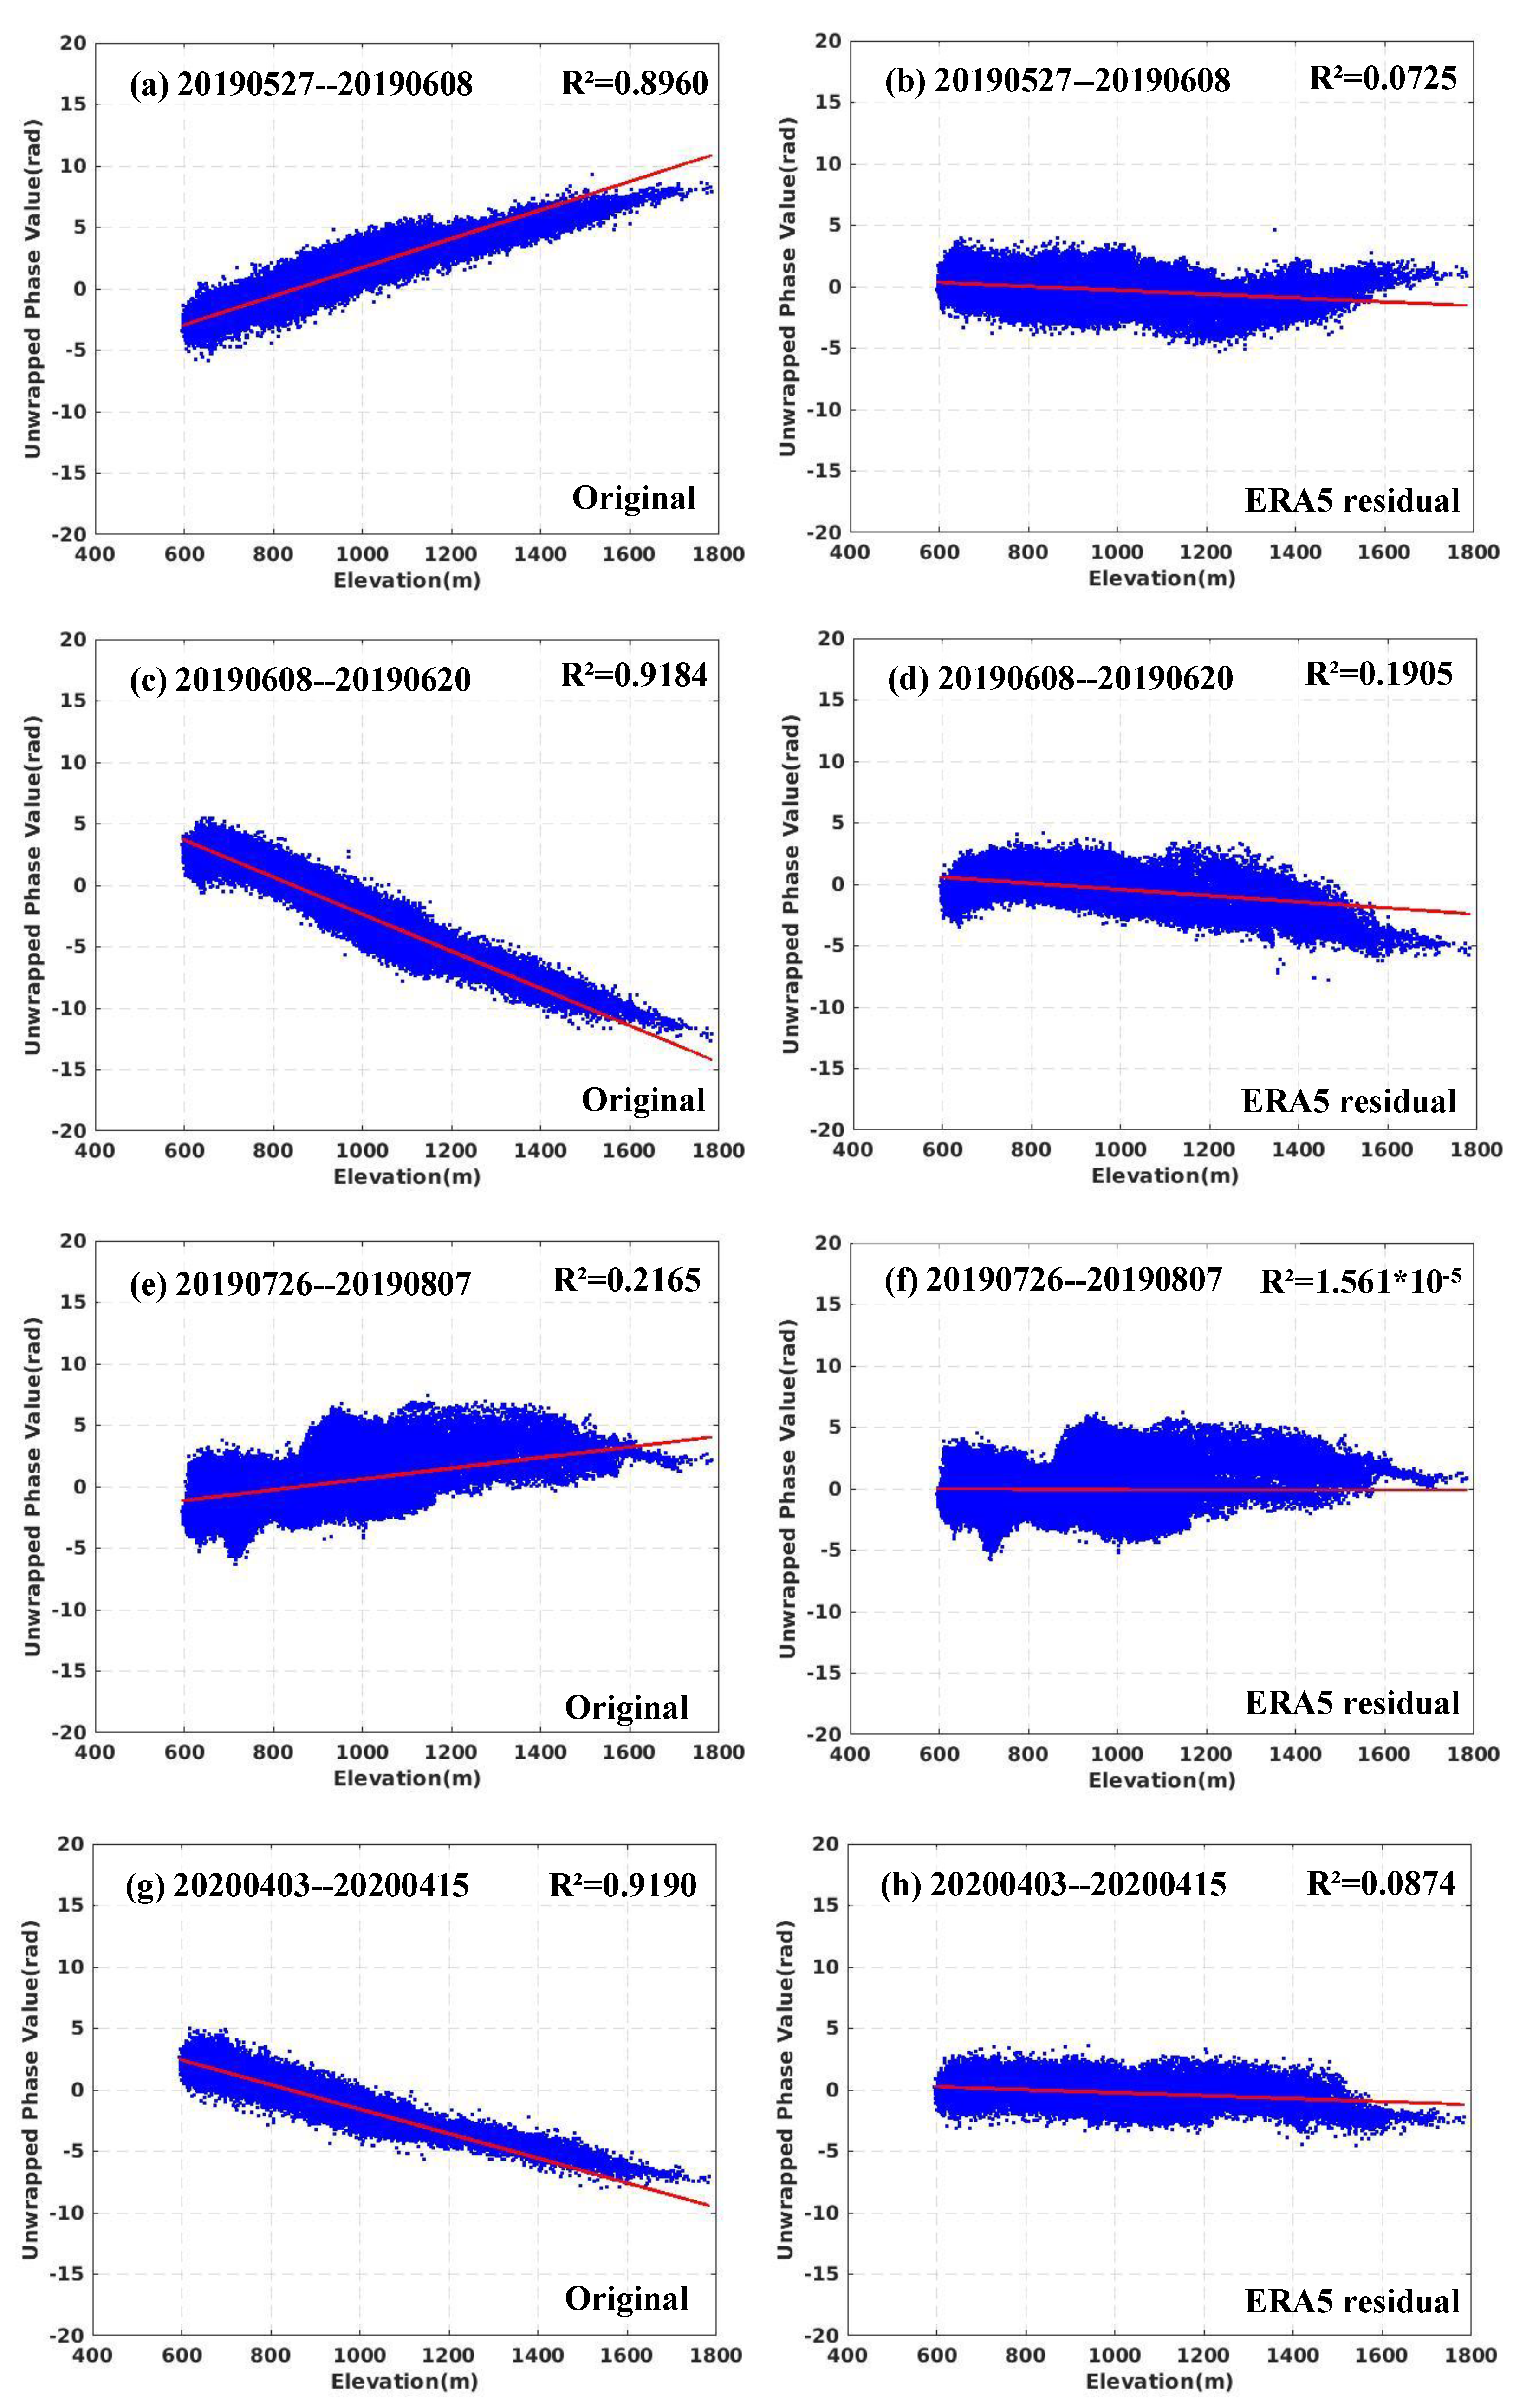
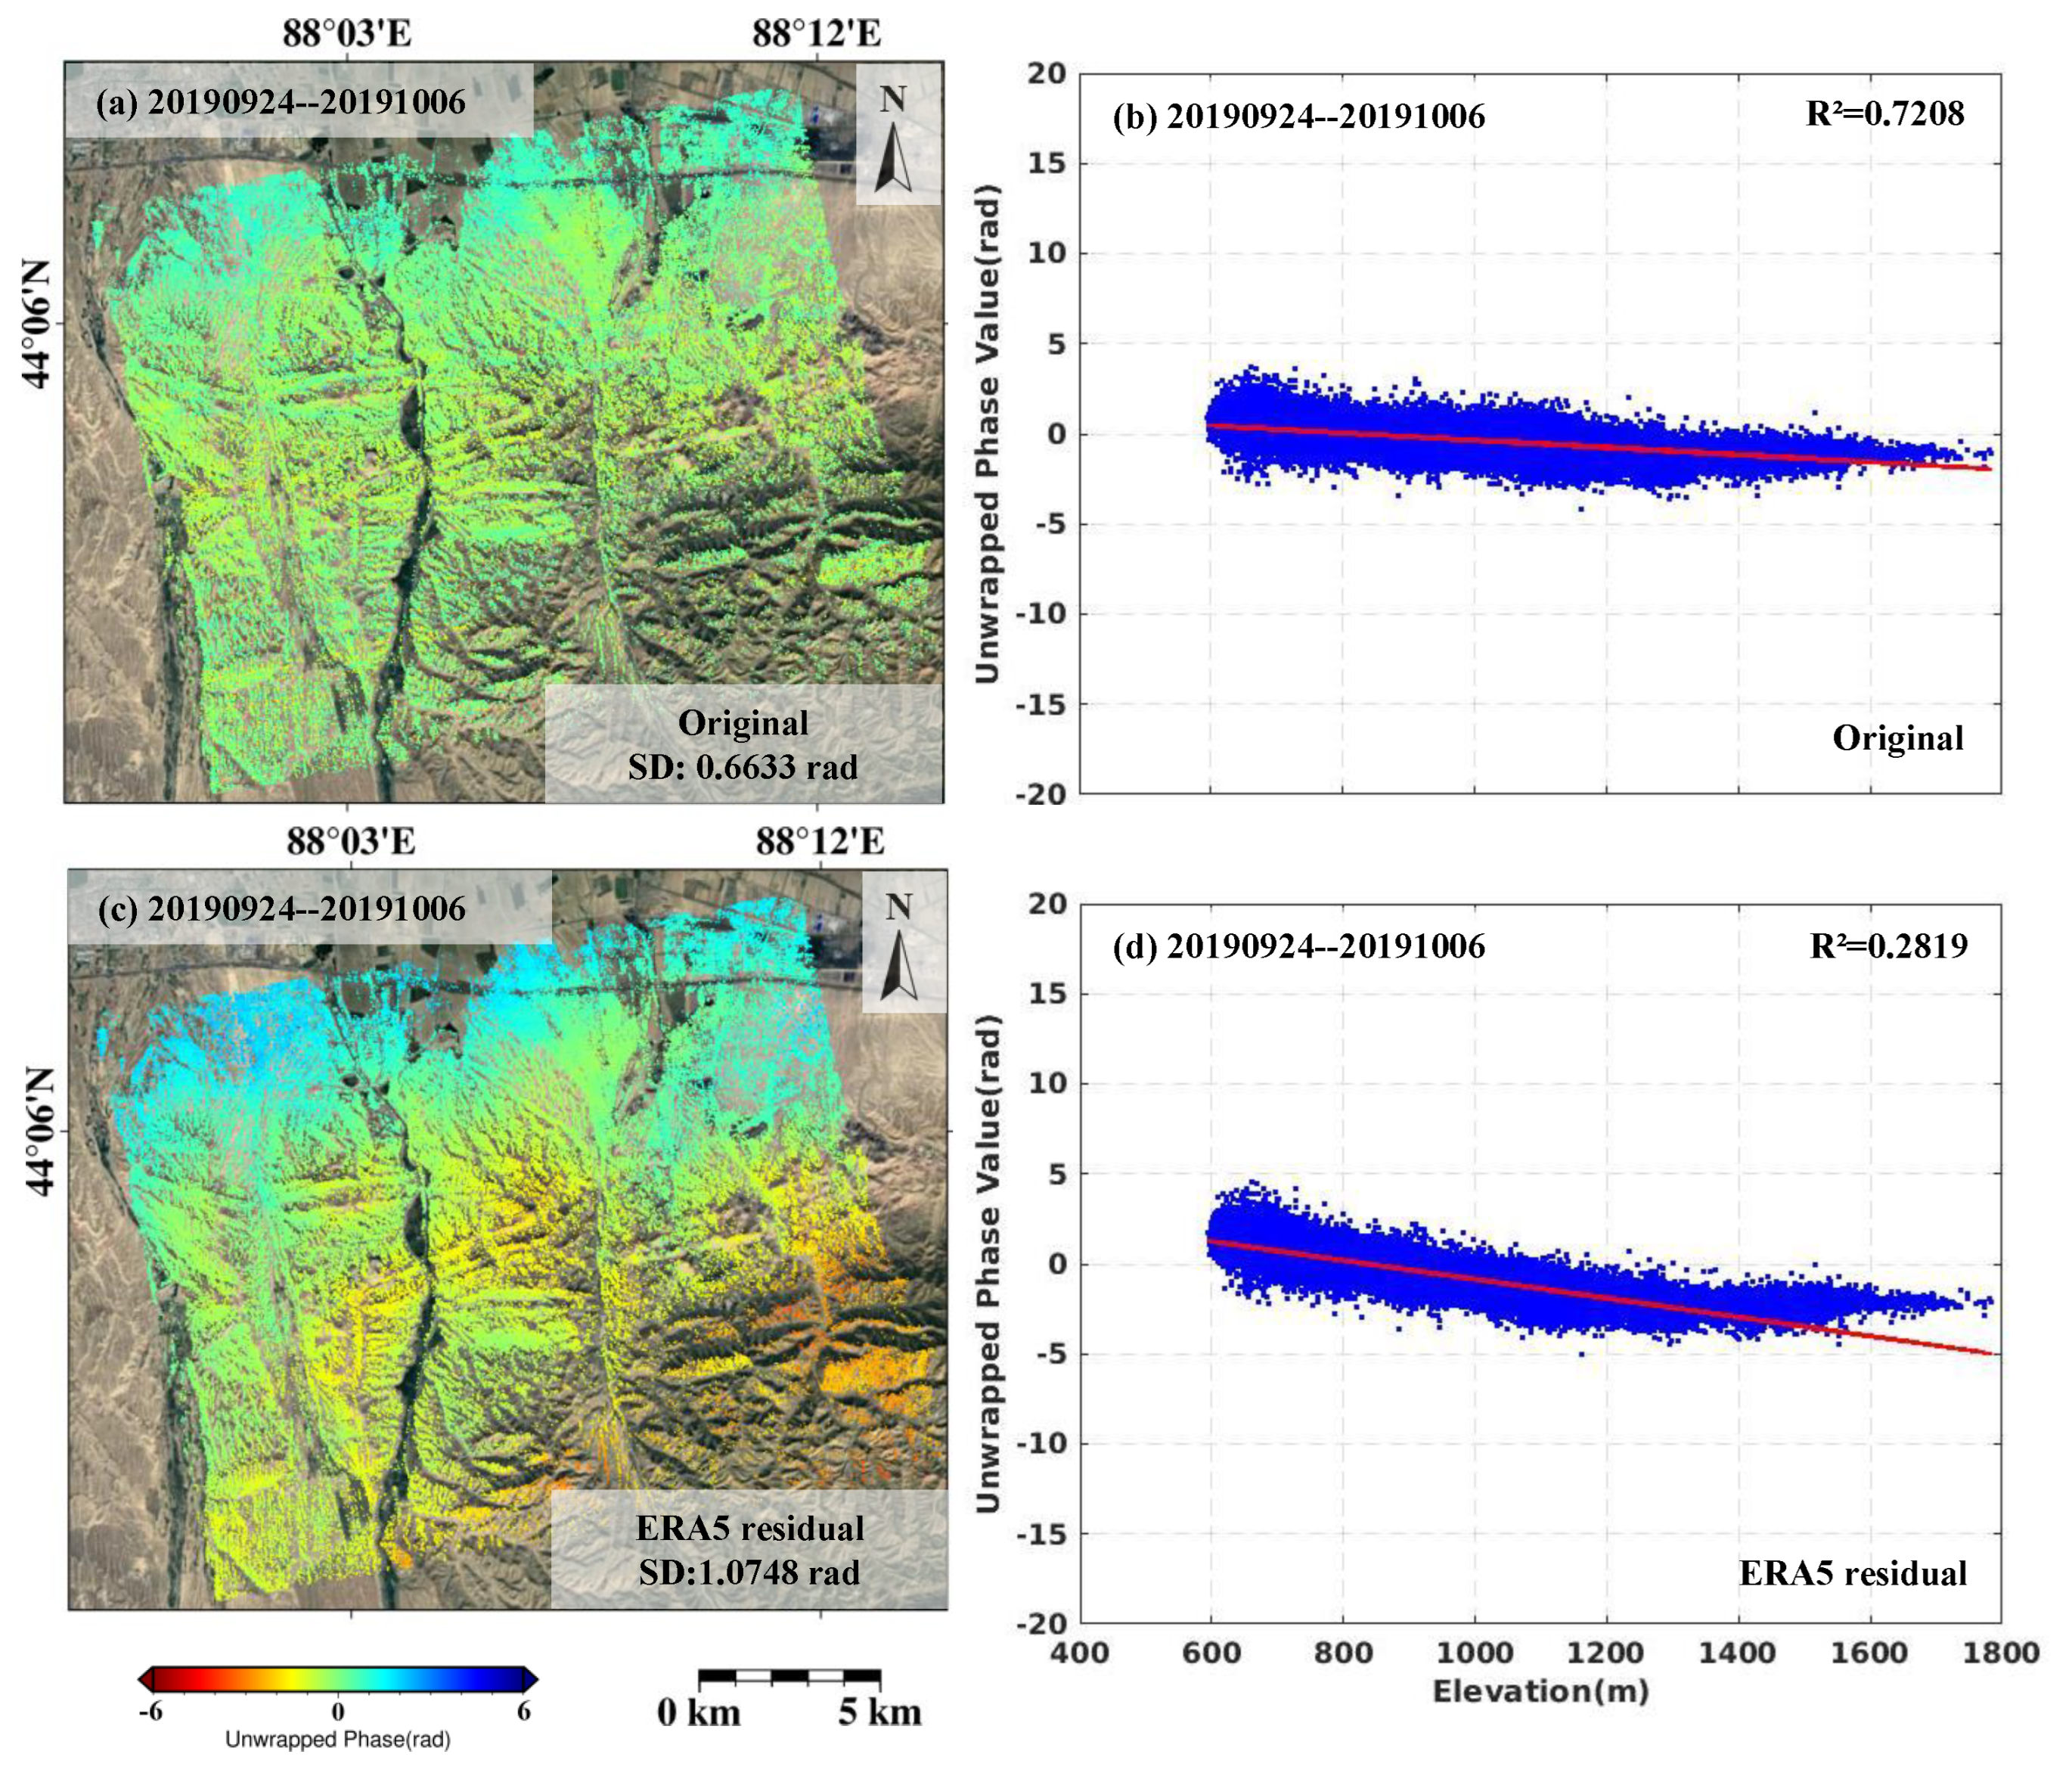
4.1. Atmospheric Correction Results and Analysis

Figure 4 shows a part of the atmospheric delay products, namely atmospheric phase screen (APS) estimated using ERA5 based on the D-LOS model. It can be found that the phase of atmospheric delay is different in different periods. Furthermore, the distribution of atmospheric delay is related to the topography of the study area. The APS using ERA5 based on the D-LOS model is removed from the original interferogram to obtain the interferogram after atmospheric correction.
In order to ensure the precision and reliability of the results, a value of 0.8 for the temporal coherence estimator is used as the threshold to select pixels with high interferometric phase quality. The standard deviation (SD) of the unwrapped phase is selected as the evaluation index of interferogram quality.
As shown in Table 1, to evaluate atmospheric correction performance on the study area, statistical analysis is carried out to all 57 interferograms by comparing their SD. Furthermore, the overall change is shown in Figure 5. The light green bar represents correction percentage. The positive value represents the decrease in SD, which can be considered as a good atmospheric correction effect. The phase SD of most interferograms decreases after atmospheric correction. The largest reduction is 63.72% of the 20190608–20190620 interferogram pair. The average phase SD of the interferograms after atmospheric correction is 13.6% lower than that of the original interferograms. Therefore, it can be concluded that the D-LOS atmospheric phase correction method using ERA5 data has a good correction effect in this study area.
As shown in Figure 6a–h, four groups of interferogram results with reduced phase SD after correction are selected for comparison. Figure 6a,c,e,g are the original unwrapped results of the interferograms 20190527–20190608, 20190608–20190620, 20190726–20190807 and 20200403–20200415, respectively. The short temporal and perpendicular baseline preclude deformation and DEM phase errors. Therefore, the phase component can be considered as atmospheric artifacts in the original interferograms. The distribution of phase values shown in the figure has a certain tendency. The phase SD of these four interferograms is 2.1456, 2.7458, 1.6325 and 1.8175, respectively. Figure 6b,d,f,h are the residual unwrapped phases of the corresponding interferograms after atmospheric correction. It can be seen that the trend characteristics in the unwrapped results are significantly reduced, and the phase SD is reduced to 1.0152, 0.9963, 1.5131 and 0.7095, respectively.
Figure 6 shows that the original phase unwrapped value has a certain trend. At the same time, it can be seen from Figure 4 that the vertical stratification part of tropospheric delay has a strong correlation with topography. This correlation is more visible when looking at the phase-elevation scatter plots in Figure 7. It is evident that the slope of the fitting line between the unwrapped phase and the terrain is significantly reduced after removing APS predicted by the D-LOS model using ERA5. The tropospheric delay related to elevation is effectively weakened. However, although the 20190726–20190807 interferogram shown in Figure 7e,f has improved, the effect is not evident. The correlation between tropospheric delay and topography is weak. Most of the atmospheric delay here may come from the turbulent part unrelated to topography.
According to Table 1, the phase SD of some interferograms increases after removing APS predicted by the D-LOS model using ERA5. As shown in Figure 8, the unwrapped phase of the interferogram 20190924–20191006 with increased phase SD after correction was selected for demonstration. Figure 8a,c shows the original and residual phase, respectively, of the interferogram 20190924–20191006. Figure 8b,d shows the distribution relationship between the corresponding phase and the elevation. It can be seen that the unwrapped phase of the original interferogram is small, and that the correlation between the phase shown in the scatter plot and the elevation is weak. In addition, from Table 1, among the 17 interferograms with increased phase SD after atmospheric correction, the original unwrapped phase SD of 14 interferograms is lesser than the average value of the original unwrapped phase SD. The phase SD of the three other interferograms increased after correction. It can be inferred that these 17 interferograms are less affected by the atmosphere, and the quality of the original interferograms is better.

4.2. Deformation Monitoring Result and Analysis

In this paper, 57 original interferograms were first used for Stacking-InSAR (referred to as Original Stacking-InSAR) to obtain the average deformation velocity in the LOS direction of the study area, as shown in Figure 9a. Negative LOS values indicate movement away from the satellite, while positive values indicate movement toward the satellite. The red triangle in the figure represents the location of the coal fire point, and the area circled by the black box is the main coal fire deformation area. It can be seen that there is visible deformation around most coal fire points, while the deformation trend around some coal fire points is not significant. A large area of abnormal deformation is shown in the red box in the southeastern part of the study area, which is magnified as shown in Figure 9e. According to Figure 1c, there is a mountainous area with a high altitude. Therefore, it is highly likely to be affected by the atmosphere. The topography-related tropospheric delay exists in the interferograms in this region, which leads to the anomaly of the average velocity.
Subsequently, the atmospheric products estimated from the D-LOS model of the ERA5 dataset obtained above were removed from the 57 original interferograms. The ERA5-Corrected Stacking-InSAR method was used to calculate the average deformation velocity (referred to as Original ERA5-Corrected Stacking-InSAR). The result is shown in Figure 9b. As can be seen from the deformation velocity map, the deformation range of the main coal fire in the middle of the study area practically does not change. However, the abnormal deformation value of the red box in the southeast direction (as shown in Figure 9f) decreases significantly. Then, 40 interferograms with reduced SD of the unwrapped phase after atmospheric correction were selected for stacking (referred to as Effective ERA5-Corrected Stacking-InSAR). The average deformation velocity map obtained is shown in Figure 9c. Similarly, the abnormal deformation (magnified as shown in Figure 9g) in the red box range described above is further reduced. This indicates that the above atmospheric products have achieved good results in correcting the interferogram in the study area. The phase quality of the stacked interferogram determines the accuracy of the Stacking-InSAR processing results.
Finally, 40 interferograms with reduced SD of unwrapped phase after atmospheric correction and 17 original interferograms with increased SD of phase after atmospheric correction that are not seriously affected by the atmosphere were stacked for Stacking-InSAR calculation (referred to as Adaptive ERA5-Corrected Stacking-InSAR). The obtained average deformation result is shown in Figure 9d. It can be clearly seen that the abnormal deformation value in the red box range obtained by Effective ERA5-Corrected Stacking-InSAR (Figure 9g) is reduced more significantly (magnified as shown in Figure 9h). Consequently, this confirms that, as expected, the more interferograms with better quality, the more precise and reliable the deformation results obtained by Stacking-InSAR.

5. Discussion

5.1. Internal Accuracy

The standard deviation of average deformation velocity is a direct evaluation index of the quality of time-series InSAR results, which represents the separation degree of deformation phase and residual phase. The smaller standard deviation of the average deformation velocity, the smaller residual phase in the deformation velocity and the higher theoretical accuracy of the deformation estimation results [64].
Figure 10a–d shows the standard deviation of the average velocity of the Original Stacking-InSAR result, Original ERA5-Corrected Stacking-InSAR result, Effective ERA5-Corrected Stacking-InSAR result and Adaptive ERA5-Corrected Stacking-InSAR result, respectively. The above results are amplified by Figure 10e–h in the area circled by the red box in (a). The overall standard deviation of all high coherence point targets is distributed between 0 and 5 mm/year, and the monitoring results are relatively reliable. In addition, the standard deviation of high coherent pixels in Figure 10e is further reduced in Figure 10f–h, which is consistent with the corrected change in deformation anomalies in Section 4.2.

5.2. Comparison with GACOS-Corrected Stacking-InSAR Results

The Generic Atmospheric Correction Online Service (GACOS) atmospheric delay products, which are based on numerical weather models, are the highest-resolution atmospheric model of ECMWF. By using the iterative tropospheric decomposition interpolation model, the stratified and turbulent components are separated, and the high-resolution zenith total delay (ZTD) is generated [55,65,66]. In recent studies, the GACOS atmospheric delay products have been applied in Stacking-InSAR to obtain the ground deformation [62].
As mentioned in Section 2 and Section 3, the ERA5 dataset has a shorter sampling time. At the same time, a realistic integration strategy along the LOS direction (D-LOS) has been used for estimating atmospheric artifacts. Therefore, the ground deformation result and standard deviation of the LOS velocity result base on GACOS-Corrected Stacking-InSAR were acquired (Figure 11).
It can be seen from Figure 11 that, compared with Original Stacking-InSAR, ground deformation errors caused by atmospheric delay are effectively alleviated by atmospheric correction. However, compared with the result of proposed Adaptive ERA5-Corrected stacking-InSAR, the abnormal deformation value in the southeast toward the mountain area is more visible in the result of GACOS-Corrected stacking-InSAR. In order to further verify the performance of the proposed adaptive ERA5-Corrected Stacking-InSAR, the mean values of standard deviations of the LOS velocity in the three main coal fire deformation areas in Figure 11 are calculated, respectively, (Table 2). As shown in Table 2, after atmospheric correction, the standard deviation of LOS velocity in the three main coal fire areas decreases compared with the Original Stacking-InSAR. The mean values of standard deviations of the adaptive ERA5-Corrected stacking-InSAR method in the three main coal fire deformation areas are minimal, so the deformation result in the coal fire area obtained by the proposed method has a better performance relative to the study area.

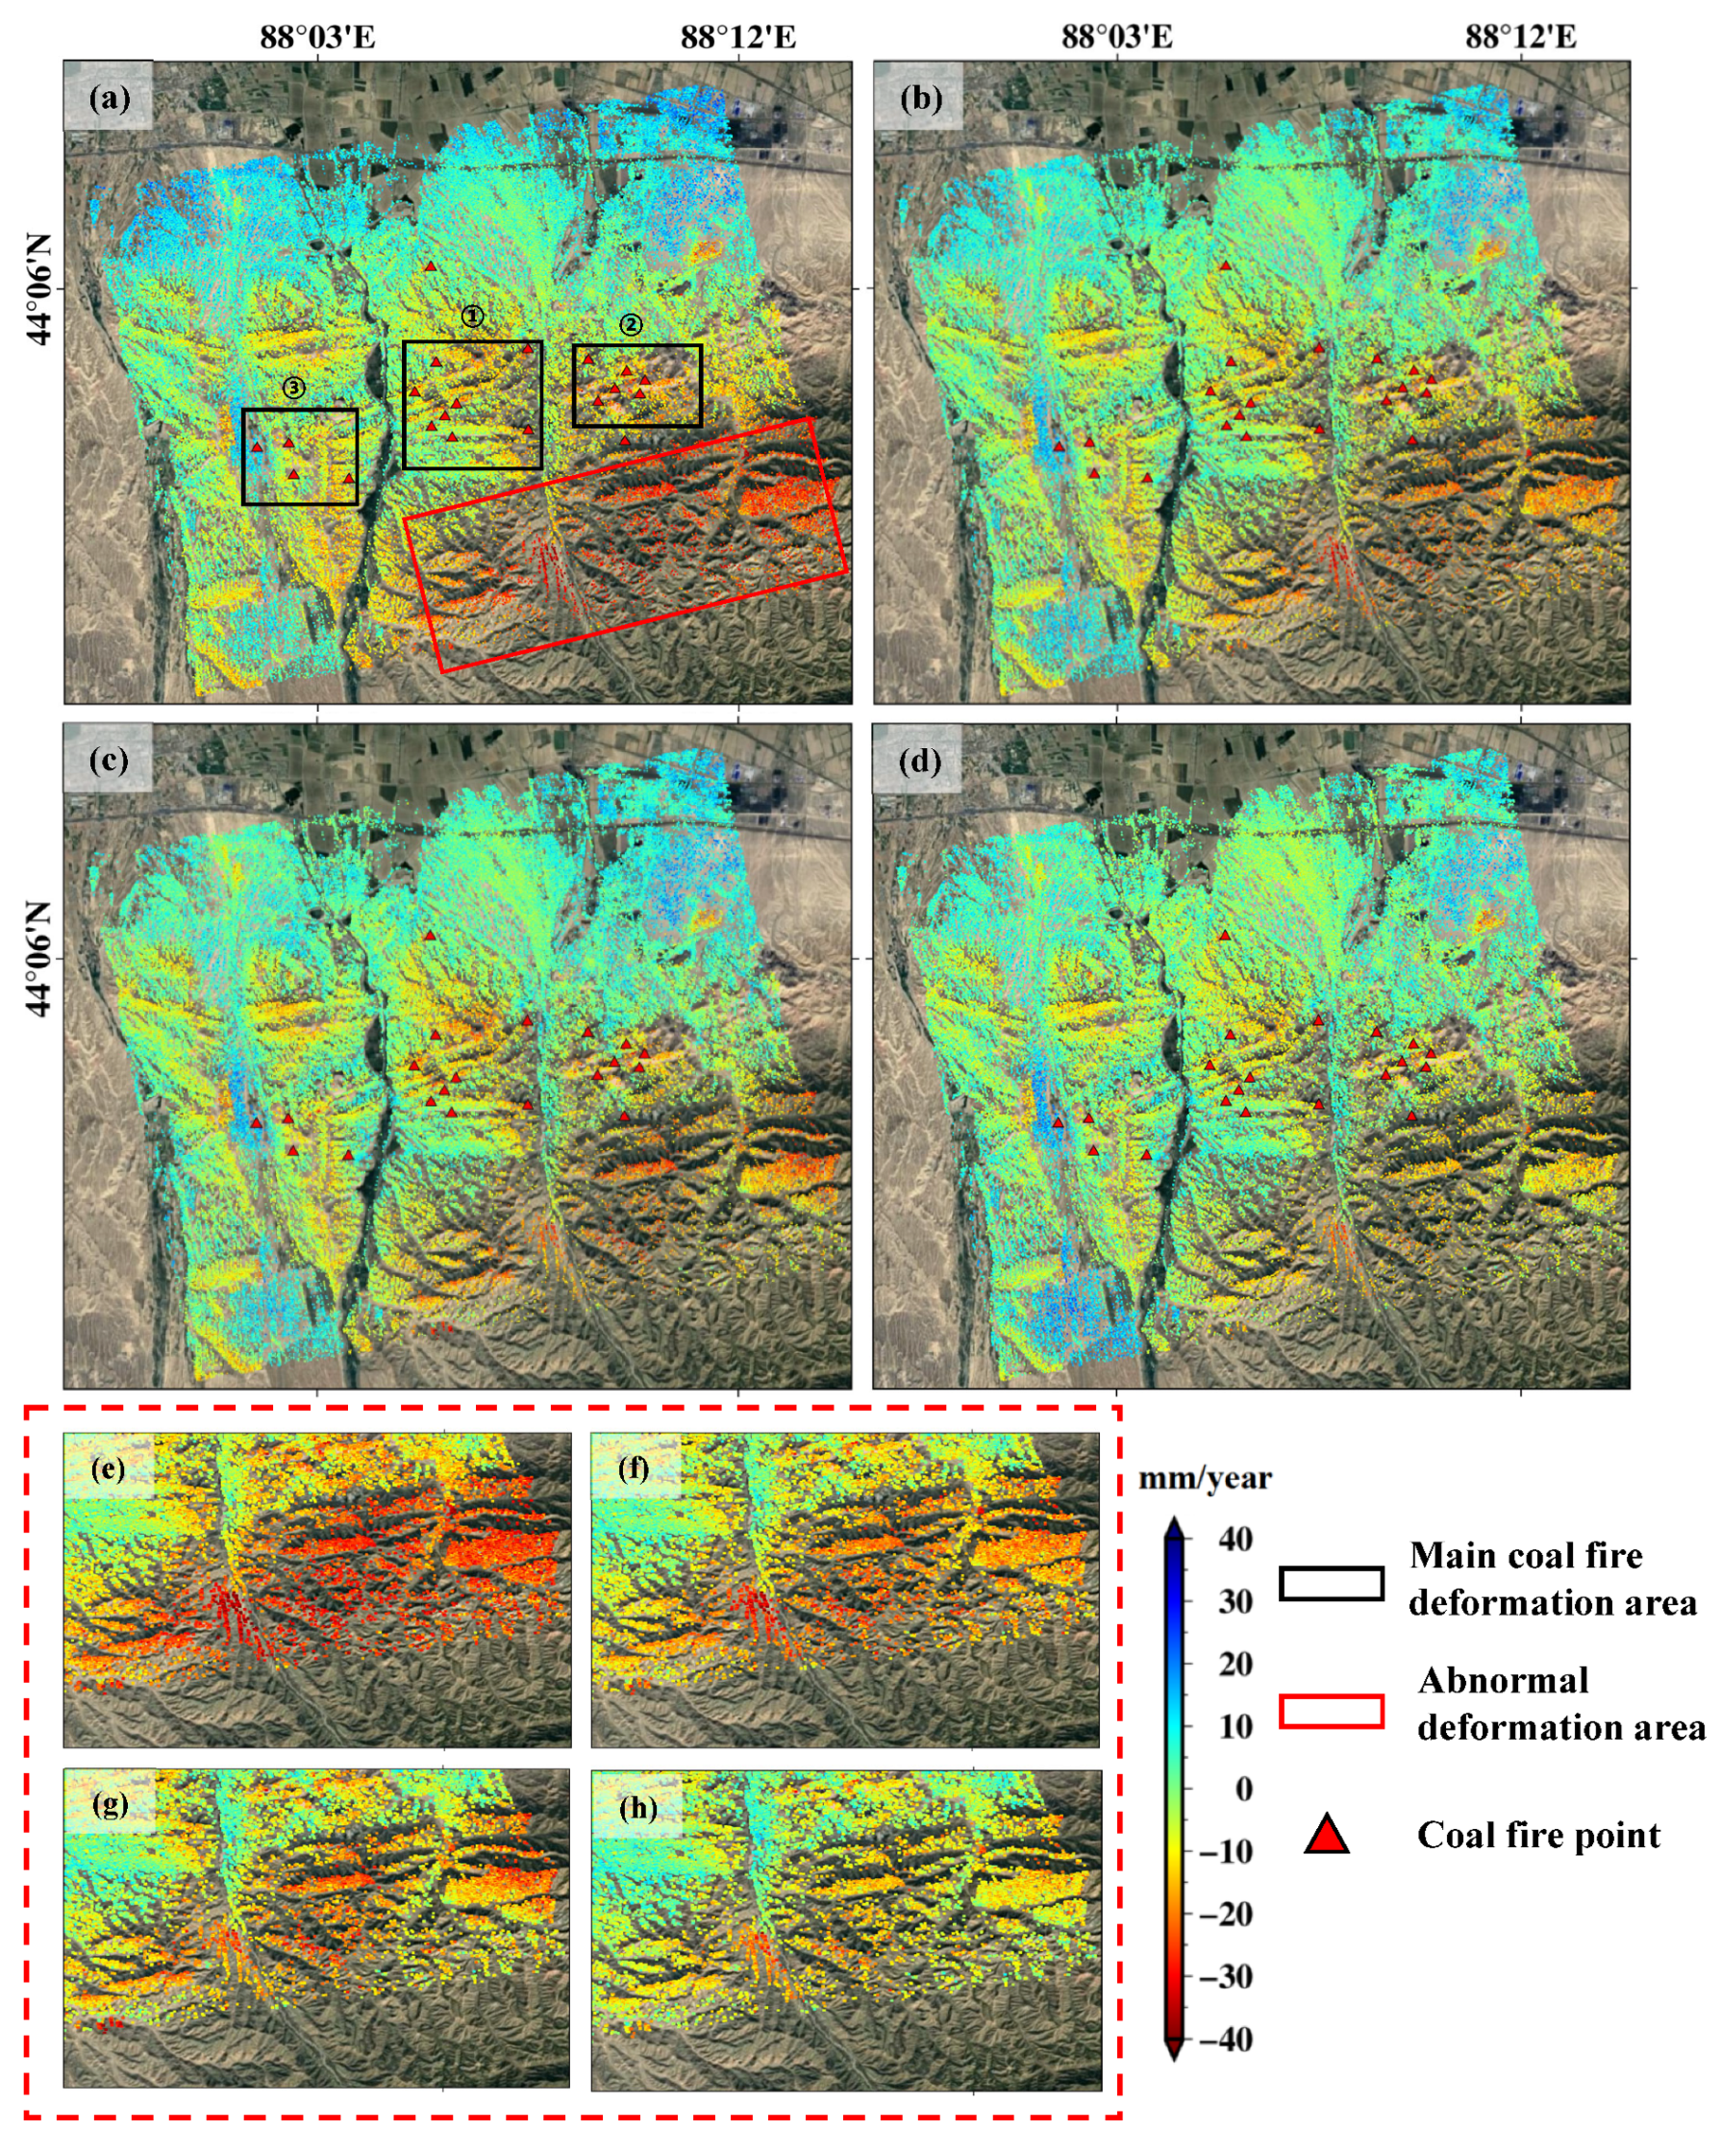
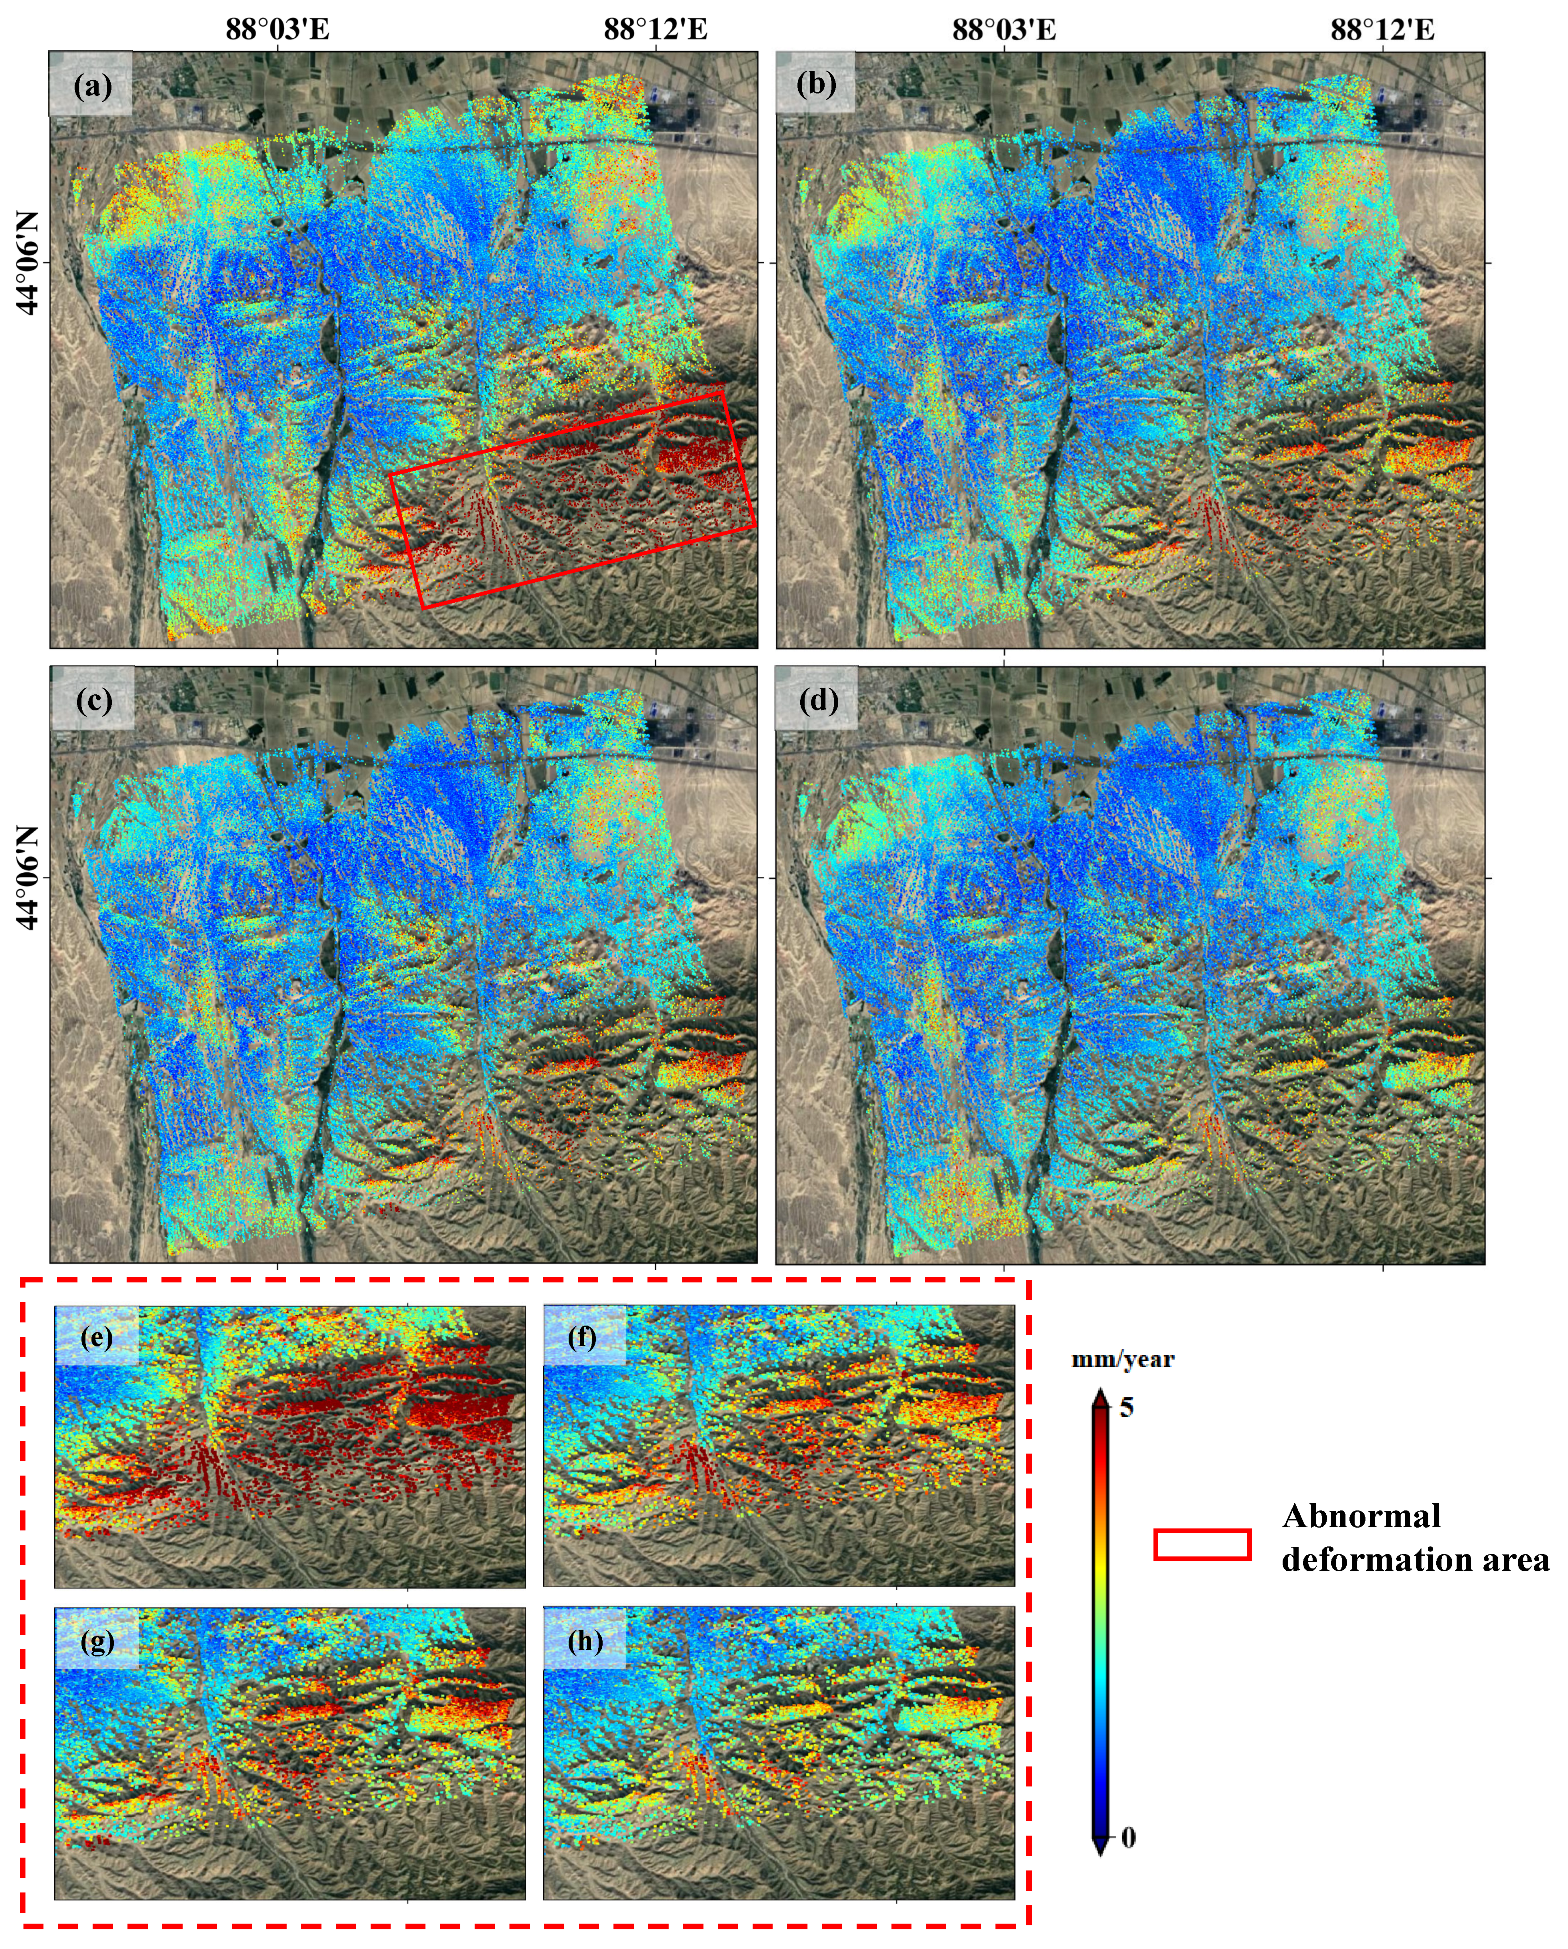
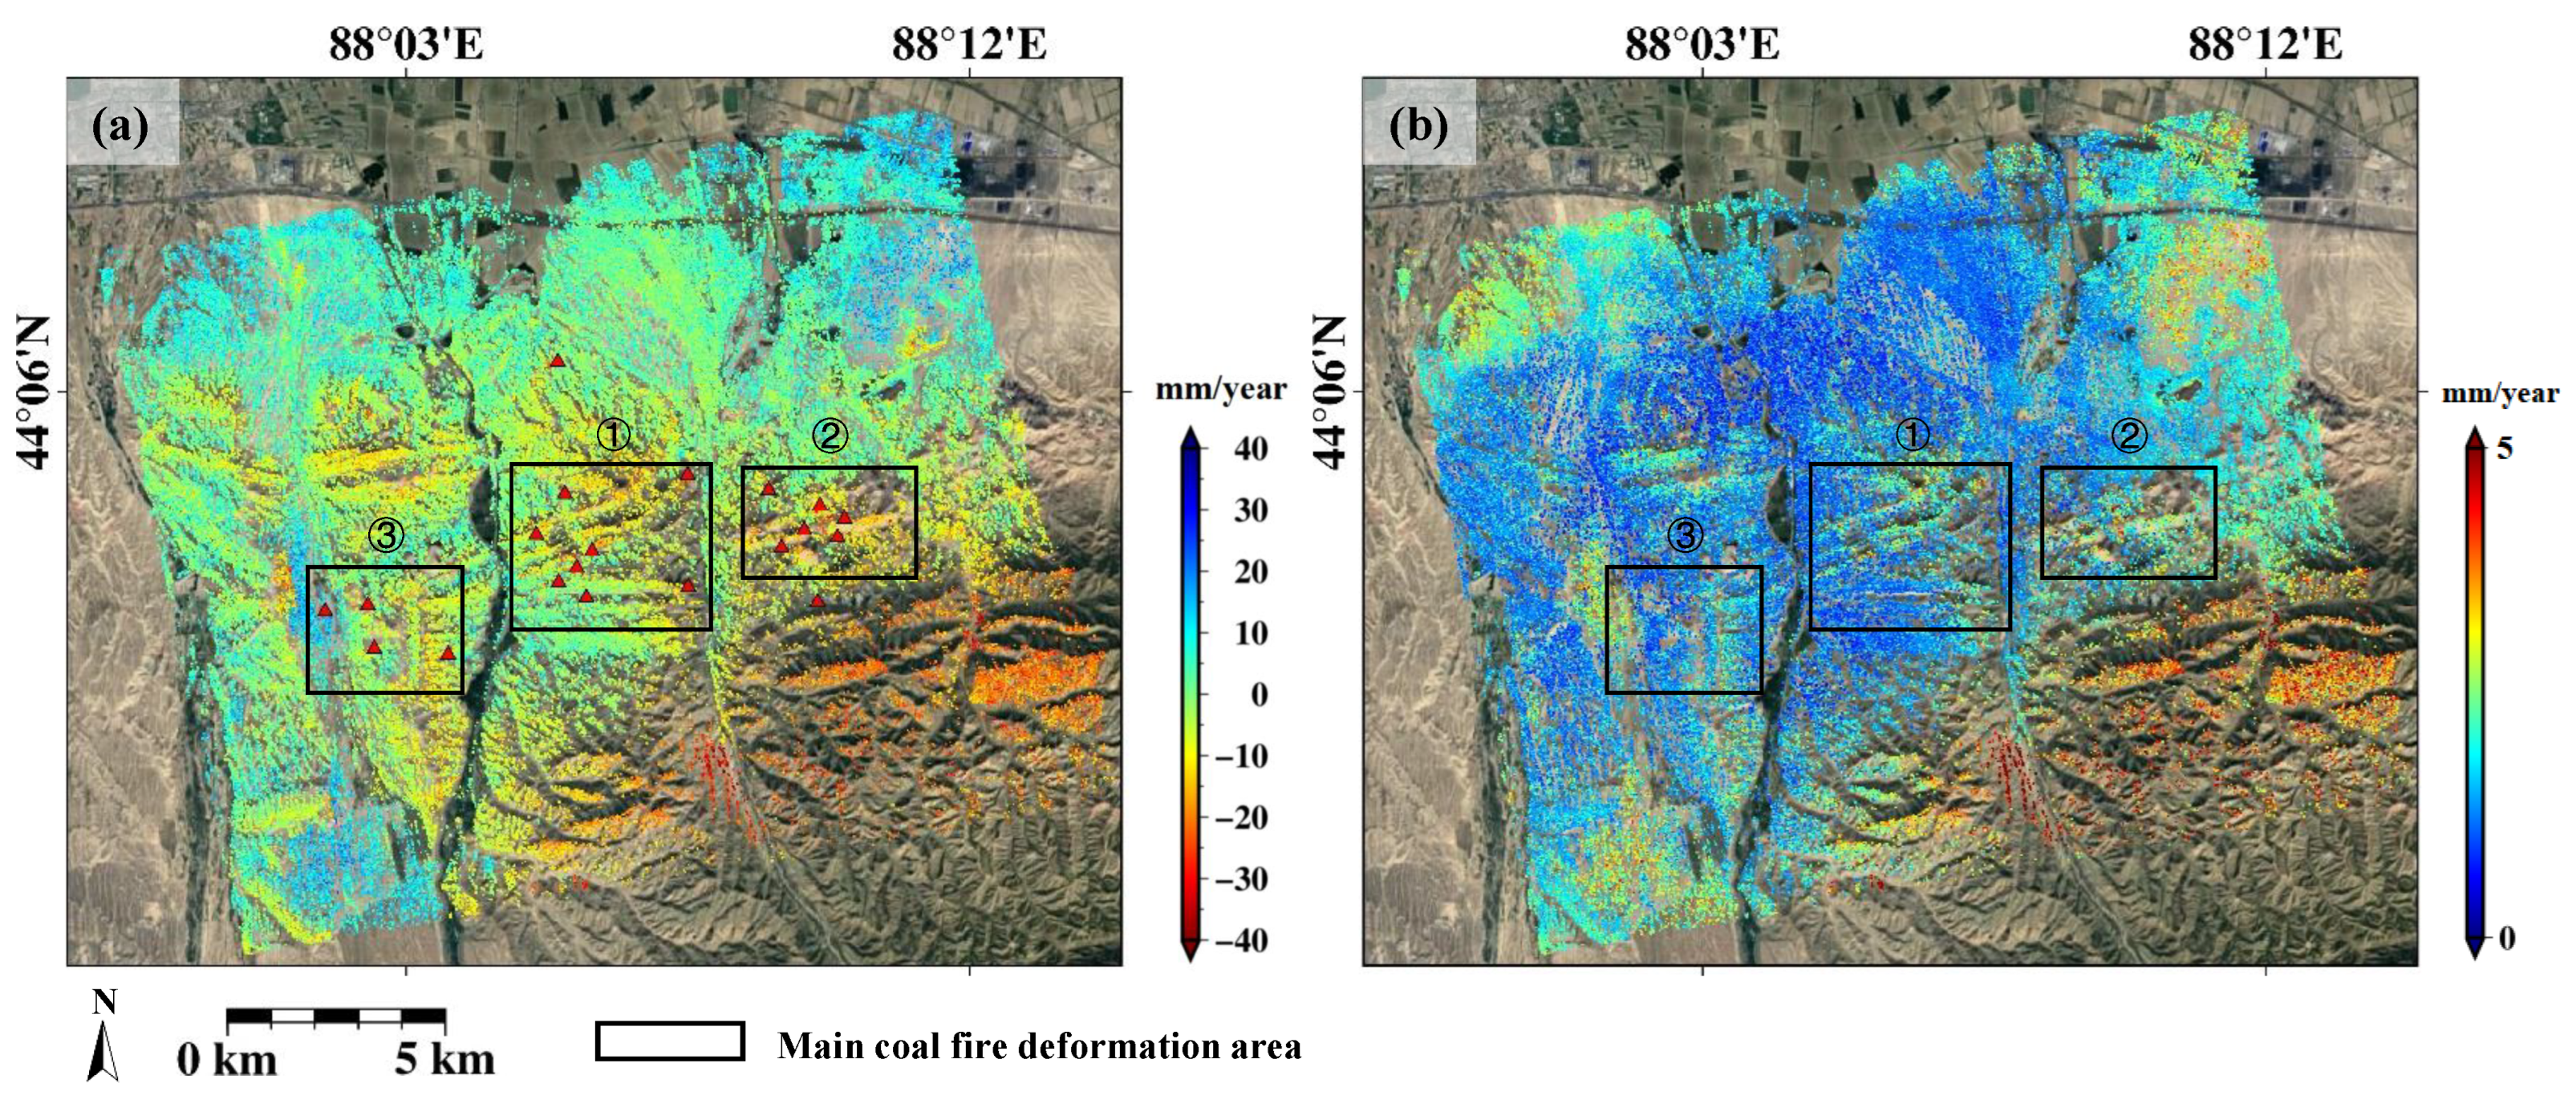
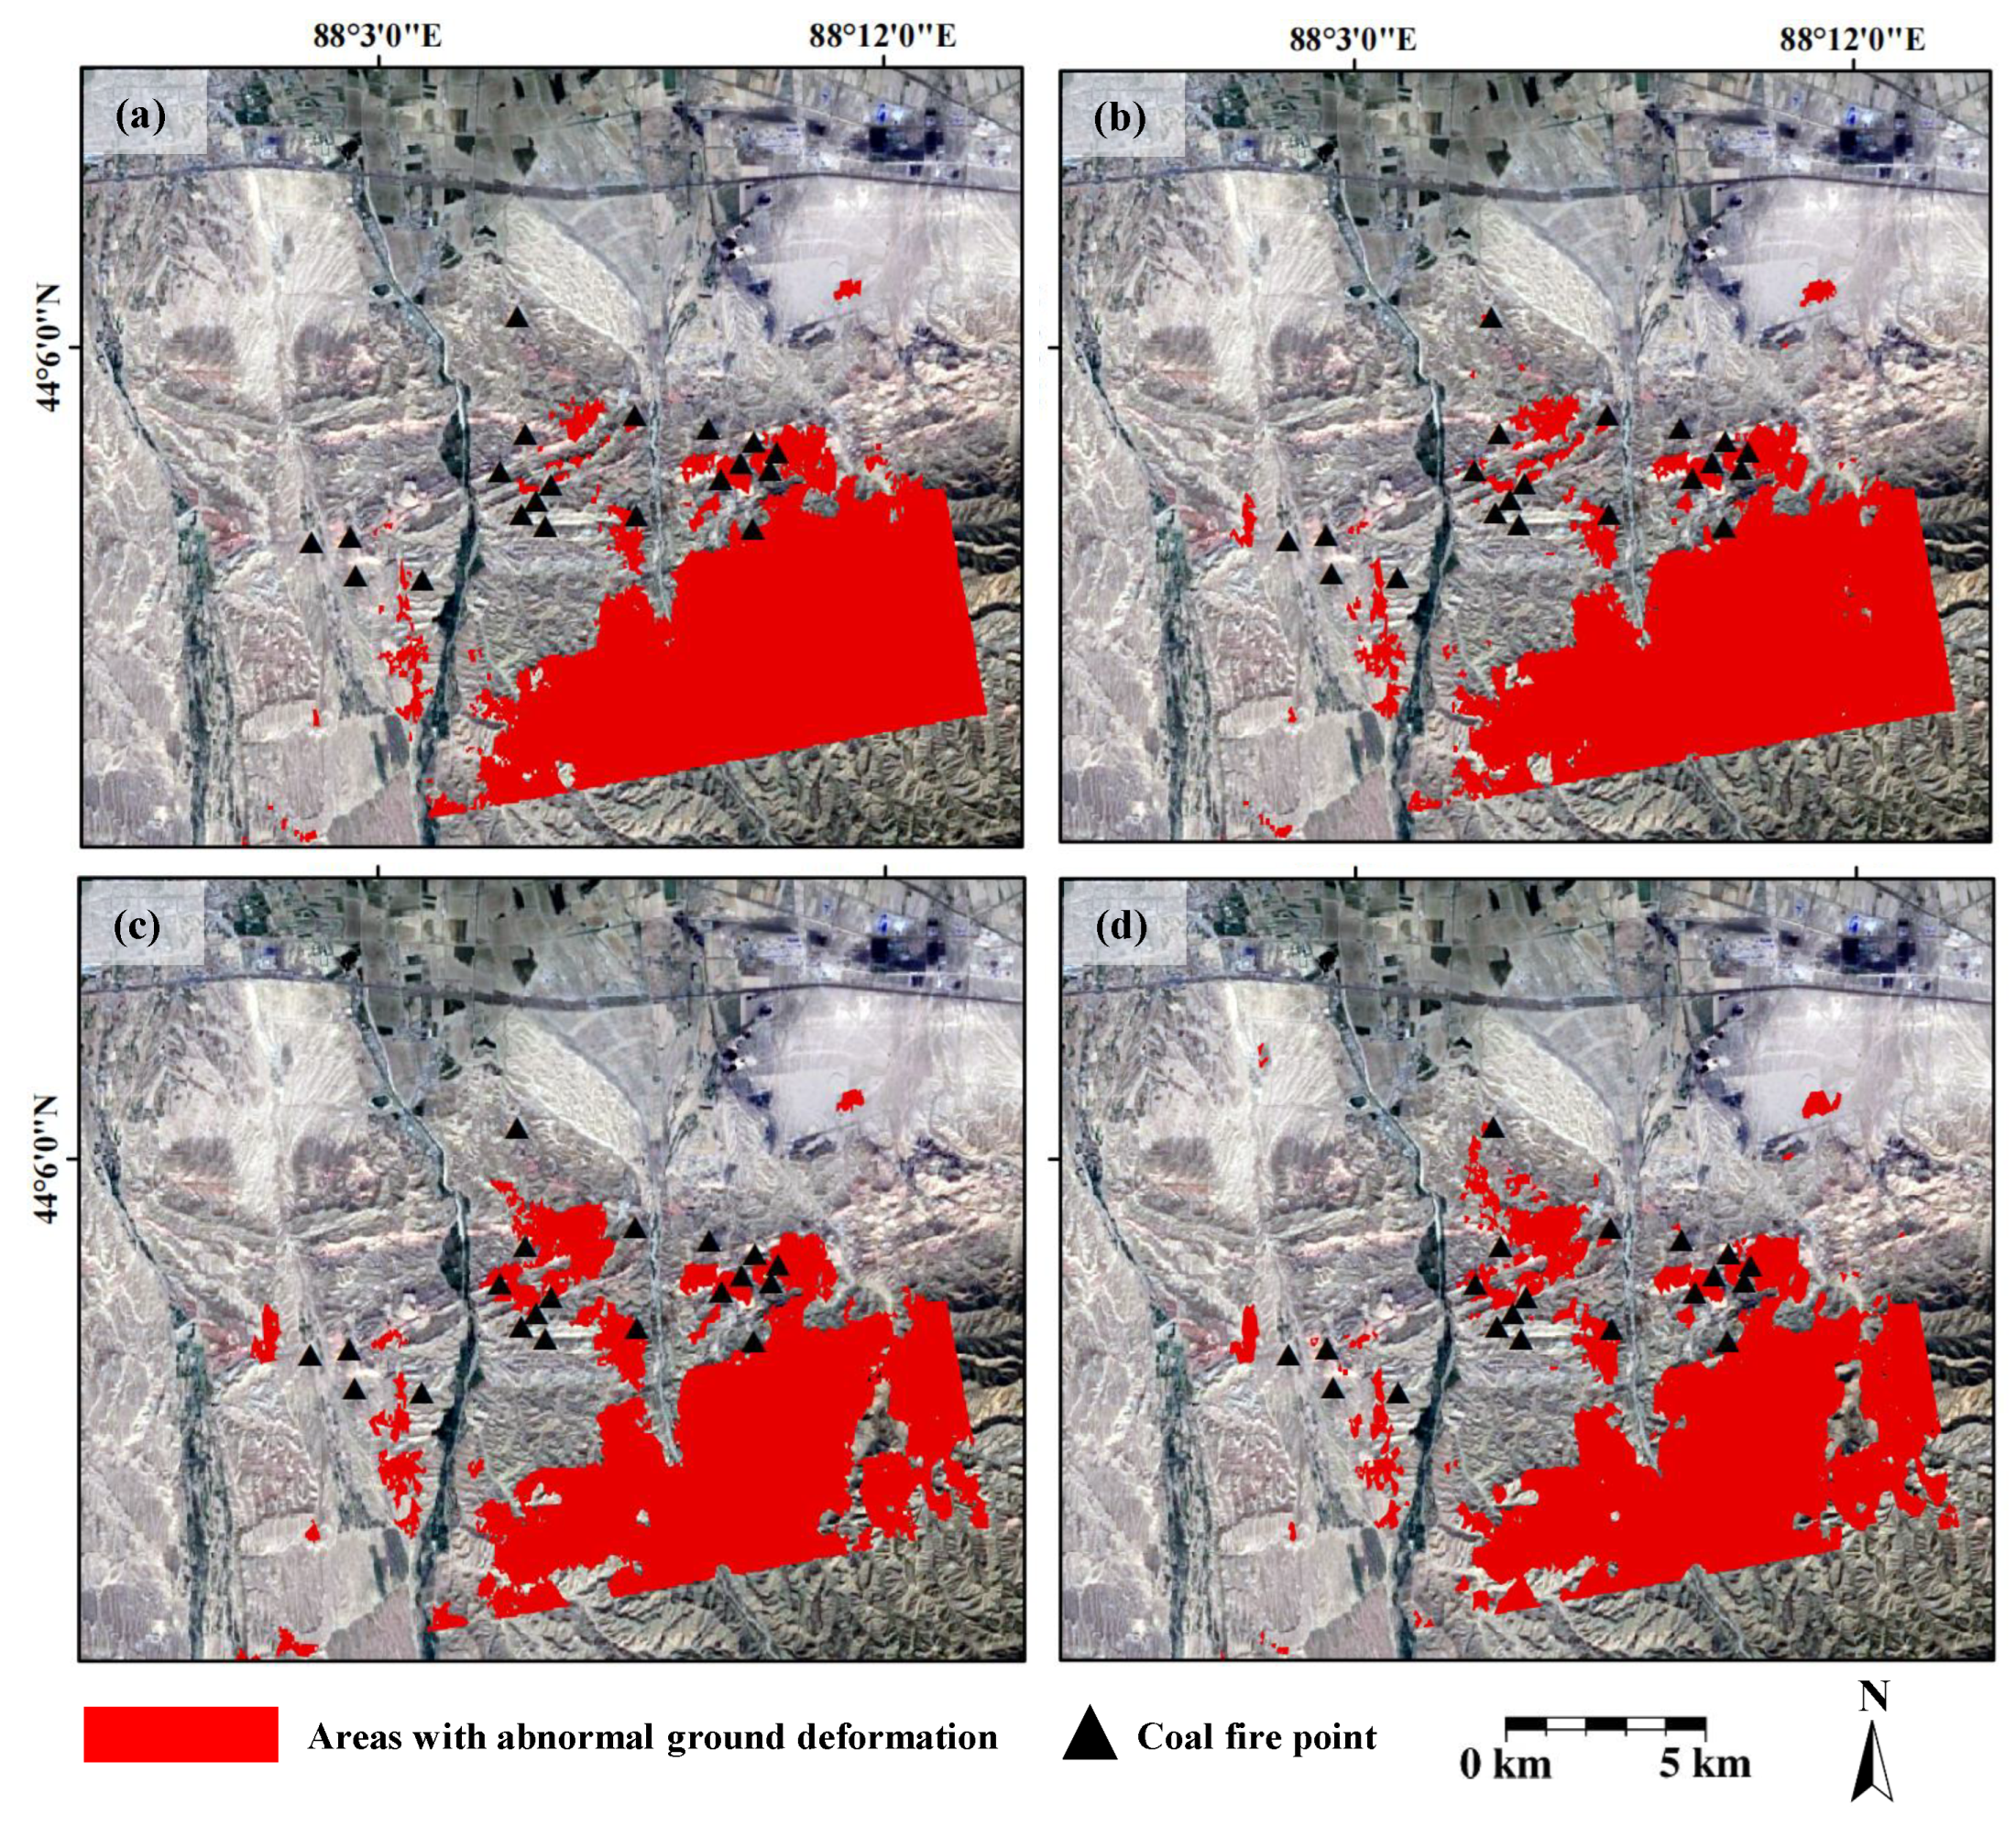
5.3. Coal Fire Related Ground Deformation Anomalies Identification

In Section 4.2 above, four groups of deformation results in the study area were obtained. Kriging interpolation was performed. The mean value minus standard deviation of the four groups of interpolated raster images was used as the threshold to recognize the deformation anomalies. As shown in Figure 12, the red area is the deformation anomalies, and the black triangles show the detected coal fire points. Figure 12a–d shows the deformation anomalies identified by Original Stacking-InSAR result, Original ERA5-Corrected Stacking-InSAR result, Original ERA5-Corrected Stacking-InSAR result and Adaptive ERA5-Corrected Stacking-InSAR result, respectively. With the improvement of Stacking-InSAR results, the deformation abnormal areas obtained by the southeastern division of the study area decrease. The coincidence with the detected coal fire points gradually increase. Many deformation studies [67] in mining areas show that ground cracks generally appear in places with large curvatures, but not in places with maximum deformation. Normally, coal fire points are marked near ground cracks. Thus, the location of coal fire point and deformation anomaly area is not highly consistent.
According to the mine data obtained, the mining scope in the fire area can reach several hundred meters. In this paper, we generated a 400-meter buffer at the location of the coal fire points and intersected it with the deformation anomaly area shown in Figure 12. The effect of ERA5-Corrected Stacking-InSAR results on the monitoring of ground deformation in the coal fire area were evaluated by the size of the overlapping area. As shown in Table 3, the area of abnormal deformation zones divided by the above four results and the overlapping area with the coal fire point buffer zone are counted. The ratio of coincidence area to area of abnormal deformation was used to evaluate the results. The results in the table show that the effective deformation area divided by the Original Stacking-InSAR result accounted for 2.96%; while the counterparts for the Original ERA5-Corrected Stacking-InSAR, Effective ERA5-Corrected Stacking-InSAR and Adaptive ERA5-Corrected Stacking-InSAR are 3.01%, 4.19% and 4.33%, respectively. Compared with the effective deformation area divided by the Original Stacking-InSAR result, the effective area identified by the other three methods increased by 1.6%, 41.5% and 46.3%, respectively.
Based on the optical image and the local geographical characteristics of the study area, it is inferred that the abnormal deformation in the southeastern part of the study area toward the mountainous area may be the result of the mountain erosion caused by the water flow of melting snow. In the follow-up research work, we will combine more surface information, such as temperature, to further accurately identify the coal fire area.
Given these points, the deformation result based on the proposed adaptive ERA5-corrected Stacking-InSAR is beneficial to accurately monitor the ground deformation range over large-scale coal fire areas rapidly and at a low cost. At the same time, it was further proved that the quality and quantity of stacking interferometric pairs would have a certain impact on the Stacking-InSAR results. The higher the quality and quantity of the interferometric pair, the more precise and reliable the deformation velocity result obtained by Stacking-InSAR.

6. Conclusions

To improve the monitoring efficiency of large-scale coal fire ground deformation, an Adaptive ERA5-Corrected Stacking-InSAR method is proposed to monitor the ground deformation over the Fukang coal fire area of Xinjiang in this study.
After atmospheric correction, the unwrapped standard deviations (SDs) of 40 interferograms are reduced, and the topography-related unwrapped phase terms are visibly decreased. Specifically, the average phase SD of the corrected interferograms is reduced by 13.6% compared with that of the original ones. This indicates that the ERA5 atmospheric product obtained by the D-LOS model can effectively remove the atmospheric delay in the study area. The ground deformation result and standard deviation of the LOS velocity result based on GACOS-Corrected Stacking-InSAR are also acquired, and the results show that the proposed Adaptive ERA5-Corrected Stacking-InSAR method has a better and more reliable performance.
By stacking the interferograms with different phase standard deviation, four ground deformation results are obtained. Based on the detected coal fire points, the four obtained ground deformation results are evaluated. Compared with the Original Stacking-InSAR, the effective area identified by Original ERA5-Corrected Stacking-InSAR, Effective ERA5-Corrected Stacking-InSAR and the proposed adaptive ERA5-Corrected Stacking-InSAR, is increased by 1.6%, 41.5% and 46.3%, respectively. The proposed adaptive ERA5-Corrected Stacking-InSAR method presents the best performance.
In this paper, the ERA5 atmospheric delay product generated based on the D-LOS model is used to remove atmospheric delay in mountainous areas. By comparing the interferogram quality before and after correction, an adaptive method that selects interferograms with better phase quality for Stacking-InSAR deformation estimation is proposed. The proposed adaptive ERA5-Corrected Stacking-InSAR can efficiently retrieve ground deformation over underground coal fire areas with mountains. However, it is difficult to accurately identify underground coal fire areas only relying on the ground deformation anomaly. The proposed adaptive ERA5-Corrected Stacking-InSAR algorithm should be combined with other techniques to more effectively delineate and identify underground coal fire areas.

Author Contributions

Conceptualization: Y.Z., Y.W., W.H., F.Z. and Z.H.; methodology: Y.Z., F.Z., Z.H. and T.W.; formal analysis: Y.Z.; investigation: Y.W., R.S., F.C. and J.Y.; resources: Z.H. and W.H.; data curation: R.S. and L.Z.; writing—original draft preparation: Y.Z.; writing—review and editing: Y.W., F.Z., Z.H., J.L., T.W., J.F., J.E. and L.Z.; visualization: Y.Z.; supervision: Y.W. All authors have read and agreed to the published version of the manuscript.

Funding

This research was supported in part by the National Natural Science Foundation of China (Grant No.41874044 and Grant No. 42004011), in part by project G2HOTSPOTS (PID2021-122142OB-I00) from the MCIN /AEI /10.13039 /501100011033 /FEDER, UE and in part by China Postdoctoral Science Foundation (Grant No. 2020M671646). At the same time, the research was also funded by the Construction Program of Space-Air-Ground-Well Cooperative Awareness Spatial Information Project (B20046) and National Key R&D Program of China (Grant No. 2022YFE0102600).

Data Availability Statement

Not applicable.

Acknowledgments

We thank the ESA and USGS for providing Sentinel-1 SLC data and SRTM elevation data used in this study. Further thanks to ECMWF for providing meteorological data. We also want to thank Xinjiang Coal Fire Geology Bureau, China, for providing the coal fire survey data.

Conflicts of Interest

The authors declare no conflict of interest.

References

  1. Tan, Y. Disaster and control of spontaneous combustion in coal field, China. Meitiandizhi Kantan 2000, 28, 8–10. [Google Scholar]
  2. Rosema, A.; Guan, H.; Veld, H. Simulation of spontaneous combustion, to study the causes of coal fires in the Rujigou Basin. Fuel 2001, 80, 7–16. [Google Scholar] [CrossRef]
  3. Deng, J.; Ge, S.; Qi, H.; Zhou, F.; Shi, B. Underground coal fire emission of spontaneous combustion, Sandaoba coalfield in Xinjiang, China: Investigation and analysis. Sci. Total Environ. 2021, 777, 146080. [Google Scholar] [CrossRef] [PubMed]
  4. Qi, X.; Wang, D.; Xin, H.; Zhong, X. Environmental Hazards of Coal Fire and Their Prevention in China. Environ. Eng. Manag. J. (EEMJ) 2013, 12, 1915–1919. [Google Scholar] [CrossRef]
  5. Jianjun, W.; Weiguo, J.; Xiaochen, L.; Lei, G.; Jiahong, L. Innovative Technologies for Exploration, Monitoring and Extinction of Underground Coal Fires. J. China Coal Soc. 2009, 34, 1669–1674. [Google Scholar]
  6. Stracher, G.B. Coal fires burning around the world: A global catastrophe. Int. J. Coal Geol. 2004, 1, 1–152. [Google Scholar] [CrossRef]
  7. Zhou, B.; Wu, J.; Wang, J.; Wu, Y. Surface-based radon detection to identify spontaneous combustion areas in small abandoned coal mine gobs: Case study of a small coal mine in China. Process Saf. Environ. Prot. 2018, 119, 223–232. [Google Scholar] [CrossRef]
  8. Xueqing, Z.; Yu, Z.; Mingda, Y.; Xiaofei, L.; Tian, W.; Sherong, H. Damages and Cellenge for Governing of Coalfield Fires in Xinjiang. China Min. Mag. 2014, 23, 93–96. [Google Scholar]
  9. Tan, B.; Zhang, F.; Zhang, Q.; Wei, H.; Shao, Z. Firefighting of subsurface coal fires with comprehensive techniques for detection and control: A case study of the Fukang coal fire in the Xinjiang region of China. Environ. Sci. Pollut. Res. 2019, 26, 29570–29584. [Google Scholar] [CrossRef]
  10. Shao, Z.; Jia, X.; Zhong, X.; Wang, D.; Wei, J.; Wang, Y.; Chen, L. Detection, extinguishing, and monitoring of a coal fire in Xinjiang, China. Environ. Sci. Pollut. Res. 2018, 25, 26603–26616. [Google Scholar] [CrossRef]
  11. Xie, J.; Xue, S.; Cheng, W.; Wang, G. Early detection of spontaneous combustion of coal in underground coal mines with development of an ethylene enriching system. Int. J. Coal Geol. 2011, 85, 123–127. [Google Scholar] [CrossRef]
  12. Singh, A.K.; Singh, R.; Singh, M.P.; Chandra, H.; Shukla, N. Mine fire gas indices and their application to Indian underground coal mine fires. Int. J. Coal Geol. 2007, 69, 192–204. [Google Scholar] [CrossRef]
  13. Zhang, J.; Wagner, W.; Prakash, A.; Mehl, H.; Voigt, S. Detecting coal fires using remote sensing techniques. Int. J. Remote Sens. 2004, 25, 3193–3220. [Google Scholar] [CrossRef]
  14. Riyas, M.J.; Syed, T.H.; Kumar, H.; Kuenzer, C. Detecting and Analyzing the Evolution of Subsidence Due to Coal Fires in Jharia Coalfield, India Using Sentinel-1 SAR Data. Remote Sens. 2021, 13, 1521. [Google Scholar] [CrossRef]
  15. Yuan, G.; Wang, Y.; Zhao, F.; Wang, T.; Zhang, L.; Hao, M.; Yan, S.; Dang, L.; Peng, B. Accuracy assessment and scale effect investigation of UAV thermography for underground coal fire surface temperature monitoring. Int. J. Appl. Earth Obs. Geoinf. 2021, 102, 102426. [Google Scholar] [CrossRef]
  16. Liu, J.; Wang, Y.; Yan, S.; Zhao, F.; Li, Y.; Dang, L.; Liu, X.; Shao, Y.; Peng, B. Underground coal fire detection and monitoring based on Landsat-8 and Sentinel-1 data sets in Miquan fire area, XinJiang. Remote Sens. 2021, 13, 1141. [Google Scholar] [CrossRef]
  17. Wang, Y.; Yuan, G.; Wang, T.; Liu, J.; Zhao, F.; Feng, H.; Dang, L.; Peng, K.; Zhang, L. Research on Multi-Source Remote Sensing Detection of Concealed Fire Sources in Coalfields; Geomatics and Information Science of Wuhan University: Wuhan, China, 2022; pp. 1651–1661. [Google Scholar]
  18. Huo, H.; Jiang, X.; Song, X.; Li, Z.L.; Ni, Z.; Gao, C. Detection of coal fire dynamics and propagation direction from multi-temporal nighttime Landsat SWIR and TIR data: A case study on the Rujigou coalfield, Northwest (NW) China. Remote Sens. 2014, 6, 1234–1259. [Google Scholar] [CrossRef] [Green Version]
  19. Yan, S.; Shi, K.; Li, Y.; Liu, J.; Zhao, H. Integration of satellite remote sensing data in underground coal fire detection: A case study of the Fukang region, Xinjiang, China. Front. Earth Sci. 2020, 14, 1–12. [Google Scholar] [CrossRef]
  20. Wang, T.; Wang, Y.; Zhao, F.; Feng, H.; Liu, J.; Zhang, L.; Zhang, N.; Yuan, G.; Wang, D. A spatio-temporal temperature-based thresholding algorithm for underground coal fire detection with satellite thermal infrared and radar remote sensing. Int. J. Appl. Earth Obs. Geoinf. 2022, 110, 102805. [Google Scholar] [CrossRef]
  21. Mansor, S.B.; Cracknell, A.P.; Shilin, B.; Gornyi, V. Monitoring of underground coal fires using thermal infrared data. Int. J. Remote Sens. 1994, 15, 1675–1685. [Google Scholar] [CrossRef]
  22. Kuenzer, C.; Zhang, J.; Jing, L.; Huadong, G.; Dech, S. Thermal infrared remote sensing of surface and underground coal fires. In Thermal Infrared Remote Sensing: Sensors, Methods, Applications; Springer: Berlin/Heidelberg, Germany, 2013; pp. 429–451. [Google Scholar]
  23. Shao, Z.; Li, Y.; Deng, R.; Wang, D.; Zhong, X. Three-dimensional-imaging thermal surfaces of coal fires based on UAV thermal infrared data. Int. J. Remote Sens. 2021, 42, 672–692. [Google Scholar] [CrossRef]
  24. Gao, Y.; Hao, M.; Wang, Y.; Dang, L.; Guo, Y. Multi-scale coal fire detection based on an improved active contour model from Landsat-8 Satellite and UAV images. ISPRS Int. J. Geo-Inf. 2021, 10, 449. [Google Scholar] [CrossRef]
  25. Ferretti, A.; Prati, C.; Rocca, F. Permanent scatterers in SAR interferometry. IEEE Trans. Geosci. Remote Sens. 2001, 39, 8–20. [Google Scholar] [CrossRef]
  26. Berardino, P.; Fornaro, G.; Lanari, R.; Sansosti, E. A new algorithm for surface deformation monitoring based on small baseline differential SAR interferograms. IEEE Trans. Geosci. Remote Sens. 2002, 40, 2375–2383. [Google Scholar] [CrossRef] [Green Version]
  27. Polcari, M.; Montuori, A.; Bignami, C.; Moro, M.; Stramondo, S.; Tolomei, C. Using multi-band InSAR data for detecting local deformation phenomena induced by the 2016–2017 Central Italy seismic sequence. Remote Sens. Environ. 2017, 201, 234–242. [Google Scholar] [CrossRef]
  28. Camacho, A.G.; Fernández, J.; Samsonov, S.V.; Tiampo, K.F.; Palano, M. 3D multi-source model of elastic volcanic ground deformation. Earth Planet. Sci. Lett. 2020, 547, 116445. [Google Scholar] [CrossRef]
  29. Zhang, X.; Feng, M.; Zhang, H.; Wang, C.; Tang, Y.; Xu, J.; Yan, D.; Wang, C. Detecting Rock Glacier Displacement in the Central Himalayas Using Multi-Temporal InSAR. Remote Sens. 2021, 13, 4738. [Google Scholar] [CrossRef]
  30. Zhao, F.; Mallorqui, J.J.; Iglesias, R.; Gili, J.A.; Corominas, J. Landslide monitoring using multi-temporal SAR interferometry with advanced persistent scatterers identification methods and super high-spatial resolution TerraSAR-X images. Remote Sens. 2018, 10, 921. [Google Scholar] [CrossRef] [Green Version]
  31. Escayo, J.; Marzan, I.; Martí, D.; Tornos, F.; Farci, A.; Schimmel, M.; Carbonell, R.; Fernández, J. Radar Interferometry as a Monitoring Tool for an Active Mining Area Using Sentinel-1 C-Band Data, Case Study of Riotinto Mine. Remote Sens. 2022, 14, 3061. [Google Scholar] [CrossRef]
  32. Jiang, L.; Lin, H.; Ma, J.; Kong, B.; Wang, Y. Potential of small-baseline SAR interferometry for monitoring land subsidence related to underground coal fires: Wuda (Northern China) case study. Remote Sens. Environ. 2011, 115, 257–268. [Google Scholar] [CrossRef]
  33. Liu, J.; Wang, Y.; Li, Y.; Dang, L.; Liu, X.; Zhao, H.; Yan, S. Underground coal fires identification and monitoring using time-series InSAR with persistent and distributed scatterers: A case study of Miquan coal fire zone in Xinjiang, China. IEEE Access 2019, 7, 164492–164506. [Google Scholar] [CrossRef]
  34. Kai, P. Research on Surface Deformation Monitoring Using DS-InSAR in Fukang Coal fire Area, Xinjiang. Master’s Thesis, China University of Mining and Technology, Beijing, China, 2021. [Google Scholar]
  35. Chatterjee, R.; Thapa, S.; Singh, K.; Varunakumar, G.; Raju, E. Detecting, mapping and monitoring of land subsidence in Jharia Coalfield, Jharkhand, India by spaceborne differential interferometric SAR, GPS and precision levelling techniques. J. Earth Syst. Sci. 2015, 124, 1359–1376. [Google Scholar] [CrossRef] [Green Version]
  36. Ferretti, A.; Fumagalli, A.; Novali, F.; Prati, C.; Rocca, F.; Rucci, A. A new algorithm for processing interferometric data-stacks: SqueeSAR. IEEE Trans. Geosci. Remote Sens. 2011, 49, 3460–3470. [Google Scholar] [CrossRef]
  37. Zhao, F.; Mallorqui, J.J. SMF-POLOPT: An adaptive multitemporal pol (DIn) SAR filtering and phase optimization algorithm for PSI applications. IEEE Trans. Geosci. Remote Sens. 2019, 57, 7135–7147. [Google Scholar] [CrossRef]
  38. Zhao, F.; Mallorqui, J.J. Coherency matrix decomposition-based polarimetric persistent scatterer interferometry. IEEE Trans. Geosci. Remote Sens. 2019, 57, 7819–7831. [Google Scholar] [CrossRef] [Green Version]
  39. Zhao, F.; Wang, T.; Zhang, L.; Feng, H.; Yan, S.; Fan, H.; Xu, D.; Wang, Y. Polarimetric Persistent Scatterer Interferometry for Ground Deformation Monitoring with VV-VH Sentinel-1 Data. Remote Sens. 2022, 14, 309. [Google Scholar] [CrossRef]
  40. Yu, C.; Li, Z.; Penna, N.T. Interferometric synthetic aperture radar atmospheric correction using a GPS-based iterative tropospheric decomposition model. Remote Sens. Environ. 2018, 204, 109–121. [Google Scholar] [CrossRef]
  41. Bekaert, D.; Walters, R.; Wright, T.; Hooper, A.; Parker, D. Statistical comparison of InSAR tropospheric correction techniques. Remote Sens. Environ. 2015, 170, 40–47. [Google Scholar] [CrossRef] [Green Version]
  42. Shamshiri, R.; Motagh, M.; Nahavandchi, H.; Haghighi, M.H.; Hoseini, M. Improving tropospheric corrections on large-scale Sentinel-1 interferograms using a machine learning approach for integration with GNSS-derived zenith total delay (ZTD). Remote Sens. Environ. 2020, 239, 111608. [Google Scholar] [CrossRef]
  43. Dong, J.; Zhang, L.; Liao, M.; Gong, J. Improved correction of seasonal tropospheric delay in InSAR observations for landslide deformation monitoring. Remote Sens. Environ. 2019, 233, 111370. [Google Scholar] [CrossRef]
  44. González, P.J.; Tiampo, K.F.; Camacho, A.G.; Fernández, J. Shallow Flank Deformation at Cumbre Vieja Volcano (Canary Islands): Implications on the Stability of Steep-Sided Volcano Flanks at Oceanic Islands; Elsevier: Amsterdam, The Netherlands, 2010. [Google Scholar]
  45. Carmon, N.; Berk, A.; Bohn, N.; Brodrick, P.G.; Kalashnikova, O.; Nguyen, H.; Thompson, D.R.; Turmon, M. Unified Topographic and Atmospheric Correction for Remote Imaging Spectroscopy. Front. Remote Sens. 2022, 3, 916155. [Google Scholar] [CrossRef]
  46. Jolivet, R.; Agram, P.S.; Lin, N.Y.; Simons, M.; Doin, M.P.; Peltzer, G.; Li, Z. Improving InSAR geodesy using global atmospheric models. J. Geophys. Res. Solid Earth 2014, 119, 2324–2341. [Google Scholar] [CrossRef]
  47. Jolivet, R.; Grandin, R.; Lasserre, C.; Doin, M.P.; Peltzer, G. Systematic InSAR tropospheric phase delay corrections from global meteorological reanalysis data. Geophys. Res. Lett. 2011, 38. [Google Scholar] [CrossRef] [Green Version]
  48. Hu, Z.; Mallorqui, J.J. A direct method to estimate atmospheric phase delay for InSAR with global atmospheric models. In Proceedings of the IGARSS 2018-2018 IEEE International Geoscience and Remote Sensing Symposium, Valencia, Spain, 22–27 July 2018; IEEE: New York, NY, USA, 2018; pp. 2196–2199. [Google Scholar]
  49. Hu, Z. Atmospheric Artifacts Correction for InSAR Using Empirical Model and nUmerical Weather Prediction Models; Universitat Politècnica de Catalunya: Barcelona, Spain, 2019. [Google Scholar]
  50. Hu, Z.; Mallorquí, J.J. An accurate method to correct atmospheric phase delay for insar with the era5 global atmospheric model. Remote Sens. 2019, 11, 1969. [Google Scholar] [CrossRef] [Green Version]
  51. Fernández, J.; Escayo, J.; Hu, Z.; Camacho, A.G.; Samsonov, S.V.; Prieto, J.F.; Tiampo, K.F.; Palano, M.; Mallorquí, J.J.; Ancochea, E. Detection of volcanic unrest onset in La Palma, Canary Islands, evolution and implications. Sci. Rep. 2021, 11, 2540. [Google Scholar] [CrossRef]
  52. Fernández, J.; Escayo, J.; Camacho, A.G.; Palano, M.; Prieto, J.F.; Hu, Z.; Samsonov, S.V.; Tiampo, K.F.; Ancochea, E. Shallow magmatic intrusion evolution below La Palma before and during the 2021 eruption. Sci. Rep. 2022, 12, 20257. [Google Scholar] [CrossRef]
  53. Hersbach, H. The ERA5 Atmospheric Reanalysis. In Proceedings of the AGU fall Meeting Abstracts, Francisco, CA, USA, 12–16 December 2016; Volume 2016, p. NG33D–01. [Google Scholar]
  54. Hersbach, H.; Bell, B.; Berrisford, P.; Hirahara, S.; Horányi, A.; Muñoz-Sabater, J.; Nicolas, J.; Peubey, C.; Radu, R.; Schepers, D.; et al. The ERA5 global reanalysis. Q. J. R. Meteorol. Soc. 2020, 146, 1999–2049. [Google Scholar] [CrossRef]
  55. Xiao, R.; Yu, C.; Li, Z.; He, X. Statistical assessment metrics for InSAR atmospheric correction: Applications to generic atmospheric correction online service for InSAR (GACOS) in Eastern China. Int. J. Appl. Earth Obs. Geoinf. 2021, 96, 102289. [Google Scholar] [CrossRef]
  56. Smith, E.K.; Weintraub, S. The constants in the equation for atmospheric refractive index at radio frequencies. Proc. IRE 1953, 41, 1035–1037. [Google Scholar] [CrossRef] [Green Version]
  57. Sandwell, D.T.; Price, E.J. Phase gradient approach to stacking interferograms. J. Geophys. Res. Solid Earth 1998, 103, 30183–30204. [Google Scholar] [CrossRef] [Green Version]
  58. Li, Z. Locating the Small 1999 Frenchman Flat, Nevada Earthquake with InSAR Stacking. J. Geod. Geoinf. Sci. 2022, 5, 39. [Google Scholar]
  59. Zhang, L.; Dai, K.; Deng, J.; Ge, D.; Liang, R.; Li, W.; Xu, Q. Identifying potential landslides by stacking-InSAR in southwestern China and its performance comparison with SBAS-InSAR. Remote Sens. 2021, 13, 3662. [Google Scholar] [CrossRef]
  60. Kang, Y.; Zhao, C.; Zhang, Q.; Lu, Z.; Li, B. Application of InSAR techniques to an analysis of the Guanling landslide. Remote Sens. 2017, 9, 1046. [Google Scholar] [CrossRef] [Green Version]
  61. Xu, Y.; Li, T.; Tang, X.; Zhang, X.; Fan, H.; Wang, Y. Research on the Applicability of DInSAR, Stacking-InSAR and SBAS-InSAR for Mining Region Subsidence Detection in the Datong Coalfield. Remote Sens. 2022, 14, 3314. [Google Scholar] [CrossRef]
  62. Xiao, R.; Yu, C.; Li, Z.; Song, C.; He, X. General Survey of Large-scale Land Subsidence by GACOS-Corrected InSAR Stacking: Case Study in North China Plain. Proc. Int. Assoc. Hydrol. Sci. 2020, 382, 213–218. [Google Scholar] [CrossRef] [Green Version]
  63. Zhao, F.; Mallorqui, J.J. A temporal phase coherence estimation algorithm and its application on DInSAR pixel selection. IEEE Trans. Geosci. Remote Sens. 2019, 57, 8350–8361. [Google Scholar] [CrossRef] [Green Version]
  64. Ge, D. Research on the Key Techniques of SAR Interferometry for Reg ional Land Subsidence Monitoring; China University of Geosciences Beijing: Beijing, China, 2013. [Google Scholar]
  65. Murray, K.D.; Bekaert, D.P.; Lohman, R.B. Tropospheric corrections for InSAR: Statistical assessments and applications to the Central United States and Mexico. Remote Sens. Environ. 2019, 232, 111326. [Google Scholar] [CrossRef]
  66. Wang, Q.; Yu, W.; Xu, B.; Wei, G. Assessing the use of GACOS products for SBAS-INSAR deformation monitoring: A case in Southern California. Sensors 2019, 19, 3894. [Google Scholar] [CrossRef]
  67. Yang, J. Study on Mining Subsidence Law of Whole Basin in Shilawusu Mine Based on InSAR Technology. Master’s Thesis, China University of Mining and Technology, Beijing, China, 2021. [Google Scholar]
Figure 1. Sketch map of the study area. (a) Shows the geographical location of study area, (b) is optical image and (c) is DEM over the study area derived from SRTM data. The red box indicates the detection range of ground deformation in (b,c). The red triangles in (c) represent the detected coal fire points.
Remotesensing 15 01444 g001
Figure 2. Temporal and perpendicular baseline distribution of the acquisitions used in this study. Plus symbols represent the acquisitions and red lines denote the interferometric pairs used to form interferograms. The perpendicular baseline was set to be within 150 m, and the maximum temporal baseline was 144 days.
Remotesensing 15 01444 g002
Figure 3. Data processing flowchart of adaptive ERA5-Corrected Stacking-InSAR.
Remotesensing 15 01444 g003
Figure 4. Atmospheric phase screen (APS) estimated by D-LOS model using ERA5. (ak) Shows the estimation of APS by D-LOS model for some interferograms showing the maximum and minimum values obtained.
Remotesensing 15 01444 g004
Figure 5. Phase standard deviation of original interferogram and ERA5 residual interferogram. The light green bar represents the Original−Residual/Original rate of phase standard deviation change. The positive value represents the decrease in standard deviation.
Remotesensing 15 01444 g005
Figure 6. Phase comparison between original interferograms and ERA5 residual interferograms after TPC selection. (a,c,e,g) represents the original interferogram of 20190527–20190608, 20190608–20190620, 20190726–20190807 and 20200403–20200415, respectively. (b,d,f,h) represents the interferogram with residual phase after atmospheric correction of corresponding time, respectively.
Remotesensing 15 01444 g006
Figure 7. Unwrapped phase-elevation scatter plots for original phase and ERA5 residual phase. (a,c,e,g) represents the original phase-elevation of 20190527–20190608, 20190608–20190620, 20190726–20190807 and 20200403–20200415, respectively. (b,d,f,h) represents the residual phase-elevation of corresponding time, respectively.
Remotesensing 15 01444 g007
Figure 8. (a,c) show the original and residual phase, respectively, of the interferogram 20190924–20191006. (b,d) show the distribution relationship between the corresponding phase and elevation, respectively.
Remotesensing 15 01444 g008
Figure 9. Deformation monitoring results. (ad) are the deformation monitoring results of Original Stacking-InSAR, Original ERA5-Corrected Stacking-InSAR, Effective ERA5-Corrected Stacking-InSAR and Adaptive ERA5-Corrected Stacking-InSAR, respectively. (eh) are the areas in the red boxes of (a) corresponding to the magnification of the results of (ad). The black boxes in (a) indicate the three main coal fire deformation areas over the study area.
Remotesensing 15 01444 g009
Figure 10. Standard deviation of the LOS velocity. (ad) are the results of Original Stacking-InSAR, Original ERA5-Corrected Stacking-InSAR, Effective ERA5-Corrected Stacking-InSAR and adaptive ERA5-Corrected Stacking-InSAR, respectively. (eh) are the areas in the red boxes of (a) corresponding to the magnification of the results of (ad).
Remotesensing 15 01444 g010
Figure 11. The results of GACOS-Corrected Stacking-InSAR. (a) is deformation monitoring result and (b) is standard deviation of the LOS velocity. The black boxes in (a) indicate the three main coal fire deformation areas over the study area.
Remotesensing 15 01444 g011
Figure 12. Areas with abnormal ground deformation. (ad) are the divided results of Original Stacking-InSAR, Original ERA5-Corrected Stacking-InSAR, Effective ERA5-Corrected Stacking-InSAR and adaptive ERA5-Corrected Stacking-InSAR, respectively.
Remotesensing 15 01444 g012
Table 1. Statistics using D-LOS mitigation model for 57 interferograms in study area. Correction percentage is calculated by the following equation: (Original−Residual)/Original.
ifg.ReferenceSecondaryPhase SDCorrection Percentage/%
OriginalERA5 Residual
13 May 201915 May 20190.71970.819−13.80
23 May 201927 May 20191.08750.868720.12
33 May 20198 June 20191.54880.966237.62
415 May 201927 May 20190.90270.741517.86
515 May 20198 June 20191.65381.044836.82
615 May 201920 June 20191.41491.214114.19
727 May 20198 June 20192.14561.015252.69
827 May 201920 June 20190.93511.1429−22.22
927 May 20192 July 20191.67911.459813.06
108 June 201920 June 20192.74580.996363.72
..................
172 July 201926 July 20191.81971.306628.20
..................
2126 July 20197 August 20191.63251.51317.32
..................
3324 September 20196 October 20190.66331.0748−62.04
..................
523 April 202015 April 20201.81750.709560.96
533 April 202027 April 20200.73911.3078−76.94
543 April 20209 May 20200.72810.9989−37.20
5515 April 202027 April 20202.07431.48328.50
5615 April 20209 May 20202.12821.293939.20
5727 April 20209 May 20200.67430.896−32.87
Mean 1.43051.235913.60
Table 2. Statistics on the mean values of standard deviations in the three main coal fire deformation areas.
Deformation Area
Deformation Area
Deformation Area
Original Stacking-InSAR2.07641.89432.9254
ERA5-Corrected Stacking-InSAROriginal ERA5-Corrected1.56971.43911.8363
Effective ERA5-Corrected2.08691.78742.1903
Adaptive ERA5-Corrected1.51011.42201.6294
GACOS-Corrected Stacking-InSAR1.52141.44071.8645
Table 3. Statistics on the effectiveness of Stacking-InSAR results in identifying fire areas.
Area of Abnormal
Deformation/m²
Coincidence
Area/m²
Validity/%
Original Stacking-InSAR61,182,730.541,810,926.1752.96
ERA5-Corrected Stacking-InSAROriginal ERA5-Corrected60,468,157.061,819,869.3883.01 (1.6)
Effective ERA5-Corrected59,531,085.592,493,108.8734.19 (41.5)
Adaptive ERA5-Corrected55,993,651.42,424,075.2544.33 (46.3)
Disclaimer/Publisher’s Note: The statements, opinions and data contained in all publications are solely those of the individual author(s) and contributor(s) and not of MDPI and/or the editor(s). MDPI and/or the editor(s) disclaim responsibility for any injury to people or property resulting from any ideas, methods, instructions or products referred to in the content.

