1. Introduction
Global warming and the increased frequency of extreme climate events have led to frequent water shortages in many areas in recent years caused by large-scale drought events [
1,
2,
3,
4]. The spatial and temporal distribution of precipitation in China is uneven [
5]. The Loess Plateau is an important area for western development in China, especially in northwestern China. Affected by severe climate change, extreme drought events have occurred frequently in recent years [
6,
7]. There are four main types of drought events; generally speaking, the study of meteorological drought and hydrological drought is worthwhile [
8,
9]. The primary cause of meteorological drought is a lack of precipitation. When meteorological drought lasts for a certain time and reaches a certain severity where the precipitation is insufficient to allow the soil water content to reach saturation and produce surface runoff, this is defined as hydrological drought [
10,
11,
12]. The standardized precipitation index (SPI) is recommended by the World Meteorological Organization (WMO). Liu et al. [
13] applied the standardized precipitation evapotranspiration index (SPEI) to the Tibetan Plateau (TP) region, which is sensitive to climate change.
Different types of drought characteristics can be obtained using “Run theory,” which is widely used by researchers at home and abroad [
14,
15]. There are complex correlations between different drought characteristics; however, correlation coefficients are limited by a particular distribution function and thus lack universality. Meanwhile, the Copula function is suitable for any distribution function, which can construct the joint distribution function between different drought characteristics through the marginal distribution functions of different drought characteristics as well as the joint frequency distributions and the joint recurrence period [
16,
17,
18]. Maryam Dehghannik et al. used the Copula function to establish a linear relationship between the meteorological drought and hydrological drought characteristics and thereby predict the characteristics of drought [
19]. The propagation of meteorological drought and hydrological drought is influenced by many factors. The existing research results show that the most significant influencing factors are precipitation amount, land use, vegetation coverage, human activity changes, and other factors [
20,
21,
22]. Since the 1990s, in the Loess Plateau, measures such as the return of farmland to forest, urbanization construction, and water and soil conservation project implementation have intensified, and this has affected the dynamics of surface runoff in the basin, thereby leading to the increase in hydrological drought events in the basin.
Global circulation models (GCMs) can predict future climate characteristics at different emission levels, and these models also have a universal applicability [
23]. However, due to the low resolution of the climate model data, error and uncertainty are present. Generally, the statistical downscaling simulation model (SDSM) is used to decrease the error and can improve the model’s applicability and simulation accuracy [
24]. Chen et al. evaluated the potential impacts of climate change integrated with land use alteration on the evolution of future hydrological drought in the Luanhe River basin of China [
25].
The SWAT model is a semi-distributed hydrological model developed by the American Center for Agricultural Research. The model is widely used to simulate hydrological processes under the influence of climate change and human activities due to its relatively complete consideration of physical mechanisms [
26,
27].
The main purpose of this study was to evaluate the spatial and temporal evolution laws of the meteorological and hydrological drought characteristics in the JRB under climate change in the future. The research contents of this study include (i) to obtain the future spatial and temporal evolution of precipitation and runoff; (ii) to identify the meteorological and hydrological drought spatiotemporal evolution characteristics of the JRB under different future emission scenarios; (iii) to reveal the joint distribution of the meteorological and hydrological drought characteristics under different periods; (iv) and to explore the probabilities of different types of drought propagation events in the future for the JRB.
2. Materials and Methods
2.1. Study Area
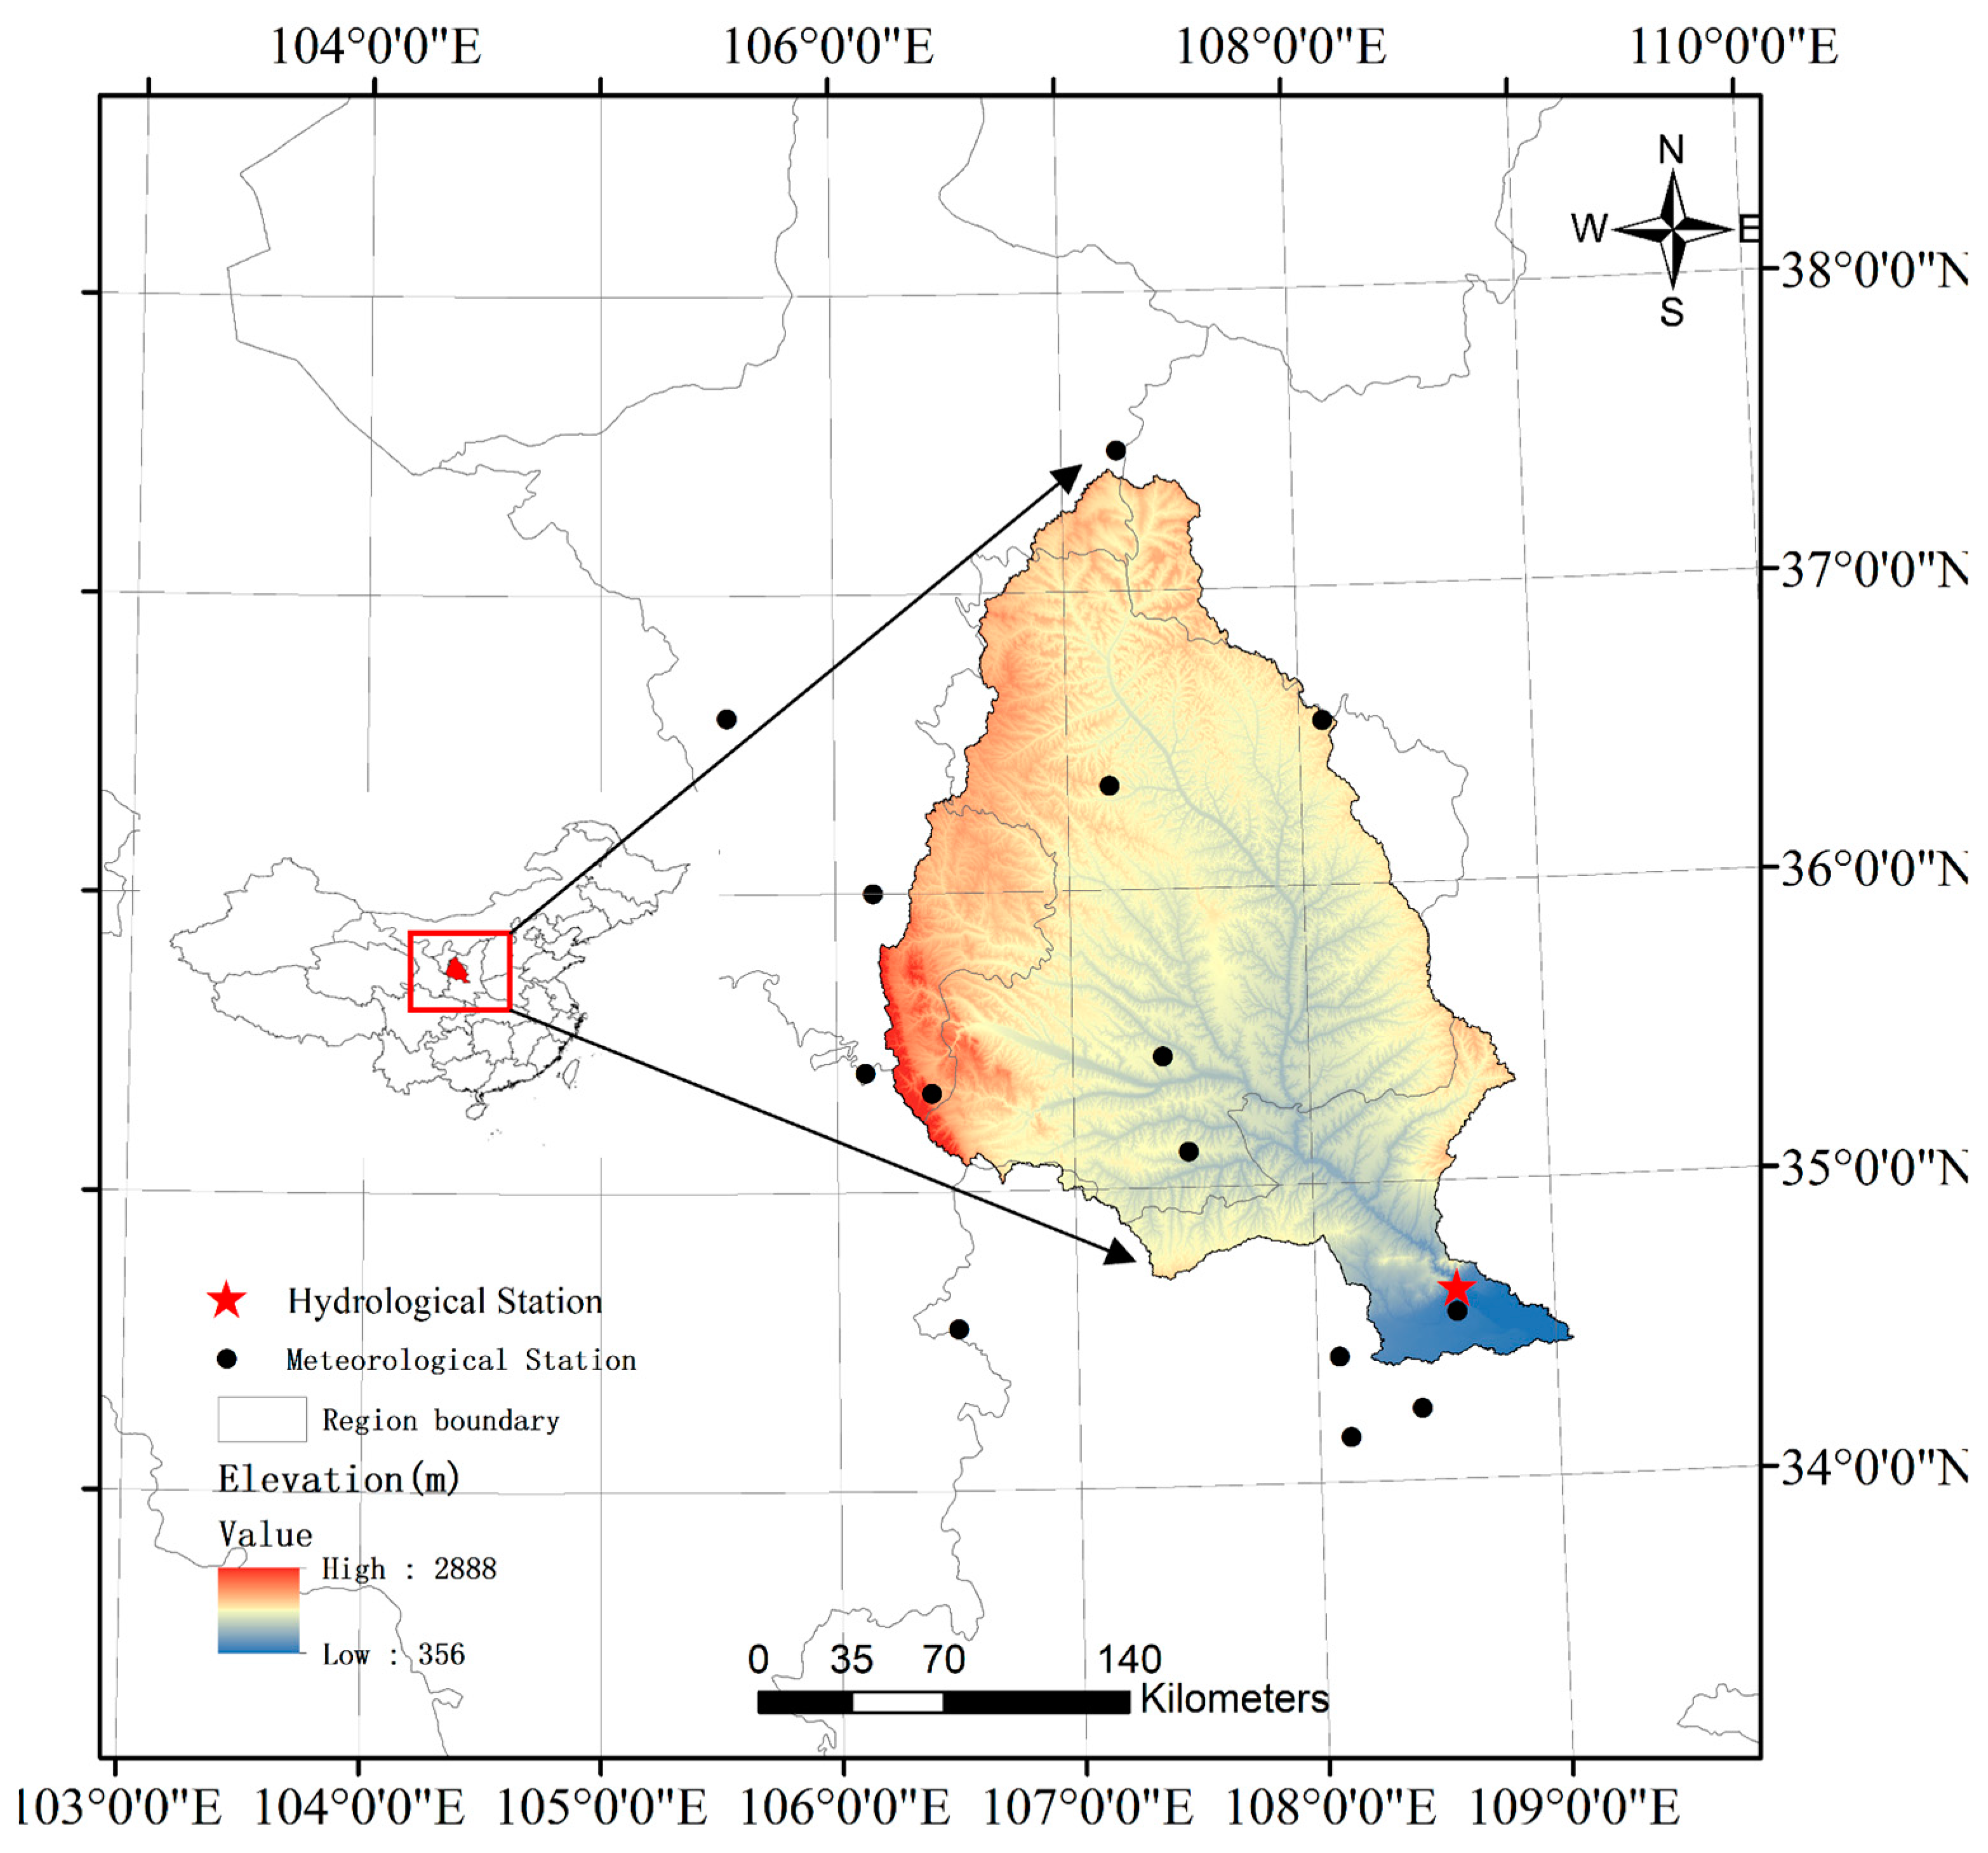
The Jinghe River Basin (north latitude 34°46′~37°19′, east longitude 106°14′~108°42′) is located in the middle of China’s Loess Plateau (
Figure 1), with a total area of 45,412 km
2. The river flows from northwest to southeast through Ningxia, Gansu, and Shanxi province. The Jinghe River Basin (JRB) has a typical temperate continental climate. The average annual temperature in the JRB ranges from 8 to 10 °C and the average annual precipitation ranges from 350 to 650 mm. Frequent droughts and the over-exploitation of water resources have caused severe water shortages in the JRB [
28]. A statistical analysis of the annual average climate factors of the JRB is shown in
Table 1.
2.2. Data Source
We obtained the daily rainfall, daily maximum temperature, daily minimum temperature, daily average wind speed, and sunshine hours from 14 weather stations in the Jinghe River Basin from 1990 to 2017. The input data used to drive the SWAT model included a 90 m resolution of digital elevation DEM data, a resolution of 1 km of land use data, and 1 km resolution of soil type data.
The monthly runoff observation data of the Zhangjiashan Hydrological Station from 1990 to 2017 were obtained from the National Earth System Science Data Center. The observed monthly runoff data from 1991 to 2005 was used to calibrate the SWAT model parameters, and data from 2006 to 2017 were used to verify the SWAT model parameters. This study used the GFDL-CM3 global climate model data in CMIP5 to analyze climate change in the future period (2021–2060) and considered two representative emission scenarios named RCP4.5 and RCP8.5. The SWAT model input data and hydrometeorological data are summarized in
Table 2. The GFDL-CM3 climate model data were simulated by the Geophysical hydrodynamics Laboratory of the National Oceanic and Atmospheric Administration, and the climate data fit well. Climate predictions were corrected for bias using the quantile mapping method (QM) [
29]. The IDW interpolation method was used to interpolate the meteorological drought characteristic value of each meteorological station of the JRB and the hydrological drought characteristic value of each sub basin to the grid point of
degree.
2.3. Methods
2.3.1. Mann–Kendall Trend Analysis
The Mann–Kendall (MK) method can effectively distinguish whether a process displays natural fluctuations or has a certain change trend [
30]. Because it is not disturbed by a few outliers, it is widely used in the time series trend analysis of hydrometeorological data. In this study, we use the MK trend detection method to characterize the evolution of the JRB standardized precipitation index (SPI) and the standardized runoff index (SRI) under different emission scenarios in historical and future periods.
The MK test statistic Z is generally used to identify the degree to which a trend is consistently decreasing or increasing [
31,
32]. Positive values of the Z statistic indicate upward trends over the whole time series, whereas negative values of the Z statistic indicate downward trends over the whole time series. In this study, α = 0.01, α = 0.05, and α = 0.1 significance levels were considered, and the corresponding values of Z
1−α/2 were 2.58, 1.96, and 1.64, respectively.
2.3.2. SDSM Method
The SDSM is a mixed method comprising multiple linear regression and a random weather generator [
33]. Multivariate linear regression (MLR) was used to establish the statistical relationship between the measured data of 14 meteorological stations from 1990 to 2018 and the predicted value of NECP (large-scale climate data) to generate the regression parameters and verify the observed data. Then, the data for two typical emission scenarios (RCP4.5 and RCP8.5) of the GFDL-CM3 global climate model were input into the constructed statistical model to predict the daily scale time series of the climate elements of the JRB meteorological stations in the future (2021–2060). The quantitative statistical function can be described as follows:
where
Y is the local predictor and
xi is the
ith large-scale atmospheric predictor. The precipitation determined by the SDSM through large-scale atmospheric variables is as follows:
where
ϕ is a constant cumulative distribution function and
F is an empirical distribution function of
.
2.3.3. The SWAT Model
An important sub-model of the SWAT model is the hydrologic process module. We used this sub-model to simulate the spatiotemporal evolution of the JRB runoff (RCP4.5, RCP8.5) in the period of 1990–2017 and a future period (2021–2060).
The constructed SWAT model divided the basin into 43 sub-basins with 1226 hydrological response units. The SUFI-2 algorithm was used in this study to rate determine the model parameters, and the rate-determined parameter results are shown in
Table 1. The monthly runoff data of the Zhangjiashan Hydrological Station of the JRB Exit Hydrological Station were used for verification.
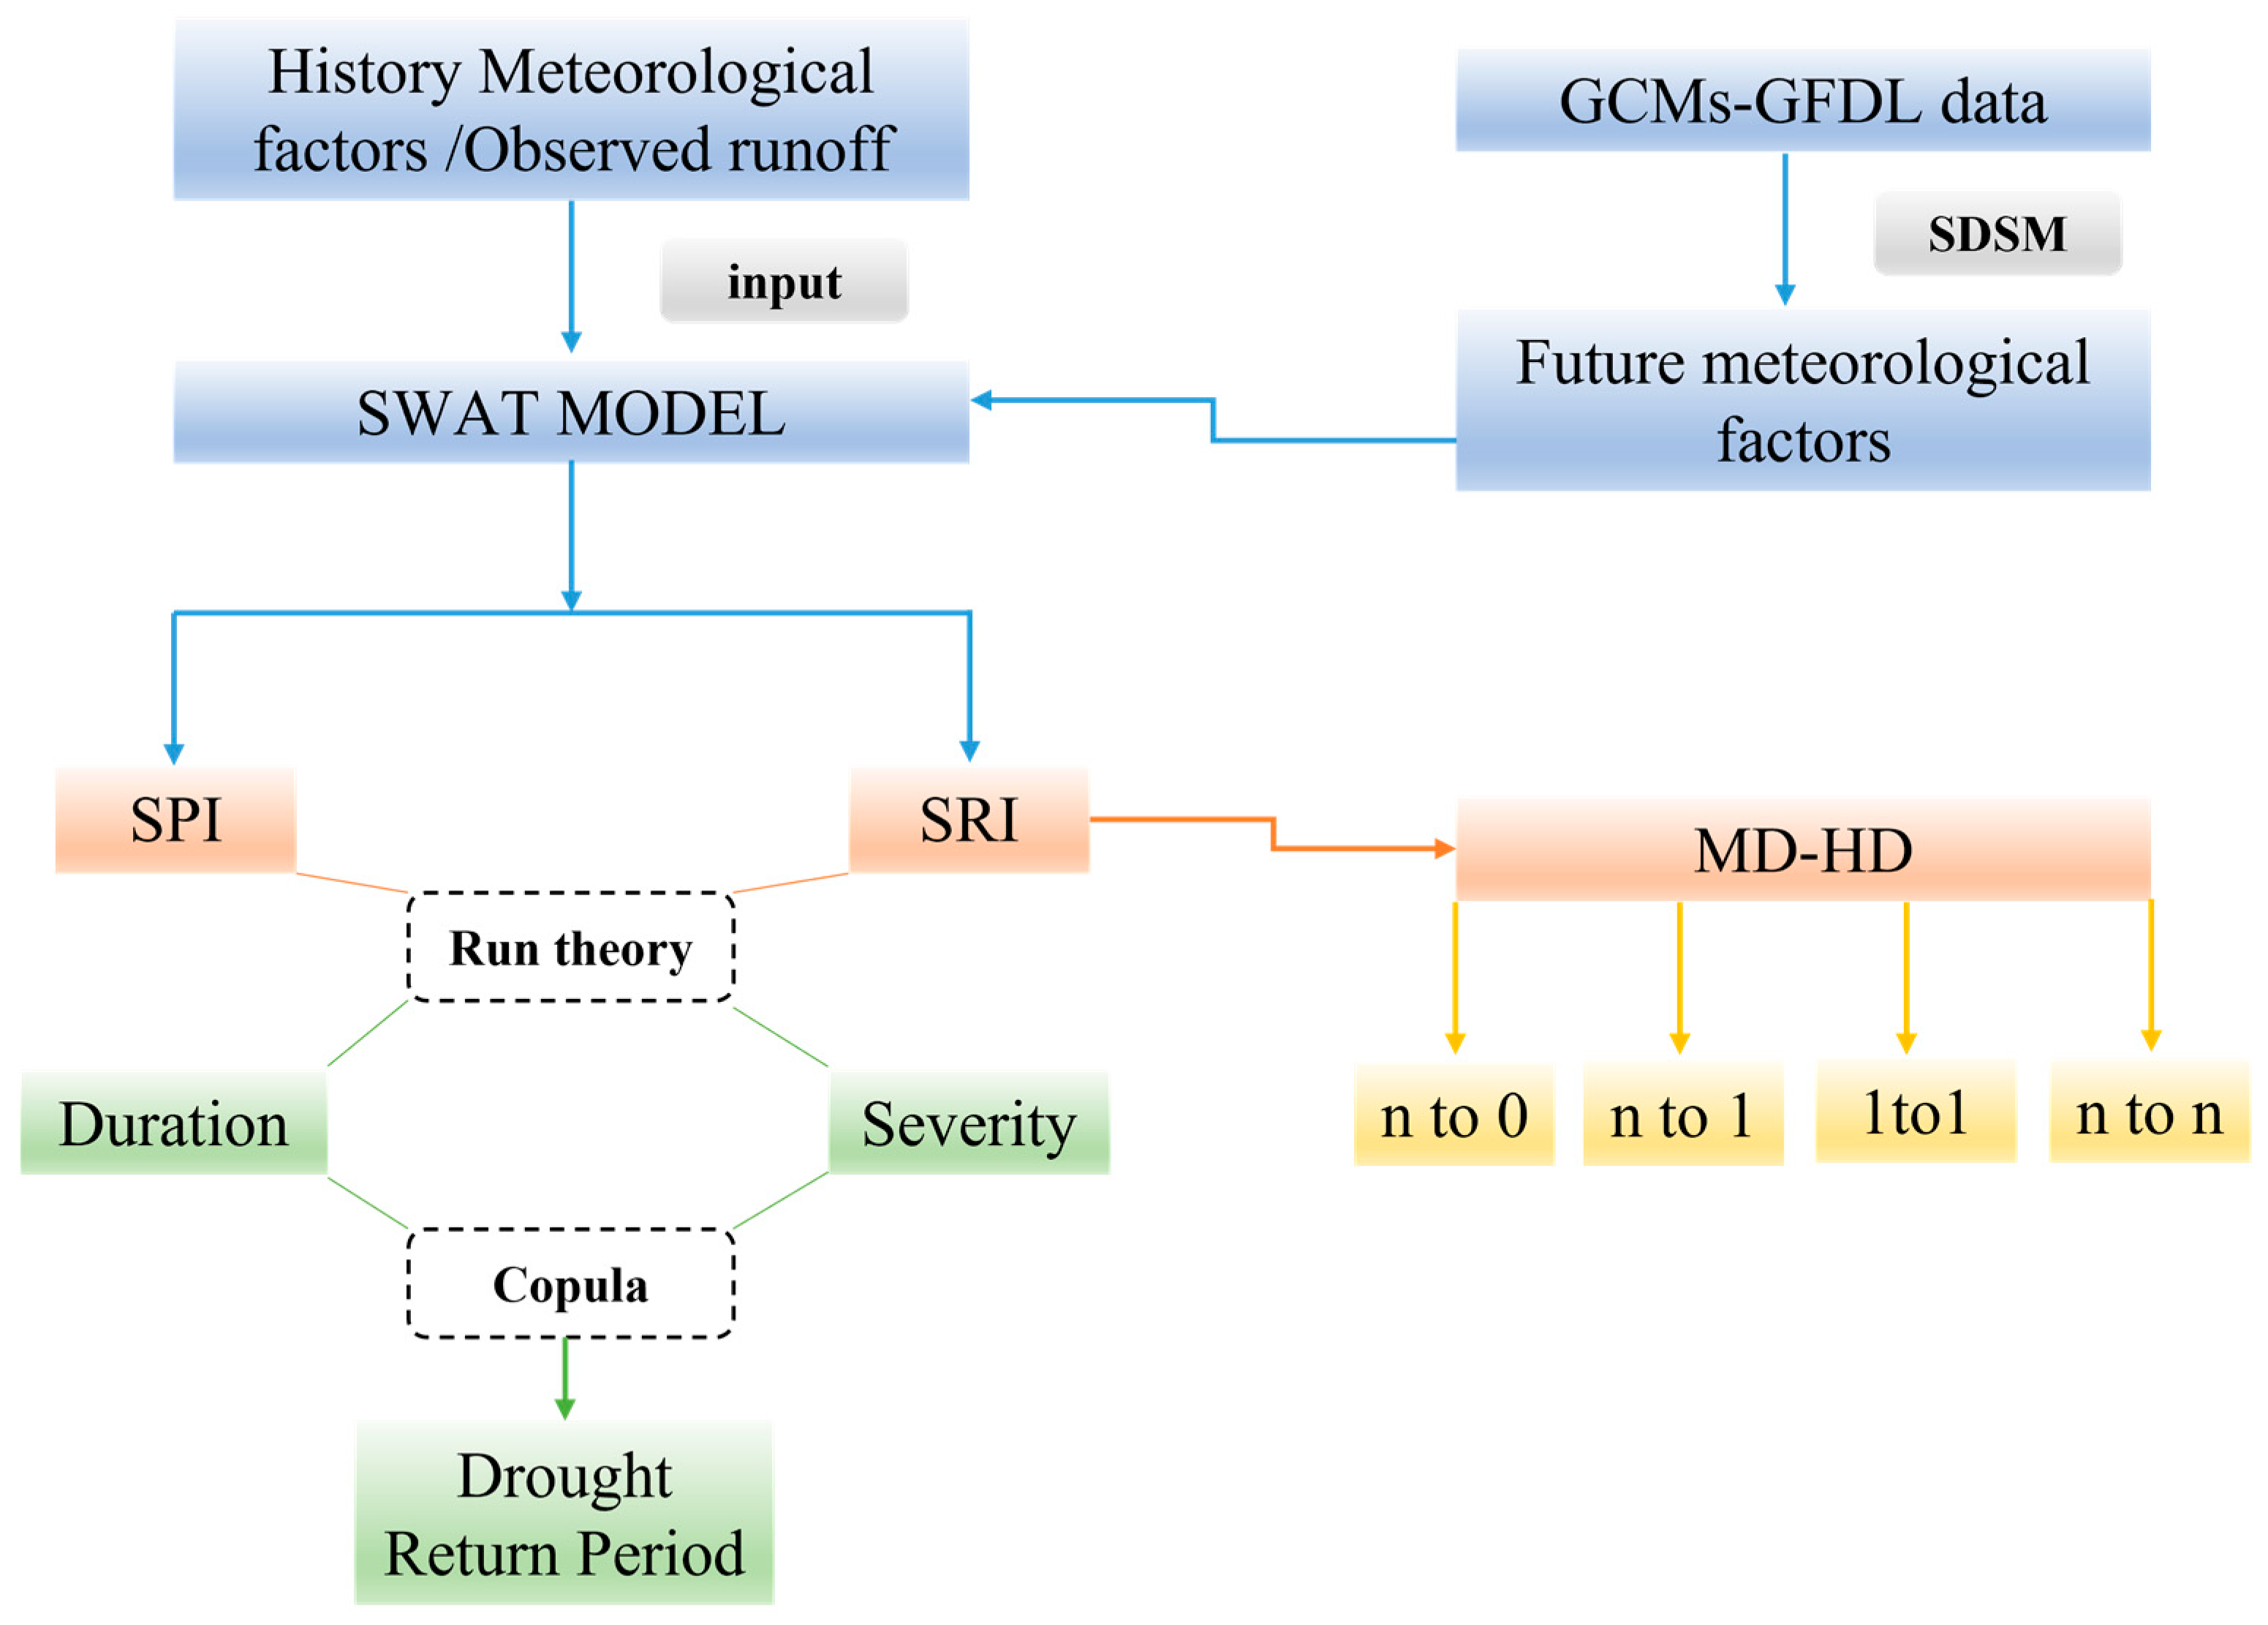
In order to reflect the main research content, we have drawn a flowchart (
Figure 2), which mainly illustrates the input datasets, methods, and output results of this study.
2.3.4. Drought Index
The standardized precipitation index (SPI) and the standardized runoff index (SRI) are used to describe the occurrence of meteorological and hydrological drought in the JRB. The SPI was proposed by McKee et al. It has been applied to meteorological and hydrological drought assessments globally [
34]. The calculation of the SPI includes 3 steps: (1) the accumulation of precipitation series according to a specific time scale (1, 3, and 12 months were used to represent the monthly, seasonal, and annual condition in this study); (2) the selection of optimal probability distribution to fit cumulative precipitation series; (3) and the transformation of the optimal probability distribution to a standard normal distribution. The calculation of the SRI is similar to the SPI. The Gamma distribution is confirmed to be the optimal choice for the SPI and the SRI calculation in most regions of the world [
35], so the Gamma distribution is applied to fit precipitation and runoff series in this study. The wetness/dryness levels of the SPI/SRI are ≥0.5, −0.5 to 0.5, −0.5 to −1.0, −1.5 to −1.0, −1.5 to −2.0, and ≤−2.0, which correspond to wet, normal, mild dry, moderate dry, severe dry, and extreme dry, respectively.
2.3.5. Run Theory
In this study, the run theory is applied to identify drought and derive drought characteristics based on the SPI/SRI with multiple time scales. The drought severity, duration, and intensity [
36,
37] are the most important features to characterize a drought event, with any two being adequate to depict a specific drought event [
38]. The drought duration and severity are selected to characterize drought events.
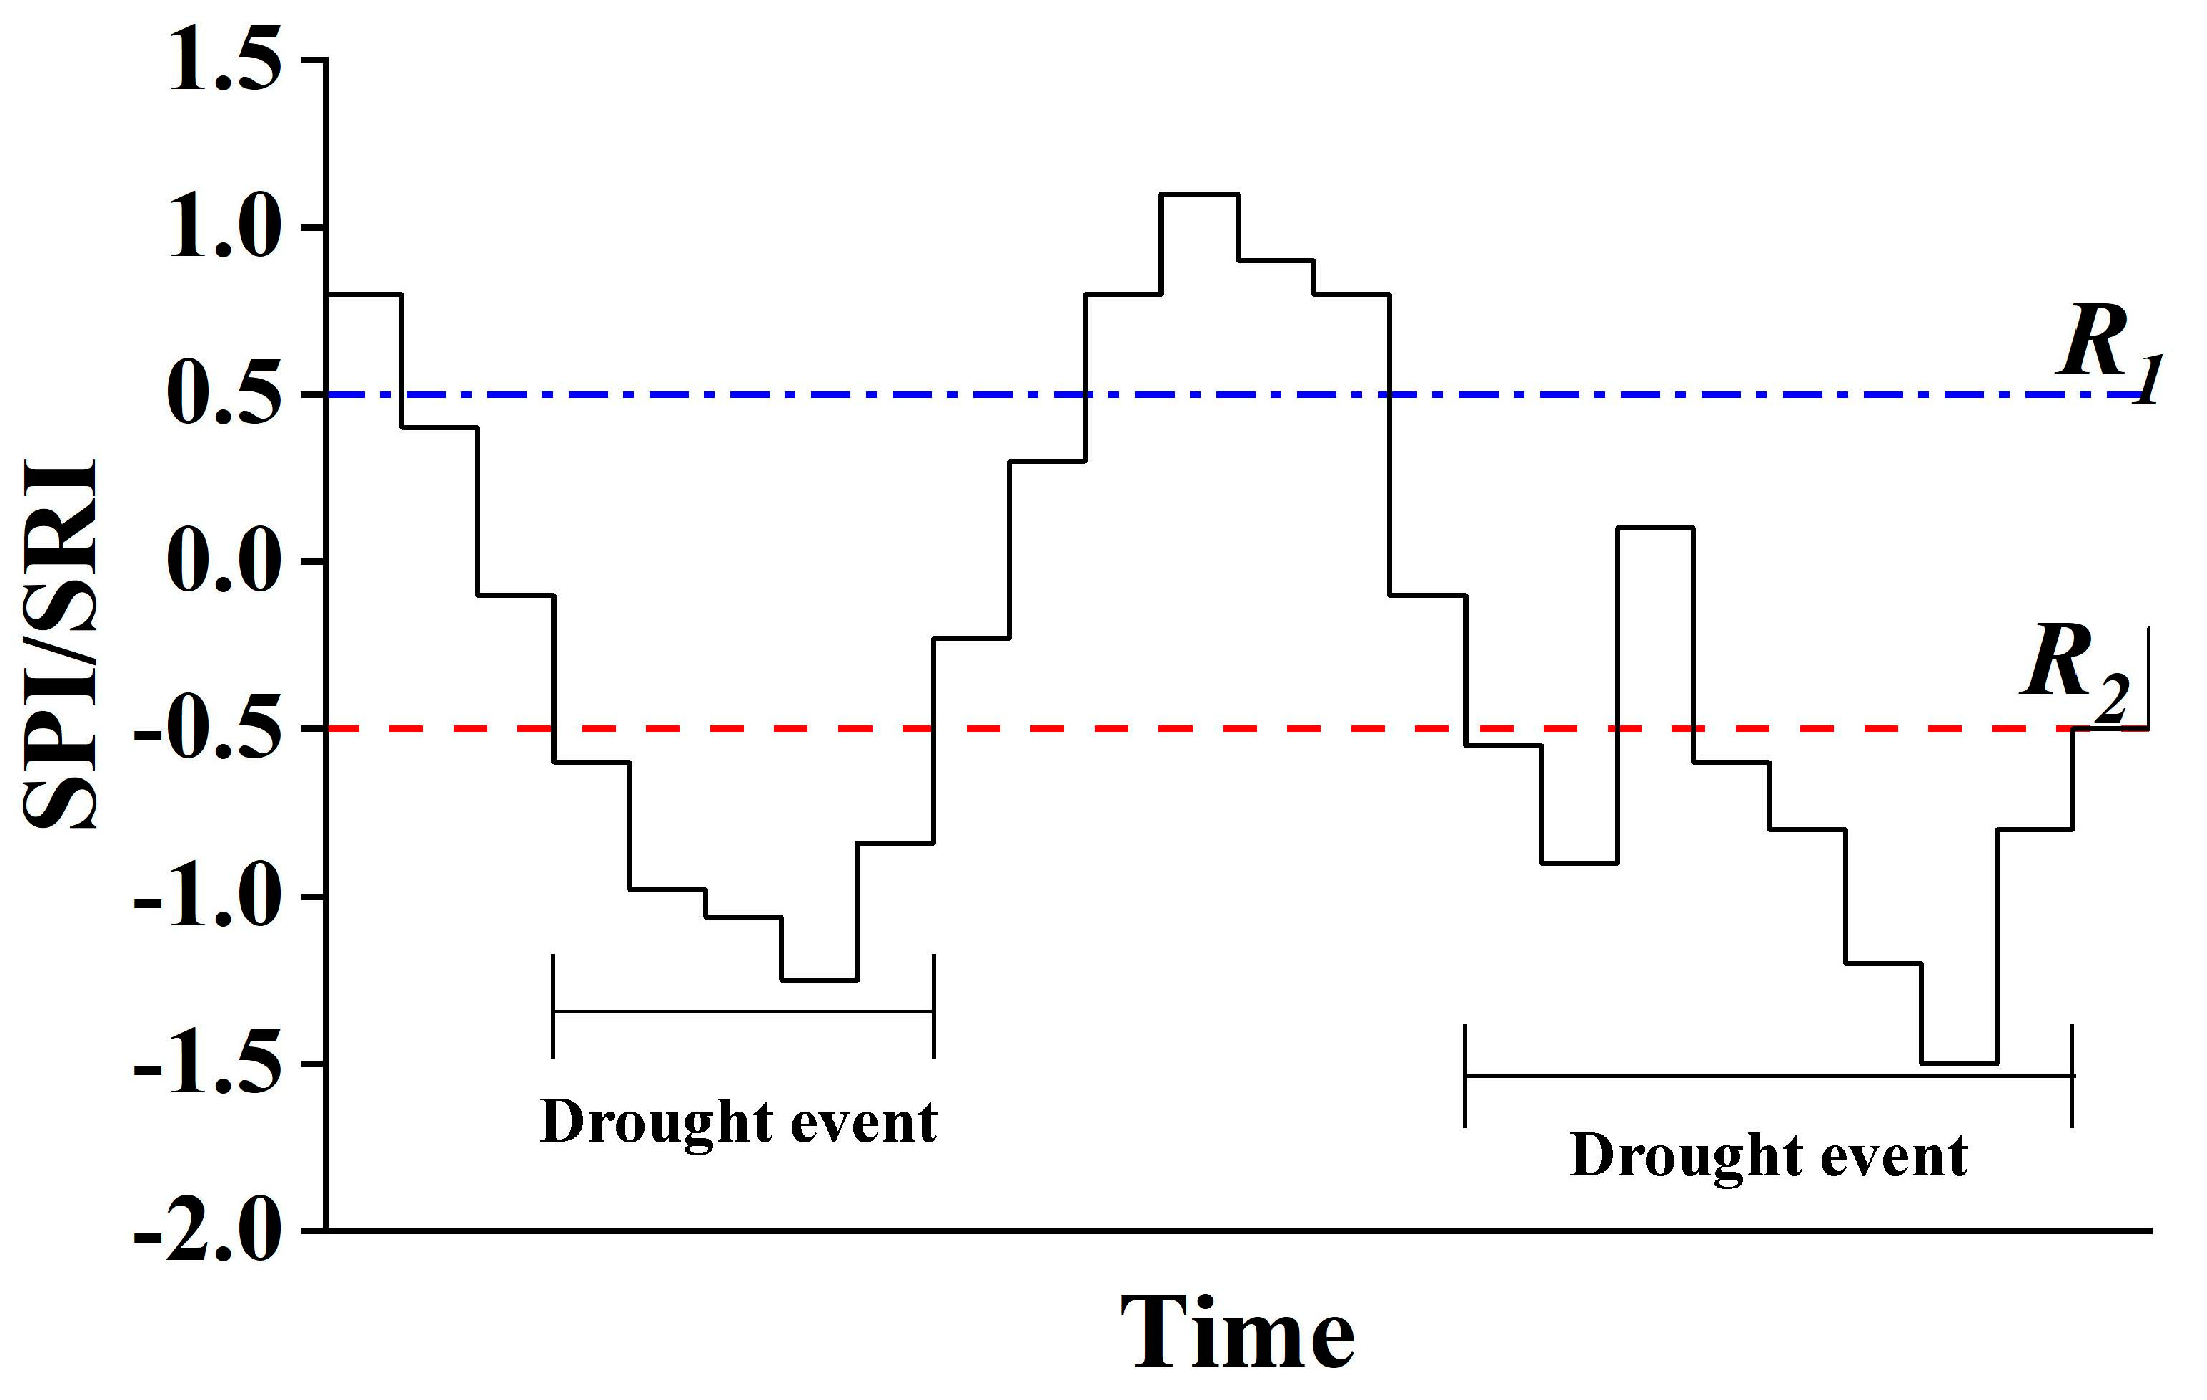
According to the dryness levels of the SPI/SRI, −0.5 (R
2) and 0.5 (R
1) are chosen as the thresholds to initially identify dry and wet periods, respectively. A prolonged drought event is often separated to a few mutually dependent droughts by short non-dry spells; hence, a pooling procedure is necessary to ensure the accuracy of the drought assessment. The steps of drought characterization are as follows (
Figure 3): (1) set threshold R
2 = −0.5 to capture drought events; (2) for 2 adjacent drought events, if the interval time between these 2 events is less than 1 month and the SPI/SRI in the inter-event process is less than 0.5 (R
1), the 2 adjacent drought events can be pooled to a new drought event; (3) and drought duration is defined as the period from the start to the end of a drought event and drought severity is defined as the cumulative value of difference between 0 and the drought index during a drought event [
39].
2.3.6. The Copula Function
Drought events have many characteristic properties such as duration, severity, and peak severity. However, it is difficult to comprehensively describe the characteristic properties of drought events only using single features. The Copula function can construct the joint distribution function for different drought characteristics. For the two-dimensional marginal distribution functions of
FX(x) and
FY(y), there is a two-dimensional Copula function
C:
In this study, we considered the duration and severity of meteorological and hydrological droughts; therefore, the drought univariate feature recurrence period can be expressed as:
where
represents the average interval between drought variables;
/
represents the recurrence period when the duration/severity of meteorological drought is greater than
d/s, and
/ represents the recurrence period when the duration/severity of hydrological drought is greater than
d/s.
/ is the cumulative probability distribution function of the duration/severity of the meteorological drought. Similarly,
/ is the cumulative probability distribution function of the hydrological drought duration/severity. In addition, the two bivariate combined recurrence periods “
” and “
” can be calculated from the following equation [
40]:
where
indicates the duration/severity cumulative probability distribution function of meteorological drought or hydrological drought, respectively, and
is the joint probability distribution function of the duration and the severity of meteorological drought or hydrological drought.
represents the combined recurrence period when the drought duration and severity simultaneously exceed specific values. Similarly,
indicates the joint recurrence period when the drought duration is higher than a particular value or when the drought severity is greater than a particular value.
2.3.7. Performance Evaluation Criteria
In order to evaluate the SWAT model in this study, the root mean square error (
RMSE), Nash–Sutcliffe efficiency coefficient (
NSE), and the coefficient of determination (
R2) were used to evaluate the model performance:
where
N represents the number of samples;
represents the observed data of variable i;
represents the simulated data of variable i; and
and
represent the average values of the observed and simulated data, respectively.
3. Results
3.1. GCM Simulation Assessment
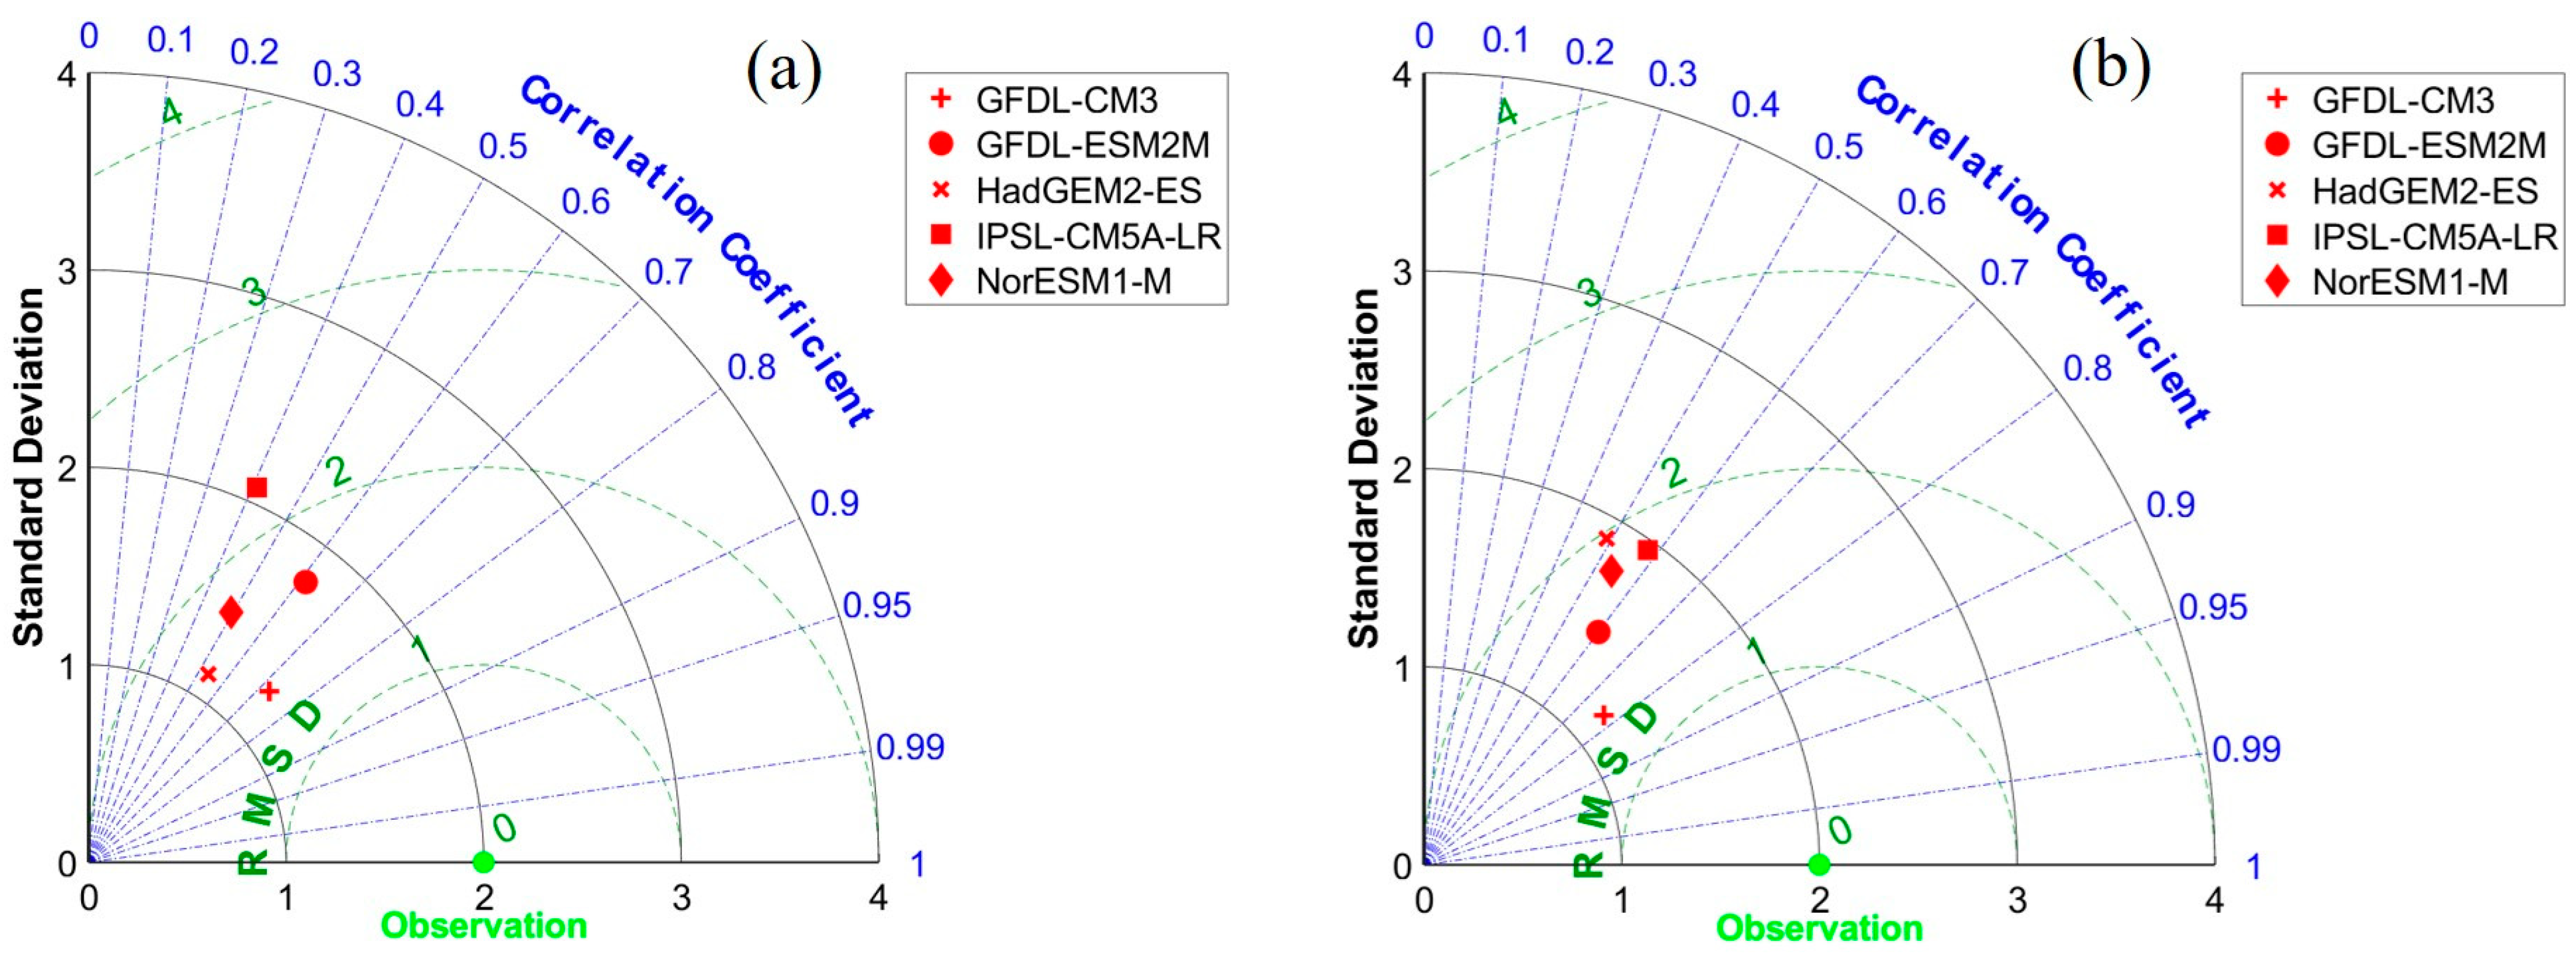
Different CMIP5 models shows different simulation performances for different climatic elements in different regions; therefore, five commonly used CMIP5 models were selected in this study for comparing and analyzing the simulation effects of different climate models under two RCPs on precipitation in the JRB (
Figure 4). the reasonableness of the model selection is comprehensively examined in terms of the correlation coefficient, ratio of standard deviation, and centralization root mean square error by using Taylor diagrams [
41].
The simulation shows that the GFDL-CM3 climate models are better than other climate models, with spatial correlation coefficients reaching nearly 0.8. In general, the simulation of precipitation under the RCP8.5 emission scenario is better than the RCP4.5 scenario.
The performance of the statistical downscaling model (SDSM) was evaluated by three elements: daily average precipitation, daily average maximum temperature, and daily average minimum temperature from the 14 weather stations. Accordingly, the performance of the downscaling model was evaluated using standard statistical methods (R2, RMSE, and NSE). The results shows that the atmospheric downscaling model had the highest simulation accuracy and could be used to simulate the drought characteristics under future climate change scenarios in the JRB.
3.2. Calibration and Validation of the SWAT Model
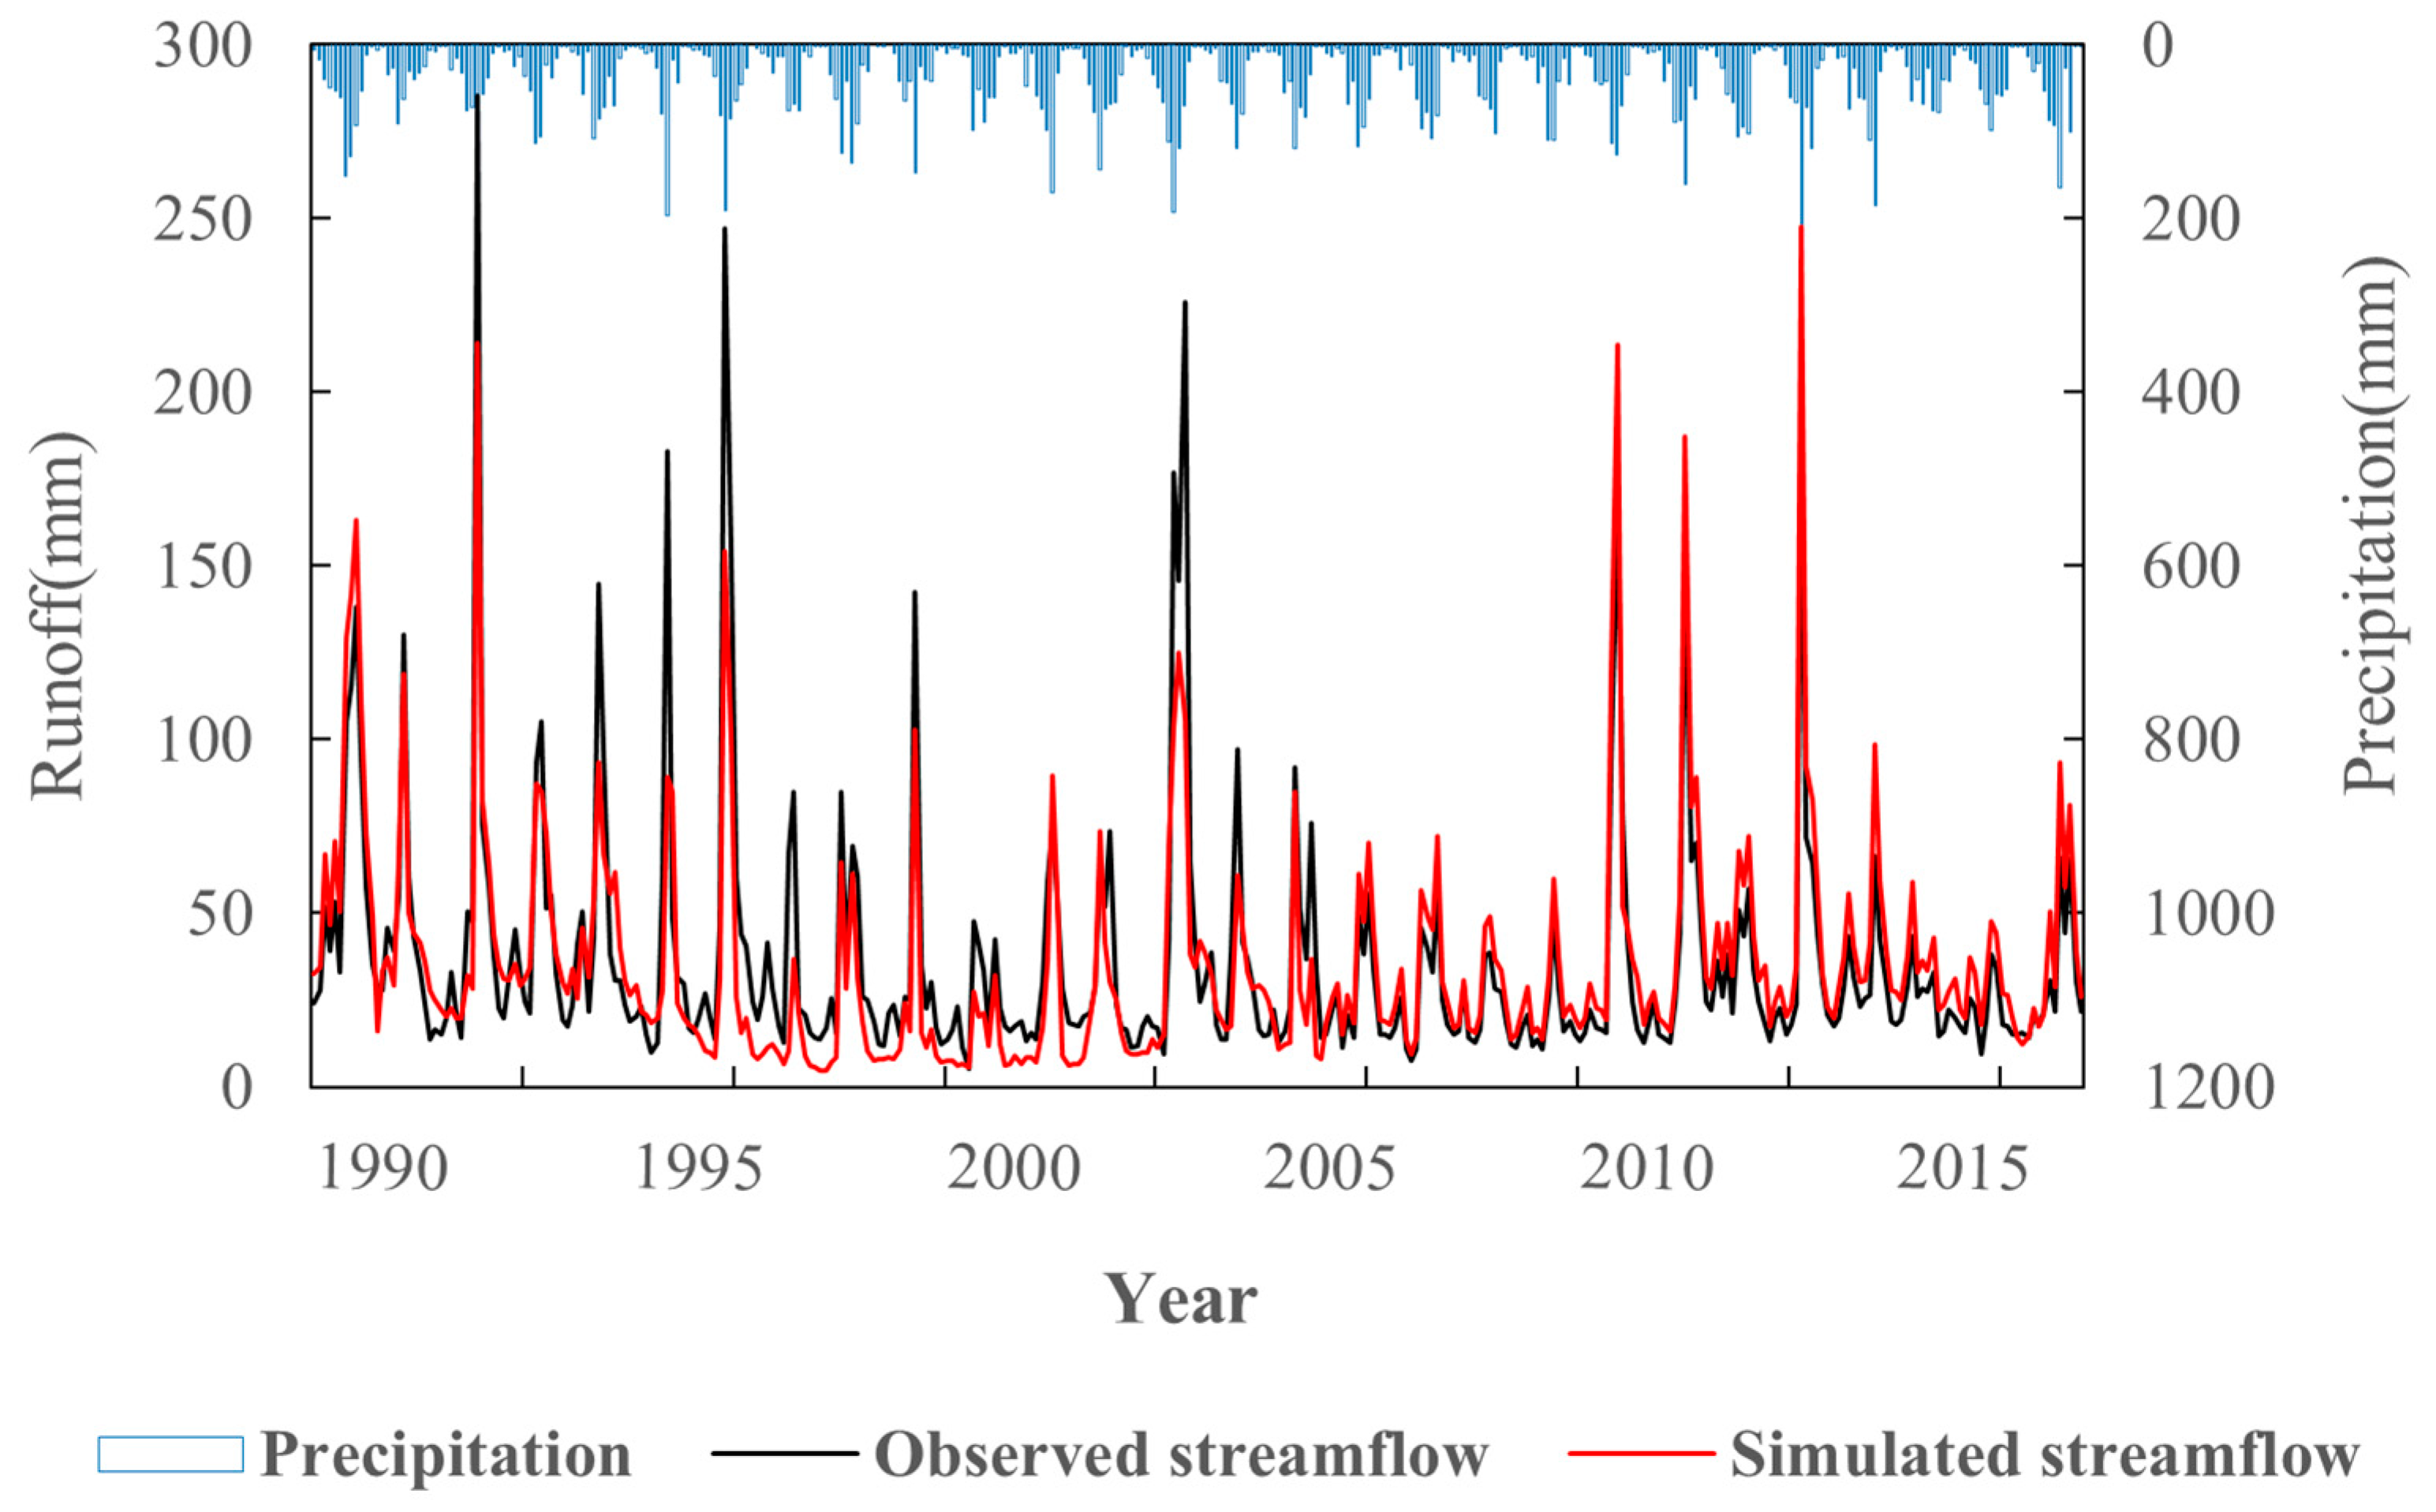
The SWAT model parameters were determined and verified according to the observed monthly flow data of Zhangjiashan Hydrological Station from 1990 to 2017. The year 1990 was the initial preheating period of the model operation. The Zhangjiashan Hydrological Station is the main outlet hydrographic station of the JRB and controls more than 95% of the total area of the basin. To reduce the impact of the initial conditions, the model considered the period from 1991 to 2005, and the model verification period was from 2006 to 2017. The uncertainty of the SWAT model parameters was analyzed by using the SUFI-2 method. R
2, NSE, and RMSE are usually used to evaluate the simulation accuracy and applicability of the model parameters. The optimized parameters for the SWAT model of the JRB are shown in
Table 3. The SWAT model simulates runoff from the actually observed runoff, and their relation to rainfall is shown in
Figure 5.
From the relationship between the precipitation data of 14 weather stations and the simulated runoff in Zhangjiashan, the simulated runoff was higher in the months with more precipitation, indicating that the runoff is correspondingly large under greater precipitation, and the two are positively related. In terms of the correspondence between precipitation and runoff, the 14 meteorological stations selected during the modeling process had a high spatial correspondence with the Zhangjiashan hydrological station (
Table 4). According to the results, the simulated runoff series and the observed runoff series were well-fitted, which indicated that the SWAT model constructed in this study accurately simulated the runoff process and could be adapted to the JRB and used in the next step.
3.3. Temporal and Spatial Evolution Characteristics of Meteorological Drought
3.3.1. Temporal Characteristics of MD
Figure 6 illustrates the changes in and trends of the standardized precipitation index (SPI) in the JRB under different scenario modes (RCP4.5 and RCP8.5) and different time scales. The analysis indicated that the SPI value of the JRB will be in a state of alternating drought and flooding in the future, with more complex periodic changes. Overall, the RCP4.5 scenario mode predicted more frequent drought at the monthly, seasonal, and yearly scales than the RCP8.5 scenario mode.
The changing trend of meteorological drought in different scenarios was clearly different, and the frequency of alternating drought and flooding at the monthly, seasonal, and annual scale decreased successively. On the monthly scale, the drought trend in the RCP8.5 scenario was more intense than that under the RCP4.5 scenario, and the drought trend reached a 0.05 significance level in 2024. It is interesting that the seasonal scale was similar to the monthly scale situation. However, on the annual scale, the RCP4.5 scenario was more arid than the RCP8.5 scenario. Especially after 2033, the overall drought trend under the RCP8.5 scenario would be eased, which basically showed a wetting trend. In contrast, the RCP4.5 scenario showed characteristic drought and flood alternation patterns, and the drought severity was more serious.
Combined with the changes in the M-K mutation curve, the different time scales of the JRB under the RCP8.5 scenario mode were basically from drought aggravation to drought mitigation, while the opposite was found under the RCP4.5 scenario. The mutation points were concentrated in 2030, 2032, and 2033. The simulation prediction results showed that the overall annual precipitation of JRB in the river basin increased after 2032 because the SPI value was directly affected by the amount of precipitation. Therefore, the trend of JRB wetting is consistent with the trend of precipitation changes. In addition, the spatiotemporal distribution of the SPI of the JRB varied in different time scales, and thus the drought trend mutation points were also different.
3.3.2. Spatial Drought Characteristics of MD
In order to reveal the spatial evolution characteristics of meteorological drought at different time scales under two different future scenarios (RCP4.5 and RCP8.5),
Figure 7a–f and
Figure 8a–f revealed the spatial evolution pattern of meteorological drought duration and drought severity in the future period (2021–2060). On the monthly scale, the meteorological drought duration of the JRB under RCP4.5 lasted between 2.78 and 3.35 months, with a drought severity of between 2.12 and 2.60. The duration and severity of meteorological drought under RCP8.5 are similar to that of RCP4.5. However, the area with a long drought duration and large severity under RCP4.5 is more extensive, and more obvious in the middle reaches of JRB, while under the RCP8.5 emission scenario, JRB is more prominent in the upstream Yanchi station.
On the seasonal scale, the JRB meteorological drought lasted between 4.52 and 5.63 in RCP4.5, and the drought severity was between 3.86 and 4.80, while the meteorological drought duration and severity were reduced in the RCP8.5 emission scenario. The difference is that the meteorological drought duration and severity of the JRB in the RCP8.5 emission scenario decreased northwest to southeast, while the meteorological drought duration and severity of the JRB under the RCP4.5 emission scenario are larger in the middle reaches.
On the annual scale, the JRB lasted between 9.79 and 19.14, and the drought severity was between 8.74 and 15.49. The meteorological drought under the RCP8.5 emission scenario lasted between 12.72 and 16.90 months, with a drought severity of between 9.62 and 13.26. However, under the RCP4.5 emission scenario, the overall drought duration and severity of the whole JRB river basin were large, mainly concentrated in the middle and upper reaches of the JRB. Interestingly, under the RCP8.5 emission scenario, the drought duration distribution was similar to that in the RCP4.5 emission scenario, but the large values of the drought severity were concentrated at the Yanchi meteorological station point upstream of the JRB.
3.4. Temporal and Spatial Evolution Characteristics of Hydrological Drought
3.4.1. Temporal Drought Characteristics Evolution of HD
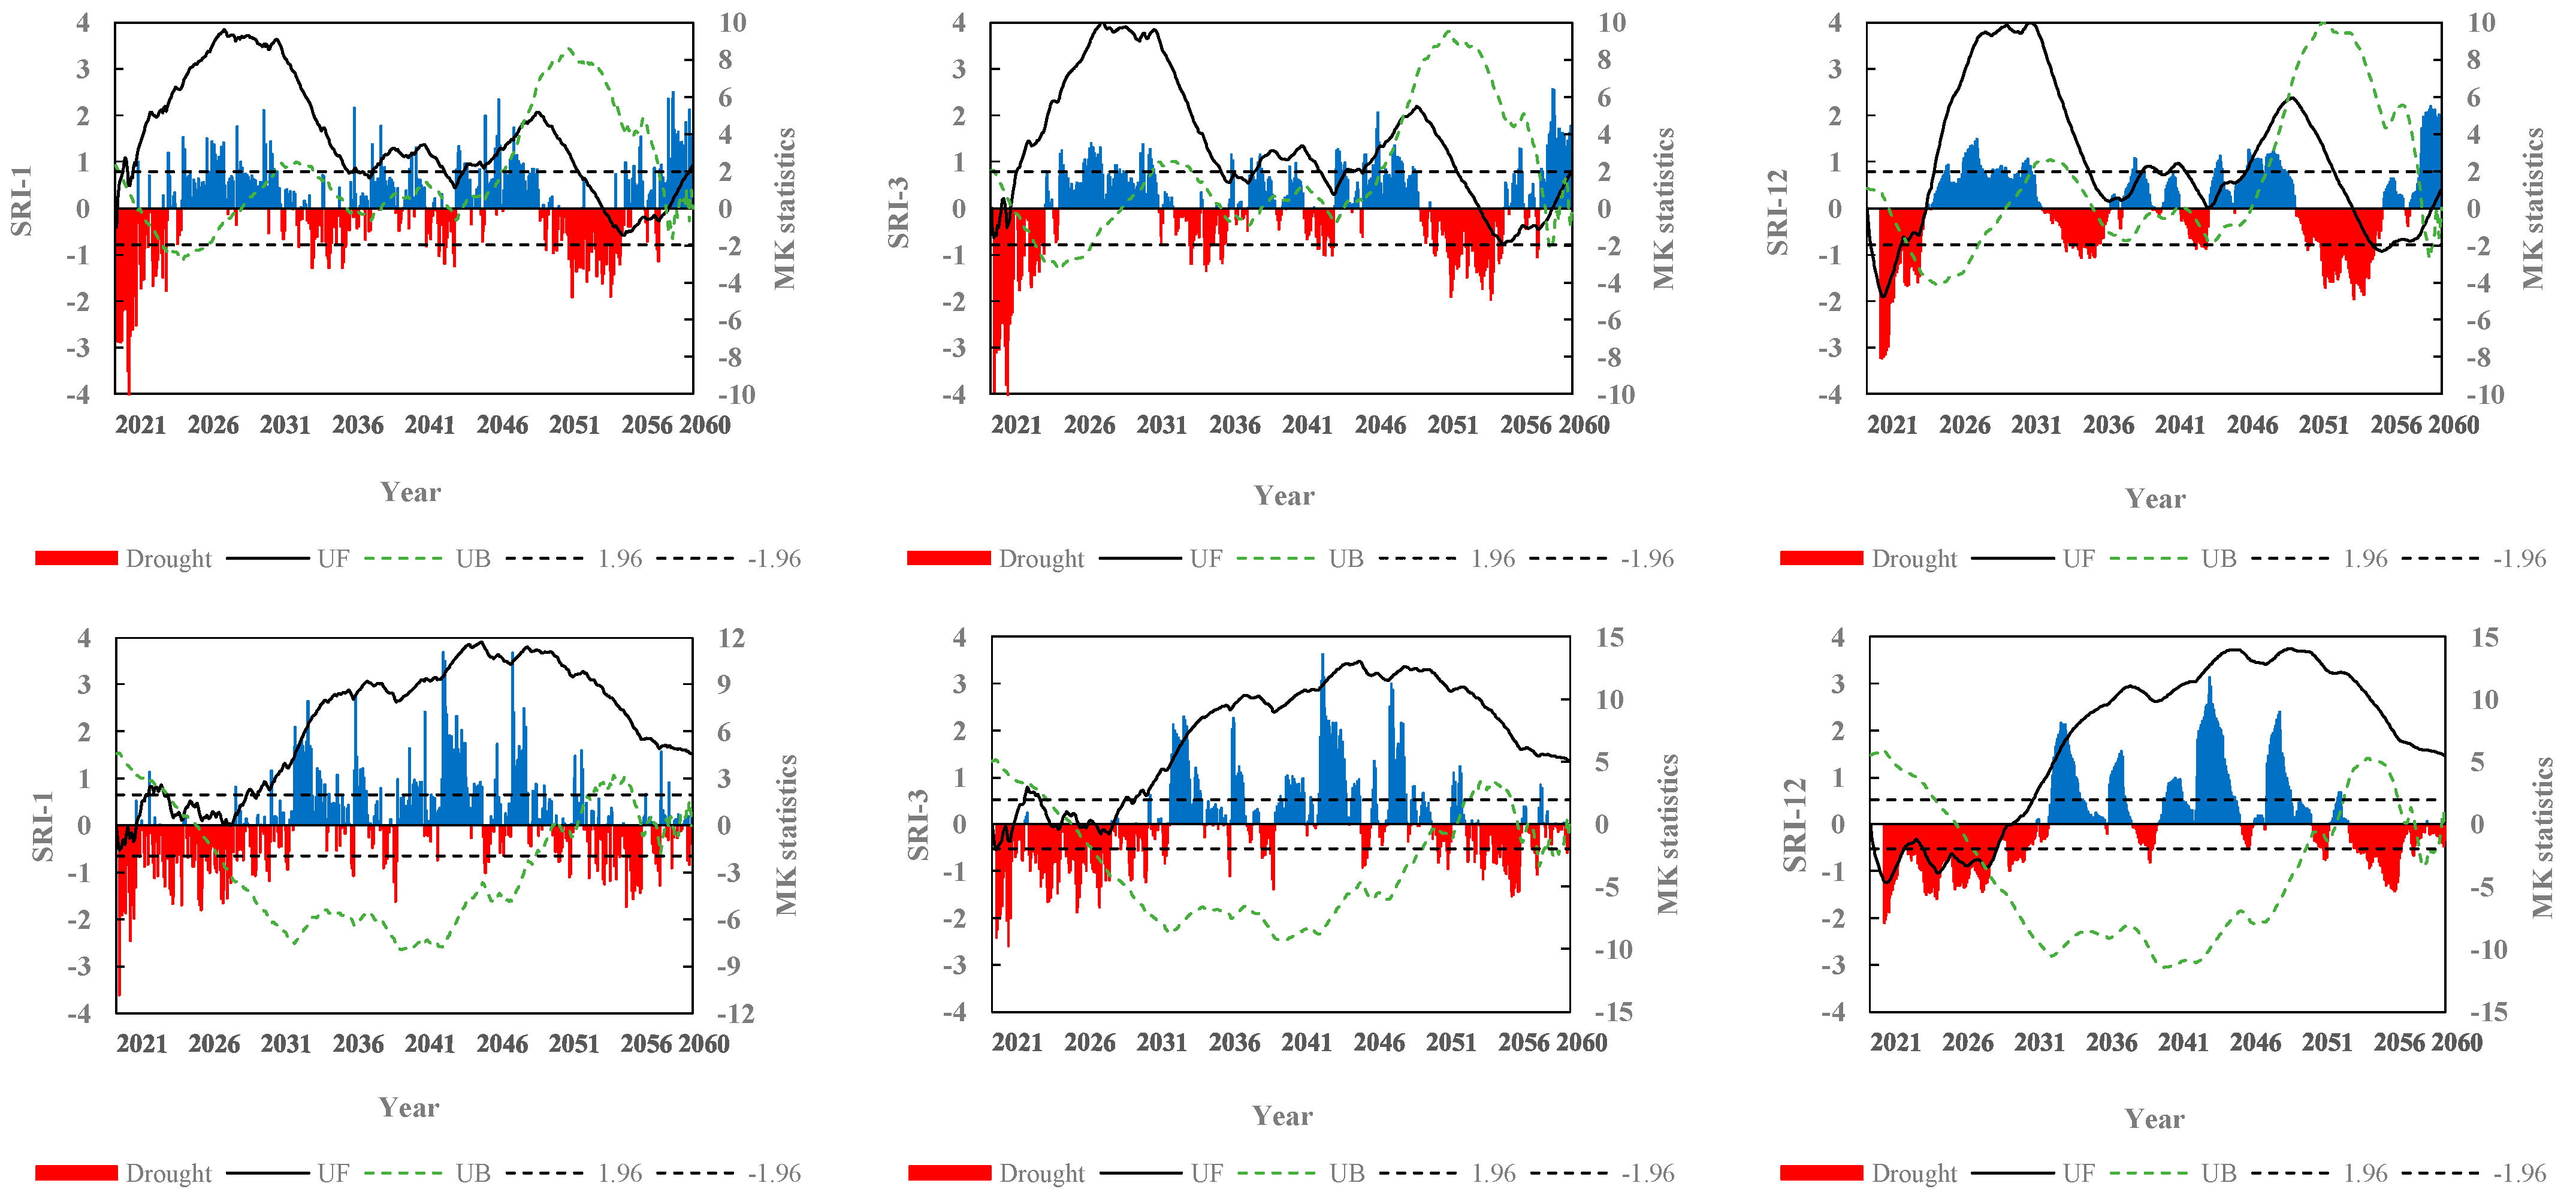
The SWAT model was used to drive the GCMs downscale atmospheric dataset to simulate the JRB emissions in the future period under different runoff sequences to obtain the standardized runoff index (SRI) time series (
Figure 9). The future SRI was predicted to show “drought_flood_drought_flood” periodic changes, and with the increase in the time scale, the drought duration and severity gradually increased.
Combined with the results of the M-K trend test, the results showed that the JRB had two mutation years under the RCP4.5 scenario, and the hydrological drought mutation years were 2021, 2049, 2022, 2049, 2023, and 2050, where the drought trends were similar. For example, at the monthly scale, the JRB showed a significant wetting trend in the overall watershed during 2021–2049. After 2049, the JRB began to show a drying trend. Interestingly, the JRB hydrological drought trend on the monthly and seasonal scales has never exceeded the significance level , while on the annual scale, the JRB drought trend reached the significance level in 2021 and 2056 . The above results showed that the annual future drought trend of the JRB under the RCP4.5 scenario was more significant when compared with the monthly and seasonal scales.
Under the RCP8.5 scenario, the JRB has only one mutation point on the monthly, seasonal, and annual scales in 2024, 2026, and 2029, respectively; a remarkable wetting trend continued after the mutation year until 2060. Meanwhile, the JRB hydrological drought trend did not exceed the significance level on the monthly and seasonal scales, but on the annual scale, the JRB drought trend repeatedly reached the significance level between 2021 and 2030 . As for the RCP4.5 scenario, the JRB was drier on the annual scale than the monthly and seasonal scales, while the difference was that the JRB drought–flood alternation frequency was dramatically decreased under the RCP8.5 scenario.
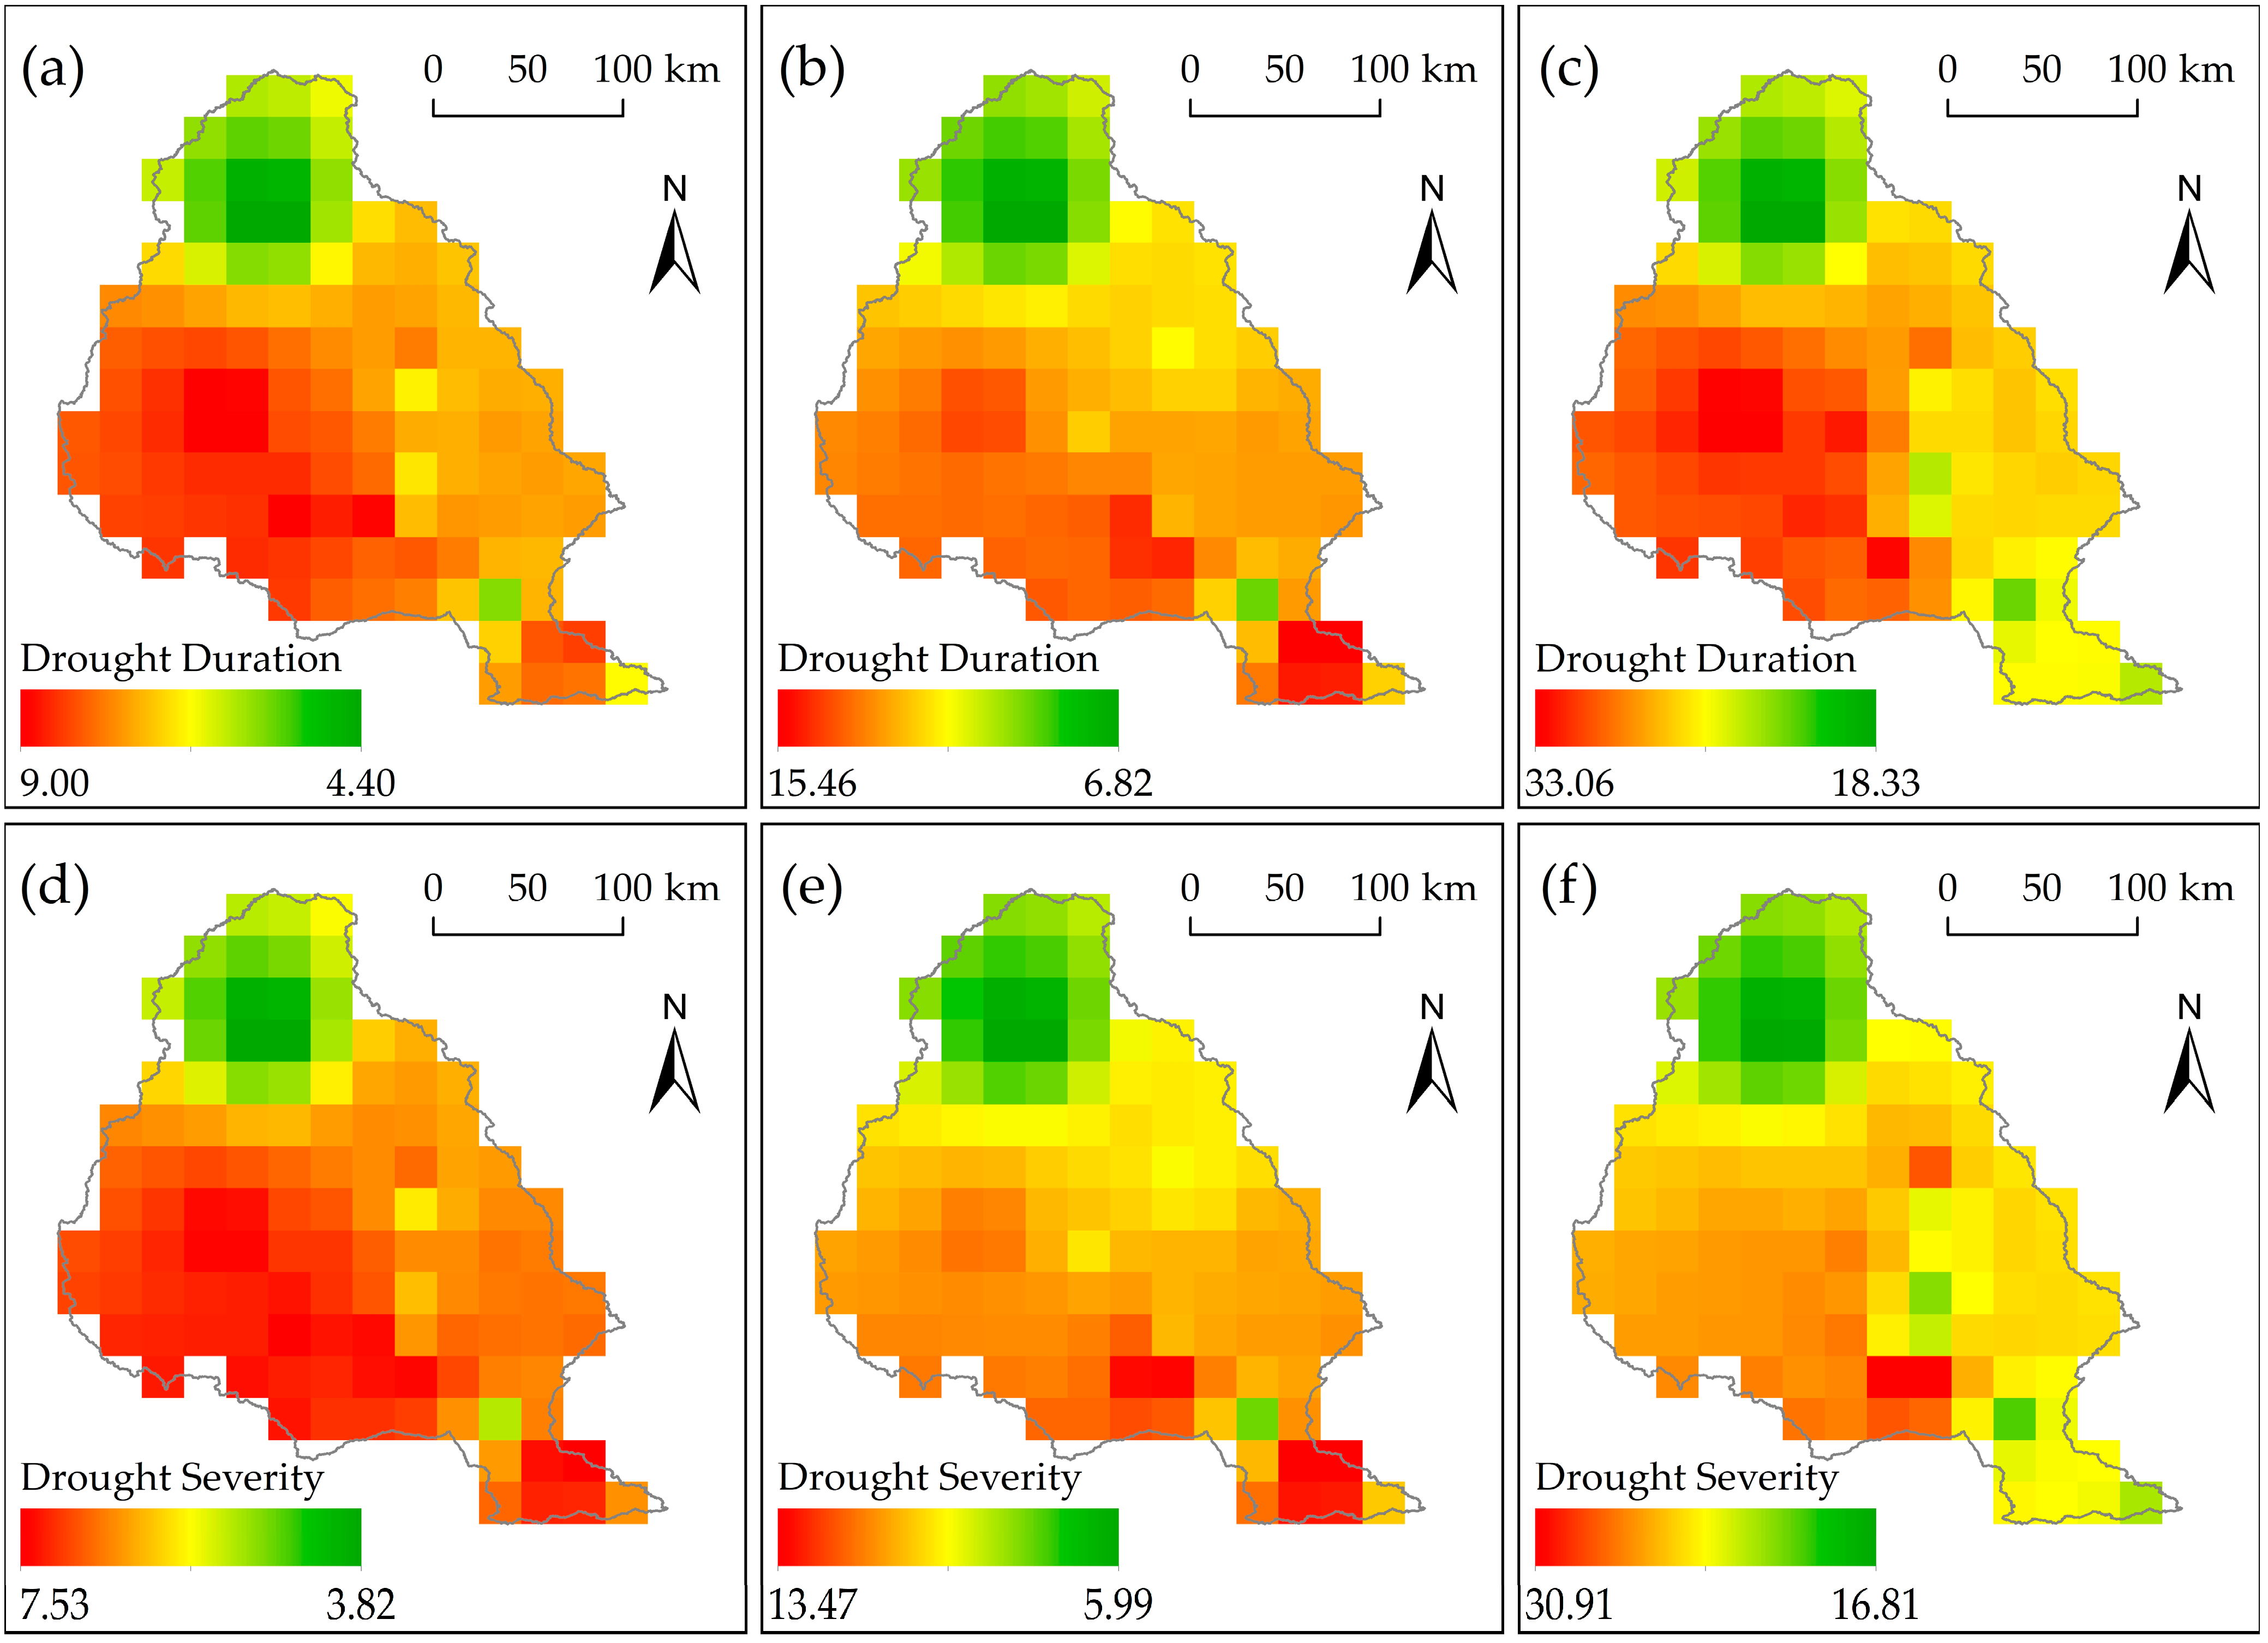
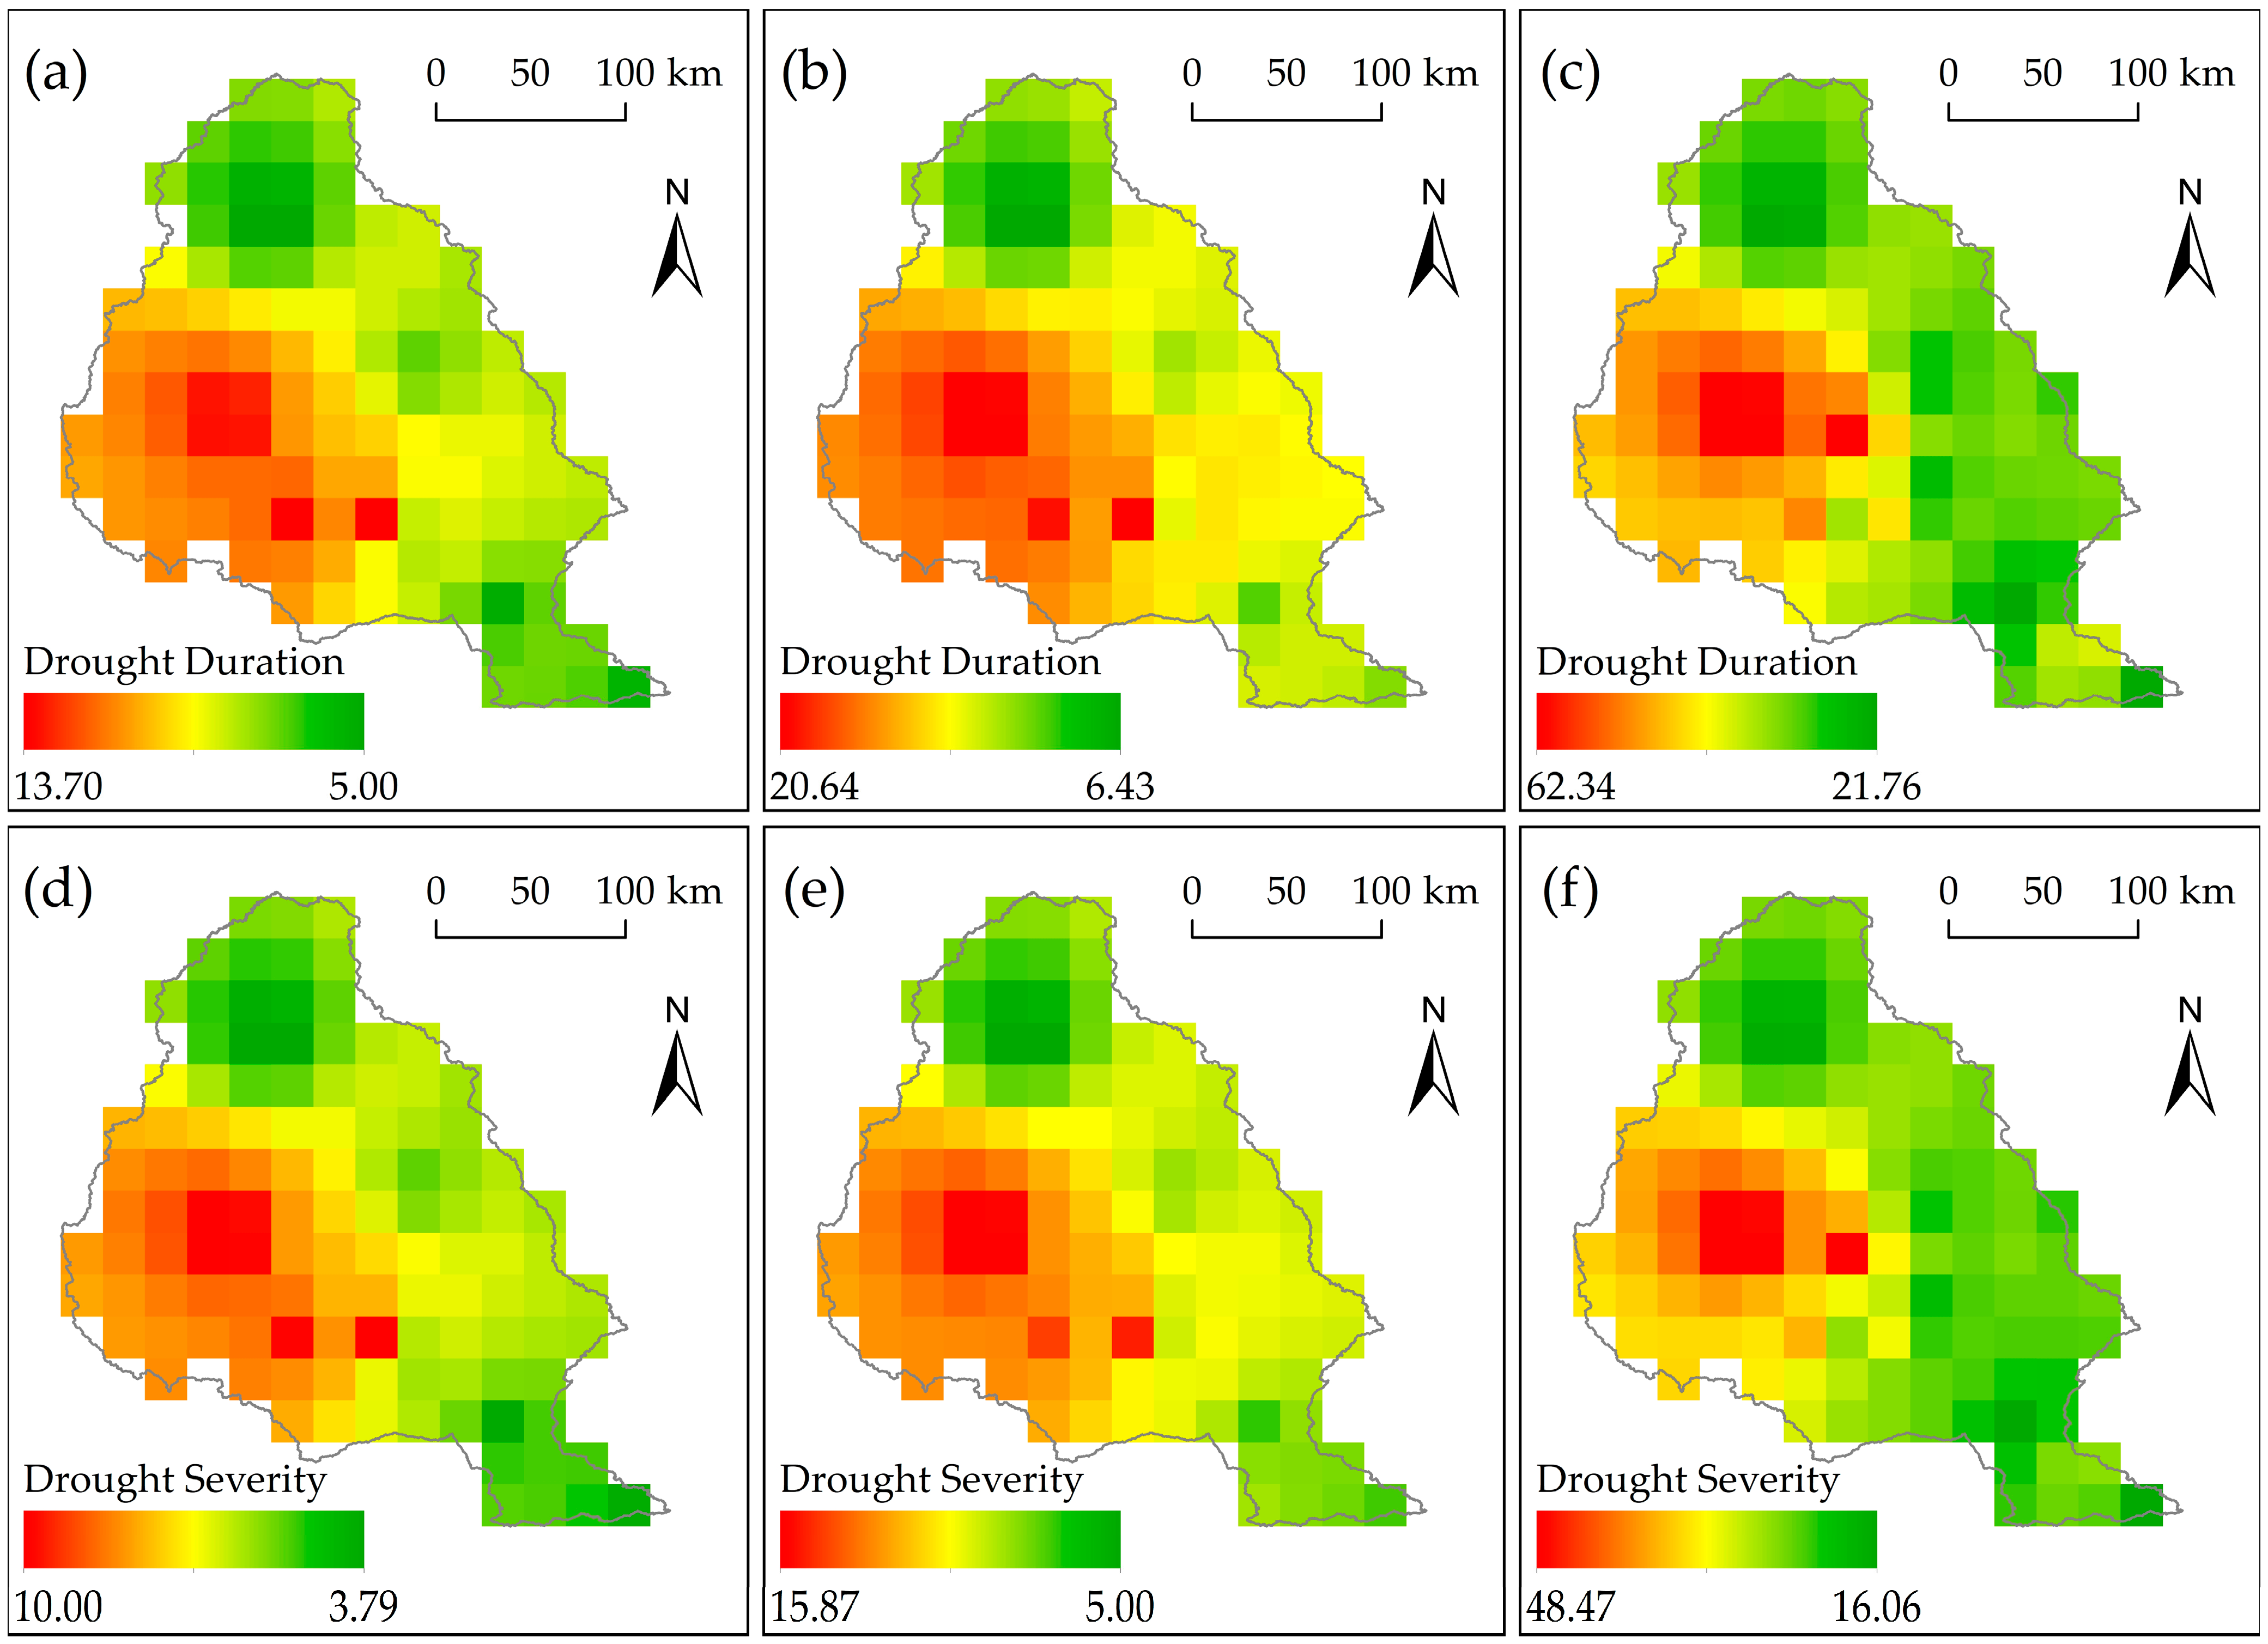
3.4.2. Spatial Drought Characteristics Evolution of HD
The statistical downscale atmospheric dataset of GCMs was input into the SWAT model to simulate the spatial and temporal change distribution of the JRB runoff under different scenario modes in the future (2021–2060). Therefore, we used run theory to reveal the spatial and temporal distributions in the JRB, as shown in
Figure 10 and
Figure 11.
Overall, the drought duration and severity of hydrological drought were prolonged and increased compared with the meteorological drought in the JRB. On the monthly time scale, the JRB hydrological drought duration lasted between 4.40 and 9.00 months under the RCP4.5 emission scenario, and the drought severity was between 3.82 and 7.53. Taking Huanxian-Yaoxian as the boundary, the hydrological drought in the west of the boundary lasted for a long time; the drought severity was also large. However, the JRB experienced the strongest hydrological drought duration and severity in Xifeng and Pingliang areas under the RCP8.5 emission scenario, lasting for 13.4 months and with a severity that reached 9.6.
From a seasonal perspective, under the RCP4.5 emission scenario, the hydrological drought duration of the JRB was between 6.82 and 15.46 months, and the drought severity was from 5.99 to 13.47 months, being more intense in Xifeng and Changwu than in other regions. In contrast, under the RCP8.5 emission scenario, the drought duration was longer than under the RCP4.5 emission scenario, lasting from 6.43 to 20.64 months, and the drought severity increased slightly. The duration and severity in the west of the middle reaches were more pronounced.
On the annual scale, the overall drought duration of the basin was longer under the JRB emission scenario of RCP4.5; the drought lasted for a long time, reaching 30 months west of the line of Huanxian-Xifeng-Changwu. The severity of drought ranged from 16.81 to 30.91 and reached 30.91 in the Changwu area. Under the RCP8.5 emission scenario, the JRB hydrological drought duration distribution was similar to the severity distribution. The hydrological drought duration ranged from 21.76 to 62.34 months, and the drought severity ranged from 16.06 to 48.47 months. It is worth noting that in the east of the Huanxian-Xifeng Changwu boundary line, there was little difference in the hydrological drought duration or severity between RCP4.5 and RCP8.5 scenarios. However, west of the boundary line, the hydrological drought duration and severity under the RCP8.5 scenario were much greater than under the RCP4.5 scenario.
3.5. Univariate Drought Analysis
3.5.1. Univariate and Bivariate Distributions
The Copula function was adopted to optimize the marginal distribution functions of different drought types and characteristics in historical and future periods. The analysis successively used the K-S, AIC, BIC, and other test methods to optimize the joint distribution models of different marginal functions [
42]. Many studies have shown that the three-month time scale drought index can better represent the characteristic law of watershed drought evolution [
43]. Therefore, the meteorological and hydrological drought duration and severity identified by the SPI-3 and SRI-3 were revealed.
We selected the marginal distribution functions that were most suitable for the drought duration and severity from the six probability distribution functions of normal, exponential, log-normal, gamma, Weibull, and generalized extremal distribution, as shown in
Table 5. The results of the K-S test indicated that the gamma distribution, Weibull distribution, and log-normal distribution functions could effectively fit the JRB drought eigenfunctions. Additionally, corresponding to
Table 6, the Gumbel and Frank functions could be used to combine the marginal distribution characteristic functions of both drought duration and drought severity.
3.5.2. Univariate and Bivariate Distributions
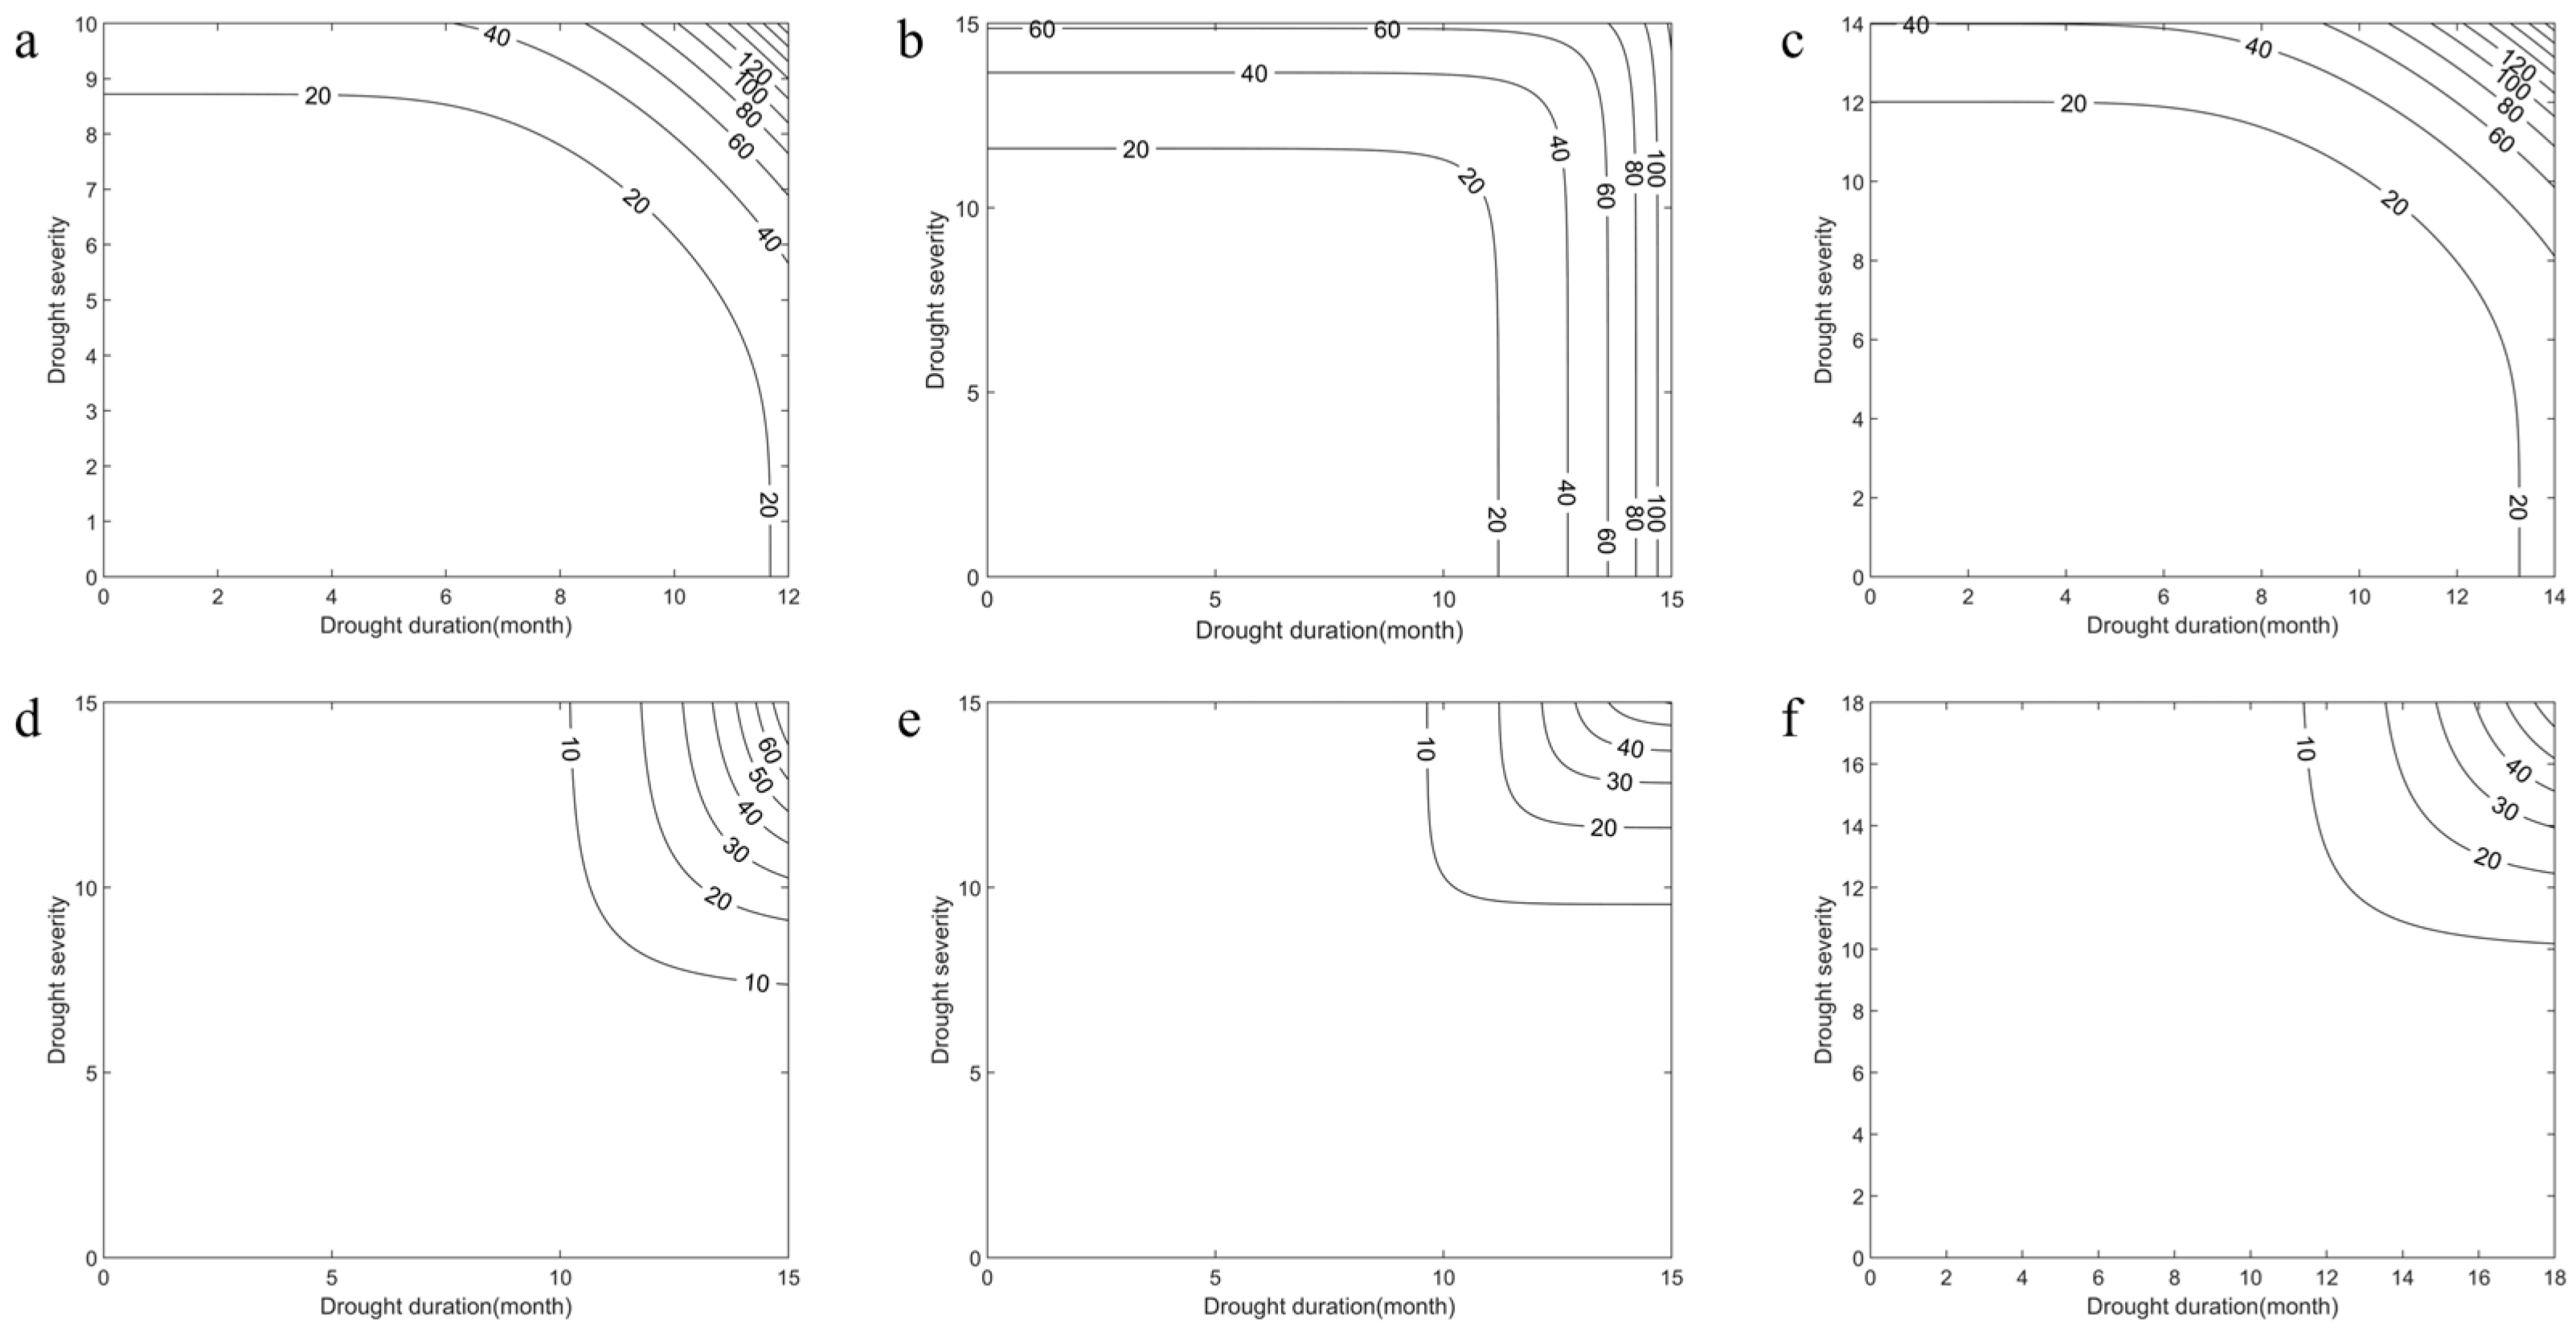
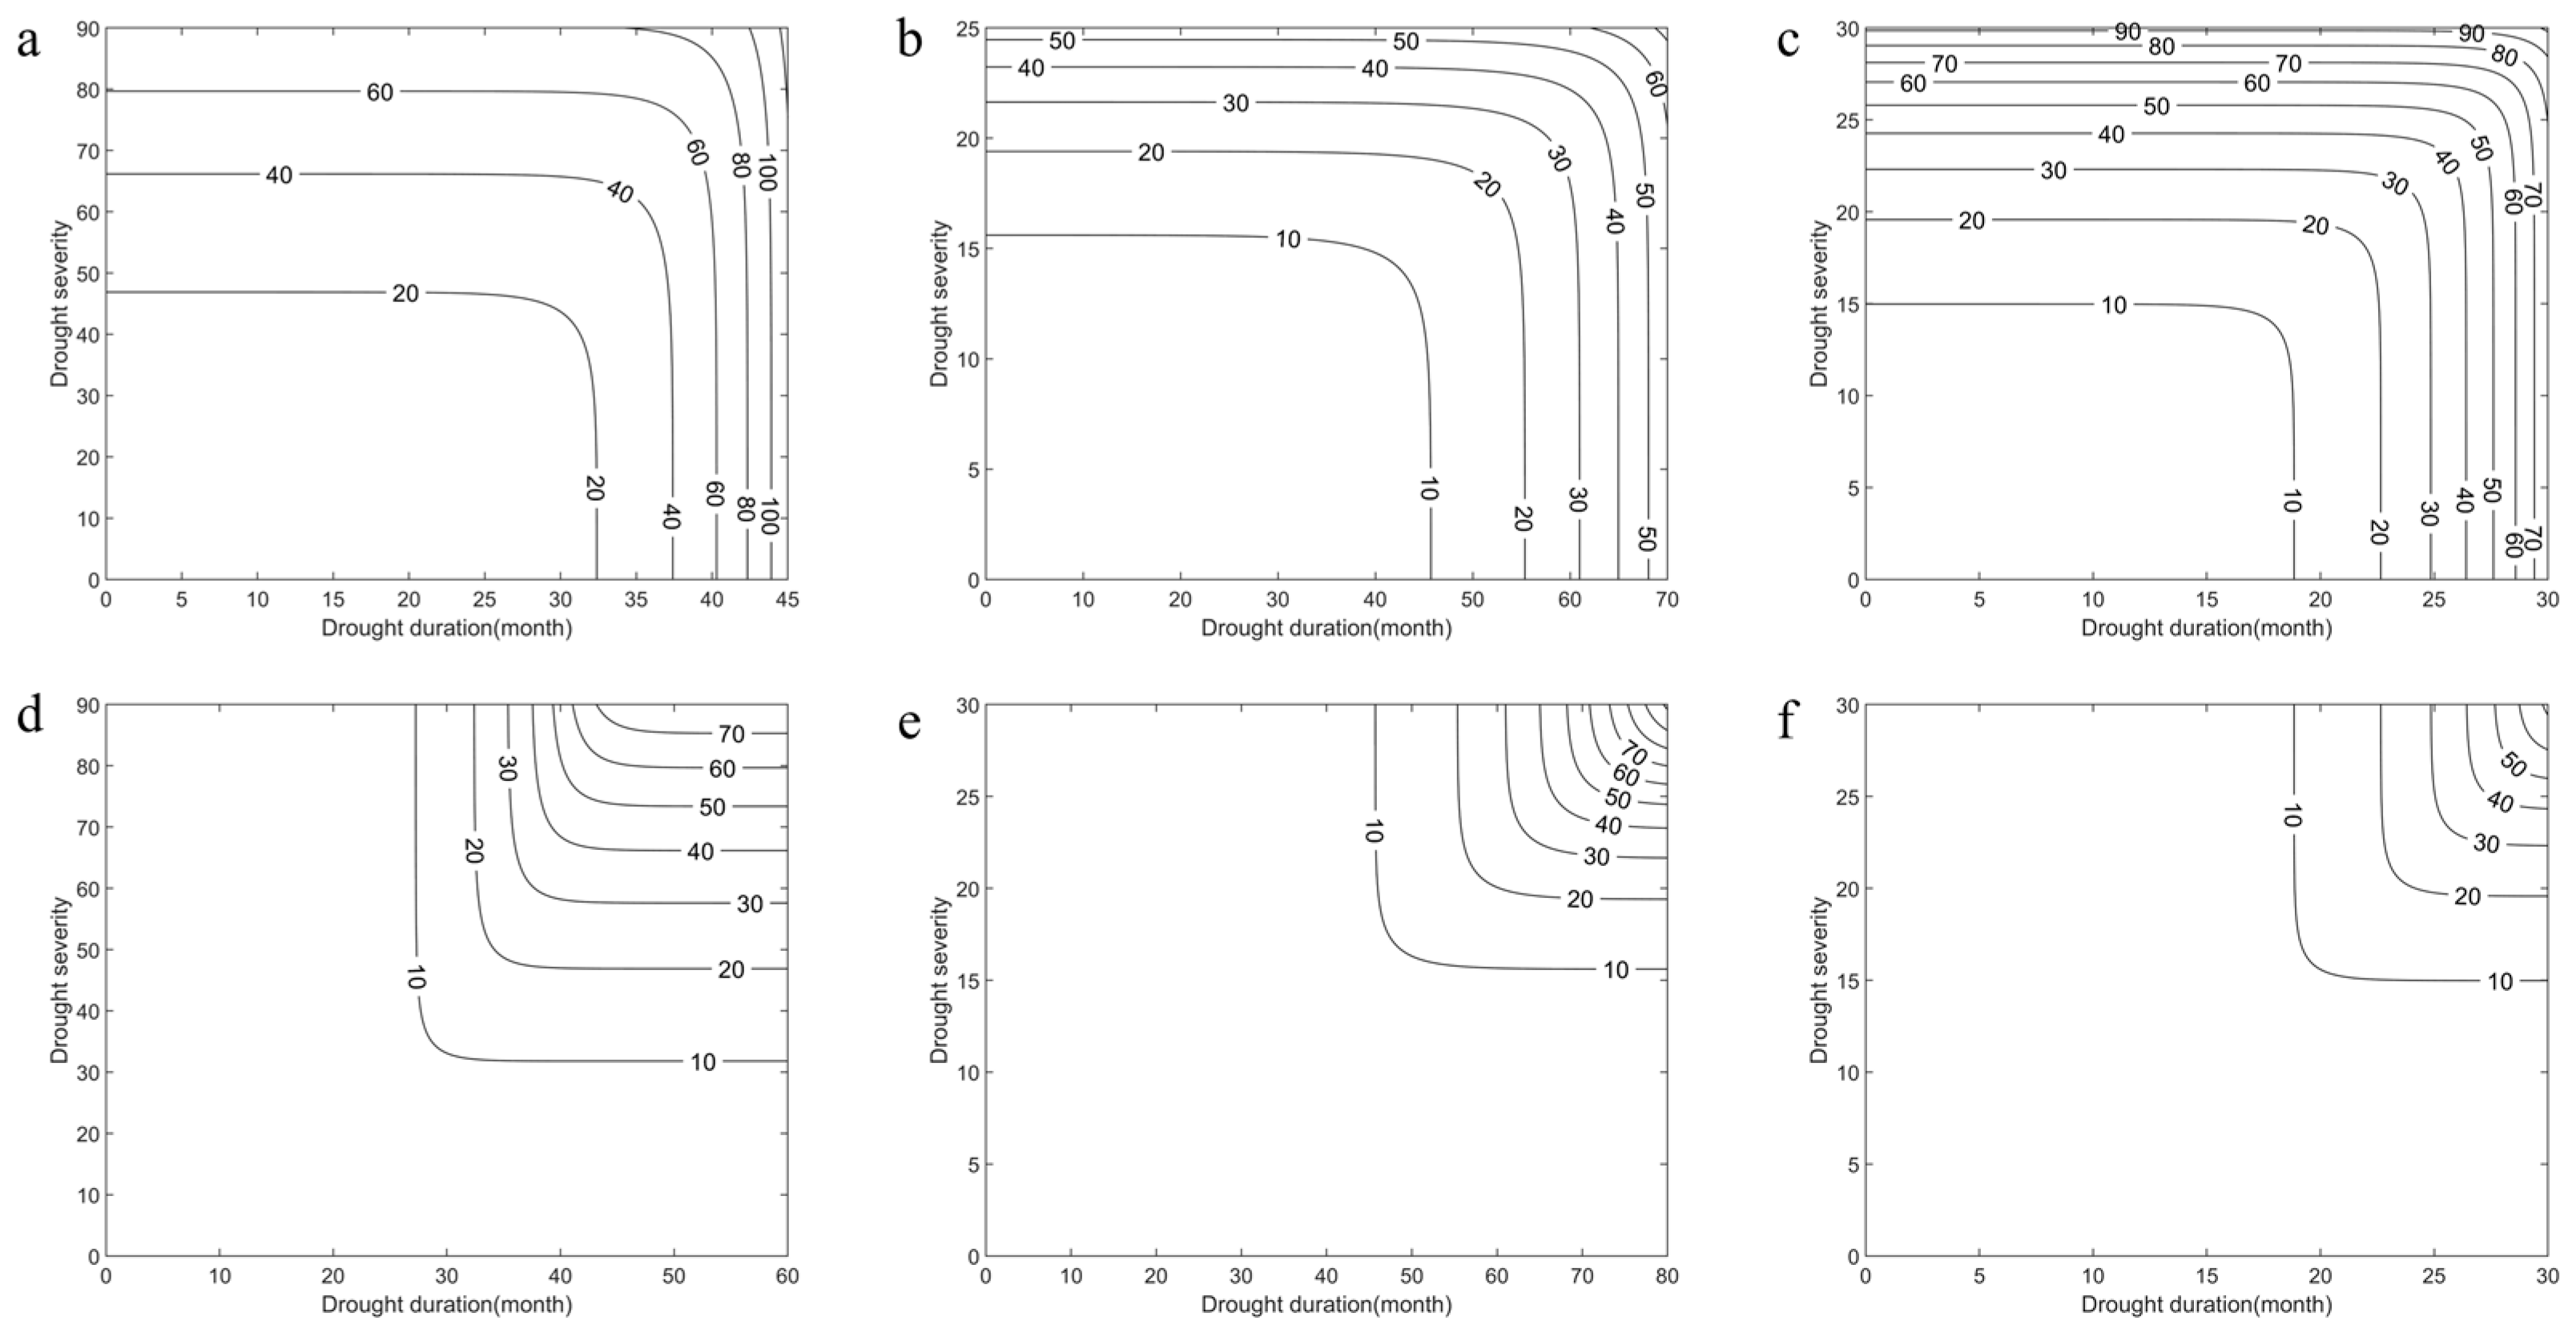
Based on the Copula joint distribution function under different scenario combinations, the “AND” and “OR” drought characteristics of MD and HD in the historical period (1990–2017) and future period (2021–2060) are shown in
Figure 12 and
Figure 13.
As can be seen from
Figure 9, under the same recurrence period, the MD severity of both the RCP4.5 and RCP8.5 scenarios in the future period was significantly increased compared with the historical period. However, the MD duration under the RCP4.5 scenario was comparable to that of the historical period. It is worth noting that the duration of MD was longer under the future RCP8.5 scenario compared to the historical period. For example, in the “AND” joint distribution model, when the JRB encountered a 20-year return period MD, the drought duration was 11.64, 11.3, and 13.26 months in the historical period, future RCP4.5, and future RCP8.5, respectively, and the drought severity was 8.70, 11.52, and 11.98, respectively. Accordingly, there were similar characteristics in the “OR” joint distribution model.
It can be seen from
Figure 10 that under the same return period, the HD severity under the scenarios of RCP4.5 and RCP8.5 would decrease in the future, and the HD situation is alleviated. Meanwhile, the duration of HD under the RCP4.5 scenario is significantly extended, but it is significantly shortened under the RCP8.5 scenario. For example, when the JRB encounters an HD with a 20-year return period in the “AND” joint distribution model, the duration of HD in the historical period, future RCP4.5, and future RCP8.5 scenarios are 32.40 months, 55.25 months, and 22.65 months, respectively, and the drought severity is 46.95, 19.40, and 19.45, respectively. Accordingly, there are similar characteristics in the “OR” joint distribution model.
4. Discussion
4.1. Drought Propagation Characteristics
This study explored the spatiotemporal evolution characteristics of MD and HD in the JRB under different climate emission models. We also studied the correlations between different drought characteristics. In addition, we should also be clear about how the MD propagates the HD and what types of drought propagation events would arise in the future. These studies are also very important and cannot be ignored. Different types of droughts, MD, and HD propagate under certain conditions. However, the process of drought propagation has diverse effects, including merger, attenuation, extension, and hysteresis. Therefore, there are many forms and characteristics of drought propagation. The present study divided drought transmission into the following situations.
S0: There is no correlation between MD events and HD events, i.e., when MD events occur, hydrological drought events do not occur. In this case, the duration of MD is likely to be short, and the severity is slight. After the MD event occurs, the HD event has been relieved before the underlying surface system receives a response.
S1: One MD event corresponds to one HD event because an MD event with a long duration and high severity is “reduced” by the land surface system, resulting in attenuation and triggering a hydrological drought event with a relatively short duration and low severity.
S2: Multiple MD events correspond to one HD event. After multiple MD events have occurred, an HD event with a long duration and high severity is generated due to combination, lag, or other effects. After the previous MD event, with the lag effects, the HD has not ended but has meanwhile ushered in a new MD event until the MD event no longer occurs or has been alleviated. At this time, an HD event formed by these conditions lasts for a long time and has a high severity with adverse effects.
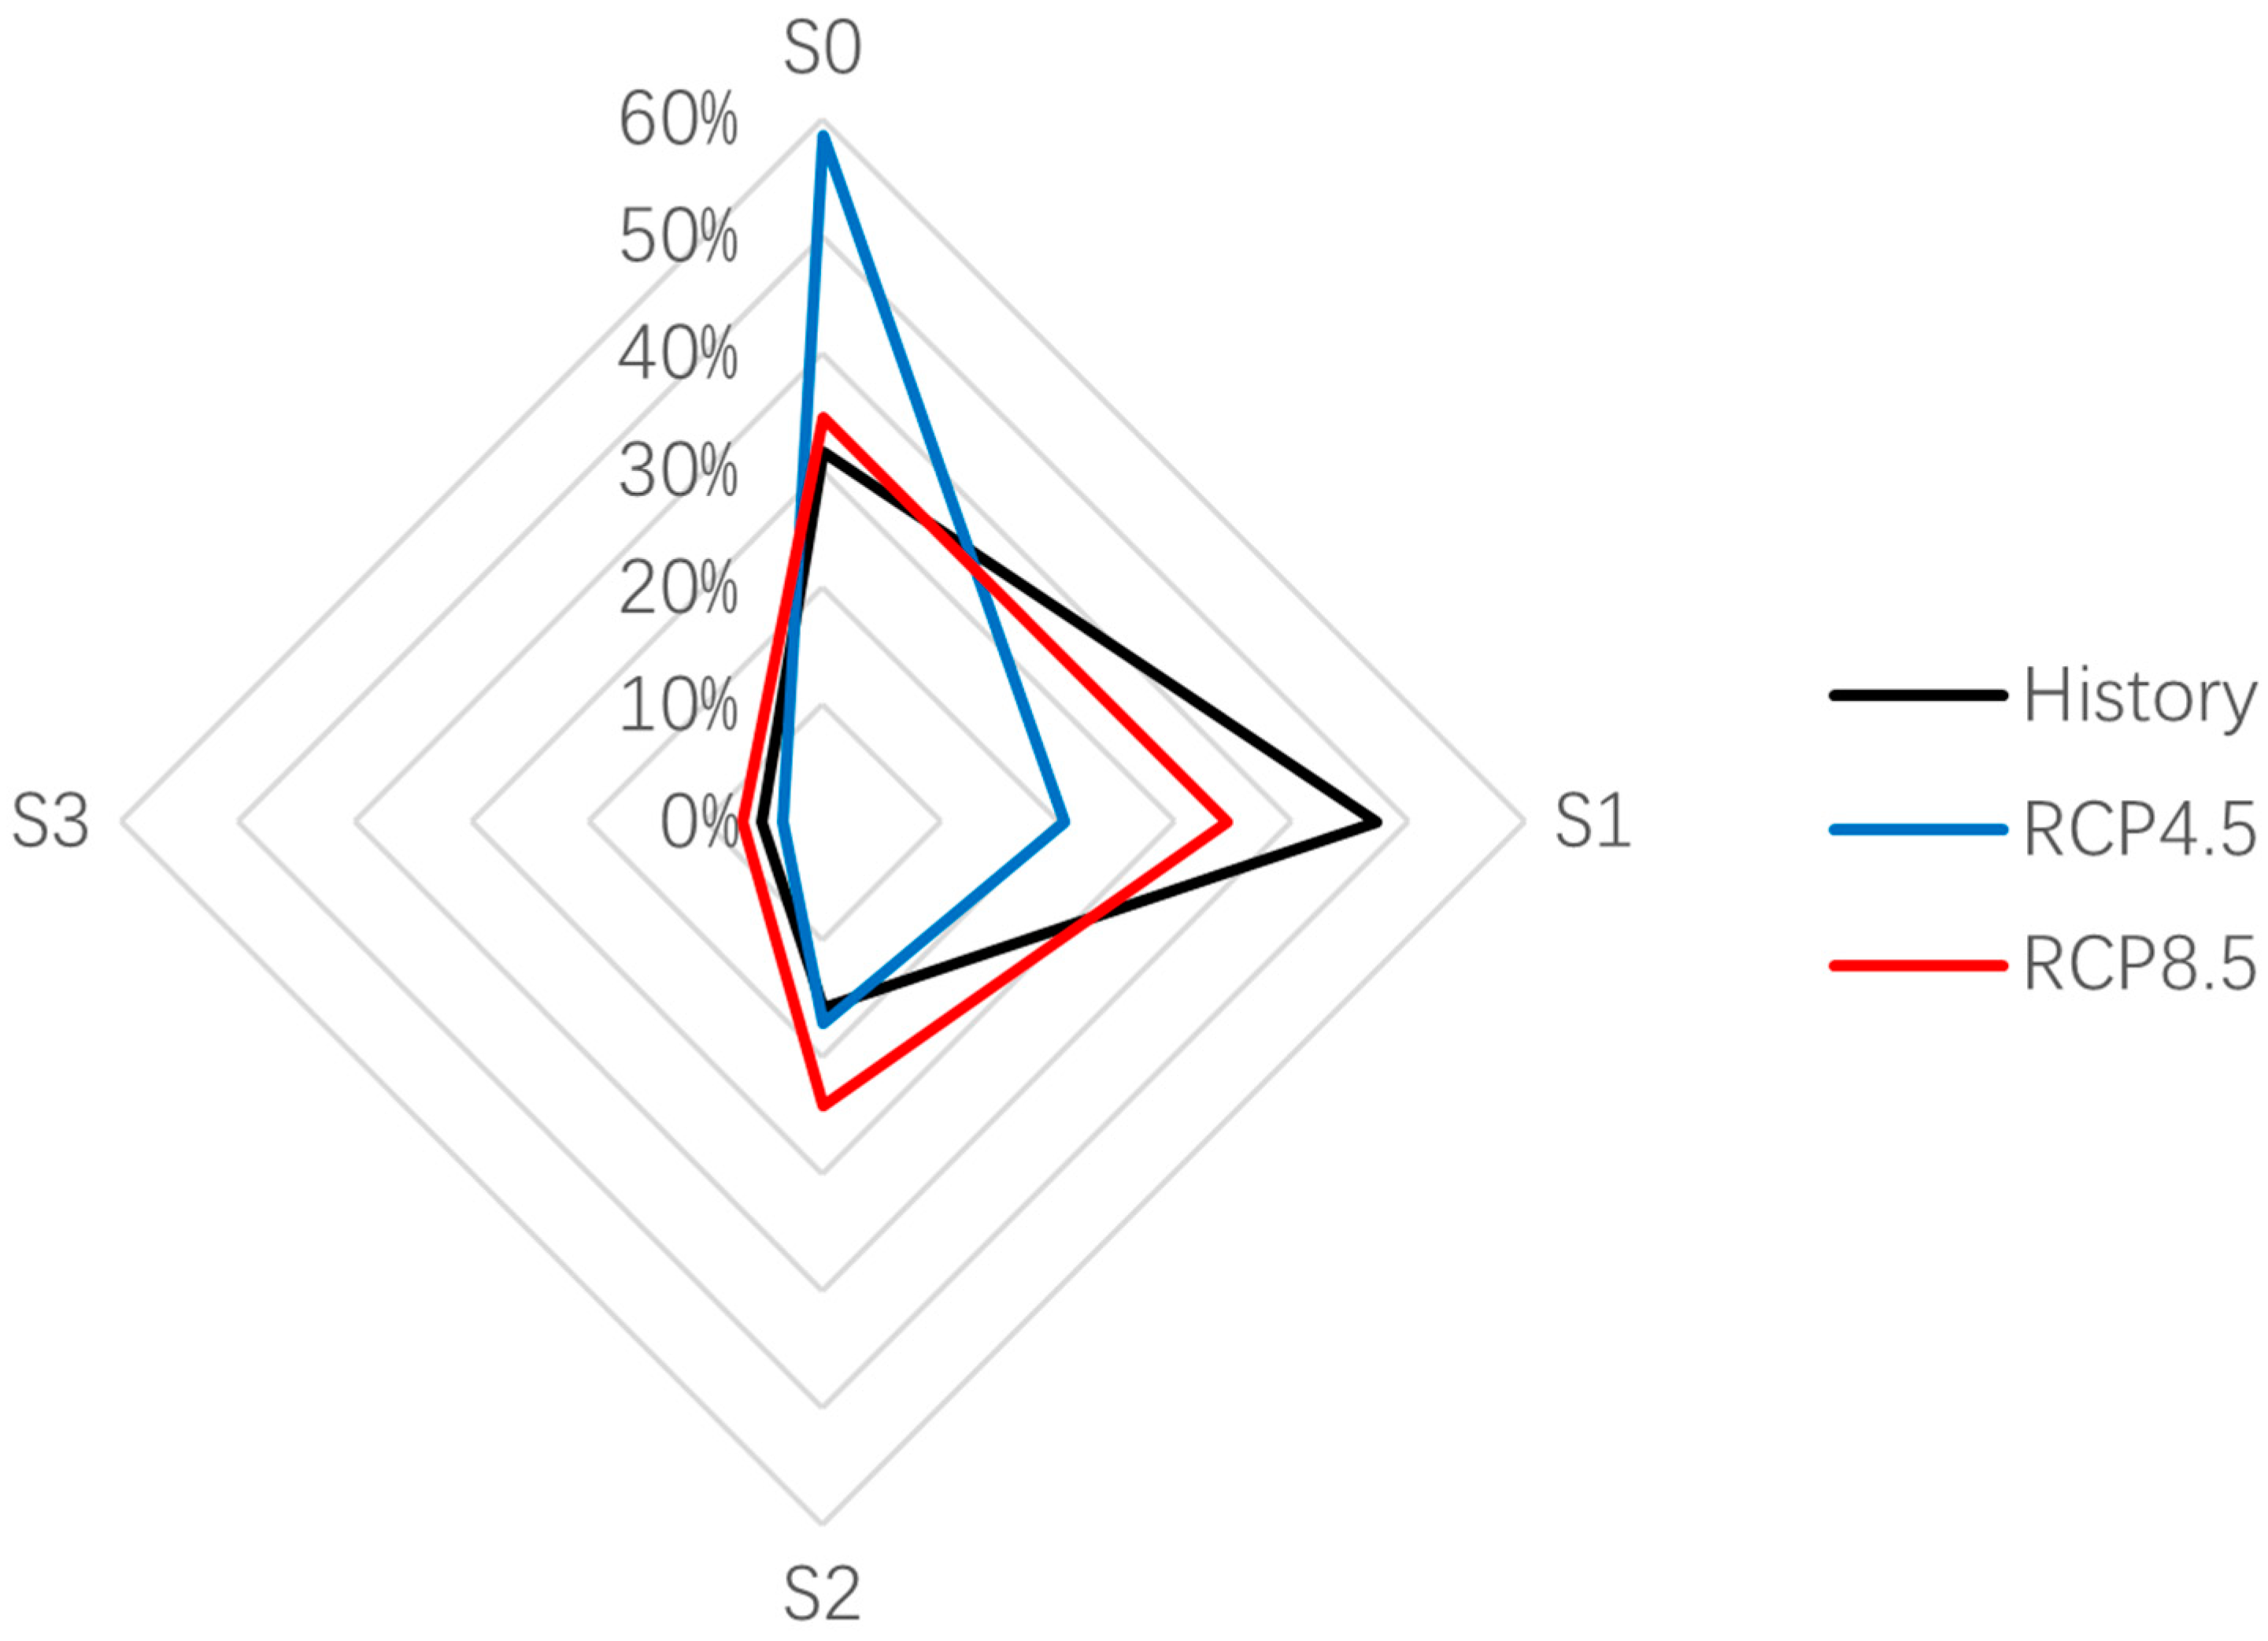
S3: Multiple MD events correspond to multiple HD events. This situation is usually rare, and it is often caused by complex meteorological fluctuations or human activities. After this type of drought propagation event occurs, it is more likely to have serious consequences for the local residents. According to the drought propagation characteristics of the JRB, we matched the MD and HD events under different scenarios in the JRB historical period and the future. The drought propagation types are shown in
Figure 14.
According to
Figure 14, compared with the duration period, the probability of an S0 event occurring in the scenario of RCP4.5 of JRB increases, the probability of an S1 and S3 event occurring is basically unchanged, and the probability of an S2 event occurring is basically unchanged. Under RCP8.5, the probability of S0 events is almost unchanged, the probability of S1 events decreases, and the probability of S2 and S3 events increases. Therefore, more attention should be paid to drought propagation events under an RCP8.5 scenario in the future. After the occurrence of MD in this scenario, it is easy to form a long-duration and high-severity HD event that is difficult to recover from. Furthermore, although the impact of the drought propagation events of the JRB under an RCP4.5 scenario is relatively small, its MD events are frequent, which also requires us to retain our attention.
4.2. Analysis of Difference in Spatiotemporal Variation in Meteorological and Hydrological Drought Characteristics
In this study, the meteorological data from the GFDL-CM3 model were first used to predict the pattern of meteorological drought characteristics for the JRB over the next 40 years (2021–2060s), and then their future climate model data were driven into the SWAT model. Even though the average annual precipitation of the JRB increases in the future, but its spatial and temporal distribution of precipitation becomes more heterogeneous, which often leads to significant differences in the spatial and temporal characteristics of meteorological droughts and an increase in the frequency of extreme weather events [
44] (
Figure 6).
The JRB experienced a slight increase in meteorological drought on a 3-month scale, but the JRB experienced a slowdown in hydrological drought, which is consistent with Sun’s findings [
40]. The main reason for this phenomenon is that hydrological drought generally lags behind meteorological drought on a 3-month scale [
45]. This allows the basin to retain sufficient moisture in the soil to maintain surface runoff production in the absence of precipitation, thus reducing or delaying the onset of hydrological drought.
4.3. Limitation and Extension
Due to the limited data collected, this study only explored the meteorological and hydrological drought characteristics of the JRB under natural conditions. However, the occurrence of hydrological drought is not only influenced by natural meteorological elements, but also closely related to local underlying surface conditions and anthropogenic disturbances [
46]. Future studies should also consider the evolution of hydrological drought patterns under the combined influence of natural and anthropogenic factors.
Furthermore, different GCM models have different simulations for precipitation and temperature in different regions [
47,
48]. Although the GFDL-CM3 model is better used on the JRB, more GCM models should be considered in the other regions. The CMIP6 model data are already widely used and can be further investigated. Therefore, it is encouraged to use this climate projection product for drought projections in future studies.
Many studies indicated that there are some improvements from the CMIP5 to CMIP6 GCMs in simulating the mean and extreme temperature and precipitation globally and in China as a whole [
49,
50]. Compared with CMIP5, the resolution of CMIP6 for the atmosphere and ocean is improved. Because it includes new and more complex processes, as well as more complex surface processes, ice sheets, and permafrost, these processes can restore hydrological processes more comprehensively [
51].
Guo et al. evaluated and compared the performance of CMIP6 and CMIP5 models in simulating the runoff on global-scale and eight large-scale basins and found that CMIP6 models have less uncertainty on the global scale when compared with CMIP5 models, but it has not made outstanding progress on the basin scale [
52]. Moreover, Cui et al. evaluated the mean and extreme surface air temperature and precipitation in the CMIP6 multimodel ensemble simulations over the Tibetan Plateau [
53], and it shows that CMIP6 models continue to suffer from cold bias in temperature and wet bias in precipitation similarly to its predecessor CMIP5. Therefore, the runoff simulation capability at the basin scale needs to be further improved to some extent.
5. Conclusions
This study explored the temporal and spatial evolution of meteorological drought and hydrological drought in the JRB at different time scales by driving the SWAT model and downscale climate datasets for two representative future emission scenarios. Moreover, the Copula joint distribution function was used to reveal the relationship between different drought characteristic values and the joint distribution characteristic law. The main conclusions are as follows:
(1) With the increase in the time scale, the frequency of drought events gradually decreased. The meteorological drought and hydrological drought of the JRB displayed complex periodic change trends of drought and flood succession. The patterns were influenced by the characteristics of precipitation distribution. Importantly, the JRB meteorological and hydrological drought experienced effects from aggravation to mitigation under the RCP8.5 scenario. However, a periodic change pattern of drought–flood–drought–flood occurred under the RCP4.5 scenario.
(2) In the future period, the JRB would have significant differences under different emission scenarios of the spatial drought characteristic scale due to it being affected by an uneven precipitation distribution. The duration and severity of MD under the RCP4.5 emission scenario were more intense in the middle reaches of the JRB. As for the JRB HD, the area affected by drought under the RCP4.5 scenario was larger than that under the RCP8.5 scenario, which exceeds 50% of the whole area. However, under the RCP8.5 scenario, in the areas where the JRB suffered from serious drought, the drought was more concentrated, the drought duration was longer, it was very difficult to recover from this type of drought.
(3) It can be seen from the future joint distribution model of drought duration and severity that the future MD severity of the JRB would increase both under the two emission scenarios. Compared with the historical period, the overall runoff of the JRB in the future period would be increased and the HD events would be mitigated. In contrast, the HD duration of the JRB was significantly prolonged under the RCP4.5 scenario but reduced under the RCP8.5 scenario.
It is worth noting that the combined return period of the JRB drought duration and severity of the MD as well as HD in the future were slightly larger than those of the co-occurrence return period, indicating that when one drought characteristic variable occurred, the probability of another drought variable occurring simultaneously was higher. The numerous and short-duration MD events causing long-duration HD events would increase. In that case, the HD caused by this situation would last relatively longer, and the drought severity would be high, making the recovery thereof difficult. Although the area affected by HD under the RCP8.5 scenario was smaller than that under the RCP4.5 scenario, some of its local areas were vulnerable to long-duration and high-severity HD events would have unfavorable effects after the occurrence.
Author Contributions
Conceptualization, T.H. and Z.W. (Zhiyong Wu); methodology, T.H. and Z.S.; software, T.H.; validation, T.H. and Y.L.; formal analysis, T.H., Z.W. (Zhiyong Wu) and J.W.; investigation, Z.W. (Zhiyong Wu); resources, T.H. and Z.W. (Zhiyong Wu); data curation, T.H.; writing—original draft preparation, T.H. and Z.W. (Zhiyong Wu); writing—review and editing, T.H., Z.W. (Zhiyong Wu) and Z.S.; visualization, Z.W. (Zhihui Wang); supervision, TH and Z.W. (Zhiyong Wu); project administration, Z.W. (Zhihui Wang) and P.X.; funding acquisition, Z.W. (Zhihui Wang) and P.X. All authors have read and agreed to the published version of the manuscript.
Funding
This research was funded by Natural Funds—Influence and role of allocation of soil and water conservation measures on runoff and sediment process in watershed. (U2243210).
Data Availability Statement
Not applicable.
Conflicts of Interest
The authors declare no conflict of interest.
References
- Zhang, Y.; Qi, J.; Pan, D.; Marek, G.W.; Zhang, X.; Feng, P.; Liu, H.; Li, B.; Ding, B.; Brauer, D.K. Development and testing of a dynamic CO2 input method in SWAT for simulating long-term climate change impacts across various climatic locations. J. Hydrol. 2022, 614, 128544. [Google Scholar] [CrossRef]
- Yan, Y.; Wang, R.; Chen, S.; Zhang, Y.; Sun, Q. Three-dimensional agricultural water scarcity assessment based on water footprint: A study from a humid agricultural area in China. Sci. Total Environ. 2023, 857, 159407. [Google Scholar] [CrossRef] [PubMed]
- Mao, Y.; Wu, Z.; He, H.; Lu, G.; Xu, H.; Lin, Q. Spatio-temporal analysis of drought in a typical plain region based on the soil moisture anomaly percentage index. Sci. Total Environ. 2017, 576, 752–765. [Google Scholar] [CrossRef]
- Ju, X.; Wang, Y.; Wang, D.; Singh, V.P.; Xu, P.; Wu, J.; Ma, T.; Liu, J.; Zhang, J. A time-varying drought identification and frequency analyzation method: A case study of Jinsha River Basin. J. Hydrol. 2021, 603, 126864. [Google Scholar] [CrossRef]
- Hefley, T.J.; Hooten, M.B.; Hanks, E.M.; Russell, R.E.; Walsh, D.P. Dynamic spatio-temporal models for spatial data. Spat. Stat. 2017, 20, 206–220. [Google Scholar] [CrossRef]
- Zheng, X.; Huang, S.; Peng, J.; Leng, G.; Huang, Q.; Fang, W.; Guo, Y. Flash Droughts Identification Based on an Improved Framework and Their Contrasting Impacts on Vegetation Over the Loess Plateau, China. Water Resour. Res. 2022, 58, e2021WR031464. [Google Scholar] [CrossRef]
- Han, Z.; Huang, S.; Huang, Q.; Bai, Q.; Leng, G.; Wang, H.; Zhao, J.; Wei, X.; Zheng, X. Effects of vegetation restoration on groundwater drought in the Loess Plateau, China. J. Hydrol. 2020, 591, 125566. [Google Scholar] [CrossRef]
- Ding, Y.; He, X.; Zhou, Z.; Hu, J.; Cai, H.; Wang, X.; Li, L.; Xu, J.; Shi, H. Response of vegetation to drought and yield monitoring based on NDVI and SIF. CATENA 2022, 219, 106328. [Google Scholar] [CrossRef]
- Karmaoui, A.; ben Salem, A.; el Jaafari, S.; Chaachouay, H.; Moumane, A.; Hajji, L. Exploring the land use and land cover change in the period 2005–2020 in the province of Errachidia, the pre-sahara of Morocco. Front. Earth Sci. 2022, 10. [Google Scholar] [CrossRef]
- Zhang, Q.; Miao, C.; Gou, J.; Wu, J.; Jiao, W.; Song, Y.; Xu, D. Spatiotemporal characteristics of meteorological to hydrological drought propagation under natural conditions in China. Weather. Clim. Extrem. 2022, 38, 100505. [Google Scholar] [CrossRef]
- Zhang, T.; Su, X.; Zhang, G.; Wu, H.; Wang, G.; Chu, J. Evaluation of the impacts of human activities on propagation from meteorological drought to hydrological drought in the Weihe River Basin, China. Sci. Total Environ. 2022, 819, 153030. [Google Scholar] [CrossRef] [PubMed]
- Wang, L.; Zhang, J.; Elmahdi, A.; Shu, Z.; Wu, Y.; Wang, G. Evolution characteristics and relationship of meteorological and hydrological droughts from 1961 to 2018 in Hanjiang River Basin, China. J. Water Clim. Chang. 2021, 13, 224–246. [Google Scholar] [CrossRef]
- Liu, Y.; Jia, Z.; Ma, X.; Wang, Y.; Guan, R.; Guan, Z.; Gu, Y.; Zhao, W. Analysis of Drought Characteristics Projections for the Tibetan Plateau Based on the GFDL-ESM2M Climate Model. Remote Sens. 2022, 14, 5084. [Google Scholar] [CrossRef]
- Li, C.; Zhang, X.; Yin, G.; Xu, Y.; Hao, F. Evaluation of Drought Propagation Characteristics and Influencing Factors in an Arid Region of Northeast Asia (ARNA). Remote Sens. 2022, 14, 3307. [Google Scholar] [CrossRef]
- Zhang, X.; Hao, Z.; Singh, V.P.; Zhang, Y.; Feng, S.; Xu, Y.; Hao, F. Drought propagation under global warming: Characteristics, approaches, processes, and controlling factors. Sci. Total Environ. 2022, 838, 156021. [Google Scholar] [CrossRef] [PubMed]
- Huang, S.; Zhang, X.; Chen, N.; Li, B.; Ma, H.; Xu, L.; Li, R.; Niyogi, D. Drought propagation modification after the construction of the Three Gorges Dam in the Yangtze River Basin. J. Hydrol. 2021, 603, 127138. [Google Scholar] [CrossRef]
- Wu, J.; Chen, X.; Yao, H.; Gao, L.; Chen, Y.; Liu, M. Non-linear relationship of hydrological drought responding to meteorological drought and impact of a large reservoir. J. Hydrol. 2017, 551, 495–507. [Google Scholar] [CrossRef]
- Katneshwarkar, B.; Abhishek Kinouchi, T. A Multivariate Drought Index for Seasonal Agriculture Drought Classification in Semiarid Regions. Remote Sens. 2022, 14, 3891. [Google Scholar] [CrossRef]
- Naderi, K.; Moghaddasi, M.; Shokri, A. Drought Occurrence Probability Analysis Using Multivariate Standardized Drought Index and Copula Function Under Climate Change. Water Resour. Manag. 2022, 36, 2865–2888. [Google Scholar] [CrossRef]
- Zhou, J.; Li, Q.; Wang, L.; Lei, L.; Huang, M.; Xiang, J.; Feng, W.; Zhao, Y.; Xue, D.; Liu, C.; et al. Impact of Climate Change and Land-Use on the Propagation from Meteorological Drought to Hydrological Drought in the Eastern Qilian Mountains. Water 2019, 11, 1602. [Google Scholar] [CrossRef] [Green Version]
- Sawada, Y. Quantifying Drought Propagation from Soil Moisture to Vegetation Dynamics Using a Newly Developed Ecohydrological Land Reanalysis. Remote Sens. 2018, 10, 1197. [Google Scholar] [CrossRef] [Green Version]
- Wang, M.; Jiang, S.; Ren, L.; Xu, C.-Y.; Menzel, L.; Yuan, F.; Xu, Q.; Liu, Y.; Yang, X. Separating the effects of climate change and human activities on drought propagation via a natural and human-impacted catchment comparison method. J. Hydrol. 2021, 603, 126913. [Google Scholar] [CrossRef]
- Qin, J.; Zhongbo, Y.; Zhenchun, H.; Gengxin, O.; Zhiyong, W.; Chuanguo, Y.; Huanghe, G. Response of Hydrologic Processes to Future Climate Changes in the Yangtze River Basin. J. Hydrol. Eng. 2014, 19, 211–222. [Google Scholar] [CrossRef]
- Gebresellase, S.H.; Wu, Z.; Xu, H.; Muhammad, W.I. Evaluation and selection of CMIP6 climate models in Upper Awash Basin (UBA), Ethiopia. Theor. Appl. Climatol. 2022, 149, 1521–1547. [Google Scholar] [CrossRef]
- Chen, X.; Han, R.; Feng, P.; Wang, Y. Combined effects of predicted climate and land use changes on future hydrological droughts in the Luanhe River basin, China. Nat. Hazards 2022, 110, 1305–1337. [Google Scholar] [CrossRef]
- Wang, Y.; Li, J.; Wang, Y.; Bai, J. Regional social-ecological system coupling process from a water flow perspective. Sci. Total Environ. 2022, 853, 158646. [Google Scholar] [CrossRef]
- Zhang, X.; Chen, P.; Han, Y.; Chang, X.; Dai, S. Quantitative analysis of self-purification capacity of non-point source pollutants in watersheds based on SWAT model. Ecol. Indic. 2022, 143, 109425. [Google Scholar] [CrossRef]
- Ning, T.; Li, Z.; Liu, W. Separating the impacts of climate change and land surface alteration on runoff reduction in the Jing River catchment of China. CATENA 2016, 147, 80–86. [Google Scholar] [CrossRef]
- Kim, J.H.; Sung, J.H.; Shahid, S.; Chung, E.-S. Future Hydrological Drought Analysis Considering Agricultural Water Withdrawal Under SSP Scenarios. Water Resour. Manag. 2022, 36, 2913–2930. [Google Scholar] [CrossRef]
- Liu, J.; Chen, J.; Xu, J.; Lin, Y.; Yuan, Z.; Zhou, M. Attribution of Runoff Variation in the Headwaters of the Yangtze River Based on the Budyko Hypothesis. Int. J. Environ. Res. Public Health 2019, 16, 2506. [Google Scholar] [CrossRef] [Green Version]
- Hamed, K.H. Exact distribution of the Mann–Kendall trend test statistic for persistent data. J. Hydrol. 2009, 365, 86–94. [Google Scholar] [CrossRef]
- Meng, X.; Gao, X.; Li, S.; Lei, J. Spatial and Temporal Characteristics of Vegetation NDVI Changes and the Driving Forces in Mongolia during 1982–2015. Remote Sens. 2020, 12, 603. [Google Scholar] [CrossRef] [Green Version]
- Wu, Z.; Chen, X.; Lu, G.; Xiao, H.; He, H.; Zhang, J. Regional response of runoff in CMIP5 multi-model climate projections of Jiangsu Province, China. Stoch. Environ. Res. Risk Assess. 2017, 31, 2627–2643. [Google Scholar] [CrossRef]
- Cao, S.; Zhang, L.; He, Y.; Zhang, Y.; Chen, Y.; Yao, S.; Yang, W.; Sun, Q. Effects and contributions of meteorological drought on agricultural drought under different climatic zones and vegetation types in Northwest China. Science of The Total Environment 2022, 821, 153270. [Google Scholar] [CrossRef] [PubMed]
- Wang, W.; Wang, J.; Romanowicz, R. Uncertainty in SPI Calculation and Its Impact on Drought Assessment in Different Climate Regions over China. J. Hydrometeorol. 2021, 22, 1369–1383. [Google Scholar] [CrossRef]
- Aksoy, H.; Cetin, M.; Eris, E.; Burgan, H.I.; Cavus, Y.; Yıldırım, I.; Sivapalan, M. Critical drought intensity-duration-frequency curves based on total probability theorem-coupled frequency analysis. Hydrol. Sci. J. /J. Sci. Hydrol. 2021, 66, 1337–1358. [Google Scholar] [CrossRef]
- Won, J.; Kim, S. Ecological Drought Condition Index to Monitor Vegetation Response to Meteorological Drought in Korean Peninsula. Remote Sens. 2023, 15, 337. [Google Scholar] [CrossRef]
- Wu, J.; Miao, C.; Zheng, H.; Duan, Q.; Lei, X.; Li, H. Meteorological and Hydrological Drought on the Loess Plateau, China: Evolutionary Characteristics, Impact, and Propagation. J. Geophys. Res. Atmos. 2018, 123, 11569–11584. [Google Scholar] [CrossRef]
- Wu, Z.; Lin, Q.; Lu, G.; He, H.; Qu, J.J. Analysis of hydrological drought frequency for the Xijiang River Basin in South China using observed streamflow data. Nat. Hazards 2015, 77, 1655–1677. [Google Scholar] [CrossRef]
- Sun, C.X.; Zhou, X. Characterizing Hydrological Drought and Water Scarcity Changes in the Future: A Case Study in the Jinghe River Basin of China. Water 2020, 12, 1605. [Google Scholar] [CrossRef]
- Mendicino, G.; Senatore, A. Evaluation of parametric and statistical approaches for the regionalization of flow duration curves in intermittent regimes. J. Hydrol. 2013, 480, 19–32. [Google Scholar] [CrossRef]
- Yuan, F.; Ma, M.; Ren, L.; Shen, H.; Li, Y.; Jiang, S.; Yang, X.; Zhao, C.; Kong, H. Possible Future Climate Change Impacts on the Hydrological Drought Events in the Weihe River Basin, China. Adv. Meteorol. 2015, 2016, 1–14. [Google Scholar] [CrossRef] [Green Version]
- Tabassum, F.; Krishna, A.P. Spatio-temporal drought assessment of the Subarnarekha River basin, India, using CHIRPS-derived hydrometeorological indices. Environ. Monit. Assess. 2022, 194, 902. [Google Scholar] [CrossRef]
- Seyoum, W.M. Characterizing Water Storage Trends and Regional Climate Influence Using GRACE Observation and Satellite Altimetry Data in the Upper Blue Nile River Basin. J. Hydrol. 2018, 566, 274–284. [Google Scholar] [CrossRef]
- Lin, Q.; Wu, Z.; Zhang, Y.; Peng, T.; Chang, W.; Guo, J. Propagation from meteorological to hydrological drought and its application to drought prediction in the Xijiang River basin, South China. J. Hydrol. 2023, 617, 128889. [Google Scholar] [CrossRef]
- Cheng, H.; Wang, W.; van Oel, P.R.; Lu, J.; Wang, G.; Wang, H. Impacts of different human activities on hydrological drought in the Huaihe River Basin based on scenario comparison. J. Hydrol. Reg. Stud. 2021, 37, 100909. [Google Scholar] [CrossRef]
- Hamdi, M.; Goïta, K. Investigating Terrestrial Water Storage Response to Meteorological Drought in the Canadian Prairies. Sustain. 2022, 14, 13216. [Google Scholar] [CrossRef]
- Mpelasoka, F.; Awange, J.L.; Goncalves, R.M. Accounting for Dynamics of Mean Precipitation in Drought Projections: A Case Study of Brazil for the 2050 and 2070 Periods. Sci. Total Environ. 2018, 622–623, 1519–1531. [Google Scholar] [CrossRef]
- Chen, H.; Sun, J.; Lin, W.; Xu, H. Comparison of CMIP6 and CMIP5 models in simulating climate extremes. Sci. Bull. 2020, 65, 1415–1418. [Google Scholar] [CrossRef]
- Lun, Y.; Liu, L.; Cheng, L.; Li, X.; Li, H.; Xu, Z. Assessment of GCMs simulation performance for precipitation and temperature from CMIP5 to CMIP6 over the Tibetan Plateau. Int. J. Climatol. 2021, 41, 3994–4018. [Google Scholar] [CrossRef]
- Simpkins, G. Progress in climate modelling. Nat. Clim. Chang. 2017, 7, 684–685. [Google Scholar] [CrossRef]
- Guo, H.; Zhan, C.; Ning, L.; Li, Z.; Hu, S. Evaluation and comparison of CMIP6 and CMIP5 model performance in simulating the runoff. Theor. Appl. Climatol. 2022, 149, 1451–1470. [Google Scholar] [CrossRef]
- Cui, T.; Li, C.; Tian, F. Evaluation of Temperature and Precipitation Simulations in CMIP6 Models Over the Tibetan Plateau. Earth Space Sci. 2021, 8, e2020EA001620. [Google Scholar] [CrossRef]
Figure 1.
Study area and its location.
Figure 1.
Study area and its location.
Figure 2.
Flowchart including the input dataset, method, and output result.
Figure 2.
Flowchart including the input dataset, method, and output result.
Figure 3.
Diagram of drought identification using the run theory.
Figure 3.
Diagram of drought identification using the run theory.
Figure 4.
Taylor diagrams of precipitation under different RCPs scenario: (a) RCP4.5 and (b) RCP8.5.
Figure 4.
Taylor diagrams of precipitation under different RCPs scenario: (a) RCP4.5 and (b) RCP8.5.
Figure 5.
Comparison between simulated runoff and observed runoff in the JRB.
Figure 5.
Comparison between simulated runoff and observed runoff in the JRB.
Figure 6.
Evolution trends of different time scales of the SPI.
Figure 6.
Evolution trends of different time scales of the SPI.
Figure 7.
Distribution of spatiotemporal scale of meteorological drought characteristics under the RCP4.5 scenario: (a) Drought Duration of SPI−1; (b) Drought Duration of SPI−3; (c) Drought Duration of SPI−12; (d) Drought Severity of SPI−1; (e) Drought Severity of SPI−3; (f) Drought Severity of SPI−12.
Figure 8.
Distribution of the spatiotemporal scale of meteorological drought characteristics under the RCP8.5 scenario: (a) Drought Duration of SPI−1; (b) Drought Duration of SPI−3; (c) Drought Duration of SPI−12; (d) Drought Severity of SPI−1; (e) Drought Severity of SPI−3; (f) Drought Severity of SPI−12.
Figure 9.
Evolution trends of different time scales of the SRI.
Figure 9.
Evolution trends of different time scales of the SRI.
Figure 10.
Distribution of spatiotemporal scale of hydrological drought characteristics under the RCP4.5 scenario: (a) Drought Duration of SRI−1; (b) Drought Duration of SRI−3; (c) Drought Duration of SRI−12; (d) Drought Severity of SRI−1; (e) Drought Severity of SRI−3; (f) Drought Severity of SRI−12.
Figure 11.
Distribution of spatiotemporal scale of hydrological drought characteristics under the RCP8.5 scenario: (a) Drought Duration of SRI−1; (b) Drought Duration of SRI−3; (c) Drought Duration of SRI−12; (d) Drought Severity of SRI−1; (e) Drought Severity of SRI−3; (f) Drought Severity of SRI−12.
Figure 12.
Contour map of “AND” and “OR” type MD return periods of JRB under different scenarios (a) “AND” type in the history; (b) “AND” type RCP4.5 in the future; (c) “AND” type RCP8.5 in the future; (d) “OR” type in the history; (e) “OR” type RCP4.5 in the future; (f) “OR” type RCP8.5 in the future.
Figure 13.
Contour map of “AND” and “OR” type HD return periods of JRB under different scenarios (a) “AND” type in the history; (b) “AND” type RCP4.5 in the future; (c) “AND” type RCP8.5 in the future; (d) “OR” type in the history; (e) “OR” type RCP4.5 in the future; (f) “OR” type RCP8.5 in the future.
Figure 14.
Characteristics of drought propagation under different scenarios.
Figure 14.
Characteristics of drought propagation under different scenarios.
Table 1.
A statistical analysis of the annual average precipitation and temperature.
Table 1.
A statistical analysis of the annual average precipitation and temperature.
| Climate Factors | Mean | Median | Std | Cv |
|---|
| Annual precipitation | 493.12 | 476.71 | 81.98 | 0.17 |
| Annual temperature | 9.63 | 9.62 | 0.62 | 0.06 |
Table 2.
SWAT model input data and hydrometeorological data.
Table 2.
SWAT model input data and hydrometeorological data.
Table 3.
Optimization parameters of SWAT model in the JRB.
Table 3.
Optimization parameters of SWAT model in the JRB.
| Parameter_Name | Definition of Parameters | Fitted_Value | Min_Value | Max_Value |
|---|
| 1:R__CN2.mgt | Runoff curve number | −0.5203 | −0.833 | −0.197 |
| 2:V__ALPHA_BF.gw | Baseflow coefficient | 0.5506 | 0.0834 | 0.5529 |
| 3:V__GW_DELAY.gw | Groundwater delay days | 612.15 | 337.97 | 638.71 |
| 4:V__GWQMN.gw | Limiting of shallow aquifers | 376.24 | −13.65 | 428.57 |
| 5:R__SOL_AWC(..).sol | Soil water availability | 0.044 | −0.1878 | 0.2652 |
| 6:R__SOL_K(..).sol | Saturated hydraulic conductivity | 0.1472 | −0.2225 | 0.4059 |
| 7:R__SOL_BD(..).sol | Moist bulk density | −0.3232 | −0.8726 | −0.261 |
| 8:V__REVAPMN.gw | Guaranteed to shallow groundwater for re-evaporation | 276.26 | 81.38 | 286.88 |
| 9:V__ESCO.hru | Soil evaporation compensation factor | 0.507 | 0.2847 | 0.7309 |
| 10:R__HRU_SLP.hru | Average slope steepness | −0.0957 | −0.2323 | 0.2584 |
| 11:V__SLSUBBSN.hru | Average slope length | 11.61 | 10 | 14 |
| 12:V__CH_K2.rte | Effective hydraulic conductivity of the mainstream | 13.09 | 12.44 | 31 |
| 13:V__EPCO.hru | Plant evaporation compensation factor | 0.0848 | −0.6598 | 0.1366 |
| 14:V__RCHRG_DP.gw | Permeability coefficient of deep aquifers | 0.277 | −0.2745 | 0.3217 |
| 15:V__SURLAG.bsn | Surface runoff delay factor | 3.3509 | 0.75 | 22.7291 |
| 16:V__SFTMP.bsn | Snowfall temperature parameters | 4.3803 | −1.8696 | 9.7401 |
| 17:V__SMTMP.bsn | Snowmelt minimum temperature | −5.187 | −13.3622 | −2.1377 |
| 18:V__SMFMN.bsn | Minimum snow melt day factor | 1.5257 | −0.8357 | 7.1689 |
| 19:V__TRNSRCH.bsn | Proportion of main channel propagation losses into deep aquifers | 0.2142 | 0 | 0.5 |
| 20:V__ESCO.hru | Soil evaporation compensation factor | 0.9305 | 0.7 | 1 |
| 21:V__CANMX.hru | Maximum canopy interception | 3.8433 | 3 | 5 |
Table 4.
Model evaluation of the calibration and validation periods at the hydrological station.
Table 4.
Model evaluation of the calibration and validation periods at the hydrological station.
| Hydrological Station | Calibration (1991–2005) | Validation (2006–2017) |
|---|
| R2 | NSE | RMSE | R2 | NSE | RMSE |
|---|
| Zhangjiashan | 0.75 | 0.72 | 9.45 | 0.83 | 0.79 | 5.56 |
Table 5.
MD and HD duration and severity fitting distribution function and goodness test under different scenarios.
Table 5.
MD and HD duration and severity fitting distribution function and goodness test under different scenarios.
| Periods | Drought Type | Drought Characteristics | Marginal Distribution | Parameter | K-S Test |
|---|
| a | b | D | p-Value |
|---|
| History | MD | Duration | Gamma | 2.9 | 1.64 | 0.1143 | 0.7544 |
| Severity | Gamma | 1.27 | 2.03 | 0.0754 | 0.9869 |
| HD | Duration | Gamma | 1.94 | 6.21 | 0.1216 | 0.9695 |
| Severity | LN | 1.63 | 1.19 | 0.1347 | 0.9317 |
| RCP4.5 | MD | Duration | Gamma | 2.32 | 1.82 | 0.1174 | 0.5998 |
| Severity | Gamma | 1.14 | 2.89 | 0.0902 | 0.8254 |
| HD | Duration | Gamma | 1.19 | 7.23 | 0.1571 | 0.5451 |
| Severity | Weibull | 3.13 | 13.52 | 0.2022 | 0.7399 |
| RCP8.5 | MD | Duration | Gamma | 1.87 | 2.44 | 0.0845 | 0.8699 |
| Severity | Gamma | 1.36 | 2.67 | 0.0701 | 0.9657 |
| HD | Duration | Gamma | 1.54 | 4.92 | 0.1399 | 0.7547 |
| Severity | Weibull | 0.57 | 7.58 | 0.0873 | 0.9927 |
Table 6.
Best-fit Copula function test between duration and severity of MD and HD under different scenarios.
Table 6.
Best-fit Copula function test between duration and severity of MD and HD under different scenarios.
| Periods | Drought Type | Copulas | Correlation | Parameters | AIC Value | BIC Value |
|---|
| History | MD | Frank | 0.69 | 9.53 | −34.71 | −33.23 |
| HD | Gumbel | 0.71 | 3.85 | −20.73 | −20.09 |
| RCP4.5 | MD | Gumbel | 0.72 | 3.33 | −63.5 | −61.72 |
| HD | Gumbel | 0.7 | 3.31 | −24.1 | −15.52 |
| RCP8.5 | MD | Frank | 0.75 | 12.55 | −69.22 | −67.39 |
| HD | Gumbel | 0.79 | 4.72 | −40.93 | −39.89 |
| Disclaimer/Publisher’s Note: The statements, opinions and data contained in all publications are solely those of the individual author(s) and contributor(s) and not of MDPI and/or the editor(s). MDPI and/or the editor(s) disclaim responsibility for any injury to people or property resulting from any ideas, methods, instructions or products referred to in the content. |
© 2023 by the authors. Licensee MDPI, Basel, Switzerland. This article is an open access article distributed under the terms and conditions of the Creative Commons Attribution (CC BY) license (https://creativecommons.org/licenses/by/4.0/).


