Article

Prospects of Consumer-Grade UAVs for Overpass Bridges Pier Pads Alignment

by
Hasan Abdulhussein Jaafar
1,* and
Bashar Alsadik
2
1
Civil Department, Faculty of Engineering, University of Kufa, Kufa 54003, Iraq
2
ITC Faculty, University of Twente, 7522 NB Enschede, The Netherlands
*
Author to whom correspondence should be addressed.
Remote Sens. 2023, 15(4), 877; https://doi.org/10.3390/rs15040877
Submission received: 8 January 2023 / Revised: 27 January 2023 / Accepted: 2 February 2023 / Published: 5 February 2023

Abstract

:
The use of Unmanned Aerial Vehicles (UAVs) for surveying is at the forefront of their use in the Architectural Engineering and Construction (AEC) industry. UAVs make accessing hard-to-reach construction regions simpler and more cost-effective because of their small size, ease of mobility, and the wealth of information given by their integrated sensors. Accordingly, their use is thriving in different AEC sectors such as the management and inspection of engineering facilities such as concrete bridges. Overpass bridge engineering inspections are still applied using high accuracy surveying instruments in situ to ensure meeting the quality standards of construction. One important application is to measure the bridge pier caps centerline fitting using total stations, which is costly in terms of time and labor. Therefore, in this article, a new approach based on consumer-grade UAV imaging is proposed for replacing the traditional surveying techniques which are expected to improve automation and reduce time and cost. The proposed method utilized a sequence of processes on the UAV point clouds of the bridge concrete pier caps to finally extract the pier pads center and check their alignment. In two experiments, point clouds are created using DJI Phantom 3 images taken over bridge pier projects under construction, and concrete pad centers are then estimated and compared to the reference total station measurements. The results of both tests reveal the ability of the proposed method to attain the required accuracy for the pads’ alignment, as the root mean square error (RMSE) is one centimeter and two centimeters for the first and second tests, respectively. In addition, the new approach can reduce implementation time and the project budget.

1. Introduction

The integration of photogrammetry and computer vision has paved the way for low-cost solutions for many image-based applications. Thanks to Structure-from-Motion (SfM), it is possible to provide high-quality results given recent advances in automation. In addition, Unmanned Aerial Vehicle (UAV) development has added new applications in the field of aerial photogrammetry owing to it being a cost-effective method of data acquisition compared to the use of classical manned aircraft [1]. In the Geoscience field, UAV photogrammetry has been applied in: river morphological mapping [2], the detection and mapping of land surface elevation changes [3], the reconstruction of topography and geomorphic features of quarries [4], mapping ground elevations of a grower’s field [5], mapping the topography of sand dunes [6], mapping and characterizing landslides [7], the topography of a slope for the purpose of landslide-related disaster reduction [8], observing high mountains in the Himalayas for the purpose of assessing where flood and landslide events present a risk to populations and infrastructure [9], urban flood damage assessment and mapping of houses that were washed away, destroyed, or with total roof collapse [10], analyzing sediment budget under the particular vegetation cover of a foredune and a beach [11], automatic marine litter detection [12], and the field of glacial and periglacial geomorphology [13].
Furthermore, UAVs have shown great potential in the sector of Architectural Engineering and Construction (AEC), especially in the Structural Health Monitoring (SHM) of huge and complex structures such as bridges. For example, Yoon and Shin [14] have proposed a framework to measure the absolute displacement of a structure from a video taken from a UAV. They inferred that the proposed approach can estimate the displacement of structures with an RMSE of about 2.14 mm, corresponding to 1.2 pixels of image resolution. Another example, Jongerius [15] has reviewed the use of UAVs for bridge inspection along with expert views collected by interviews. Dorafshan and Maguire [16] have also reviewed the literature for the United States bridge inspection programs and presented how automated and unmanned bridge inspections can be made suitable for present and future prospects. In addition, UAVs have been employed in a high-accuracy inspection system for the crane tracks of storage cranes at the Container Terminal Altenwerder (CTA) [17,18]. A UAV-based fully automatic workflow was proposed to deduce the outline of an elongated track system. The accuracy of the results is as high as a 2 mm error in planimetry and 8 mm error in altitude. Debus and Rodehorst [19] have suggested a method for the computation of flight paths for visual UAV bridge inspection which is based on different levels of interest defined for parts of a structure. This method was applied on the Scherkonde bridge, Germany, which proved its ability to determine a flight plan that covers specific areas of a structure in high resolution while covering the other parts of the structure in lower resolution. Perry and Guo [20] have developed an automated bridge inspection system based on UAV technologies, computer vision, and machine learning techniques. Through experimental tests, they demonstrated the advantages of the proposed method to quantify and visualize damage automatically. Gaspari and Ioli [21] have compared two different approaches for bridge inspection: a UAV LiDAR-based method and an integrated traditional topographic survey with a UAV photogrammetry method. The results revealed a centimetric accuracy, i.e., 1.5–2.5 cm of the traditional method compared to 5–10 cm of the UAV-LiDAR technique. Ioli and Pinto [22] have presented a procedure based on UAV photogrammetry for the metric reconstruction of cracks on concrete bridges. The results of the test detected cracks reconstructed with millimetric accuracy when flying at a distance of ~4 m from the abutment surface.
Traditionally, field surveying techniques using total stations and GNSS instruments are used in the application of SHM to provide the required high accuracy measures. Obviously, these field surveying technique results still offer the best quality control in construction and monitoring. However, the use of UAVs in such engineering applications is gradually increasing because they reduce cost, time, and risk. Moreover, they offer a rich texture from the images and then efficient as-built 3D point clouds of the structures which open channels for more data extraction automation.
In the photogrammetry field, several researchers such as Fraser [23] and Förstner [24] have conducted different tests to estimate the coincidence of the theoretical accuracy of stereo-vision photogrammetry with the empirical results. In addition, estimating the absolute accuracy is conventionally done by computing the root mean square error (RMSE) using ground control points (GCPs) distributed over the object of interest, where some points serve as checkpoints. For instance, Martínez-Carricondo and Agüera-Vega [1] have analyzed the influence of the number and distribution of GCPs on the accuracy of DSMs derived from UAV photogrammetry. They inferred that edge distribution and stratified distribution with a density of around 0.5–1 GCP per hectare are the best for error minimization. Likewise, Sanz-Ablanedo and Chandler [25] have empirically investigated the accuracy of a 3D SfM based on the location and number of control points used for geo-referencing. They have stated that an accuracy of about 2–2.5 times that of ground sample distance (GSD) can be achieved by utilizing a higher number of GCPs (2–3 GCPs per 100 photos). Ferrer-González and Agüera-Vega [26] have assessed the optimal number and distribution of GCPs in a linear photogrammetric project, e.g., a road. They concluded that the best optimal results can be obtained from utilizing 4.3–5.2 GCPs per km distributed on a zigzagging pattern on both sides of the road with a pair of GCPs at each end of the road. In contrast, Chudley and Christoffersen [27] have researched the possibility of acquiring accurate results with no ground control. They proposed employing an onboard Real-Time Kinematic (RTK) GNSS receiver to determine the images’ external orientation. They achieved an accuracy of about ±0.12 m (1.1 times that of GSD) and ±0.14m (1.3 times that of GSD) in planimetry and altimetry, respectively, at an altitude of 450 m above ground level. Furthermore, accuracies have been investigated in UAV–SfM models produced from image sets collected with various imaging angles (0–35°) [28]. It has been concluded that higher overlap and higher oblique camera angles (20–35°) increased precision and accuracy by nearly 50% relative to nadir-only image blocks. In addition, Wiącek and Pyka [29] have assessed the accuracy of the bundle adjustment of UAV image blocks in different scenarios: flight height, flight directions, direct and indirect georeferencing, and camera specifications (with or without rolling shutter). They stated that the highest accuracies were obtained using a grid flight plan with varying flight altitude for both direct and indirect georeferencing, while the RMSE was at a similar level for both cameras. Moreover, the performances of different SfM software packages have been assessed [30]. Five software packages were compared: Agisoft PhotoScan [31], Inpho UAS Master [32], Pix4D [33], ContextCapture [34], and MicMac [35]. It was concluded that an accuracy of about 1 GSD for the horizontal and less than 1.5 GSD for the vertical components can be obtained. Finally, the accuracy of digital terrain models (DTM) has been reviewed based on various variables related to the terrain, UAV flight, camera sensor, georeferencing, and post-processing [36].
However, to the authors’ knowledge, UAVs have not been researched in terms of inspecting newly constructed overpass bridges, where geometric checks are required in different key stages compared to the proposed design. For instance, it is required to check the coordinates and the elevations of the constructed piles and pile caps before starting the next stage, which is constructing piers and pier caps. In addition, the constructed concrete pads in the pier caps are checked again before constructing the girders (Figure 1). This is normally done by supervisors or quality control engineers utilizing traditional surveying instruments such as total stations and GNSS.
Accordingly, this research aims to propose a new UAV-based technique as an alternative method for geomatical checks of concrete pads, in terms of the 3D coordinate centers of newly built bridges. Hence, we attempt to answer the following research questions:
  • How to extract the construction geometrical features of the pier pads from the UAV data?
  • Does the quality of results from consumer-grade UAV data fit the required engineering quality standards of the inspection?
  • What will be achieved by using UAVs for the inspection in terms of time, cost, and safety?
Following the introduction to this paper is Section 2, which contains a review of the existing standards and norms for the bridge inspection and tolerances, followed by the presentation of the proposed method in Section 3, then continuing to Section 4 which presents the results of the experimental test. Section 5 is allocated for discussions, and conclusions will be given in Section 6.

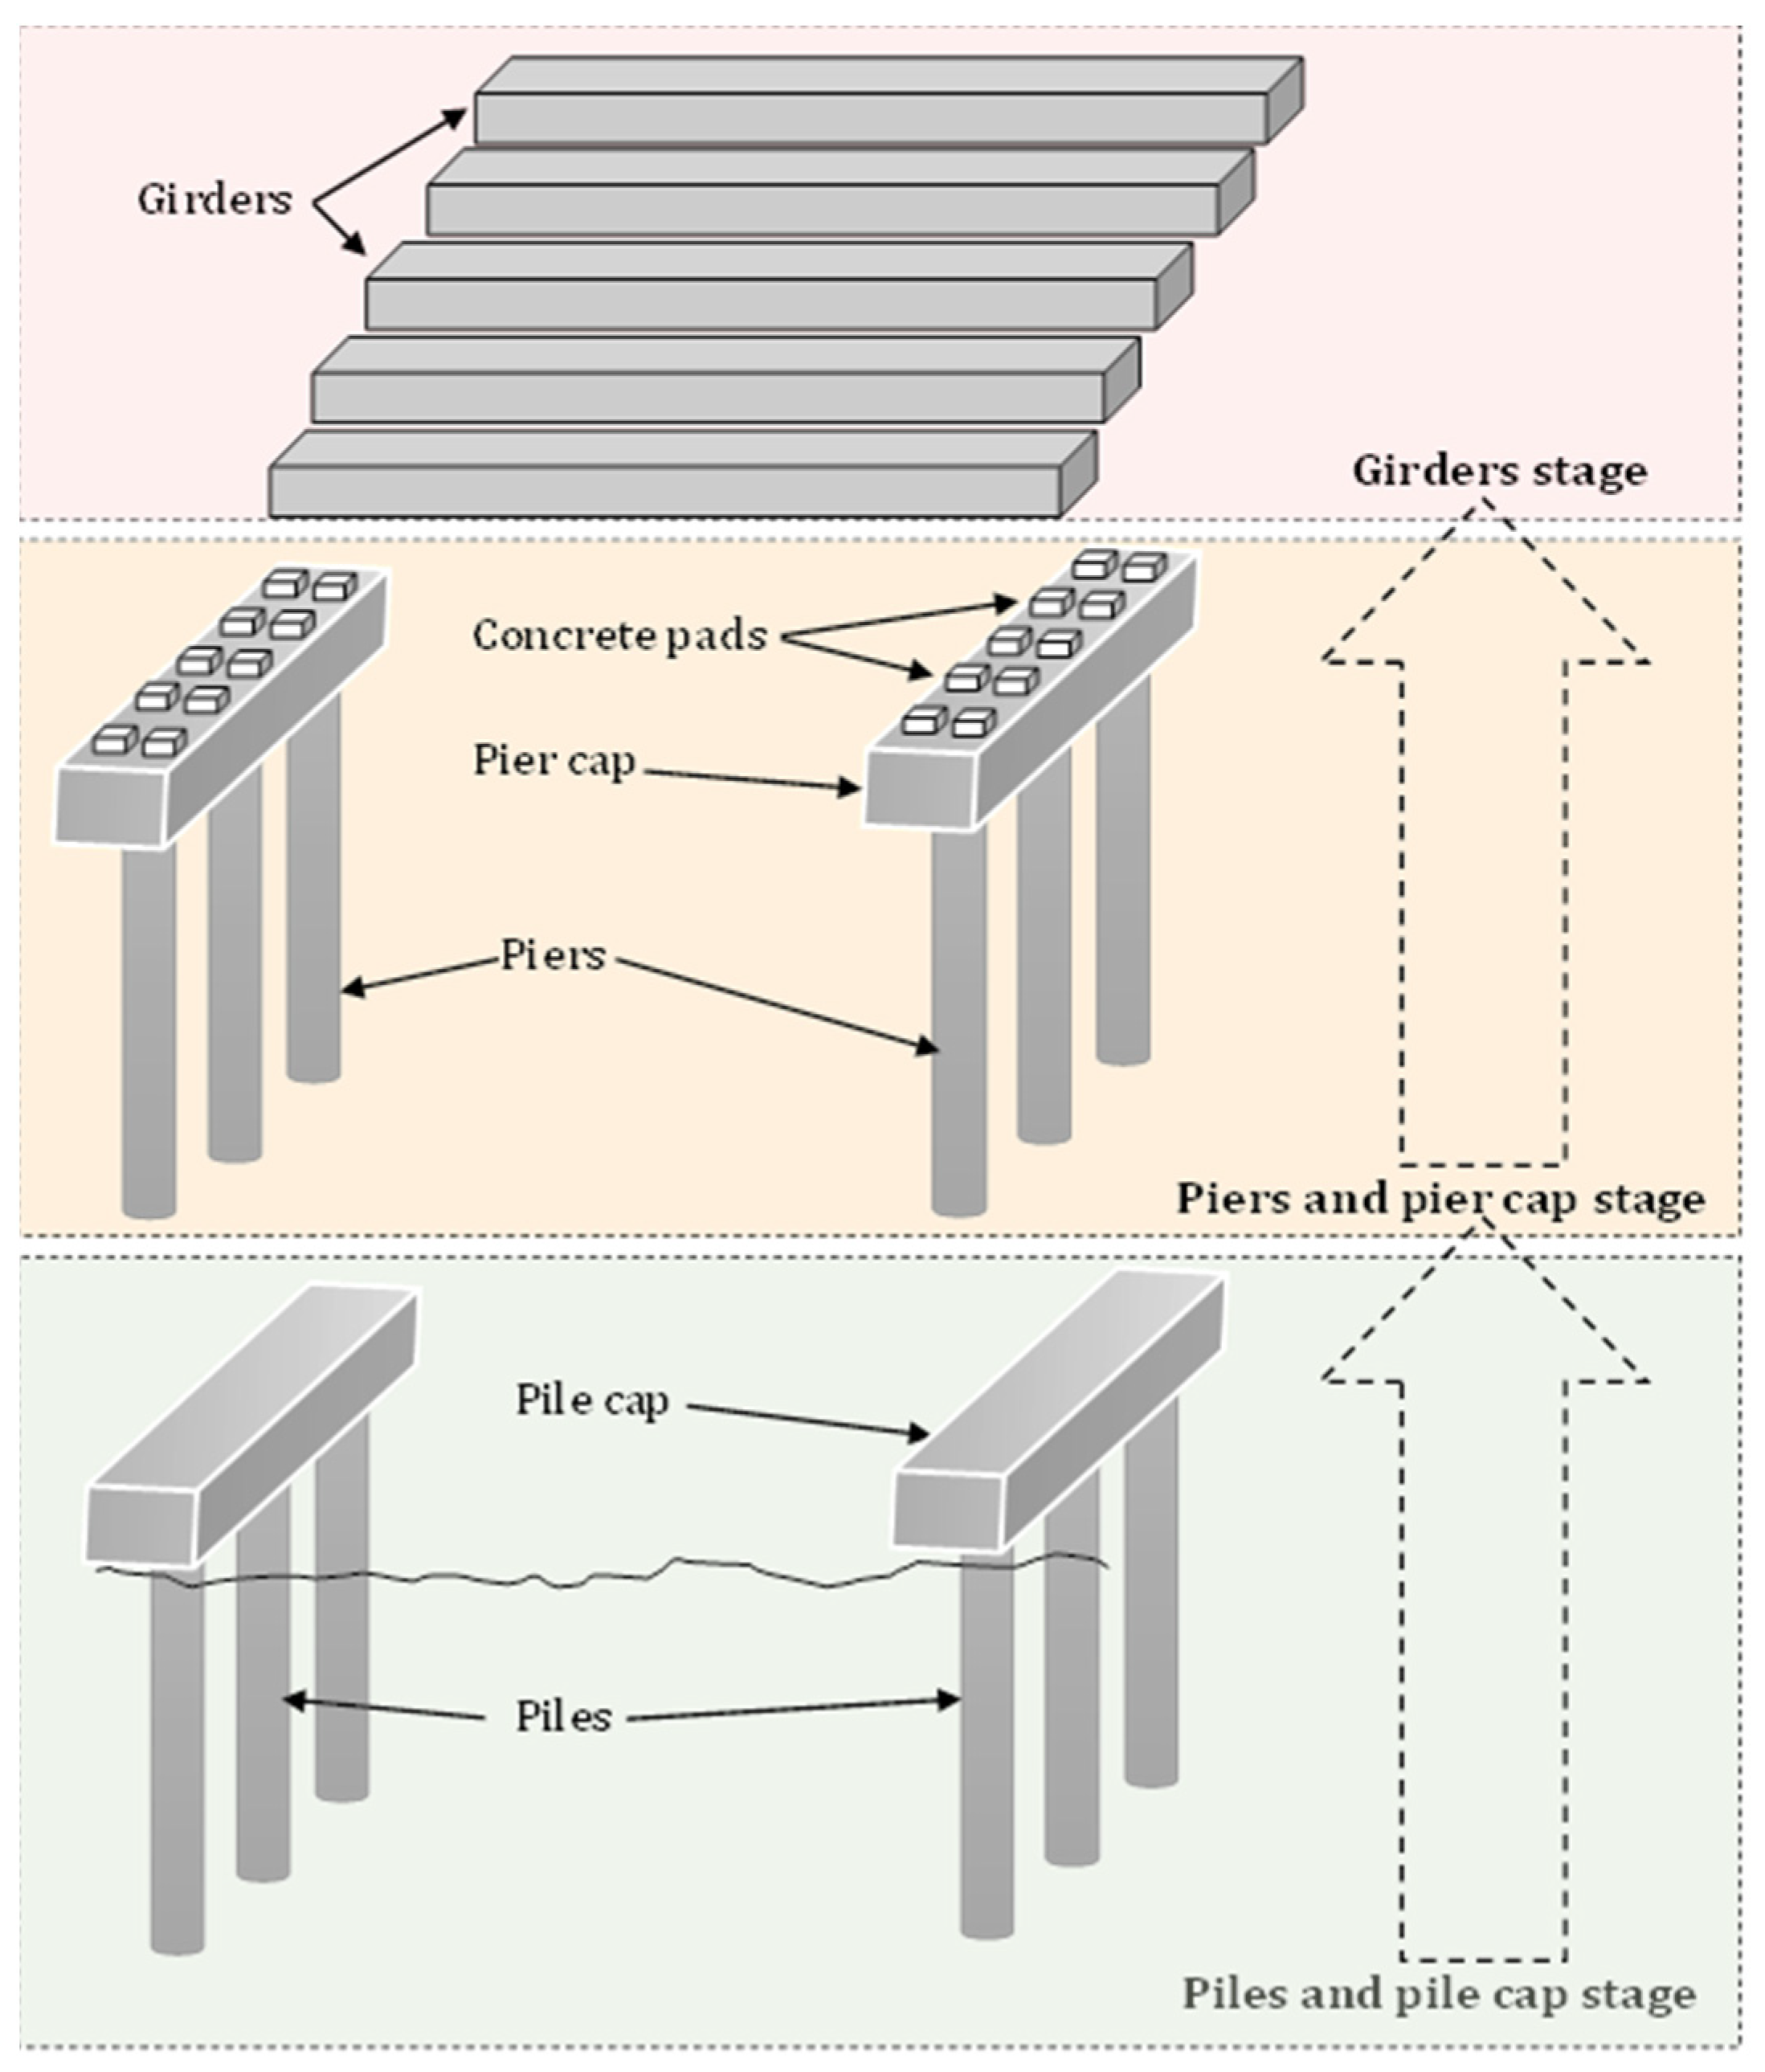
2. Inspection Standards and Tolerances

The inspection and testing of bridges shall be undertaken against the relevant specifications and within the quality requirements. For this purpose, the European Standard (EN) specifies a list of the required inspections [37,38]. One standard from the list is to survey the geometrical position of connection nodes, which is our concern in this paper. In addition, it is suggested in these norms to employ methods and instruments from those listed in ISO-7976-1 [39] and ISO-7976-2 [40], which must be calibrated according to ISO-17123 [41]. Interestingly, point cloud survey methods are also suggested if they take into account the capability of the survey process in terms of accuracy relative to the acceptance criteria, in clause 12 Section 12.7.3.1 in CEN [37]. Accordingly, the authors suggest employing this technique to survey the geometrical position of pier pads.
On the other hand, tolerances shall be incorporated into the structural analysis to cover the effects of geometrical imperfections. Tolerances can be a lack of verticality, lack of straightness, lack of flatness, lack of fit, and the unavoidable minor eccentricities present in the joints of an unloaded structure [38]. In general, there are two types of tolerances [37]:
Essential tolerances: a range of criteria that are essential for the mechanical resistance and stability of the completed structure.
Functional tolerances: other criteria related to fit-up and appearance.
On the other hand, CONSTRUCT [42] adopted a hierarchy of tolerances such that each level must be contained within the tolerance of a higher level; hence, four levels are suggested:
  • The first level for the overall tolerance of the whole structure.
  • The second level for the positional tolerance of the structure elements.
  • The third level for the dimensional tolerance of the individual elements.
  • The fourth level for the positional tolerance inside the individual elements, e.g., reinforcement.
For the first level, CONSTRUCT [42] specifies ±15 mm for the permitted vertical deviation, while the following, Equation (1), is to determine the tolerance of the horizontal location (x,y):
Δ = H 200 n   , | Δ | 50   mm
where H is the height at location (ranged between 7 and 10 m for overpass bridges), and n is the number of stories (one for bridges).
On the other hand, for the second level, it is suggested that ±25 mm is the permitted deviation in the x and y position, and ±20 mm is the permitted deviation in the elevation [42]. Likewise, the American Concrete Institute (ACI), ACI 117-10 Section 11, specifies that the tolerance of the horizontal and vertical position for bearing pads is ±2.54 cm (±1 in) [43].
In this paper, the objective is to assess the proposed method (Section 3) associated with the first and the second level of tolerances. The quality of the results will be checked to reference measurements applied by using a typical total station instrument with an accuracy of 2 mm ± 2 ppm. Based on the abovementioned standards, the targeted accuracy for the purpose of comparison in this research is ±50 mm for the x and y positions, and ±25 mm for the elevation (z).

3. Methodologies and Materials

Generally, the proposed method is divided into two main stages (Figure 2). The first stage includes constructing the point cloud from UAV images, which involves two main parts: flight planning and georeferencing strategy. The second stage represents our innovative procedures for automatically extracting the required geometry from the constructed pier caps. The input variables for the former are the required accuracy and specifications of the used UAV, while the latter takes into account different considerations such as geometrical shape, feasibility (full or semi-automation), time-consumption, etc. As indicated, Figure 2 illustrates the general proposed methodology for extracting the bridge pier pad centres from UAV imagery.
To give the readers more insight into our proposed methodology, the intended UAV flight planning is explained and then followed by a section about our described approach to extracting the pier pad geometries from the UAV imageries.

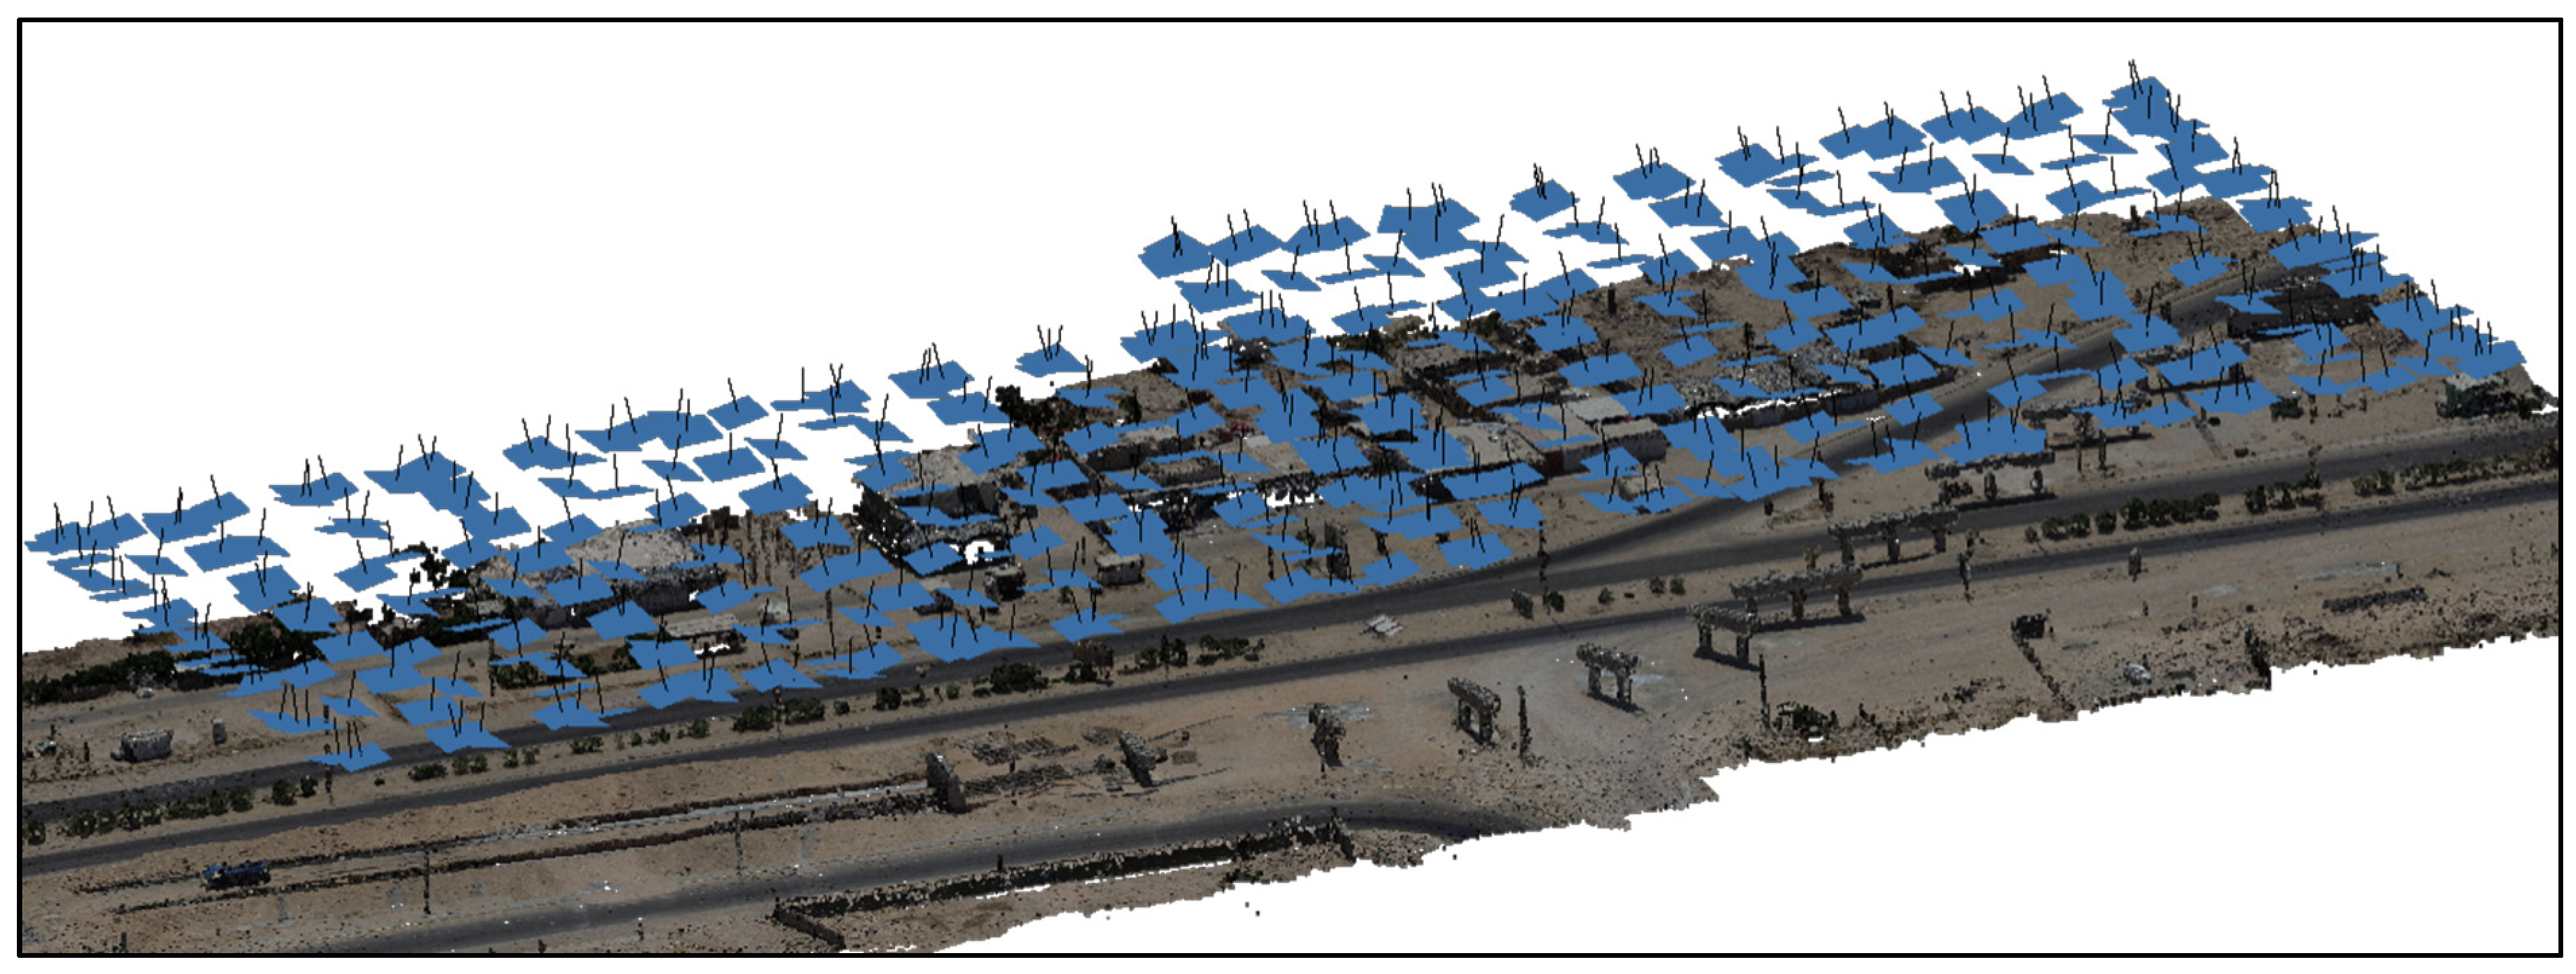
3.1. Flight Plan and Georeferencing Strategy

As described in the previous section, the UAV data collection starts with the flight planning step, where several parameters should be determined to reach the required quality and resolution. Mainly, UAV flying height, image overlap, and theoretical accuracy can be estimated from single and stereopair image geometry. The average flying height H is computed using the focal length f, the Ground Sample Distance GSD, and the pixel size Pix (Equation (2)):
H = f × G S D P i x
From Equation (2), two considerations are taken into account when calculating the flight height: camera specifications and required accuracy. The related camera specifications are sensor size and focal length, while the required accuracy is achieved relative to the GSD. According to the literature, an accuracy of two or fewer times that of GSD can be achieved if an adequate number of GCPs with proper distribution are employed [17,18,25,27,30,36]. In addition, it is worth mentioning that, in nadir photogrammetry, elevation precision is less than horizontal precision. This impacted setting up the proposed GSD to be at least half of the required accuracy of elevations. Accordingly, based on the required geometrical tolerance of the bridge pier caps discussed in Section 2, where the required tolerance is ±25 mm for elevations, the suggested GSD for the UAV flight mission should not be larger than 13 mm.
In addition, it is worth mentioning that the number and distribution of GCPs in bridge projects presents a challenge since they are distributed in an elongated shape, and it is difficult to obtain a good GCP network. The suggested strategy for such a case is to locate at least one GCP point at each pier cap. Furthermore, inspired by Ferrer-González and Agüera-Vega [26], GCPs will be placed in a zigzag shape. Auxiliary GCPs aside from the bridge pier caps will also be placed to strengthen the georeferencing geometry.

3.2. Geometrical Features Extraction

After the 3D reconstruction step where a dense point cloud of the pier caps site is created, the pier pad centres will be extracted. For the purpose of automation of the proposed method, the required coordinates are not measured directly in the point cloud, but from profiles and cross-sections generated from it. These sections result from a list of procedures conducted in the sequence: segmentation, classification, primitive fitting, and cross-sectioning; with a proper setting based on the shape and features of extracted parts as shown in the general workflow in Figure 2. In more detail, the following processing steps will be applied:
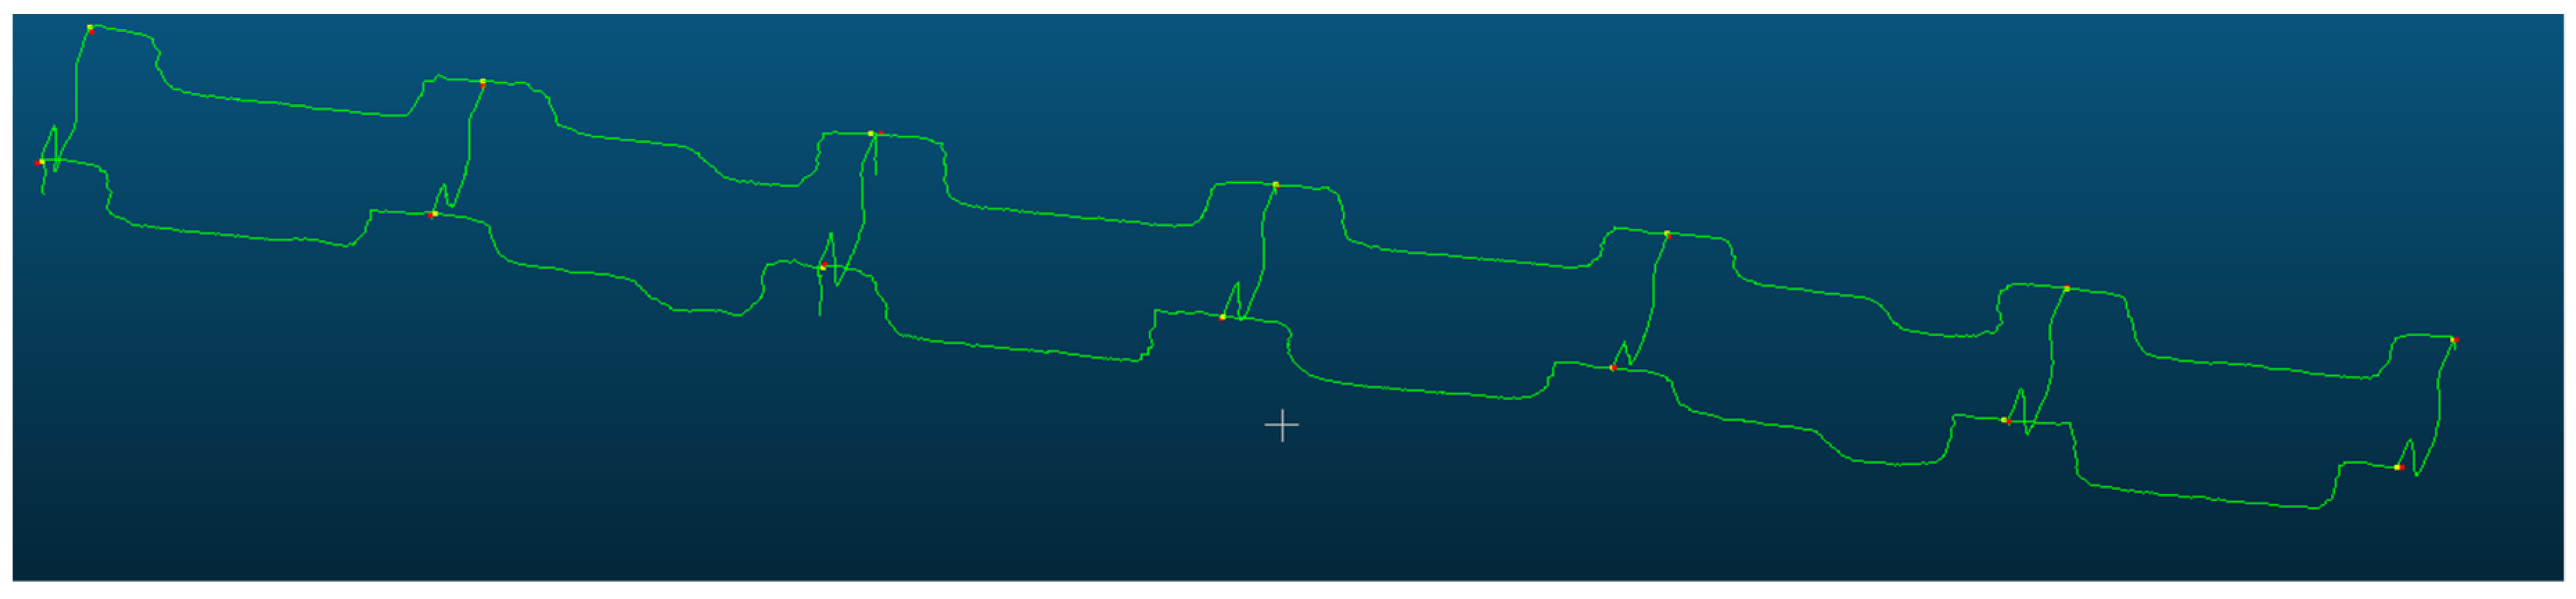
  • Segmenting the pier cap points out of the site point cloud by using a 3D box with proper dimensions and coordinates as shown in Figure 3.
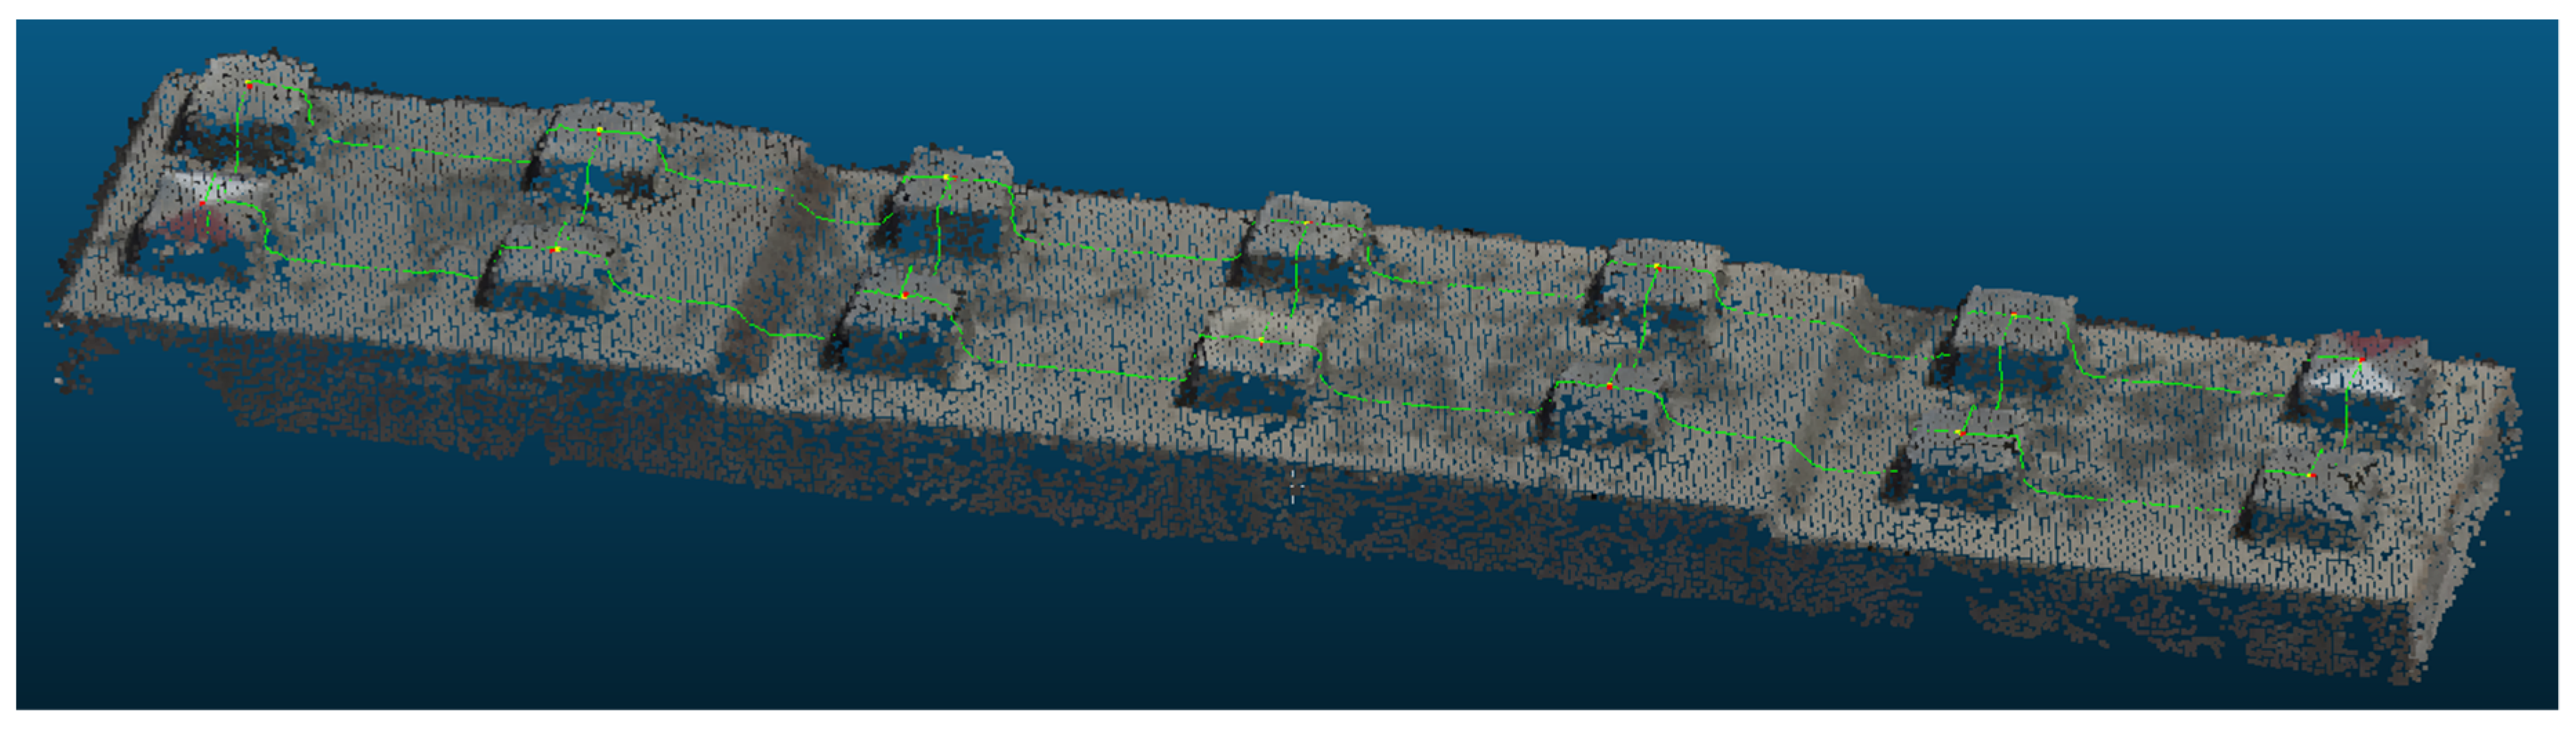
  • Separating the point cloud of each pier using the Connected Component Labelling (CCL) algorithm, as shown in Figure 4.
  • Primitive fitting using the Random Sample Consensus (RANSAC) method follows. For the pier pads extraction, sphere primitive is proposed because of the symmetrical shape of the pads. Furthermore, sphere centers and tops are easier to measure and compose in sections. Figure 5 shows an example of the spheres fitting of pier pads by RANSAC.
  • The vertices of the created spheres are saved to find the points of highest elevation, which represent the tops of the spheres. The spheres’ tops represent the top centres of pier pads. However, the elevations of these points are inaccurate because the tops of the spheres frequently do not fit very well with the pads’ surface.
  • The extracted pad centers are employed as polylines for the created profile and cross-sections, as shown in Figure 6. Vertices of these sections are also saved to find intersecting points between sections. These points represent the required 3D coordinates of the pier pad centers.

4. Experimental Tests

The proposed method described in Section 3 has been applied in two experiments, one is simulated and one is real, for an ongoing project of the construction of a new overpass bridge. In both experiments, the consumer-grade DJI Phantom 3 drone was used, which was equipped with FC300X 12 megapixels camera. The camera has a complementary metal oxide semiconductor (CMOS) sensor of size (6.5 mm × 4.9 mm) divided into (4000 × 3000) pixels, and a focal length of 3.6 mm. According to the previously mentioned standards (Section 2), the flight height in both tests was designed to be ≤30 m to maintain the required GSD value (≤13 mm). In addition, the maximum allowable error of the pier pad points elevation should not exceed ±25 mm; hence, according to Equation (3), the airbase B is designed to be ≤16 m, and the image overlap percentage (Equation (3)) is designed to be ≥60%.
In addition, for both tests, the Agisoft Metashape Professional software was used for camera alignment, self-calibration, and point cloud creation. Furthermore, GCPs and checkpoints were fixed in the project area for indirect georeferencing and quality checks.
On the other hand, the open-source CloudCompare [44] was used to implement some steps of the proposed method.
The following subsections illustrate the work done in both tests.

4.1. First Experiment–Simulated Project

In this first experiment, four bridge piers (15 × 1.6 × 1 m3) were simulated using the open-source tool Blender [45]. To mimic reality, the pier caps were designed to have slightly different elevations while the separation distance between each of them wes 12.6 m, where every pier includes 14 pads (Figure 7). Camera movement and setting were intended to simulate the DJI Phantom 3 drone in a double grid flight pattern which wes composed of 79 oblique (80° from the horizon) images. The UAV images are assumed to be distortion-free since they were taken in a typical simulated setting.
The following flight plan parameters were designed to achieve a GSD of 10 mm to fulfil the aforementioned pier caps surveying accuracy standards.
  • A total of 80% forward overlap and 60% side overlap.
  • A total of 23 m flying height, 6 m airbase, and 15 m separation between flight lines.
Furthermore, five GCPs were placed in the project area to ensure the required referencing on a real scale. Figure 7 shows the flight plan and the simulated scene.
The Metashape software was executed to build a point cloud from the UAV images. The RMSEs that were computed for the GCP coordinates are 6.7 mm, 3.8 mm, and 7.4 mm in X, Y, and Z, respectively. For checkpoints, RMSEs of 10.8 mm, 2.1 mm, and 11.8 mm were computed for X, Y, and Z, respectively. Then, after, 56 points (14 points on each pier) were extracted from the point cloud according to the proposed method, which represents the centres of piers pads. Since the reference centre points of the pier pads are known from the simulation scene, the RMSEs can be calculated. Accordingly, the RMSEs of the extracted pad points are computed as 10 mm, 8 mm, and 3 mm in X, Y, and Z, respectively. Noteably, the differences between the known pad coordinates and measured coordinates resulting from the proposed method are within the required tolerance mentioned in Section 2 for all points, as shown in Figure 8 and Figure 9.

4.2. Second Experiment-Real Project

The second experiment was applied to an ongoing project for the construction of a new overpass bridge, located in An Najaf governorate, Iraq. The piers and pier caps were already constructed and reached the stage of laying girders. However, the contractor required approval from the client before starting the next stage, which is normally done by a quality control (QC) engineer nominated by the client. The works of the QC engineer involve measuring the 3D coordinates of the concrete pad centres and comparing them with the design. This is normally done by field surveying measurements using a total station or GNSS instruments. The bridge has 10 pier caps and each has 14 concrete pads: in total, 140 pads needed to be measured. Hence, the proposed method was applied to the mentioned bridge under construction on 26 May 2021. Firstly, the bridge was photographed using a DJI Phantom 3 UAV according to the flight plan (Figure 10) prepared by Pix4Dcapture App. In addition, the camera angle was set to be t same as the simulated experimental (80° from the horizon). The following flight plan parameters were designed to achieve a GSD of 13 mm to fulfil:
A total of 75% forward overlap and 68% side overlap.
A 30 m flying height, 6 m airbase, and 16 m separation between flight lines.
Then, the coordinates of all of the pads were measured in the standard manner by the total station model TOPCON ES 103, with an angle accuracy of (±3″) and distance accuracy of (2 mm + 2 ppm). The total station-measured coordinates of the pads are considered as the benchmark values for the RMSE estimation.
The result of the UAV flight mission was 400 images, although, due to quality issues, only 300 images were processed by Metashape software. Firstly, the images were aligned utilizing ½ the image resolution, which is indicated by the software as the high accuracy option. The successful image alignment step resulted in a sparse point cloud of 45K tie points and the processing time took about 20 min using a computer with CPU Intel(R) Core (TM) i7-6700 CPU @ 3.40GHz. Consequently, 12 GCPs, along with 8 checkpoints, were measured in the Metashape software to georeference the model. The RMSEs for the GCPs wre 9.2 mm, 4.8 mm, and 4.5 mm for X, Y, and Z, respectively, while the computed RMSEs for the checkpoints were 11.1 mm, 10.8 mm, and 6.3 mm for X, Y, and Z, respectively. Finally, the dense point cloud of the project site was created using the full image resolution in Metashape. After less than 2 h, about 42 million points were created and then exported in a .ply file to be post-processed in CloudCompare version 2.12 software.
The next step was to extract the required coordinates of the pad-centre points according to the proposed method (Section 3.2). Figure 11 proves that the points surveyed with total station are the same ones identified in the dense cloud.
Interestingly, the RMSE of the extracted coordinates using the derived UAV point clouds agrees with the maximum allowable error (Section 2) of 27 mm, 26 mm, and 12 mm for X, Y, and Z respectively. Figure 12 and Figure 13 illustrate the differences between the reference pad coordinates, measured by a total station, and the extracted coordinates using the proposed method on the X and Y, and Z axes, respectively. Obviously, the majority of the points have differences less than the required tolerance; however, a few extracted pad points do not satisfy the required accuracy, which will be discussed in the next section.

5. Discussion

According to the research objectives, the proposed method is discussed in terms of four items: accuracy, time, cost, and safety.

5.1. Accuracy

As expected, all of the extracted centre points accuracies, for the first experiment, were within the required tolerance because of the smaller GSD, and the UAV images were lens distortion-free since they were taken in a typical simulated setting. Undoubtedly, the accuracy of the filed surveying instruments such as the total station is still better than the accuracies attained from image-based platforms used in our proposed method. However, for the second experiment, the general indicator of the accuracy, represented by RMSE, showed promising prospects for the proposed method to satisfy the required accuracy for setting up bridge pier pads. In addition, most of the extracted centre points of the pads were within the desired tolerance, i.e., 93% (131 out of 140), 96% (135 out of 140), and 94% (132 out of 140) for the X, Y, and Z axs, respectively. For the engineering inspection purpose, where it requires ultra-confidence for any used technique, the proposed method needs to be improved by increasing the GSD or using a better-quality UAV camera. The former means a lower flying height which is critical due to safety restrictions and authorizations. Hence, using a camera type with a better resolution and sensor size, with an improved flight plan, could be the solution to this issue.

5.2. Time and Cost

Obviously, the proposed method surpasses the traditional method in terms of cost. The field surveying method requires at least two labourers and one or two technicians, along with expensive instruments such as a total station, compared to one pilot for the consumer-grade UAV. However, the cost is not a major concern for such a vital stage of construction. Essentially, the time cost is important for both the contractor and the client. The traditional method requires at least two days because moving the total station instrument and its reflector from one pier to another is time-consuming. In addition, due to weather restrictions and to attain the required accuracy, the measurements are conducted in only a few hours. On the other hand, the proposed method using a UAV requires about 20–30 min of flying time and about 4–5 h of office work. Table 1 reveals a breakdown of the time-cost of the proposed method of the second test.

5.3. Safety

Labourer safety is also the main interest of both the contractor and the client in such a construction project. The proposed UAV-based method clearly improves the safety of the staff by reducing fieldwork and the need to physically be on the site. Hence, more than 90% of fieldwork is reduced by the proposed approach. Moreover, for the traditional technique, it is required to climb piers that are 7–10 m heigh to measure all pier pads, which may be considered a dangerous task. The fieldwork is also reduced by the proposed method as it is only necessary to measure a few GCPs, compared to the 140 points in the second test. Furthermore, using the proposed method, the movement in the worksite is decreased, which can be a dangerous task in some projects such as in the second experiment that required crossing the main road many times.

6. Conclusions

In this paper, a new approach is suggested for use in overpass bridge inspections, namely, to automatically measure the alignment of pier pads during the construction using consumer-grade UAVs. The proposed method is divided into two steps: firstly, the point cloud is created from UAV images, and, then, extracting the required coordinates of pads from this point cloud. According to the research objectives in this paper, the proposed method is discussed and tested against three items, i.e., geometry extraction technique, accuracy measures, and improvements in time, cost, and safety. Accordingly, the answers to the presented research questions are concluded as follows:
  • The required geometry can be extracted from the point cloud by applying a series of computations using RANSAC and extracting point cloud cross-sections. Through RANSAC sphere fitting, it was possible to determine the centre of pier pads automatically while filtering outliers. Consequently, the proposed technique for geometry extraction offered both automation and feasibility in attaining accuracy.
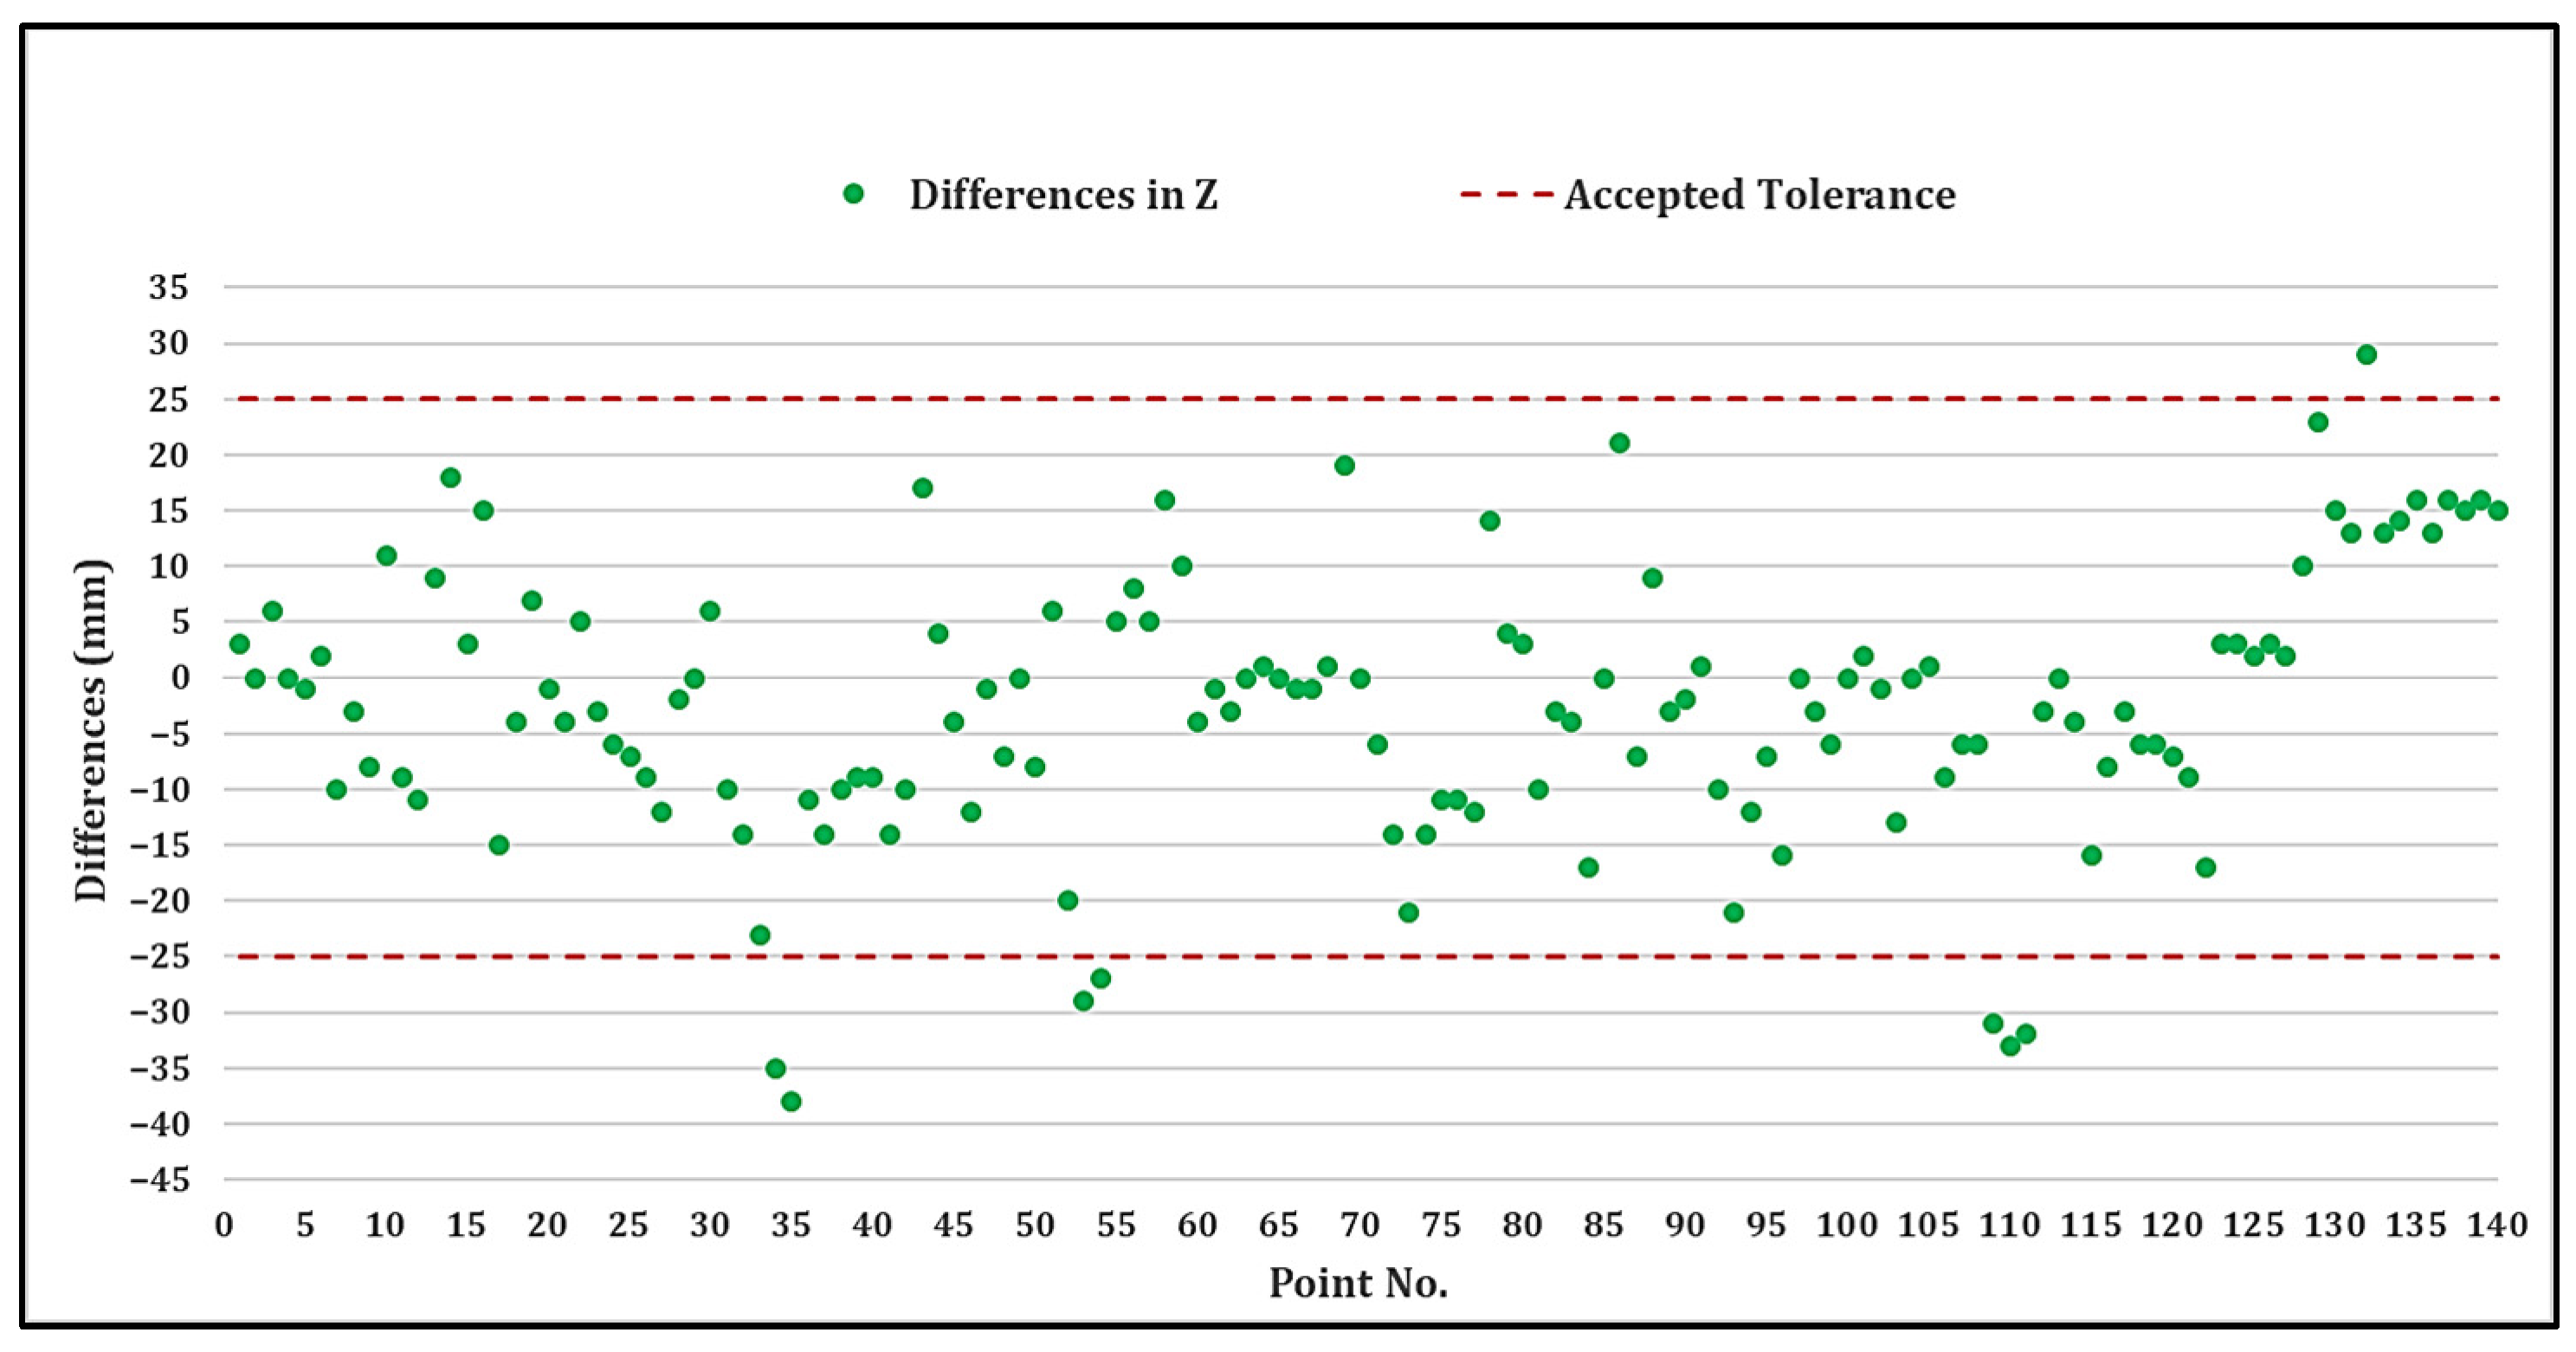
  • The results in both experiments of the proposed method are promising and the RMSE of the extracted pier pad points is within the allowable tolerance of the bridge inspection standards. However, the results of about 6% of the individual points were outside of the required accuracy. Hence, the points extraction using the proposed method is expected to be improved when using a better UAV camera such as the DJI Phantom 4 Pro.
  • Obviously, the proposed method surpasses the traditional technique in terms of cost, accessibility, portability, safety, and by reducing the fieldwork time. It was found that, by using the proposed method, more than 90% of the fieldwork time is eliminated. Hence, the cost may be reduced and the safety may be improved by a significant percentage.
For future research, the proposed technique will be integrated with Building Information Models (BIM) for inspection in construction projects. Hence, what is called scan-vs-BIM will be investigated where comparisons are not restricted to only measured values but extend to the design represented in BIM.
Furthermore, deep learning techniques will be investigated for the extraction of the pier pads out of the derived UAV point clouds. This is expected to offer a higher level of automation and better extraction accuracy.

Author Contributions

Conceptualization, H.A.J. and B.A.; methodology, H.A.J.; software, H.A.J. and B.A.; validation, H.A.J. and B.A.; formal analysis, H.A.J.; investigation, H.A.J. and B.A.; resources, H.A.J.; data curation, H.A.J.; writing—original draft preparation, H.A.J.; writing—review and editing, B.A.; visualization, H.A.J. and B.A. All authors have read and agreed to the published version of the manuscript.

Funding

This research received no external funding.

Data Availability Statement

The data presented in this study are available on request from the corresponding author. The data are not publicly available due to its size.

Acknowledgments

This research received no external funding but it is part of the research activities made at the University of Kufa/Remote Sensing Centre, thanks to facilities of this center such as software and computers where they were used in this research.

Conflicts of Interest

The authors declare no conflict of interest.

References

  1. Martínez-Carricondo, P.; Agüera-Verga, F.; Carvajal-Ramírez, F.; Mesas-Carrascosa, F.-J.; García-Ferrer, A.; Pérez-Porras, F.-J. Assessment of UAV-photogrammetric mapping accuracy based on variation of ground control points. Int. J. Appl. Earth Obs. Geoinf. 2018, 72, 1–10. [Google Scholar] [CrossRef]
  2. Watanabe, Y.; Kawahara, Y. UAV photogrammetry for monitoring changes in river topography and vegetation. Procedia Eng. 2016, 154, 317–325. [Google Scholar] [CrossRef]
  3. Lizarazo, I.; Angulo, V.; Rodríguez, J. Automatic mapping of land surface elevation changes from UAV-based imagery. Int. J. Remote Sens. 2017, 38, 2603–2622. [Google Scholar] [CrossRef]
  4. Rossi, P.; Mancini, F.; Dubbini, M.; Mazzone, F.; Capra, A. Combining nadir and oblique UAV imagery to reconstruct quarry topography: Methodology and feasibility analysis. Eur. J. Remote Sens. 2017, 50, 211–221. [Google Scholar] [CrossRef]
  5. Enciso, J.; Jung, J.; Chang, A.; Carlos Chavez, J.; Yeom, J.; Landivar, J.; Cavazos, G. Assessing land leveling needs and performance with unmanned aerial system. J. Appl. Remote Sens. 2018, 12, 016001. [Google Scholar] [CrossRef]
  6. Gonçalves, G.R.; Pérez, J.A.; Duarte, J. Accuracy and effectiveness of low cost UASs and open source photogrammetric software for foredunes mapping. Int. J. Remote Sens. 2018, 39, 5059–5077. [Google Scholar] [CrossRef]
  7. Rossi, G.; Tanteri, L.; Tofani, V.; Vannocci, P.; Moretti, S.; Casagli, N. Multitemporal UAV surveys for landslide mapping and characterization. Landslides 2018, 15, 1045–1052. [Google Scholar] [CrossRef]
  8. Yeh, F.-H.; Huang, C.-J.; Han, J.-Y.; Ge, L. Modeling slope topography using unmanned aerial vehicle image technique. MATEC Web Conf. 2018, 147, 07002. [Google Scholar] [CrossRef]
  9. Watson, C.S.; Kargel, J.S.; Tiruwa, B. UAV-derived Himalayan topography: Hazard assessments and comparison with global DEM products. Drones 2019, 3, 18. [Google Scholar] [CrossRef]
  10. Jiménez-Jiménez, S.I.; Ojeda-Bustamante, W.; Ontiveros-Capurata, R.E.; Marcial-Pablo, M.d.J. Rapid urban flood damage assessment using high resolution remote sensing data and an object-based approach. Geomat. Nat. Hazards Risk 2020, 11, 906–927. [Google Scholar] [CrossRef]
  11. Rotnicka, J.; Dłużewski, M.; Dąbski, M.; Rodzewicz, M.; Włodarski, W.; Zmarz, A. Accuracy of the UAV-based DEM of beach–foredune topography in relation to selected morphometric variables, land cover, and multitemporal sediment budget. Estuaries Coasts 2020, 43, 1939–1955. [Google Scholar] [CrossRef]
  12. Papakonstantinou, A.; Bastaris, M.; Spondylidis, S.; Topouzelis, K. A citizen science unmanned aerial system data acquisition protocol and deep learning techniques for the automatic detection and mapping of marine litter concentrations in the coastal zone. Drones 2021, 5, 6. [Google Scholar] [CrossRef]
  13. Śledź, S.; Ewertowski, M.W.; Piekarczyk, J. Applications of unmanned aerial vehicle (UAV) surveys and Structure from Motion photogrammetry in glacial and periglacial geomorphology. Geomorphology 2021, 378, 107620. [Google Scholar] [CrossRef]
  14. Yoon, H.; Shin, J.; Spencer, B.F., Jr. Structural displacement measurement using an unmanned aerial system. Comput.-Aided Civ. Infrastruct. Eng. 2018, 33, 183–192. [Google Scholar] [CrossRef]
  15. Jongerius, A. The Use of Unmanned Aerial Vehicles to Inspect Bridges for Rijkswaterstaat. Bachelor’s Thesis, University of Twente, Enschede, The Netherlands, 2018. [Google Scholar]
  16. Dorafshan, S.; Maguire, M. Bridge inspection: Human performance, unmanned aerial systems and automation. J. Civ. Struct. Health Monit. 2018, 8, 443–476. [Google Scholar] [CrossRef]
  17. Gerke, M.; Ghassoun, Y.; Alamouri, A.; Bobbe, M.; Khedar, Y.; Plöger, F. High-precision object delineation with UAV–demonstrated on a track system. ISPRS Ann. Photogramm. Remote Sens. Spat. Inf. Sci. 2020, 5, 293–299. [Google Scholar] [CrossRef]
  18. Ghassoun, Y.; Gerke, M.; Khedar, Y.; Backhaus, J.; Bobbe, M.; Meissner, H.; Kumar Tiwary, P.; Heyen, R. Implementation and validation of a high accuracy UAV-Photogrammetry based rail track inspection system. Remote Sens. 2021, 13, 384. [Google Scholar] [CrossRef]
  19. Debus, P.; Rodehorst, V. Multi-scale flight path planning for UAS building inspection. In Proceedings of the International Conference on Computing in Civil and Building Engineering, São Paulo, Brazil, 18–20 August 2020. [Google Scholar]
  20. Perry, B.J.; Guo, Y.; Atadero, R.; van de Lindt, J.W. Streamlined bridge inspection system utilizing unmanned aerial vehicles (UAVs) and machine learning. Measurement 2020, 164, 108048. [Google Scholar] [CrossRef]
  21. Gaspari, F.; Ioli, F.; Barbieri, F.; Pinto, L. Integration of UAV-lidar and UAV-photogrammetry for infrastructure monitoring and bridge assessment. Int. Arch. Photogramm. Remote Sens. Spat. Inf. Sci. 2022, 43, 995–1002. [Google Scholar] [CrossRef]
  22. Ioli, F.; Pinto, A.; Pinto, L. UAV photogrammetry for metric evaluation of concrete bridge cracks. Int. Arch. Photogramm. Remote Sens. Spat. Inf. Sci. 2022, 43, 1025–1032. [Google Scholar] [CrossRef]
  23. Fraser, C. Optimization of precision in close-range photogrammetry. Photogramm. Eng. Remote Sens. 1982, 48, 561–570. [Google Scholar]
  24. Förstner, W. On the Theoretical Accuracy of Multi Image Matching, Restoration and Triangulation; Festschrift zum 65, Geburtstag von Prof. Dr. Ing. mult. G. Konecny; Institut für Photogrammetrie, Universitat Hannover: Hannover, Germany, 1998. [Google Scholar]
  25. Sanz-Ablanedo, E.; Chandler, J.H.; Rodríguez-Pérez, J.R.; Ordóñez, C. Accuracy of unmanned aerial vehicle (UAV) and SfM photogrammetry survey as a function of the number and location of ground control points used. Remote Sens. 2018, 10, 1606. [Google Scholar] [CrossRef]
  26. Ferrer-González, E.; Agüera-Vega, F.; Carvajal-Ramírez, F.; Martínez-Carricondo, P. UAV photogrammetry accuracy assessment for corridor mapping based on the number and distribution of ground control points. Remote Sens. 2020, 12, 2447. [Google Scholar] [CrossRef]
  27. Chudley, T.R.; Christoffersen, P.; Doyle, S.H.; Abellan, A.; Snooke, N. High-accuracy UAV photogrammetry of ice sheet dynamics with no ground control. Cryosphere 2019, 13, 955–968. [Google Scholar] [CrossRef]
  28. Nesbit, P.R.; Hugenholtz, C.H. Enhancing UAV–SFM 3D model accuracy in high-relief landscapes by incorporating oblique images. Remote Sens. 2019, 11, 239. [Google Scholar] [CrossRef]
  29. Wiącek, P.; Pyka, K. The test field for UAV accuracy assessments. Int. Arch. Photogramm. Remote Sens. Spat. Inf. Sci. 2019, 42, 67–73. [Google Scholar] [CrossRef]
  30. Casella, V.; Chiabrando, F.; Franzini, M.; Maria Manzino, A. Accuracy assessment of a UAV block by different software packages, processing schemes and validation strategies. ISPRS Int. J. Geo-Inf. 2020, 9, 164. [Google Scholar] [CrossRef]
  31. Agisoft PhotoScan v 1.7; Agisoft LLC: St. Petersburg, Russia, 2010.
  32. Trimble Inpho UASMaster 7; Trimble, Inc.: Sunnyvale, CA, USA, 2010.
  33. Pix4D v 4.8; Pix4D S.A.: Prilly, Switzerland, 2011.
  34. ContextCapture v 1.7; Bentley Systems: Exton, PA, USA, 2021.
  35. MicMac; French National Geographic Institute: Saint-Mandé, France, 2007.
  36. Jiménez-Jiménez, S.I.; Ojeda-Bustamante, W.; Marcial-Pablo, M.d.J.; Enciso, J. Digital terrain models generated with low-cost UAV photogrammetry: Methodology and accuracy. ISPRS Int. J. Geo-Inf. 2021, 10, 285. [Google Scholar] [CrossRef]
  37. EN 1090-2:2018; Execution of Steel Structures and Aluminium Structures. CEN: Brussels, Belgium, 2018.
  38. EN 1994-2-2005; Design of Composite Steen and Concrete Structures—Part 2: General Rules and Rules for Bridges. CEN European Committee for Standardization: Brussels, Belgium, 2005.
  39. ISO-7976-1; Tolerances for Building-Methods of Measurement of Building Products. ISO: Geneva, Switzerland, 1989.
  40. ISO-7976-2; Tolerances for Building-Methods of Measurement of Building Products. ISO: Geneva, Switzerland, 1989.
  41. ISO-17123; Optics and Optical Instruments-Field Procedures for Testing Geodetic and Surveying Instruments. ISO: Geneva, Switzerland, 2014.
  42. Construct Concrete Structures Group. National Structural Concrete Specification for Building Construction; The Concrete Centre: Surrey, UK, 2010. [Google Scholar]
  43. ACI 117-10; Specifications for Tolerances for Concrete Construction and Materials (ACI 117-10) and Commentary (ACI 117R-10). American Concrete Institute: Farmington Hills, MI, USA, 2010.
  44. CloudCompare; Girardeau-Montaut, D.; et al., Paris, France. 2006. Available online: https://www.researchgate.net/project/CloudCompare (accessed on 7 January 2023).
  45. Blender—A 3D Modelling and Rendering Package Version 2.25; Blender Foundation: Stichting Blender Foundation: Amsterdam, The Nethrlands, 2002.
Figure 1. Key stages of bridge construction.
Remotesensing 15 00877 g001
Figure 2. The workflow of the proposed method.
Remotesensing 15 00877 g002
Figure 3. Pier caps segmentation.
Remotesensing 15 00877 g003
Figure 4. Classification using CCL.
Remotesensing 15 00877 g004
Figure 5. RANSAC for sphere fitting of the pier pad points.
Remotesensing 15 00877 g005
Figure 6. Profile and cross-section creation out of the spheres fitting points.
Remotesensing 15 00877 g006
Figure 7. UAV fight plan images above the simulated scene of the pier caps.
Remotesensing 15 00877 g007
Figure 8. Differences between the extracted points by the proposed method and known coordinates on the X and Y axes of the first test.
Remotesensing 15 00877 g008
Figure 9. Differences between the extracted points by the proposed method and known coordinates on the Z axis of the first test.
Remotesensing 15 00877 g009
Figure 10. UAV images above the project area of the pier caps for the second test.
Remotesensing 15 00877 g010
Figure 11. Location of the total station points (red point) and the extracted points according to proposed method (yellow).
Remotesensing 15 00877 g011aRemotesensing 15 00877 g011b
Figure 12. Differences between the extracted points by the proposed method and total station coordinates on the X and Y axes of the second test.
Remotesensing 15 00877 g012
Figure 13. Differences between the extracted points by the proposed method and total station coordinates on the Z axis of the second test.
Remotesensing 15 00877 g013
Table 1. Time-cost breakdown for the proposed method.
No.The StepTime-Cost
1FieldworkFlight time00 h 30 m 00 s
2UAV data acquisition and point cloud reconstructionMatching00 h 13 m 29 s
Alignment00 h 06 m 42 s
Camera Optimization00 h 00 m 05 s
Depth maps generation01 h 23 m 00 s
Dense cloud generation00 h 07 m 24 s
3Post-processing and pad centres extraction Prepare data (crop, segmentation, and classification)00 h 30 m 00 s
Sectioning01 h 40 m 00 s
Disclaimer/Publisher’s Note: The statements, opinions and data contained in all publications are solely those of the individual author(s) and contributor(s) and not of MDPI and/or the editor(s). MDPI and/or the editor(s) disclaim responsibility for any injury to people or property resulting from any ideas, methods, instructions or products referred to in the content.

