
Suitable LiDAR Platform for Measuring the 3D Structure of Mangrove Forests

Abstract
:
1. Introduction
2. Materials and Methods
2.1. Study Location
2.2. LiDAR Analysis
2.3. Data Examination
3. Results
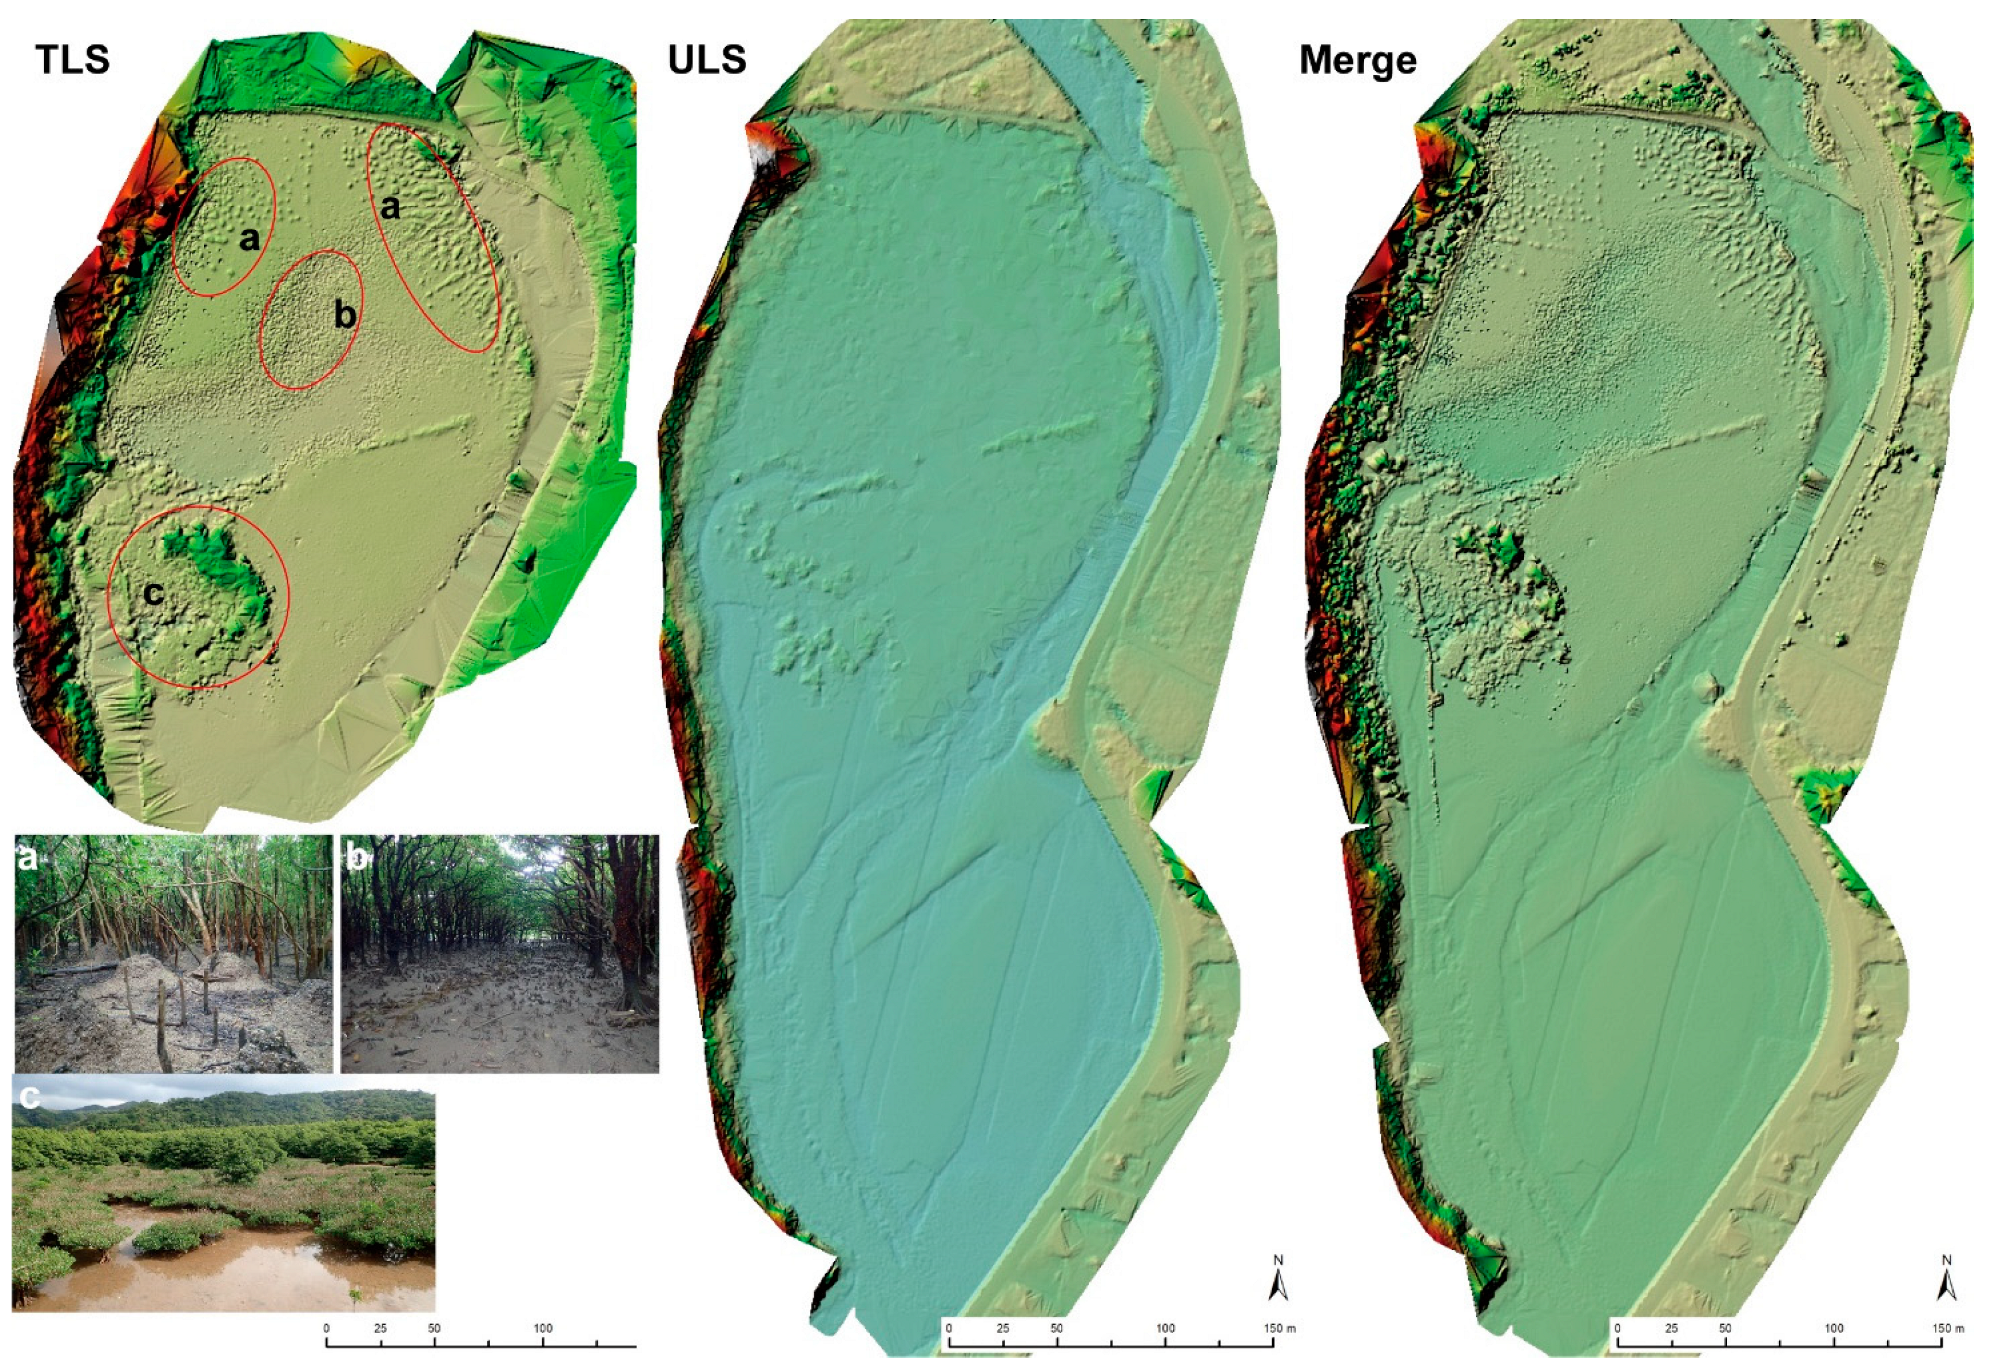
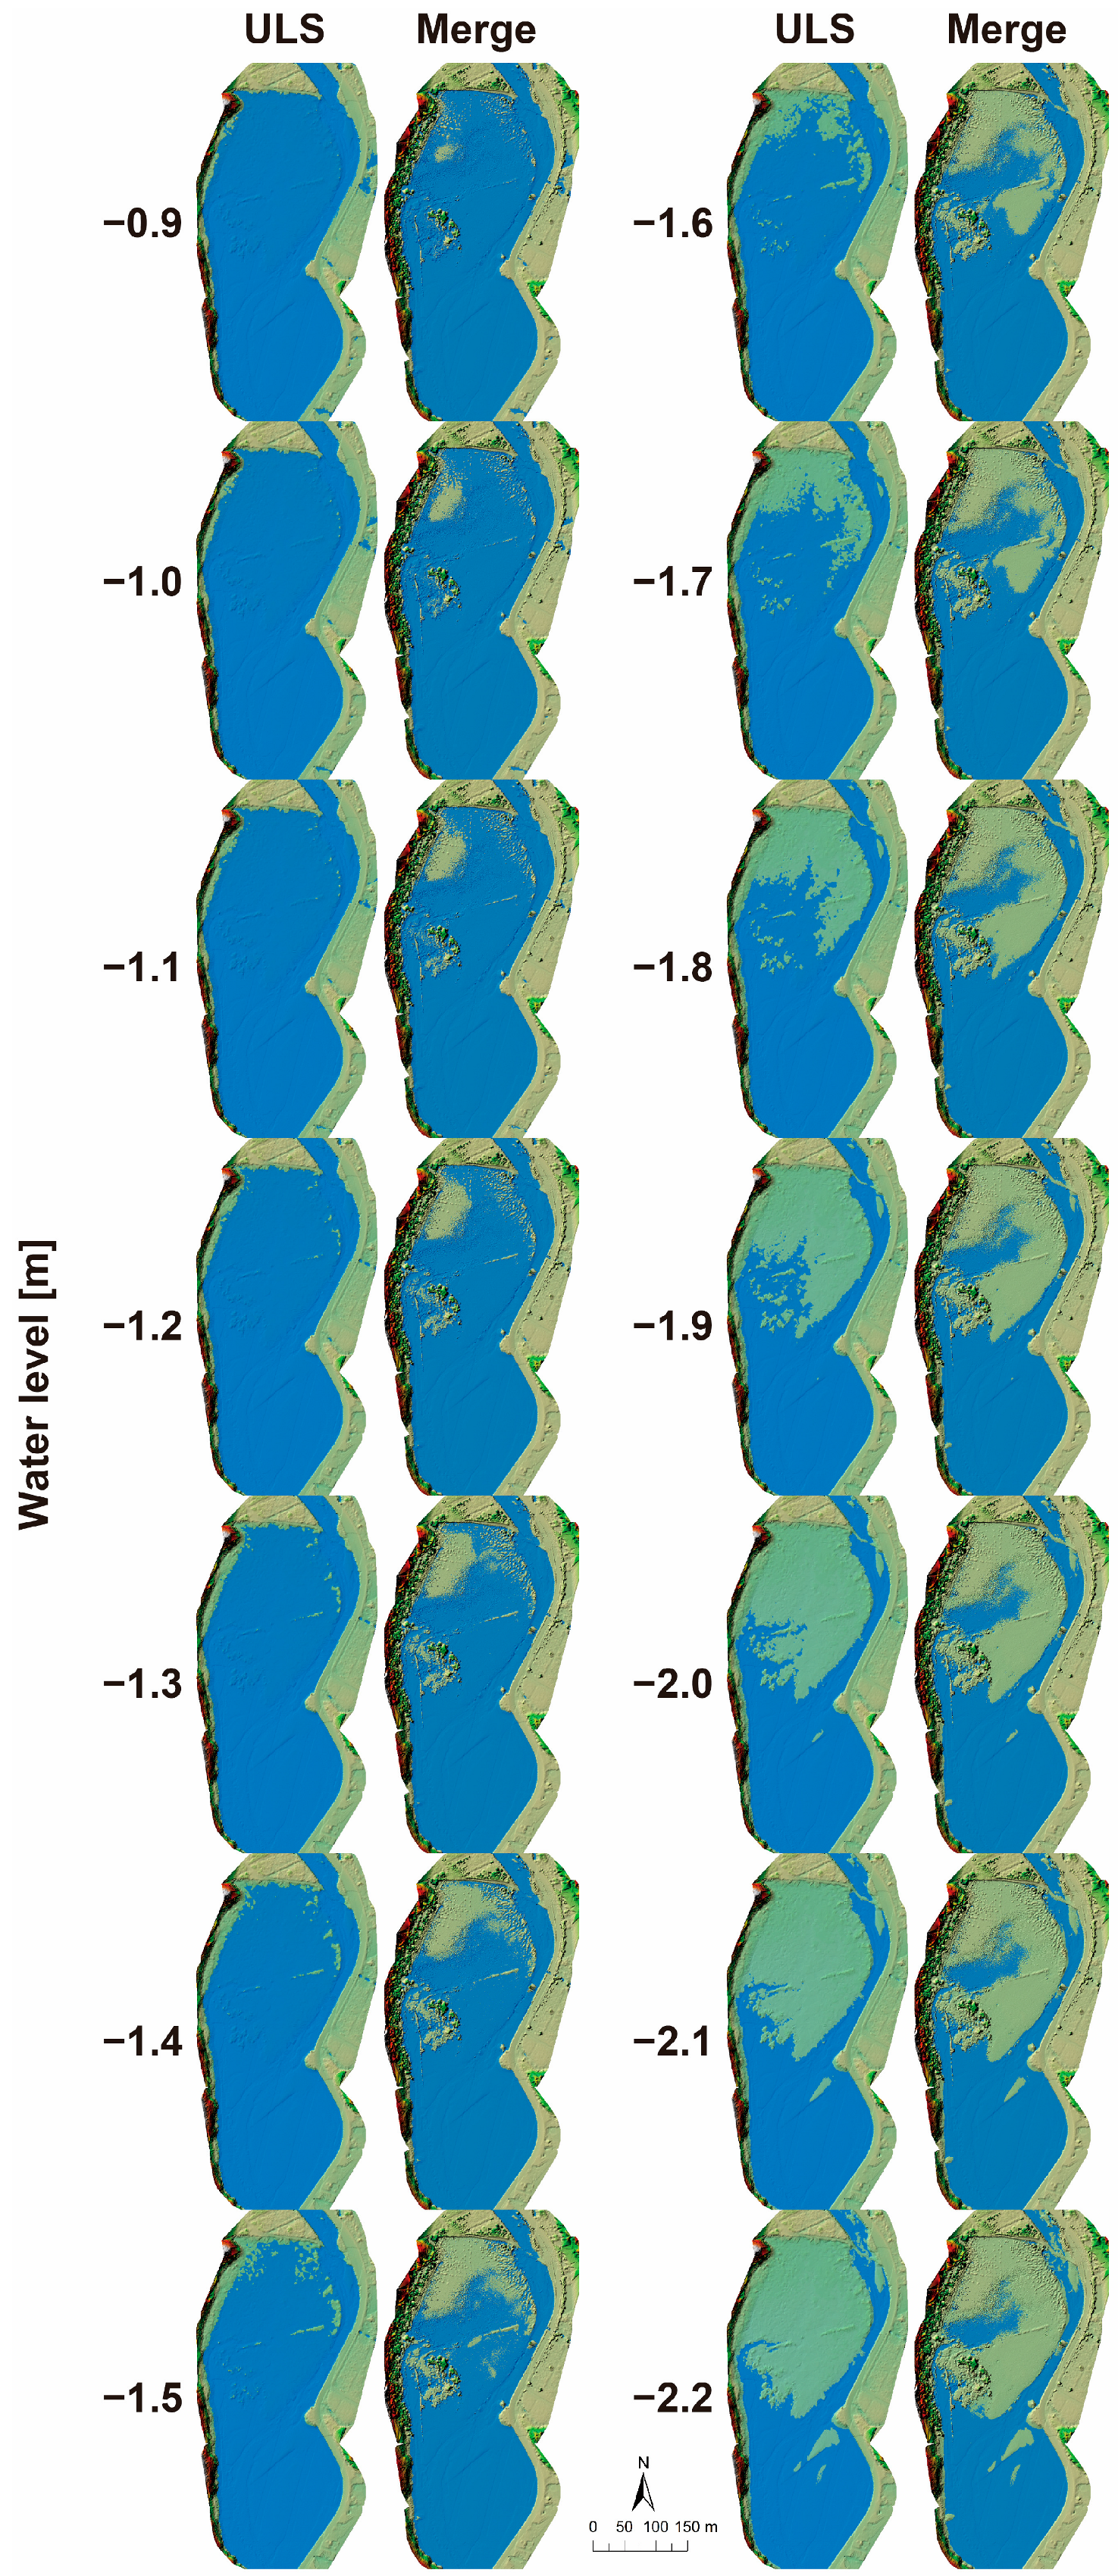
3.1. DTM
3.2. DBH
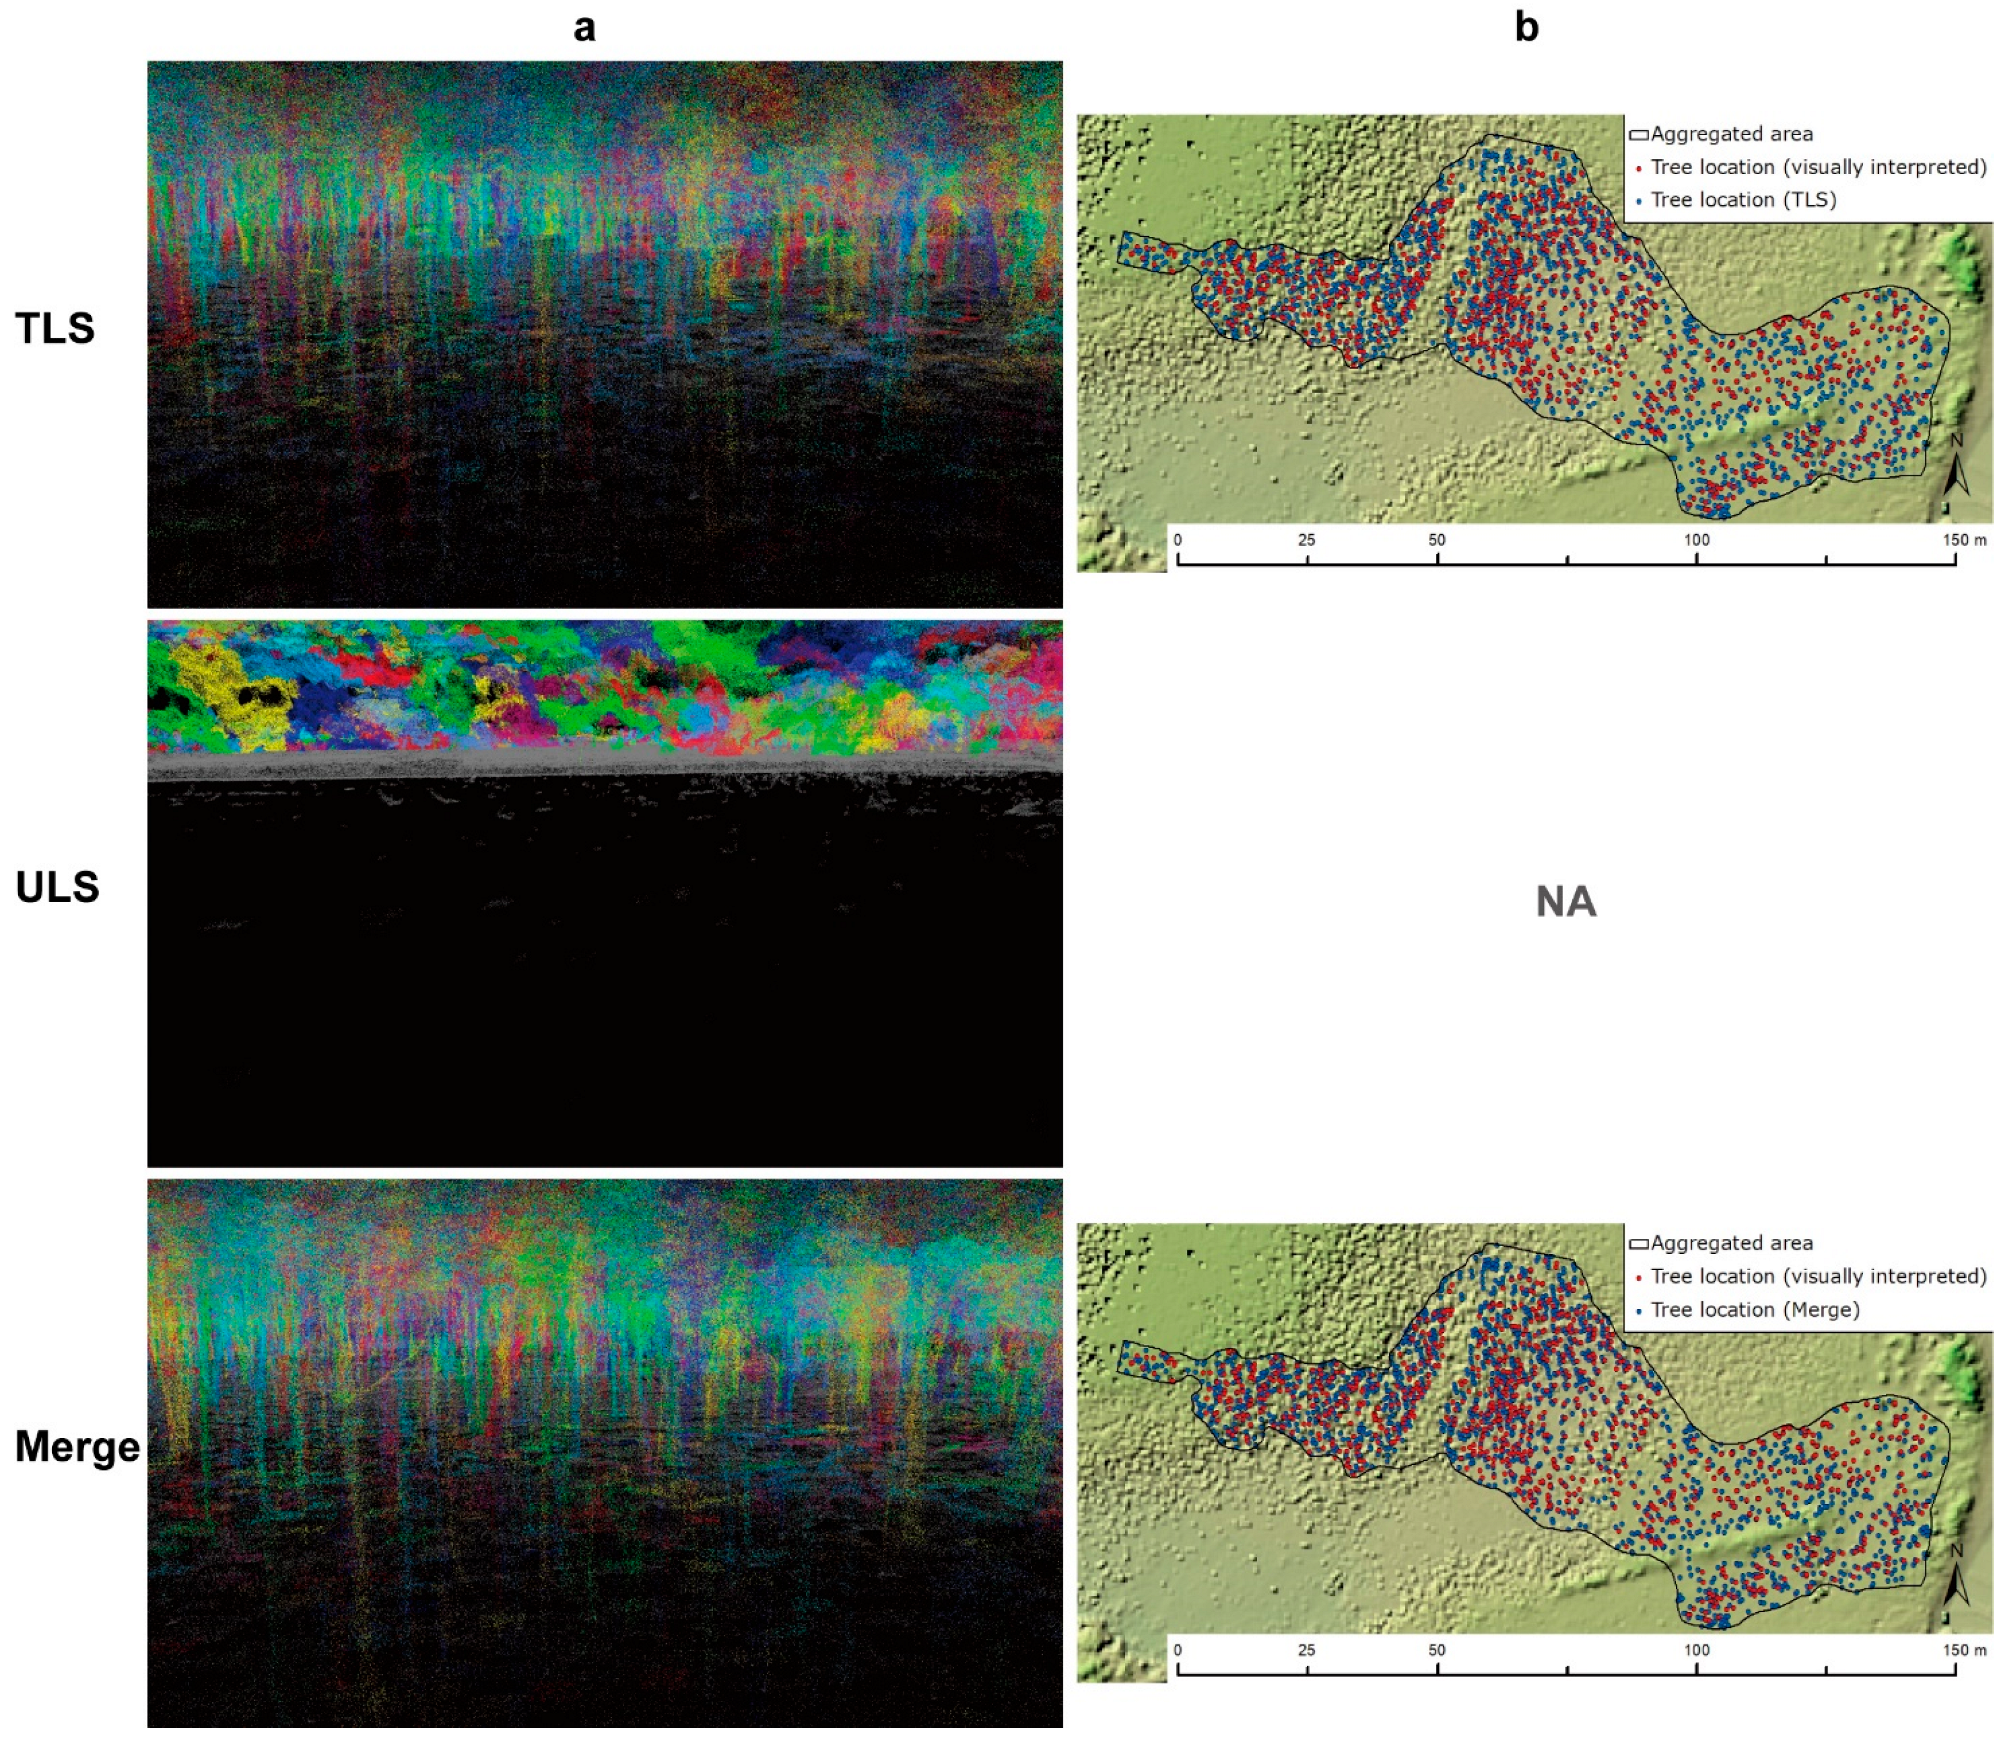
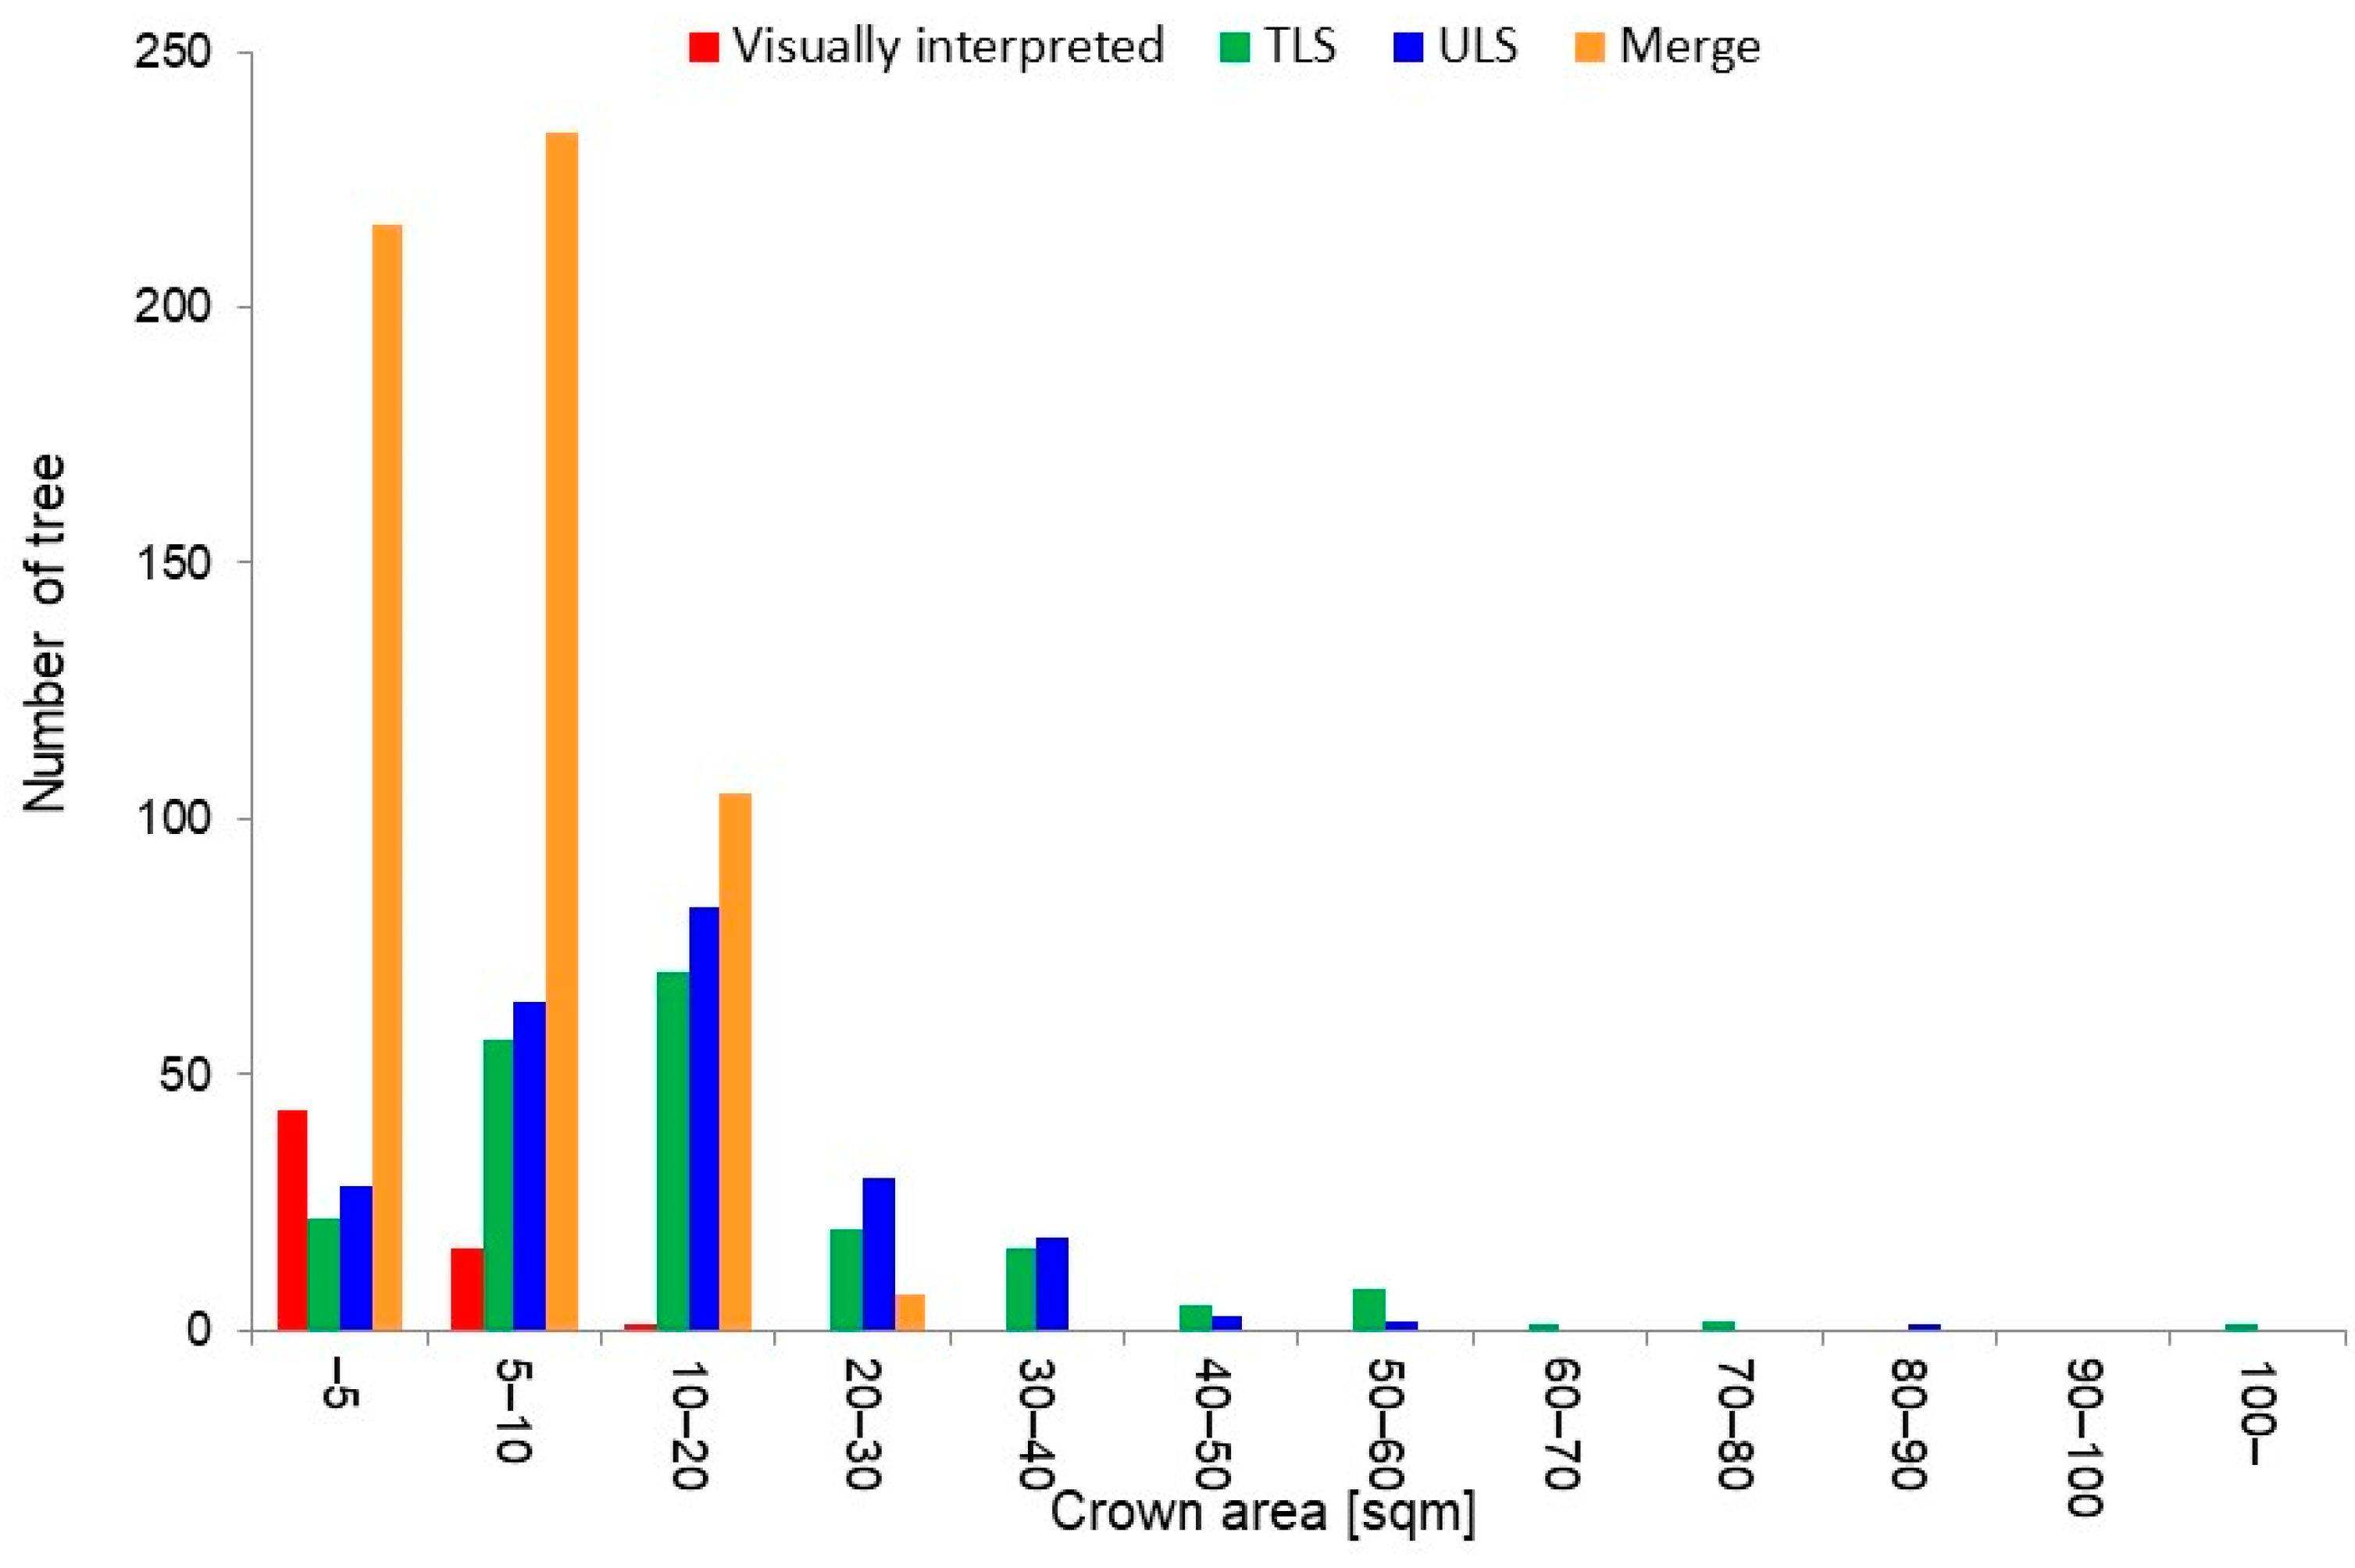
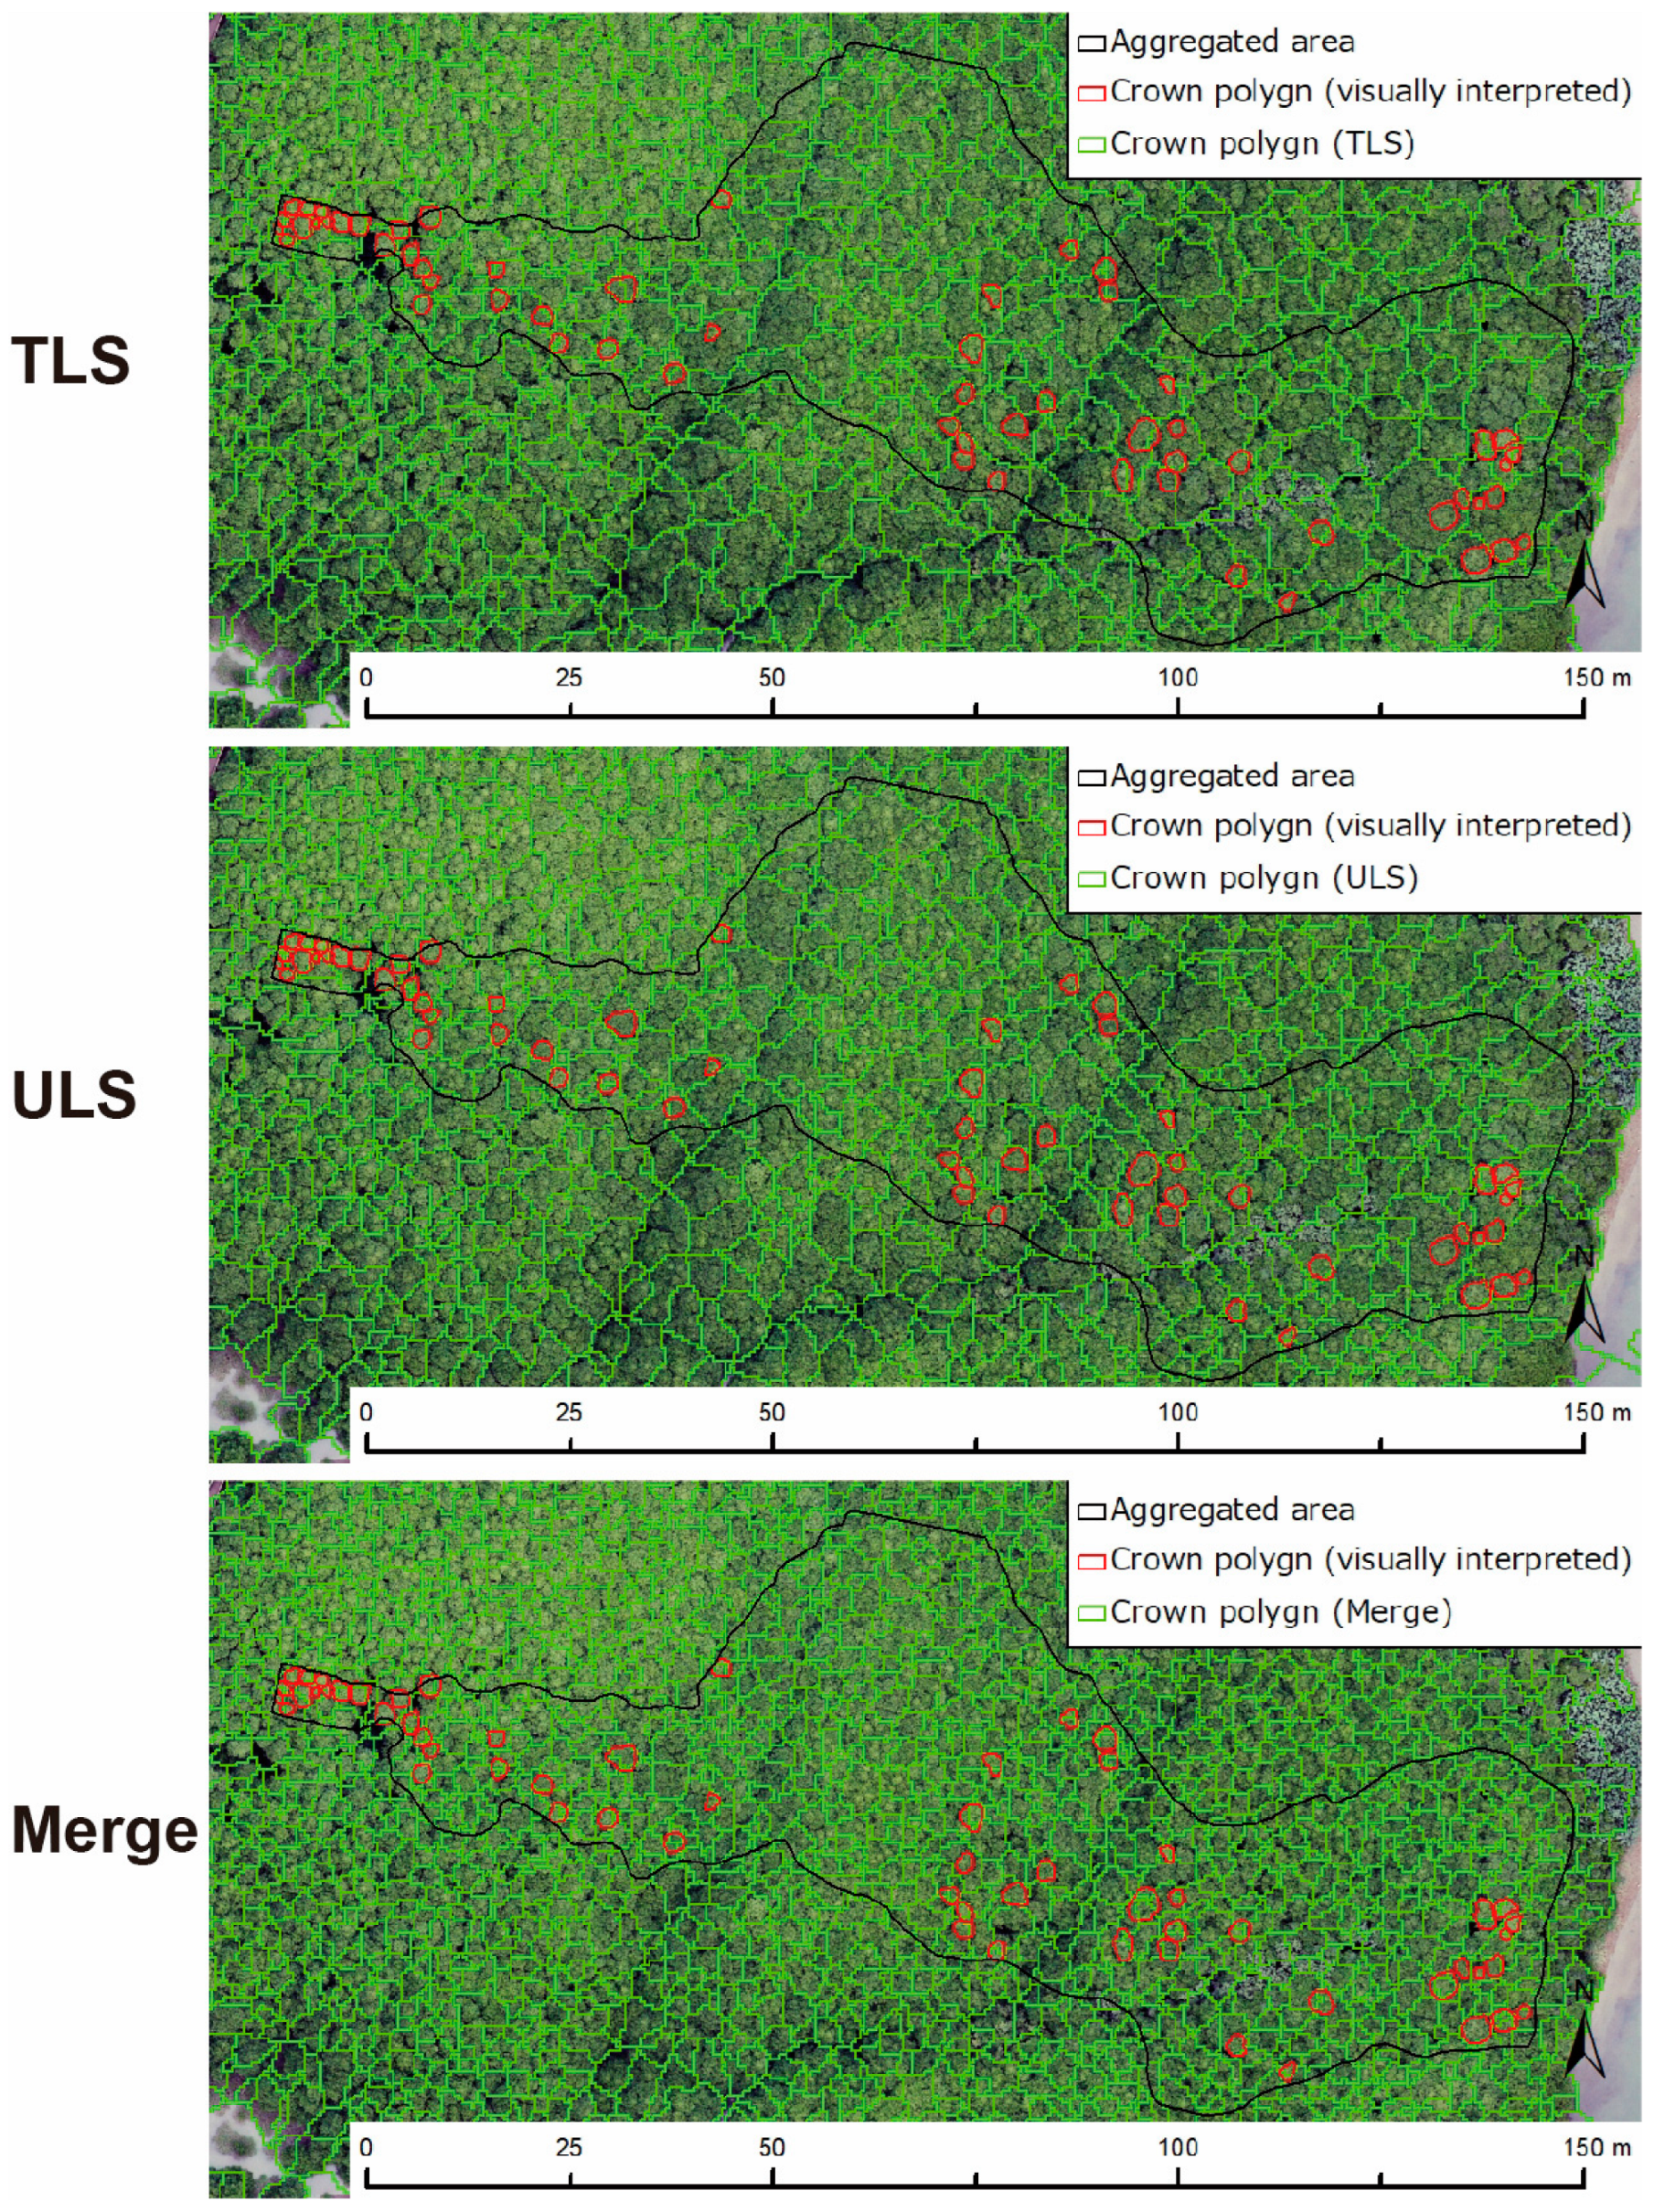
3.3. Crown
4. Discussion
4.1. DTM
4.2. Segmentation of a Tree
5. Conclusions
Author Contributions
Funding
Data Availability Statement
Conflicts of Interest
References
- Brander, L.M.; Wagtendonk, A.J.; Hussain, S.S.; McVittie, A.; Verburg, P.H.; de Groot, R.S.; van der Ploeg, S. Ecosystem service values for mangroves in Southeast Asia: A meta-analysis and value transfer application. Ecosyst. Serv. 2012, 1, 62–69. [Google Scholar] [CrossRef]
- Pham, T.D.; Yokoya, N.; Bui, D.T.; Yoshino, K.; Friess, D.A. Remote sensing approaches for monitoring mangrove species, structure, and biomass: Opportunities and challenges. Remote Sens. 2019, 11, 230. [Google Scholar] [CrossRef]
- Spalding, M.; Kainuma, M.; Collins, L. World Atlas of Mangroves (Version 3.1). A Collaborative Project of ITTO, ISME, FAO, UNEP-WCMC, UNESCO-MAB, UNU-INWEH and TNC. London (UK): Earthscan, London; Routledge: Oxfords, UK, 2010; p. 319. [Google Scholar] [CrossRef]
- Bunting, P.; Rosenqvist, A.; Hilarides, L.; Lucas, R.M.; Thomas, T.; Tadono, T.; Worthington, T.A.; Spalding, M.; Murray, N.J.; Rebelo, L.-M.; et al. Global Mangrove Extent Change 1996–2020: Global Mangrove Watch Version 3.0. Remote Sensing. 2022, 14, 3657. [Google Scholar] [CrossRef]
- Wang, L.; Jia, M.; Yin, D.; Tian, J. A review of remote sensing for mangrove forests: 1956–2018. Remote Sens. Environ. 2019, 231, 111223. [Google Scholar] [CrossRef]
- Galvincio, J.D.; Popescu, S.C. Measuring Individual Tree Height and Crown Diameter for Mangrove Trees with Airborne Lidar Data. Int. J. Adv. Eng. Manag. Sci. 2016, 2, 239456. [Google Scholar]
- Guo, Q.; Su, Y.; Hu, T.; Zhao, X.; Wu, F.; Li, Y.; Liu, J.; Chen, L.; Xu, G.; Lin, G.; et al. An integrated UAV-borne lidar system for 3D habitat mapping in three forest ecosystems across China. Int. J. Remote Sens. 2017, 38, 2954–2972. [Google Scholar] [CrossRef]
- Agca, M.; Popescu, S.C.; Harper, C.W. Deriving forest canopy fuel parameters for loblolly pine forests in eastern Texas. Can. J. For. Res. 2011, 41, 1618–1625. [Google Scholar] [CrossRef]
- Fatoyinbo, L. Remote Characterization of Biomass Measurements: Case Study of Mangrove Forests; Momba, M.N.B., Ed.; IntechOpen: Rijeka, Croatia, 2010; p. 3. [Google Scholar]
- Lim, K.; Treitz, P.; Wulder, M.; St-Onge, B.; Flood, M. LiDAR remote sensing of forest structure. Prog. Phys. Geogr. Earth Environ. 2003, 27, 88–106. [Google Scholar] [CrossRef]
- Wannasiri, W.; Nagai, M.; Honda, K.; Santitamnont, P.; Miphokasap, P. Extraction of mangrove biophysical parameters using airborne LiDAR. Remote Sens. 2013, 5, 1787–1808. [Google Scholar] [CrossRef]
- Kellner, J.R.; Armston, J.; Birrer, M.; Cushman, K.C.; Duncanson, L.; Eck, C.; Falleger, C.; Imbach, B.; Král, K.; Krůček, M.; et al. New Opportunities for Forest Remote Sensing Through Ultra-High-Density Drone Lidar. Surv. Geophys. 2019, 40, 959–977. [Google Scholar] [CrossRef] [Green Version]
- Ma, K.; Chen, Z.; Fu, L.; Tian, W.; Jiang, F.; Yi, J.; Du, Z.; Sun, H. Performance and Sensitivity of Individual Tree Segmentation Methods for UAV-LiDAR in Multiple Forest Types. Remote Sens. 2022, 14, 298. [Google Scholar] [CrossRef]
- Liu, L.; Pang, Y.; Li, Z.; Si, L.; Liao, S. Combining airborne and terrestrial laser scanning technologies to measure forest understorey volume. Forests 2017, 8, 111. [Google Scholar] [CrossRef]
- Liu, Q.; Wang, J.; Ma, W.; Zhang, J.; Deng, Y.; Shao, D.; Xu, D.; Liu, Y. Target-free ULS-TLS point-cloud registration for alpine forest lands. Comput. Electron. Agric. 2021, 190, 106460. [Google Scholar] [CrossRef]
- Levick, S.R.; Whiteside, T.; Loewensteiner, D.A.; Rudge, M.; Bartolo, R. Leveraging tls as a calibration and validation tool for mls and uls mapping of savanna structure and biomass at landscape-scales. Remote Sens. 2021, 13, 257. [Google Scholar] [CrossRef]
- Ellison, J.C. Mangrove Retreat with Rising Sea-level, Bermuda. Estuar. Coast. Shelf Sci. 1993, 37, 75–87. [Google Scholar] [CrossRef]
- Eslami-Andargoli, L.; Dale, P.E.R.; Sipe, N.; Chaseling, J. Local and landscape effects on spatial patterns of mangrove forest during wetter and drier periods: Moreton Bay, Southeast Queensland, Australia. Estuar. Coast. Shelf Sci. 2010, 89, 53–61. [Google Scholar] [CrossRef]
- Krauss, K.W.; From, A.S.; Doyle, T.W.; Doyle, T.J.; Barry, M.J. Sea-level rise and landscape change influence mangrove encroachment onto marsh in the Ten Thousand Islands region of Florida, USA. J. Coast. Conserv. 2011, 15, 629–638. [Google Scholar] [CrossRef]
- Lagomasino, D.; Price, R.M.; Whitman, D.; Melesse, A.; Oberbauer, S.F. Spatial and temporal variability in spectral-based surface energy evapotranspiration measured from Landsat 5TM across two mangrove ecotones. Agric. For. Meteorol. 2015, 213, 304–316. [Google Scholar] [CrossRef]
- Giri, C.; Ochieng, E.; Tieszen, L.L.; Zhu, Z.; Singh, A.; Loveland, T.; Masek, J.; Duke, N. Status and distribution of mangrove forests of the world using earth observation satellite data (version 1.4, updated by UNEP-WCMC). Glob. Ecol. Biogeogr. 2011, 20, 154–159. [Google Scholar] [CrossRef]
- Niwa, H.; Imai, Y.; Kamada, M. The effectiveness of a method that uses stabilized cameras and photogrammetry to survey the size and distribution of individual trees in a mangrove forest. J. For. Res. 2021, 26, 314–320. [Google Scholar] [CrossRef]
- Niwa, H.; Imai, Y.; Kamada, M. Assessment of mangrove forest degradation by comparing multiple rivers. Ecol. Civ. Eng. 2021, 23, 395–404. [Google Scholar] [CrossRef]
- Wezyk, P. The integration of the Terrestrial and Airborne Laser Scanning technologies in the semi-automated process of retrieving selected trees and forest stand parameters. Ambiencia 2012, 8, 533–548. [Google Scholar]
- Dai, W.; Yang, B.; Dong, Z.; Shaker, A. A new method for 3D individual tree extraction using multispectral airborne LiDAR point clouds. ISPRS J. Photogramm. Remote Sens. 2018, 144, 400–411. [Google Scholar] [CrossRef]
- Qin, H.; Zhou, W.; Yao, Y.; Wang, W. Individual tree segmentation and tree species classification in subtropical broadleaf forests using UAV-based LiDAR, hyperspectral, and ultrahigh-resolution RGB data. Remote Sens. Environ. 2022, 280, 113143. [Google Scholar] [CrossRef]


| Visual Identification Results | TLS | ULS | Merge | |
|---|---|---|---|---|
| Crown | 916 | 202 | 229 | 562 |
| 22% | 25% | 61% | ||
| DBH | 1871 | NA | 1829 | |
| 204% | 200% |
Disclaimer/Publisher’s Note: The statements, opinions and data contained in all publications are solely those of the individual author(s) and contributor(s) and not of MDPI and/or the editor(s). MDPI and/or the editor(s) disclaim responsibility for any injury to people or property resulting from any ideas, methods, instructions or products referred to in the content. |
© 2023 by the authors. Licensee MDPI, Basel, Switzerland. This article is an open access article distributed under the terms and conditions of the Creative Commons Attribution (CC BY) license (https://creativecommons.org/licenses/by/4.0/).
Share and Cite
Niwa, H.; Ise, H.; Kamada, M. Suitable LiDAR Platform for Measuring the 3D Structure of Mangrove Forests. Remote Sens. 2023, 15, 1033. https://doi.org/10.3390/rs15041033
Niwa H, Ise H, Kamada M. Suitable LiDAR Platform for Measuring the 3D Structure of Mangrove Forests. Remote Sensing. 2023; 15(4):1033. https://doi.org/10.3390/rs15041033
Chicago/Turabian StyleNiwa, Hideyuki, Hajime Ise, and Mahito Kamada. 2023. "Suitable LiDAR Platform for Measuring the 3D Structure of Mangrove Forests" Remote Sensing 15, no. 4: 1033. https://doi.org/10.3390/rs15041033