
Insights for Sea Outfall Turbid Plume Monitoring with High-Spatial-Resolution Satellite Imagery Application in Portugal
 , , , , and
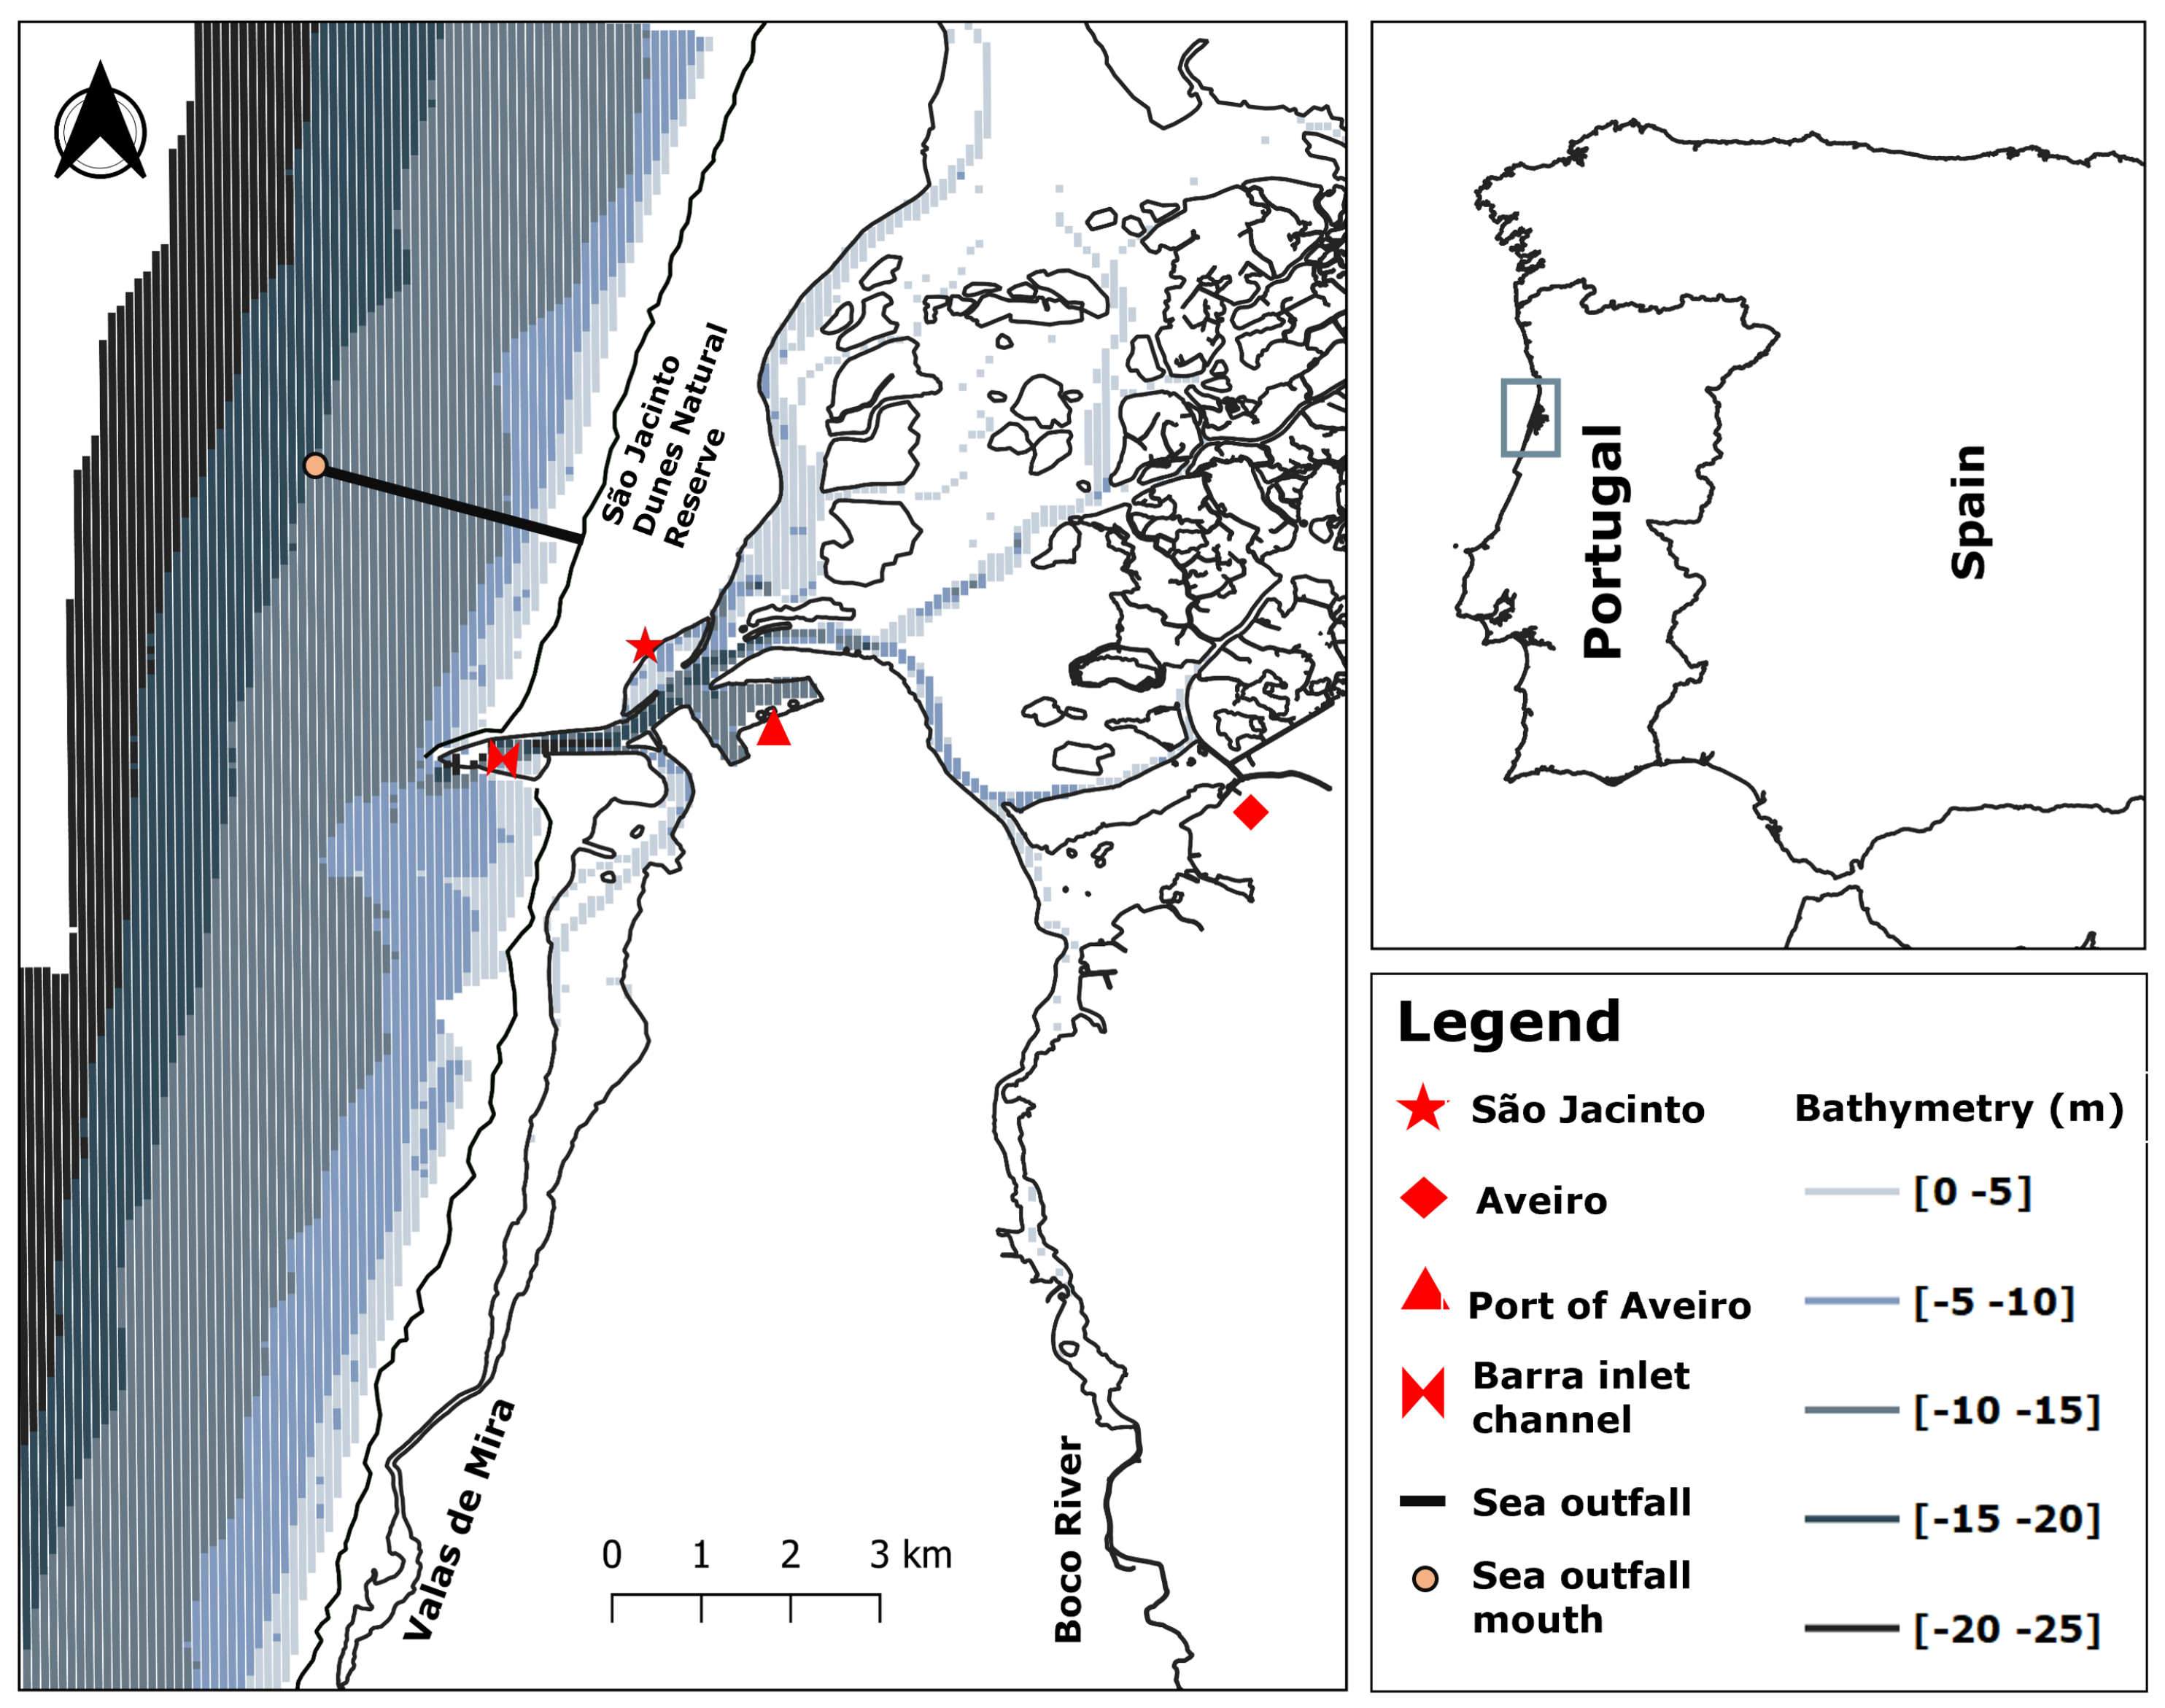
Abstract
:1. Introduction
2. Methods
2.1. Study Site
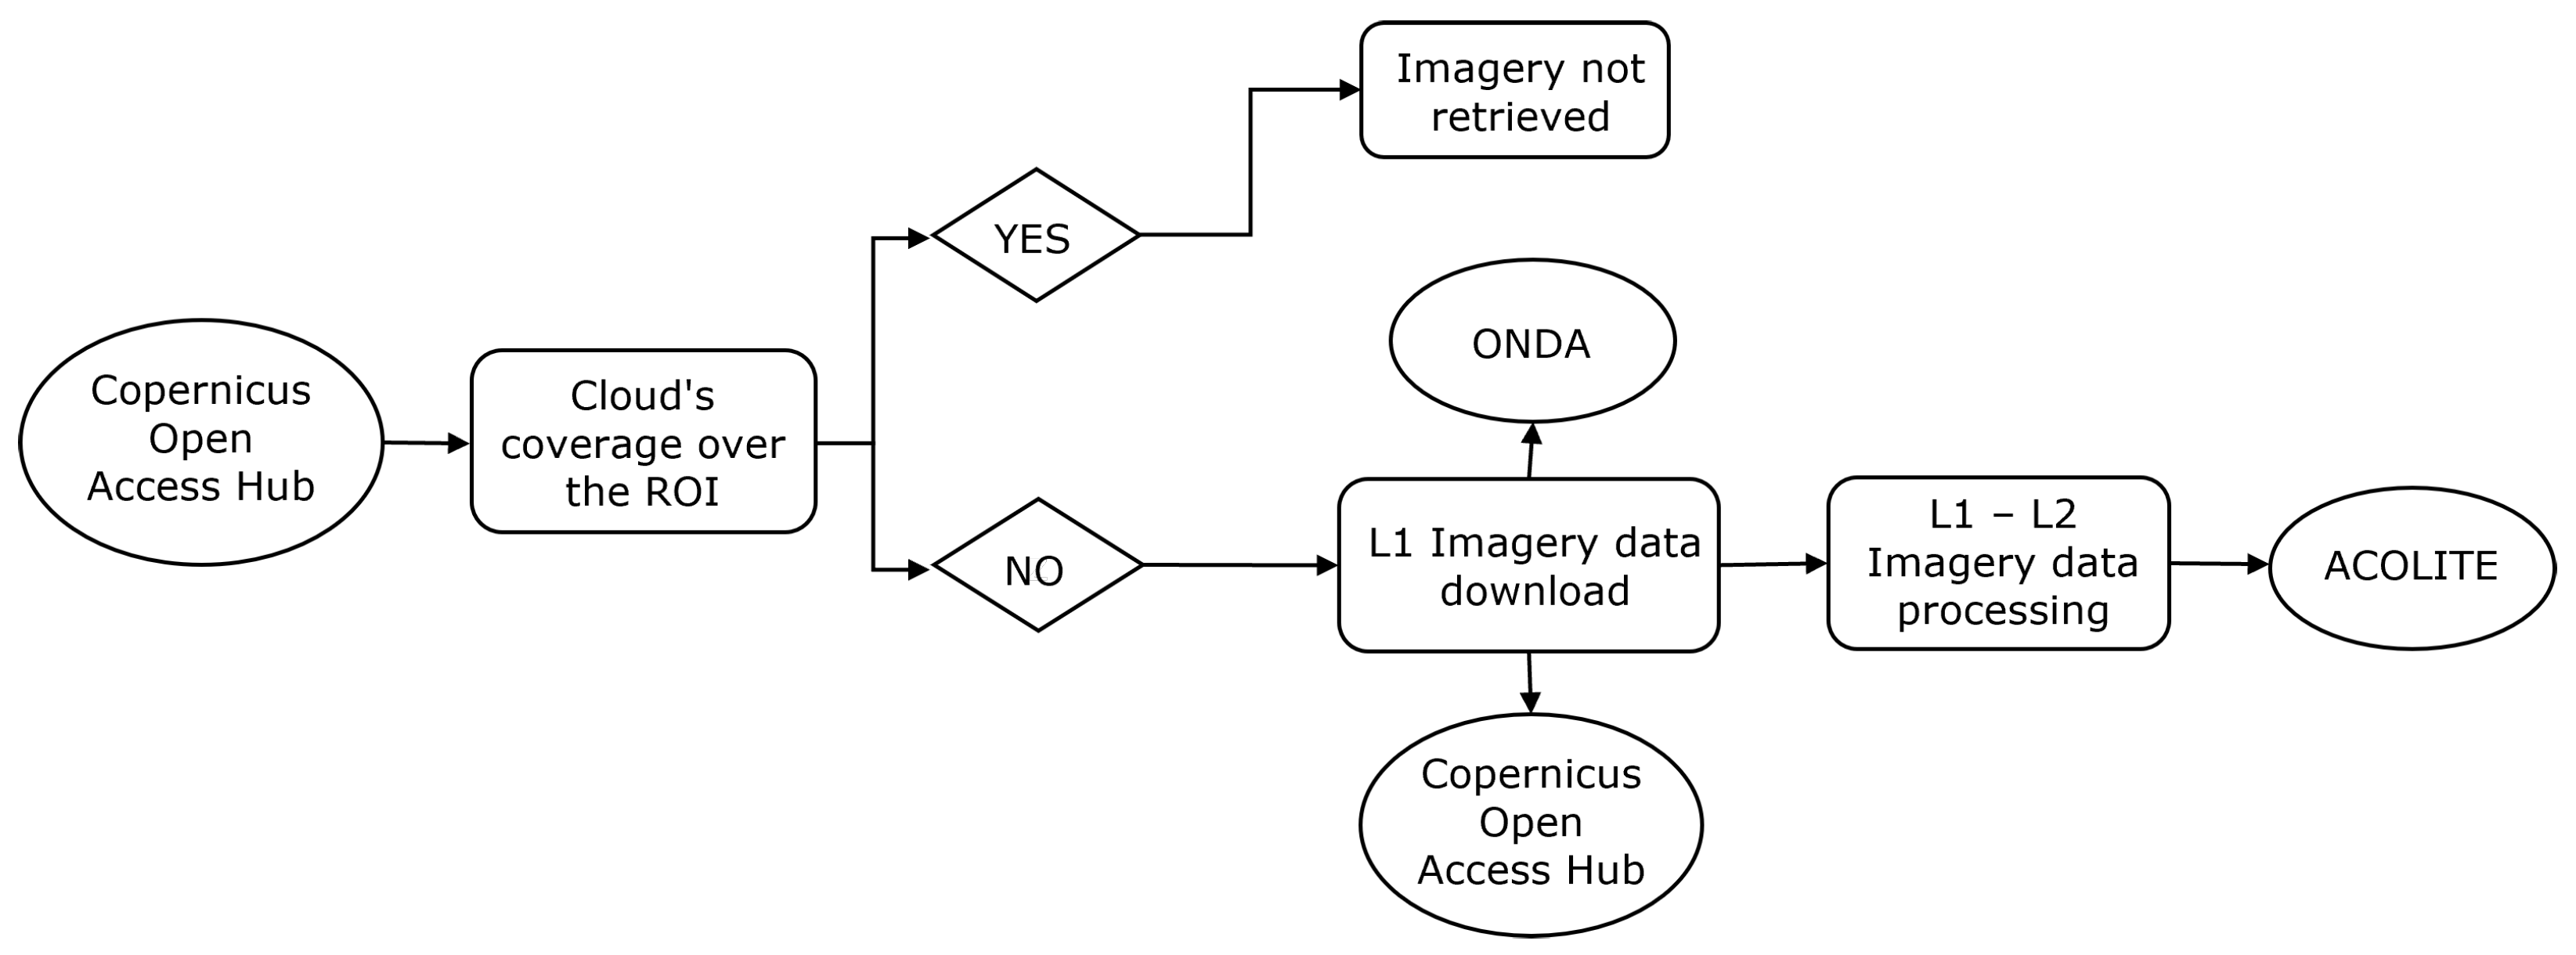
2.2. Sentinel-2 Constellation Data Acquisition and Processing
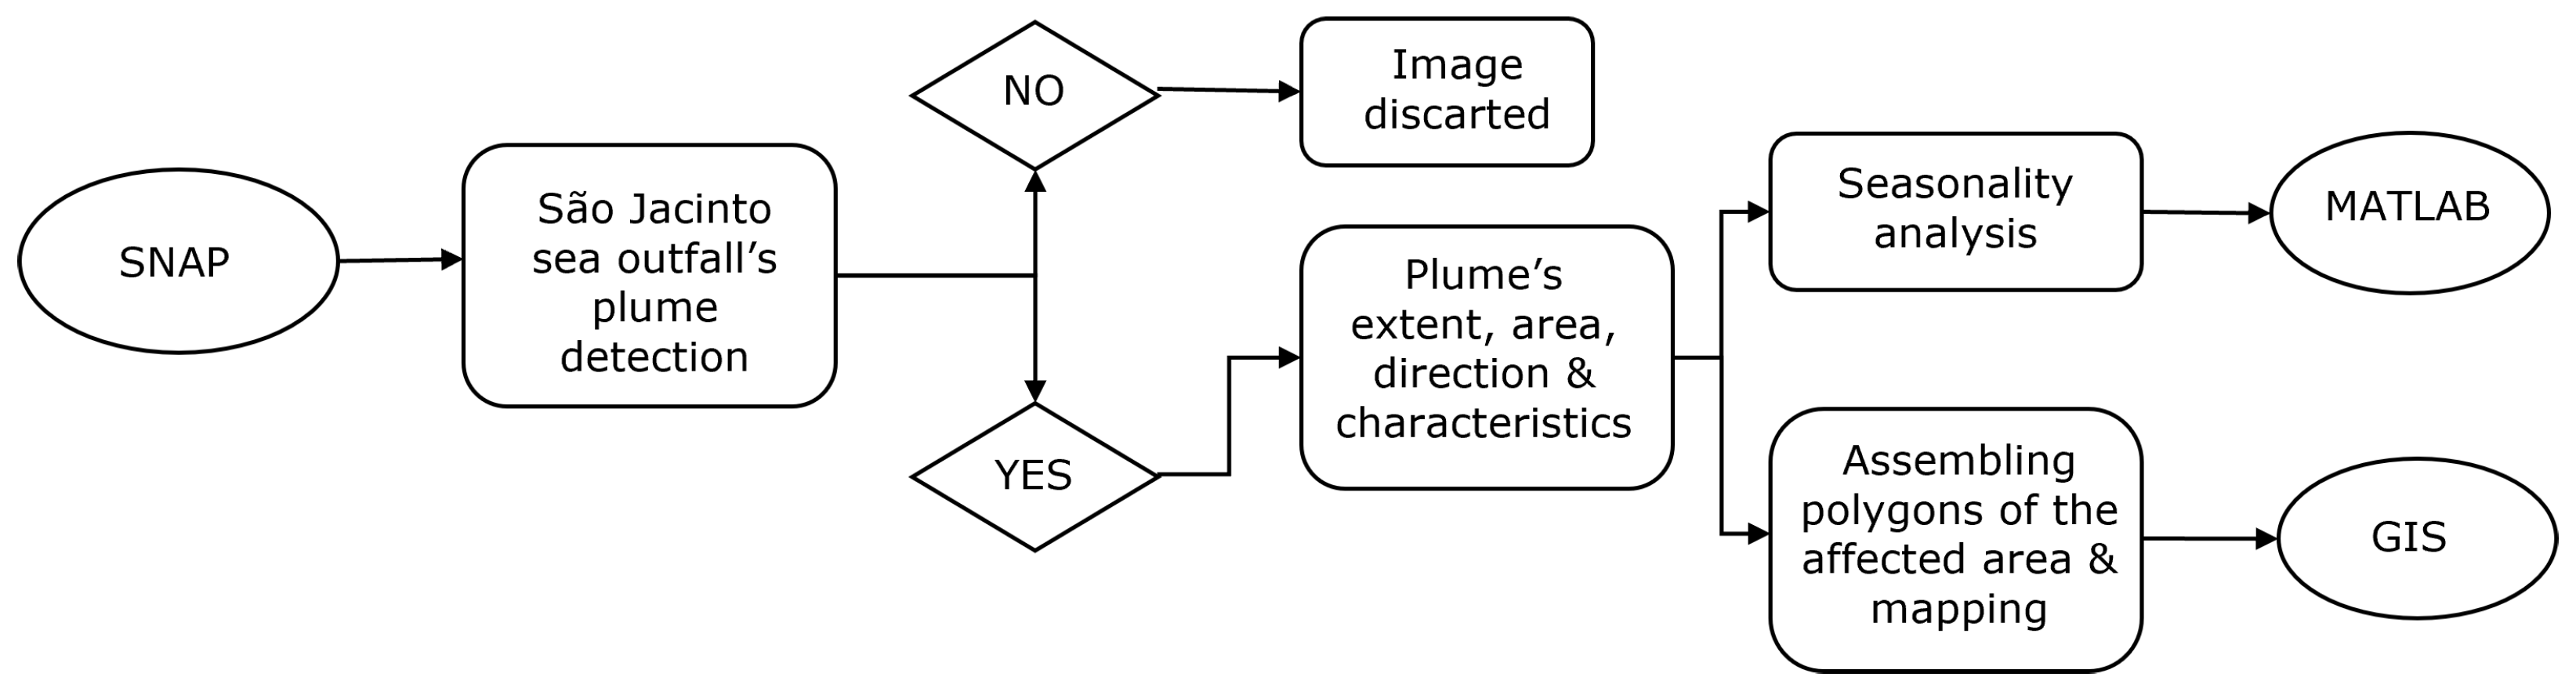
2.3. Sea Outfall Turbid Plume Detection
3. Results
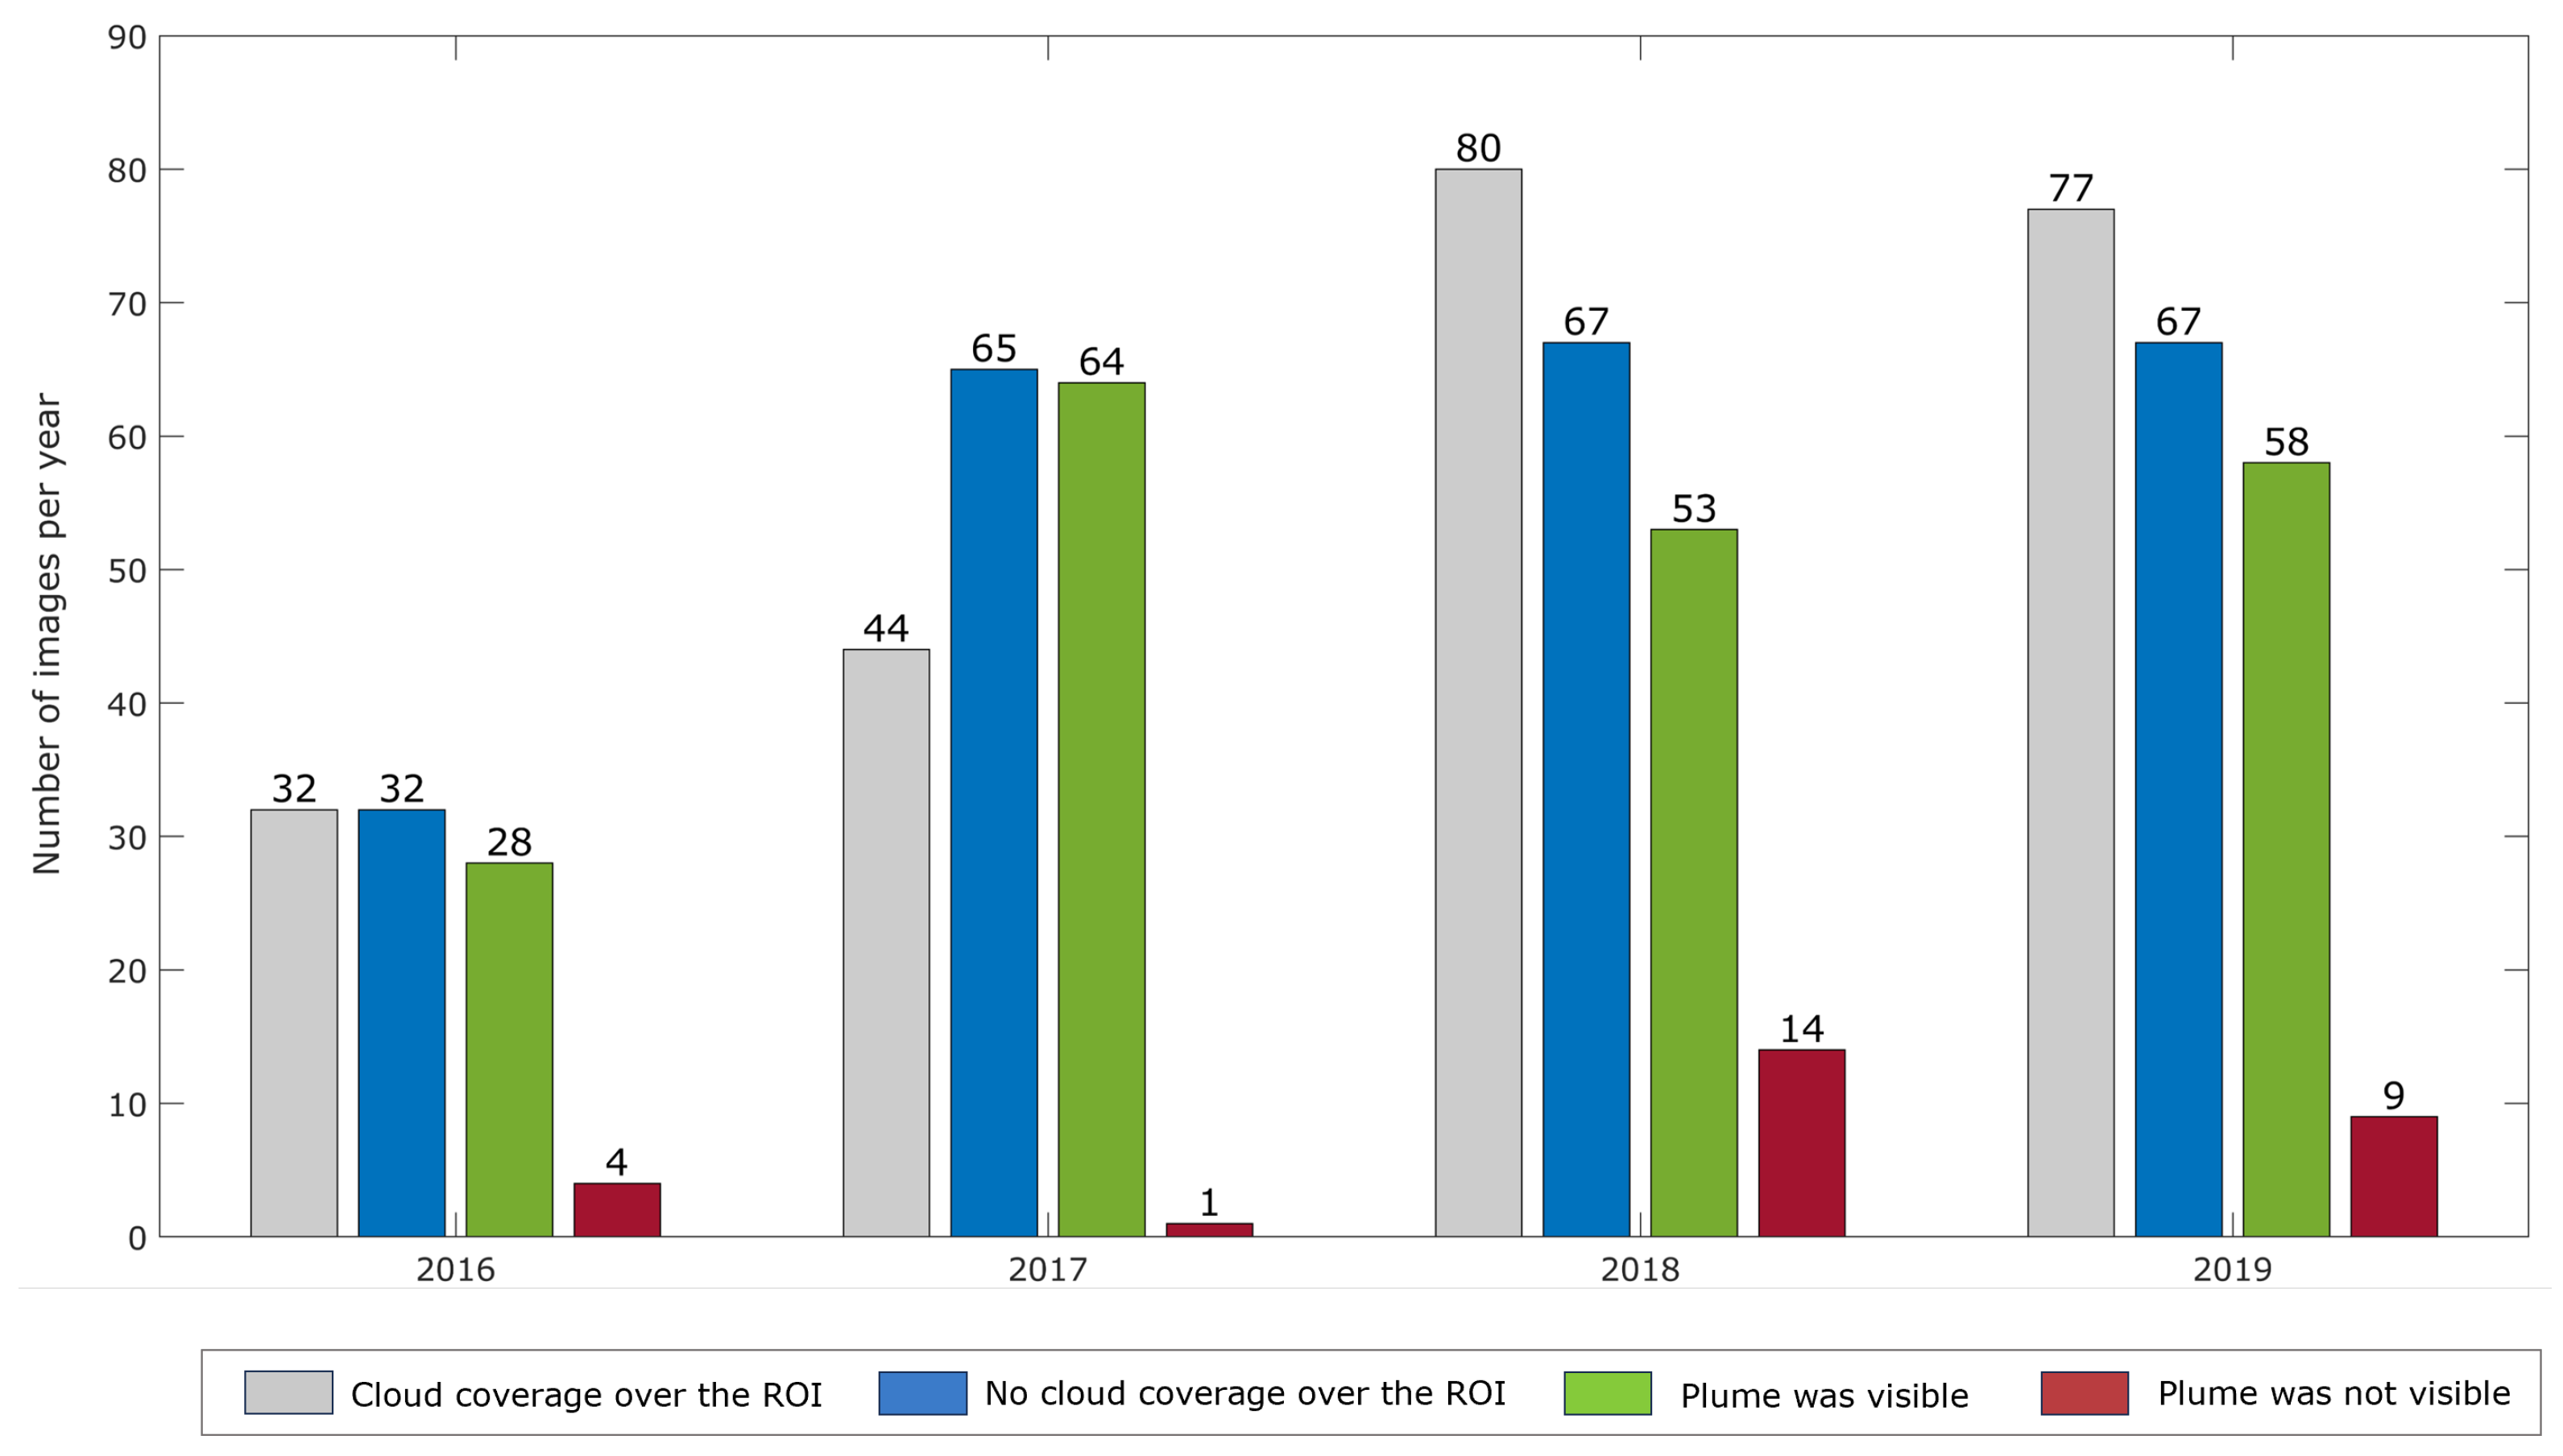
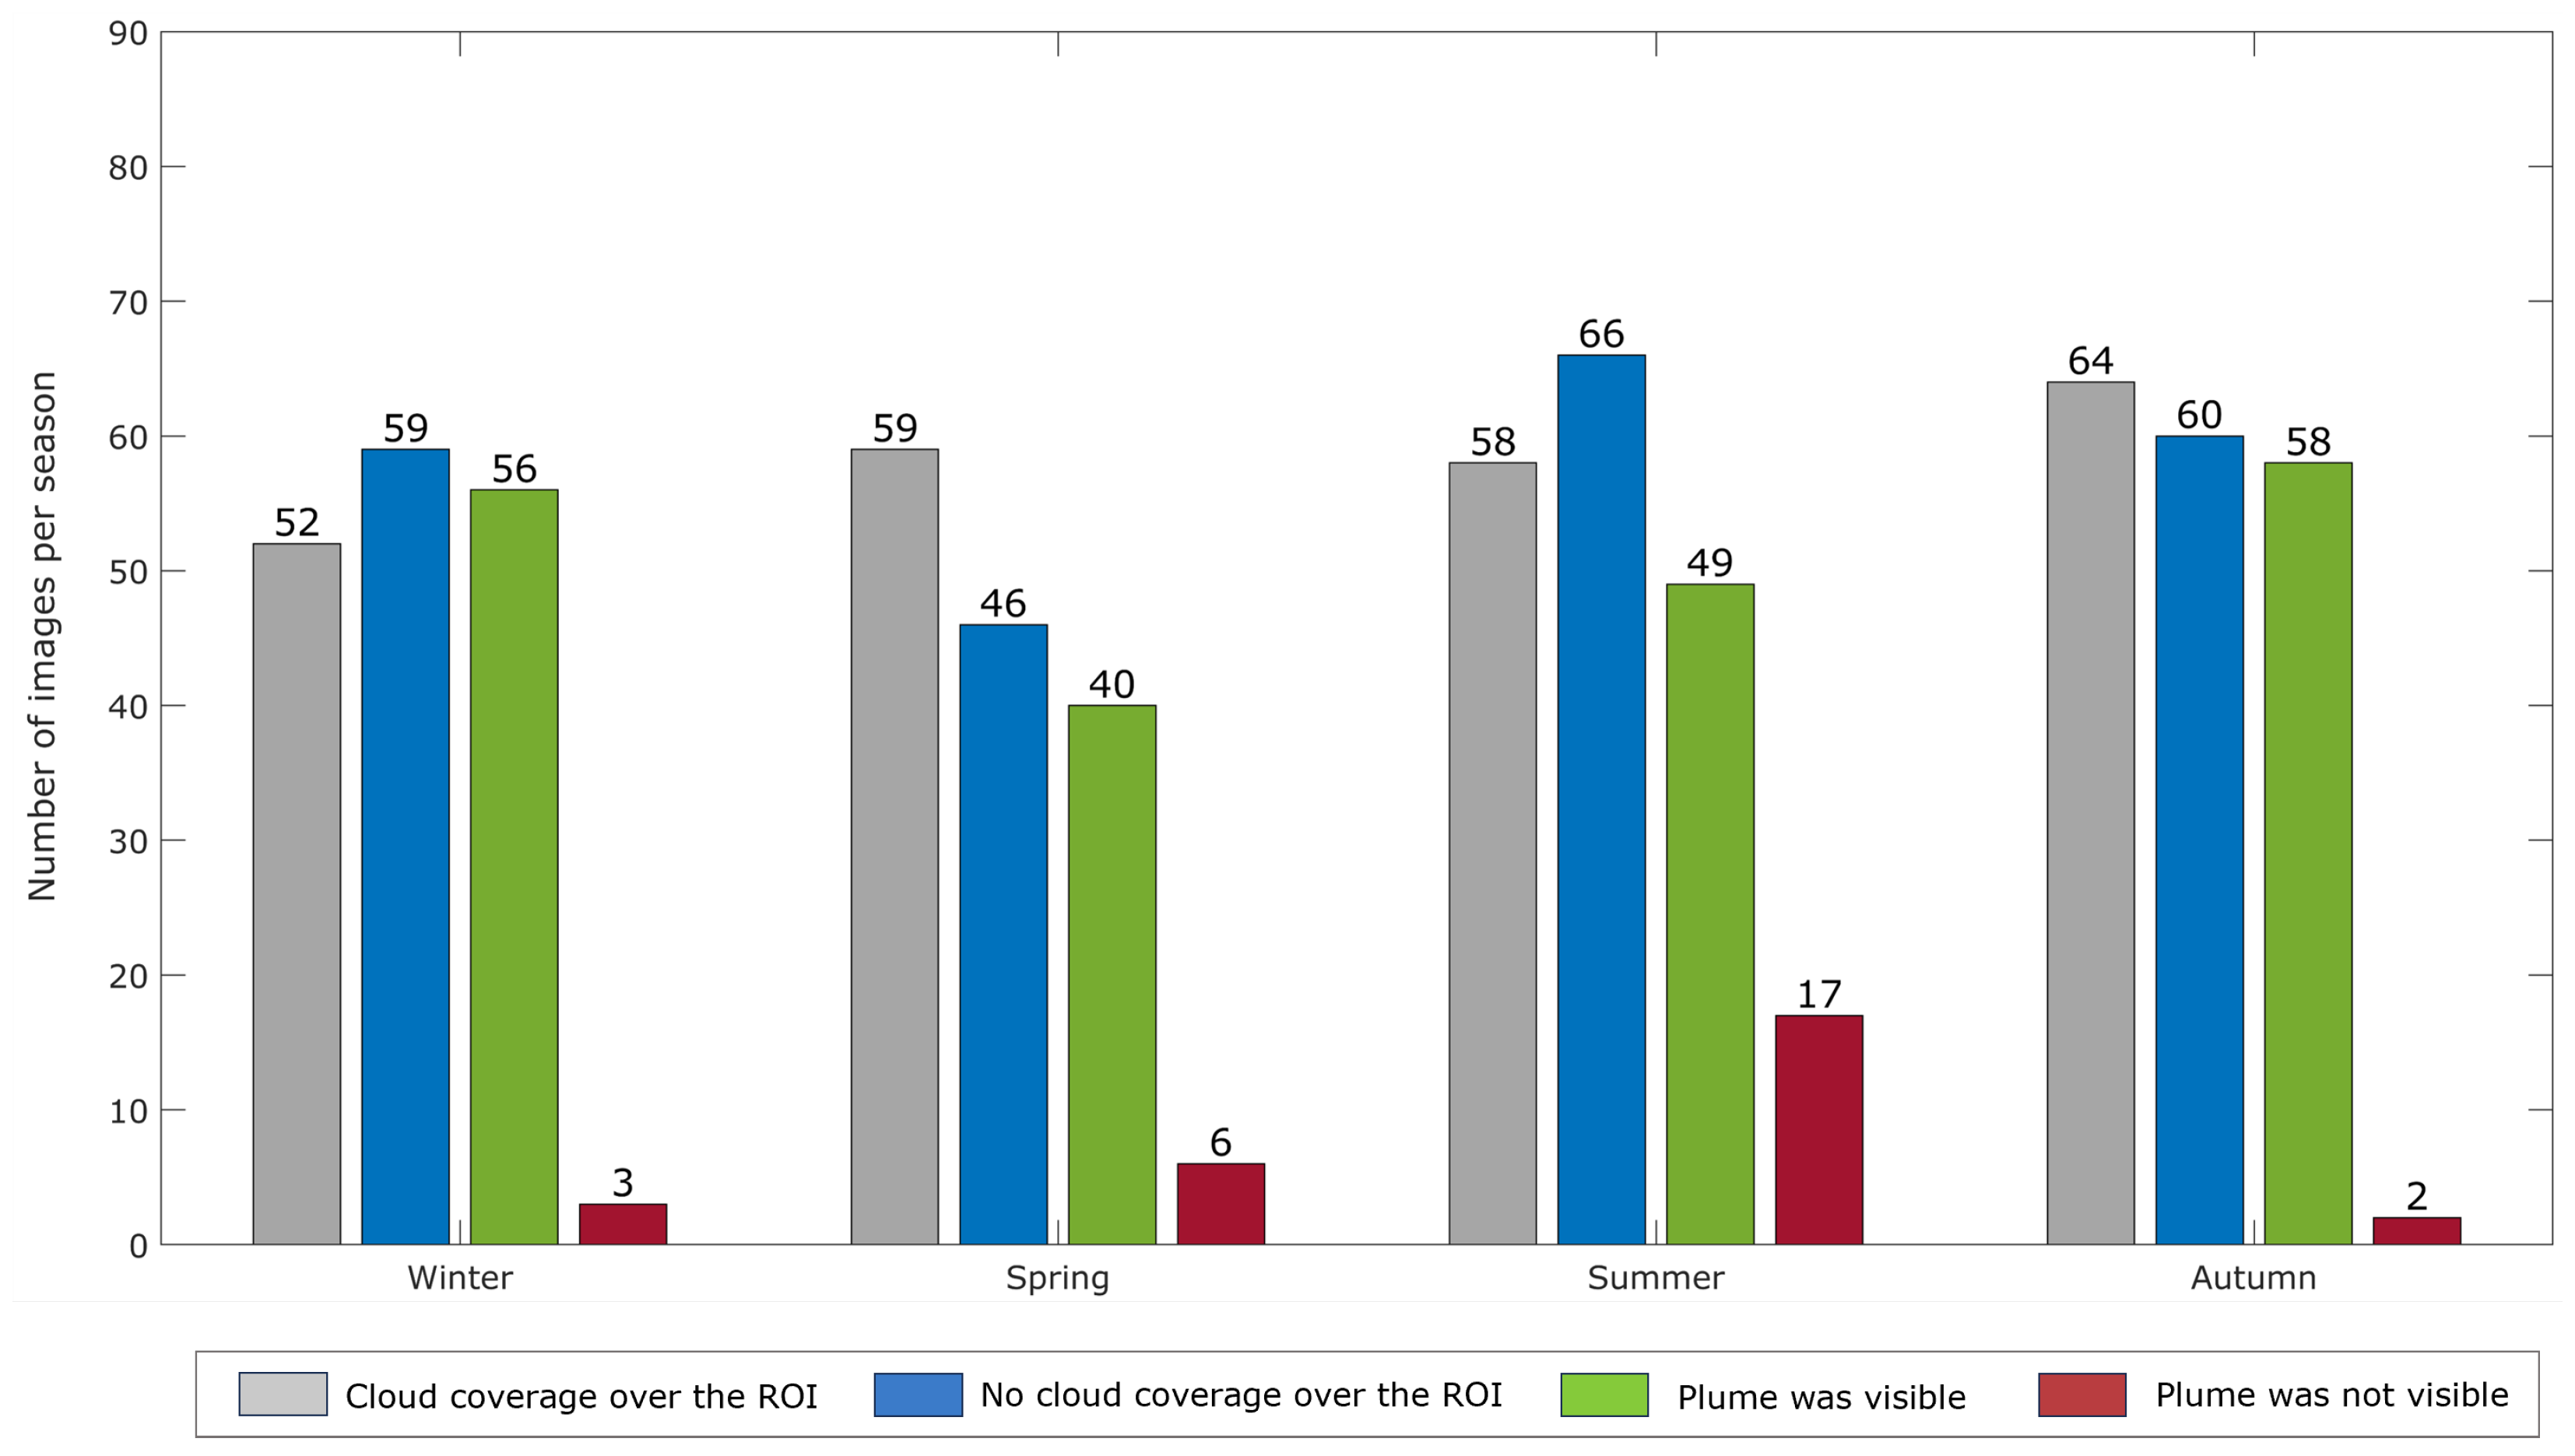
3.1. Annual and Seasonal Evaluation
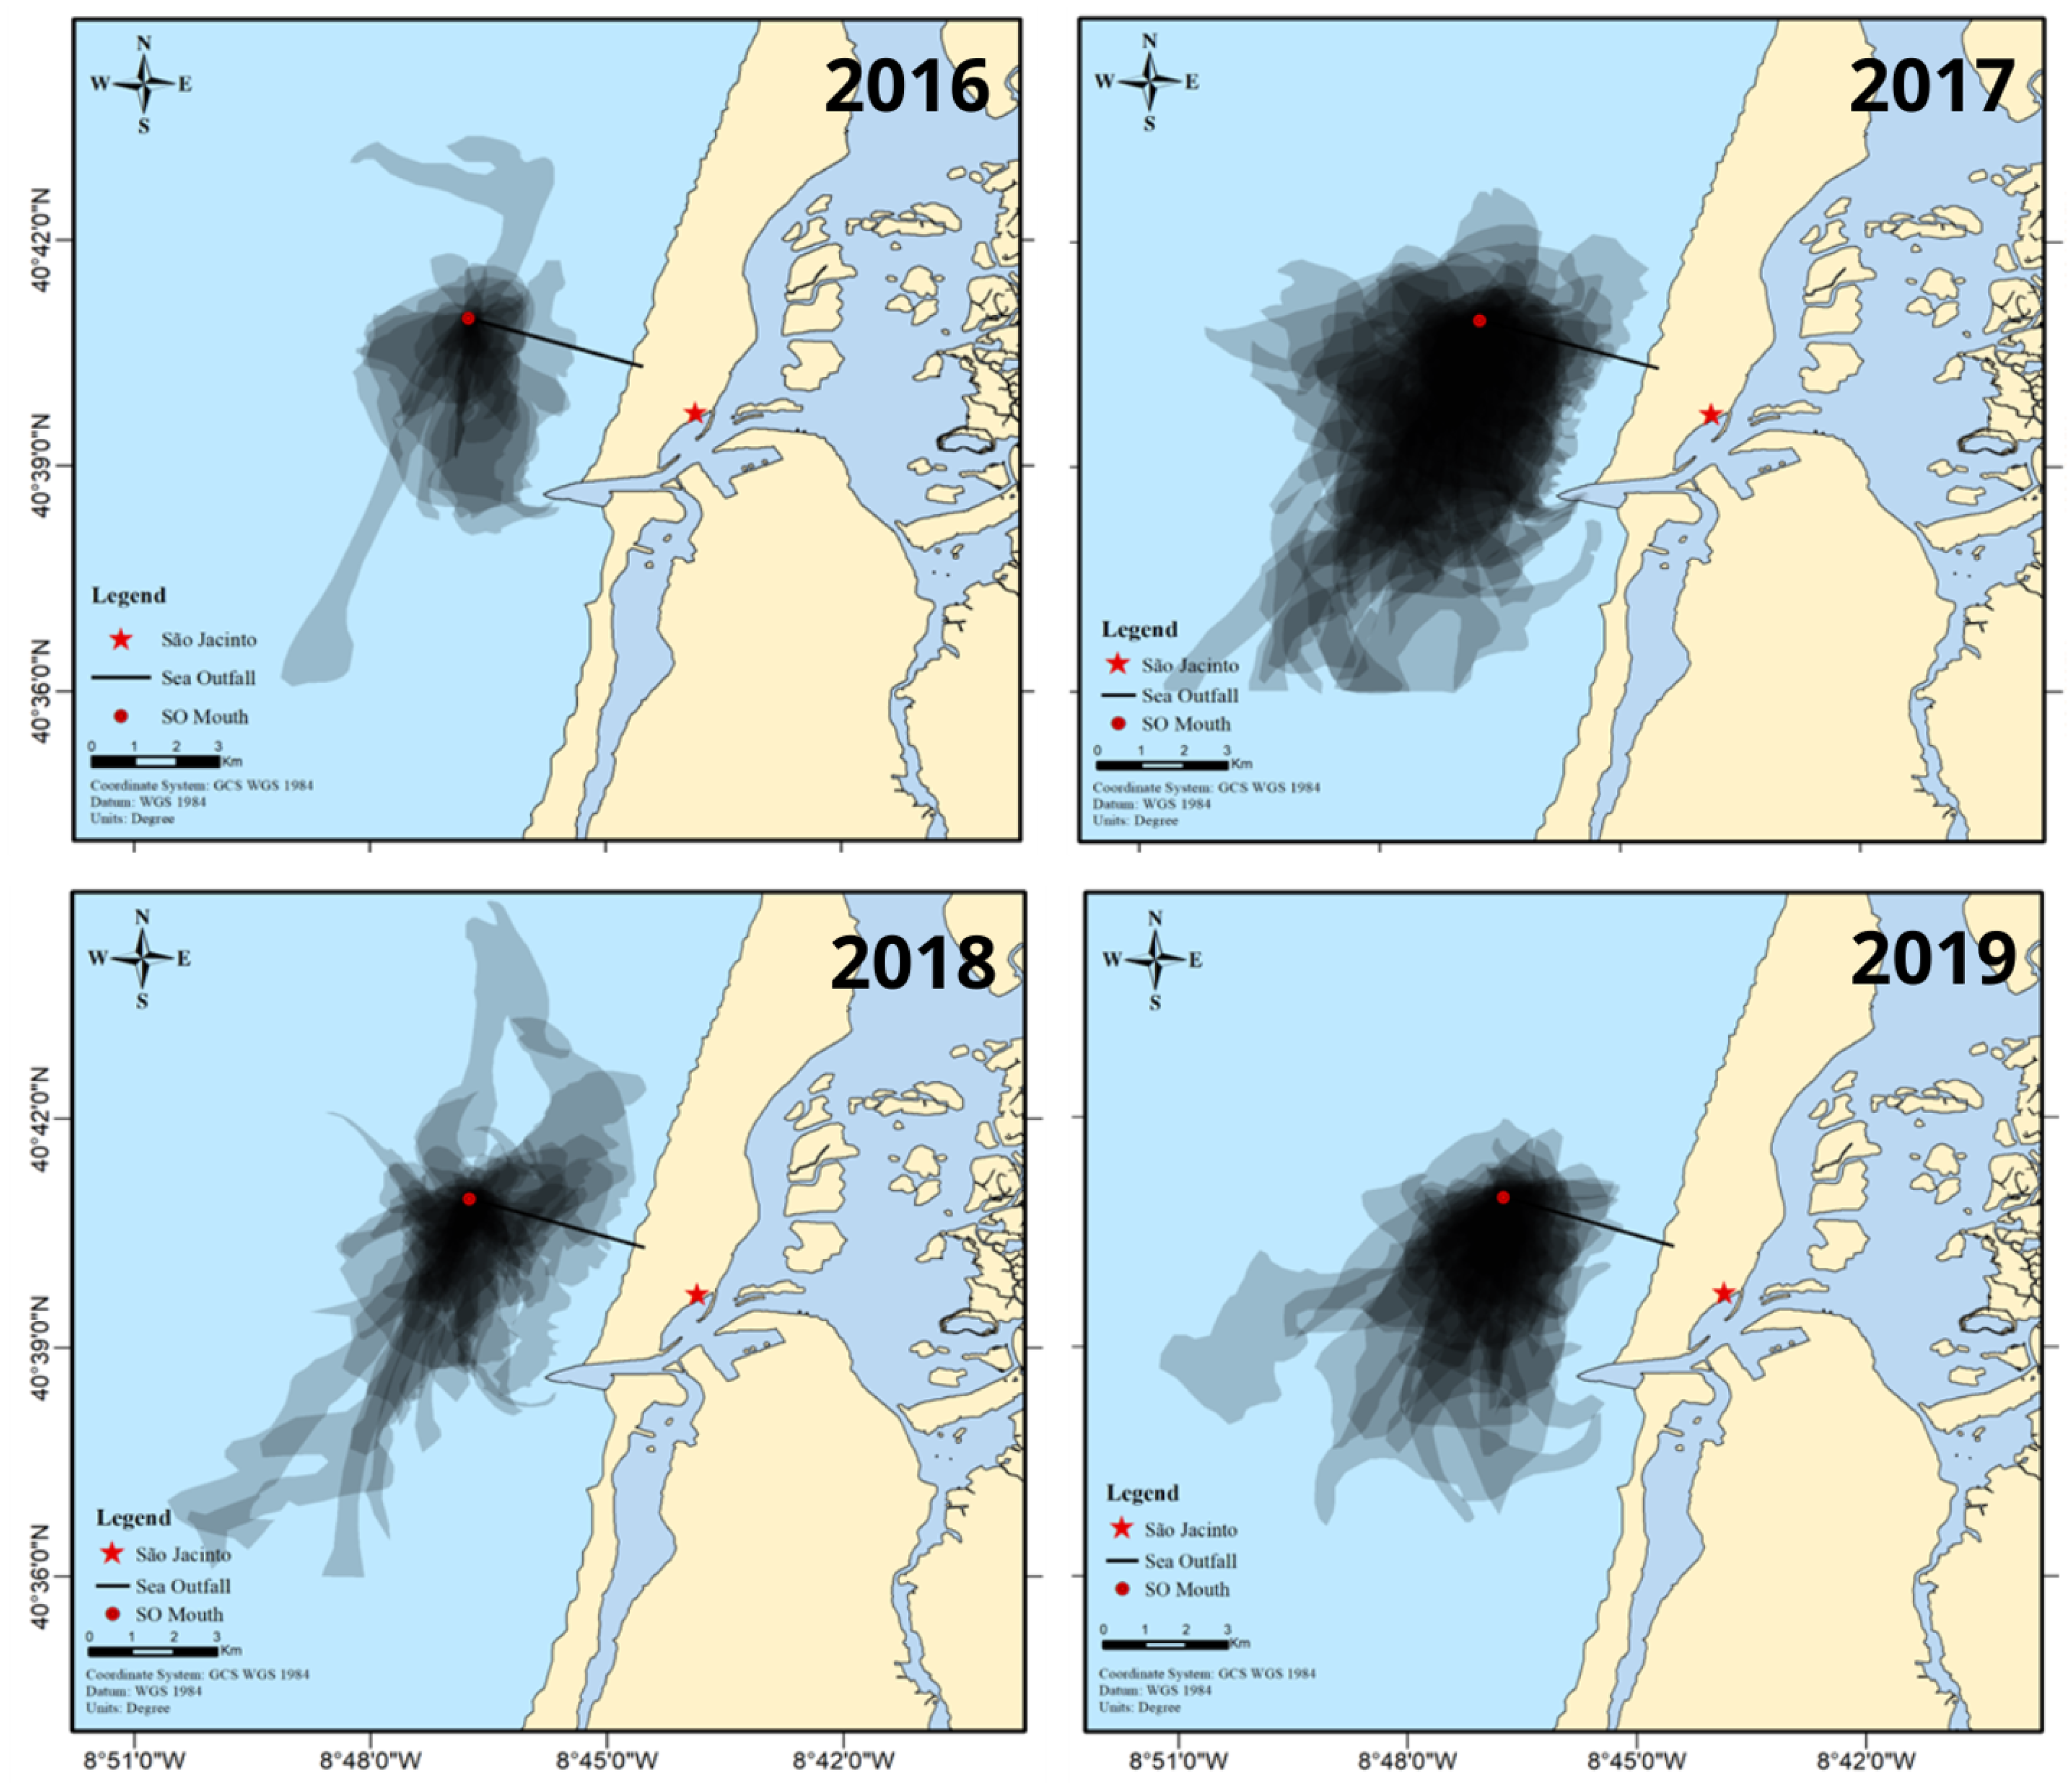
3.2. São Jacinto Sea Outfall’s Plume Catchment Area
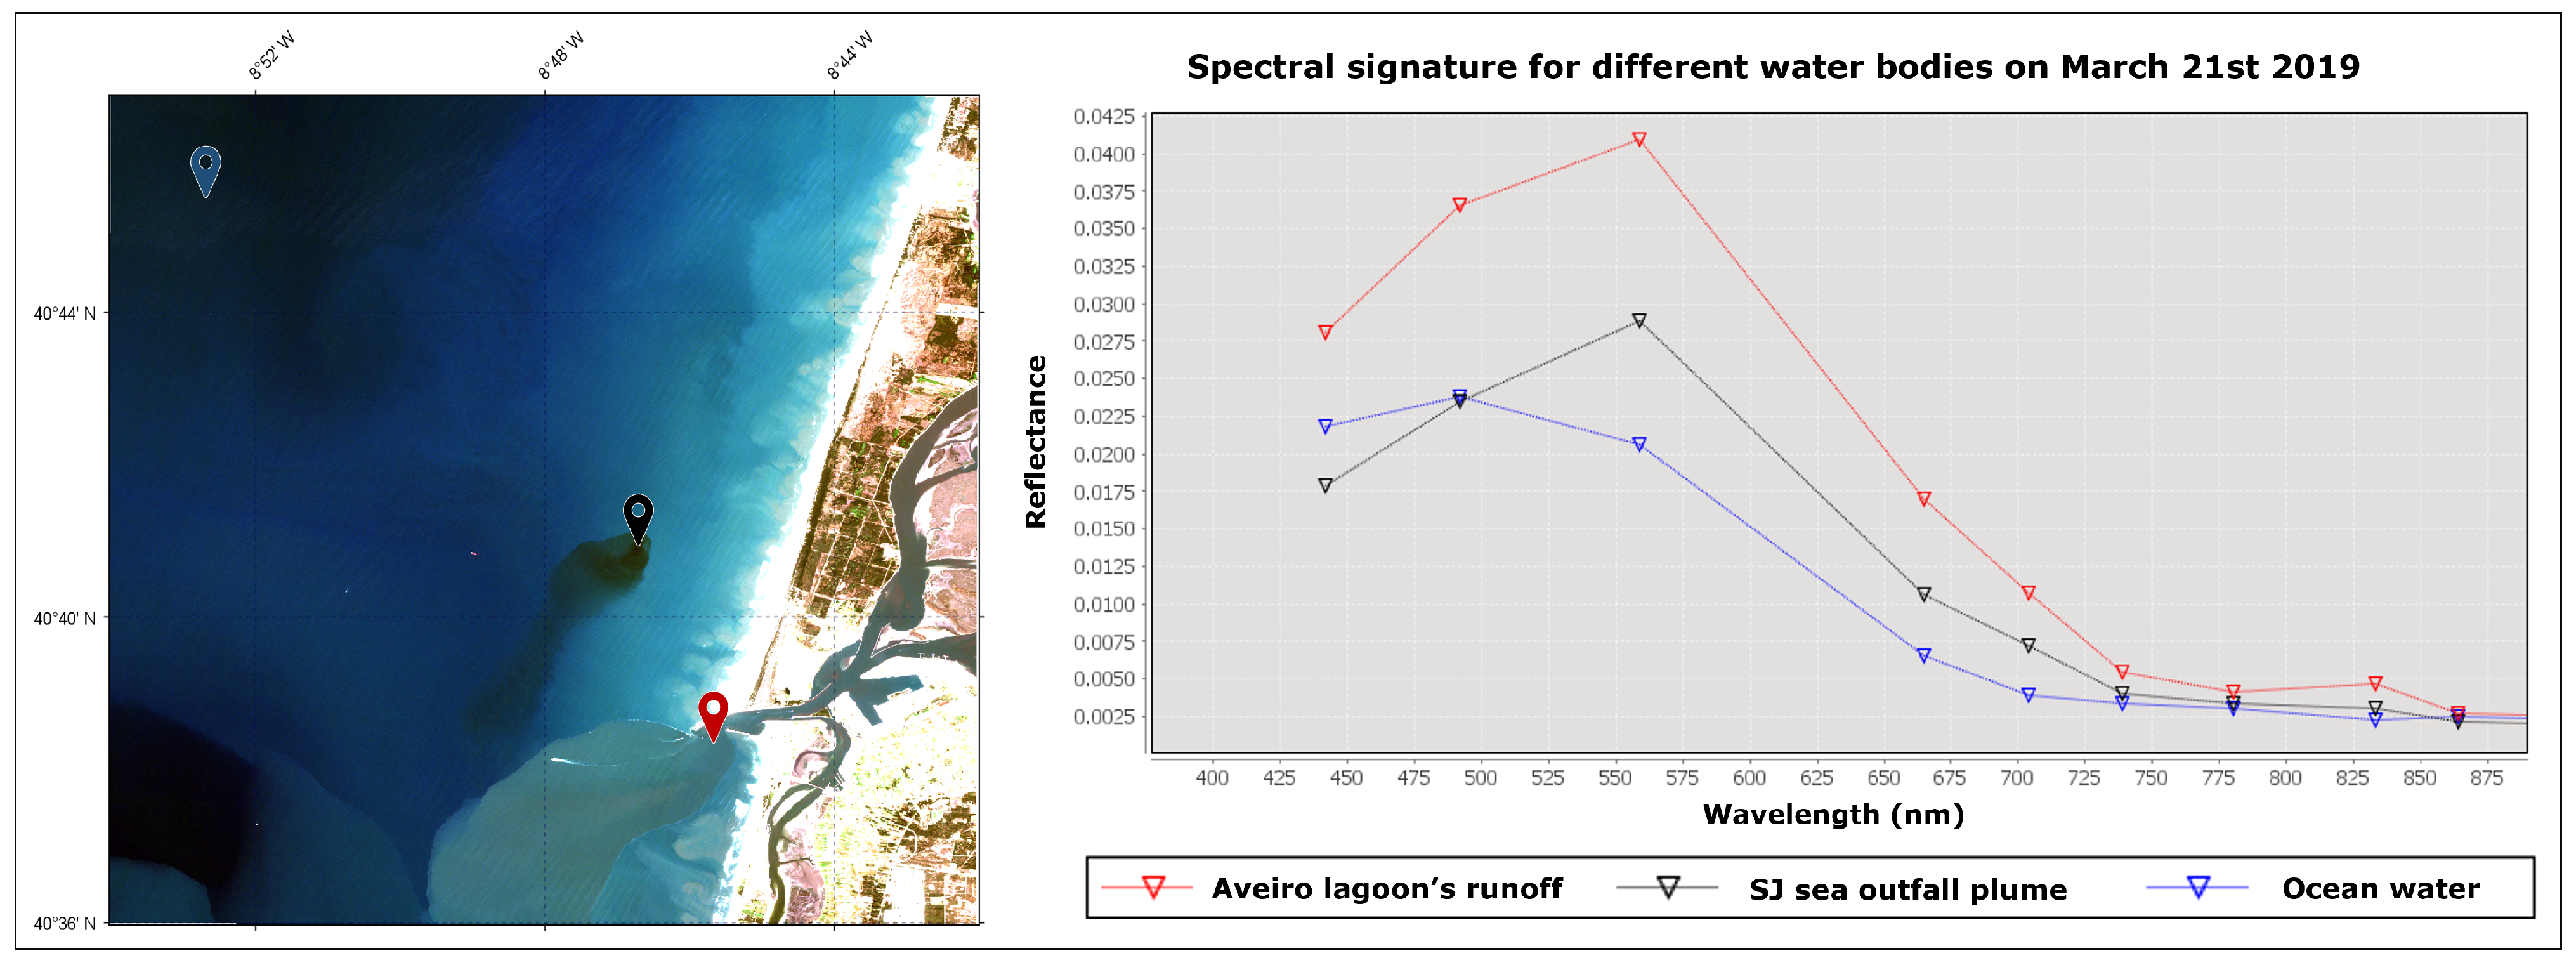
3.3. São Jacinto Sea Outfall’s Plume Monitoring through High-Spatial Resolution True Color Product
4. Discussion
- Water column stratification incremented with temperature, which limits the plume’s ascension, as observed by Ayad et al. [10] and Ramos and Neves [23]. According to the latest results, coastal water stratification increases from January, when it is dominated by salinity, to June, when it starts to be ruled by the water temperature as it increases throughout the summer. Coastal water experiences a less stratified gradient when the seasons change, as the dominant parameters’ range is altered;
- Less storm-water runoff carrying CDOM and sediments due to less precipitation in summer months;
- Sunglint and morning fog events which occur more often towards the end of spring and early summer.
5. Conclusions
Supplementary Materials
Author Contributions
Funding
Data Availability Statement
Acknowledgments
Conflicts of Interest
References
- Hafeez, S.; Wong, M.S.; Abbas, S.; Kwok, C.Y.; Nichol, J.; Ho Lee, K.; Tang, D.; Pun, L. Detection and monitoring of marine pollution using remote dsensing technologies. In Monitoring of Marine Pollution; Fouzia, H.B., Ed.; IntechOpen: London, UK, 2019; Chapter 2; p. 26. [Google Scholar] [CrossRef]
- Mozetič, P.; Malačič, V.; Turk, V. A case study of sewage discharge in the shallow coastal area of the Northern Adriatic Sea (Gulf of Trieste). Mar. Ecol. 2008, 29, 483–494. [Google Scholar] [CrossRef]
- Cravo, A.; Barbosa, A.B.; Correia, C.; Matos, A.; Caetano, S.; Lima, M.J.; Jacob, J. Unravelling the effects of treated wastewater discharges on the water quality in a coastal lagoon system (Ria Formosa, South Portugal): Relevance of hydrodynamic conditions. Mar. Pollut. Bull. 2022, 174, 113296. [Google Scholar] [CrossRef] [PubMed]
- Gancheva, I.; Peneva, E.; Slabakova, V. Detecting the surface signature of Riverine and effluent plumes along the Bulgarian black sea coast using satellite data. Remote Sens. 2021, 13, 4094. [Google Scholar] [CrossRef]
- Reifel, K.M.; Corcoran, A.A.; Cash, C.; Shipe, R.; Jones, B.H. Effects of a surfacing effluent plume on a coastal phytoplankton community. Cont. Shelf Res. 2013, 60, 38–50. [Google Scholar] [CrossRef]
- European Commission. Water Framework Directive 2000/60/EC; European Commission: Brussels, Belgium, 2000. [Google Scholar]
- Chaves, F.D.S.C. Dimensionamento Hidráulico-Estrutural de Emissários Submarinos. Estudo de Caso. Master’s Thesis, Universidade do Porto, Porto, Portugal, June 2014. [Google Scholar]
- Santos, C.; Catarino, J.; Marques, E.; Figueiredo, Z.; Trancoso, A.; Barata, P.; Marecos, H.; Neves, R. Monitorização Ambiental Do Emissário Submarino Da Guia. In Proceedings of the 7º Congresso da Água, 2004. p. 15. Available online: https://www.aprh.pt/congressoagua2004/PDF/51.PDF (accessed on 10 January 2023).
- Direção-Geral de Recursos Naturais Segurança e Serviços Marítimos. Ordenamento do Mar Português (PSOEM). Available online: https://www.psoem.pt/geoportal_psoem/ (accessed on 10 January 2023).
- Ayad, M.; Li, J.; Holt, B.; Lee, C. Analysis and classification of stormwater and wastewater runoff from the Tijuana river Using remote sensing imagery. Remote Sens. Front. Environ. Sci. 2020, 8, 599030. [Google Scholar] [CrossRef]
- Bondur, V.G.; Vorobyev, V.E.; Zamshin, V.V.; Serebryany, A.N.; Latushkin, A.A.; Li, M.E.; Martynov, O.V.; Hurchak, A.P.; Grinchenko, D.V. Monitoring anthropogenic impact on some coastal water areas of the Black Sea using multispectral satellite imagery. Atmos. Ocean. Phys. 2018, 54, 1008–1022. [Google Scholar] [CrossRef]
- Trinh, R.C.; Fichot, C.G.; Gierach, M.M.; Holt, B.; Malakar, N.K.; Hulley, G.; Smith, J. Application of Landsat 8 for Monitoring Impacts of Wastewater Discharge on Coastal Water Quality. Front. Mar. Sci. 2017, 4, 17. [Google Scholar] [CrossRef]
- European Space Agency. Colour Vision for Copernicus. The Story of Sentinel-2; Technical Report; European Space Agency: Paris, France, 2015. [Google Scholar]
- Morel, A.; Prieur, L. Analysis of variations in ocean color. Limnol. Oceanogr. 1977, 22, 709–722. [Google Scholar] [CrossRef]
- Sutcliffe, A.; Brito, A.C.; Sá, C.; Sousa, F.; Boutov, D.; Brotas, V. Ocean Colour. In Observação da Terra: Uso de Imagens de Temperatura da Superfície do mar e cor do Oceano para a Monitorização de águas Costeiras e Oceânicas, Eletronic ed.; DGRM: Lisboa, Portugal, 2016; Chapter 3; pp. 67–104. [Google Scholar]
- Sent, G.; Biguino, B.; Favareto, L.; Cruz, J.; Sá, C.; Dogliotti, A.I.; Palma, C.; Brotas, V.; Brito, A.C. Deriving water quality parameters using sentinel-2 imagery: A case study in the Sado Estuary, Portugal. Remote Sens. 2021, 13, 1043. [Google Scholar] [CrossRef]
- Mantas, V.M.; Pereira, A.J.; Neto, J.; Patrício, J.; Marques, J.C. Monitoring estuarine water quality using satellite imagery. The Mondego river estuary (Portugal) as a case study. Ocean Coast. Manag. 2013, 72, 13–21. [Google Scholar] [CrossRef]
- Silva, J.F.; Duck, R.W.; Anderson, J.M.; McManus, J.; Monk, J.G. Airborne observation of frontal systems in the inlet channel of the Ria de Aveiro, Portugal. Phys. Chem. Earth Part B Hydrol. Ocean. Atmos. 2001, 26, 713–719. [Google Scholar] [CrossRef]
- Silva, J.F.; Duck, R.W.; Hopkins, T.S.; Anderson, J.M. Nearshore circulation revealed by wastewater discharge from a submarine outfall, Aveiro Coast, Portugal. Hydrol. Earth Syst. Sci. 2002, 6, 983–988. [Google Scholar] [CrossRef]
- CPU Urbanistas e Arquitetos LDA. Plano Intermunicipal de Ordenamento da Ria de Aveiro; CPU Urbanistas e Arquitetos LDA: Lisbon, Portugal, 2007. [Google Scholar]
- Polis Litoral Ria de Aveiro. Intervenção de Requalificação e Valorização da Ria de Aveiro. Plano Estratégico. 2010. Available online: https://www.polisriadeaveiro.pt/docs/303017N1812011317686275.pdf (accessed on 12 December 2022).
- Águas do Centro Litoral. Exutores Submarinos em Manutenção. 2021. Available online: https://www.aguasdocentrolitoral.pt/exutores-submarinos-em-manutencao/?cn-reloaded=1 (accessed on 12 December 2022).
- Ramos, P.; Neves, M.V. Monitorização de Descargas de Águas Residuais no Mar através de Veículos Submarinos Autónomos (VSAs). Ing. Agua 2009, 16, 201–216. [Google Scholar] [CrossRef]
- Blue Flag. Blue Flag Sites. Available online: https://www.blueflag.global/all-bf-sites (accessed on 25 September 2021).
- Câmara Municipal de Aveiro. São Jacinto recebe Bandeira Azul e Bandeira de praia com Qualidade de Ouro 2020. 2020. Available online: https://www.cm-aveiro.pt/municipio/comunicacao/noticias/noticia/sao-jacinto-recebe-bandeira-azul-e-bandeira-de-praia-com-qualidade-de-ouro-2020 (accessed on 25 September 2021).
- Diário de Aveiro. Bandeira Azul Hasteada em São Jacinto pelo 17.º ano Consecutivo. Available online: https://www.diarioaveiro.pt/noticia/83628 (accessed on 25 September 2021).
- Malhadas, M.M.d.S. Modelling the Impact of Submarine Outfalls Plume in a Coastal Areas—Foz do Arelho Case Study. Master’s Thesis, Instituto Superior Técnico, Lisboa, Portugal, April 2008. [Google Scholar]
- Silva, P.A.; Ramos, M.; Almeida, M.; Dubert, J. Water Exchange Mechanisms between Ria de Aveiro and the Atlantic Ocean. J. Coast. Res. 2004, 1622–1626. [Google Scholar]
- Sousa, M.C.; Ribeiro, A.S.; Des, M.; Mendes, R.; Alvarez, I.; Gomez-gesteira, M.; Dias, J.M.; Si, M.; Dias, J.M.; Alvarez, I. Integrated High-resolution Numerical Model for the NW Iberian Peninsula Coast and Main Estuarine Systems. In Proceedings of the International Coastal Symposium (ICS), Busan, Republic of Korea, 13–18 May 2018; Volume 85, pp. 66–70. [Google Scholar] [CrossRef]
- Dias, J.M.; Lopes, J.F.; Dekeyser, I. Hydrological characterisation of Ria de Aveiro, Portugal, in early summer. Oceanol. Acta 1999, 22, 473–485. [Google Scholar] [CrossRef]
- Mendes, R.P.d.S. Numerical Modeling of the Ria de Aveiro Plume: A Preliminary Study. Master’s Thesis, Universidade de Aveiro, Aveiro, Portugal, 2010. [Google Scholar]
- Sobrinho, J. Balanço de nutrientes na plataforma continental ao largo da Região de Aveiro. Master’s Thesis, Instituto Superior Técnico, Lisboa, Portugal, June 2012. [Google Scholar]
- Copernincus Open Access Hub. Available online: https://scihub.copernicus.eu/dhus/#/home (accessed on 20 July 2021).
- ONDA. Available online: https://www.onda-dias.eu/cms/services/catalogues/?meta_service_category2=Data-Access (accessed on 25 July 2012).
- RBINS. ACOLITE. Available online: https://odnature.naturalsciences.be/remsem/software-and-data/acolite (accessed on 26 July 2021).
- Vanhellemont, Q. ACOLITE Python User Manual; Version 20210114; RBINS: Brussels, Belgium, 2021; 21p. [Google Scholar]
- European Space Agency. SNAP (Sentinel Aplication Platform). Available online: https://earth.esa.int/eogateway/tools/snap (accessed on 15 May 2021).
- Rocha, A.; Aguiar, M.; Lima, K.; Mendes, R.; Dias, J.M.; Sousa, M.C.; De Sousa, J.B. Optimal AUV trajectory planning and execution control for maritime pollution incident response. In Oceans Conference Record (IEEE); IEEE: Piscataway, NJ, USA, 2021. [Google Scholar] [CrossRef]
- Meteogalicia. Servidor THREDDS de MeteoGalicia. Available online: http://mandeo.meteogalicia.es/thredds/catalogos/WRF_2D/catalog.html (accessed on 15 June 2021).
- Dwivedi, V.; Singh, C. Performance Evaluation of Sewage Treatment Plant Relating to Chemical Characteristics and Re-use of Treated Sewage in Landscaping. Int. J. Res. Appl. Sci. Eng. Technol. 2019, 7, 1833–1835. [Google Scholar] [CrossRef]
- VEOLIA. Chapter 37—Wastewater Treatment. Website. 2023. Available online: https://www.watertechnologies.com/handbook/chapter-37-wastewater-treatment (accessed on 15 May 2021).
- Harmel, T.; Chami, M.; Tormos, T.; Reynaud, N.; Danis, P.A. Sunglint correction of the Multi-Spectral Instrument (MSI)-SENTINEL-2 imagery over inland and sea waters from SWIR bands. Remote Sens. Environ. 2018, 204, 308–321. [Google Scholar] [CrossRef]
- Morais, M.G. Previsão e Análise de Nevoeiros em Portugal Continental com o Modelo de Mesoescala MM5. Master’s Thesis, Universidade de Aveiro, Aveiro, Portugal, 2009. [Google Scholar]
- Ramos, M.; Almeida, M.; Silva, P.; Dubert, J.; do Carrno, J.A. Modelling Study of the Dispersal of Pollutants at São Jacinto Submarine Outfall (Aveiro, Portugal). WIT Trans. Built Environ. 2003, 70, 133–141. [Google Scholar] [CrossRef]


Disclaimer/Publisher’s Note: The statements, opinions and data contained in all publications are solely those of the individual author(s) and contributor(s) and not of MDPI and/or the editor(s). MDPI and/or the editor(s) disclaim responsibility for any injury to people or property resulting from any ideas, methods, instructions or products referred to in the content. |
© 2023 by the authors. Licensee MDPI, Basel, Switzerland. This article is an open access article distributed under the terms and conditions of the Creative Commons Attribution (CC BY) license (https://creativecommons.org/licenses/by/4.0/).
Share and Cite
Faria, B.; Mendes, R.; Lopes, C.L.; Picado, A.; Sousa, M.; Dias, J.M. Insights for Sea Outfall Turbid Plume Monitoring with High-Spatial-Resolution Satellite Imagery Application in Portugal. Remote Sens. 2023, 15, 3368. https://doi.org/10.3390/rs15133368
Faria B, Mendes R, Lopes CL, Picado A, Sousa M, Dias JM. Insights for Sea Outfall Turbid Plume Monitoring with High-Spatial-Resolution Satellite Imagery Application in Portugal. Remote Sensing. 2023; 15(13):3368. https://doi.org/10.3390/rs15133368
Chicago/Turabian StyleFaria, Bruna, Renato Mendes, Carina Lurdes Lopes, Ana Picado, Magda Sousa, and João Miguel Dias. 2023. "Insights for Sea Outfall Turbid Plume Monitoring with High-Spatial-Resolution Satellite Imagery Application in Portugal" Remote Sensing 15, no. 13: 3368. https://doi.org/10.3390/rs15133368