
Assessing Shoreline Changes in Fringing Salt Marshes from Satellite Remote Sensing Data


Abstract
:1. Introduction
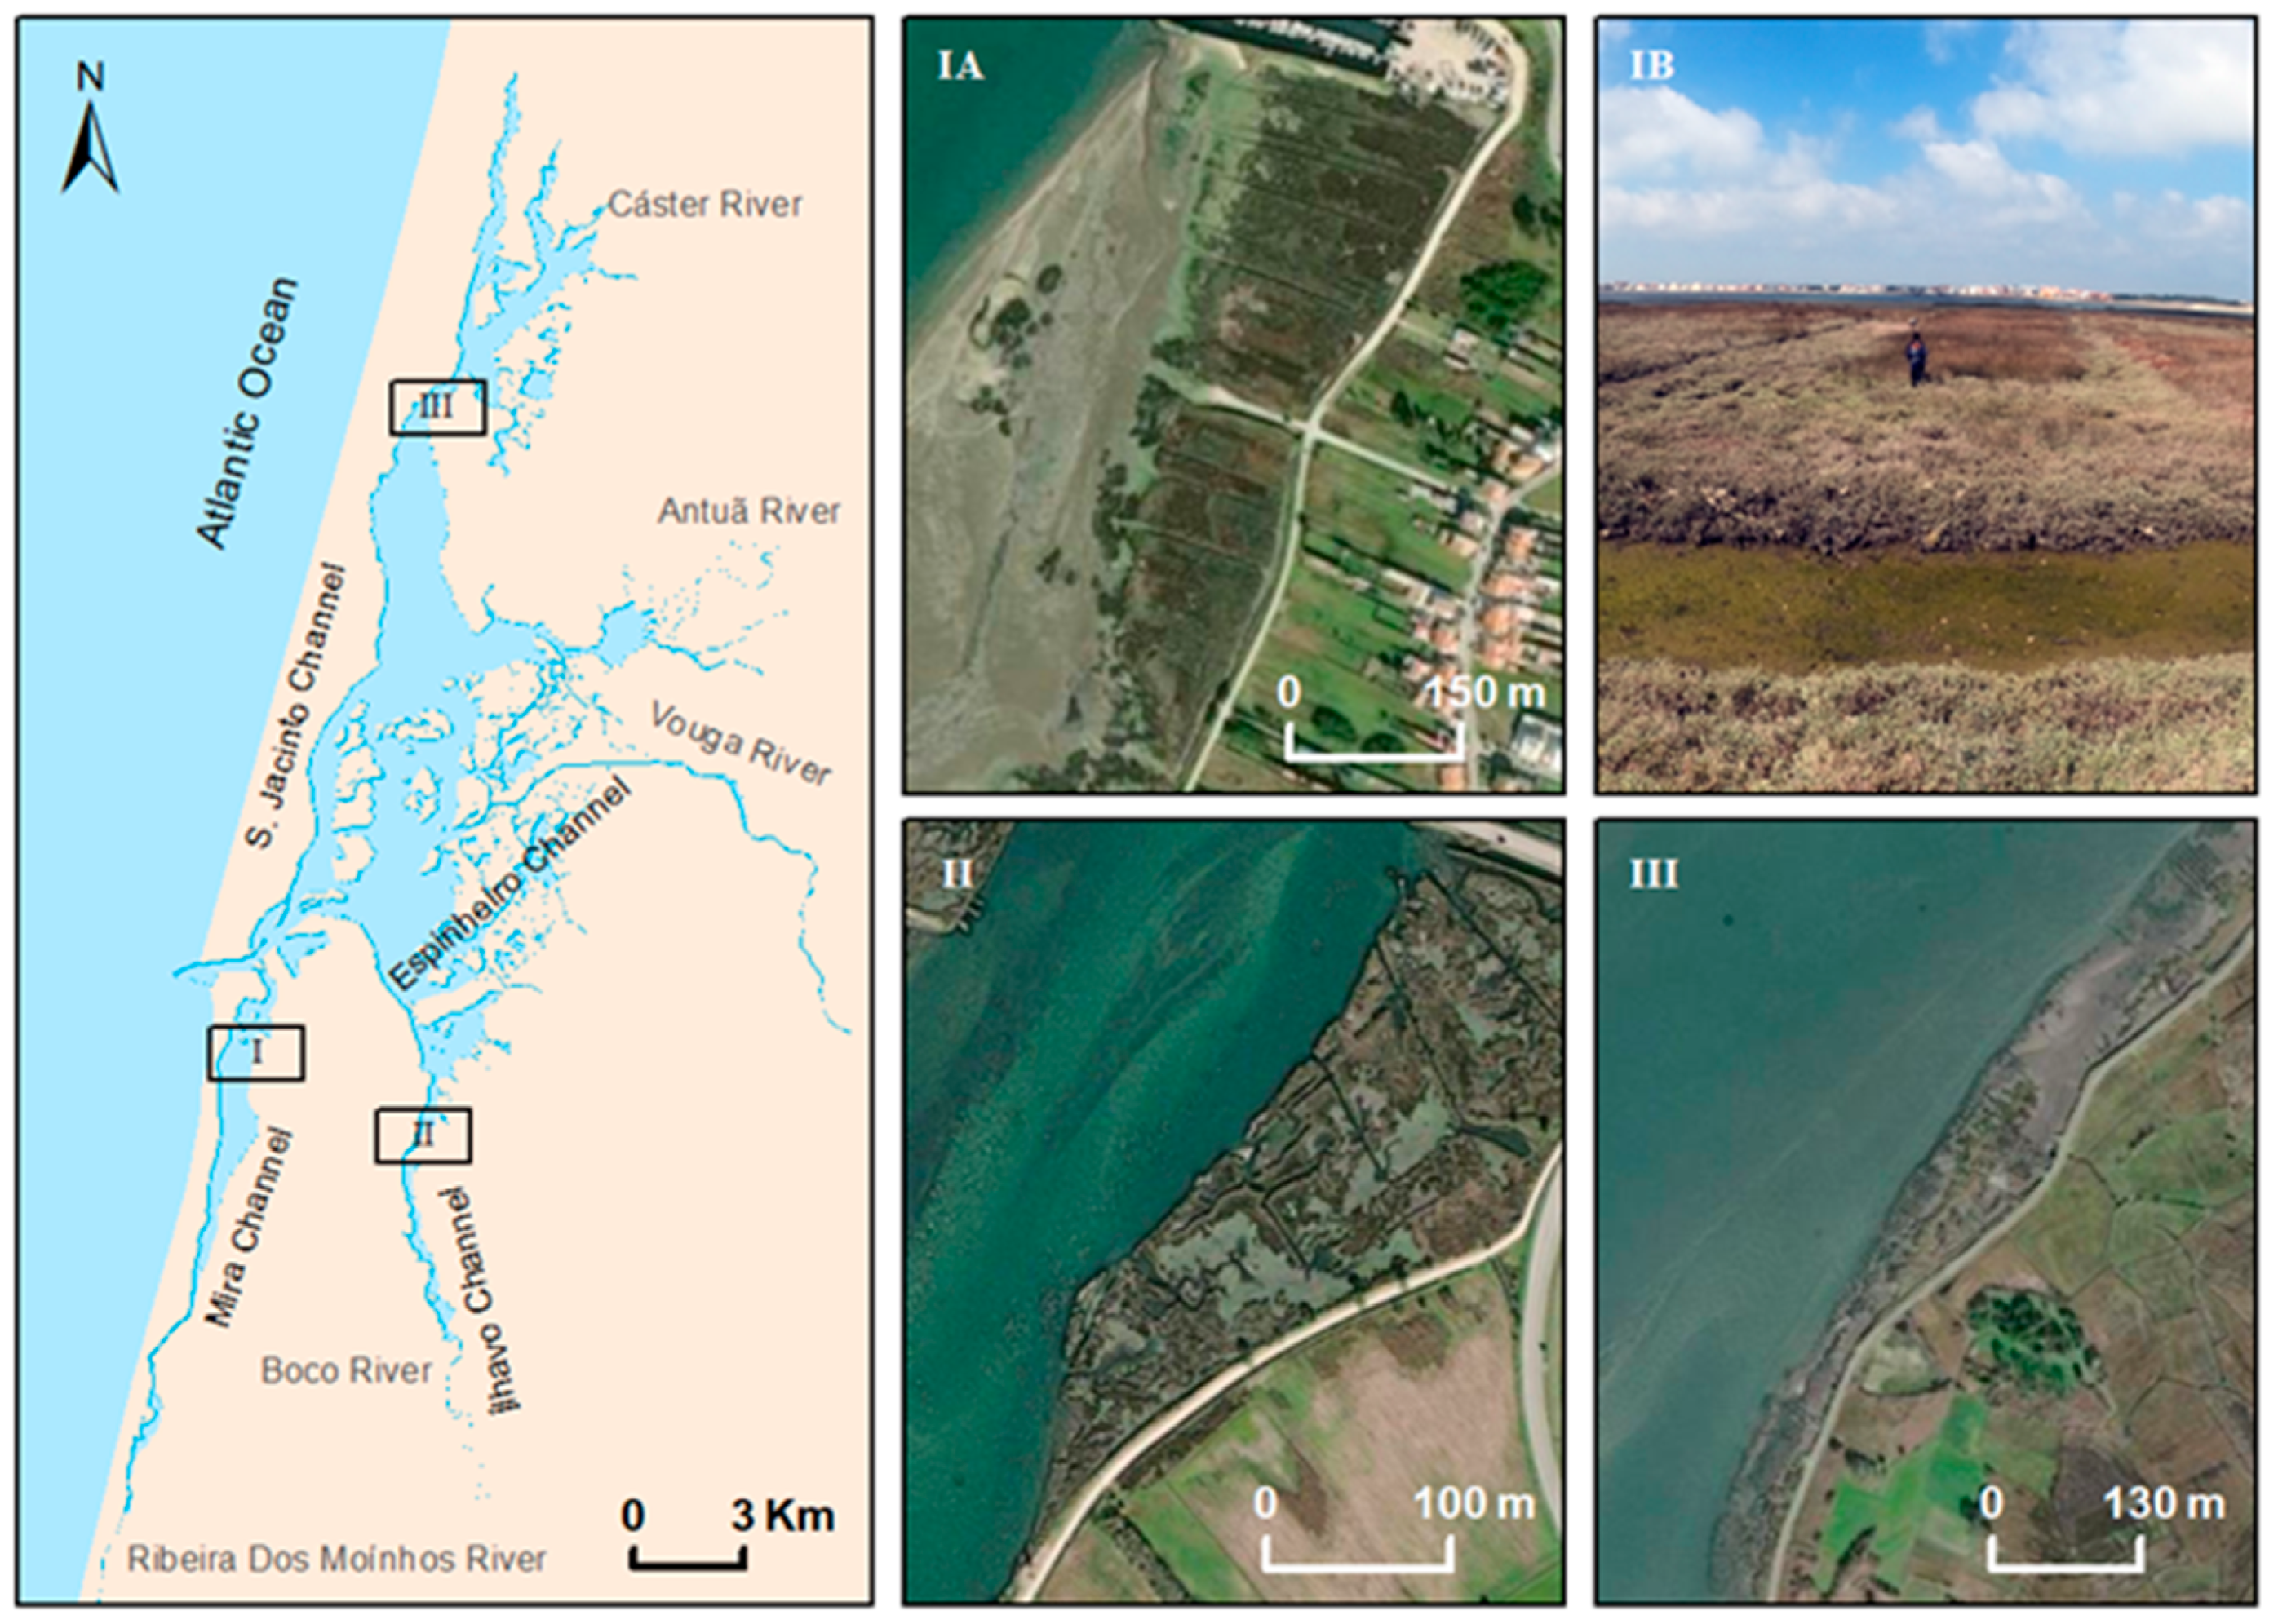
2. Study Area
3. Methodology
3.1. Data Collection
- (1)
- Surface Reflectance (SR) derived from Landsat-5 (TM) and Landsat-7 (ETM+), given by the USGS Earth Resources Observation and Science (EROS) Center Science Processing Architecture (ESPA), and Sentinel-2 (MSI), given by the Centre National d’Etudes Spatiales (CNES) for the Theia data center (Table 1). SR data for 1984, 2000, and 2022 was used to derive salt marsh shorelines based on the values of the NDVI. It should be noted that these dates consider three key moments: 1984, the start of Landsat-5 (TM) data collection; 2000, the beginning of salt marsh degradation as shown by Lopes et al. [10]; and 2022, indicative of the present.
- (2)
- Salt marsh shoreline was collected in Mira with a Trimble R8 receiver on 6 April 2022, during low tide to guarantee that the tidal flat was completely exposed. The coordinates of shoreline points were acquired with an accuracy of more than 10 cm using the GPS-RTK method by receiving signals from Global Navigation Satellite Systems (GNSS) and communicating with the reference network ReNEP (Portuguese Network of Permanent GNSS Stations) station closest to the sampling site. Cost and accessibility limitations made it impossible to collect data in the other two salt marshes.
- (3)
- Orthophotomosaics for 2021, made available by the General Directorate of Territory (DGT) (Table 1), were used to delineate reference shorelines for the Ílhavo and S. Jacinto salt marshes.
3.2. Salt Marsh Shoreline Assessment and Validation
3.3. Salt Marsh Shoreline Change
4. Results
4.1. Salt Marsh Shoreline Validation
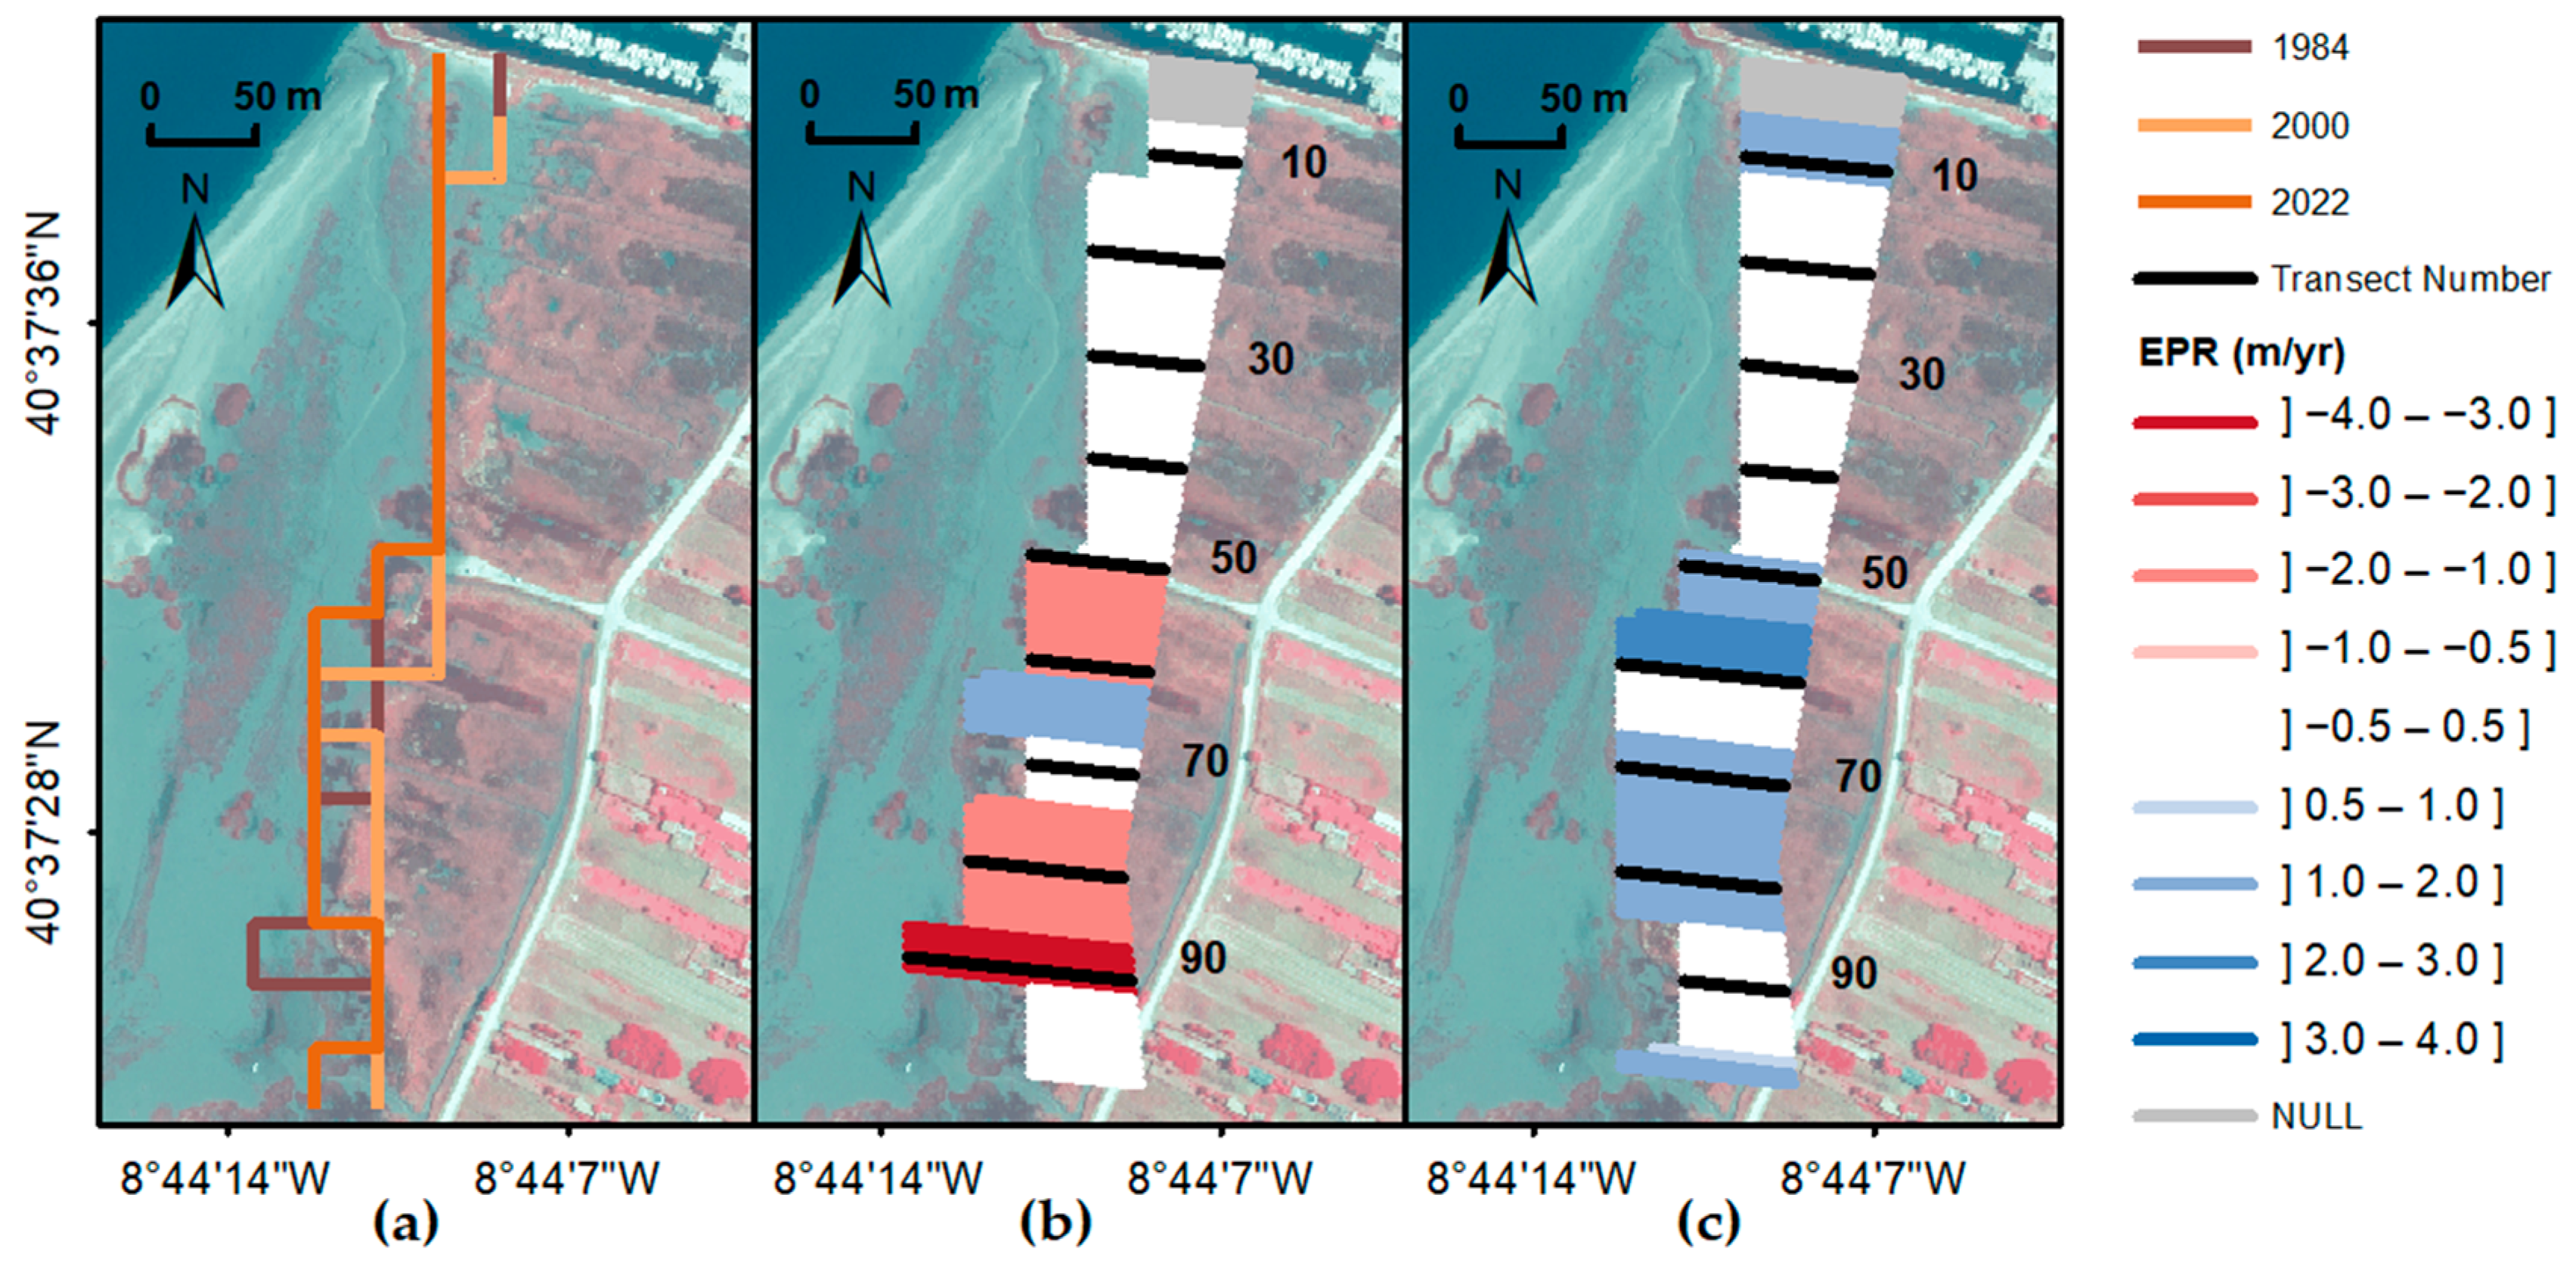
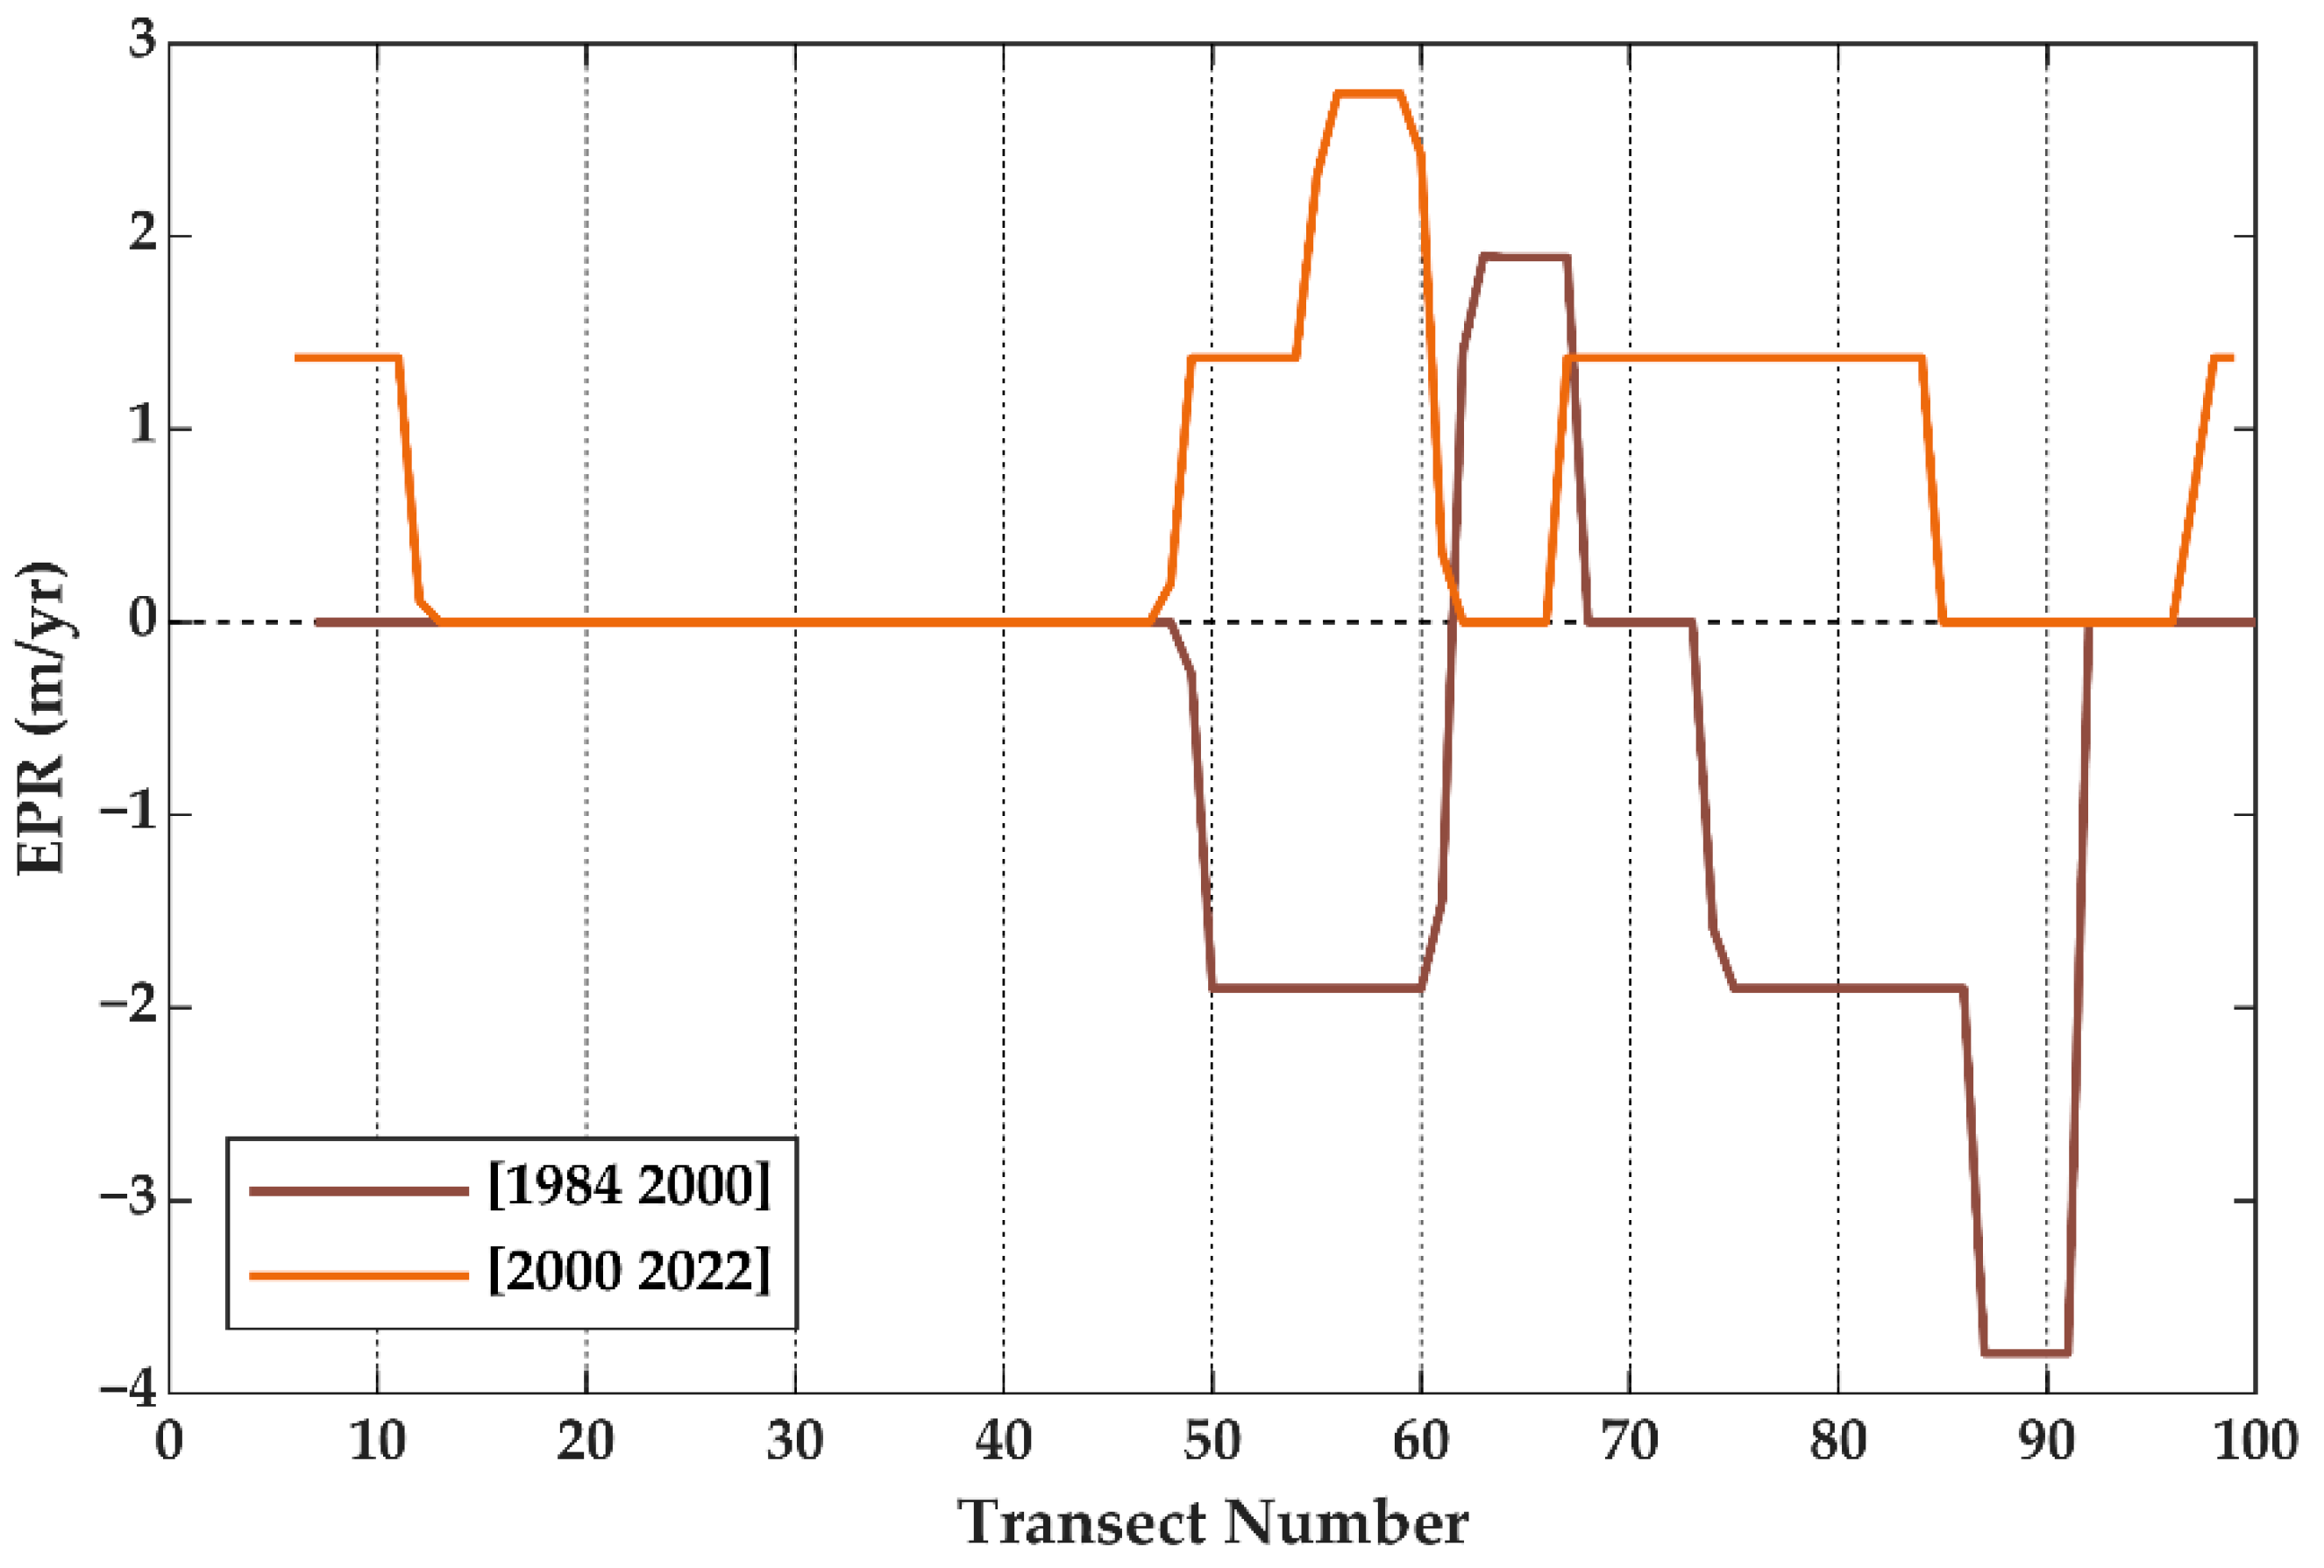
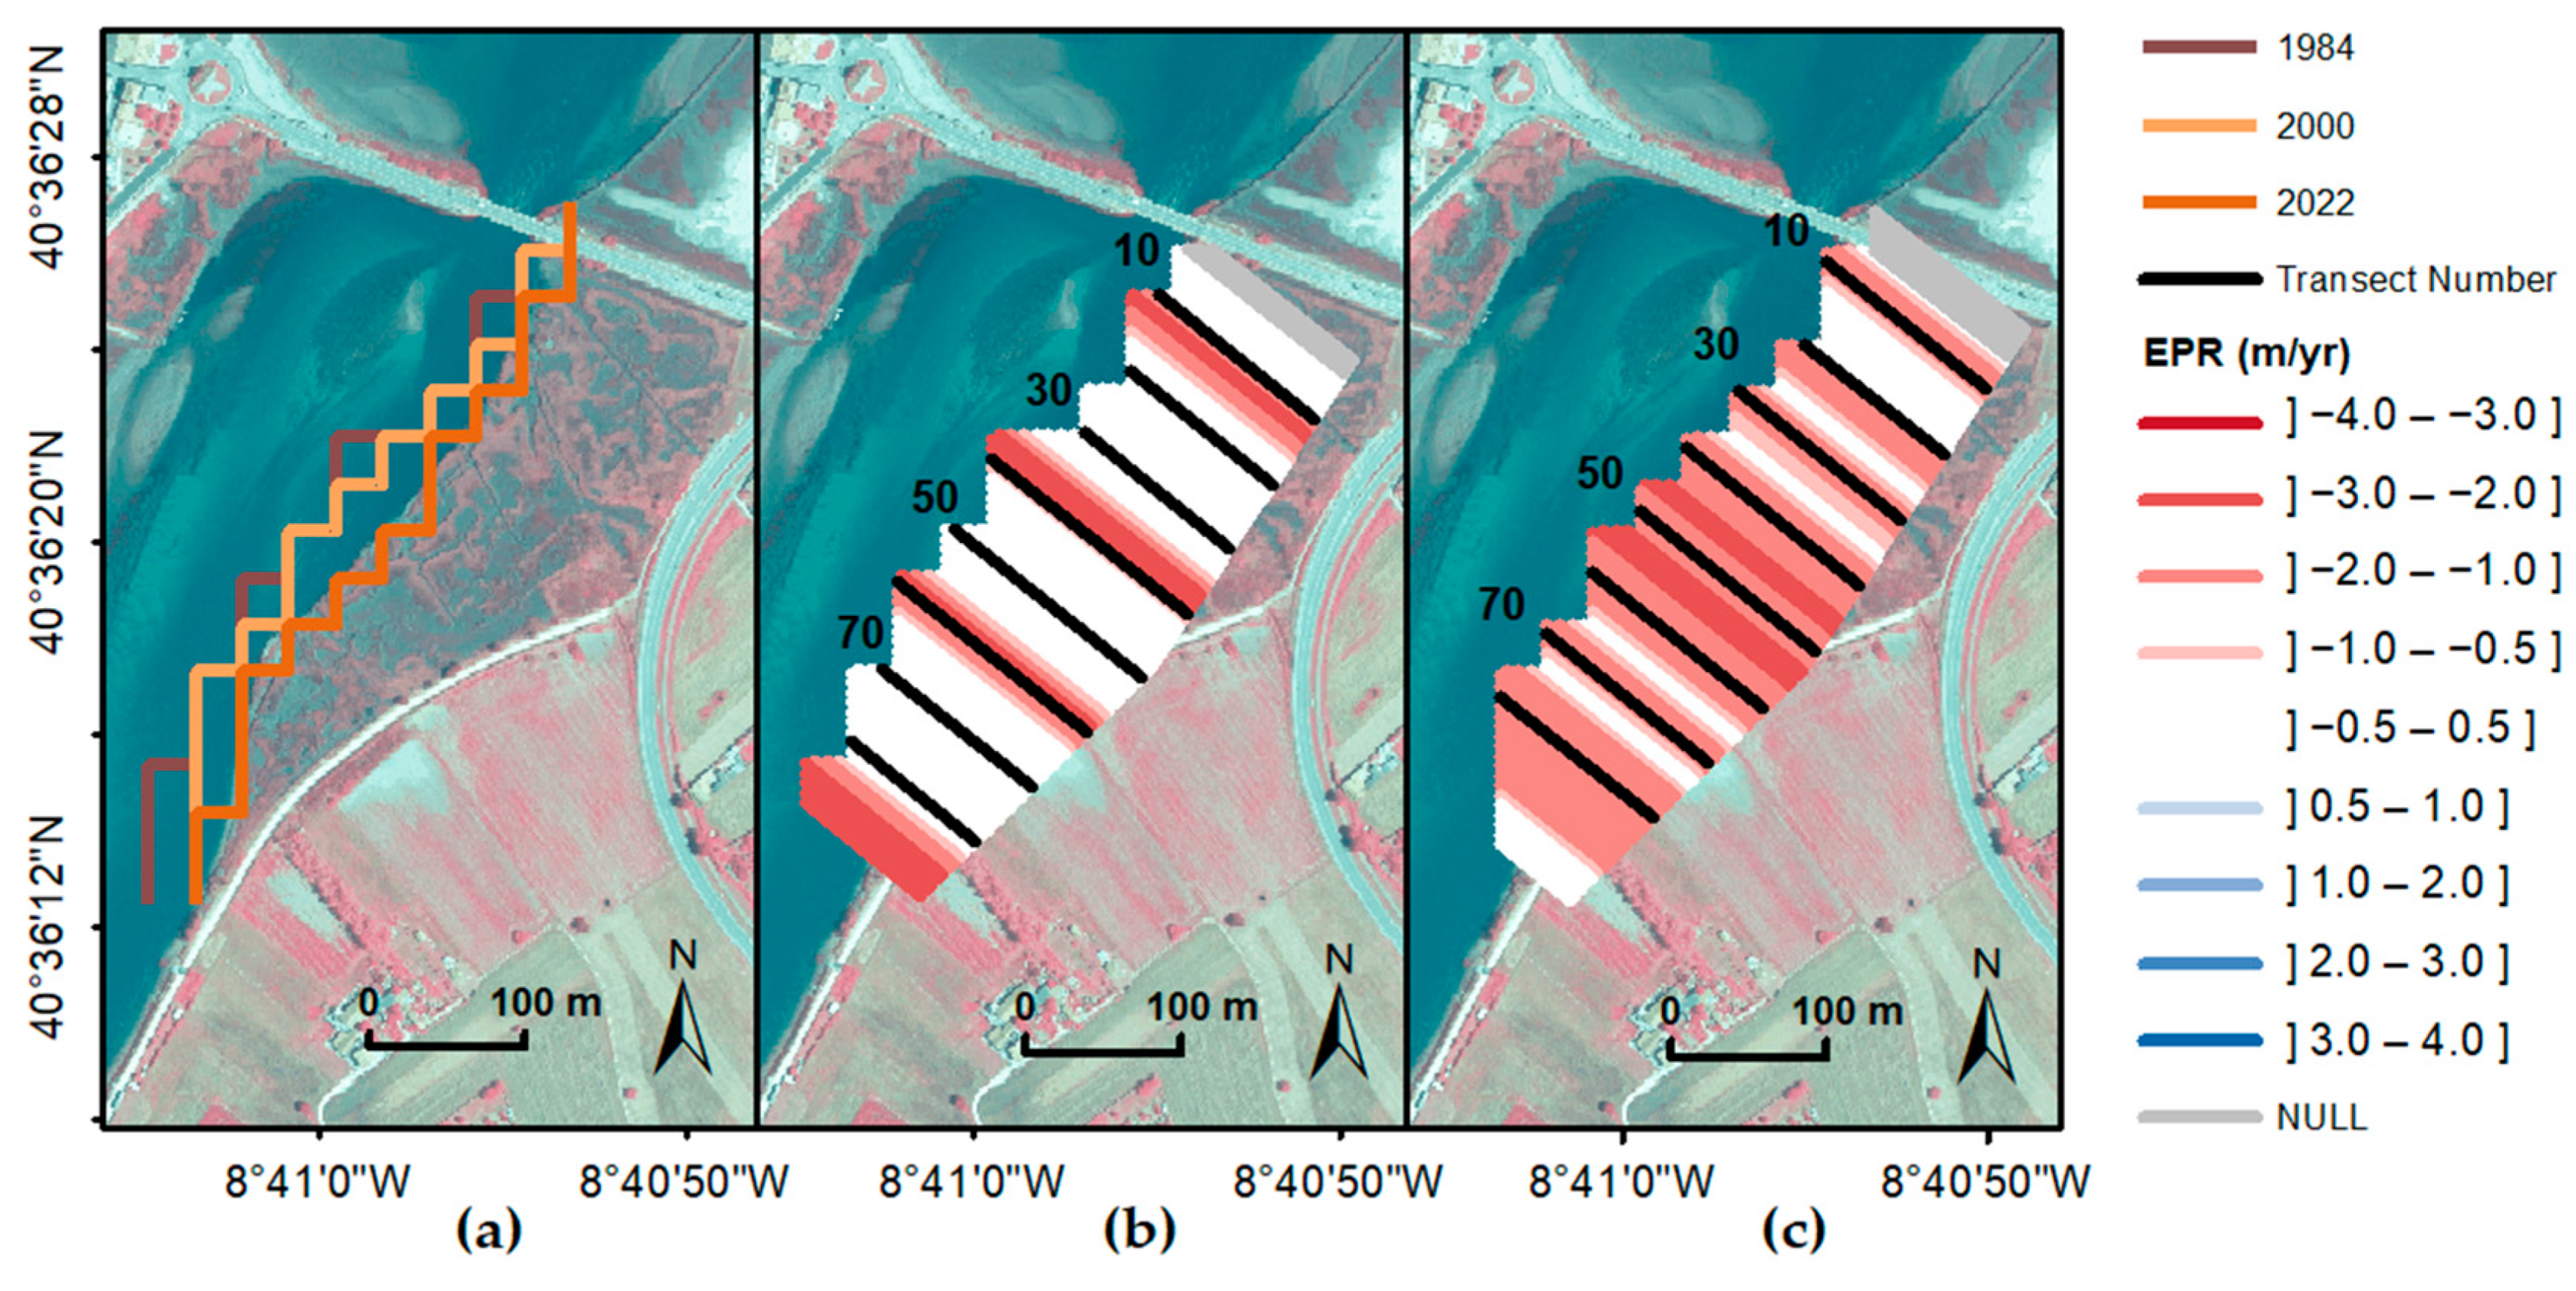
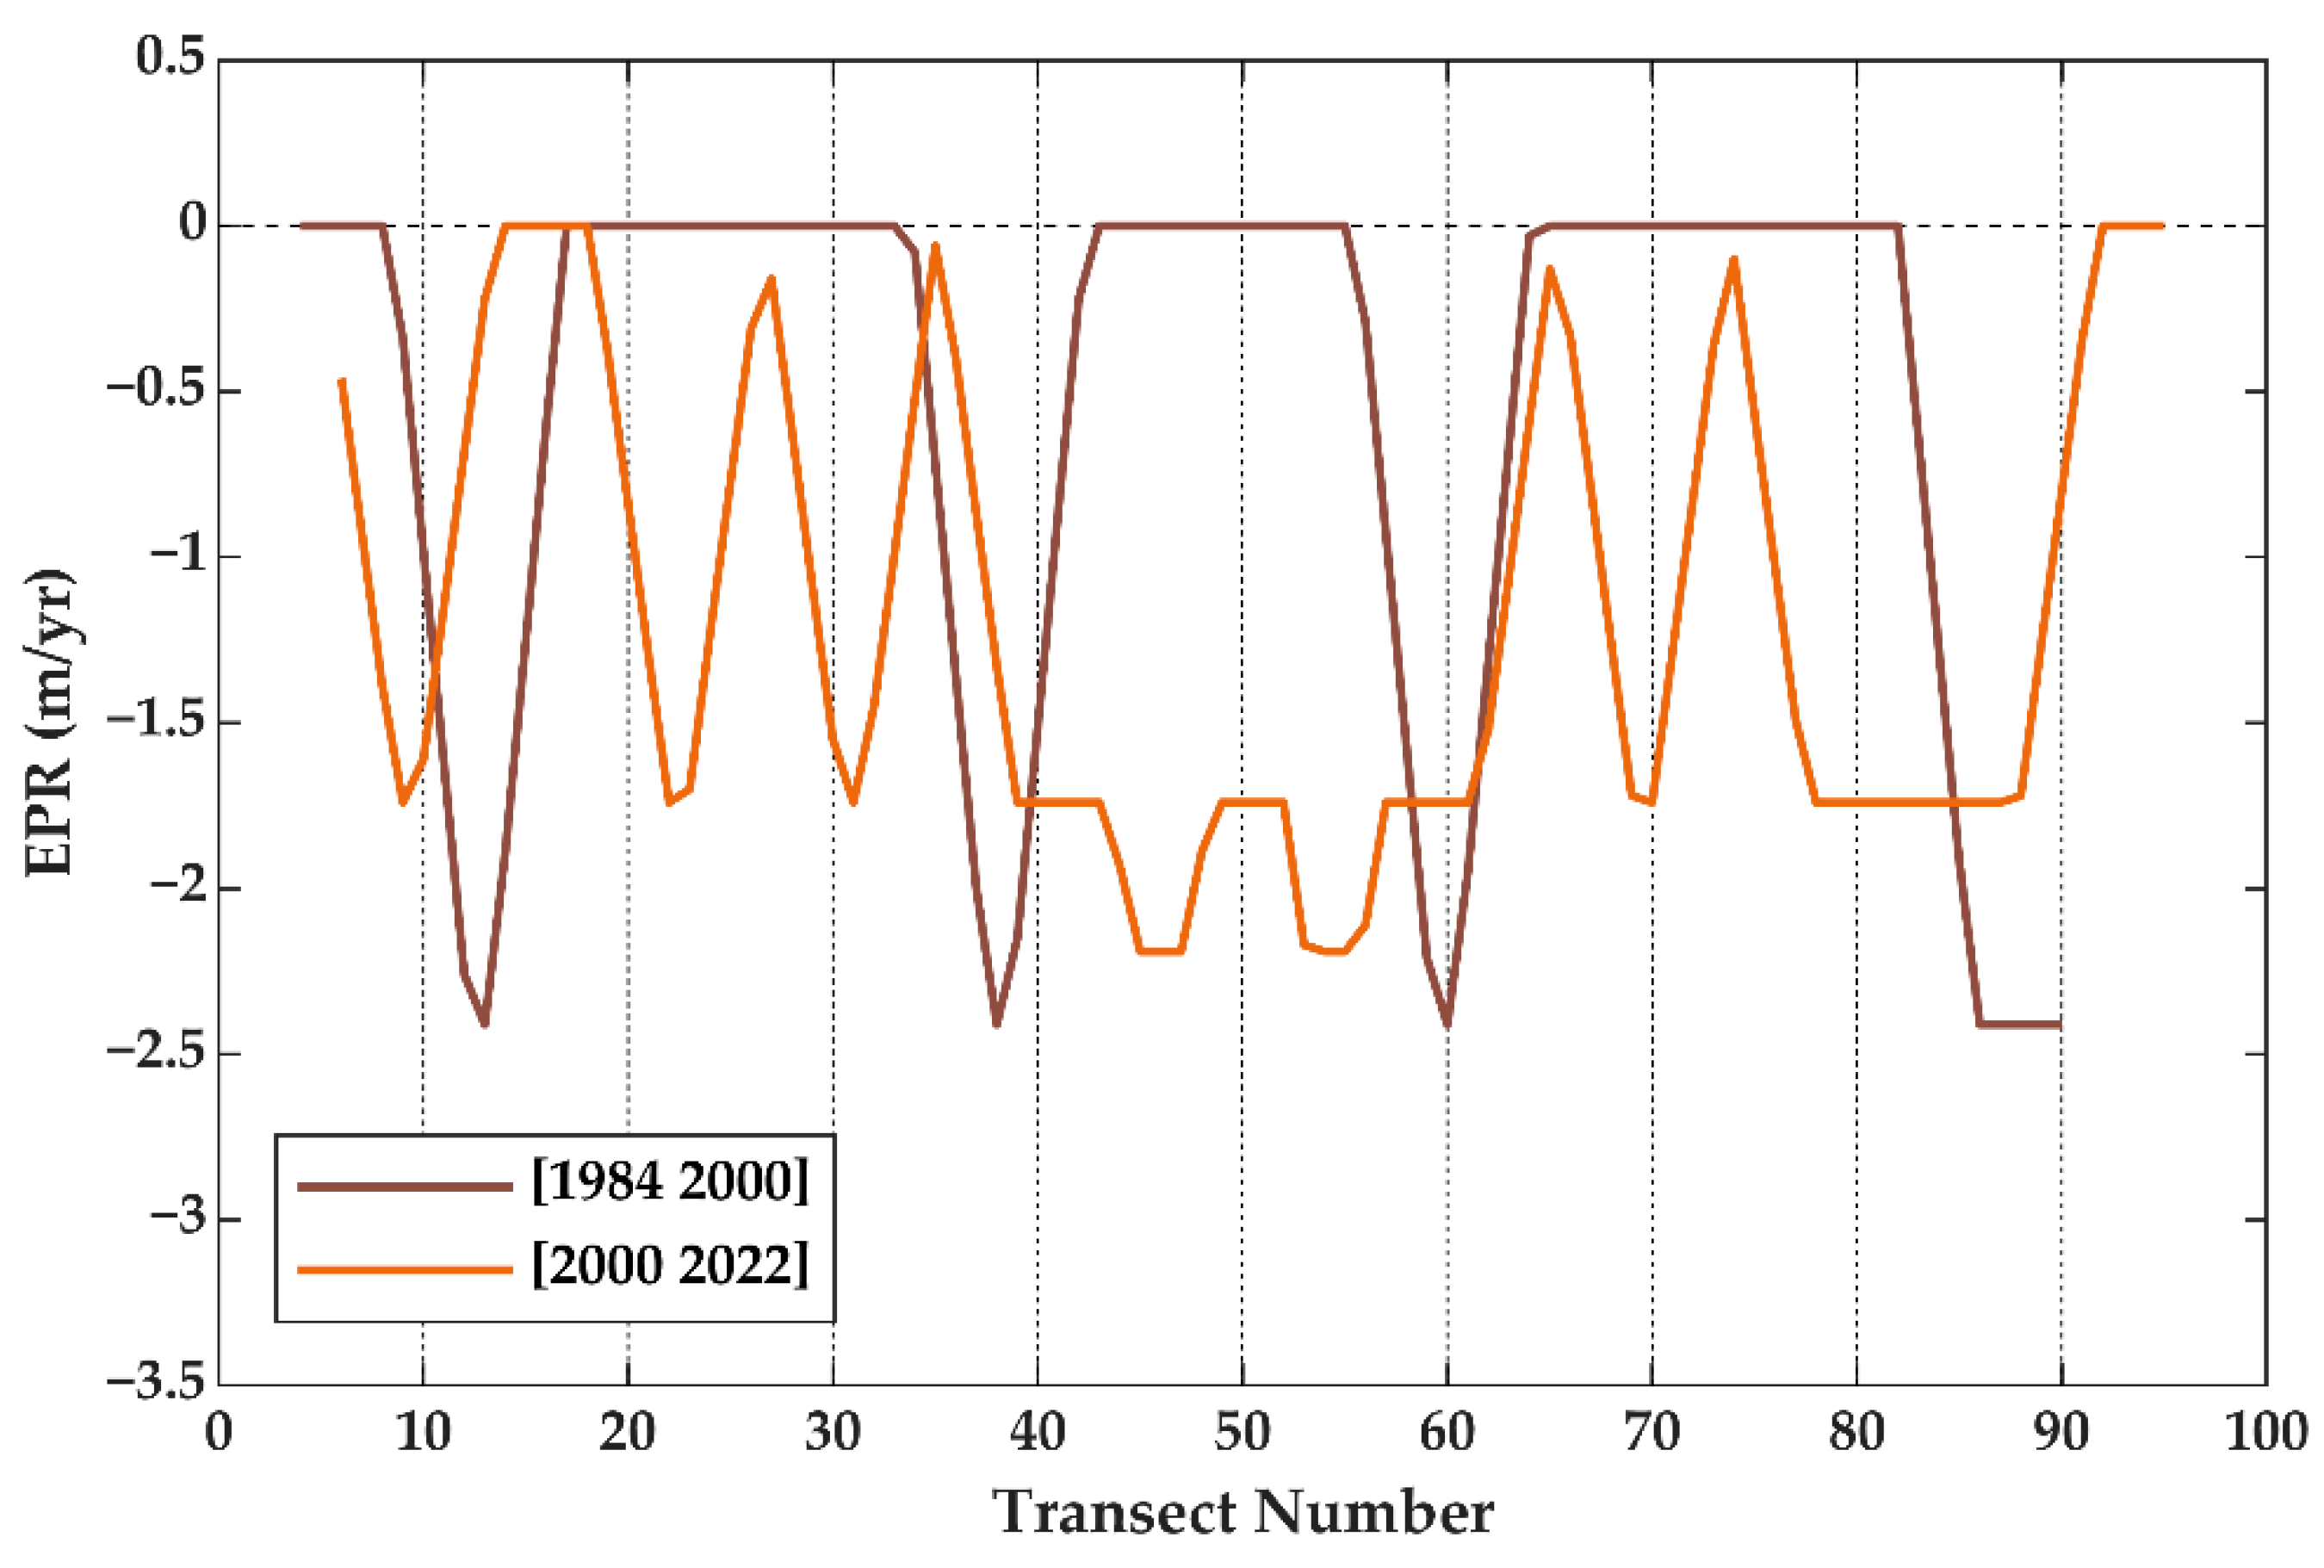
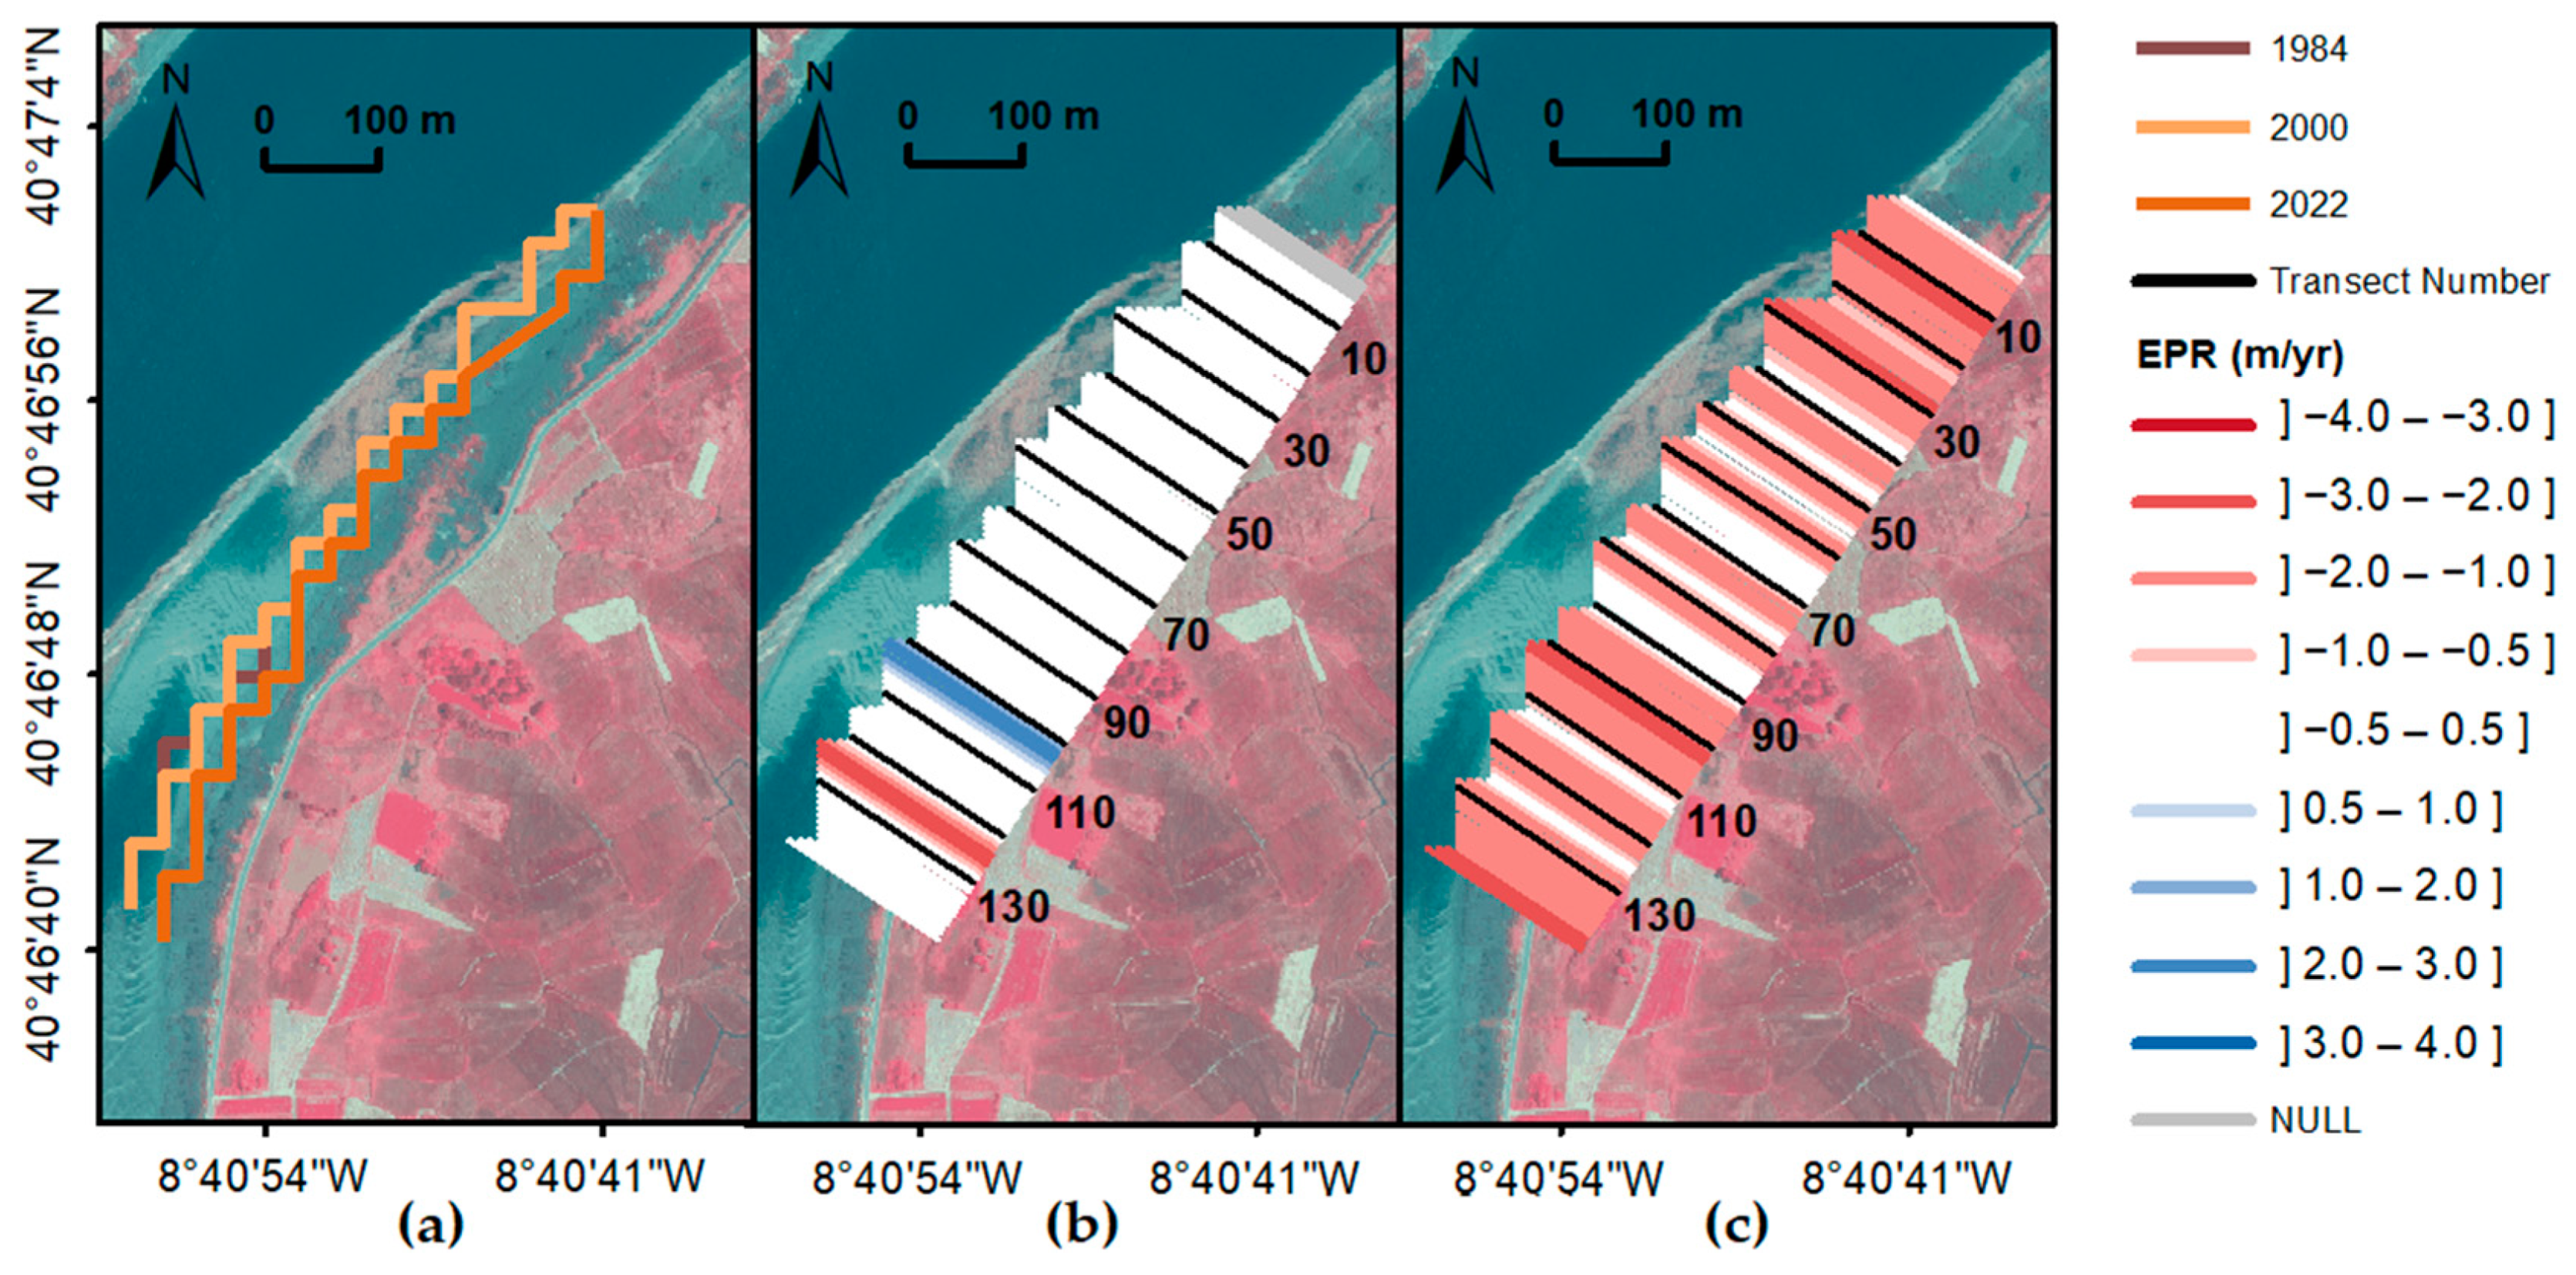
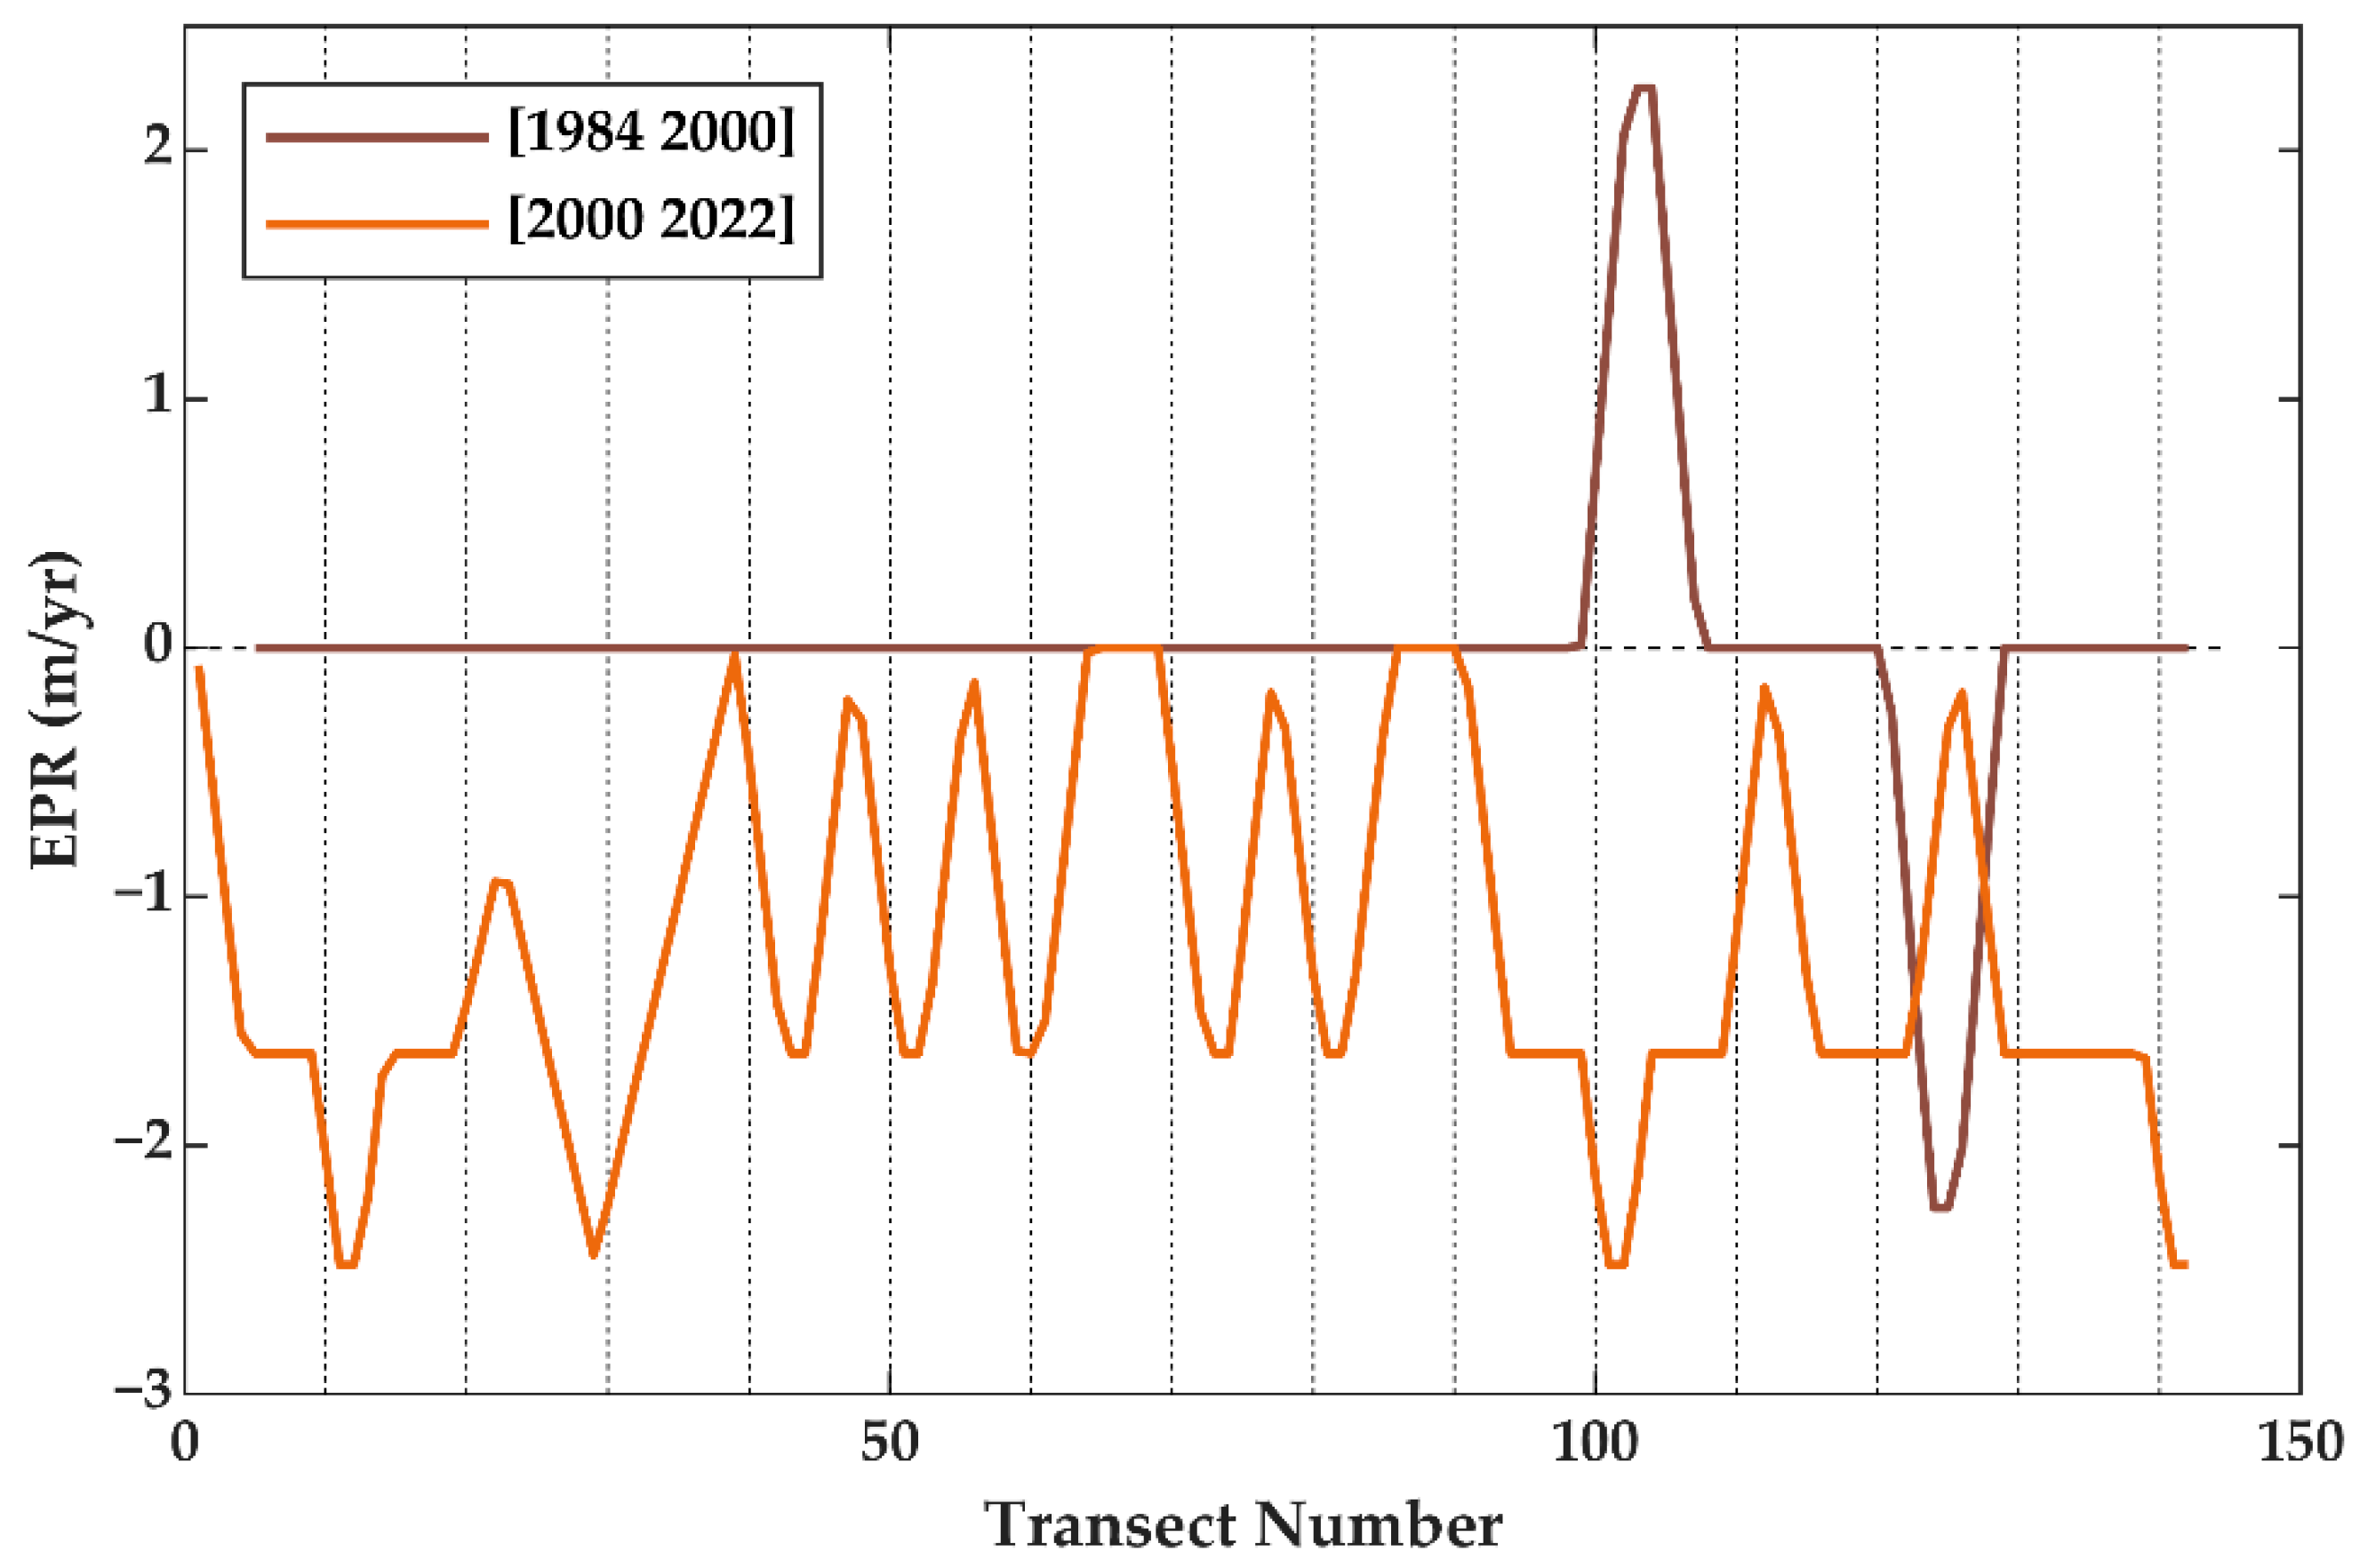
4.2. Salt Marsh Shoreline Change
5. Discussion
5.1. Salt Marsh Shoreline Validation
5.2. Salt Marsh Shoreline Change
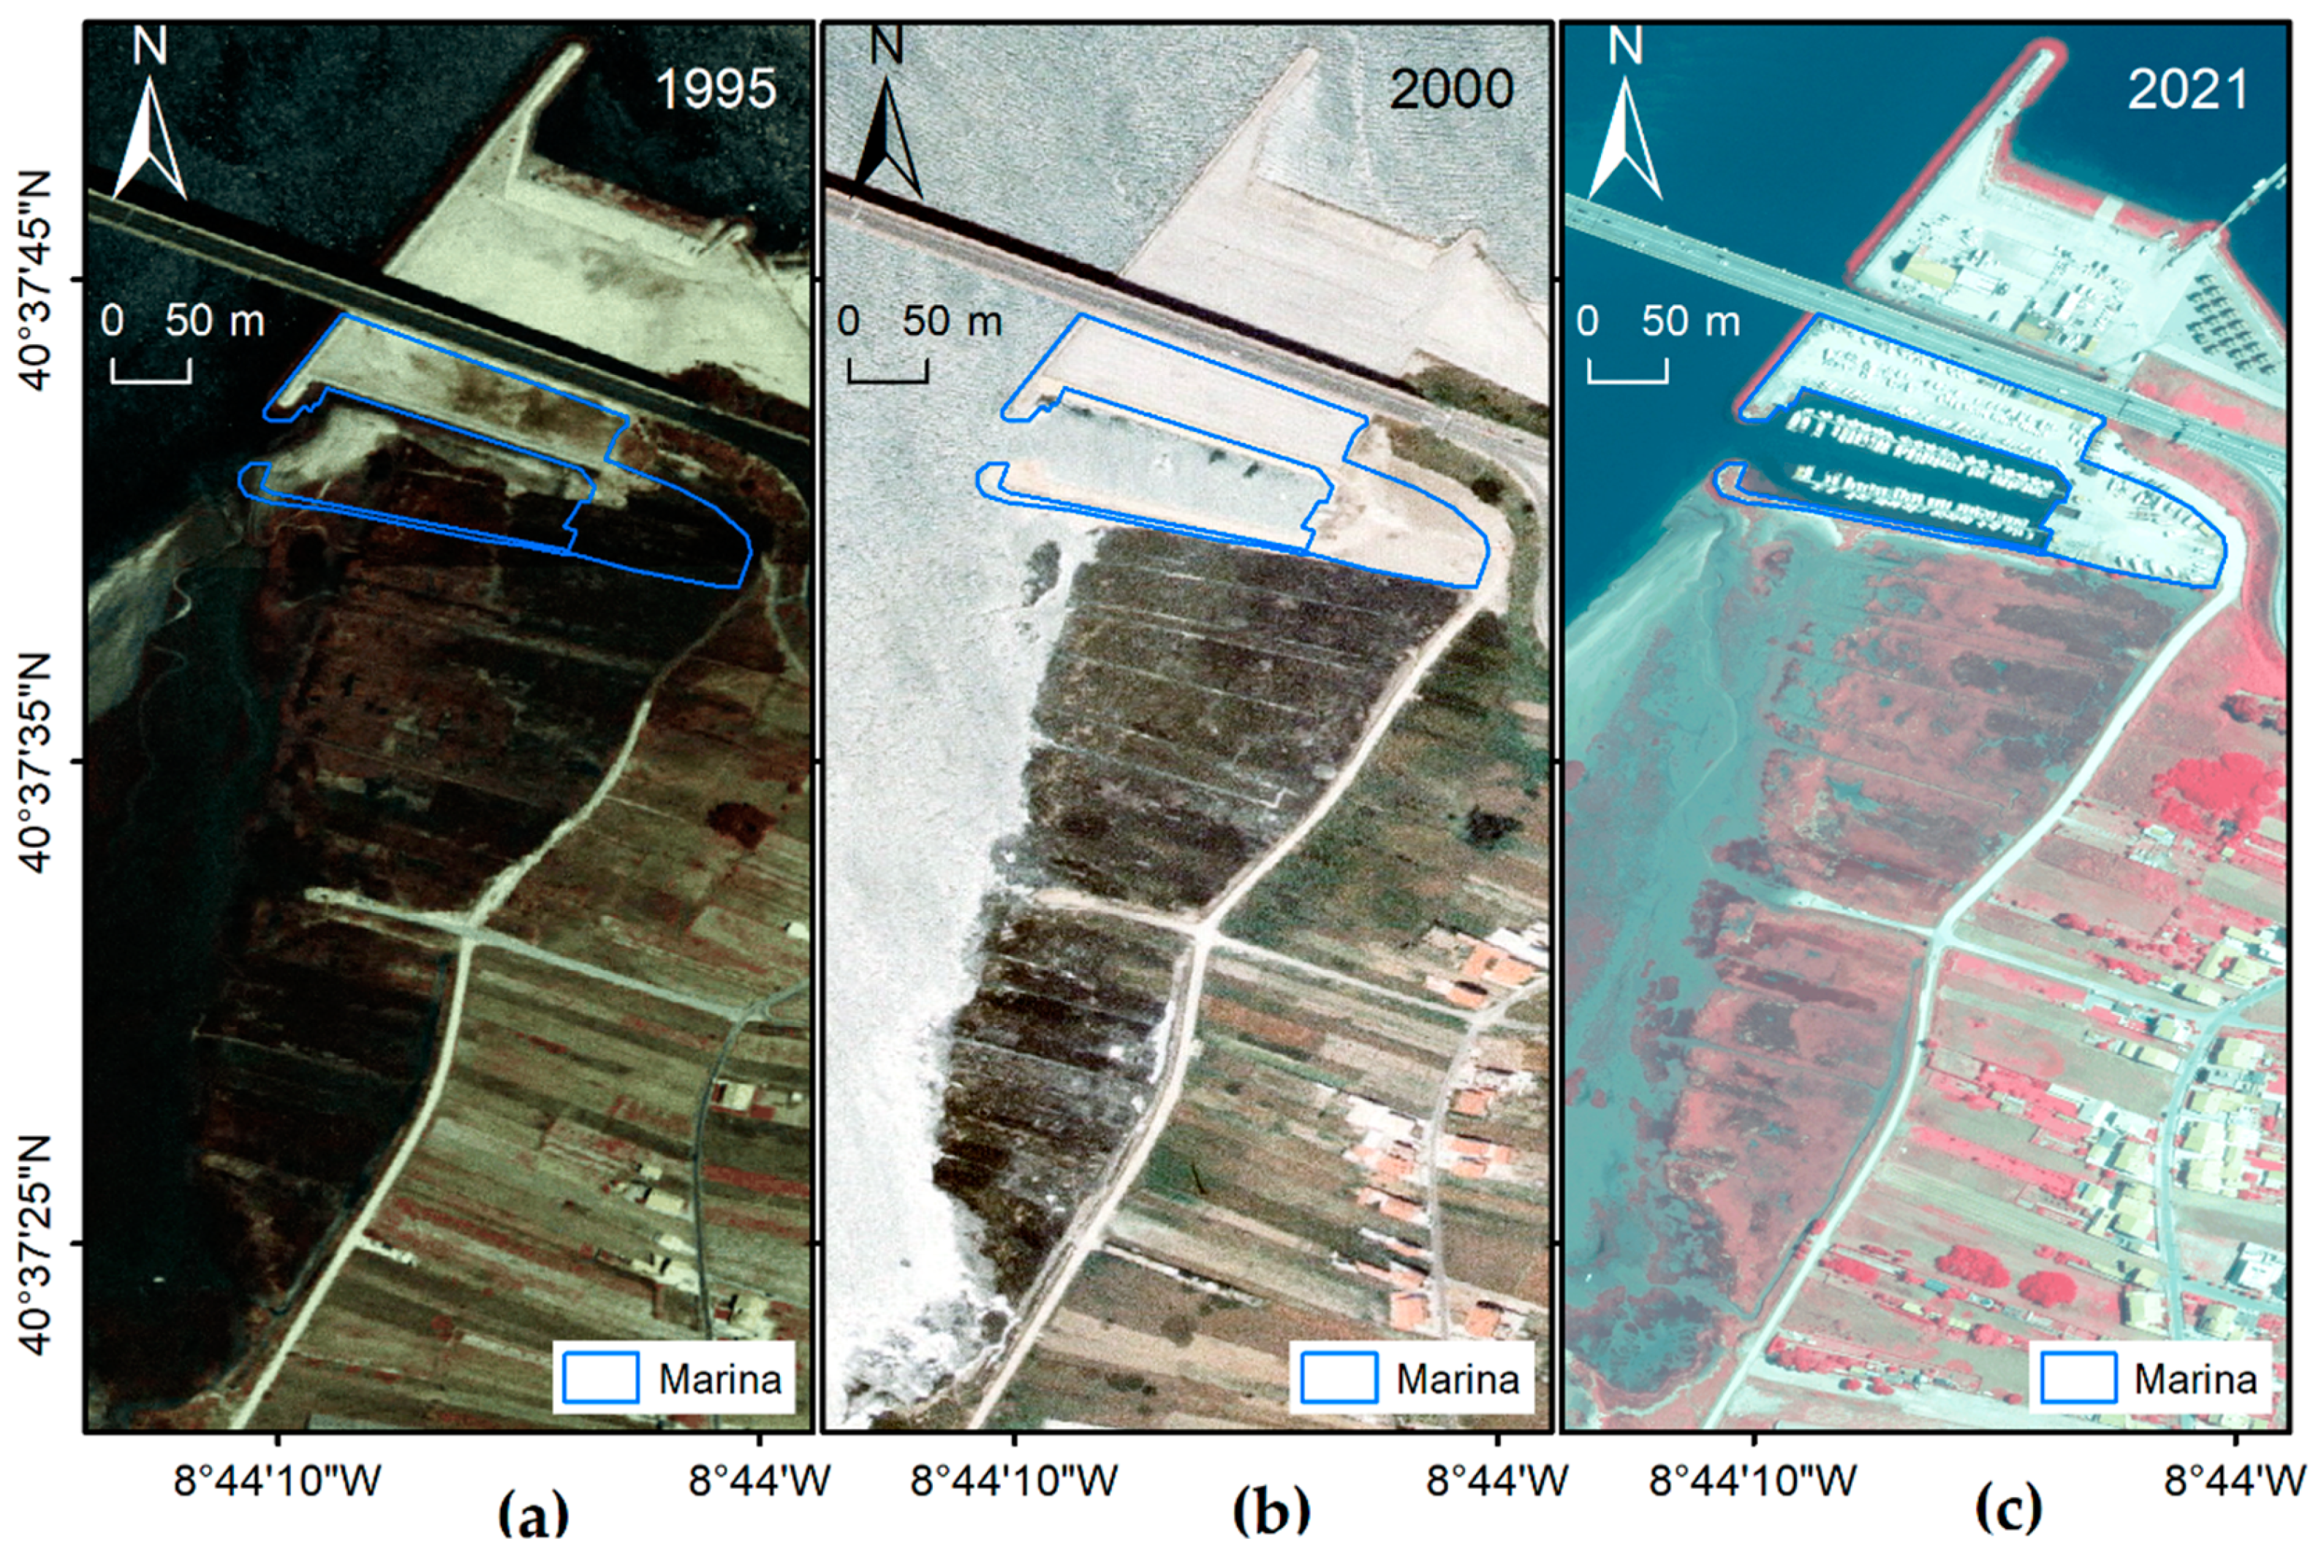
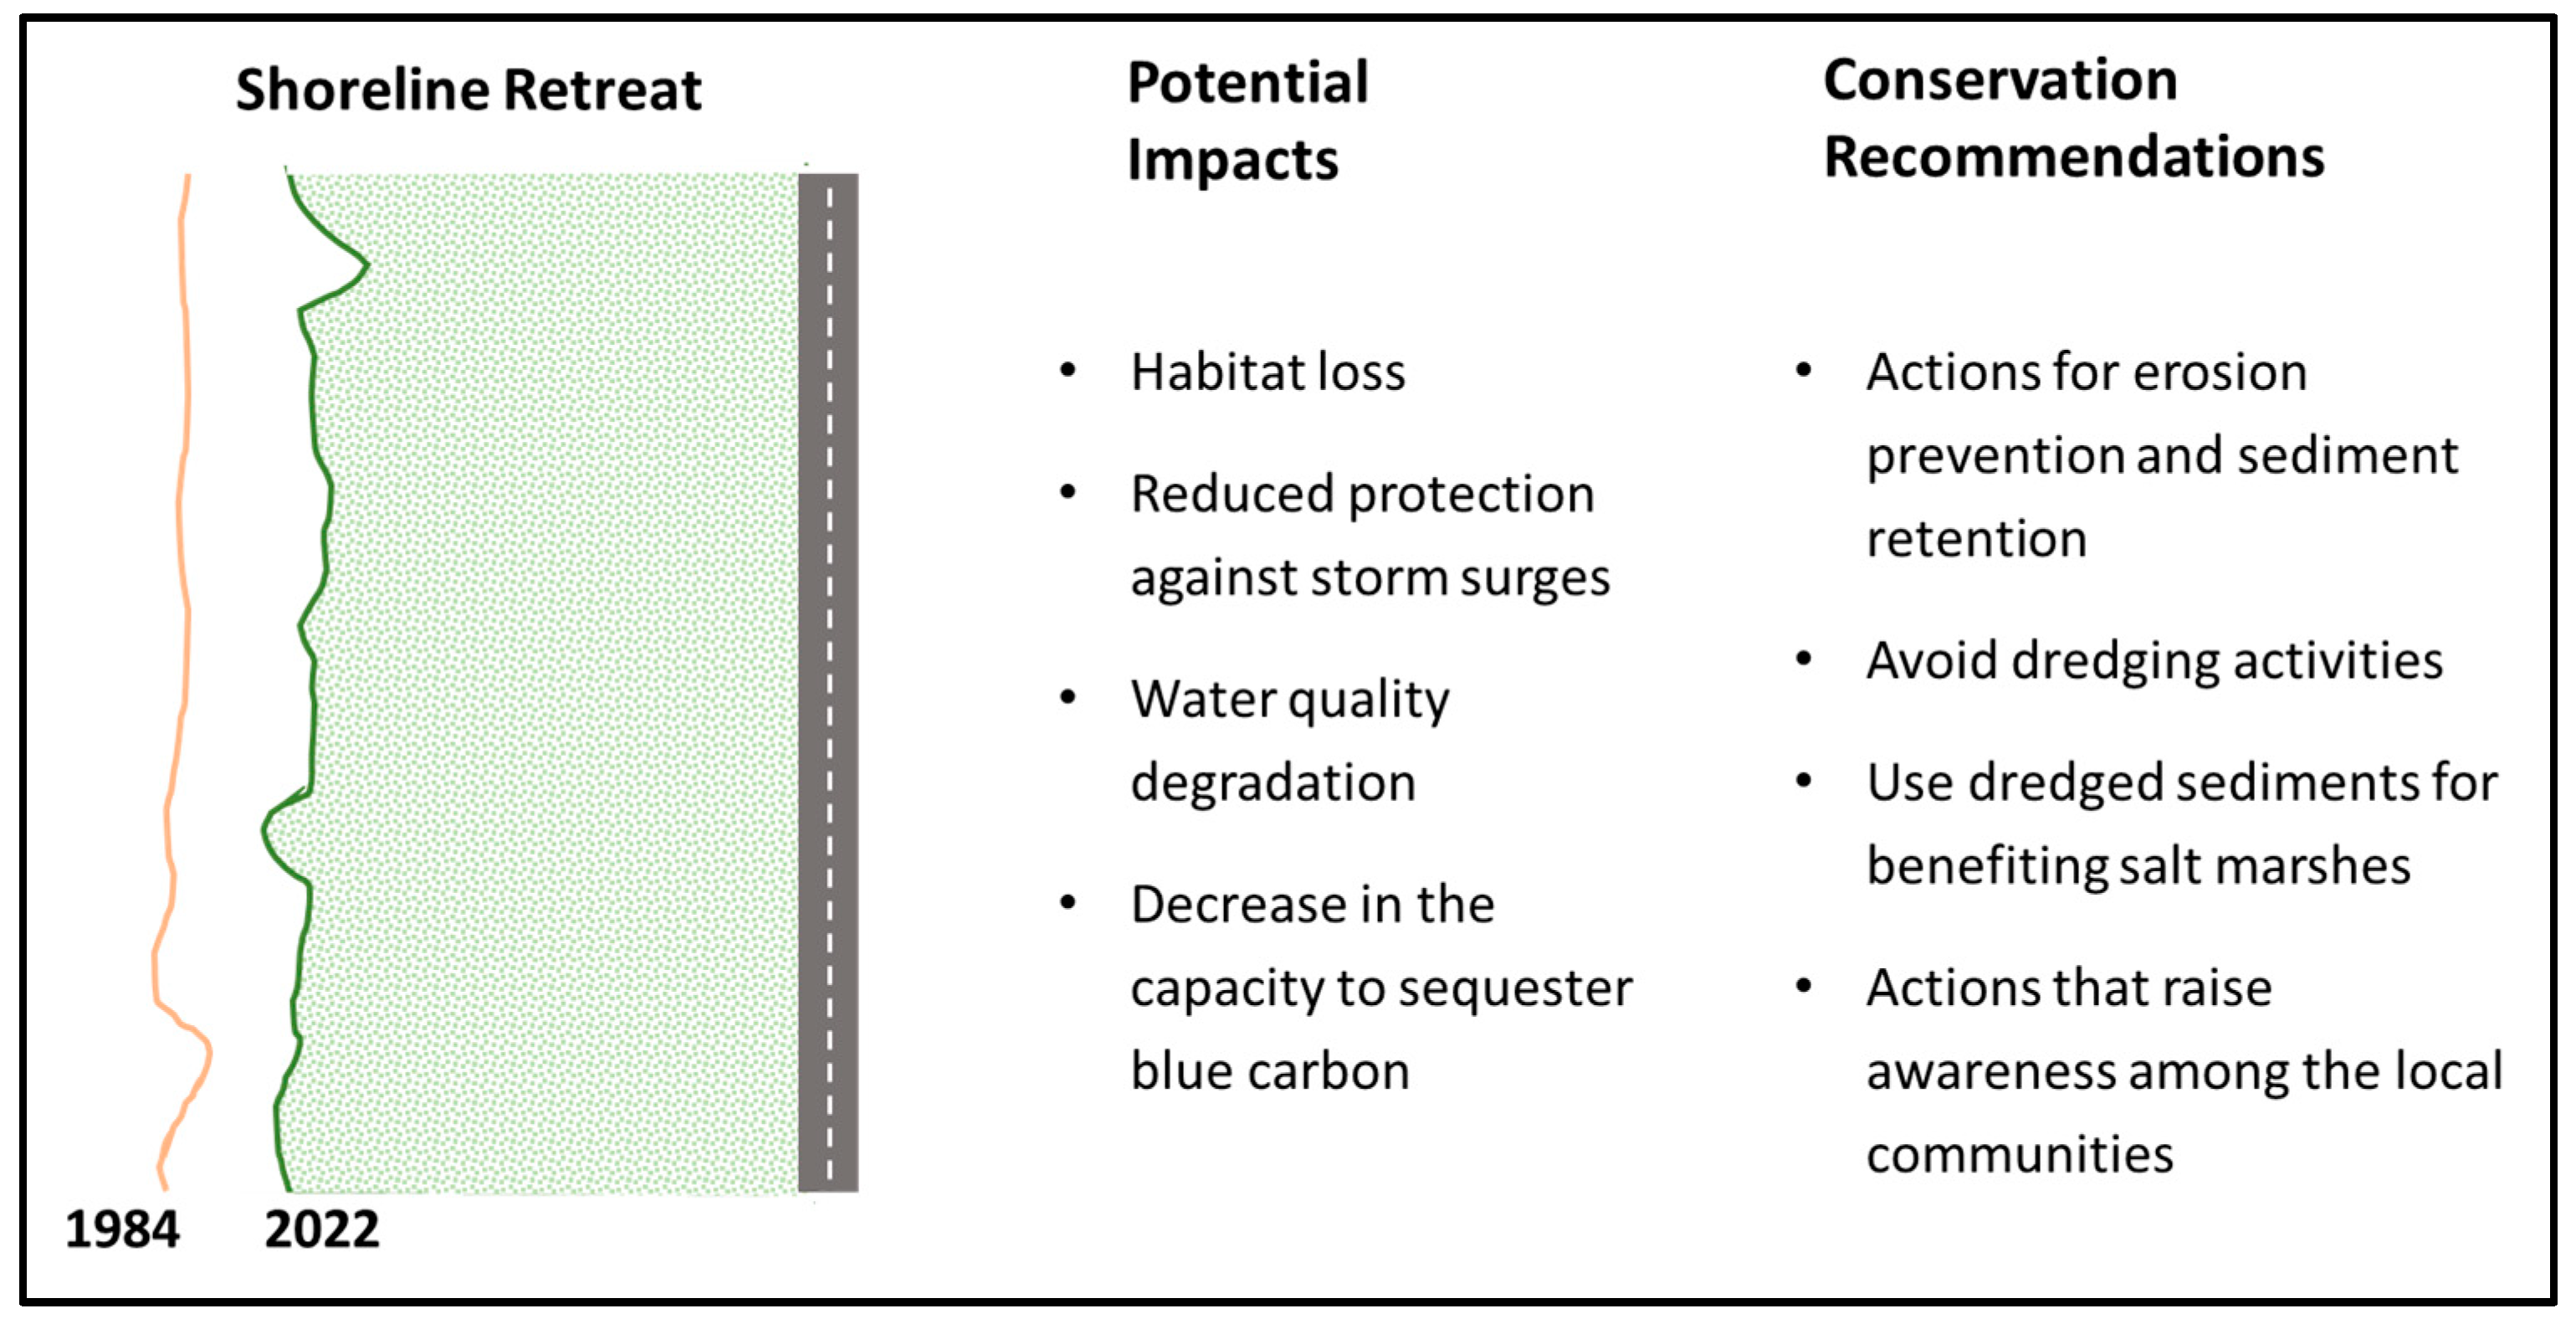
5.3. Potential Impacts of Salt Marsh Shoreline Changes and Recommendations
5.4. Limitations
6. Conclusions
Author Contributions
Funding
Data Availability Statement
Acknowledgments
Conflicts of Interest
References
- Townend, I.; Fletcher, C.; Knappen, M.; Rossington, K. A Review of Salt Marsh Dynamics. Water Environ. J. 2011, 25, 477–488. [Google Scholar] [CrossRef]
- Ameixa, O.M.C.C.; Sousa, A.I. Saltmarshes: Ecology, Opportunities, and Challenges. In Life Below Water. Encyclopedia of the UN Sustainable Development Goals; Springer: Berlin/Heidelberg, Germany, 2020; pp. 1–15. ISBN 978-3-319-71064-8. [Google Scholar]
- Lopes, C.L.; Mendes, R.; Caçador, I.; Dias, J.M. Assessing Salt Marsh Loss and Degradation by Combining Long-Term LANDSAT Imagery and Numerical Modelling. Land Degrad. Dev. 2021, 32, 4534–4545. [Google Scholar] [CrossRef]
- Sousa, A.I.; Santos, D.B.; Silva, E.F.D.; Sousa, L.P.; Cleary, D.F.R.; Soares, A.M.V.M.; Lillebø, A.I. “Blue Carbon” and Nutrient Stocks of Salt Marshes at a Temperate Coastal Lagoon (Ria de Aveiro, Portugal). Sci. Rep. 2017, 7, 41225. [Google Scholar] [CrossRef]
- Howard, J.; Hoyt, S.; Isensee, K.; Telszewski, M.; Pidgeon, E. Coastal Blue Carbon: Methods for Assessing Carbon Stocks and Emissions Factors in Mangroves, Tidal Salt Marshes, and Seagrasses. Int. Union Conserv. Nat. 2014, 87, 1478–1479. [Google Scholar] [CrossRef]
- Mariotti, G. Revisiting Salt Marsh Resilience to Sea Level Rise: Are Ponds Responsible for Permanent Land Loss? J. Geophys. Res. Earth Surf. 2016, 121, 1391–1407. [Google Scholar] [CrossRef]
- Carrasco, A.R.; Ferreira, O.; Roelvink, D. Coastal Lagoons and Rising Sea Level: A Review. Earth-Sci. Rev. 2016, 154, 356–368. [Google Scholar] [CrossRef]
- Carrasco, A.R.; Kombiadou, K.; Amado, M.; Matias, A. Past and Future Marsh Adaptation: Lessons Learned from the Ria Formosa Lagoon. Sci. Total Environ. 2021, 790, 148082. [Google Scholar] [CrossRef]
- Day, J.W., Jr.; Scarton, F.; Rismondo, A.; Are, D. Rapid Deterioration of a Salt Marsh in Venice Lagoon, Italy. J. Coast. Res. 2014, 14, 583–590. [Google Scholar]
- Lopes, C.L.; Mendes, R.; Caçador, I.; Dias, J.M. Evaluation of Long-Term Estuarine Vegetation Changes through Landsat Imagery. Sci. Total Environ. 2019, 653, 512–522. [Google Scholar] [CrossRef]
- Blount, T.R.; Carrasco, A.R.; Cristina, S.; Silvestri, S. Exploring Open-Source Multispectral Satellite Remote Sensing as a Tool to Map Long-Term Evolution of Salt Marsh Shorelines. Estuar. Coast. Shelf Sci. 2022, 266, 107664. [Google Scholar] [CrossRef]
- Lopes, C.L.; Mendes, R.; Caçador, I.; Dias, J.M. Assessing Salt Marsh Extent and Condition Changes with 35 Years of Landsat Imagery: Tagus Estuary Case Study. Remote Sens. Environ. 2020, 247, 111939. [Google Scholar] [CrossRef]
- Sagar, S.; Roberts, D.; Bala, B.; Lymburner, L. Extracting the Intertidal Extent and Topography of the Australian Coastline from a 28 Year Time Series of Landsat Observations. Remote Sens. Environ. 2017, 195, 153–169. [Google Scholar] [CrossRef]
- Murray, N.J.; Phinn, S.R.; Clemens, R.S.; Roelfsema, C.M.; Fuller, R.A. Continental Scale Mapping of Tidal Flats across East Asia Using the Landsat Archive. Remote Sens. 2012, 4, 3417–3426. [Google Scholar] [CrossRef]
- Kuleli, T.; Guneroglu, A.; Karsli, F.; Dihkan, M. Automatic Detection of Shoreline Change on Coastal Ramsar Wetlands of Turkey. Ocean Eng. 2011, 38, 1141–1149. [Google Scholar] [CrossRef]
- Laengner, M.L.; Siteur, K.; van der Wal, D. Trends in the Seaward Extent of Saltmarshes across Europe from Long-Term Satellite Data. Remote Sens. 2019, 11, 1653. [Google Scholar] [CrossRef]
- Dias, J.M.; Pereira, F.; Picado, A.; Lopes, C.L.; Pinheiro, J.P.; Lopes, S.M.; Pinho, P.G. A Comprehensive Estuarine Hydrodynamics-Salinity Study: Impact of Morphologic Changes on Ria de Aveiro (Atlantic Coast of Portugal). J. Mar. Sci. Eng. 2021, 9, 234. [Google Scholar] [CrossRef]
- Gouveia, M.M.; Magni, N.N.; Lopes, C.L.; Ribeiro, A.S.; Dias, J.M.; Silva, H. The Importance of Soil Elevation and Hydroperiods in Salt Marsh Vegetation Zonation: A Case Study of Ria de Aveiro. Appl. Sci. 2023, 13, 4605. [Google Scholar] [CrossRef]
- Dias, J.M.; Lopes, J.F.; Dekeyser, I. Hydrological Characterisation of Ria de Aveiro, Portugal, in Early Summer. Oceanol. Acta 1999, 22, 473–485. [Google Scholar] [CrossRef]
- Valentim, J.M.; Vaz, N.; Silva, H.; Duarte, B.; Caçador, I.; Dias, J.M. Tagus Estuary and Ria de Aveiro Salt Marsh Dynamics and the Impact of Sea Level Rise. Estuar. Coast. Shelf Sci. 2013, 130, 138–151. [Google Scholar] [CrossRef]
- Rouse, J.W.; Haas, R.H.; Schell, J.A.; Deering, D.W. Monitoring Vegetation Systems in the Great Plains with ERTS. In Proceedings of the Third Earth Resources Technology Satellite-1 Symposium, Washington, DC, USA, 10–14 December 1973; Volume 1, pp. 325–333. [Google Scholar]
- Laben, C.A.; Brower, B.V. Process for Enhancing the Spatial Resolution of Multispectral Imagery Using Pan-Sharpening. U.S. Patent US6011875A, 4 January 2000. [Google Scholar]
- Vivone, G.; Alparone, L.; Chanussot, J.; Dalla Mura, M.; Garzelli, A.; Licciardi, G.A.; Restaino, R.; Wald, L. A Critical Comparison Among Pansharpening Algorithms. IEEE Trans. Geosci. Remote Sens. 2015, 53, 2565–2586. [Google Scholar] [CrossRef]
- Jones, E.G.; Wong, S.; Milton, A.; Sclauzero, J.; Whittenbury, H.; McDonnell, M.D. The Impact of Pan-Sharpening and Spectral Resolution on Vineyard Segmentation through Machine Learning. Remote Sens. 2020, 12, 934. [Google Scholar] [CrossRef]
- Du, Q.; Younan, N.H.; King, R.; Shah, V.P. On the Performance Evaluation of Pan-Sharpening Techniques. IEEE Geosci. Remote Sens. Lett. 2007, 4, 518–522. [Google Scholar] [CrossRef]
- Alparone, L.; Wald, L.; Chanussot, J.; Thomas, C.; Gamba, P.; Bruce, L.M. Comparison of Pansharpening Algorithms: Outcome of the 2006 GRS-S Data Fusion Contest. IEEE Trans. Geosci. Remote Sens. 2007, 45, 3012–3021. [Google Scholar] [CrossRef]
- Amro, I.; Mateos, J.; Vega, M.; Molina, R.; Katsaggelos, A.K. A Survey of Classical Methods and New Trends in Pansharpening of Multispectral Images. EURASIP J. Adv. Signal Process. 2011, 2011, 79. [Google Scholar] [CrossRef]
- Farris, A.S.; Defne, Z.; Ganju, N.K. Identifying Salt Marsh Shorelines from Remotely Sensed Elevation Data and Imagery. Remote Sens. 2019, 11, 1795. [Google Scholar] [CrossRef]
- Goodwin, G.C.H.; Mudd, S.M.; Clubb, F.J. Unsupervised Detection of Salt Marsh Platforms: A Topographic Method. Earth Surf. Dyn. 2018, 6, 239–255. [Google Scholar] [CrossRef]
- Oliveira, A.; Fortunato, A.B.; Dias, J.M. Numerical Modeling of the Aveiro Inlet Dynamics. In Coastal Engineering 2006; World Scientific Publishing Co.: Singapore, 2007; pp. 3282–3294. [Google Scholar] [CrossRef]
- Picado, A.; Dias, J.M.; Fortunato, A.B. Tidal Changes in Estuarine Systems Induced by Local Geomorphologic Modifications. Cont. Shelf Res. 2010, 30, 1854–1864. [Google Scholar] [CrossRef]
- Lopes, C.L.; Dias, J.M. Tidal Dynamics in a Changing Lagoon: Flooding or Not Flooding the Marginal Regions. Estuar. Coast. Shelf Sci. 2015, 167, 14–24. [Google Scholar] [CrossRef]
- Lopes, C.L.; Plecha, S.; Silva, P.A.; Dias, J.M. Influence of Morphological Changes in a Lagoon Flooding Extension: Case Study of Ria de Aveiro (Portugal). J. Coast. Res. 2013, 165, 1158–1163. [Google Scholar] [CrossRef]
- Siemes, R.W.A.; Borsje, B.W.; Daggenvoorde, R.J.; Hulscher, S.J.M.H. Artificial Structures Steer Morphological Development of Salt Marshes: A Model Study. J. Mar. Sci. Eng. 2020, 8, 326. [Google Scholar] [CrossRef]
- APA, S.A. Porto de Aveiro 2020. Available online: https://portodeaveiro.pt/uploads/2022-01-18-10-57-09-Relatorio-Sustentabilidade-APA-2020.pdf (accessed on 15 July 2023).
- Pétillon, J.; McKinley, E.; Alexander, M.; Adams, J.B.; Angelini, C.; Balke, T.; Griffin, J.N.; Bouma, T.; Hacker, S.; He, Q.; et al. Top Ten Priorities for Global Saltmarsh Restoration, Conservation and Ecosystem Service Research. Sci. Total Environ. 2023, 898, 165544. [Google Scholar] [CrossRef] [PubMed]
- Barbier, E.B.; Hacker, S.D.; Kennedy, C.; Koch, E.W.; Stier, A.C.; Silliman, B.R. The Value of Estuarine and Coastal Ecosystem Services. Ecol. Monogr. 2011, 81, 169–193. [Google Scholar] [CrossRef]
- Rendón, O.R.; Garbutt, A.; Skov, M.; Möller, I.; Alexander, M.; Ballinger, R.; Wyles, K.; Smith, G.; McKinley, E.; Griffin, J.; et al. A Framework Linking Ecosystem Services and Human Well-being: Saltmarsh as a Case Study. People Nat. 2019, 1, 486–496. [Google Scholar] [CrossRef]
- McKinley, E.; Pagès, J.F.; Alexander, M.; Burdon, D.; Martino, S. Uses and Management of Saltmarshes: A Global Survey. Estuar. Coast. Shelf Sci. 2020, 243, 106840. [Google Scholar] [CrossRef]
- Whitfield, A.K. The Role of Seagrass Meadows, Mangrove Forests, Salt Marshes and Reed Beds as Nursery Areas and Food Sources for Fishes in Estuaries. Rev. Fish Biol. Fish. 2017, 27, 75–110. [Google Scholar] [CrossRef]
- Leonardi, N.; Carnacina, I.; Donatelli, C.; Ganju, N.K.; Plater, A.J.; Schuerch, M.; Temmerman, S. Dynamic Interactions between Coastal Storms and Salt Marshes: A Review. Geomorphology 2018, 301, 92–107. [Google Scholar] [CrossRef]
- Schuerch, M.; Spencer, T.; Temmerman, S.; Kirwan, M.L.; Wolff, C.; Lincke, D.; McOwen, C.J.; Pickering, M.D.; Reef, R.; Vafeidis, A.T.; et al. Future Response of Global Coastal Wetlands to Sea-Level Rise. Nature 2018, 561, 231–234. [Google Scholar] [CrossRef]
- Möller, I.; Kudella, M.; Rupprecht, F.; Spencer, T.; Paul, M.; van Wesenbeeck, B.K.; Wolters, G.; Jensen, K.; Bouma, T.J.; Miranda-Lange, M.; et al. Wave Attenuation over Coastal Salt Marshes under Storm Surge Conditions. Nat. Geosci. 2014, 7, 727–731. [Google Scholar] [CrossRef]
- Lloret, J.; Pedrosa-Pamies, R.; Vandal, N.; Rorty, R.; Ritchie, M.; McGuire, C.; Chenoweth, K.; Valiela, I. Salt Marsh Sediments Act as Sinks for Microplastics and Reveal Effects of Current and Historical Land Use Changes. Environ. Adv. 2021, 4, 100060. [Google Scholar] [CrossRef]
- Nelson, J.L.; Zavaleta, E.S. Salt Marsh as a Coastal Filter for the Oceans: Changes in Function with Experimental Increases in Nitrogen Loading and Sea-Level Rise. PLoS ONE 2012, 7, e38558. [Google Scholar] [CrossRef]
- Carrasco-Barea, L.; Verdaguer, D.; Gispert, M.; Font, J.; Compte, J.; Llorens, L. Carbon Stocks in Vegetation and Soil and Their Relationship with Plant Community Traits in a Mediterranean Non-Tidal Salt Marsh. Estuaries Coasts 2023, 46, 376–387. [Google Scholar] [CrossRef]
- Gispert, M.; Phang, C.; Carrasco-Barea, L. The Role of Soil as a Carbon Sink in Coastal Salt-Marsh and Agropastoral Systems at La Pletera, NE Spain. CATENA 2020, 185, 104331. [Google Scholar] [CrossRef]
- Perera, N.; Lokupitiya, E.; Halwatura, D.; Udagedara, S. Quantification of Blue Carbon in Tropical Salt Marshes and Their Role in Climate Change Mitigation. Sci. Total Environ. 2022, 820, 153313. [Google Scholar] [CrossRef] [PubMed]
- Campbell, A.D.; Fatoyinbo, L.; Goldberg, L.; Lagomasino, D. Global Hotspots of Salt Marsh Change and Carbon Emissions. Nature 2022, 612, 701–706. [Google Scholar] [CrossRef] [PubMed]
- Giuliani, S.; Bellucci, L.G. Chapter 4—Salt Marshes: Their Role in Our Society and Threats Posed to Their Existence. In World Seas: An Environmental Evaluation, 2nd ed.; Sheppard, C., Ed.; Academic Press: Cambridge, MA, USA, 2019; pp. 79–101. ISBN 978-0-12-805052-1. [Google Scholar]
- Barausse, A.; Grechi, L.; Martinello, N.; Musner, T.; Smania, D.; Zangaglia, A.; Palmeri, L. An Integrated Approach to Prevent the Erosion of Salt Marshes in the Lagoon of Venice. EQA Int. J. Environ. Qual. 2015, 18, 43–54. [Google Scholar] [CrossRef]
- Baptist, M.J.; Gerkema, T.; van Prooijen, B.C.; van Maren, D.S.; van Regteren, M.; Schulz, K.; Colosimo, I.; Vroom, J.; van Kessel, T.; Grasmeijer, B.; et al. Beneficial Use of Dredged Sediment to Enhance Salt Marsh Development by Applying a ‘Mud Motor’. Ecol. Eng. 2019, 127, 312–323. [Google Scholar] [CrossRef]
- Ford, M.A.; Cahoon, D.R.; Lynch, J.C. Restoring Marsh Elevation in a Rapidly Subsiding Salt Marsh by Thin-Layer Deposition of Dredged Material1Mention of Trade Names or Commercial Products Does Not Constitute an Endorsement or Recommendation for Use by the US Government.1. Ecol. Eng. 1999, 12, 189–205. [Google Scholar] [CrossRef]
- Mendelssohn, I.A.; Kuhn, N.L. Sediment Subsidy: Effects on Soil–Plant Responses in a Rapidly Submerging Coastal Salt Marsh. Ecol. Eng. 2003, 21, 115–128. [Google Scholar] [CrossRef]
- Stagg, C.L.; Mendelssohn, I.A. Controls on Resilience and Stability in a Sediment-Subsidized Salt Marsh. Ecol. Appl. 2011, 21, 1731–1744. [Google Scholar] [CrossRef]
- Tong, C.; Baustian, J.J.; Graham, S.A.; Mendelssohn, I.A. Salt Marsh Restoration with Sediment-Slurry Application: Effects on Benthic Macroinvertebrates and Associated Soil–Plant Variables. Ecol. Eng. 2013, 51, 151–160. [Google Scholar] [CrossRef]
- Fagherazzi, S.; Mariotti, G.; Leonardi, N.; Canestrelli, A.; Nardin, W.; Kearney, W.S. Salt Marsh Dynamics in a Period of Accelerated Sea Level Rise. J. Geophys. Res. Earth Surf. 2020, 125, e2019JF005200. [Google Scholar] [CrossRef]
- Huete, A.R. A Soil-Adjusted Vegetation Index (SAVI). Remote Sens. Environ. 1988, 25, 295–309. [Google Scholar] [CrossRef]
- Qi, J.; Chehbouni, A.; Huete, A.R.; Kerr, Y.H.; Sorooshian, S. A Modified Soil Adjusted Vegetation Index. Remote Sens. Environ. 1994, 48, 119–126. [Google Scholar] [CrossRef]
- Pinty, B.; Verstraete, M.M. GEMI: A Non-Linear Index to Monitor Global Vegetation from Satellites. Vegetatio 1992, 101, 15–20. [Google Scholar] [CrossRef]
- Chen, Y.; Dong, J.; Xiao, X.; Zhang, M.; Tian, B.; Zhou, Y.; Li, B.; Ma, Z. Land Claim and Loss of Tidal Flats in the Yangtze Estuary. Sci. Rep. 2016, 6, 24018. [Google Scholar] [CrossRef]
- Sun, C.; Fagherazzi, S.; Liu, Y. Classification Mapping of Salt Marsh Vegetation by Flexible Monthly NDVI Time-Series Using Landsat Imagery. Estuar. Coast. Shelf Sci. 2018, 213, 61–80. [Google Scholar] [CrossRef]
- Miller, G.J.; Morris, J.T.; Wang, C.; Miller, G.J.; Morris, J.T.; Wang, C. Mapping Salt Marsh Dieback and Condition in South Carolina’s North Inlet-Winyah Bay National Estuarine Research Reserve Using Remote Sensing. AIMSES 2017, 4, 677–689. [Google Scholar] [CrossRef]
- Pettorelli, N.; Laurance, W.F.; O’Brien, T.G.; Wegmann, M.; Nagendra, H.; Turner, W. Satellite Remote Sensing for Applied Ecologists: Opportunities and Challenges. J. Appl. Ecol. 2014, 51, 839–848. [Google Scholar] [CrossRef]
- Polis Ria de Aveiro Transposição de Sedimentos Para Otimização Do Equilíbrio Hidrodinâmico Na Região de Aveiro. Available online: http://www.polisriadeaveiro.pt/obras/index.php?w=4 (accessed on 13 May 2023).


| Aerial Images | Dates | Source | Spectral Bands | Spatial Resolution (m) |
|---|---|---|---|---|
| Orthophotomosaics | 2021 | DGT (Directorate of Territory) | Red (R), Green (G), and Near Infra Red (NIR) | 0.25 |
| Landsat-5 (TM) | 17 April 1984 | NASA and USGS (National Aeronautics and Space Administration and United States Geological Survey) | 30 | |
| Landsat-7 (ETM+) | 20 March 2000 | RG, NIR, and Panchromatic | ||
| 2 April 2022 | ||||
| Sentinel-2 (MSI) | 2 April 2022 | ESA (Eros Science Processing Architecture) | RG and NIR | 10 |
| NDVI | RMSE (m) | ||
|---|---|---|---|
| Mira | Landsat-7 (Pan-sharpening) | 0.10 | 16.99 |
| 0.11 | 13.62 * | ||
| 0.12 | 16.24 | ||
| Landsat-7 | 0.09 | 17.6 | |
| 0.10 | 15.02 * | ||
| 0.11 | 19.81 | ||
| Sentinel-2 | 0.43 | 15.28 | |
| 0.44 | 14.39 * | ||
| 0.45 | 14.61 | ||
| Ílhavo | Landsat-7 (Pan-sharpening) | 0.07 | 7.58 |
| 0.08 | 6.11 * | ||
| 0.09 | 11.32 | ||
| Landsat-7 | 0.05 | 12.08 | |
| 0.06 | 10.77 * | ||
| 0.07 | 12.89 | ||
| Sentinel-2 | −0.01 | 6.32 | |
| 0.00 | 4.81 * | ||
| 0.01 | |||
| 0.02 | |||
| 0.03 | 6.27 | ||
| S. Jacinto | Landsat-7 (Pan-sharpening) | 0.04 | 15.41 |
| 0.05 | 13.36 * | ||
| 0.06 | 13.5 | ||
| Landsat-7 | 0.04 | 12.88 | |
| 0.05 | 11.53 * | ||
| 0.06 | 16.4 | ||
| Sentinel-2 | 0.23 | 40.67 | |
| 0.24 | 31.96 * | ||
| 0.25 | 33.69 | ||
Disclaimer/Publisher’s Note: The statements, opinions and data contained in all publications are solely those of the individual author(s) and contributor(s) and not of MDPI and/or the editor(s). MDPI and/or the editor(s) disclaim responsibility for any injury to people or property resulting from any ideas, methods, instructions or products referred to in the content. |
© 2023 by the authors. Licensee MDPI, Basel, Switzerland. This article is an open access article distributed under the terms and conditions of the Creative Commons Attribution (CC BY) license (https://creativecommons.org/licenses/by/4.0/).
Share and Cite
Castro, I.J.; Dias, J.M.; Lopes, C.L. Assessing Shoreline Changes in Fringing Salt Marshes from Satellite Remote Sensing Data. Remote Sens. 2023, 15, 4475. https://doi.org/10.3390/rs15184475
Castro IJ, Dias JM, Lopes CL. Assessing Shoreline Changes in Fringing Salt Marshes from Satellite Remote Sensing Data. Remote Sensing. 2023; 15(18):4475. https://doi.org/10.3390/rs15184475
Chicago/Turabian StyleCastro, Inês J., João M. Dias, and Carina L. Lopes. 2023. "Assessing Shoreline Changes in Fringing Salt Marshes from Satellite Remote Sensing Data" Remote Sensing 15, no. 18: 4475. https://doi.org/10.3390/rs15184475