Article

Forage Mass Estimation in Silvopastoral and Full Sun Systems: Evaluation through Proximal Remote Sensing Applied to the SAFER Model

by
Samira Luns Hatum de Almeida
1,*,
Jarlyson Brunno Costa Souza
1,
Sandra Furlan Nogueira
2,
José Ricardo Macedo Pezzopane
3,
Antônio Heriberto de Castro Teixeira
4,
Cristiam Bosi
3,
Marcos Adami
5,
Cristiano Zerbato
1,
Alberto Carlos de Campos Bernardi
3,
Gustavo Bayma
2 and
Rouverson Pereira da Silva
1
1
Department of Engineering and Mathematical Sciences, São Paulo State University (Unesp), Jaboticabal 14884900, SP, Brazil
2
Brazilian Agricultural Research Corporation, Embrapa Environment, Campinas 13918110, SP, Brazil
3
Brazilian Agricultural Research Corporation, Embrapa Southeast Livestock, São Carlos 13560970, SP, Brazil
4
Water Resources Program (PRORH), Federal University of Sergipe (UFS), São Cristóvão 49100000, SE, Brazil
5
Amazon Spatial Coordination, National Institute for Space Research (INPE), São José dos Campos 12227900, SP, Brazil
*
Author to whom correspondence should be addressed.
Remote Sens. 2023, 15(3), 815; https://doi.org/10.3390/rs15030815
Submission received: 17 November 2022 / Revised: 31 December 2022 / Accepted: 2 January 2023 / Published: 31 January 2023

Abstract

:
The operational slowness in the execution of direct methods for estimating forage mass, an important variable for defining the animal stocking rate, gave rise to the need for methods with faster responses and greater territorial coverage. In this context, the aim of this study was to evaluate a method to estimate the mass of Urochloa brizantha cv. BRS Piatã in shaded and full sun systems, through proximal sensing applied to the Simple Algorithm for Evapotranspiration Retrieving (SAFER) model, applied with the Monteith Radiation Use Efficiency (RUE) model. The study was carried out in the experimental area of Fazenda Canchim, a research center of Embrapa Pecuária Sudeste, São Carlos, SP, Brazil (21°57′S, 47°50′W, 860 m), with collections of forage mass and reflectance in the silvopastoral systems animal production and full sun. Reflectance data, as well as meteorological data obtained by a weather station installed in the study area, were used as input for the SAFER model and, later, for the radiation use efficiency model to calculate the fresh mass of forage. The forage collected in the field was sent to the laboratory, separated, weighed and dried, generating the variables of pasture total dry mass), total leaf dry mass, leaf and stalk dry mass and leaf area index. With the variables of pasture, in situ, and fresh mass, obtained from SAFER, the training regression model, in which 80% were used for training and 20% for testing the models. The SAFER was able to promisingly express the behavior of forage variables, with a significant correlation with all of them. The variables that obtained the best estimation performance model were the dry mass of leaves and stems and the dry mass of leaves in silvopastoral and full sun systems, respectively. It was concluded that the association of the SAFER model with the proximal sensor allowed us to obtain a fast, precise and accurate forage estimation method.

1. Introduction

Pasture degradation, and the subsequent need for new areas to maintain livestock activity, is a reality in several places of the world. This condition is becoming more common as a result of rising food demand and inefficient use of natural resources. The main reasons for this are poor management of the area and overgrazing [1,2]. As a result, livestock has been one of the primary drivers of land use and land cover change in Brazil, primarily due to forest conversion [3].
One method to avoid overusing pasture is to size the herd based on pasture availability throughout the year. This necessitates the reliable estimation of the forage mass, which is commonly accomplished through direct or indirect methods. Direct methods are based on cutting and weighing the forage and require a lot of effort, and are difficult to carry out in large areas. Indirect methods for estimating forage mass that takes forage canopy height into account, assuming a relationship between plant height and forage mass [4,5]. However, indirect methods like this still require extensive field data collection, and height can be measured with a measuring disc or graduated ruler [6,7]. Furthermore, performing indirect methods necessarily requires destructive collections to generate one or more calibration equations.
Given the different methods of mass estimation and their operational and time-consuming nature, remote sensing appears as a feasible tool to obtain this estimate. Remote sensing allows for the collection of information about a target without making direct contact with it, making pasture monitoring possible even over large geographical areas [8]. Remote sensing data collection levels range from orbital to terrestrial or proximal, with sensors at various field level altitudes, each one with a high potential for estimating pasture forage mass. Proximal sensing (near ground level) has the advantage of providing immediate and potentially accurate data, giving farmers more control over obtaining this type of data.
Crop-livestock integration is presented as a feasible option for sustainable production intensification in Brazil, as pasture sustains 90% of the animal herd [9]. The integration of crop, livestock and forestry aims to achieve convergence between agricultural and animal resources in combination with land use and management strategies focused on natural resource protection [10]. In the 2000s, producers increased the use of new technologies, which resulted in increased productivity, animal stocking rate, and individual weight gain of cattle [11].
In a silvopastoral system, where there is a combination of pasture cultivation and tree species, proximal remote sensing data are recommended (Figure 1). This is because tree rows are spaced closely together, in an orbital remote sensing perspective, and as pasture evaluations with proximal sensors can be carried out below the tree canopy, they minimize the influence of the arboreal canopy on the reflectance captured. These proximal data combined with meteorological variables can be used as input in models that estimate vegetation biophysical parameters, such as the Simple Algorithm for Evapotranspiration Retrieving-SAFER model [12]. Through this model, it is possible to estimate the vegetation mass, as performed by [13] with pastures in the Alto Tocantins Hydrographic Basin, which obtained satisfactory results in identifying forage availability in degraded areas.
These models are being increasingly used in studies that aim to estimate biomass and productivity of crop areas. [14,15] demonstrated that the SAFER model is promising for estimating corn and pasture biomass. [16] found that the model has high applicability for estimating biophysical parameters and energy balance in Urochloa brizantha cv. Marandu. However, this model has not yet been used to estimate forage mass in a silvopastoral system.
Several biophysical parameters, such as the vegetation index (VI) and fractions derived from spectral mixture analysis [17], evapotranspiration [18], and energy balance components [16], have been used to characterize pasture grazing systems. Thus, the aim of this study was to analyze the feasibility of SAFER as a model for estimating the biophysical parameters of Urochloa brizantha cv. Piatã in different pasture production systems. Proximal reflectance and meteorological data were used as input data in the SAFER agrometeorological model combined with the Monteith radiation use efficiency (RUE) model.

2. Materials and Methods

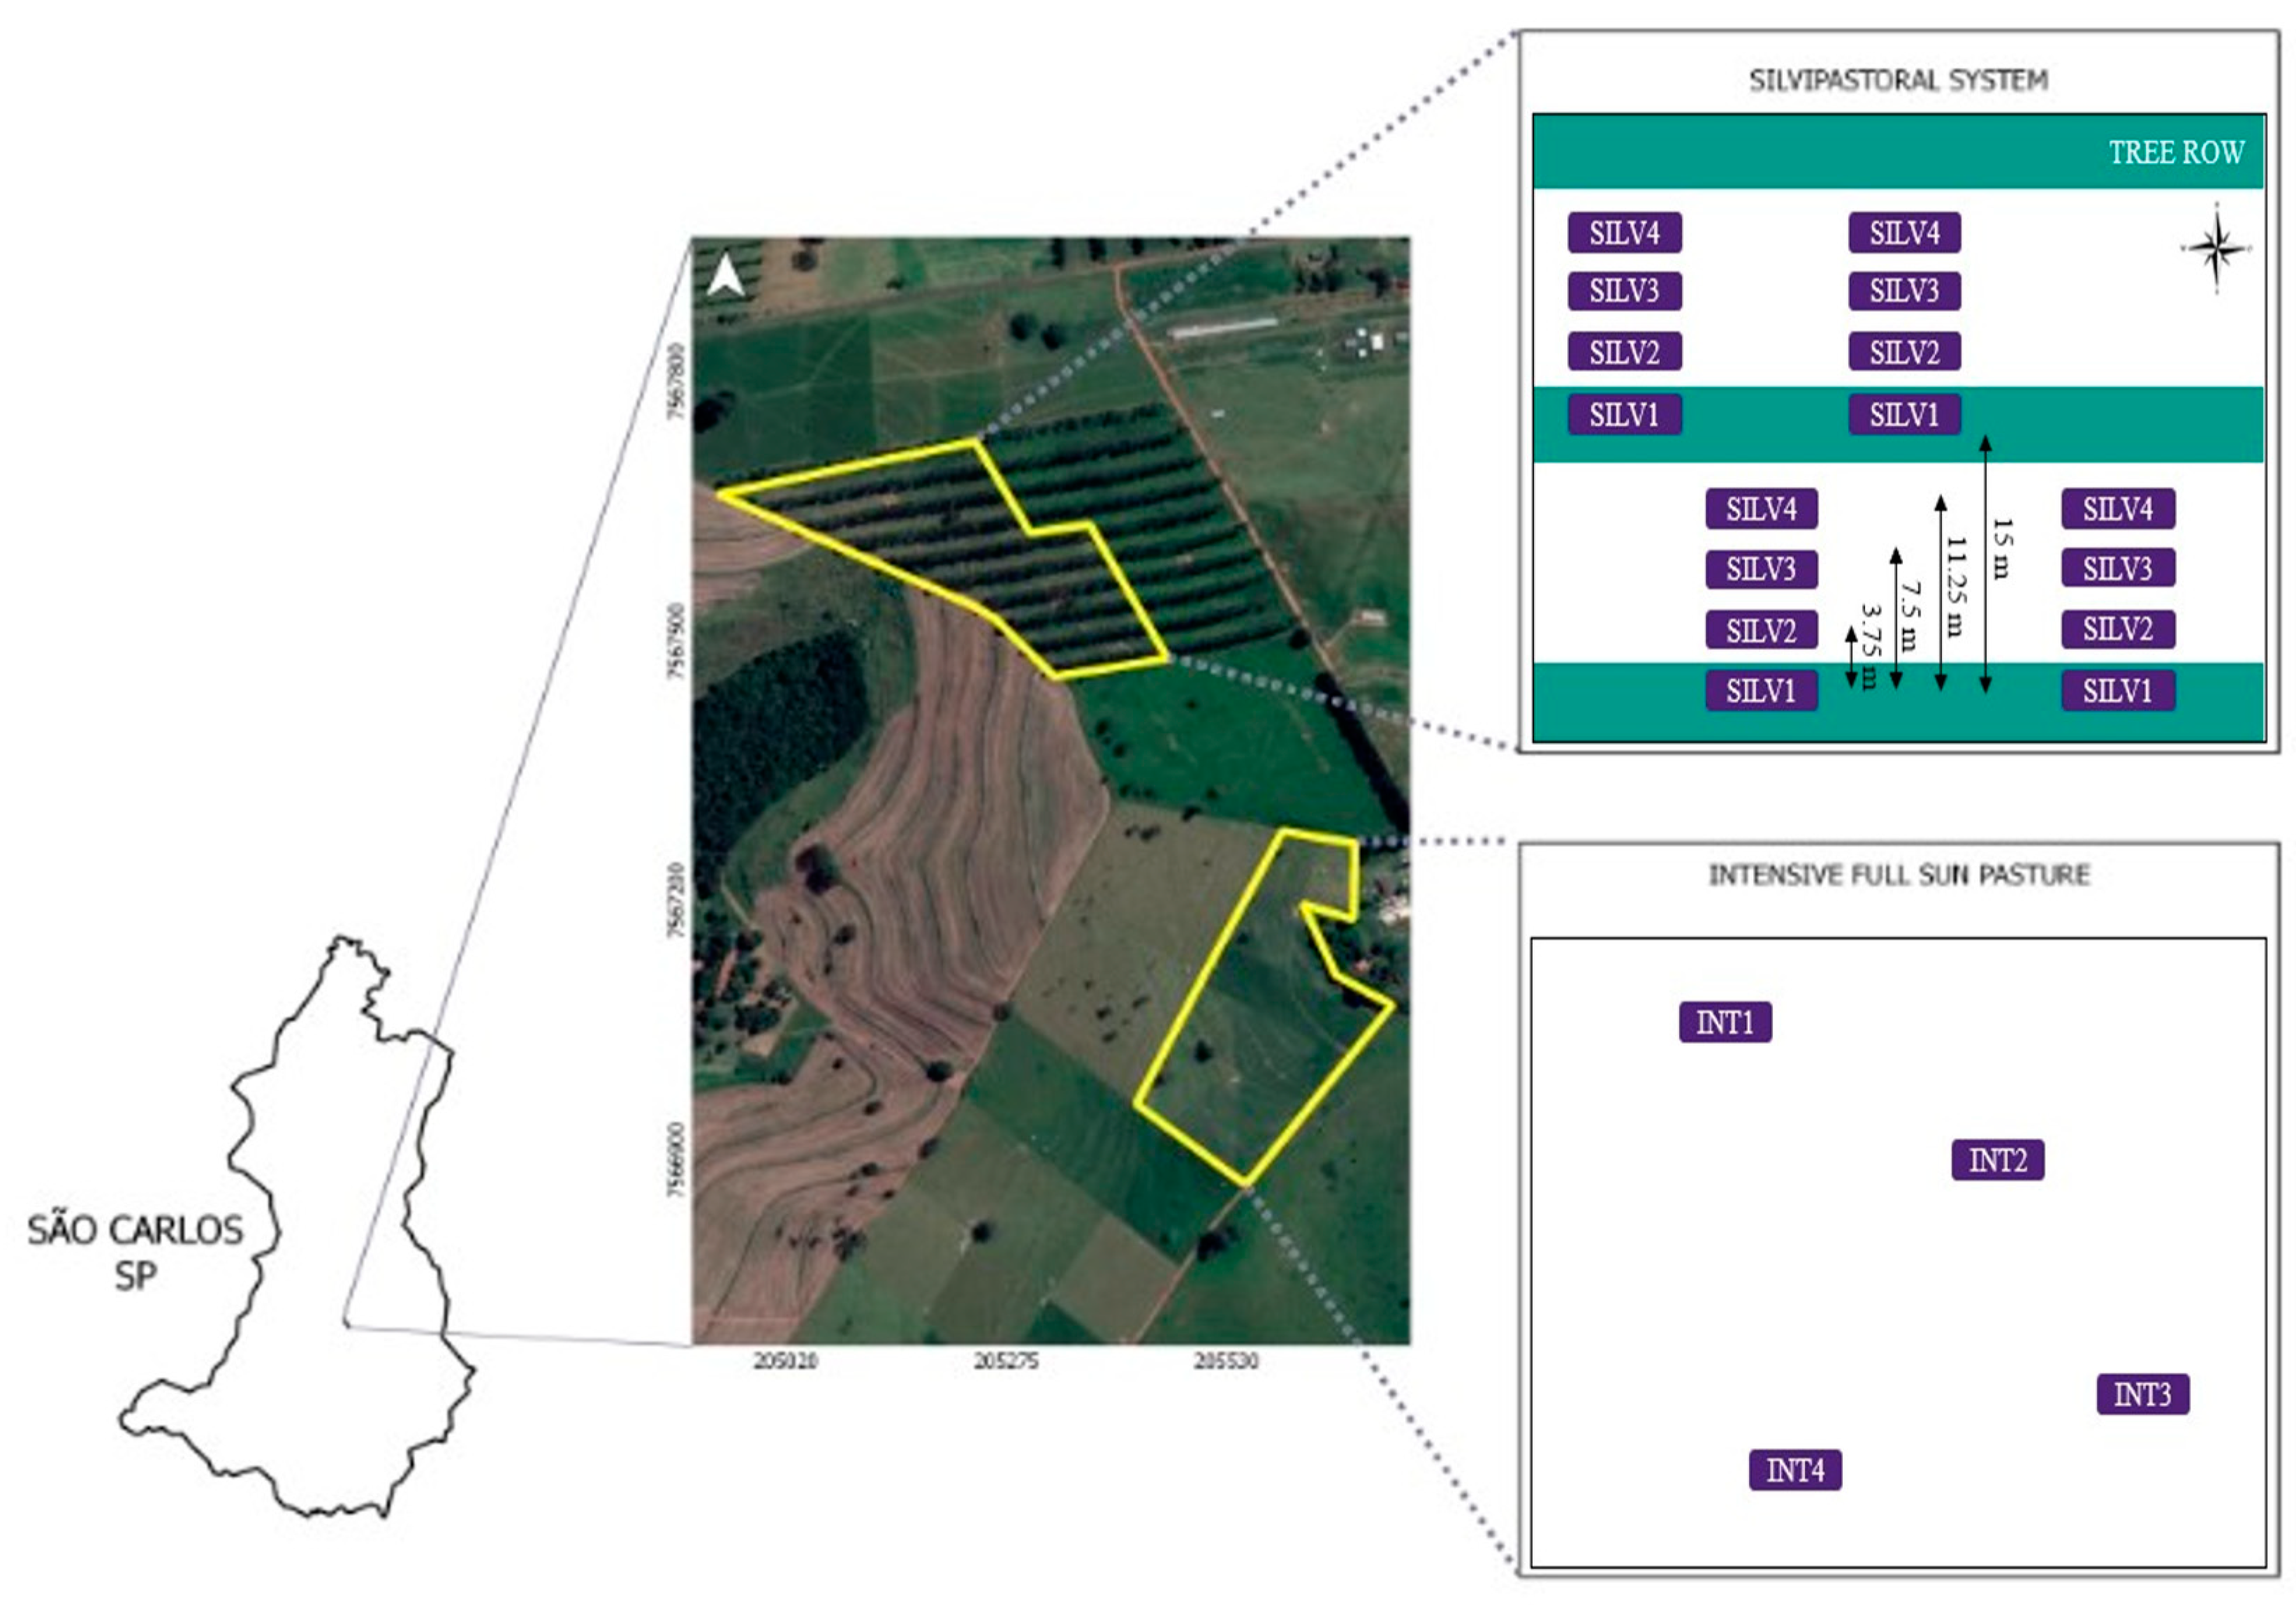
2.1. Study Site and Experiment Design

The study was conducted in the experimental area of Embrapa Pecuária Sudeste, São Carlos, SP, Brazil (21°57′S, 47°50′W, 860 m; Figure 2). According to Koppen’s classification, the region is characterized by a Cwa climate (humid subtropical climate) composed of a dry winter and rainy summer [19]. The soil in the study area is the dystrophic red-yellow latosol [20].
In the study site, 2 grazing systems were evaluated: a silvopastoral system (SILV) and an intensive (INT), full-sun system, with Urochloa pasture (syn. Brachiaria) brizantha cv. BRS Piatã, in rotational grazing. Eucalyptus trees (Eucalyptus urograndis clone GG100) were planted in the SILV system in April 2011. The experimental design consisted of single rows, with an orientation close to east-west in a spacing of 15 × 2 m (15 m between rows and 2 m between trees in the rows), which resulted in a population density of 333 trees ha-1.
In both systems, pasture was managed under rotational stocking were grazed by castrated males of the Canchim breed (3/8 Nellore + 5/8 Charolais), with stock adjusted according to the forage mass in the pre-grazing. The periods of occupation and rest were 6 and 30 days, respectively.

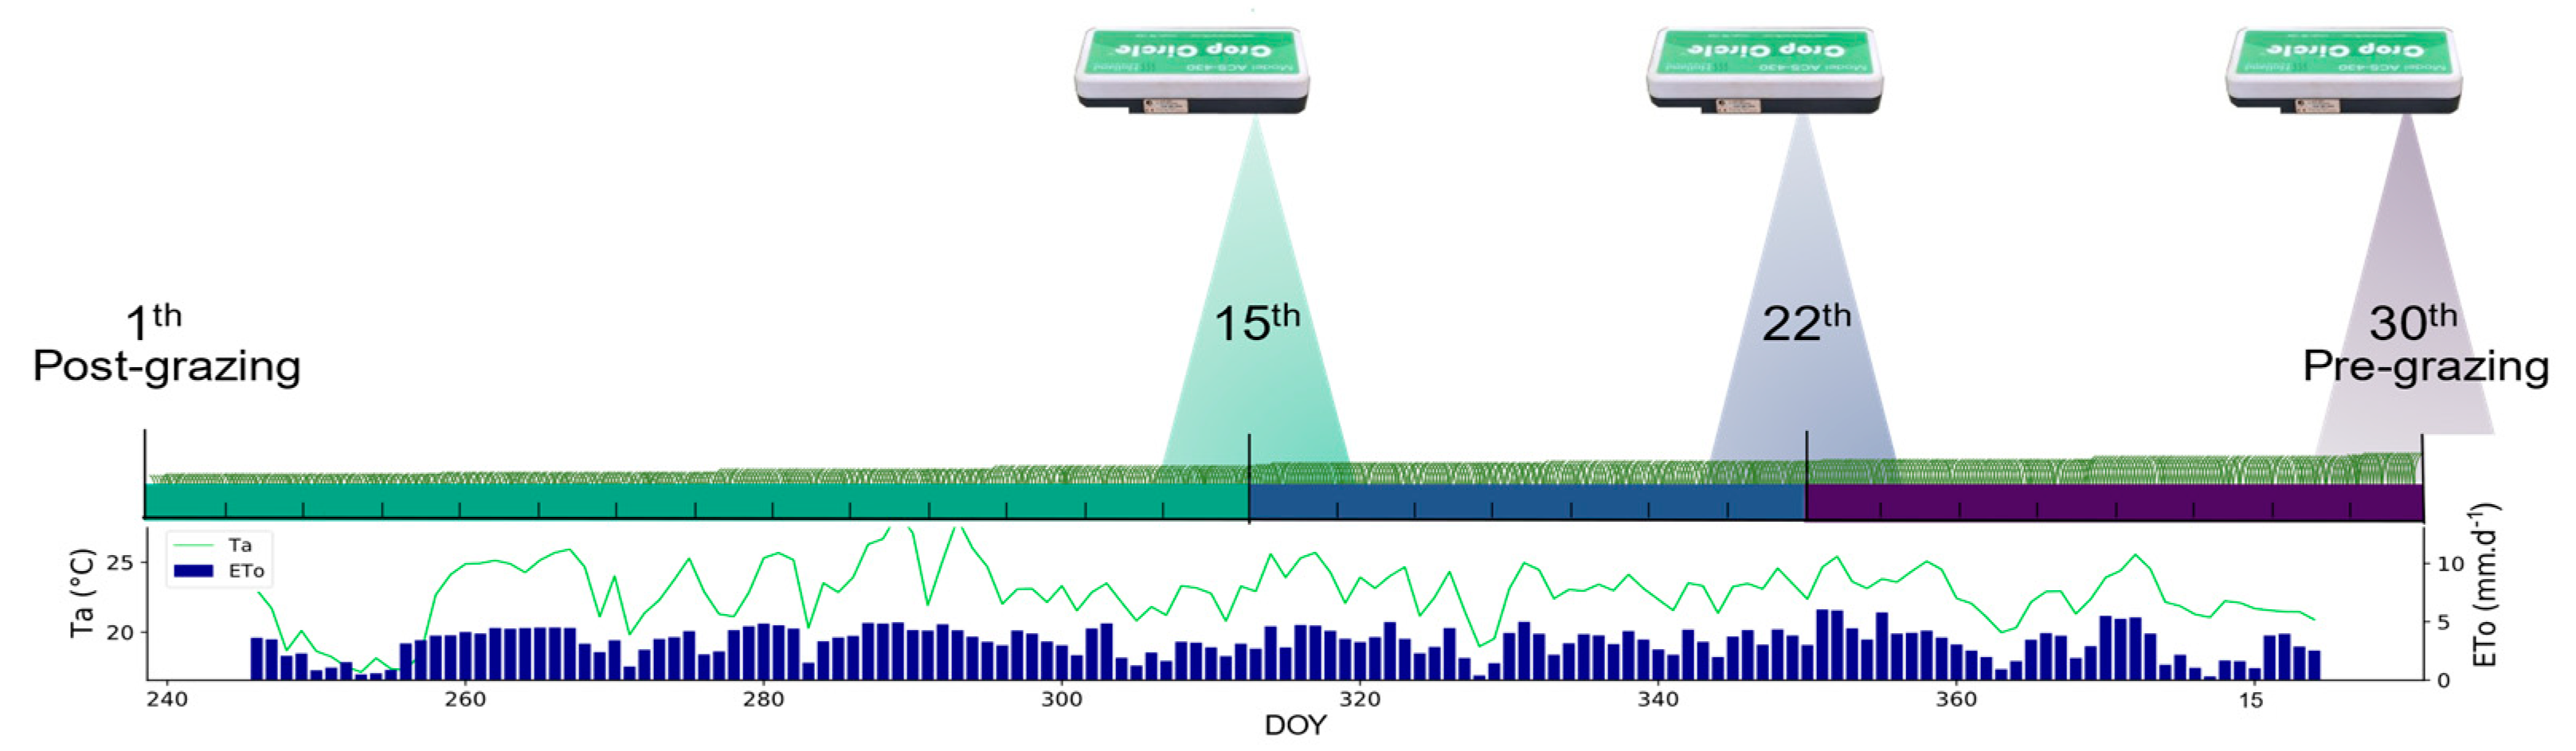
2.2. Proximal Reflectance and Meteorological Data Acquisition

The Crop Circle ACS-430 (Holland Scientific, Lincoln, NE, USA), an active sensor that emits electromagnetic light and captures reflectance centered on red (670 nm), red edge (730 nm), and near-infrared-NIR (780 nm), was used to collect canopy reflectance in the experimental area (Figure 2). The field of view of the Crop Circle ACS-430 sensor is an oval of ~30° by ~14° range. Sensor readings were collected approximately 0.7 m above the forage canopy in an area of 4 m2 (2 × 2 m).
The collections were conducted in four complete cycles of forage growth, from September 2015 to January 2016, with three collections per cycle, close to the 15th, 22nd, and 30th day after the end of grazing. In the INT, 4 randomly distributed points were sampled in the paddock. In the SILV, the forage was sampled at 4 levels of shading. For this, the evaluations were carried out in parallel between the tree rows, spaced at 3.75 m, with 4 points being sampled for each level of shade (Figure 2).
On the same day as the evaluation, forage mass samples were collected from the center of this area (2 × 2 m). The direct technique was used to collect the forage mass required to evaluate the performance of the SAFER model, in which the forage within the 0.5 × 0.5 m frame was cut close to the ground. After drying in an oven for 72 h at 65 °C, the mass samples were weighed, and a subsample was taken for morphological evaluation and another for dry matter analysis. The total dry mass (MST), dry mass of leaf + stem (MSfc), and dry mass of leaves (MSf) in kg ha−1 were determined based on the dry matter and morphological composition. The leaf area index (LAI) was calculated from the ratio between the leaf area and the area from which the forage was collected. All these variables were used to measure the SAFER model in order to observe which 1 would be better related to the biomass estimated by the model in each of the production systems.
The meteorological parameters used as input data in the SAFER model were photosynthetically active radiation (PAR), air temperature (Ta), and reference evapotranspiration (ETo). These parameters were obtained from 2 meteorological stations located nearby the experimental areas and were utilized to characterize the SILV and INT paddock areas. The linear quantum sensors were used to quantify the PAR in the INT system and in different shading levels in the SILV.

2.3. Simple Algorithm for Evapotranspiration Retrieving (SAFER)

SAFER is a model to calculate real crop evapotranspiration based on the Penman–Monteith equation [21]. Evapotranspiration is computed using biophysical factors combined with meteorological station data without the need for crop classification data or radiation physics [22]. The potential to use meteorological data from several stations is a significant benefit of this model since it increases the amount of data accessible for processing [12]. Furthermore, another significant advantage of SAFER is that it does not require information from thermal bands, allowing the use of a broader range of sensors that do not have this type of information [12]. In this paper, forage mass was designated as fresh mass (MF), about mass with water, since the model employs variables inherent to the evapotranspiration process and the Normalized Difference Vegetation Index (NDVI).
Reflectance and meteorological data were used as input to the SAFER model. Initially, based on the reflectance at the wavelengths of red ( α ), red edge ( α 1 ), and near-infrared ( α 2 ), the surface albedo ( α 0 ) was estimated.
α 0 = b α + c α 1 + d α 2
where b , c , and d are regression coefficients calculated from Planck’s law [23].
The reflectance of the red and near-infrared bands was applied to calculate the N D V I [24].
N D V I = ( α 2 α ) ( α 2 + α )
From the photosynthetically active radiation ( P A R ) measured at the meteorological station, the global incident radiation ( R G ) was estimated.
R G = P A R a B
where a B is the regression coefficient.
Then, the incident longwave radiation emitted by the atmosphere was calculated ( R a ) through the Stefan-Boltzmann law.
R a = σ ε A T a 4
where σ is the Stefan–Boltzmann constant (5.67 × 10⁻⁸ W⋅m−2⋅K−4), T a is the air temperature, and ε A is the atmospheric emissivity calculated according to [25].
ε A = α A ( ln τ s w ) b A
where α A and b A are the regression coefficients, and τ s w is the atmospheric transmissivity.
Based on and on surface albedo ( α 0 ), the values of reflected radiation ( R R ) were calculated.
R R = α 0 R G
As a next step, to obtain the surface temperature ( T 0 ) by the residual method, the net radiation was calculated ( R n ) through the Slob equation.
R n = ( 1 α 0 ) R G ( a L τ s w )
where a L is the regression coefficient correlated with T a [25], and τ s w is the atmospheric transmissivity.
Using the data R G , R R , R a and R n was used in the radiation balance equation to obtain the long wave radiation emitted by the cultivated surface ( R S ).
R S = R G R R + R a R n
T 0 was then estimated using Equation (9).
T 0 = R S σ ε S 4
where ε S is the surface emissivity calculated according to [25].
ε S = a S ln N D V I + b S
where a S and b S are regression coefficients.
The evapotranspiration ratio was obtained based on Equation (11).
E T E T 0 = exp [ a s f + b s f ( T 0 α 0 N D V I ) ]
where a s f and b s f are regression coefficients.
Based on the evapotranspiration data calculated from the SAFER, the daily forage biomass (MVD) was estimated (Equation (12)). The absorbed photosynthetically active radiation, APAR, constitutes the MVD estimation equation (Equation (13)) [26] adapted by [27].
A P A R = ( 0.161 + 1.257 N D V I ) ( P A R )
where P A R is the photosynthetically active radiation.
MVD =   ( ε max ET ET 0 APAR 0.864 )
where ε max is the maximum efficiency of radiation use. For the Piatã grass, ε max = 2.31 g M J 1 , was used [28].
Although spectral and field evaluations were carried out at three moments of the cycle, estimates were made daily, considering the meteorological data of the exact days and the spectral behavior of the subsequently collected forage (Figure 3). In view of the results of daily fresh forage mass accumulation (kg ha−1), these were added to obtain the forage mass estimate consistent with the collection days (MF).

2.4. Statistical Analysis

At the end of the four forage cycles, 192 (4 points × 4 shading levels × 3 moments for cycle × 4 cycles) points were sampled in SILV and 48 points in INT (4 points × 3 moments for cycle × 4 cycles) production system. For the NDVI variable, a boxplot notch analysis was generated, which demonstrates confidence intervals of approximately 95% for the medians. The standardized residuals method was used to eliminate outliers and values less than −2 and greater than +2 from the data set. The maximum number of outliers taken from the SILV dataset was 13, while in the INT, it was 3. The Shapiro–Wilk test was performed to determine whether the data had a normal distribution.
A Spearman correlation was performed, 1% probability, as non-normal data for the variables was observed, separately for SILV and INT. Linear regression models were generated for each system between the data estimated by the SAFER and in situ data. For model training, 80% of the total data was used, and 20% for the test phase. The coefficient of determination (R2) values was used to analyze the behavior of the estimated fresh mass, the other variables and the relationship between them.
To evaluate the forage mass estimation from SAFER, the data estimated after this phase were compared with the observed data at the field, using a performance graph, R2, root mean square error (RMSE) and relative absolute error (ER; Equations (14)–(16)).
R 2 = S Q R S Q T
RMSE = [ ( 1 n ) 1 = i n ( O i E i ) 2 ]
ER   ( % ) = 100   ( 1 n ) 1 = i n / E i O i / σ
where S Q R is the sum of the squares of the regression, S Q T is the sum of the total squares, O i is the observed value, E i is the estimated value, n is the number of points, and σ is the average of the observed values.

3. Results

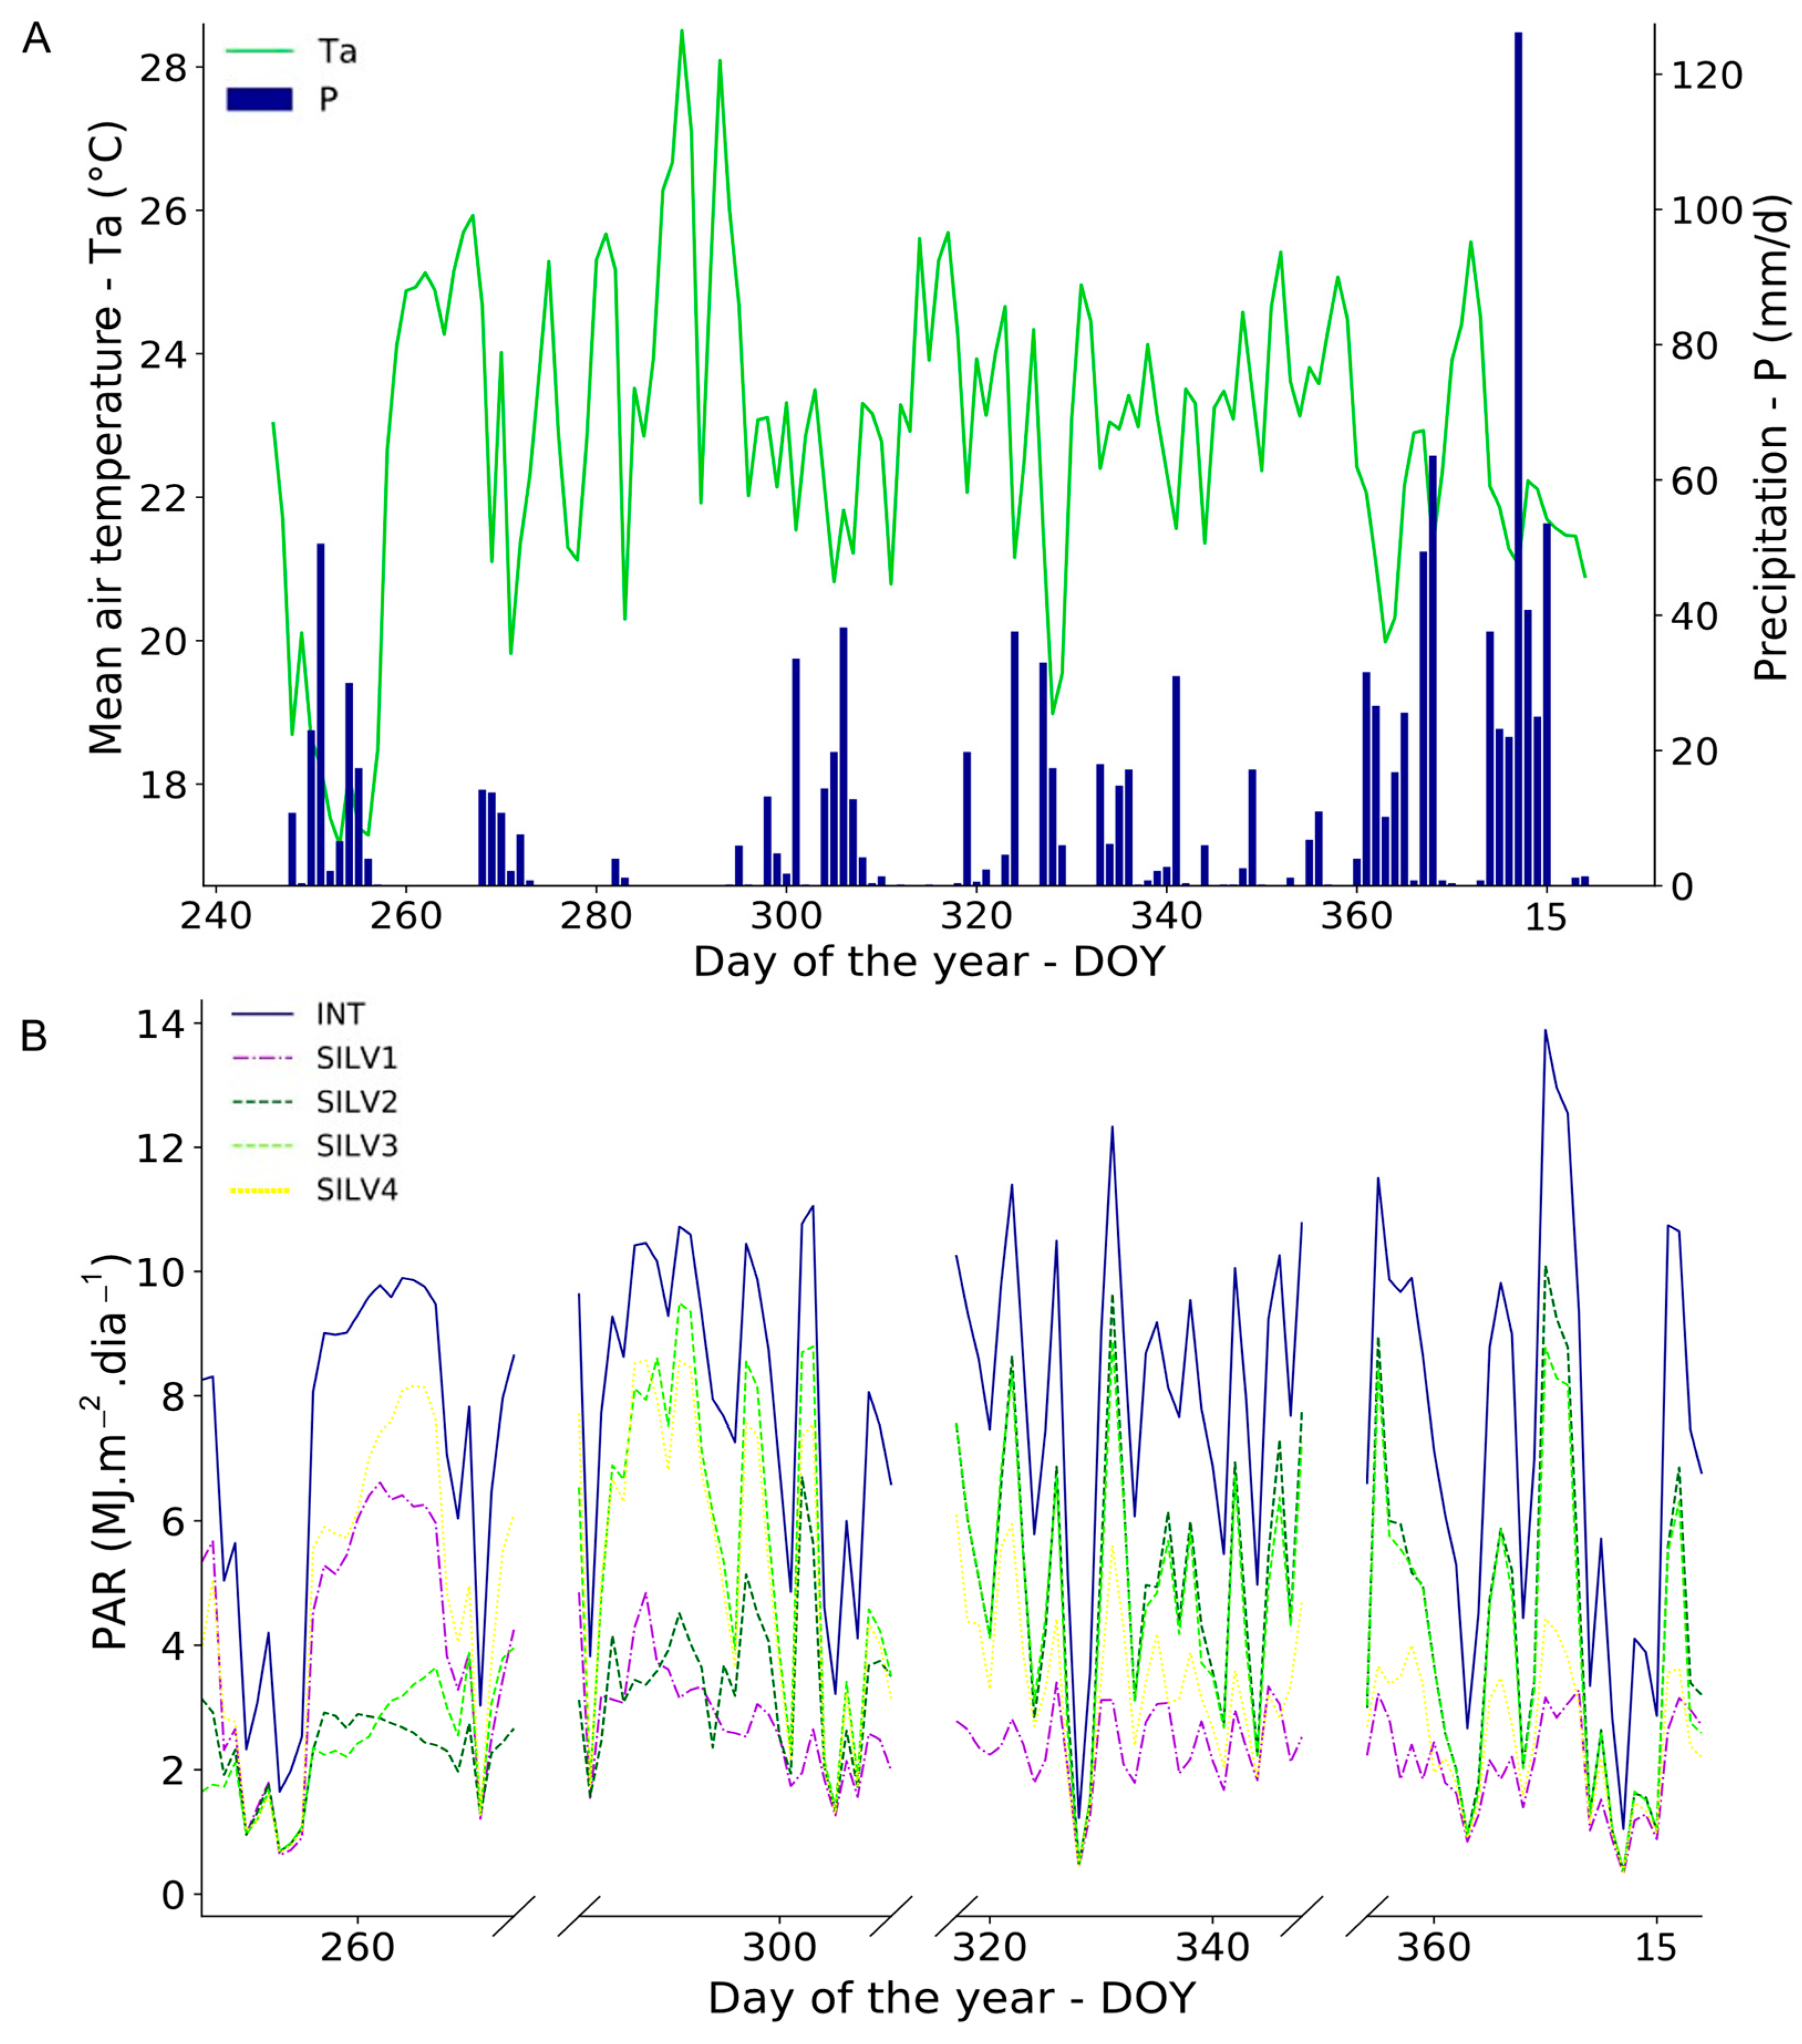
3.1. Weather Parameters

The evaluations were carried out at the end of winter, spring and the beginning of summer, providing the observation of several meteorological variables that directly affect the growth of forages (Figure 4A). In winter, between 246 and 265 days of the year (DOY), there is a steady decline in the mean temperature, with values falling below 18 °C, which was not observed on the other days studied. Over these 20 days, the average precipitation was 7.26 mm d−1, with a total accumulation of 145.20 mm.
The mean precipitation in spring (DOY 266–355) was approximately 5 mm d−1, with maximum precipitation not exceeding 40 mm on any of the days evaluated. Throughout the season, the thermal amplitude was approximately 11 °C, with an average maximum temperature of 28 °C; however, on most days, the average temperatures ranged from 21 to 25 °C. At the start of summer (DOY 356–19), the period in question had an average rainfall of 19.75 mm d−1, which was significantly greater than the value observed at the other forage cycles studied. Despite the fact that only one day had accumulated 126 mm, it rained on 80 percent of the analyzed summer days, indicating that the rains were evenly distributed. According to the classification proposed by Koppen [19], the study area presents a hot and humid period between the months of October and March. In Figure 4A, this condition is evidenced by the increase in precipitation and temperature at the end of the month of October (DOY 294), extending until January.
It is conceivable to see distinct behaviors for the pasture in INT and the four levels of shading in the SILV system by evaluating PAR (Figure 4B). INT system presented higher PAR than shade levels in SILV, which implies that it has a greater capacity for photosynthetic activity. This can be explained by the absence of a canopy above the brachiaria in the INT system, a condition unobserved in SILV systems, in which the eucalyptus leaves absorb partial PAR radiation and reduces the amount of sunlight incidence on pasture and, consequently, forage mass production. Eucalyptus interference occurs in different proportions and may be based on the distance between the forage sampled and the tree rows, as seen in Figure 4B.

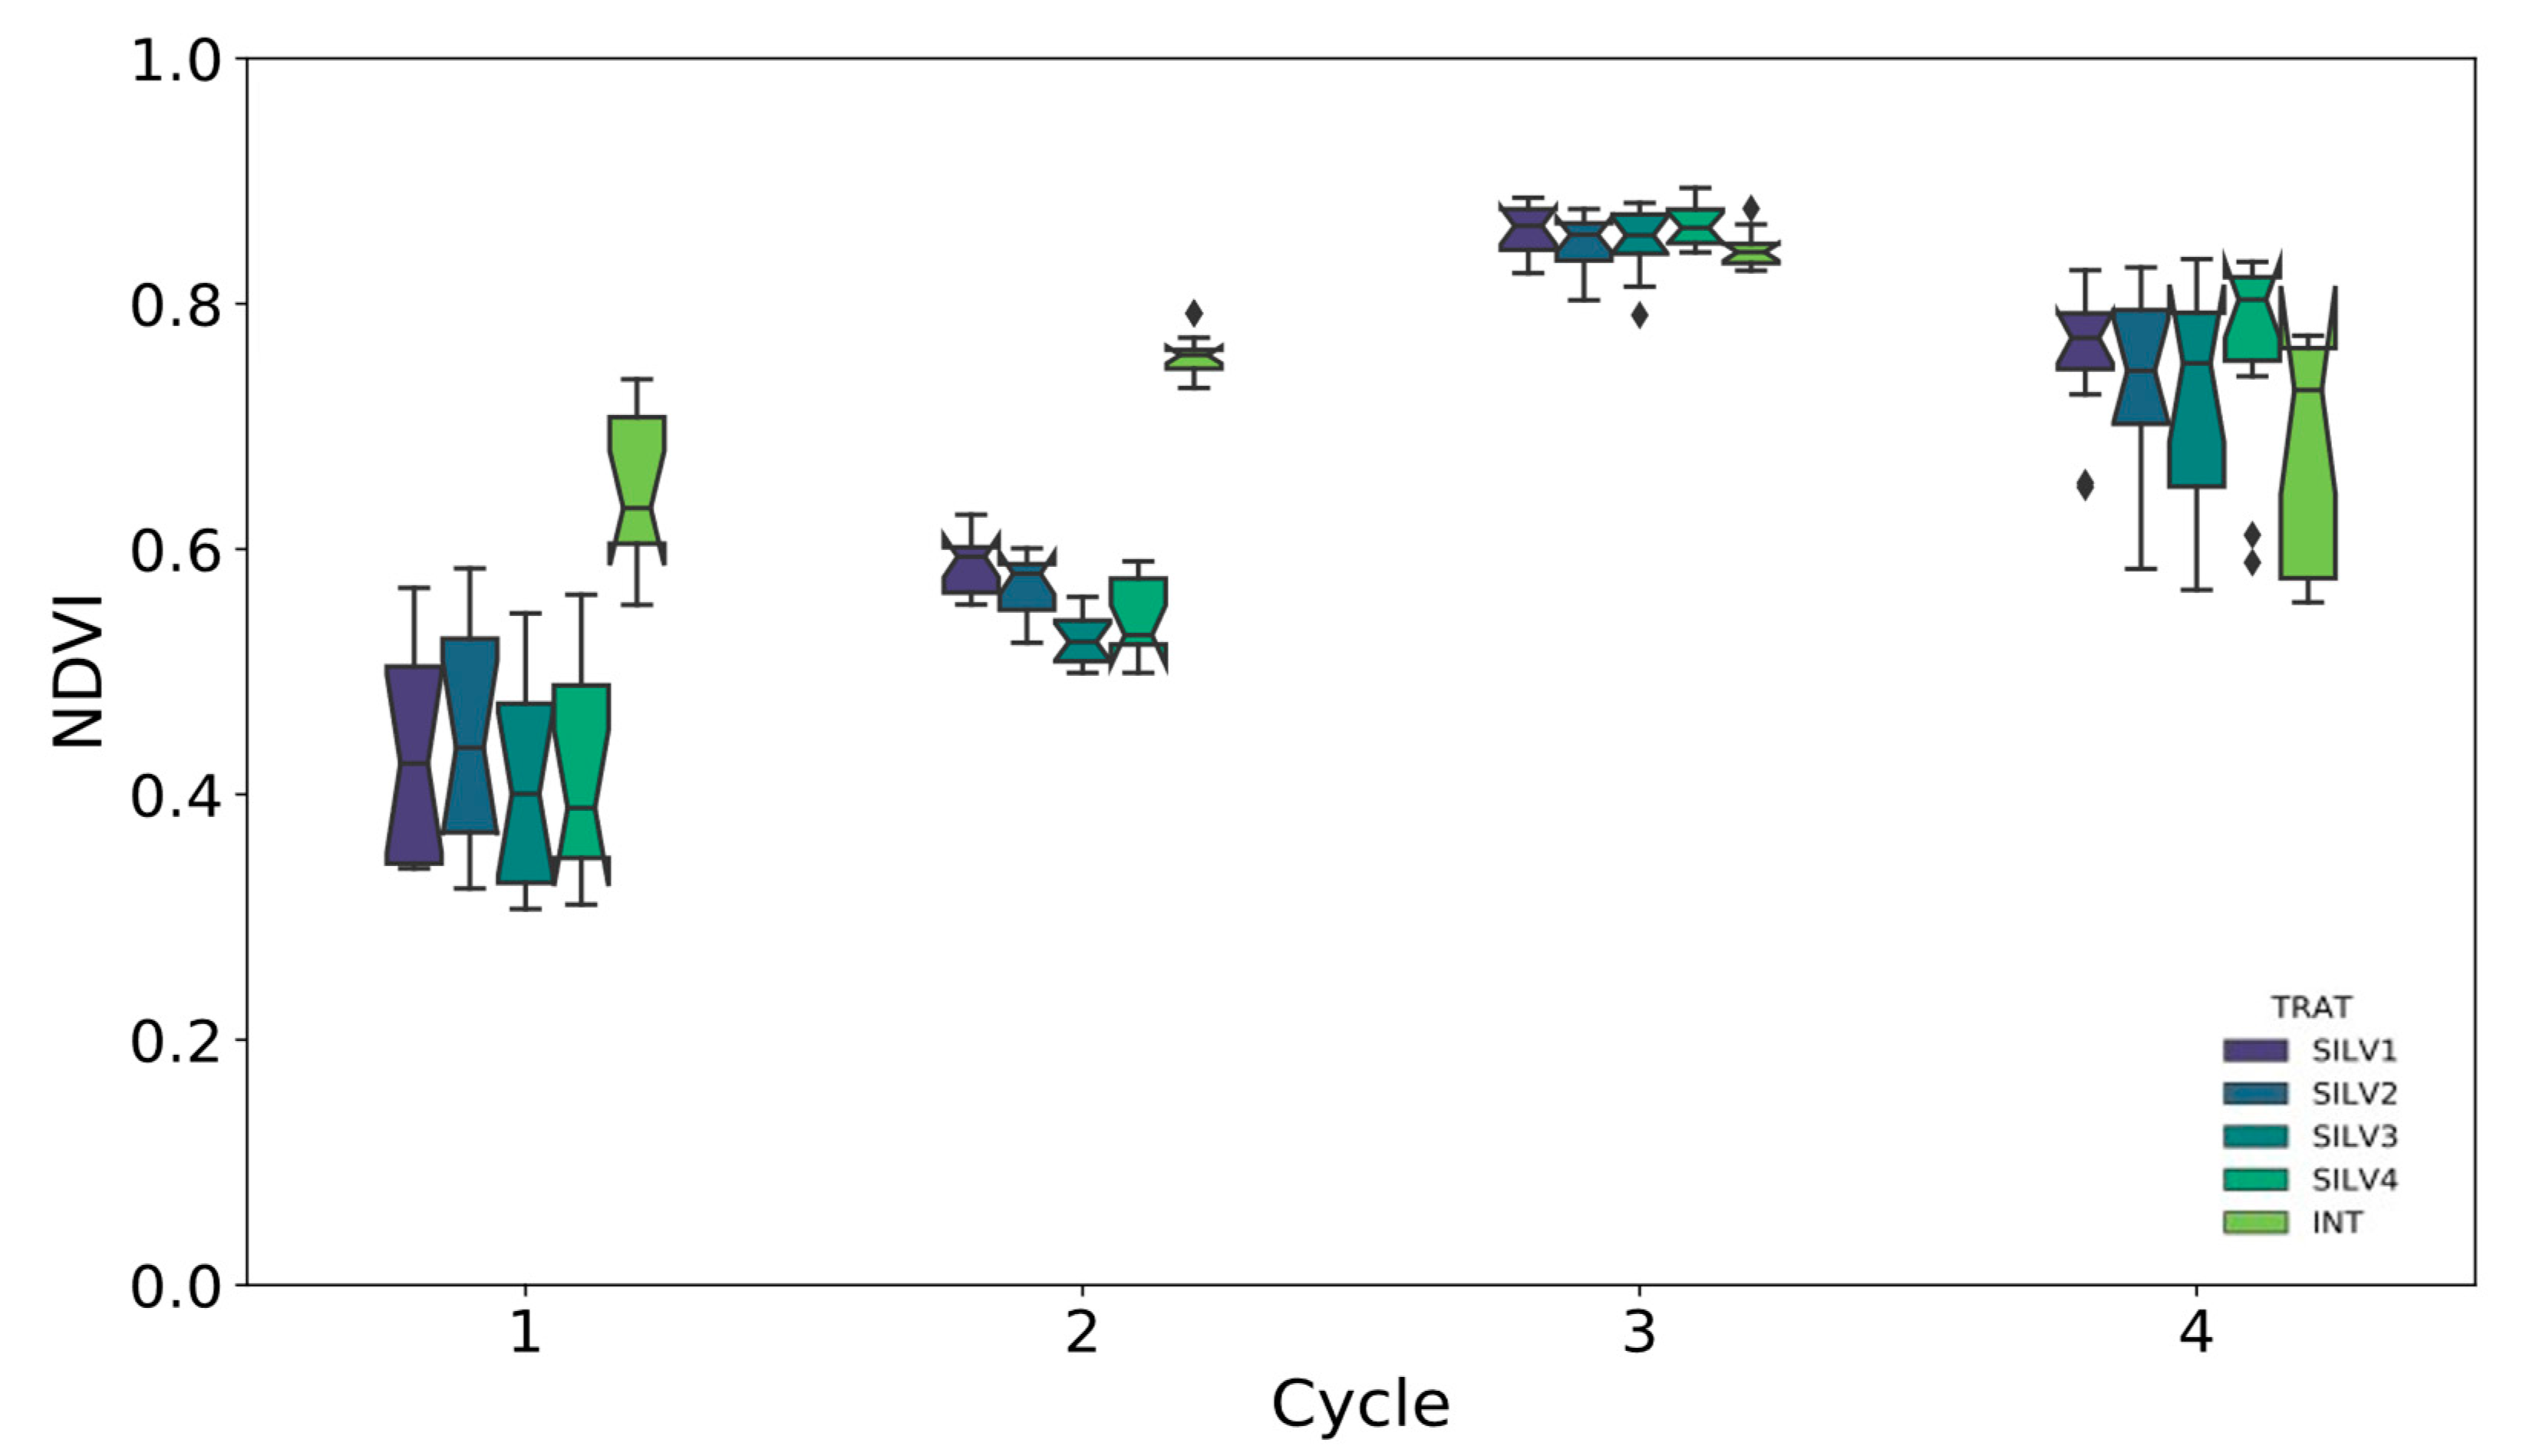
3.2. Spectral Parameter

In the first forage cycle, predominantly in winter, the pasture had an NDVI median of ~0.4 in four shading levels (SILV), while in the INT system, it was above 0.6, significantly different (Figure 5). The NDVI increased in the second cycle, in spring, for all conditions, with the vegetation indices remaining higher in the INT. The NDVI also grew in the third cycle, with the medians seeming extremely similar between the systems, and displayed a modest decline in the fourth cycle, in the summer, with similar medians between systems.
In the study area, winter is dry with milder temperatures (Figure 4A), and these aspects do not favor vegetation growth, contributing to low NDVI values in the first cycle. Also, in the first cycle, as in the second, the higher incidence of PAR in the INT system (Figure 4B) favored the fresh mass accumulation in relation to the different shading levels in SILV. This is supported by the difference in NDVI between systems. The increase in NDVI in late spring (third cycle) can be associated with the most favorable meteorological conditions for forage growth (higher values of temperature, precipitation and PAR–Figure 4). However, the high values of NDVI and the low variability observed in this cycle suggest saturation in both livestock production systems, a condition resulting from the high forage mass density.

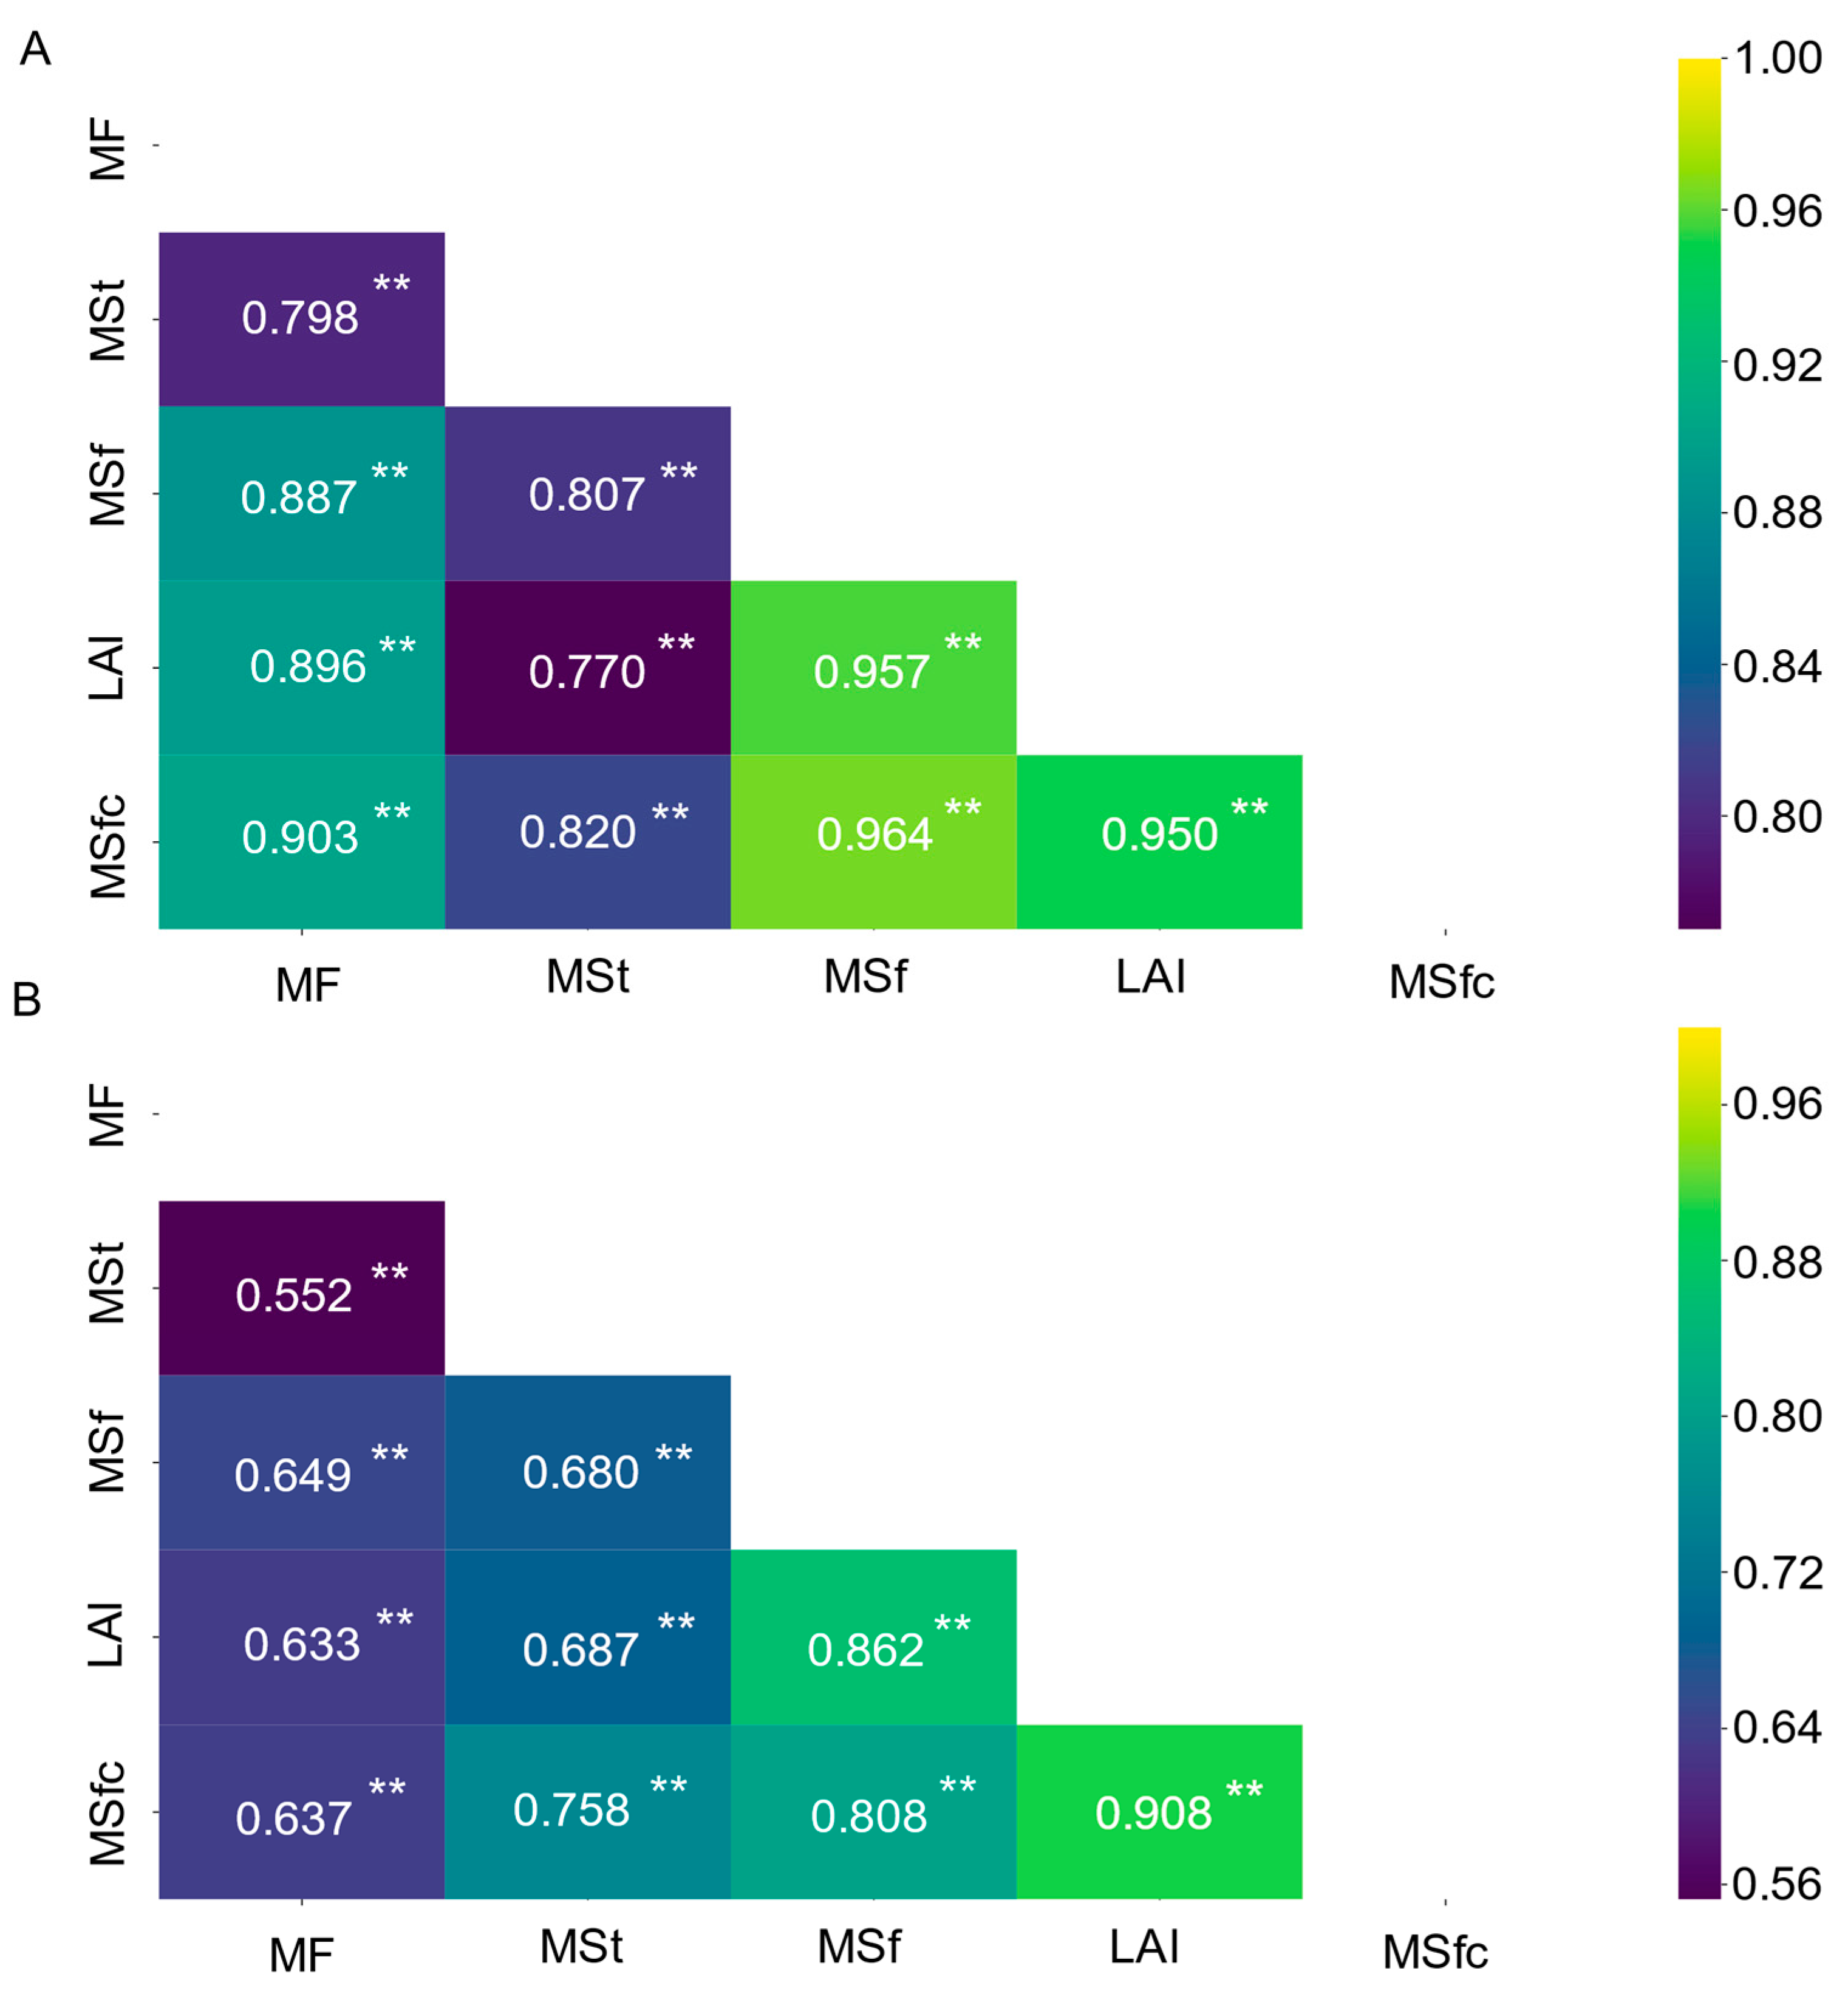
3.3. SAFER Estimated Forage Mass and In Situ Biophysical Pasture Variables

The pasture variables were total dry mass (MSt), dry mass of leaves and stalks (MSfc), dry mass of leaves (MSf), and leaf area index (LAI). The correlations between estimated fresh mass by model SAFER and in situ pasture variables are presented in Figure 6. The relationships between in situ pasture variables are presented in the graphs as a record.
In the SILV (Figure 6A), we observed a strong correlation between the estimated fresh mass and the in situ pasture variables, with an emphasis on the leaf and stem dry mass (0.903). The variables leaf area index and dry mass of leaves correlated approximately 0.9 with the estimated forage mass derived from SAFER. In INT, the correlations were lower than in the SILV system, with leaf dry mass having the strongest correlation (0.649). The other correlations were moderate: 0.637, 0.633, and 0.552 for leaf and stem dry mass, leaf area index and total dry mass, respectively.
The models generated in the training phase between MF in situ pasture variables are shown in Figure 7 and Figure 8. The SAFER forage mass estimation in SILV (Figure 7) was ~3000 kg ha−1, with the largest concentration of points up to 2000 kg ha−1, values that were lower than those observed in the field. It is worth mentioning that the SAFER was created and calibrated for the semiarid region, and that may have affected the final results of fresh mass, but still, it was able to generate values strongly correlated with pasture variables in the experiment region, cerrado biome. With this, it is possible to create, through linear regression, models between these variables, suggesting a previous validation in the field. Among the four pasture variables analyzed, only the total dry mass presented an R2 below 0.65.
The best regression performance was observed for leaf dry mass (Figure 7B), with an R2 of 0.76. In the INT, the estimated pasture fresh and dry masses were higher than in the SILV, as expected, since the PAR incidence on the vegetation was higher (Figure 8). The maximum estimated forage mass was ~4000 kg ha−1, and the observed total dry mass was ~12,000 kg ha−1.
Total dry mass was variable with the lowest R2; this can be explained due to the presence of dead matter in the sample, which has a direct impact on the NDVI value. The presence of dead matter tends to reduce the NDVI values as red reflectance increases and NIR reflectance reduces. NDVI will suffer interference from the senescence process and will not reflect the real biomass condition in the area. The best fit regression in the INT was the leaf and stem dry mass, followed by the leaf area index, both with an R2 of 0.52.

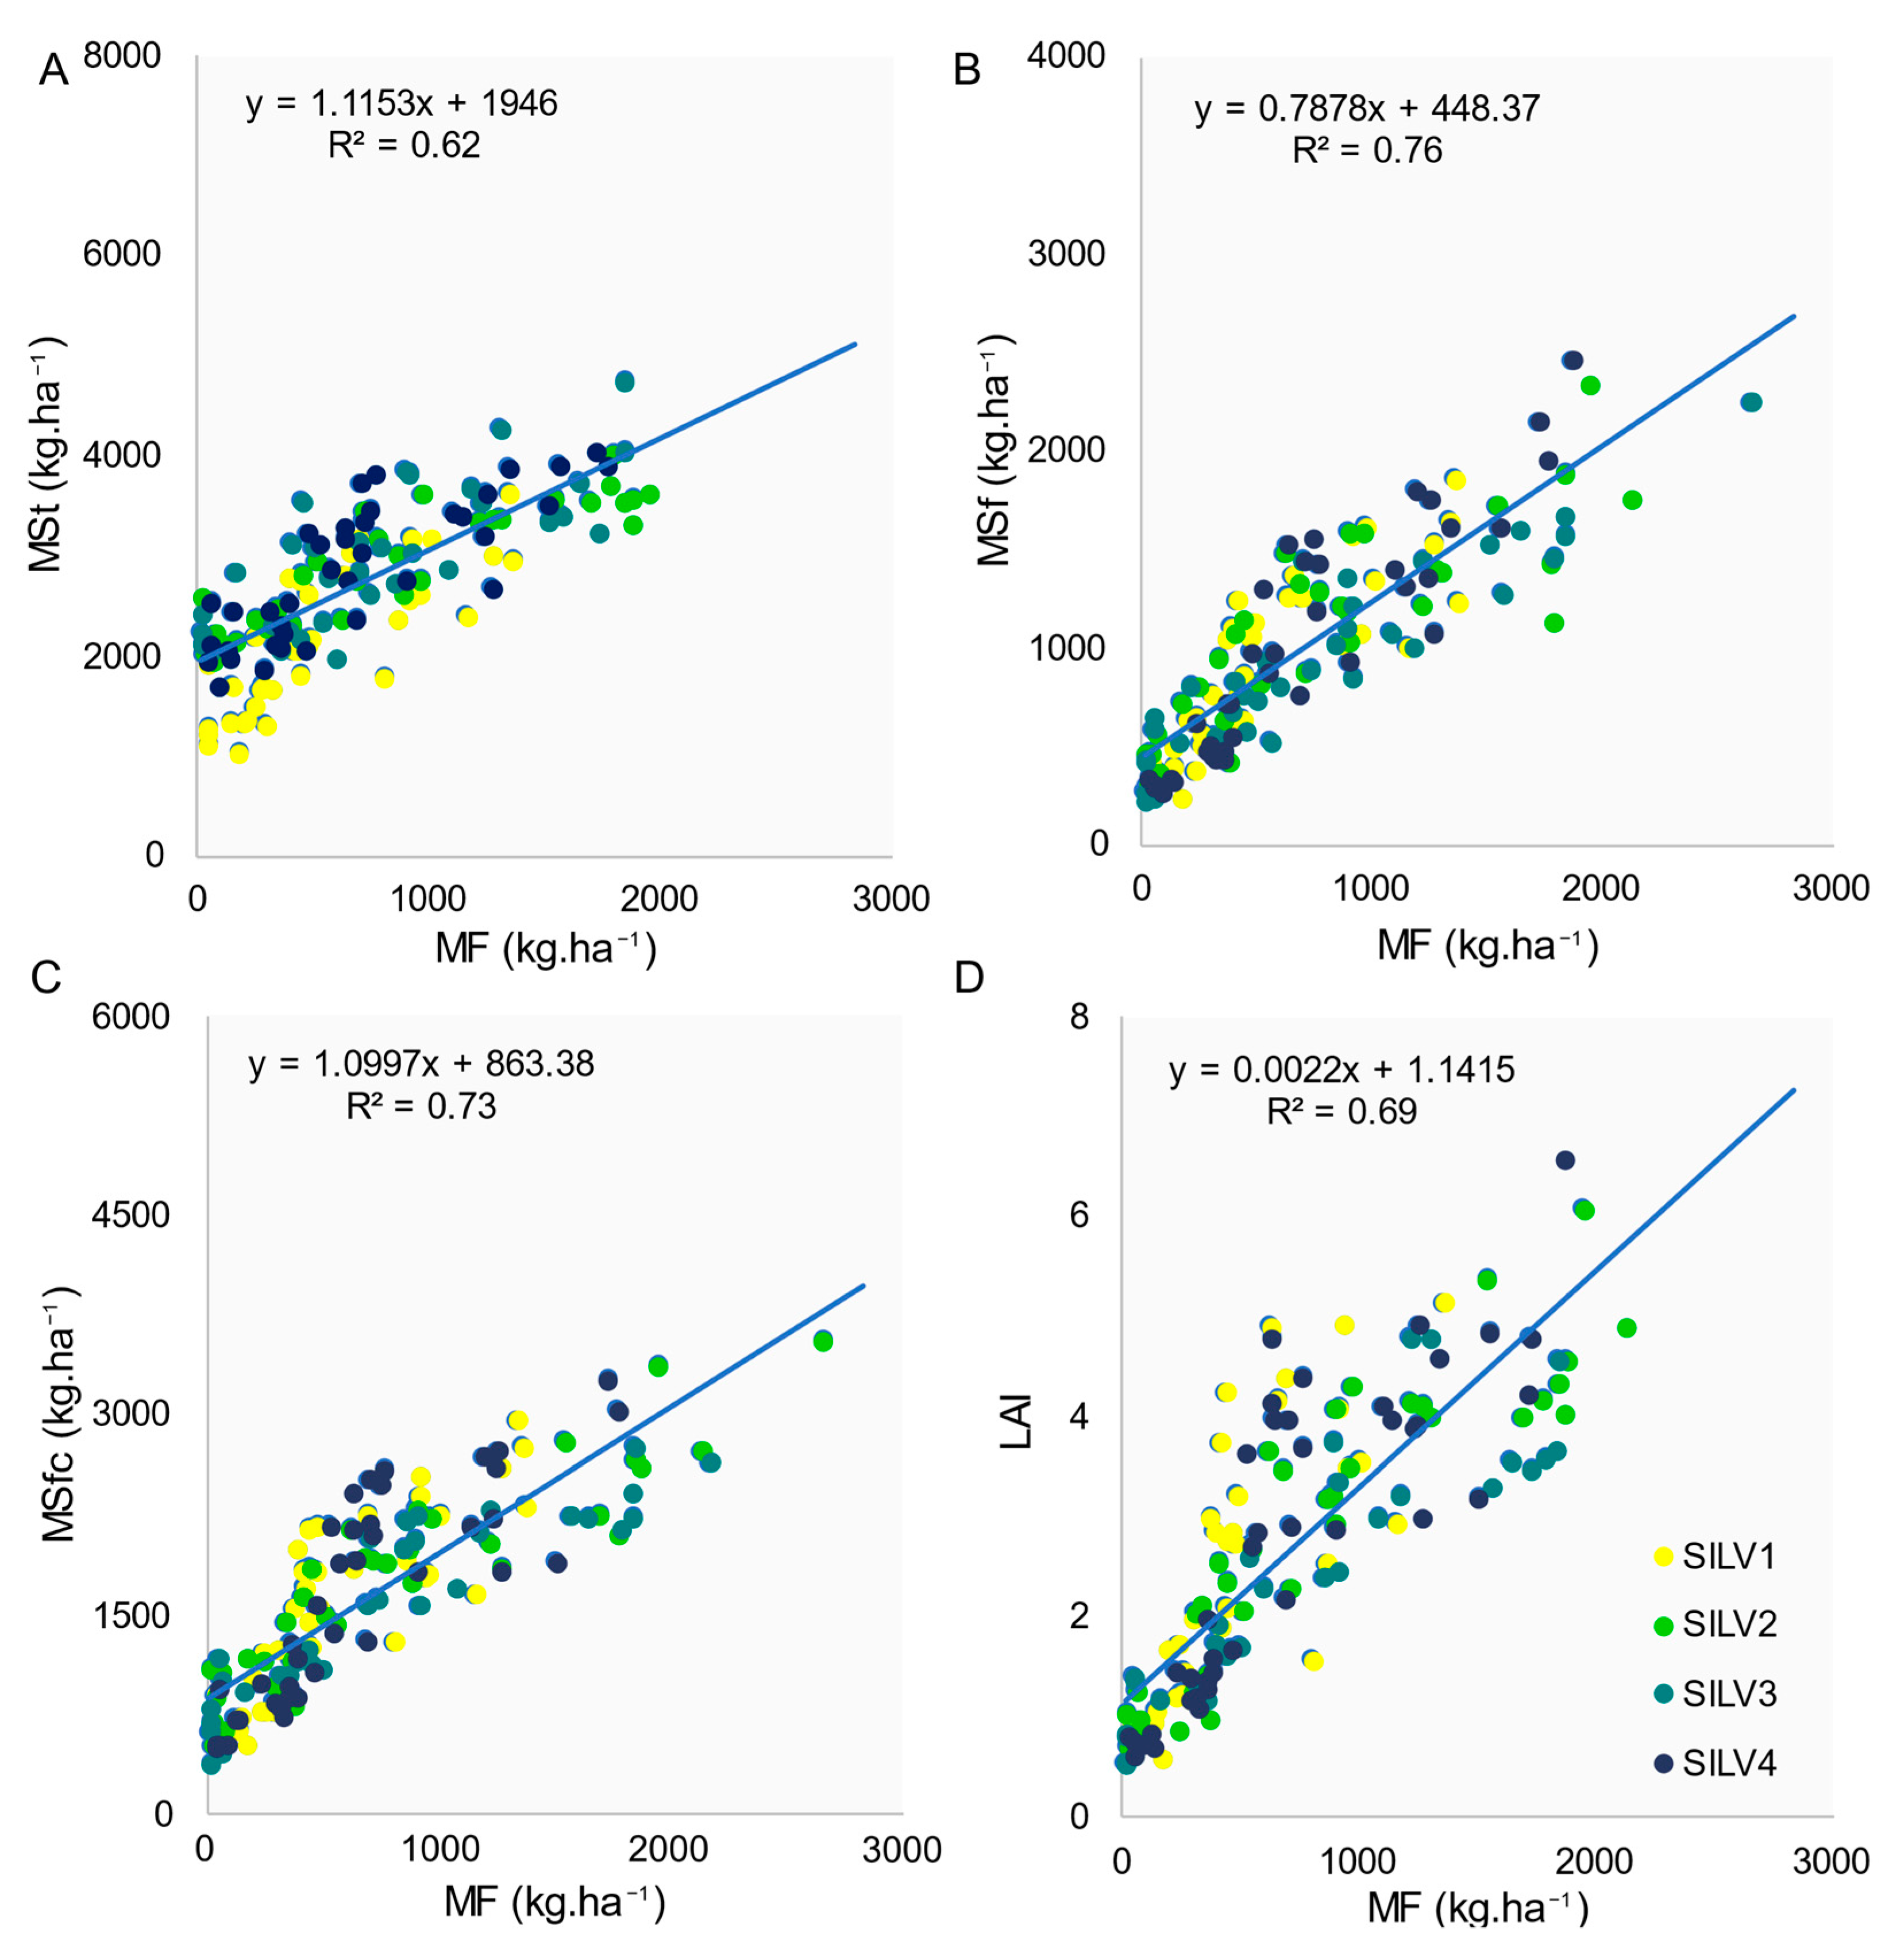
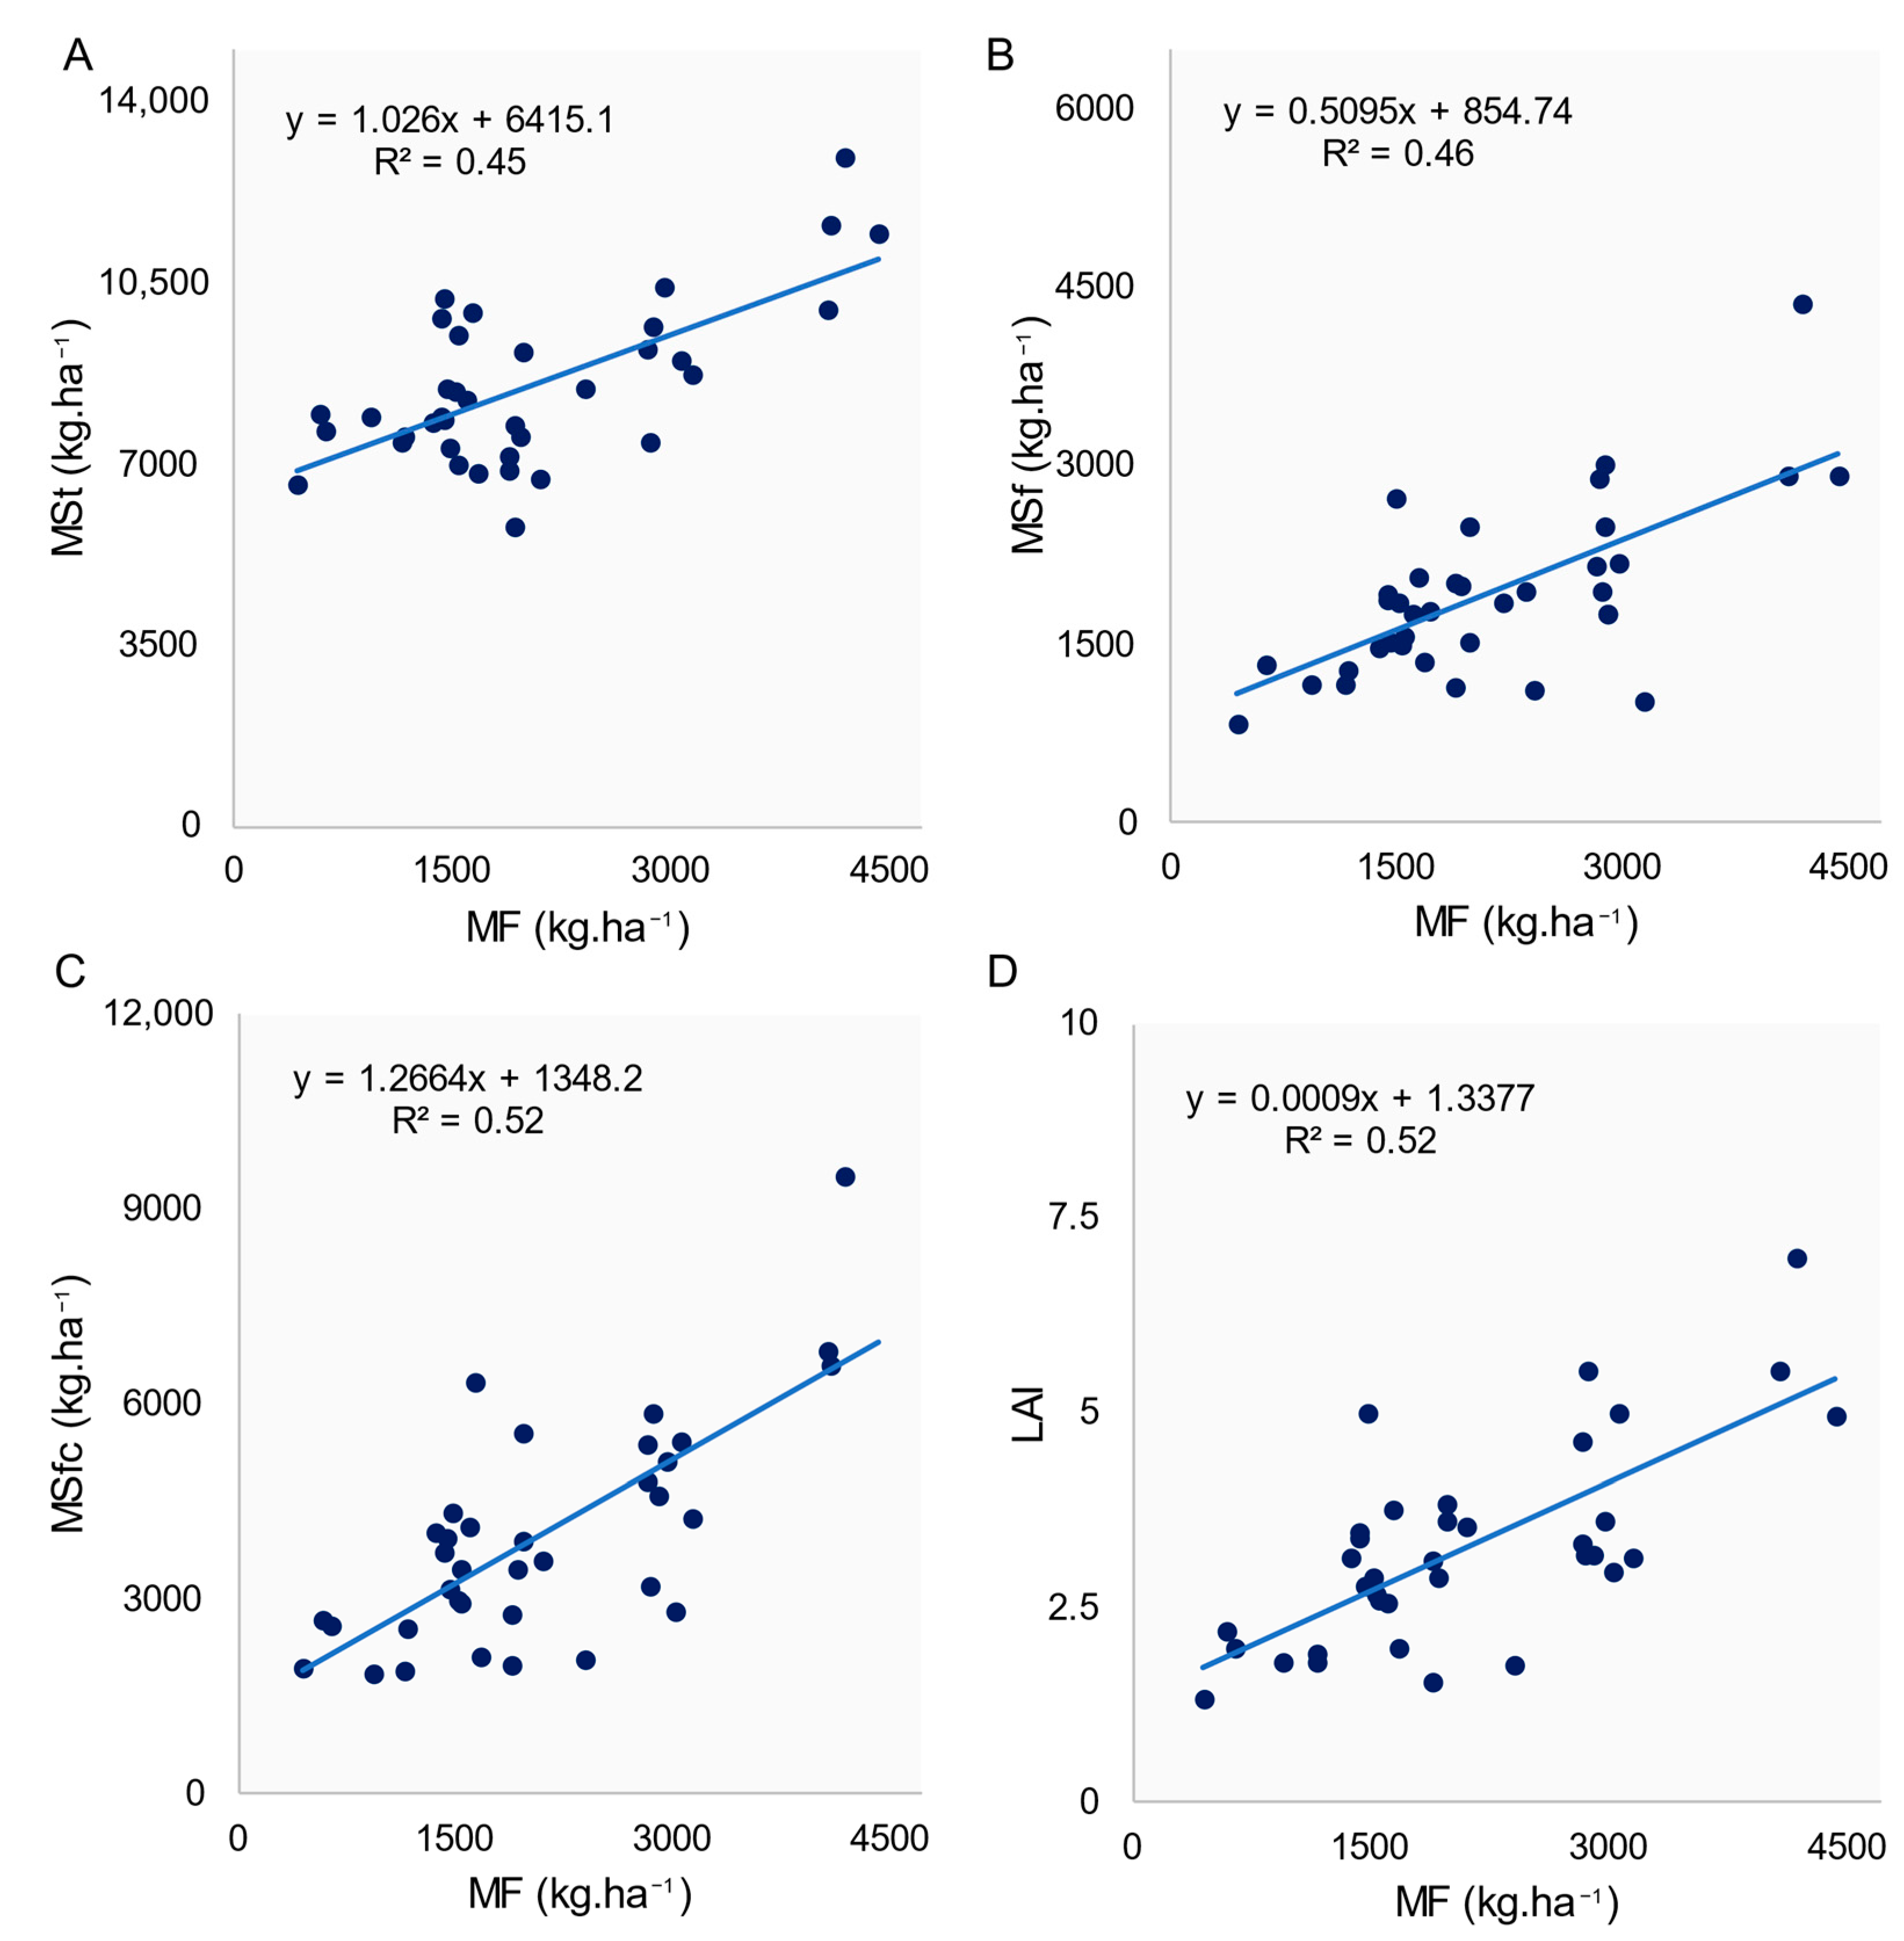
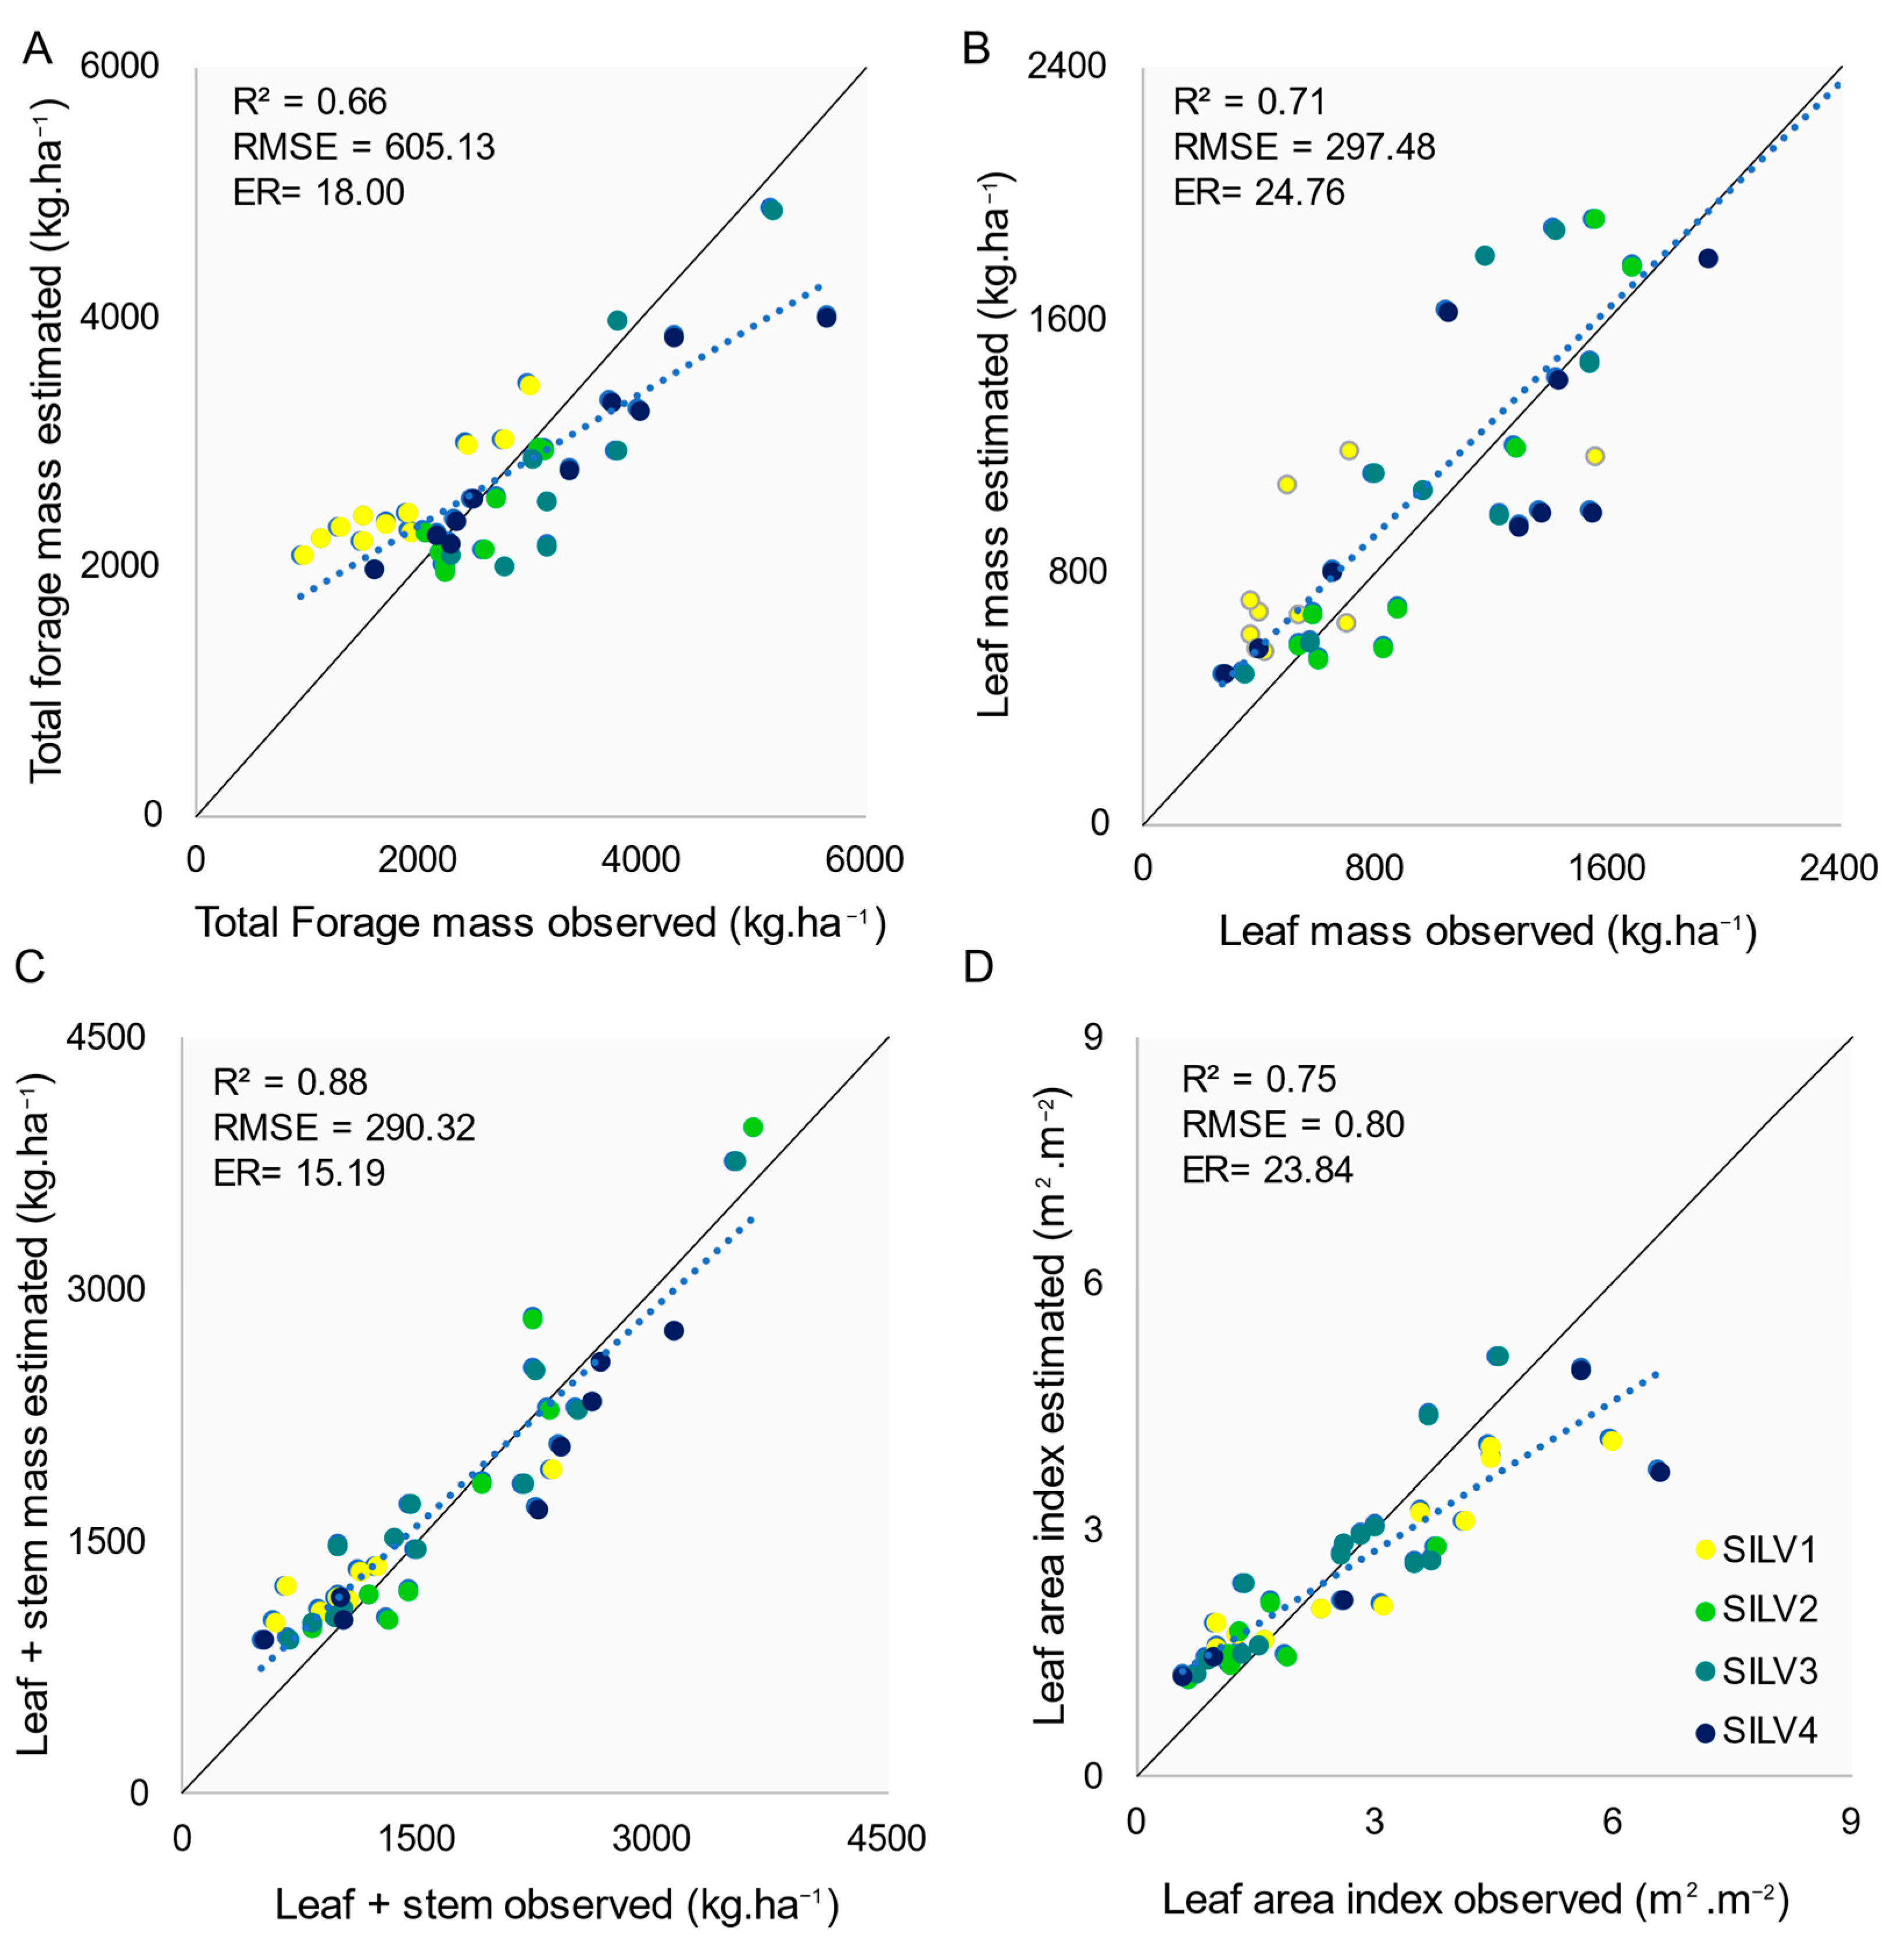
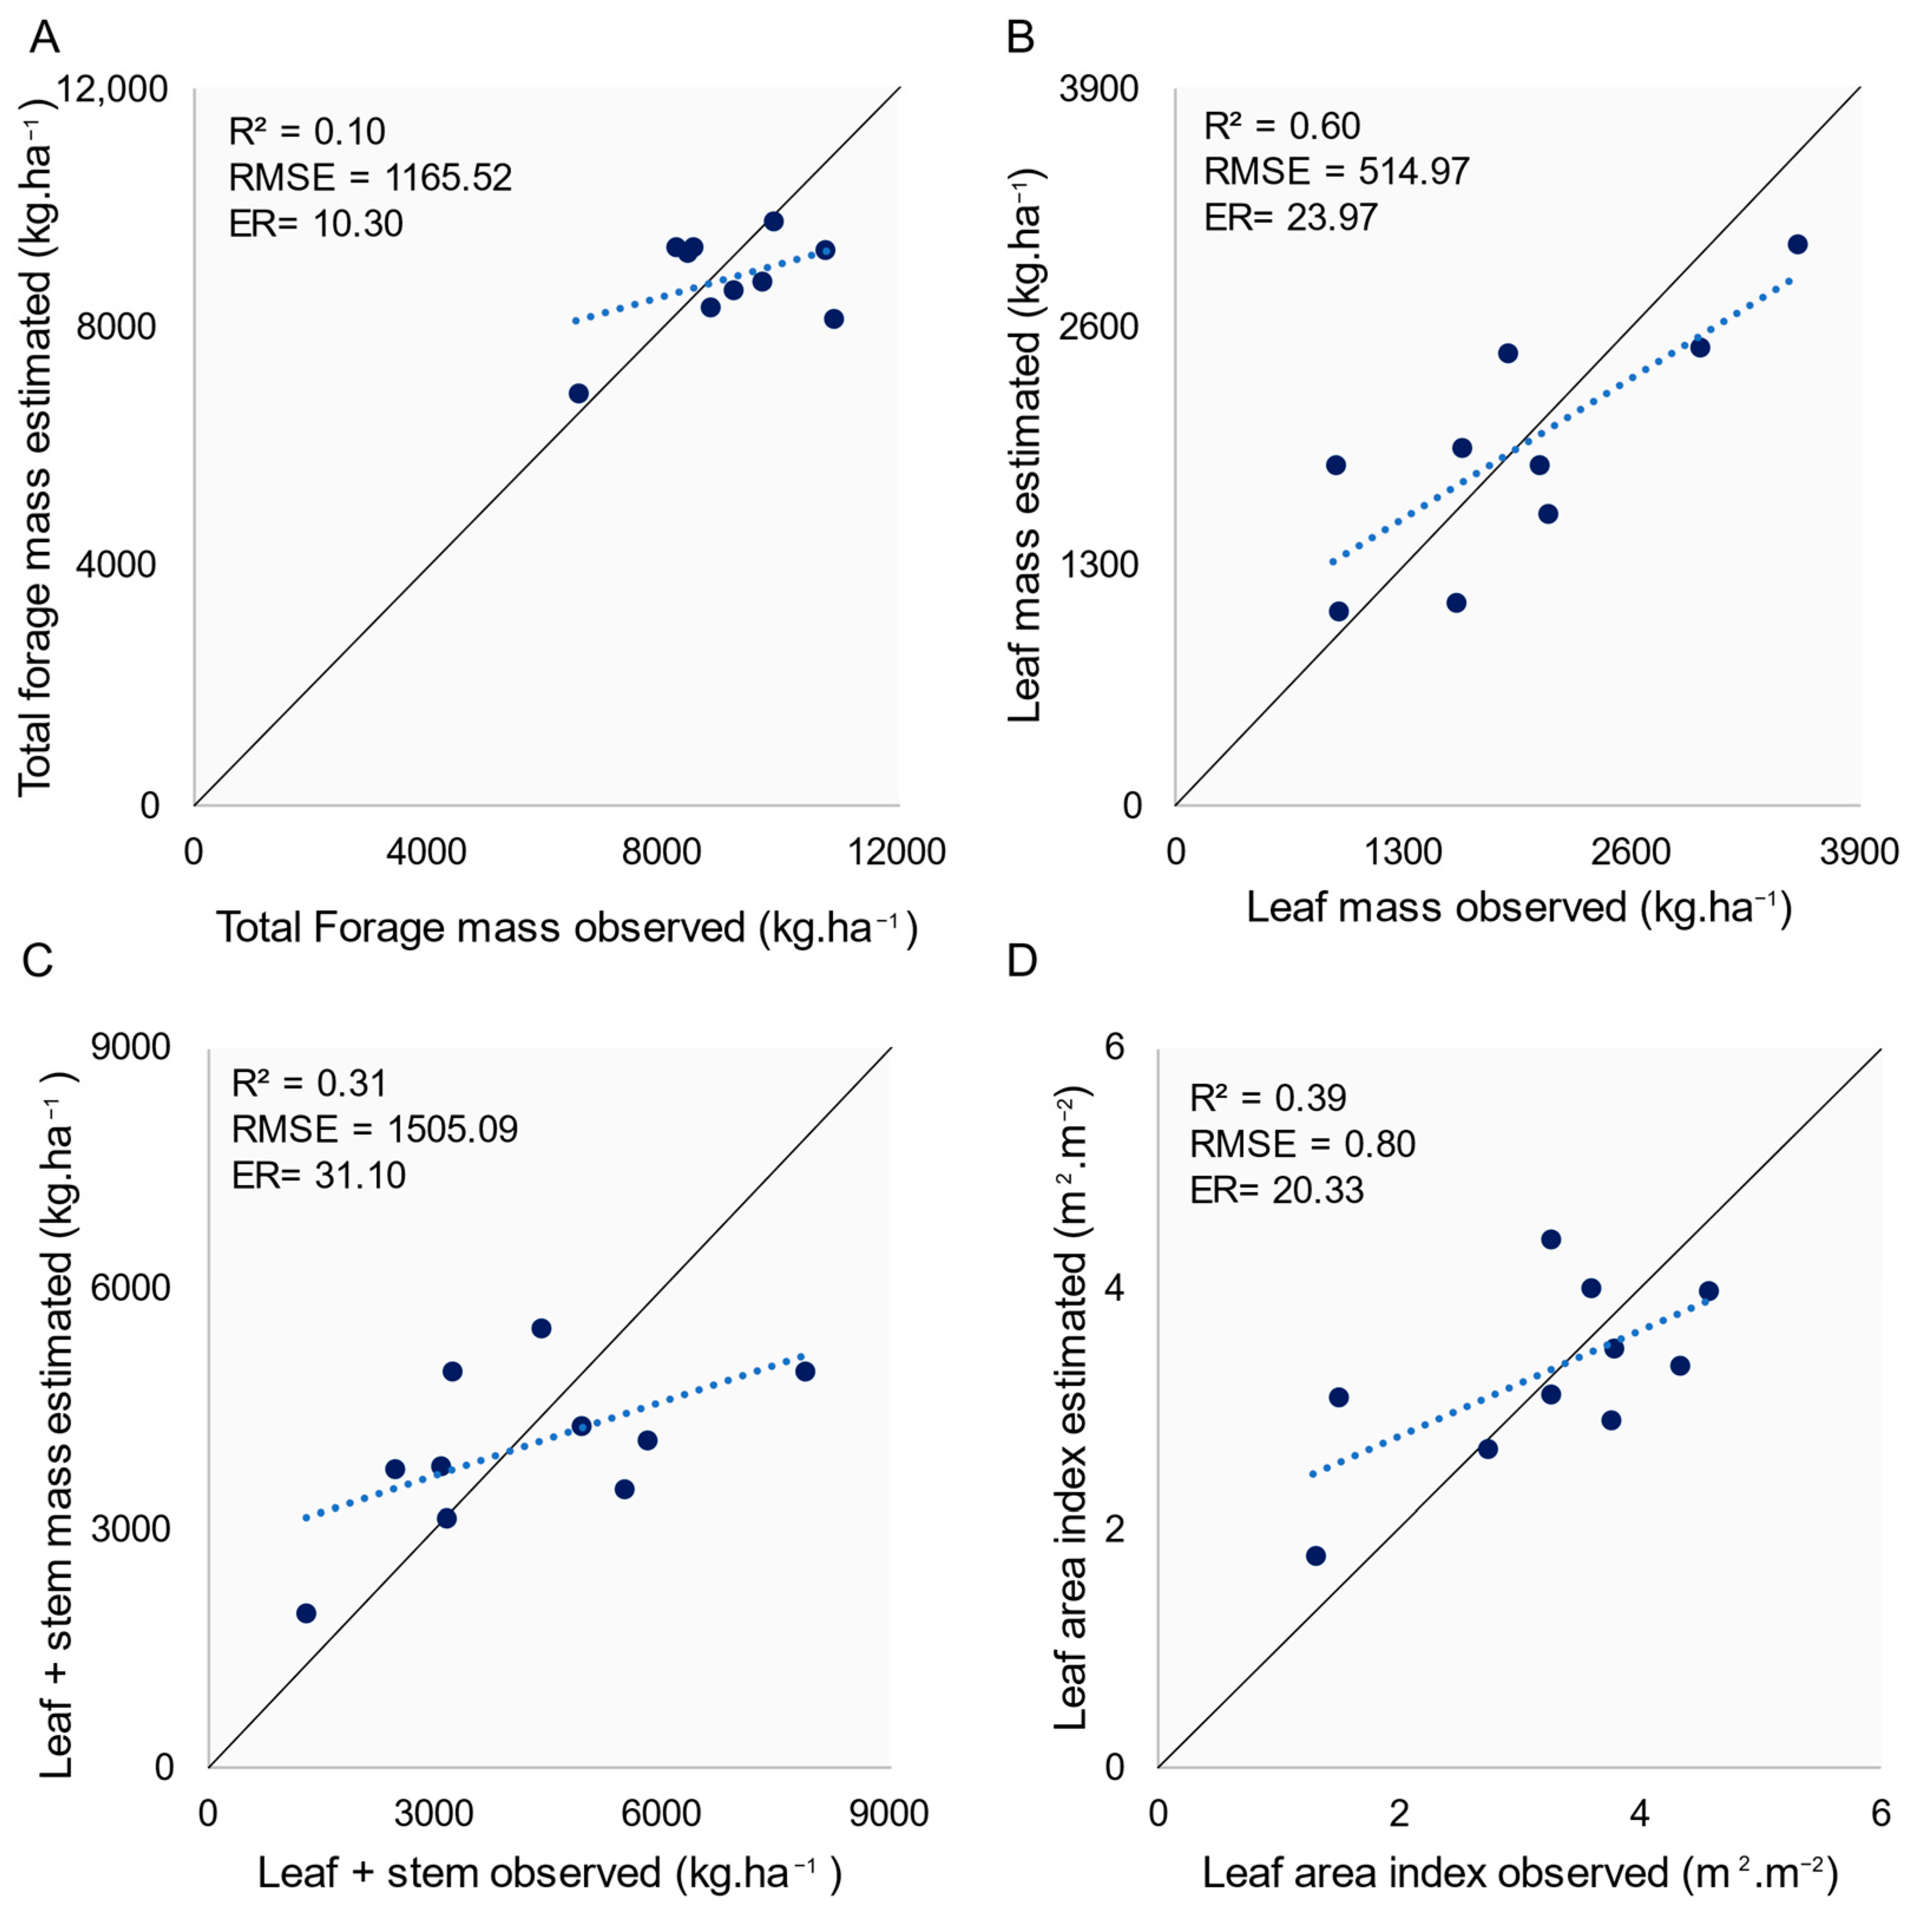
3.4. Evaluation of Linear Regression Models

Fresh mass calculated from SAFER was used to estimate pasture parameters. Figure 9 and Figure 10 show observed and predicted data correlations for the SILV and INT systems, respectively. In SILV, the models showed better performance in relation to INT. The model obtained from the dry mass of leaf and stem (MSfc; Figure 9C) had the adjusted line and prediction values closer to the 1:1 line, with higher precision expressed by R2 of 0.88 and higher accuracy with a relative error of 15.19%. In this model, the RMSE was 290.32 kg ha-1. The SILV3 and SILV1 presented the highest prediction errors and SILV2 the lowest error. The model using dry leaf mass (MSf; Figure 9B) also presented good results, with an R2 of 0.71, nevertheless with an Er of 24.76%.
In the INT, the model with a bigger R2 was the dry mass of leaves (Figure 10B) with an R2 of 0.60. The total dry mass (Figure 10A) generated a model with the best performance, with a relative error of 10.30%. The line that best fitted the 1:1 line was for the dry mass of leaves (Figure 10B).

4. Discussion

The available pasture mass quantity is critical information for determining the animal stocking rate. The most common method for evaluating this variable is to use direct methods based on cutting and weighing the feed [6]. Forage mass estimate at a fine scale, based on field measurements, requires time and is typically geographically limited, and is unlikely to provide representative information for extensive areas [29].
The methodology presented in this work proposed forage mass estimation considering the particularities of two livestock production systems, in which pastures are conducted in intensive and in a silvopastoral system using proximal remote sensing and meteorological data. Initially, obtaining fresh mass from SAFER generated lower results than the total dry mass of samples collected in the field for both systems. However, it managed to express the phenology Urochloa (syn. Brachiaria) brizantha cv. Piat in a promising manner, as demonstrated in Figure 6. These promising results can be attributed to the fact that variables highly associated with plant biochemical processes, such as photosynthetically active radiation, air temperature, reference evapotranspiration, and maximum crop efficiency, in addition to NDVI and albedo, were used as input to SAFER, resulting from the spectral vegetation behavior [12,30].
The SILV model outperformed INT in terms of fresh mass estimation based on in situ pasture characteristics. (Figure 9 and Figure 10). This condition may be associated with higher NDVI variability during the evaluated cycles in shaded forage once linear regression models are more sensitive to large variations. As one of the SAFER input variables, NDVI influences the energy balance and the fresh mass generated from the Monteith equation. In the silvopastoral system, the variability of the dry mass of forage collected in the field is accompanied by NDVI variability (Figure 5). In INT, field dry mass variability is higher than SILV system, as observed by [31]. However, the NDVI showed less variability throughout the cycles. This can be attributed to the NDVI saturation process in the presence of high biomass densities [30,32]. While total DM from 6574.70 to 11,607.35 kg ha−1 in INT was observed, the forage mass in the SILV system ranged from 945.19 to 5626.32 kg ha−1.
The higher proportion of fresh mass can be another factor that may have contributed to more accurate estimation in the SILV system, as seen by a lower difference between the observed total dry mass and the dry mass of leaves and stems. (Figure 7A and Figure 8C), a condition also reported by [33] and [34]. According to [35], the presence of senescent material negatively affects the ratio of vegetation index and biomass, material that is present in higher proportion in the INT system. As the vegetation senescence process affects reflectance at different wavelengths, variations in NDVI can be attributed not only to the amount of forage mass but also to the tissue death process [36,37].
In the SILV system (Figure 9), the fresh mass generated by SAFER and the dry mass of leaves and stems (Msfc) were the parameters that showed the best correlation. In the INT system (Figure 10), despite the total dry mass being higher, the points are concentrated between ~7000 and ~11,000 kg ha−1, which could affect estimates in which the masses were outside this range. The model with the best precision in the system was the one using the leaf dry mass. Defining the animal stocking rate based on these pasture variables is beneficial since it does not consider the dead matter still in the plant, a limiting factor for the quality of forage with lower nutritional value [38].
Fresh mass calculated from SAFER models proved to be suitable for estimating pasture parameters, especially in the SILV system. However, it is expected that the fresh mass estimated by SAFER was higher than the actual drought, the region where the work was carried out, and the crop, as well as the sensor used, may have contributed to these values not being reached by the SAFER model combined with the Monteith Radiation Use Efficiency (RUE) model. SAFER, a model that allows estimation of energy balance parameters, was developed and validated for the Brazilian semiarid region and with Landsat images (TM and ETM sensor), an imaging sensor on board an orbital platform with characteristics different from the CropCircle sensor [12]. The region in which it was developed has higher mean air temperature and lower annual precipitation compared to the municipality of São Carlos, where this work was carried out. These aspects affect evapotranspiration, so the model calibration, specifically the regression coefficients of the evapotranspiration ratio (Equation (11)), for the cerrado region of São Paulo could contribute to better results, as performed by [39] for corn cultivation in the semiarid region of Bahia.
Although it has already been applied to pastures with MODIS images, allowing us to find the forage fresh mass of up to 2500 kg ha−1 month−1 for pastures at different levels of degradation, [13] did not validate the data estimated by SAFER with real field data. Based on what was discussed, this work is of great relevance and innovative character, as it compares the data estimated by SAFER with real data for pasture.
In addition, data from orbital and aerial platforms have already been used as input to the SAFER model, but it was not found in the literature with data from non-imaging and proximal sensors such as CropCircle. As described in the works with orbital images, in which Landsat 8 images used with SAFER allowed the estimation of energy balance variables [40,41]. Ref. [42] observed the successful application of multispectral sensor images on board a remotely piloted aircraft (RPA) to obtain water productivity from SAFER. The characteristics/resolutions of these sensors, as well as the distances from the targets at the time of data acquisition, lead to different results for the same target. In addition, the images used so far are passive and are prone to the influence of the radiation source and atmospheric interference [43]. Although fresh mass values were not reached by SAFER with a proximal sensor consistent with the data collected in the field, it can be said, based on the correlation, that its application was promising, allowing the generation of accurate and precise linear regression models for estimating pasture variables. The silvopastoral system models in the test phase performed better than those reported in the literature, including the application of machine learning [31,44,45].
Ref. [31], when applying proximal remote sensing data to estimate forage mass (leaf + stem), observed models with better performance in the animal production system in the shadow when compared to the full-sun system. Even so, the best R2 found, with MSR vegetation index, was 0.67, with a relative error of 25.9%. By using a model generated from the junction of NDVI and plant height, derived from the LIDAR sensor, [46] obtained more accurate forage estimates than when using models with only the NDVI as input. The combined application of orbital remote sensing data and weather data through artificial neural networks, carried out by [44], proved more promising in forage estimation than only the use of Sentinel-2 data. Based on this, the methodology proposed in this study combines variables that have shown some type of success in forage estimation, proximal remote sensing (NDVI) and meteorological data.
The option for the proximal sensor was made considering the forage disposal in the silvopastoral system. The presence of the arboreal component, in this case, eucalyptus, would influence the pixel reflectance value if satellite images with free access were used, causing spectral mixing between brachiaria and eucalyptus, which would lead to estimation errors. Another important factor is the intention to facilitate the dissemination of the method and make it as usual as possible. By not generating images that require knowledge for processing and interpretation, the application becomes simpler, allowing even fewer technician producers to apply it.

5. Conclusions

This study proposes to evaluate the forage mass estimation methodology in animal production systems using the SAFER model combined with the Montheit radiation use efficiency (RUE) model. In addition, it uses proximal remote sensing data to feed the SAFER model, a situation not observed in the specialized literature so far.
The integration of the SAFER model and the Monteith model allowed us to obtain a fast and promising forage estimation method. The integration of meteorological and remote sensing data, proposed by this model, proved to be efficient in estimating the mass of Urochloa (syn. Brachiaria) brizantha cv. Piatã in the silvopastoral animal production systems and full sun, with better performance in the silvopastoral system. Future works will consider the development of an intuitive application to estimate forage mass with the SAFER model.

Author Contributions

Conceptualization, S.L.H.d.A., S.F.N., J.R.M.P. and A.H.d.C.T.; methodology, S.L.H.d.A.; J.B.C.S., C.B., S.F.N., J.R.M.P. and A.H.d.C.T. software, S.L.H.d.A.; validation, S.L.H.d.A., J.B.C.S.; formal analysis, S.L.H.d.A. and J.B.C.S.; investigation, S.L.H.d.A.; data curation, S.L.H.d.A.; writing—original draft preparation, S.L.H.d.A.; writing—review and editing, S.L.H.d.A., J.B.C.S., M.A., G.B., R.P.d.S.; visualization, S.L.H.d.A.; supervision, R.P.d.S., S.F.N., J.R.M.P. and A.H.d.C.T., C.Z.; project administration, R.P.d.S. and S.F.N.; funding acquisition, R.P.d.S., A.C.d.C.B. and J.R.M.P. All authors have read and agreed to the published version of the manuscript.

Funding

This research was funded by Animal production in the future: tools to support decision making in pasture management and transfer of technology (PecFuturo) grant number [22.16.05.021.00.00], the Sustainable Rural Project – Cerrado, the Coordination of Superior Level Staff Improvement (CAPES), and The National Council for Scientific and Technological Development (CNPq).

Data Availability Statement

Not applicable.

Acknowledgments

The authors are thankful to the Sustainable Rural Project, Cerrado, a partnership between IDB, the United Kingdom Government, the Brazilian Ministry of Agriculture, Livestock and Supply, IABS and the ICLF Network Association through Embrapa. Also, to the Coordination of Superior Level Staff Improvement (CAPES) and The National Council for Scientific and Technological Development (CNPq).

Conflicts of Interest

The authors declare that they have no known competing financial interest or personal relationships that could have appeared to influence the work reported in this paper.

References

  1. Torres, F.N.; Richter, R.; Vohland, M. A multisensoral approach for high-resolution land cover and pasture degradation mapping in the humid tropics: A case study of the fragmented landscape of Rio de Janeiro. Int. J. Appl. Earth Obs. Geoinf. 2019, 78, 189–201. [Google Scholar]
  2. Nesper, M.; Bünemann, E.K.; Fonte, S.J.; Rao, I.M.; Velásquez, J.E.; Ramirez, B.; Hegglin, D.; Frosard, E.; Oberson, A. Pasture degradation decreases organic P content of tropical soils due to soil structural decline. Geoderma 2015, 257–258, 123–133. [Google Scholar] [CrossRef]
  3. Almeida, C.A.; de Coutinho, A.C.; Esquerdo, J.C.D.M.; Adami, M.; Venturieri, A.; Diniz, C.G.; Dessay, N.; Duriex, L.; Gomes, A.R. High spatial resolution land use and land cover mapping of the Brazilian Legal Amazon in 2008 using Landsat-5/TM and MODIS data. Acta Amaz. 2016, 46, 291–302. [Google Scholar] [CrossRef]
  4. Wilm, H.G.; Costello, D.F.; Klipple, G.E. Estimating forage yield by the doublesampling method. J. Am. Soc. Agron. 1944, 36, 194–203. [Google Scholar] [CrossRef] [Green Version]
  5. Schmer, M.R.; Mitchell, R.B.; Vogel, K.P.; Schacht, W.H.; Marx, D.B. Efficient Methods of Estimating Switchgrass Biomass Supplies. BioEnergy Res. 2010, 3, 243–250. [Google Scholar] [CrossRef] [Green Version]
  6. Sanderson, M.A.; Rotz, C.A.; Fultz, S.W.; Rayburn, E.B. Estimating forage ass with a commercial capacitance meter, rising plate meter, and pasture ruler. Agron. J. 2001, 93, 1281–1286. [Google Scholar] [CrossRef] [Green Version]
  7. Dufloth, J.H.; Back, A.J.; Passos, R. Estimativa da produção de pasto através de dois métodos indiretos: Régua (altura) e Disco Medidor (densidade). Agropecuária Catarin. 2015, 28, 83–86. [Google Scholar]
  8. Reinermann, S.; Asam, S.; Kuenzer, C. Remote Sensing of Grassland Production and Management—A Review. Remote Sens. 2020, 12, 1949. [Google Scholar] [CrossRef]
  9. Dias Filho, M.B. Degradação de Pastagens: Processos, Causas e Estratégias de Recuperação. MBDF 2011, 4, 204. [Google Scholar]
  10. Alves, B.J.R.; Madari, B.E.; Boddey, R.M. Integrated crop–Livestock–Forestry systems: Prospects for a sustainable agricultural intensification. Nutr. Cycl. Agroecosystems 2017, 108, 1–4. [Google Scholar] [CrossRef]
  11. Martha, G.B.; Alves, E.; Contini, E. Land-saving approaches and beef production growth in Brazil. Agric. Syst. 2012, 110, 173–177. [Google Scholar] [CrossRef] [Green Version]
  12. Teixeira, A.H.C.; Scherer-Warren, M.; Hernandez, F.B.T.; Andrade, R.G.; Leivas, J.F. Large-Scale Water Productivity Assessments with MODIS Images in a Changing Semi-Arid Environment: A Brazilian Case Study. Remote Sens. 2013, 5, 5783–5804. [Google Scholar] [CrossRef] [Green Version]
  13. Andrade, R.G.; Teixeira, A.H.D.C.; Leivas, J.F.; Nogueira, S.F. Analysis of evapotranspiration and biomass in pastures with degradation indicatives in the Upper Tocantins River Basin, in Brazilian Savanna. Rev. Ceres 2016, 63, 754–760. [Google Scholar] [CrossRef]
  14. Andrade, R.G.; Teixeira, A.D.C.; Leivas, J.F.; Nogueira, S.F.; Da Silva, G.B.S.; Victoria, D.D.C.; Facco, A.G. Estimativa da evapotranspiração e da biomassa de pastagens utilizando o algoritmo SAFER e imagens MODIS. In Proceedings of the Anais XVII Simpósio Brasileiro de Sensoriamento Remoto—SBSR, João Pessoa-PB, Brasil, 25–29 April 2015. [Google Scholar]
  15. Santos, R.A.; Venancio, L.P.; Filgueiras, R.; Cunha, F.F. Remote sensing as a tool to determine biophysical parameters of irrigated seed corn crop. Semin. Ciências Agrárias 2020, 41, 435–446. [Google Scholar] [CrossRef]
  16. Bayma-Silva, G.; Teixeira, A.H.C.; Victoria, D.C.; Nogueira, S.F.; Leivas, J.F.; Coaguila, D.N.; Herling, V.R. Energy balance model applied to pasture experimental areas in São Paulo State, Brazil. In Remote Sensing for Agriculture, Ecosystems, and Hydrology, 18; Proceedings of the SPIE, 2016, Edinburg, UK, 26–29 September 2016; Proceedings of the SPIE: Edinburgh, UK; Volume 9998, pp. 99981C-1–99981C-10.
  17. Numata, I.; Roberts, D.A.; Chadwick, O.A.; Schimel, J.; Sampaio, F.R.; Leonidas, F.C.; Soares, J.V. Characterization of pasture biophysical properties and the impact of grazing intensity using remotely sensed data. Remote Sens. Environ. 2007, 109, 314–327. [Google Scholar] [CrossRef]
  18. Teixeira, A.H.C.; Hernandez, F.B.T.; Scherer-Warren, M.; Andrade, R.G.; Leivas, J.F.; Victoria, D.C.; Bolfe, E.L.; Thenkabail, P.S.; Franco, R.A.M. Water productivity studies from earth observation data: Characterization, modeling, and mapping water use and water productivity. In Remote sensing of water Resources, disasters, and urban Studies; Thenkabail, P.S., Ed.; Taylor & Francis Group 1: Abingdon, UK, 2015; pp. 107–137. [Google Scholar]
  19. Alvares, C.A.; Stape, J.L.; Sentelhas, P.C.; Gonçalves, J.L.M.; Sparovek, G. Köppen’s climate classification map for Brazil. Meteorol. Z. 2013, 22, 711–728. [Google Scholar] [CrossRef] [PubMed]
  20. Calderano Filho, B.; Santos, H.D.S.; da Fonseca, O.O.M.; Primavesi, O.; Primavesi, A.C. Os solos da Fazenda Canchim, Centro de pesquisa de Pecuária do Sudeste, São Carlos, SP: Levantamento Semidetalhado, Propriedade e Potenciais; Embrapa—CNPS. Boletim de Pesquisa, 7 e Embrapa—CPPSE. Boletim de Pesquisa, 2; Embrapa: Rio de Janeiro/São Carlos, Brazil, 1998. [Google Scholar]
  21. Silva, Y.D.F.D. Uso do Algoritmo SAFER para Evapotranspiração real na Cultura da Soja. Master’s Thesis, Universidade Estadual Paulista “Júlio de Mesquita Filho”, Jaboticabal, Brazil, 2018; 57p. [Google Scholar]
  22. Teixeira, A.H.C. Modelling Evapotranspiration by Remote Sensing Parameters and Agrometeorological Stations. In Remote Sensing and Hydrology; Neale, C.M.U., Cosh, M.H., Eds.; IAHS Publ. 352; IAHS: Wallingford, UK, 2012; pp. 154–157. [Google Scholar]
  23. Teixeira, A.H.C.; Leivas, J.F.; Hernandez, F.B.T.; Franco, R.A.M. Large-scale radiation and energy balances with Landsat 8 images and agrometeorological data in the Brazilian semiarid region. J. Appl. Remote Sens. 2017, 11, 016030. [Google Scholar] [CrossRef]
  24. Rouse, J.W.; Haas, R.H.; Schell, J.A.; Deering, D.W. Monitoring vegetation systems in the great plains with ERTS. In Proceedings of the Earth Resources Technology Satellite-1 Symposium, 3, Washington, DC, USA, 10–14 December 1973; NASA, Goddard Space Flight Center: Greenbelt, MD, USA, 1973; Volume 1, pp. 309–317. [Google Scholar]
  25. Teixeira, A.D.C.; Bastiaanssen, W.G.; Moura, M.S.B.; Soares, J.M.; Ahmad, M.U.D.; Bos, M.G. Energy and water balance measurements for water productivity analysis in irrigated mango trees, Northeast Brazil. Agric. For. Meteorol. 2008, 148, 1524–1537. [Google Scholar] [CrossRef] [Green Version]
  26. Monteith, J.L. Solar radiation and productivity in tropical ecosystems. J. Appl. Ecol. 1972, 9, 747–766. [Google Scholar] [CrossRef] [Green Version]
  27. Teixeira, A.H.C.; Simão, F.R.; Leivas, J.F.; Gomide, R.L.; Reis, J.B.D.S.; Kobayashi, M.K.; Oliveira, F.G. Water Productivity Modeling by Remote Sensing in the Semiarid Region of Minas Gerais State, Brazil. In Arid Environments and Sustainability; Arman, H., Yuksel, I., Eds.; IntechOpen: London, UK, 2018; pp. 94–108. [Google Scholar]
  28. Bosi, C.; Sentelhas, P.C.; Huth, N.I.; Pezzopane, J.R.M.; Andreucci, M.P.; Santos, P.M. APSIM-tropical pasture: A model for simulating perennial tropical grass growth and its parameterisation for palisade grass (Brachiaria brizantha). Agric. Syst. 2020, 184, 102917. [Google Scholar] [CrossRef]
  29. Legg, M.; Bradley, S. Ultrasonic Proximal Sensing of Pasture Biomass. Remote Sens. 2019, 11, 2459. [Google Scholar] [CrossRef] [Green Version]
  30. Carneiro, F.M.; Furlani, C.E.A.; Zerbato, C.; de Menezes, P.C.; da Silva Gírio, L.A.; Oliveira, M.F. Comparison between vegetation indices for detecting spatial and temporal variabilities in soybean crop using canopy sensors. Precis. Agric. 2019, 21, 979–1007. [Google Scholar] [CrossRef]
  31. Pezzopane, J.R.M.; Bernardi, A.C.C.; Bosi Crippa, P.H.; Santos, P.M.; Nardachione, E.C. Assessment of Piatã palisadegrass forage mass in integrated livestock production systems using a proximal canopy reflectance sensor. Eur. J. Agron. 2019, 103, 130–139. [Google Scholar] [CrossRef]
  32. Mutanga, O.; Skidmore, A.K. Narrow band vegetation indices overcome the saturation problem in biomass estimation. Int. J. Remote Sens. 2004, 25, 3999–4014. [Google Scholar] [CrossRef]
  33. Paciullo, D.S.C.; Gomide, C.A.M.; Castro, C.R.T.D.; Fernandes, P.B.; Müller, M.D.; Pires, M.F.Á.; Fernandes, E.M.; Xavier, D.F. Características produtivas e nutricionais do pasto em sistema agrossilvipastoril, conforme a distância das árvores. Pesqui. Agropecuária Bras. 2011, 46, 1176–1183. [Google Scholar] [CrossRef] [Green Version]
  34. Pezzopane, J.R.M.; Bernardi, A.C.C.; Bosi, C.; Oliveira, P.P.A.; Marconato, M.H.; Pedroso, A.F.; Esteves, S.N. Forage productivity and nutritive value during pasture renovation in silvopastoral systems. Agroforest. Syst. 2017, 93, 39–49. [Google Scholar] [CrossRef]
  35. Barnes, P.; Wilson, B.R.; Reid, N.; Bayerlein, L.; Koen, T.B.; Olupot, G. Examining the impact of shade on above-ground biomass and normalized difference vegetation index of C3 and C4 grass species in North-Western NSW, Australia. Grass Forage Sci. 2014, 70, 324–334. [Google Scholar] [CrossRef]
  36. Di Bella, C.M.; Paruelo, J.M.; Becerra, J.E.; Bacour, C.; Baret, F. Effect of senescent leaves on NDVI-based estimates of fAPAR: Experimental and modelling evidences. Int. J. Remote Sens. 2004, 25, 5415–5427. [Google Scholar] [CrossRef]
  37. Van Leeuwen, W.J.D.; Huete, A.R. Effects of standing litter on the biophysical interpretation of plant canopies with spectral indices. Remote Sens. Environ. 1996, 55, 123–138. [Google Scholar] [CrossRef]
  38. Pullanagari, R.R.; Kereszturi, G.; Yule, I.J. Quantification of dead vegetation fraction in mixed pastures using aisafenix imaging spectroscopy data. Int. J. Appl. Earth Obs. Geoinf. 2017, 58, 26–35. [Google Scholar] [CrossRef]
  39. Venancio, L.P.; Mantovani, E.C.; Amaral, C.H.D.; Neale, C.M.U.; Filgueiras, R.; Gonçalves, I.Z.; Cunha, F.F.D. Evapotranspiration mapping of commercial corn fields in Brazil using SAFER algorithm. Sci. Agric. 2020, 78, e20190261. [Google Scholar] [CrossRef]
  40. Dehziari, S.A.; Sanaienejad, S.H. Energy balance quantification using Landsat 8 images and SAFER algorithm in Mashhad, Razavi Khorasan, Iran. J. Appl. Remote Sens. 2019, 13, 014528. [Google Scholar] [CrossRef]
  41. Teixeira, A.; Leivas, J.; Struiving, T.; Reis, J.; Simão, F. Energy balance and irrigation performance assessments in lemon orchards by applying the SAFER algorithm to Landsat 8 images. Agric. Water Manag. 2021, 247, 106725. [Google Scholar] [CrossRef]
  42. Teixeira, A.; Pacheco, E.; Silva, C.; Dompieri, M.; Leivas, J. SAFER applications for water productivity assessments with aerial camera onboard a remotely piloted aircraft (RPA). A rainfed corn study in Northeast Brazil. Remote Sens. Appl. Soc. Environ. 2021, 22, 100514. [Google Scholar] [CrossRef]
  43. Jorge, D.; Barbosa, C.; De Carvalho, L.; Affonso, A.; Lobo, F.; Novo, E. SNR (signal-to-noise ratio) impact on water constituent retrieval from simulated images of optically complex Amazon lakes. Remote Sens. 2017, 9, 644. [Google Scholar] [CrossRef] [Green Version]
  44. Chen, Y.; Guerschman, J.; Shendryk, Y.; Henry, D.; Harrison, M.T. Estimating Pasture Biomass Using Sentinel-2 Imagery and Machine Learning. Remote Sens. 2021, 13, 603. [Google Scholar] [CrossRef]
  45. Bispo, P.d.C.; Rodríguez-Veiga, P.; Zimbres, B.; do Couto de Miranda, S.; Henrique Giusti Cezare, C.; Fleming, S.; Baldacchino, F.; Louis, V.; Rains, D.; Garcia, M.; et al. Woody Aboveground Biomass Mapping of the Brazilian Savanna with a Multi-Sensor and Machine Learning Approach. Remote Sens. 2020, 12, 2685. [Google Scholar] [CrossRef]
  46. Schaefer, M.T.; Lamb, D.W. A Combination of Plant NDVI and LiDAR Measurements Improve the Estimation of Pasture Biomass in Tall Fescue (Festuca arundinacea var. Fletcher). Remote Sens. 2016, 8, 109. [Google Scholar] [CrossRef]
Figure 1. Use of orbital and proximal remote sensing in silvopastoral systems.
Remotesensing 15 00815 g001
Figure 2. Experimental area (in yellow) with the sampling strategy for the silvopastoral systems (SILV), with different shading levels, and full sun (INT)-Fazenda Canchim, the research center of Embrapa Pecuária Sudeste, São Carlos, SP, Brazil.
Remotesensing 15 00815 g002
Figure 3. Schematic model of data collection, with the meteorological data collected daily and the spectral data at three moments of the cycle.
Remotesensing 15 00815 g003
Figure 4. Meterorological parameters from 3 September 2015 to 19 January 2016 São Carlos, SP, Brazil. (A) mean air temperature (°C) and precipitation (mm/day). (B) photosynthetically active radiation (PAR; MJm−2d−1).
Remotesensing 15 00815 g004
Figure 5. NDVI boxplots at four levels of shading of SILV (SILV1 to SILV4) and INT for the four evaluated forage cycles.
Remotesensing 15 00815 g005
Figure 6. SAFER estimated fresh mass (MF) and in situ pasture variables correlogram (total dry mass: MSt; dry leaf mass: MSf; leaf and stem dry mass: MSfc; and leaf area index: LAI). (A) SILV; (B) INT. ** = Spearman significant correlation at 0.01.
Remotesensing 15 00815 g006
Figure 7. SAFER estimated fresh mass (MF) and the Piatã grass pasture variables linear regression in the SILV system. (A) total dry mass (MSt); (B) dry mass of leaves (MSf); (C) leaf and stem dry mass (MSfc); (D) leaf area index (LAI).
Remotesensing 15 00815 g007
Figure 8. SAFER estimated fresh mass (MF) and of Piatã grass pasture variables linear regression in the INT system. (A) total dry mass (MSt); (B) dry mass of leaves (MSf); (C) leaf and stem dry mass (MSfc); (D) leaf area index (LAI).
Remotesensing 15 00815 g008
Figure 9. Observed and estimated variables linear regression of Piatã grass pasture in the SILV. (A) total dry mass (MSt); (B) dry mass of leaves (MSf); (C) leaf and stem dry mass (MSfc); (D) leaf area index (LAI).
Remotesensing 15 00815 g009
Figure 10. Observed and estimated variables linear regression of Piatã grass pasture in the INT. (A) total dry mass (MSt); (B) dry mass of leaves (MSf); (C) leaf and stem dry mass (MSfc); (D) leaf area index (LAI).
Remotesensing 15 00815 g010
Disclaimer/Publisher’s Note: The statements, opinions and data contained in all publications are solely those of the individual author(s) and contributor(s) and not of MDPI and/or the editor(s). MDPI and/or the editor(s) disclaim responsibility for any injury to people or property resulting from any ideas, methods, instructions or products referred to in the content.

