
Landslides Detection and Mapping with an Advanced Multi-Temporal Satellite Optical Technique
 ,
,  , , , and
Abstract
:
1. Introduction
2. Materials and Methods
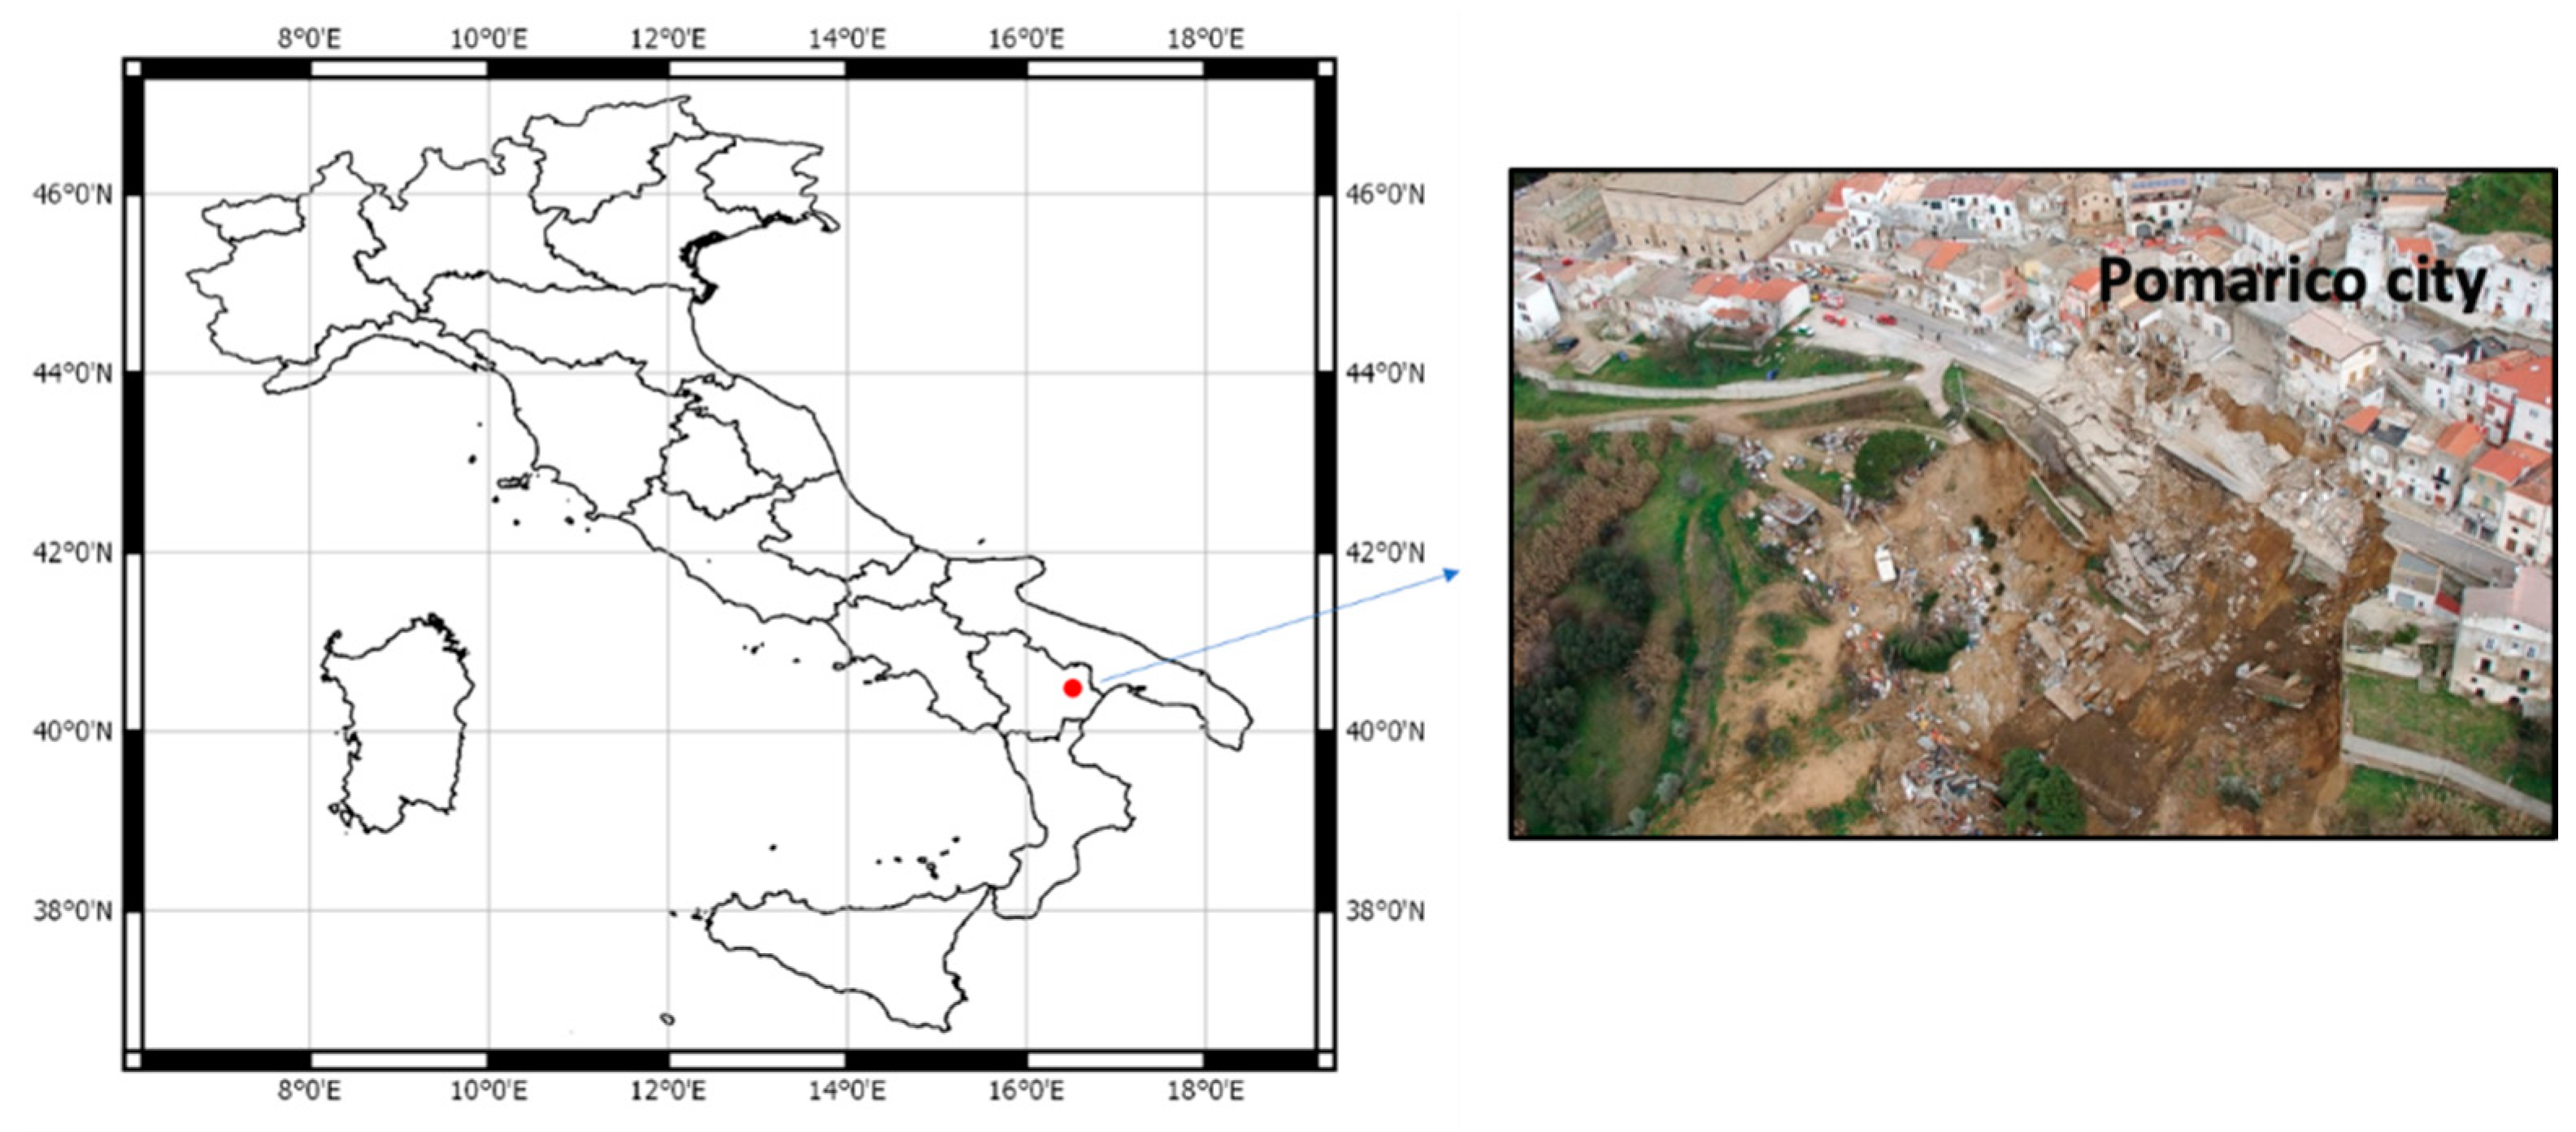
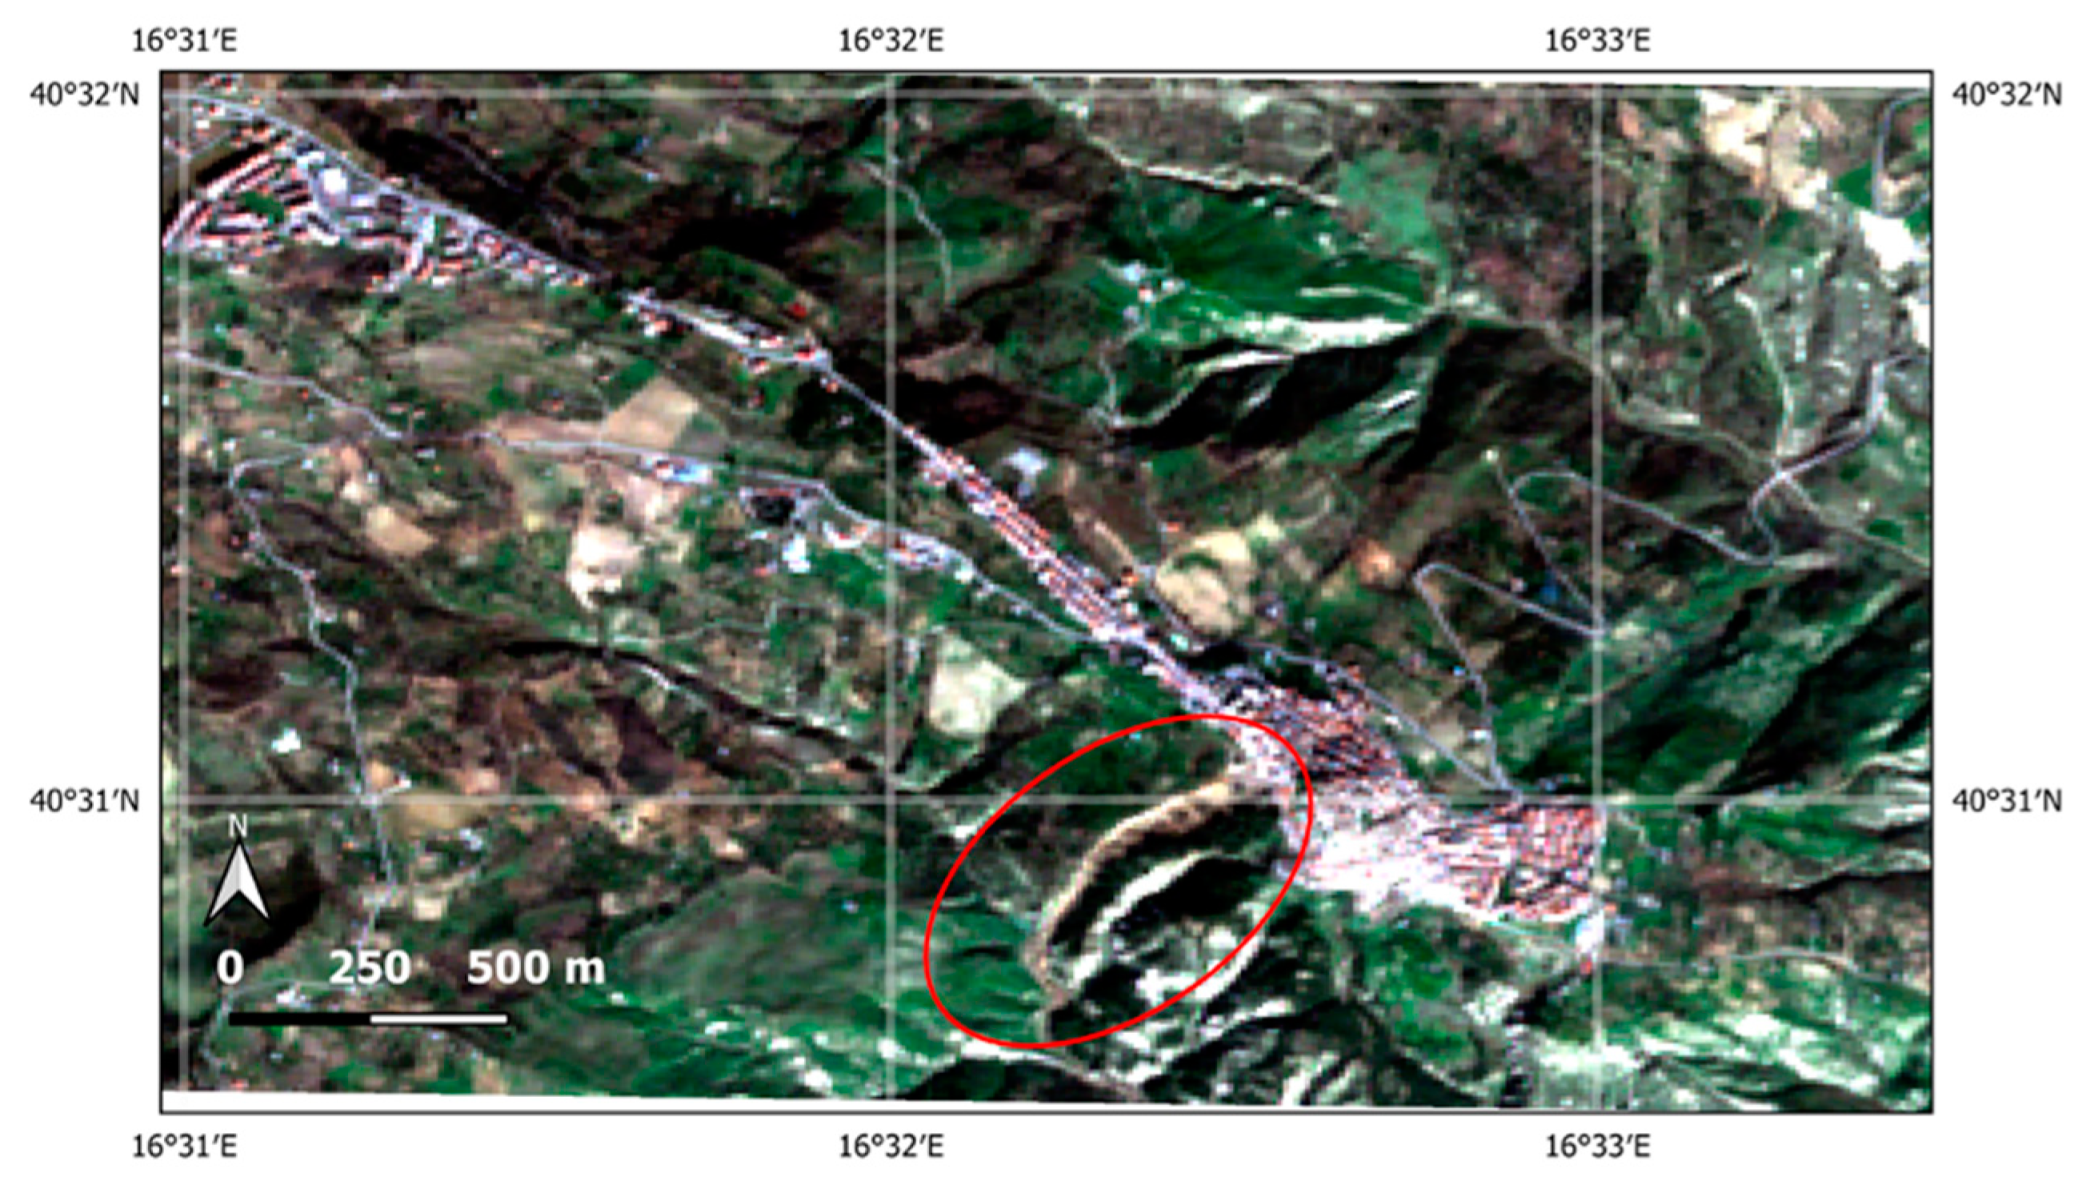
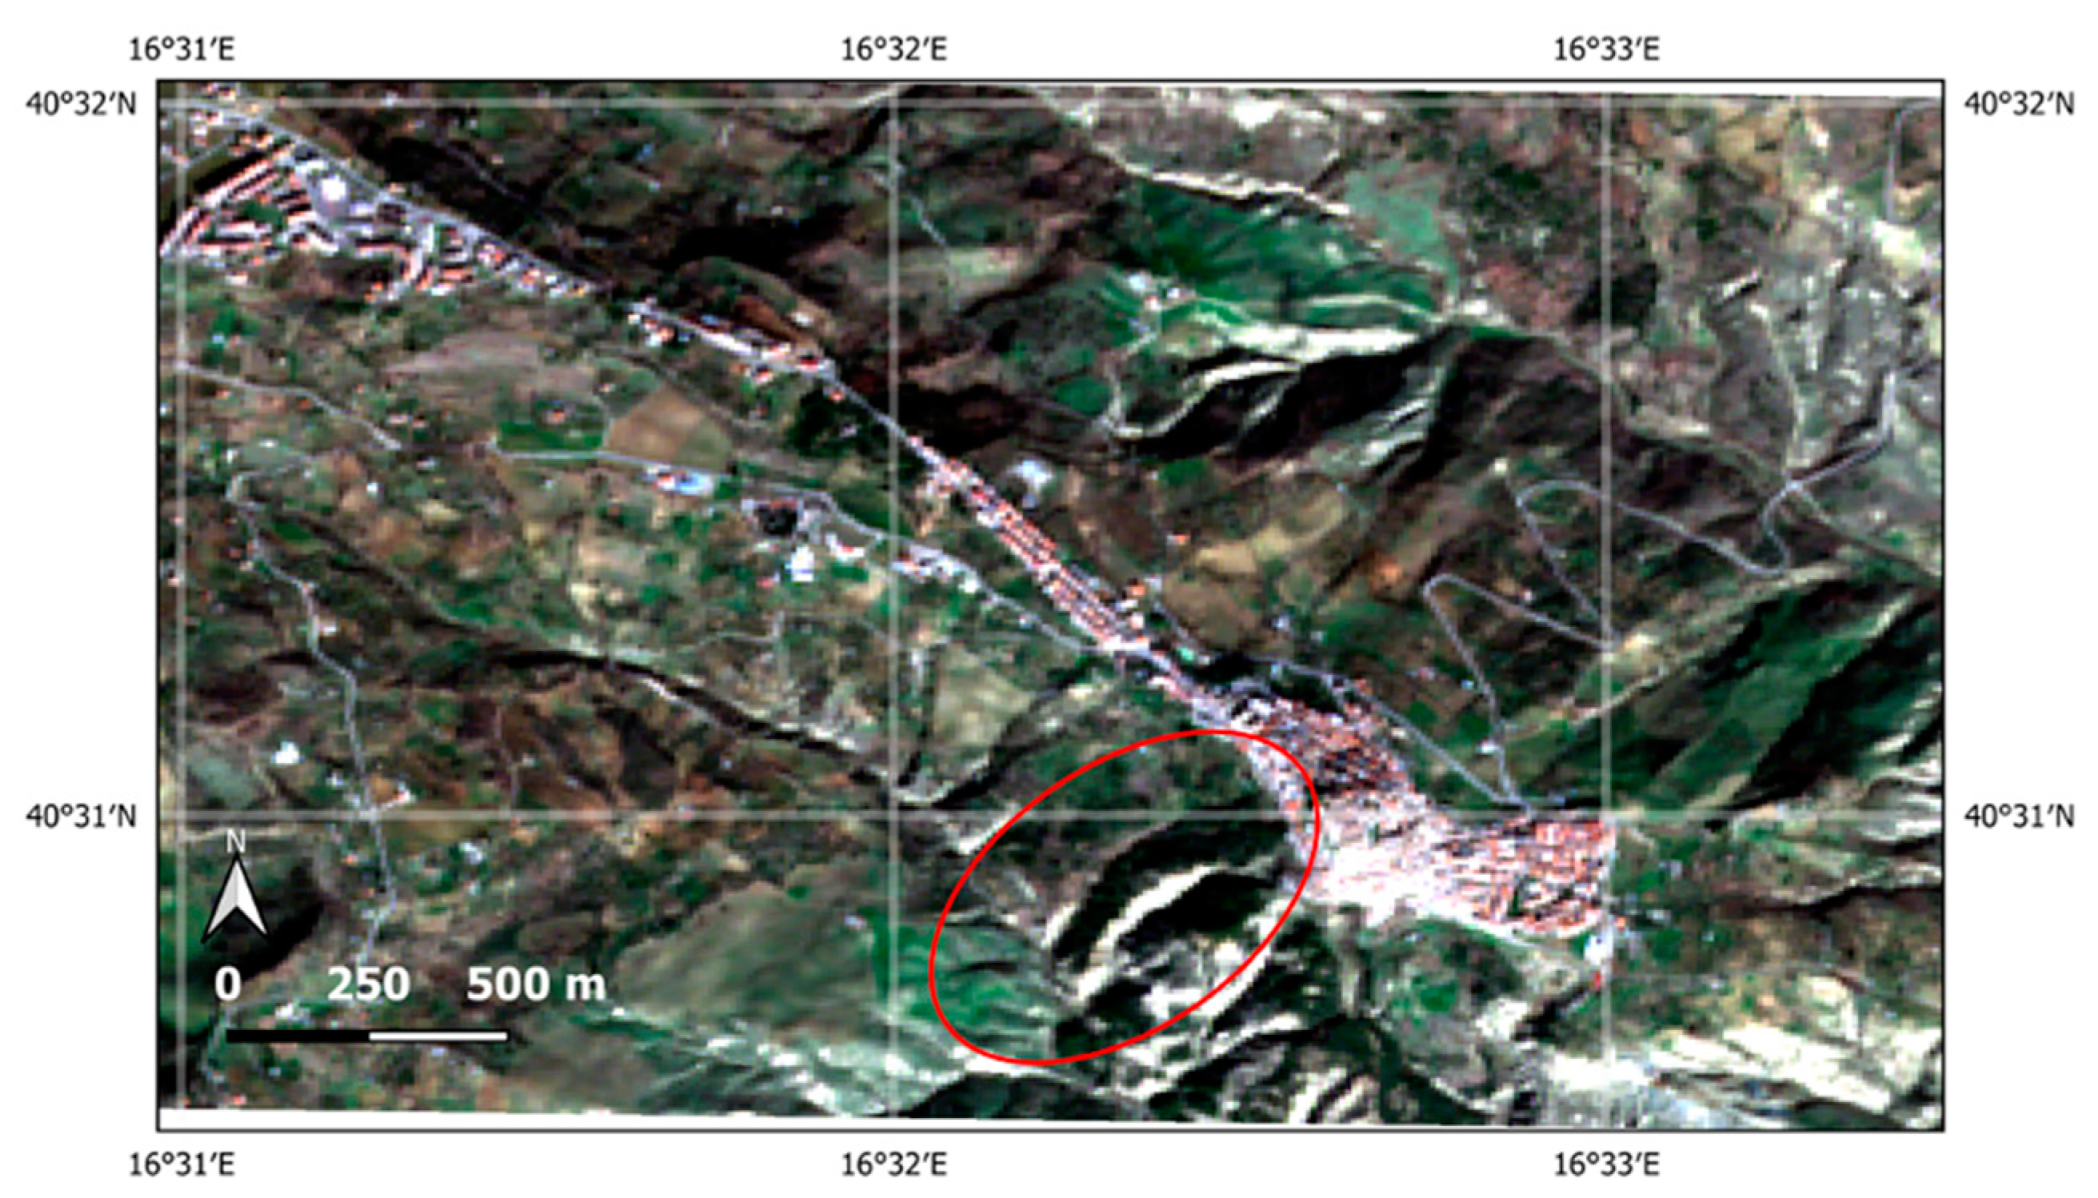
2.1. The Study Case
2.2. Data and Processing
2.2.1. Data
- ₋
- spatial subset on the area of interest;
- ₋
- temporal subset on the collection images to select the useful one/ones;
- ₋
- spectral subset for the bands useful for NDVI calculation (VIS: band 4, 0.6 μm; NIR: band 8, 0.8 μm);
- ₋
- NDVI estimation;
- ₋
- cloud detection using the bitmask band QA60, associated with each Sentinel-2 image within the considered collection, providing cloud mask information. Only clear sky pixels (i.e., with QA60 = 0) were considered in the following analyses;
- ₋
- computation of the change detection index here proposed and presented in the following section.
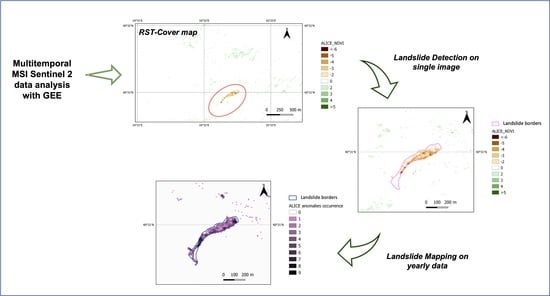
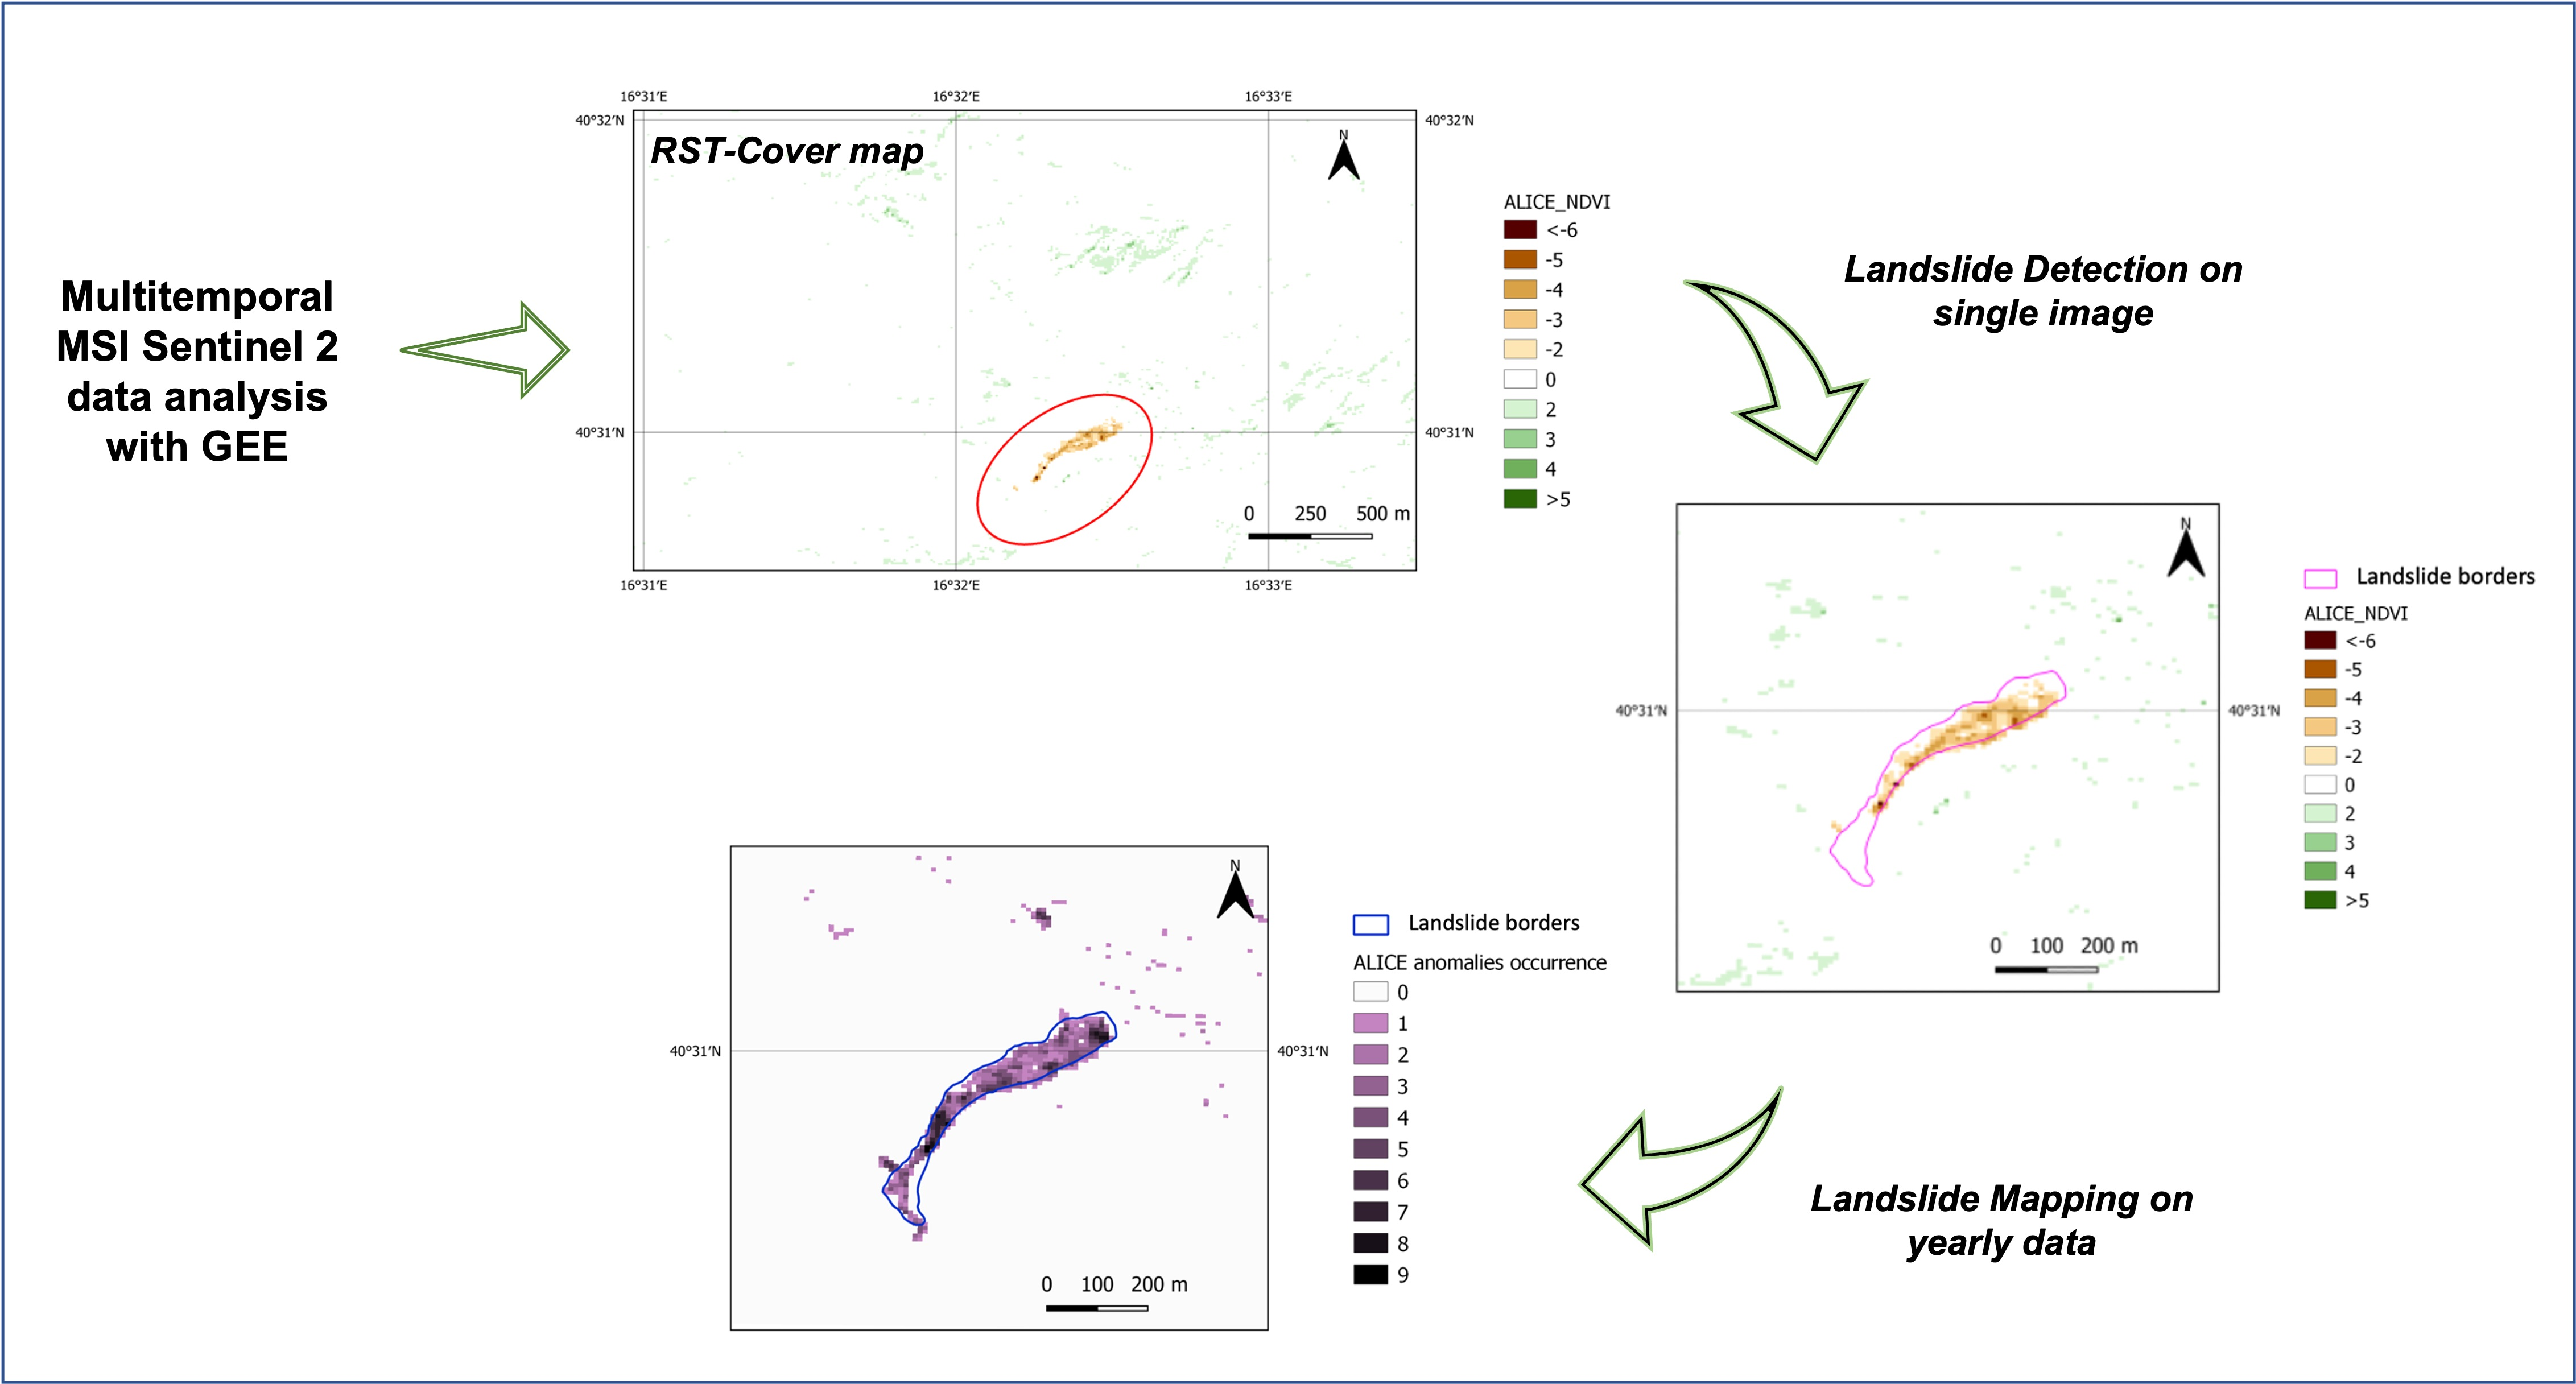
2.2.2. RST-Cover
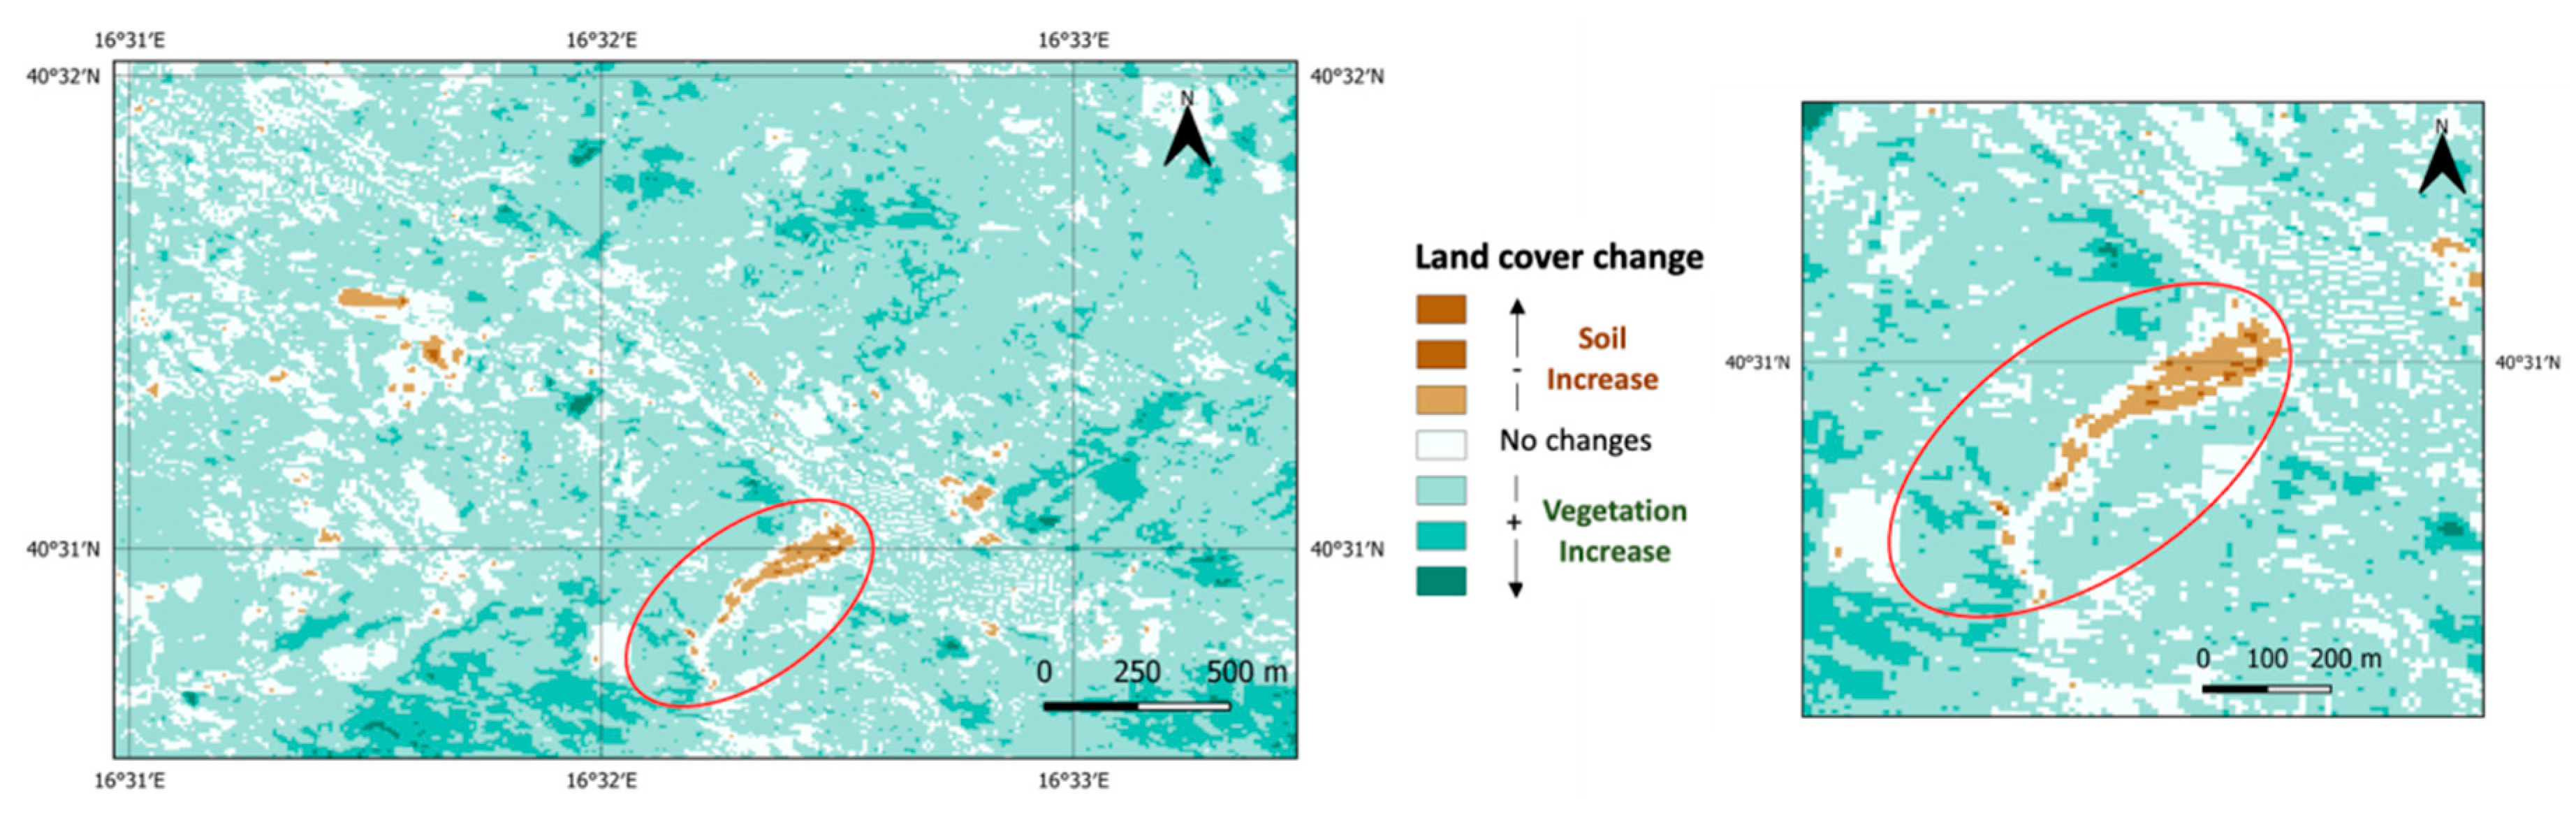
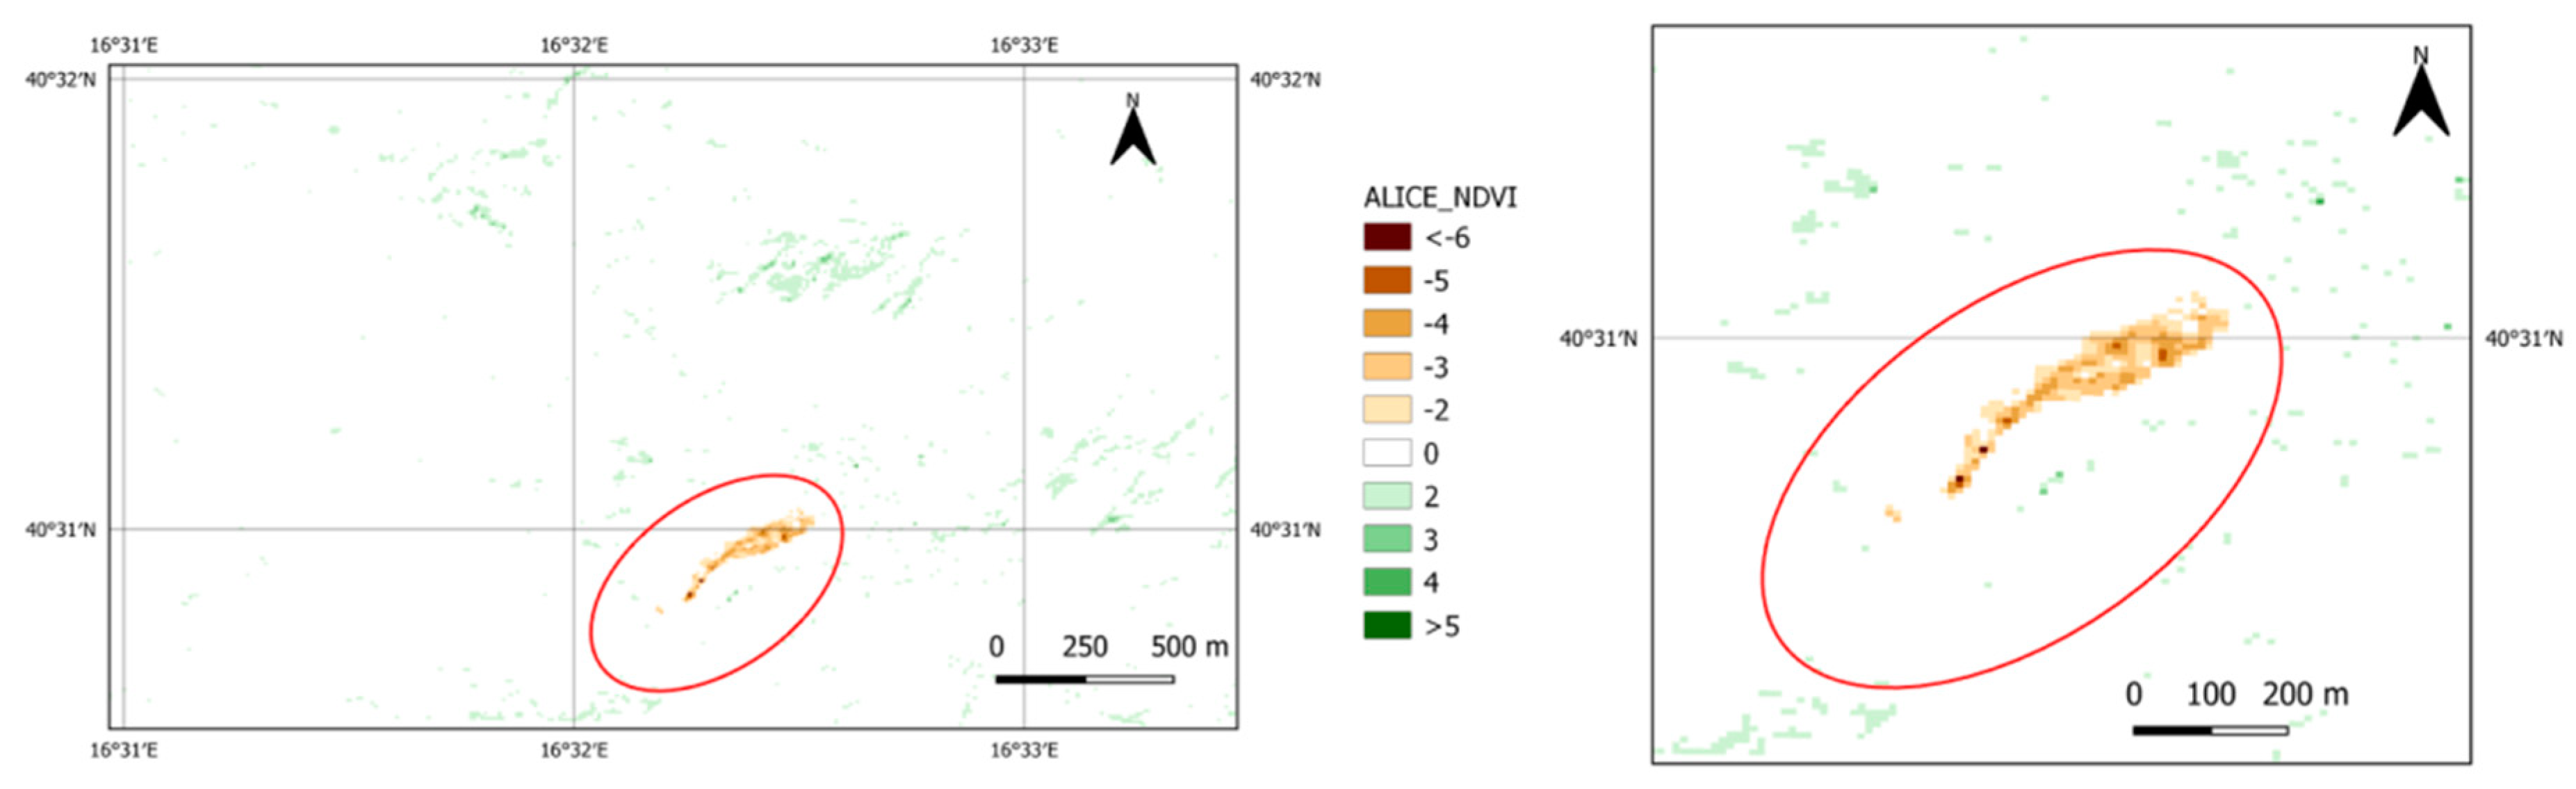
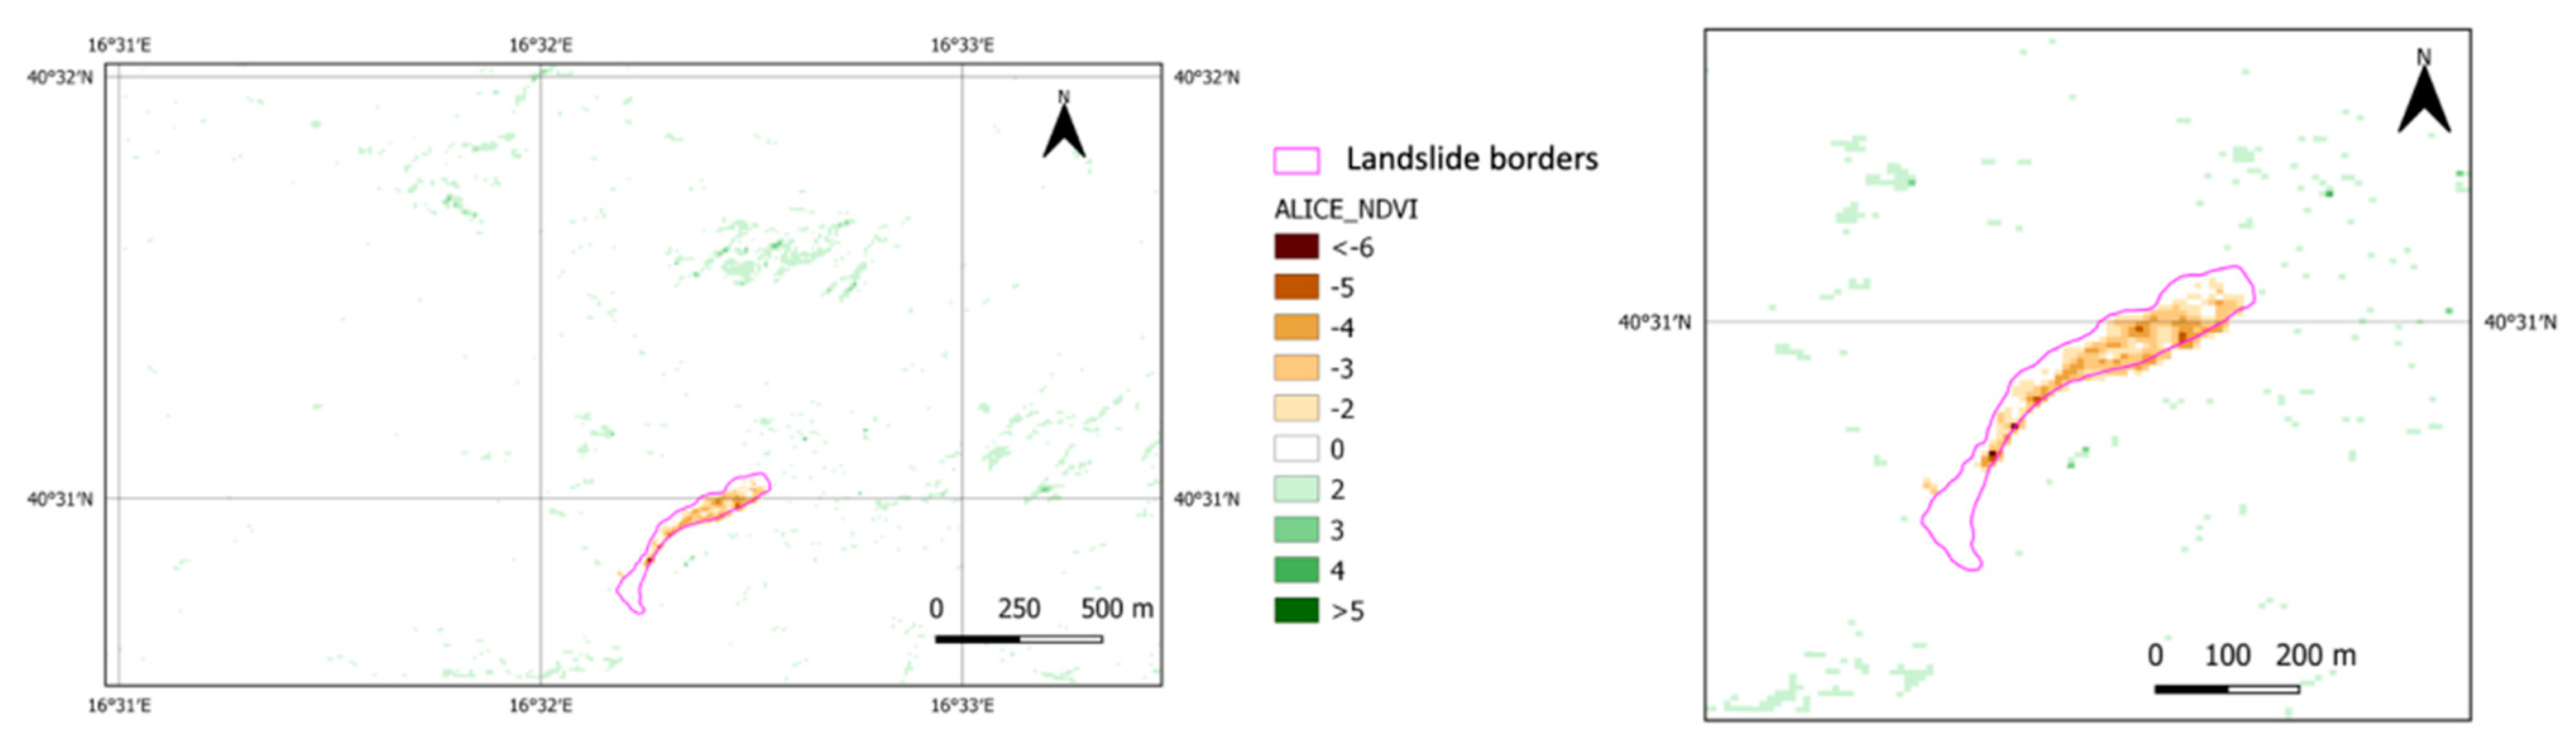
3. Results
4. Discussion and Conclusions
Author Contributions
Funding
Data Availability Statement
Acknowledgments
Conflicts of Interest
References
- Solari, L.; Del Soldato, M.; Raspini, F.; Barra, A.; Bianchini, S.; Confuorto, P.; Casagli, N.; Crosetto, M. Review of Satellite Interferometry for Landslide Detection in Italy. Remote Sens. 2020, 12, 1351. [Google Scholar] [CrossRef]
- Mateos, R.M.; López-Vinielles, J.; Poyiadji, E.; Tsagkas, D.; Sheehy, M.; Hadjicharalambous, K.; Herrera, G. Integration of landslide hazard into urban planning across Europe. Landsc. Urban Plan. 2020, 196, 103740. [Google Scholar] [CrossRef]
- Nesticò, A.; Maselli, G.; Russo, F. Hydrogeological Damage: An Overview on Appraisal Issues. In New Metropolitan Perspectives; NMP 2022. Lecture Notes in Networks and Systems; Calabrò, F., Della Spina, L., Piñeira Mantiñán, M.J., Eds.; Springer: Cham, Switzerland, 2022; Volume 482. [Google Scholar] [CrossRef]
- Centre for Research on the Epidemiology of Disasters (CRED). Economic 1998–2017 Losses, Poverty & Disaster. Available online: https://www.preventionweb.net/files/61119_credeconomiclosses.pdf (accessed on 5 January 2023).
- Haque, U.; Da Silva, P.F.; Devoli, G.; Pilz, J.; Zhao, B.; Khaloua, A.; Glass, G.E. The human cost of global warming: Deadly landslides and their triggers (1995–2014). Sci. Total Environ. 2019, 682, 673–684. [Google Scholar] [CrossRef]
- Froude, M.J.; Petley, D.N. Global fatal landslide occurrence from 2004 to 2016. Nat. Hazards Earth Syst. Sci. 2018, 18, 2161–2181. [Google Scholar] [CrossRef] [Green Version]
- Crozier, M.J. Deciphering the effect of climate change on landslide activity: A review. Geomorphology 2010, 124, 260–267. [Google Scholar] [CrossRef]
- Guzzetti, F.; Polemio, M. Il Rischio Idrogeologico in Italia e il Ruolo Della Ricerca Scientifica. Proceeding of “Dissesto Idrogeologico: Il Pericolo Geoidrologico e la Gestione del Territorio in Italia”. Roma, 10 Giugno 2011, Publishe in Geologia Dell’ambiente 2012, Supp. 2, 7. Available online: https://www.sigeaweb.it/documenti/gda-supplemento-dissesto-idrogeologico.pdf, (accessed on 23 January 2022).
- Salvati, P.; Bianchi, C.; Rossi, M.; Guzzetti, F. Societal landslide and flood risk in Italy. Nat. Hazards 2010, 10, 465–483. [Google Scholar] [CrossRef]
- Haque, U.; Blum, P.; da Silva, P.F.; Andersen, P.; Pilz, J.; Chalov, S.R.; Malet, J.P.; Auflič, M.J.; Andres, N.; Poyiadji, E.; et al. Fatal landslides in Europe. Landslides 2016, 13, 1545–1554. [Google Scholar] [CrossRef]
- Perrone, A. Lessons learned by 10 years of geophysical measurements with Civil Protection in Basilicata (Italy) landslide areas. Landslides 2021, 18, 1499–1508. [Google Scholar] [CrossRef]
- MITIGO. Mitigazione dei Rischi Naturali per la Sicurezza e la Mobilità nelle Aree Montane del Mezzogiorno. MIUR PON R&I 2014–2020 Program (Project MITIGO, ARS01_00964). Available online: https://www.mitigoinbasilicata.it (accessed on 23 January 2022).
- Wasowski, J.; Bovenga, F. Remote sensing of landslide motion with emphasis on satellite multi-temporal interferometry applications: An overview. In Landslide Hazards Risks Disasters, 2nd ed.; Elsevier: Amsterdam, The Netherlands, 2022; pp. 365–438. [Google Scholar] [CrossRef]
- Lissak, C.; Bartsch, A.; De Michele, M.; Gomez, C.; Maquaire, O.; Raucoules, D.; Roulland, T. Remote Sensing for Assessing Landslides and Associated Hazards. Surv. Geophys. 2020, 41, 1391–1435. [Google Scholar] [CrossRef]
- Handwerger, A.L.; Huang, M.-H.; Jones, S.Y.; Amatya, P.; Kerner, H.R.; Kirschbaum, D.B. Generating landslide density heatmaps for rapid detection using open-access satellite radar data in Google Earth Engine. Nat. Hazards Earth Syst. Sci. 2022, 22, 753–773. [Google Scholar] [CrossRef]
- Scheip, C.M.; Wegmann, K.W. HazMapper: A global open-source natural hazard mapping application in Google Earth Engine. Nat. Hazards Earth Syst. Sci. 2021, 21, 1495–1511. [Google Scholar] [CrossRef]
- Yang, W.; Wang, Y.; Sun, S.; Wang, Y.; Ma, C. Using Sentinel-2 time series to detect slope movement before the Jinsha River landslide. Landslides 2019, 16, 1313–1324. [Google Scholar] [CrossRef]
- Deijns, A.A.; Bevington, A.R.; van Zadelhoff, F.; de Jong, S.M.; Geertsema, M.; McDougall, S. Semi-automated detection of landslide timing using harmonic modelling of satellite imagery, Buckinghorse River, Canada. Int. J. Appl. Earth Obs. Geoinf. 2020, 84, 101943. [Google Scholar] [CrossRef]
- Wen, T.-H.; Teo, T.-A. Landslide inventory mapping from Landsat-8 NDVI time series using adaptive landslide interval detection. ISPRS Ann. Photogramm. Remote Sens. Spat. Inf. Sci. 2022, 3, 557–562. [Google Scholar] [CrossRef]
- Rouse, J.W.; Haas, R.H.; Schell, J.A.; Deering, D.W. Monitoring vegetation systems in the Great Plains with ERTS. In Proceedings of the ERTS-1 Symposium 3rd, NASA, Greenbelt, MD, USA, 10–14 December 1974. [Google Scholar]
- Gao, B.C. NDWI—A normalized difference water index for remote sensing of vegetation liquid water from space. Remote Sens. Environ. 1996, 58, 257–266. [Google Scholar] [CrossRef]
- Ghorbanzadeh, O.; Didehban, K.; Rasouli, H.; Kamran, K.V.; Feizizadeh, B.; Blaschke, T. An application of sentinel-1, sentinel-2, and GNSS data for landslide susceptibility mapping. ISPRS Int. J. Geo-Inf. 2020, 9, 561. [Google Scholar] [CrossRef]
- Qu, F.; Qiu, H.; Sun, H.; Tang, M. Post-failure landslide change detection and analysis using optical satellite Sentinel-2 images. Landslides 2021, 18, 447–455. [Google Scholar] [CrossRef]
- Qin, Y.; Lu, P.; Li, Z. Landslide inventory mapping from bitemporal 10 m sentinel-2 images using change detection based markov random field. Int. Arch. Photogramm. Remote Sens. Spat. Inf. Sci. 2018, 42, 1447–1452. [Google Scholar] [CrossRef] [Green Version]
- Psomiadis, E.; Papazachariou, A.; Soulis, K.X.; Alexiou, D.-S.; Charalampopoulos, I. Landslide Mapping and Susceptibility Assessment Using Geospatial Analysis and Earth Observation Data. Land 2020, 9, 133. [Google Scholar] [CrossRef]
- Luti, T.; Segoni, S.; Catani, F.; Munafò, M.; Casagli, N. Integration of Remotely Sensed Soil Sealing Data in Landslide Susceptibility Mapping. Remote Sens. 2020, 12, 1486. [Google Scholar] [CrossRef]
- Ortonovi, S.; Bollot, N.; Pierre, G.; Deroin, J.P. Cartographie de la susceptibilité aux glissements de terraindans le vignoble champenois entre Epernay et Dormans (France): Apport de la télédétection multispectrale. Géomorphologie Relief Process. Environ. 2021, 27, 147–158. [Google Scholar] [CrossRef]
- Copernicus Web Site. Available online: https://www.copernicus.eu (accessed on 5 January 2023).
- Tramutoli, V. Robust AVHRR Techniques (RAT) for environmental monitoring: Theory and applications. In Earth Surface Remote Sensing II; SPIE: Bellingham, WA, USA, 1998; Volume 3496, pp. 101–113. [Google Scholar]
- Doglioni, A.; Casagli, N.; Nocentini, M.; Sdao, F.; Simeone, V. The landslide of Pomarico, South Italy, occurred on 29 January 2019. Landslides 2020, 17, 2137–2143. [Google Scholar] [CrossRef]
- Perrone, A.; Canora, F.; Calamita, G.; Bellanova, J.; Serlenga, V.; Panebianco, S.; Tragni, N.; Piscitelli, S.; Vignola, L.; Doglioni, A. A multidisciplinary approach for landslide residual risk assessment: The Pomarico landslide (Basilicata Region, Southern Italy) case study. Landslides 2021, 18, 353–365. [Google Scholar] [CrossRef]
- Sdao, F.; Simeone, V. La grande frana di Pomarico del gennaio 2019–Risultati studi ed indagini–I Fase Emergenza. Report for the Civil Protection Activities of the Municipality of Pomarico, 2019. [Google Scholar]
- Sassilive Website. Available online: https://www.sassilive.it/cronaca/istituzioni-cronaca/frana-di-pomarico-attivita-della-regione-basilicata-in-favore-della-popolazione/ (accessed on 3 January 2023).
- Earth Engine Data Catalog. Available online: https://developers.google.com/earth-engine/datasets/catalog/COPERNICUS_S2 (accessed on 11 November 2022).
- Tramutoli, V. Robust satellite techniques (RST) for natural and environmental hazards monitoring and mitigation: Theory and applications. In Proceedings of the 2007 International Workshop on the Analysis of Multi-Temporal Remote Sensing Images, Leuven, Belgium, 18–20 July 2007; pp. 1–6. [Google Scholar] [CrossRef]
- Satriano, V.; Ciancia, E.; Lacava, T.; Pergola, N.; Tramutoli, V. Improving the RST-OIL algorithm for oil spill detection under severe sun glint conditions. Remote Sens. 2019, 11, 2762. [Google Scholar] [CrossRef] [Green Version]
- Lacava, T.; Ciancia, E.; Coviello, I.; Di Polito, C.; Grimaldi, C.S.; Pergola, N.; Tramutoli, V. A MODIS-based robust satellite technique (RST) for timely detection of oil spilled areas. Remote Sens. 2017, 9, 128. [Google Scholar] [CrossRef] [Green Version]
- Filizzola, C.; Carlucci, M.A.; Genzano, N.; Ciancia, E.; Lisi, M.; Pergola, N.; Ripullone, F.; Tramutoli, V. Robust Satellite-Based Identification and Monitoring of Forests Having Undergone Climate-Change-Related Stress. Land 2022, 11, 825. [Google Scholar] [CrossRef]
- Ciancia, E.; Lacava, T.; Pergola, N.; Vellucci, V.; Antoine, D.; Satriano, V.; Tramutoli, V. Quantifying the Variability of Phytoplankton Blooms in the NW Mediterranean Sea with the Robust Satellite Techniques (RST). Remote Sens. 2021, 13, 5151. [Google Scholar] [CrossRef]
- Mazzeo, G.; De Santis, F.; Falconieri, A.; Filizzola, C.; Lacava, T.; Lanorte, A.; Marchese, F.; Nolè, G.; Pergola, N.; Pietrapertosa, C.; et al. Integrated Satellite System for Fire Detection and Prioritization. Remote Sens. 2022, 14, 335. [Google Scholar] [CrossRef]
- Lacava, T.; Greco, M.; Di Leo, E.V.; Martino, G.; Pergola, N.; Romano, F.; Sannazzaro, F.; Tramutoli, V. Assessing the potential of SWVI (Soil Wetness Variation Index) for hydrological risk monitoring by means of satellite microwave observations. Adv. Geosci. 2005, 2, 221–227. [Google Scholar] [CrossRef] [Green Version]
- Lacava, T.; Filizzola, C.; Pergola, N.; Sannazzaro, F.; Tramutoli, V. Improving flood monitoring by the Robust AVHRR technique (RAT) approach: The case of the April 2000 Hungary flood. Int. J. Remote Sens. 2010, 31, 2043–2062. [Google Scholar] [CrossRef]
- Koeppen, W.C.; Pilger, E.; Wright, R. Time series analysis of infrared satellite data for detecting thermal anomalies: A hybrid approach. Bull. Volcanol. 2011, 73, 577–593. [Google Scholar] [CrossRef]
- Di Polito, C.; Ciancia, E.; Coviello, I.; Doxaran, D.; Lacava, T.; Pergola, N.; Satriano, V.; Tramutoli, V. On the potential of robust satellite techniques approach for SPM monitoring in coastal waters: Implementation and Application Over the Basilicata Ionian Coastal Waters Using MODIS-Aqua. Remote Sens. 2016, 8, 922. [Google Scholar] [CrossRef] [Green Version]
- Sport & Impianti Website. Available online: https://www.sporteimpianti.it/notizie/tensostruttura-al-centro-sportivo-di-pomarico-matera/ (accessed on 5 January 2023).


| Sentinel 2 L1C Selected Images | Historical Dataset Built |
|---|---|
| March–May, from 2016 to 2018 (86 images) |
| June–August, from 2016 to 2018 (106 images) |
| September–November, from 2016 to 2018 (107 images) |
Disclaimer/Publisher’s Note: The statements, opinions and data contained in all publications are solely those of the individual author(s) and contributor(s) and not of MDPI and/or the editor(s). MDPI and/or the editor(s) disclaim responsibility for any injury to people or property resulting from any ideas, methods, instructions or products referred to in the content. |
© 2023 by the authors. Licensee MDPI, Basel, Switzerland. This article is an open access article distributed under the terms and conditions of the Creative Commons Attribution (CC BY) license (https://creativecommons.org/licenses/by/4.0/).
Share and Cite
Satriano, V.; Ciancia, E.; Filizzola, C.; Genzano, N.; Lacava, T.; Tramutoli, V. Landslides Detection and Mapping with an Advanced Multi-Temporal Satellite Optical Technique. Remote Sens. 2023, 15, 683. https://doi.org/10.3390/rs15030683
Satriano V, Ciancia E, Filizzola C, Genzano N, Lacava T, Tramutoli V. Landslides Detection and Mapping with an Advanced Multi-Temporal Satellite Optical Technique. Remote Sensing. 2023; 15(3):683. https://doi.org/10.3390/rs15030683
Chicago/Turabian StyleSatriano, Valeria, Emanuele Ciancia, Carolina Filizzola, Nicola Genzano, Teodosio Lacava, and Valerio Tramutoli. 2023. "Landslides Detection and Mapping with an Advanced Multi-Temporal Satellite Optical Technique" Remote Sensing 15, no. 3: 683. https://doi.org/10.3390/rs15030683