Communication

Solar Potential Uncertainty in Building Rooftops as a Function of Digital Surface Model Accuracy

1
Photovoltaic Solar Energy Unit, Renewable Energy Division, CIEMAT, Avda. Complutense 40, 28040 Madrid, Spain
2
Department of Mechanical and Metallurgial Engineering, Pontificia Universidad Católica de Chile, Santiago 7820436, Chile
*
Author to whom correspondence should be addressed.
Remote Sens. 2023, 15(3), 567; https://doi.org/10.3390/rs15030567
Submission received: 12 December 2022 / Revised: 13 January 2023 / Accepted: 14 January 2023 / Published: 17 January 2023
(This article belongs to the Special Issue New Challenges in Solar Radiation, Modeling and Remote Sensing)

Abstract

:
Solar cadasters are excellent tools for determining the most suitable rooftops and areas for PV deployment in urban environments. There are several open models that are available to compute the solar potential in cities. The Solar Energy on Building Envelopes (SEBE) is a powerful model incorporated in a geographic information system (QGIS). The main input for these tools is the digital surface model (DSM). The accuracy of the DSM can contribute significantly to the uncertainty of the solar potential, since it is the basis of the shading and sky view factor computation. This work explores the impact of two different methodologies for creating a DSM to the solar potential. Solar potential is estimated for a small area in a university campus in Madrid using photogrammetry from google imagery and LiDAR data to compute different DSM. Large differences could be observed in the building edges and in the areas with a more complex and diverse topology that resulted in significant differences in the solar potential. The RSMD at a measuring point in the building rooftop can range from 10% to 50% in the evaluation of results. However, the flat and clear areas are much less affected by these differences. A combination of both techniques is suggested as future work to create an accurate DSM.

1. Introduction

Worldwide, solar photovoltaic (PV) technology is growing very quickly nowadays, faster than other renewable technologies. Indeed, the first Tera Watt milestone was reached by the PV industry in the spring of 2022 [1]. An important part of this increase is going to take place in the urban context through self-consumption PV systems in rooftops; building-integrated photovoltaics (BIPV) are also expected to gain relevance in the near future in cities. In this context, solar cadasters and solar potential studies in large urban areas or cities are increasing, notably parallel to the penetration of PV systems. These studies are aimed at mapping the annual irradiation distribution according to the urban topology in order to easily determine the most suitable rooftop surfaces for the deployment of PV systems [2].
In the last years, several models and tools have been developed to estimate solar potential on building rooftops and urban topologies, and they have been implemented in geographic information systems (GIS) in order to incorporate the influence of urban elements and topology to the incident solar radiation [3,4,5,6,7,8]. Open-source tools have evolved a lot, and today, high-quality GIS are open and accessible, with a very large number of users that contribute to their growth and further improvement. This is the case of Quantum GIS (QGIS, https://www.qgis.org/, accessed on 11 December 2022), which incorporates the functionalities of GRASS, WMS/WMTS client, the GDAL algorithms and many other libraries in a powerful open-source geographic information system. In particular, the UMEP (Urban Multi-scale Environmental Predictor) model can be incorporated as a plugin in QGIS. This is an integrated tool for urban climatology and climate-sensitive planning applications [9,10]. The SEBE (Solar Energy on Building Envelopes) model is a part of the UMEP toolbox, aimed at estimating solar radiation on the ground, rooftops and buildings by computing the sky view factor and the shadows from a digital surface model (DSM) and from the solar radiation components as meteorological input [11,12].
Photogrammetry has historically and widely been regarded as one of the most effective techniques for the 3D modeling of well-textured objects. Photogrammetry allows one to accurately and reliably recover the 3D shape of the object compared to photometric stereo [13]. It identifies the spatial positions of all the features (shapes and colors) of the considered object by detecting a series of local motion signals: arbitrary blocks of pixels used as motion vectors. Local motion signals are determined through a technique called Structure-from-Motion (SfM), in which the camera is fixed and the target rotates or the camera moves around the fixed target [14]. Local motion signals are therefore used to determine and calibrate the object points’ spatial position, which will shape the model. Today, photogrammetric 3D models are widely used in several fields, such as life and earth sciences, medicine, architecture, topography, archaeology and engineering [15,16,17].
The DSM is the fundamental initial data in GIS methodologies for solar potential analysis. A DSM is a raster image of heights that combines the ground height of a digital elevation model (DTM) with the height of all elements on the ground (trees, buildings, canopies and other structures). DSM can be determined from LiDAR (Light Detection and Ranging) images or from orthoimagery to generate 3D models of a specified urban area. Solar potential studies based on LiDAR raster images are relatively numerous in the literature [18,19,20]. Despite many studies having used LiDAR images in solar cadasters [2,4,7,21,22,23], recent studies have shown that DSMs generated from orthoimagery offer significant advantages in modeling solar resources at large scales [24]. Nowadays, there is specific software, such as Agisoft, that allows for the generation of DSM from orthoimagery such as google satellite images [25]. However, the preference for any of these methodologies must be conditioned by the final resolution and accuracy of the resulting DSM. Thus, some authors have used OpenStreetMap to obtain 2D building footprints and make use of data on the height of buildings to build 3D data, but this approach is not very reliable, since data are based on volunteered geoinformation [26]. The sensitivity of several DSMs with different resolutions was recently explored for a small neighborhood in Nantes (France), where differences in annual solar resources of up to 25% were reported [27].
In this work, a study of DSM elaborated with two different methodologies on the effect on solar radiation estimates is presented. The aim is to explore the impact that the uncertainty associated to DSM generation has on the solar potential evaluated for building rooftops and in solar cadasters in general. Despite the fact that the literature presents many works on solar cadasters and potential in urban areas, very few studies include an evaluation with experimental measurements [28,29]. Thus, in addition to the study on the differences caused by different DSMs, the results are compared to measurements taken at three different points of the rooftop of the building under study.

2. Materials and Methods

The study area selected for this work is the Ciemat campus in Madrid, where the geographic coordinates are 40.45°N, −3.73°E and the altitude is 695 m. Ciemat campus is a rather heterogeneous area of small buildings housing Ciemat laboratories and offices surrounded by a forest small area, isolated trees and roads placed in the largest university campus of Madrid. The area is also of interest because one of the buildings, hereafter referred to as Building 42, is the headquarter lab of the Renewable Energy Division in Ciemat, and it includes small BIPV arrays in the south, west and east façades, which have been the subject of several recent studies [30,31]. The building footprint is basically a parallelogram of 36 m × 45 m. In addition, there are several PV testing systems and structures installed in the rooftop of the building. Figure 1 shows a picture of the area under study with the building 42 in the center. The figure also shows the position of three measuring points, two of them with thermopile pyranometers (Point 1 and 2) and the third one with a calibrated cell (Point 3).

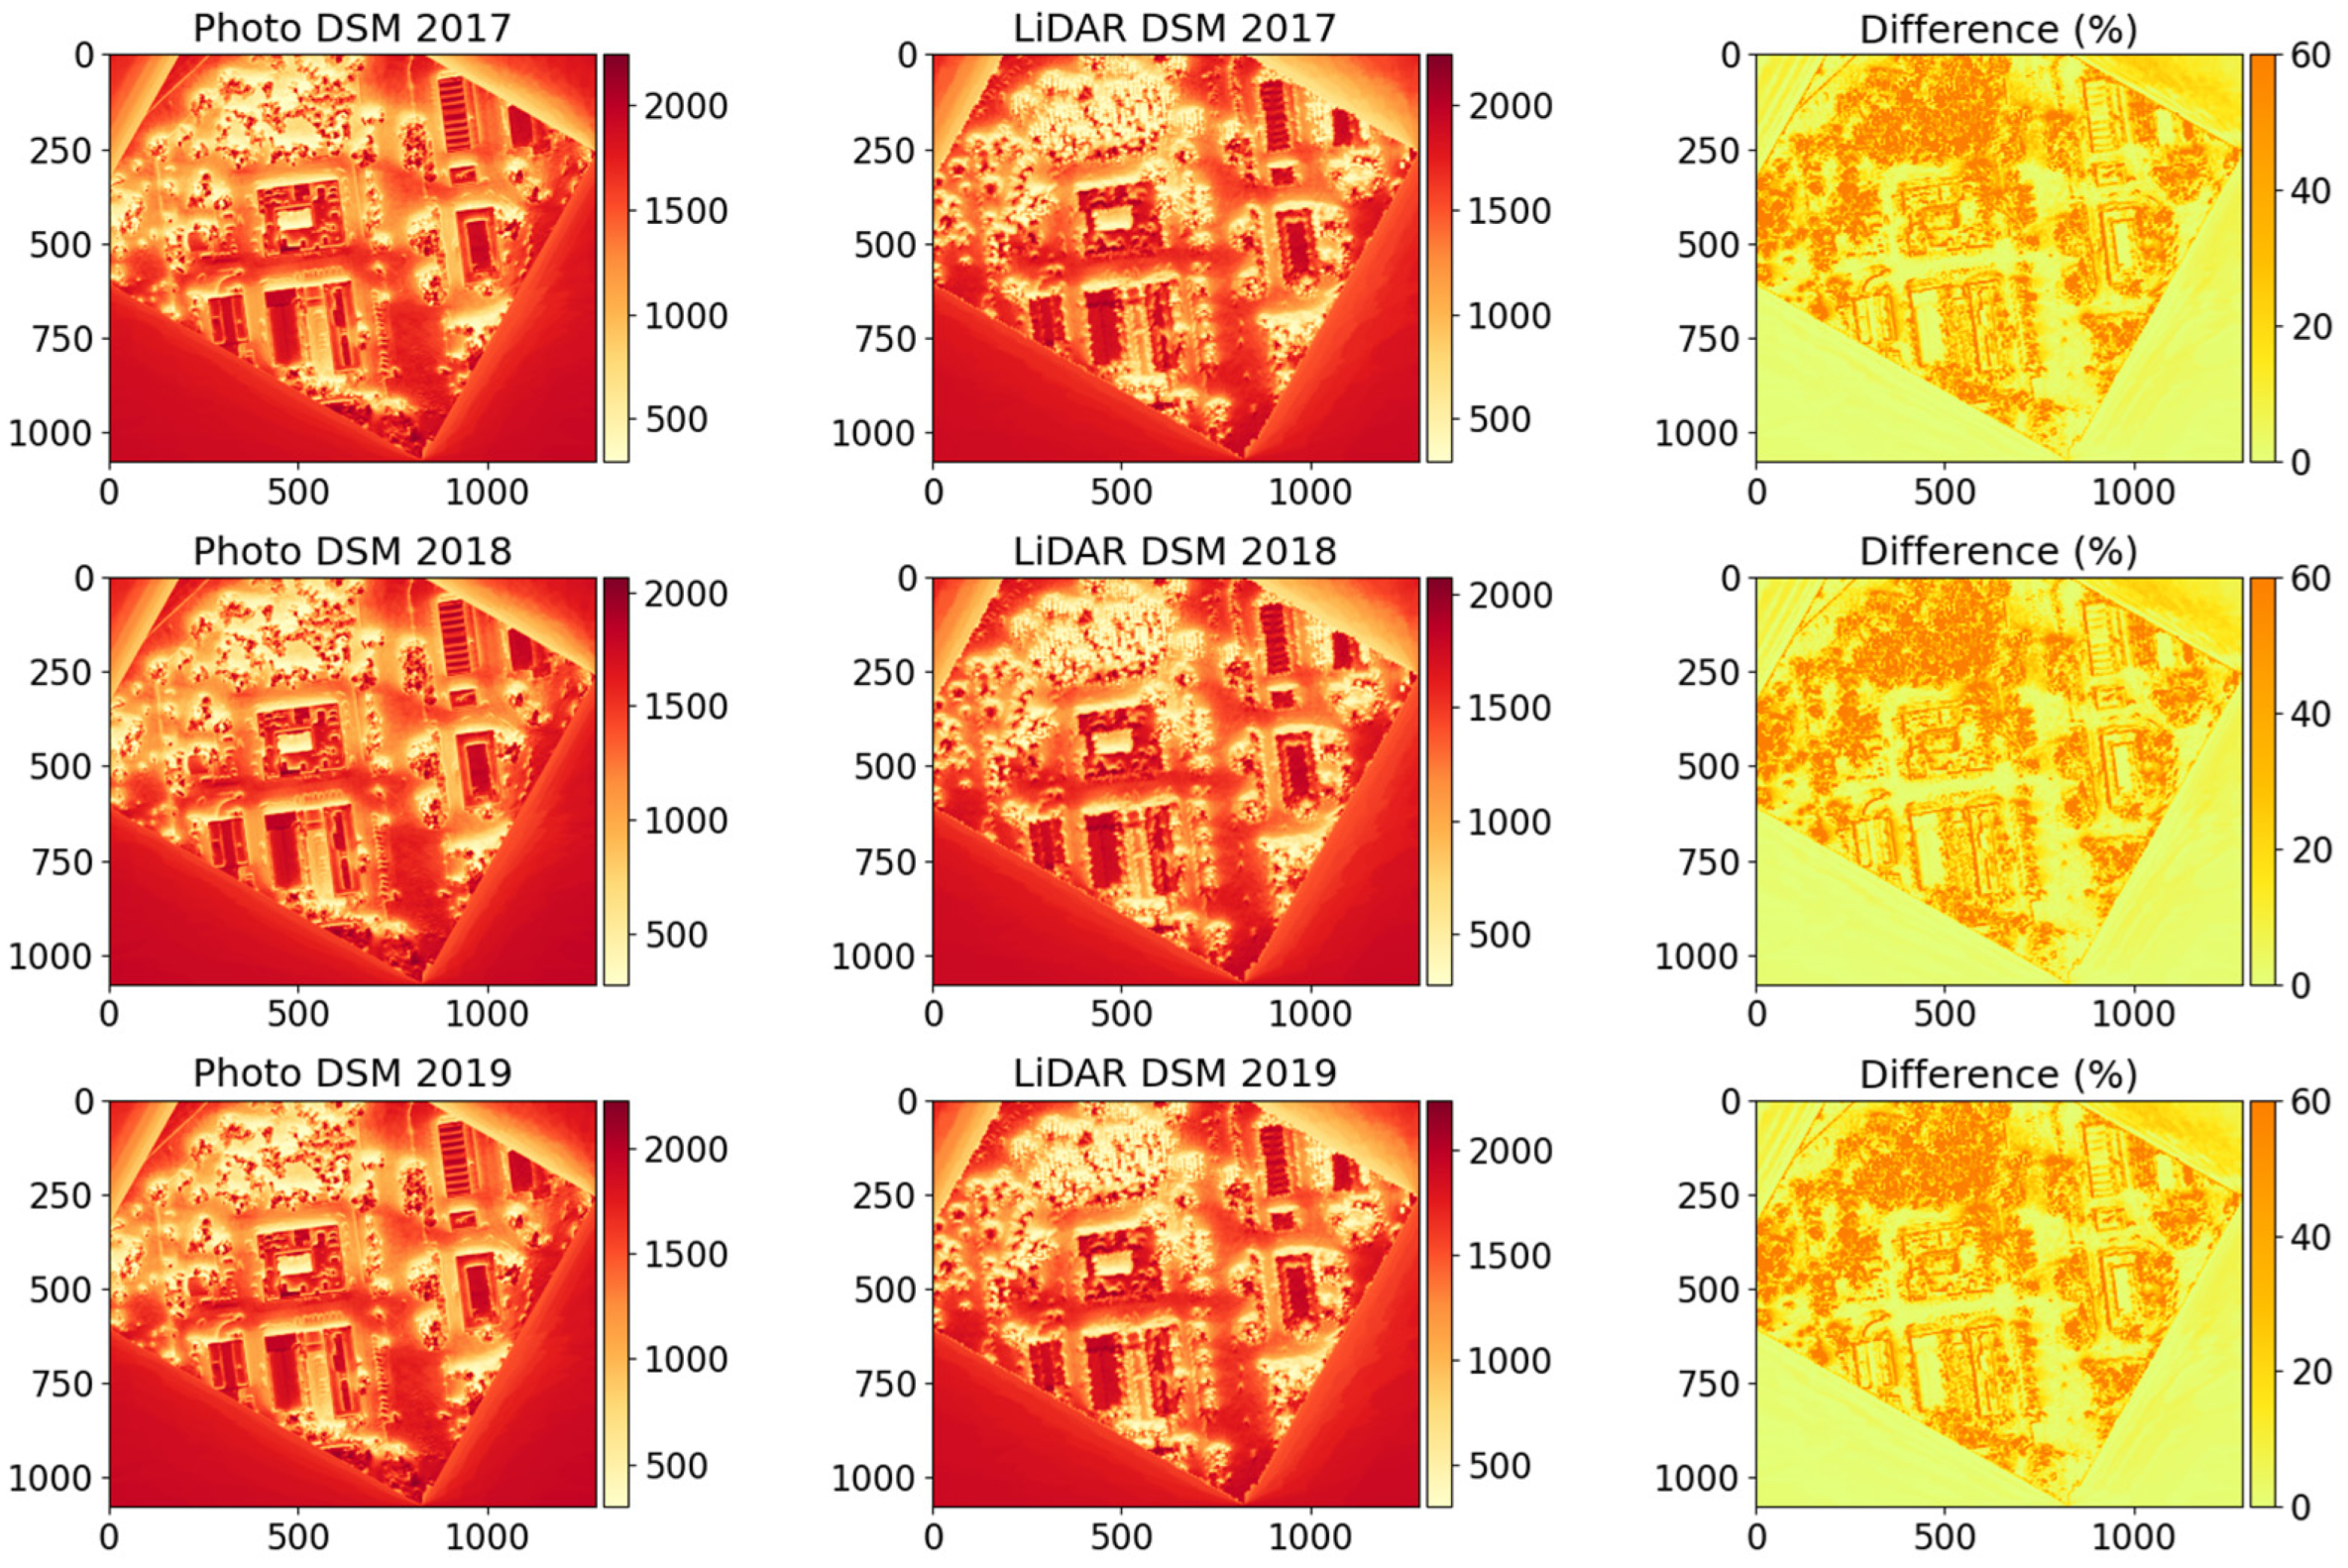
2.1. Digital Surface Model

Digital Surface Models (DSM) are raster grids of the elevation of the terrain, including vegetation, buildings and other elements. They are thus a representation of the Earth’s surface that includes all the objects on it. Photogrammetry techniques are commonly used to generate DSM [24]. In this work, two techniques were used to generate 3-D urban data (i.e., two different DSMs of the area under study): LiDAR data and photogrammetry.
LiDAR data with a density of 0.5 points/m2 of Madrid are supplied by the Spanish Geographic Institute [32]. The LiDAR images of the study area were taken around 2015 and 2016. The LAStools library is a powerful package for reading and extracting information from compressed LiDAR files (https://rapidlasso.de/, accessed on 17 January 2023). LAStools open-source functions were used in QGIS to generate the LiDAR DSM denotation of the area.
The procedure to perform the DSM through photogrammetry is obtained from Google Earth photos around the area of interest, specifically 55 photos in 360° over the Ciemat campus Madrid. PhotoScan Professional (version 1.6.2) was used, a commercial product for photogrammetry developed by AgiSoft®. This software is commonly employed for photogrammetry in urban environments [33,34]. At the end of the process, a 3D model (shown in Figure 2), an DSM and an orthophotography are exported in GeoTiff format, without any additional post-processing (optimization, point filtering, among others).
In order to allow the comparison between the two DSMs elaborated, an interpolation process was applied to the LiDAR DSM data, which was initially a raster of 243 × 295 points, to derive a raster of 1078 × 1290 points like the Photo DSM. Thus, the two DSM rasters have the same extent and pixel resolution. Figure 3 shows a comparison of the LiDAR DSM and Photo DSM of the area under study and the relative difference between both. The largest relative differences are below 7%, and they are mostly concentrated in the trees and the building edges. The building contour of the Photo DSM is displaced by around 10 pixels with respect to the LiDAR DSM. However, in the building rooftops, the relative differences between both DSMs are below 2%.

2.2. Urban Geometry

Sky view factor and shadow patterns were computed for each different DSM using the UMEP plugin with QGIS [9,10]. The shadows were computed for two specific dates and times, 21st December at 12:00 UTC and 21st June at 12:00 UTC, in order to compare the minimum and maximum shadowing conditions. Figure 4 shows the comparison of the sky view factor computed from each DSM, and Figure 5 shows the comparison of the shadow patterns resulting from each DSM.
The sky view factors computed for each DSM show relative differences below 20% in the building rooftops. As a consequence of the differences observed in the DSM, the largest differences in the sky view factor computation take place in the trees and forest areas and in the building edges. The latter is a direct consequence of the small spatial displacement between both DSMs. The shadow patterns are better defined in the Photo DSM case than in the LiDAR DSM case. However, most of the rooftops are not so strongly affected by the different shadows, with the exception of the building 42, where the complexity of the rooftop produces larger variations between both cases. Indeed, several structures with different heights are installed on the rooftop, and, consequently, the less detailed information of the LiDAR DSM generates a more diffuse and fuzzier pattern of shadows.

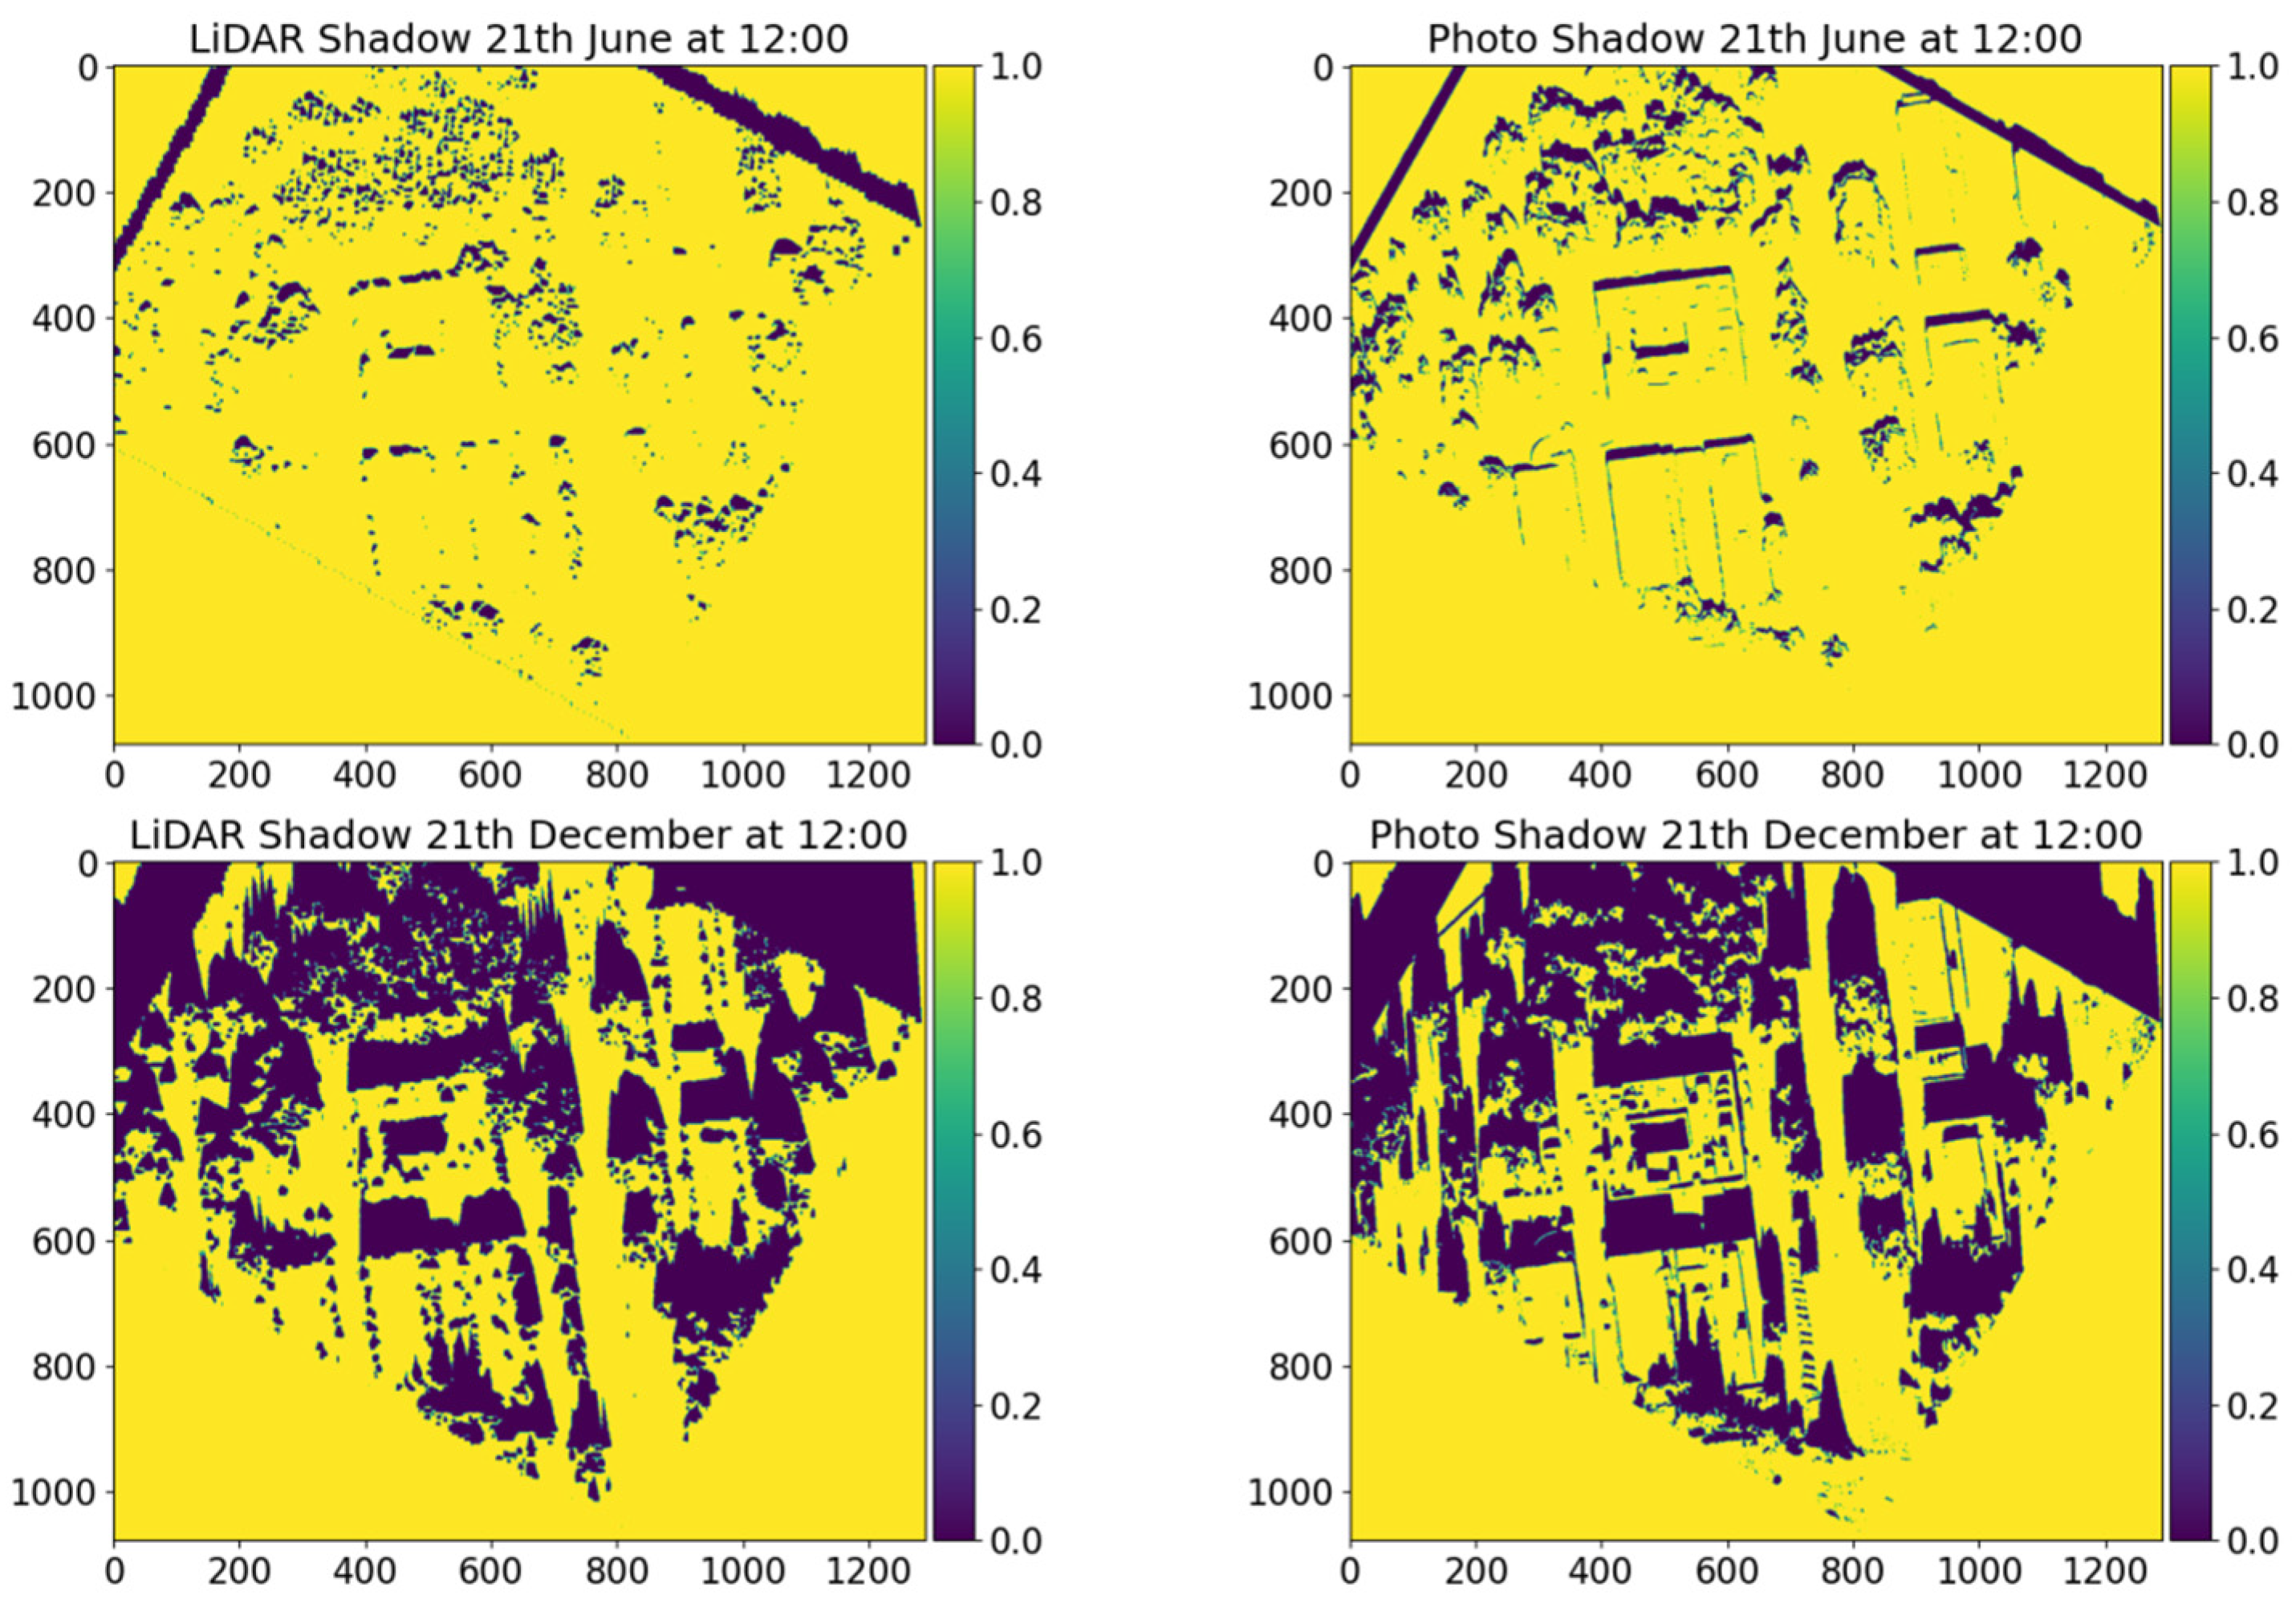
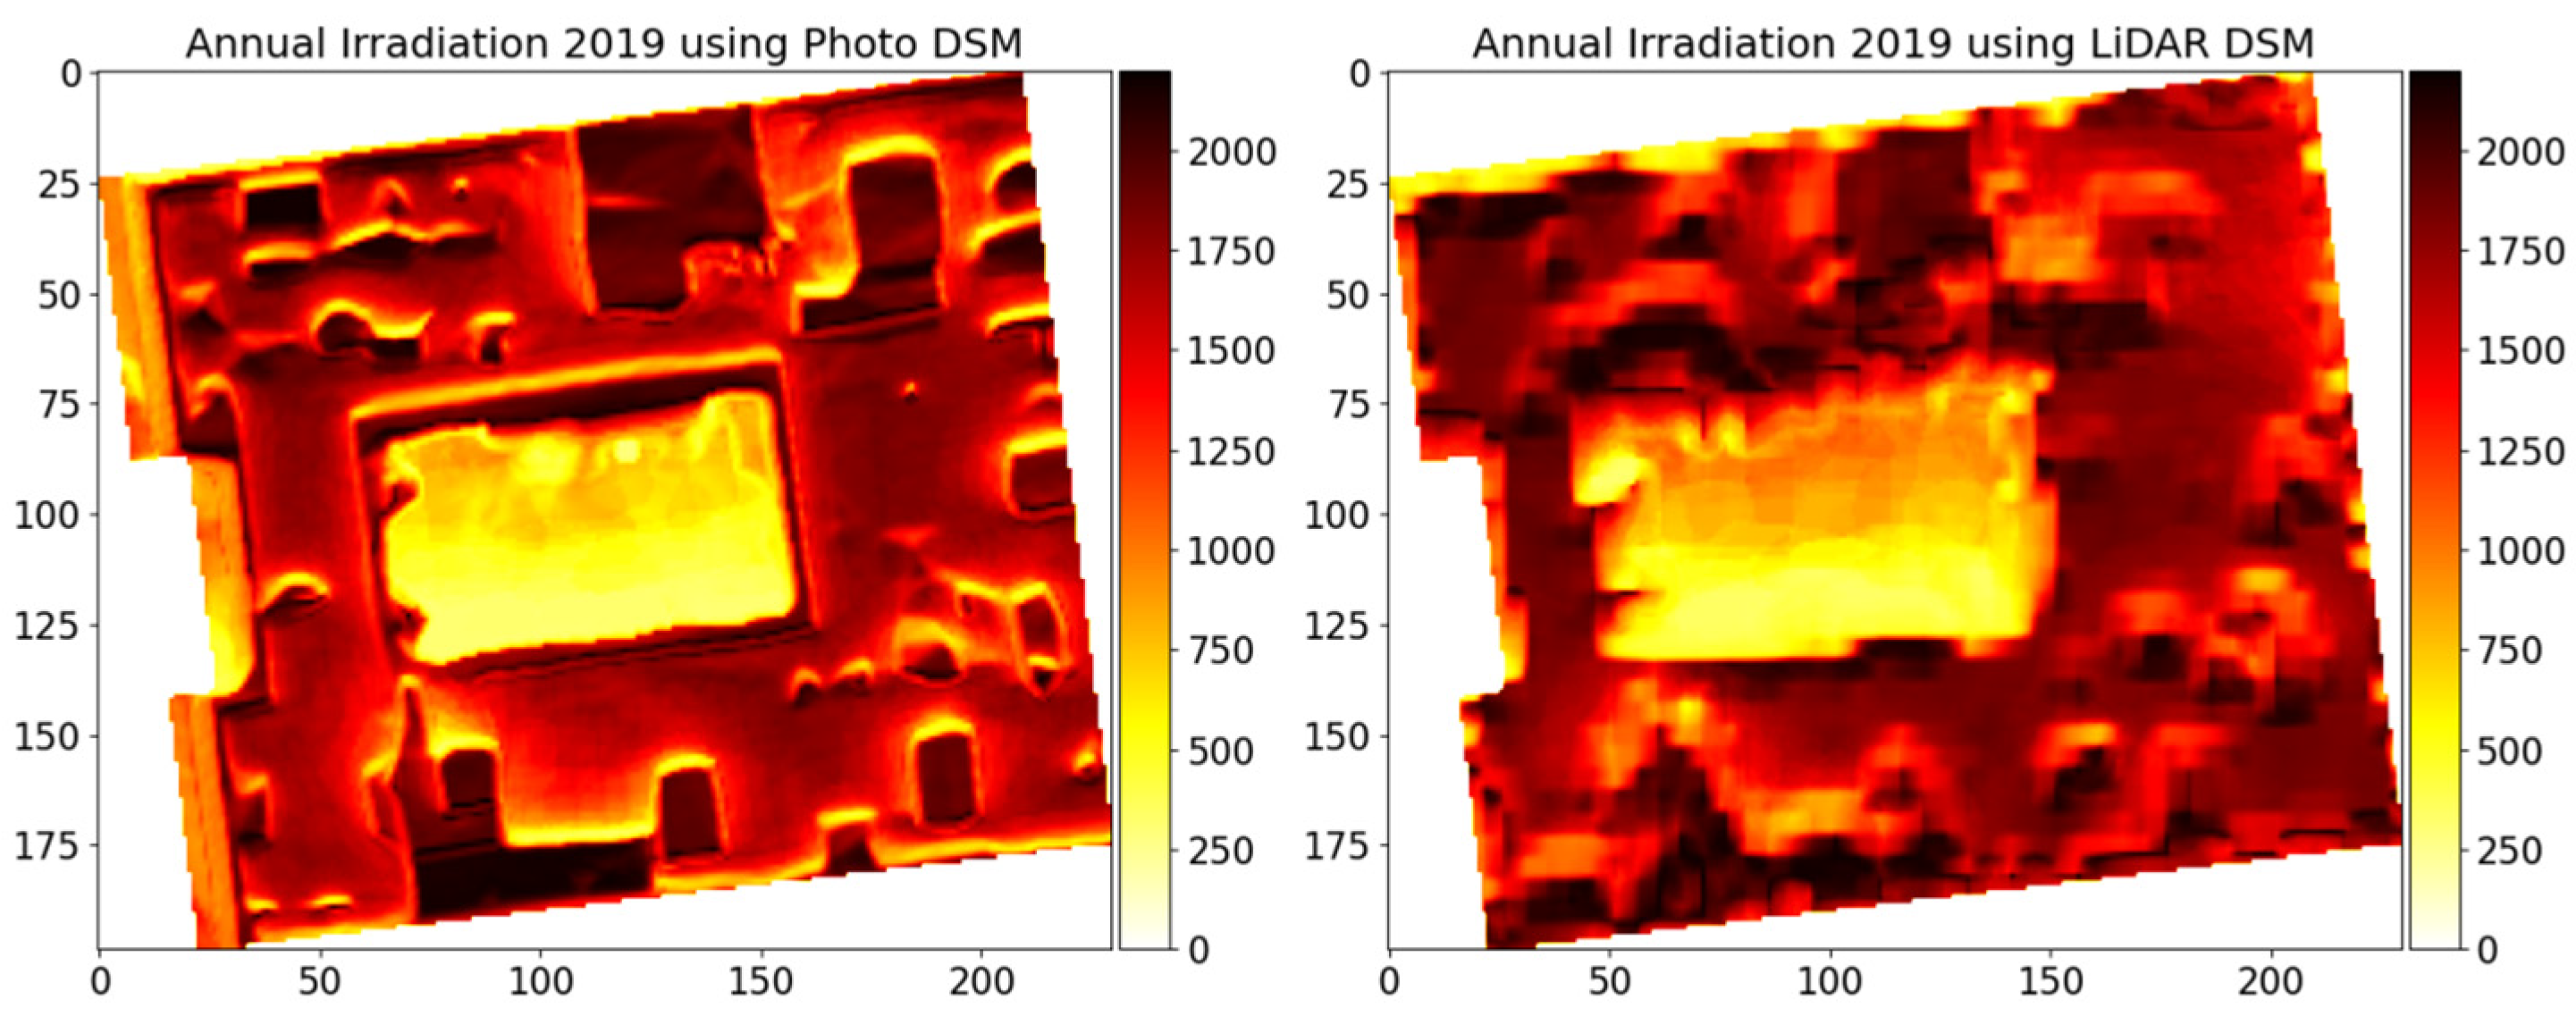
2.3. Solar Radiation
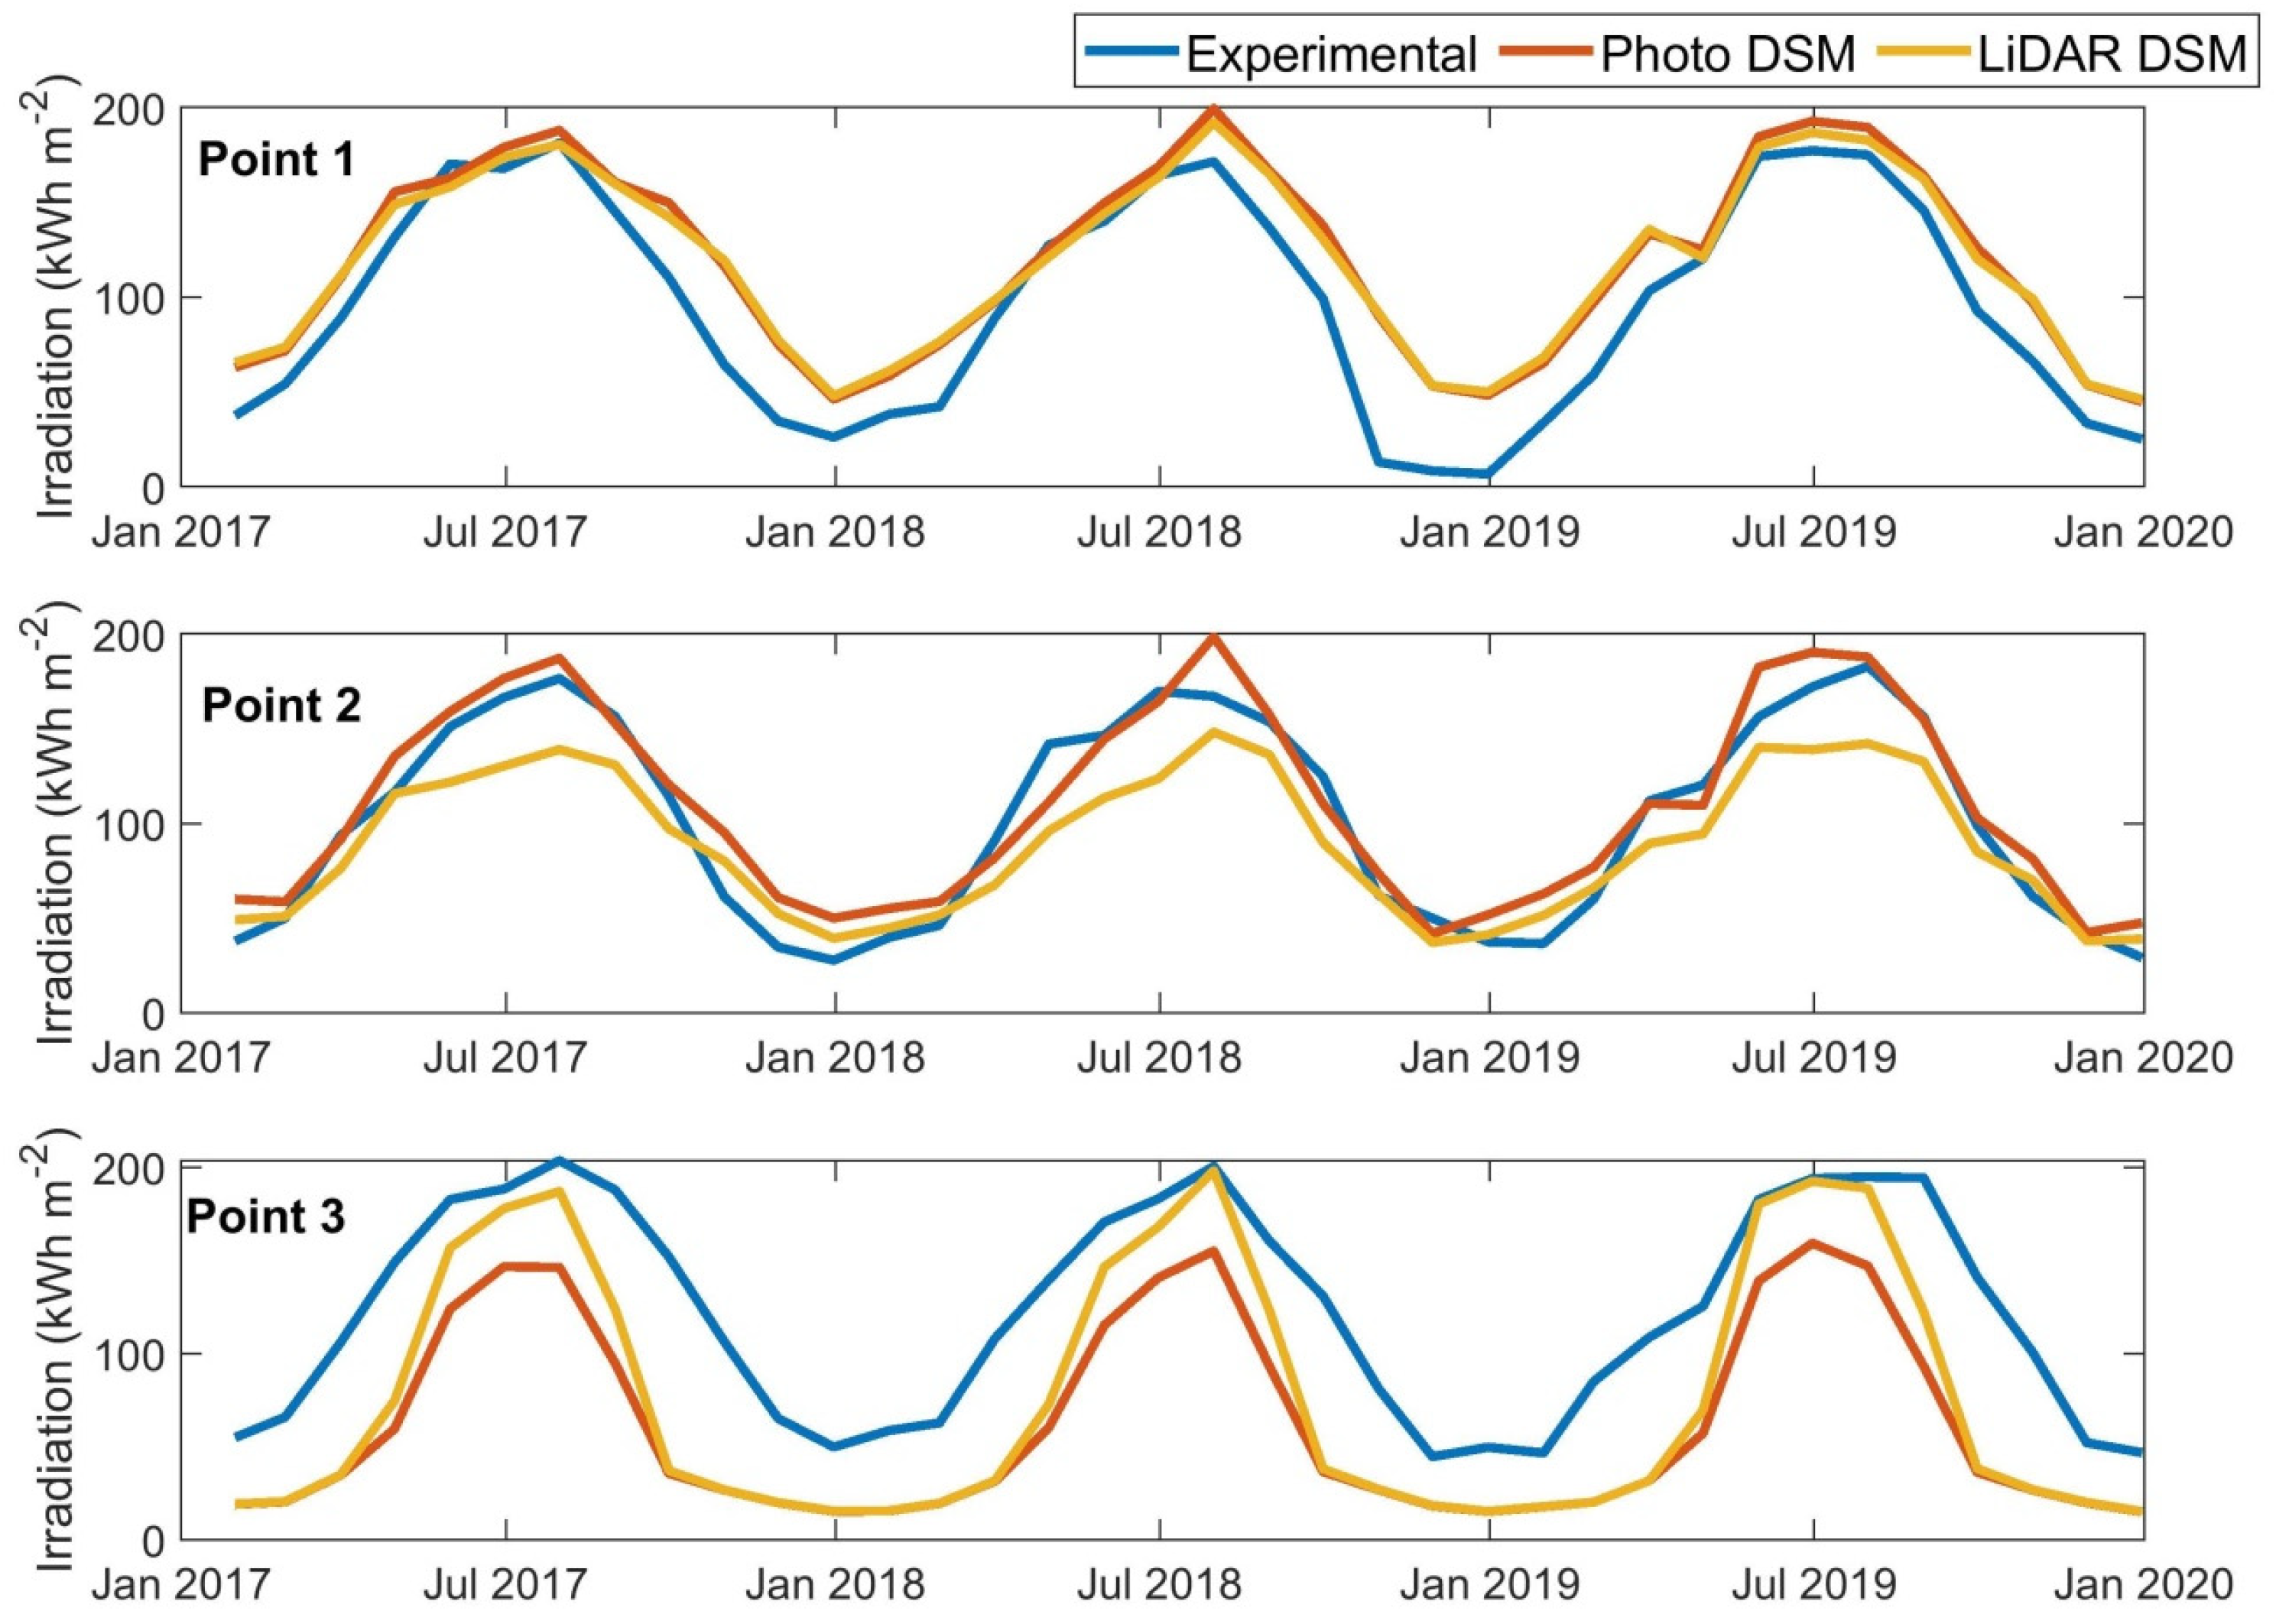
The solar energy potential is estimated for each DSM using the SEBE (Solar Energy on Building Envelopes) model in QGIS [9,11,12]. The total irradiance for a pixel ( H ) on a DSM is estimated by summing up the direct, diffuse and reflected radiations:
H = i = 0 p I ( cos A O I )   S + D S + G 1 S ρ
where   p is the number of patches on the hemisphere, I is the direct normal irradiance, D is the diffuse irradiance, G is the global irradiance, ρ is the albedo, S is the shadow calculated for each pixel, and cos A O I is the cosine of the incidence angle. The three components of the solar radiation (direct normal, diffuse and global) are estimated for this work using the PVGIS-SARAH2 solar radiation database of the PVGIS tool for the years 2017–2019. The data is delivered at an hourly basis. The PVGIS-SARAH2 database is a satellite-derived product covering the years 2005–2020 for Europe, Africa and the most western part of Asia with a spatial resolution of around 5 × 5 km (https://joint-research-centre.ec.europa.eu/pvgis-photovoltaic-geographical-information-system_en, accessed on 17 January 2023). The methodology behind this database is the CM SAF method [35,36,37].

3. Results

Solar radiation computation in the study area has been performed at an hourly basis for three years (2017 to 2019) using the SEBE model with QGIS. The three components of solar radiation supplied by the PVGIS SARAH2 database were used as meteorological input to the solar radiation model. Figure 6 shows the distribution of the annual irradiation in the study area for each year and DSM. The spatial distribution of solar radiation in the area is better defined in the case of Photo DSM than for LiDAR DSM. The latter shows the building footprints as being more diffused as a consequence of the less detailed DSM. The relative difference in annual irradiation shows a large variability, ranging from over 50% in the forest area to practically no difference in the flat rooftops and ground surfaces. In fact, the largest differences in the forest area of the study are due to both the DSM generation methodology and real physical differences in the area. Several actuations were performed in the land after 2016, which resulted in the removal of a few trees and bushes, so that the Photo DSM was constructed over a slightly modified land compared to LiDAR DSM, which corresponded to the 2015 and 2016 periods. Therefore, uncertainty sources are diverse and include: the land modification occurring between LiDAR and Photo imagery, the DSM generation methodology itself and the uncertainty of the solar radiation input to the model.
Figure 7 illustrates with more detail the annual irradiation in 2019 in the building 42. The topology of the multiple structures placed in the rooftop of the building are much better defined in the case of Photo DSM, while in the case of LiDAR DSM, the topology of the rooftop is somehow fuzzy. This lack of detail results in very large relative differences between both maps when one compares them point by point. However, the differences are notably lower when the comparison is made on the flat and free available surfaces (just those that can be exploited to install solar systems). In order to analyze the impact of the different DSM methodologies on the solar radiation estimation and the associated uncertainty, the monthly irradiation estimated with SEBE during the three years under study is compared with the experimental measurements collected in the building rooftop. Two pyranometers were installed in the north part of the building, and a calibrated cell was placed in the south-east quarter (Figure 1). Despite the uncertainty of all these measurements, which is difficult to evaluate properly [38], they can be used to evaluate, at least partially, the monthly irradiation estimated by SEBE on those three rooftop points. Figure 8 shows the monthly irradiation estimated with each DSM and the experimental values.

4. Discussion

According to the results of Figure 8, there are significant differences in the agreement of the solar irradiation estimation and experimental data at each point. Solar irradiation shows important underestimations at point 3, particularly during autumn and winter, where shadowing has a more remarkable impact. The standard metrics for assessing the estimations show mean bias deviation (MBD) values of −11.6% and −8.4% for LiDAR DSM and Photo DSM, respectively. The root mean square deviation (RMSD) for these monthly irradiation values is placed at 35% and 39% for LiDAR DSM and Photo DSM, respectively. In the case of annual irradiation, the RMSD is 29% and 35% for LiDAR DSM and Photo DSM, respectively. The deviations are quite different depending on the point for validation. The RMSD for each experimental point is shown in Table 1, where the uncertainty values can vary from around 10% to nearly 50%. Recent studies reported 25% of RMSD for annual irradiation estimated by different DSMs [27]. Despite the less detailed topology of the LiDAR DSM, its height data are more accurate than those of Photo DSM, which uses google imagery, and the annual irradiation estimations are closer to the experimental observations. However, this evaluation should be handled with precaution, since there are several uncertainty sources that cannot be easily characterized. On the one hand, there is an inherent uncertainty in determining the experimental points in each DSM. In addition, the measurements come from different types of instruments with different uncertainty values [38,39]. In addition, PVGIS solar radiation data originally used as input has a global uncertainty in terms of RMSD for yearly estimations of approximately 3% and 6% for global horizontal and direct normal irradiation, respectively. Moreover, at an hourly basis, the uncertainty of PVGIS SARAH is around 17.61% of RMSD for global irradiance evaluated at stations in Europe [40]; therefore, the contribution of the uncertainty in the meteorological input might also be significant. In addition, the uncertainty of DSM is also extremely difficult to evaluate and has an impact on both the sky view factor and the shadow estimates, which are the most sensible parameters in solar radiation computation in urban topologies. All these uncertainties are interconnected within the methodology, so that separating them into individual contributions is not a straightforward task.

5. Conclusions

In this work, the impact of different methodologies for constructing DSM on the solar potential estimation is explored in an urban environment. Photogrammetry from google earth imagery and LiDAR-based methodology have been used to create two different DSMs, Photo DSM and LiDAR DSM, respectively. The main differences are found in the building footprints, which are much better and regularly defined in the case of Photo DSM, while LiDAR DSM has the poorest resolution but a more accurate height. The determination of the uncertainty of a DSM is complex and not straightforward. The impact on the solar cadaster can be important when specific buildings with a complex topology are considered, and a much lower impact is observed in flat rooftops and flat areas. Thus, the identification of suitable rooftops in large areas for solar PV applications can be done with both techniques, but the analysis of a detailed building would require a much more accurate DSM. Further work will explore the combination of both techniques by correcting the heights of Photo DSM with LiDAR information and keeping the Photo DSM footprint.

Author Contributions

Conceptualization, J.P. and R.J.G.; methodology, J.P. and R.J.G.; validation, J.P.; formal analysis, J.P. and R.J.G.; investigation, J.P. and R.J.G.; data curation, J.P.; writing—original draft preparation, J.P.; writing—review and editing, R.J.G. All authors have read and agreed to the published version of the manuscript.

Funding

This research was funded by the Spanish Ministry of Science and Innovation, grant number PID2021-124910OB.

Data Availability Statement

Not applicable.

Acknowledgments

The authors would like to thank the RINGS-BIPV (Advanced Modeling and Prediction of BIPV) Project (PID2021-124910OB-C31), which is funded by the Ministerio de Ciencia e Innovación. The corresponding author would like to recognize the efforts, research and contributions of the expert group of IEA PVPS task 16, named Solar Resource for High Penetration and Large Scale Applications, where the author collaborates.

Conflicts of Interest

The authors declare no conflict of interest.

References

  1. JRC. Photovoltaics in the European Union 2022, Status Report on Technology Development, Trends, Value Chains and Markets; Joint Research Centre: Brussels, Belgium, 2022; ISBN 9789276575733. [Google Scholar]
  2. Freitas, S.; Catita, C.; Redweik, P.; Brito, M.C.C. Modelling solar potential in the urban environment: State-of-the-art review. Renew. Sustain. Energy Rev. 2015, 41, 915–931. [Google Scholar] [CrossRef]
  3. Jakubiec, J.A.; Reinhart, C.F. A method for predicting city-wide electricity gains from photovoltaic panels based on LiDAR and GIS data combined with hourly Daysim simulations. Sol. Energy 2013, 93, 127–143. [Google Scholar] [CrossRef]
  4. Brito, M.C.; Gomes, N.; Santos, T.; Tenedório, J.A. Photovoltaic potential in a Lisbon suburb using LiDAR data. Sol. Energy 2012, 86, 283–288. [Google Scholar] [CrossRef]
  5. Bódis, K.; Kougias, I.; Jäger-Waldau, A.; Taylor, N.; Szabó, S. A high-resolution geospatial assessment of the rooftop solar photovoltaic potential in the European Union. Renew. Sustain. Energy Rev. 2019, 114, 109309. [Google Scholar]
  6. Khan, J.; Arsalan, M.H. Estimation of rooftop solar photovoltaic potential using geo-spatial techniques: A perspective from planned neighborhood of Karachi-Pakistan. Renew. Energy 2016, 90, 188–203. [Google Scholar] [CrossRef]
  7. Singh, R.; Banerjee, R. Estimation of rooftop solar photovoltaic potential of a city. Sol. Energy 2015, 115, 589–602. [Google Scholar] [CrossRef]
  8. Verso, A.; Martin, A.; Amador, J.; Dominguez, J. GIS-based method to evaluate the photovoltaic potential in the urban environments: The particular case of Miraflores de la Sierra. Sol. Energy 2015, 117, 236–245. [Google Scholar] [CrossRef]
  9. Lindberg, F.; Sun, T.; Grimmond, S.; Tang, Y. UMEP Manual Documentation. 2021; p. 192. Available online: https://umep-docs.readthedocs.io/en/latest/ (accessed on 12 January 2023).
  10. Lindberg, F.; Grimmond, C.S.B.; Gabey, A.; Huang, B.; Kent, C.W.; Sun, T.; Theeuwes, N.E.; Järvi, L.; Ward, H.C.; Capel-Timms, I.; et al. Urban Multi-scale Environmental Predictor (UMEP): An integrated tool for city-based climate services. Environ. Model. Softw. 2018, 99, 70–87. [Google Scholar] [CrossRef]
  11. Lindberg, F.; Jonsson, P.; Honjo, T.; Wästberg, D. Solar energy on building envelopes—3D modelling in a 2D environment. Sol. Energy 2015, 115, 369–378. [Google Scholar] [CrossRef]
  12. Revesz, M.; Zamini, S.; Oswald, S.M.; Trimmel, H.; Weihs, P. SEBEpv—New digital surface model based method for estimating the ground reflected irradiance in an urban environment. Sol. Energy 2020, 199, 400–410. [Google Scholar] [CrossRef]
  13. Karami, A.; Menna, F.; Remondino, F. Combining Photogrammetry and Photometric Stereo to Achieve Precise and Complete 3D Reconstruction. Sensors 2022, 22, 8172. [Google Scholar] [CrossRef] [PubMed]
  14. Schonberger, J.L.; Frahm, J.M. Structure-from-Motion Revisited. In Proceedings of the IEEE Computer Society Conference on Computer Vision and Pattern Recognition, Las Vegas, NV, USA, 27–30 June 2016; pp. 4104–4113. [Google Scholar]
  15. Alliez, P.; Forge, F.; de Luca, L.; Pierrot-Deseilligny, M.; Preda, M. Culture 3D Cloud: A Cloud Computing Platform for 3D Scanning, Documentation, Preservation and Dissemination of Cultural Heritage. ERCIM News 2017, 111, 64. [Google Scholar]
  16. Chodoronek, M. The Use and Application of Photogrammetry for the In-field Documentation of Archaeological Features: Three Case Studies from the Great Plains and Southeastern Alaska; University of Nebraska-Lincoln: Lincoln, NE, USA, 2015. [Google Scholar]
  17. Ducke, B.; Score, D.; Reeves, J. Multiview 3D reconstruction of the archaeological site at Weymouth from image series. Comput. Graph. 2011, 35, 375–382. [Google Scholar] [CrossRef]
  18. Quirós, E.; Pozo, M.; Ceballos, J. Solar potential of rooftops in Cáceres city, Spain. J. Maps 2018, 14, 44–51. [Google Scholar] [CrossRef]
  19. Blaise, R.; Gilles, D. Adapted strategy for large-scale assessment of solar potential on facades in urban areas. Sol. Energy Adv. 2022, 2, 100030. [Google Scholar] [CrossRef]
  20. Huang, X.; Hayashi, K.; Matsumoto, T.; Tao, L.; Huang, Y.; Tomino, Y. Estimation of Rooftop Solar Power Potential by Comparing Solar Radiation Data and Remote Sensing Data—A Case Study in Aichi, Japan. Remote Sens. 2022, 14, 1742. [Google Scholar] [CrossRef]
  21. Buffat, R. Feature-Aware Surface Interpolation of Rooftops Using Low-Density Lidar Data for Photovoltaic Applications; Springer: Berlin/Heidelberg, Germany, 2016; ISBN 9783319337838. [Google Scholar]
  22. Goodwin, N.R.; Coops, N.C.; Tooke, T.R.; Christen, A.; Voogt, J.A. Characterizing urban surface cover and structure with airborne lidar technology. Can. J. Remote Sens. 2009, 35, 297–309. [Google Scholar] [CrossRef]
  23. Prieto, I.; Izkara, J.L.; Usobiaga, E. The application of lidar data for the solar potential analysis based on urban 3D model. Remote Sens. 2019, 11, 2348. [Google Scholar] [CrossRef] [Green Version]
  24. Gawley, D.; McKenzie, P. Investigating the suitability of GIS and remotely-sensed datasets for photovoltaic modelling on building rooftops. Energy Build. 2022, 265, 112083. [Google Scholar] [CrossRef]
  25. Lastilla, L.; Belloni, V.; Ravanelli, R.; Crespi, M. DSM generation from single and cross-sensor multi-view satellite images using the new agisoft metashape: The case studies of Trento and Matera (Italy). Remote Sens. 2021, 13, 593. [Google Scholar] [CrossRef]
  26. Beltran-Velamazan, C.; Monzón-Chavarrías, M.; López-Mesa, B. A method for the automated construction of 3D models of cities and neighborhoods from official cadaster data for solar analysis. Sustainability 2021, 13, 6028. [Google Scholar] [CrossRef]
  27. Amaro, R.; Blanc, P. Estimating Global Horizontal Irradiance at the Urban Level: A Sensitivity Analysis Using Different Digital Surface Models. In Proceedings of the 8th World Conference on Photovoltaic Energy Conversion, Milan, Italy, 26–30 September 2022. [Google Scholar]
  28. Desthieux, G.; Carneiro, C.; Camponovo, R.; Ineichen, P.; Morello, E.; Boulmier, A.; Abdennadher, N.; Dervey, S.; Ellert, C. Solar energy potential assessment on rooftops and facades in large built environments based on lidar data, image processing, and cloud computing. Methodological background, application, and validation in Geneva (solar cadaster). Front. Built Environ. 2018, 4, 14. [Google Scholar] [CrossRef]
  29. Govehovitch, B.; Thebault, M.; Bouty, K.; Giroux-Julien, S.; Peyrol, É.; Guillot, V.; Ménézo, C.; Desthieux, G. Numerical Validation of the Radiative Model for the Solar Cadaster Developed for Greater Geneva. Appl. Sci. 2021, 11, 8086. [Google Scholar] [CrossRef]
  30. Polo, J.; Martín-Chivelet, N.; Sanz-Saiz, C. BIPV Modeling with Artificial Neural Networks: Towards a BIPV Digital Twin. Energies 2022, 15, 4173. [Google Scholar] [CrossRef]
  31. Polo, J.; Martín-Chivelet, N.; Alonso-Abella, M.; Alonso-García, C. Photovoltaic generation on vertical façades in urban context from open satellite-derived solar resource data. Sol. Energy 2021, 224, 1396–1405. [Google Scholar] [CrossRef]
  32. Spanish Geographic National Institute Download Centre of the IGN. Available online: https://centrodedescargas.cnig.es/CentroDescargas/buscadorCatalogo.do?# (accessed on 29 November 2022).
  33. Jebur, A.K.; Tayeb, F.A.; Jawad, Z.S. Show the Potential of Agisoft Photoscan Software to Create a 3D Model for Salhiyah Residential Complex in Baghdad Based on Aerial Photos. IOP Conf. Ser. Mater. Sci. Eng. 2020, 745, 012132. [Google Scholar] [CrossRef]
  34. Peña-Villasenín, S.; Gil-Docampo, M.; Ortiz-Sanz, J. Desktop vs. cloud computing software for 3D measurement of building façades: The monastery of San Martín Pinario. Meas. J. Int. Meas. Confed. 2020, 149, 106984. [Google Scholar] [CrossRef]
  35. Mueller, R.W.; Matsoukas, C.; Gratzki, A.; Behr, H.D.; Hollmann, R. The CM-SAF operational scheme for the satellite based retrieval of solar surface irradiance—A LUT based eigenvector hybrid approach. Remote Sens. Environ. 2009, 113, 1012–1024. [Google Scholar] [CrossRef]
  36. Mueller, R.; Behrendt, T.; Hammer, A.; Kemper, A. A New Algorithm for the Satellite-Based Retrieval of Solar Surface Irradiance in Spectral Bands. Remote Sens. 2012, 4, 622–647. [Google Scholar] [CrossRef] [Green Version]
  37. Amillo, A.; Huld, T.; Müller, R. A New Database of Global and Direct Solar Radiation Using the Eastern Meteosat Satellite, Models and Validation. Remote Sens. 2014, 6, 8165–8189. [Google Scholar] [CrossRef] [Green Version]
  38. Sengupta, M.; Habte, A.; Wilbert, S.; Gueymard, C.; Remund, J. Best Practices Handbook for the Collection and Use of Solar Resource Data for Solar Energy Applications: Third Edition; Report IEA-PVPS 16-04:2021; International Energy Agency: Paris, France, 2021. [Google Scholar]
  39. Driesse, A.; Zaaiman, W.; Riley, D.; Taylor, N.; Stein, J.S. Investigation of pyranometer and photodiode calibrations under different conditions. In Proceedings of the IEEE Photovoltaic Specialists Conference, Portland, OR, USA, 5–10 June 2016; Volume 43. [Google Scholar]
  40. Urraca, R.; Gracia-Amillo, A.M.; Koubli, E.; Huld, T.; Trentmann, J.; Riihelä, A.; Lindfors, A.V.; Palmer, D.; Gottschalg, R.; Antonanzas-Torres, F. Extensive validation of CM SAF surface radiation products over Europe. Remote Sens. Environ. 2017, 199, 171–186. [Google Scholar] [CrossRef] [PubMed]
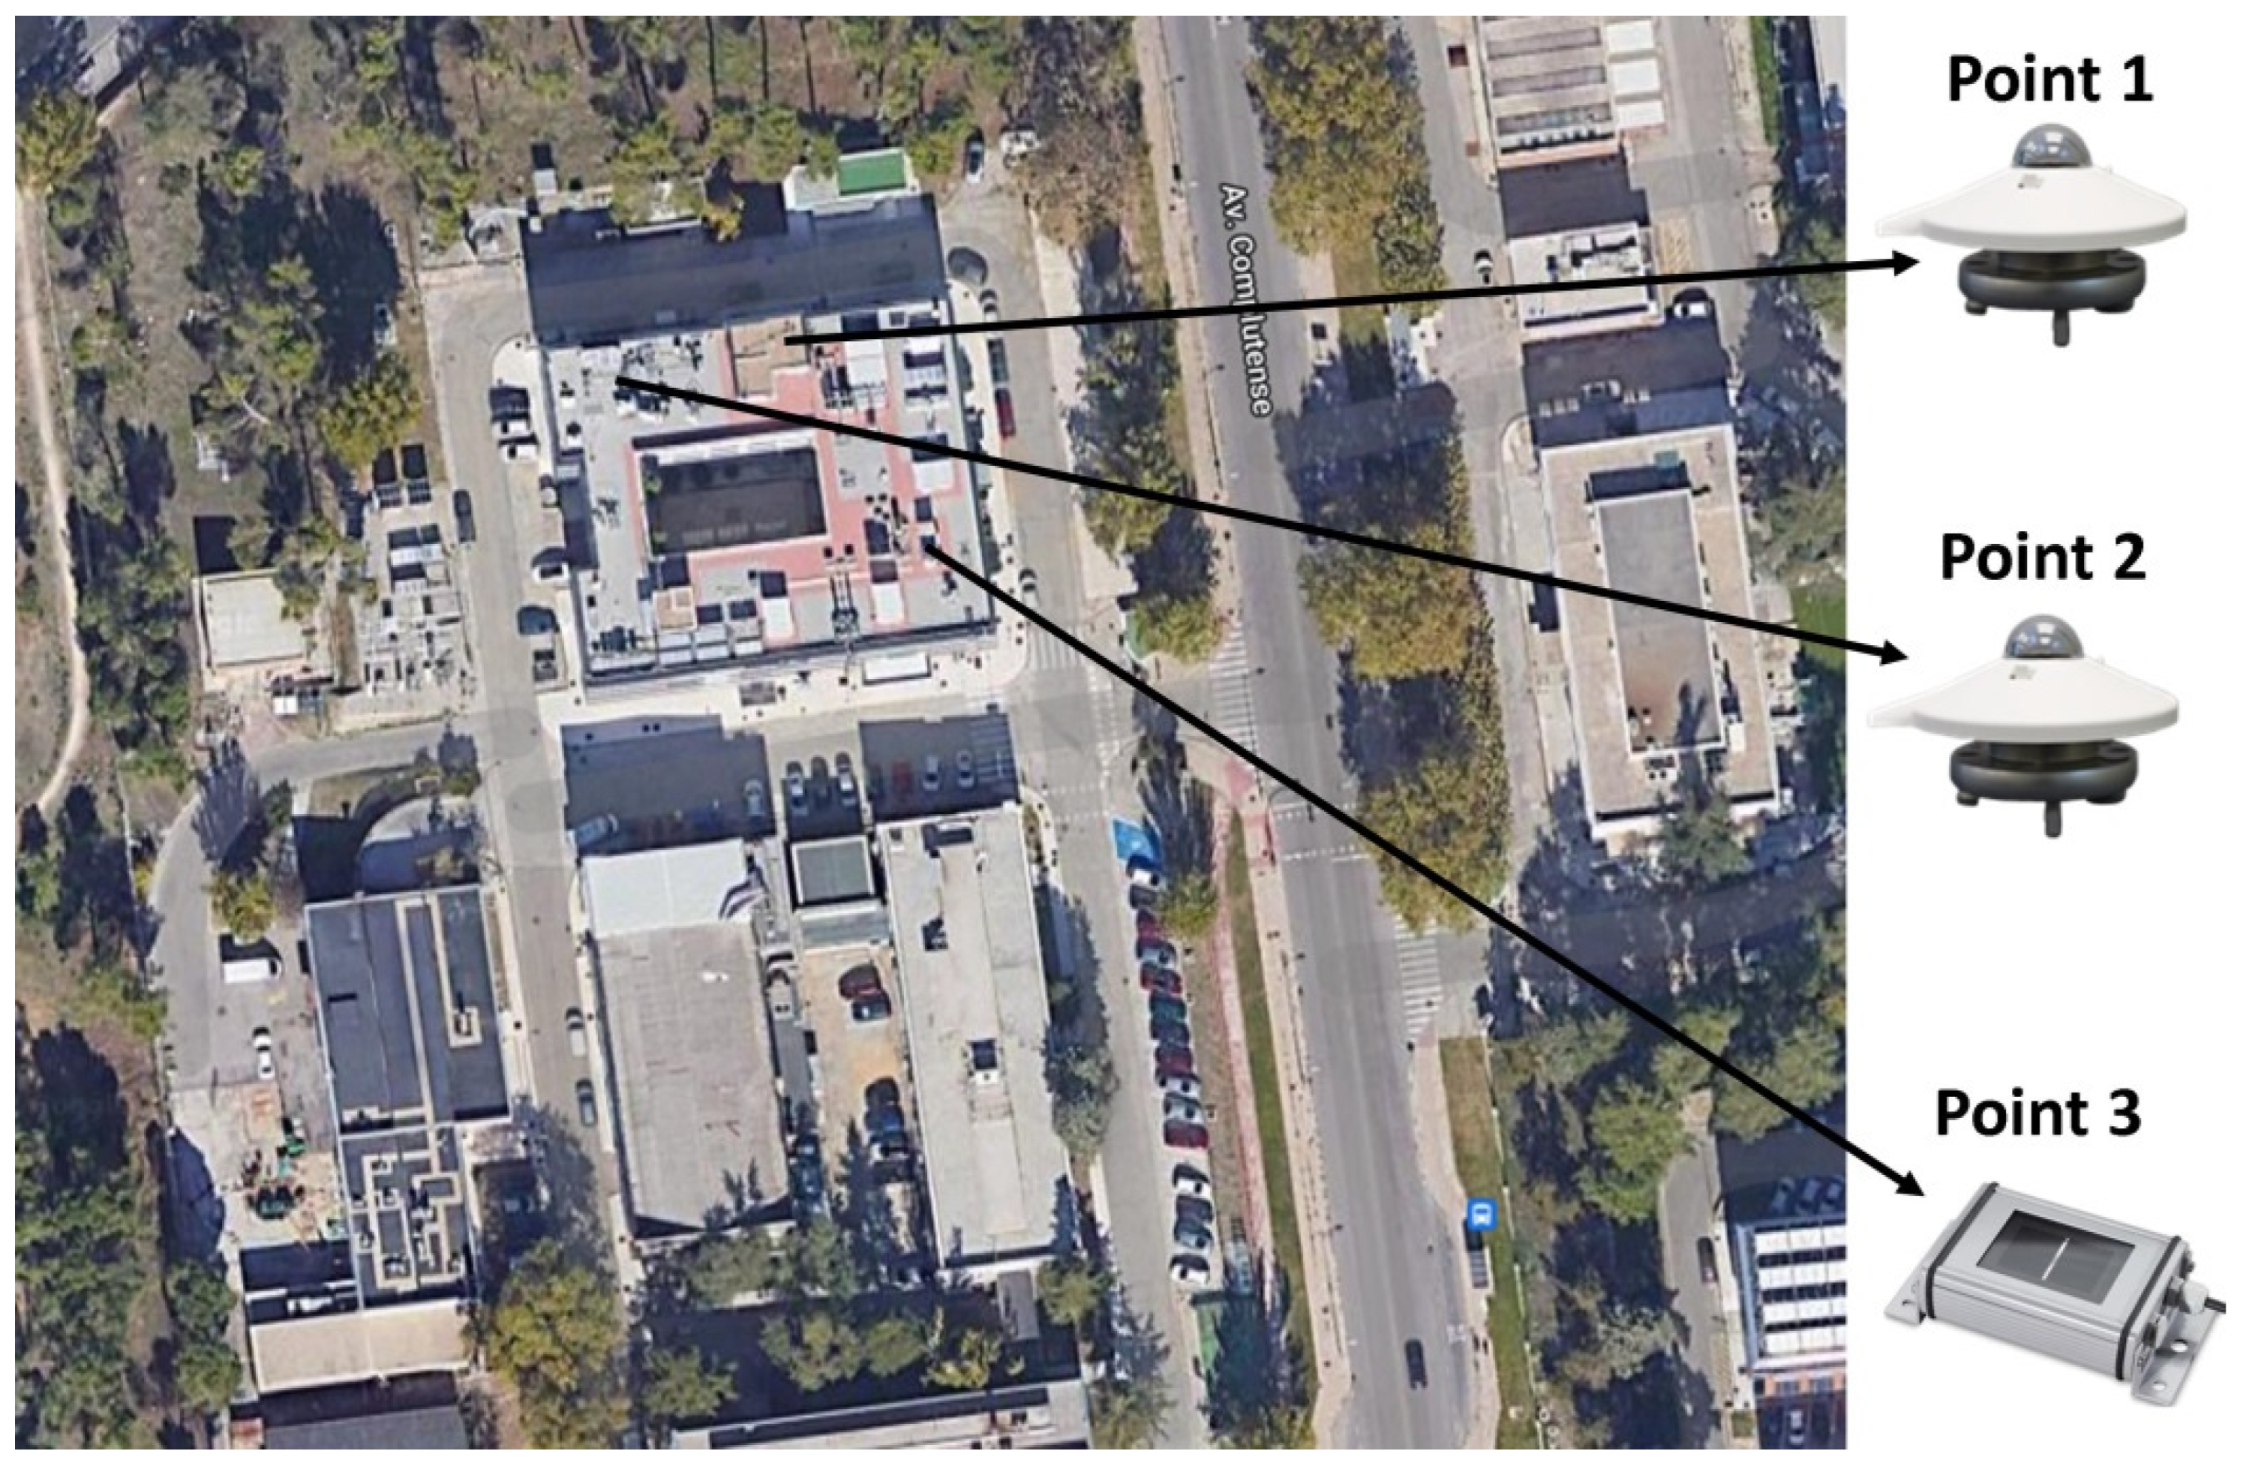
Figure 1. Image of the area under study with the building 42 in the center, including the measuring points placed on the rooftop.
Remotesensing 15 00567 g001
Figure 2. 3D model of the urban environment in Ciemat campus Madrid from photogrammetry process.
Remotesensing 15 00567 g002
Figure 3. Comparison between the DSMs generated from LiDAR data and from photogrammetry.
Remotesensing 15 00567 g003
Figure 4. Comparison of sky view factors (SVF) computed from LiDAR and Photogravimetry DSMs.
Remotesensing 15 00567 g004
Figure 5. Shadow patterns for 21st June at 12:00 UTC and 21st December at 12:00 UTC.
Remotesensing 15 00567 g005
Figure 6. Comparison of annual irradiation maps generated with each DSM (kWh m−2).
Remotesensing 15 00567 g006
Figure 7. Annual horizontal irradiation on the building 42 rooftop in 2019 (kWh m−2).
Remotesensing 15 00567 g007
Figure 8. Assessment of monthly horizontal irradiation.
Remotesensing 15 00567 g008
Table 1. RMSD values at the different measuring points in percentages.
DSMPoint 1 (%)Point 2 (%)Point 3 (%)
LiDAR DSM231338
Photo DSM25949
Disclaimer/Publisher’s Note: The statements, opinions and data contained in all publications are solely those of the individual author(s) and contributor(s) and not of MDPI and/or the editor(s). MDPI and/or the editor(s) disclaim responsibility for any injury to people or property resulting from any ideas, methods, instructions or products referred to in the content.

