1. Introduction
The forest ecosystems, as a crucial carbon pool, are the predominant component of the terrestrial ecosystem and have made great contributions to the regional and global carbon cycles [
1], storing about 45% of the carbon in the entire terrestrial ecosystem [
2]. The carbon sequestration capacity of forest ecosystems is being directly or indirectly weakened by global climate change and long-term human interference [
3,
4,
5]. The global carbon balance is regulated by forest ecosystems, which slow the increase in greenhouse gas concentrations like CO
2 in the atmosphere, thus slowing global warming and providing an effective respond to climate change [
6,
7]. Compared to industrial emission reductions, forest carbon sequestration is more cost-effective in terms of social and economic aspects [
8,
9] and is the most effective and environmentally friendly method to strengthen carbon storage [
10,
11,
12,
13]. To better respond to climate change, China proposed for the first time in 2020 that the country will aim to achieve peak and carbon neutrality. In March 2021, the overall layout of ecological civilization construction was explicitly proposed to effectively exert the carbon sequestration effect of forests and other factors and enhance the ecosystem’s carbon sink capacity. Forest vegetation plays an important role in the carbon cycle and carbon storage. Studying the current situation of carbon sequestration in forest resources and predicting future potential can help policy-makers better recognize the current situation, formulate effective strategies to strengthen forest carbon sequestration, plan more reasonable forest management and control policies, and effectively unleash the carbon sequestration potential. This has important reference value for forest management and the further realization of “carbon neutrality” goals in China.
Forest management is a significant approach to addressing environmental challenges and climate change issues [
14]. By understanding the current status of forest carbon sequestration, scientific and data support can be provided for forest management and control. In the early stages of research, scholars used eddy covariance technology to calculate forest carbon sinks in terms of carbon flux [
15,
16]. Due to the need for long-term maintenance and its susceptibility to adverse weather conditions [
17], the size of carbon sinks at the regional scale has been estimated less frequently using this approach. The vegetation net primary productivity (NPP) value can represent the net carbon sequestration of plants via photosynthesis. The changing trend of NPP in Romanian forests was investigated by Remus et al. [
18] based on machine learning algorithms and statistical procedures. Abdulla et al. [
19] used the InVEST model to study forest carbon storage in Bangladesh. Some scholars have used the resource inventory data or literature references from different time periods to estimate changes in forest carbon storage, and the results indicate that forest ecosystems have enormous carbon sequestration potential [
20,
21]. However, many national or global forest resource survey data are not designed specifically for continuous use, and due to the long update cycle, they are unable to respond to real-time demand, which creates uncertainty in research on carbon sequestration status.
With the continuous development of machine learning algorithms and to make calculations more accurate, research has often focused on integrating multiple methods and data from different perspectives to quantitatively estimate carbon sequestration potential. Chen et al. [
22] described the changes in forest biomass in China by using a machine learning method that combined several types of remote sensing observations with intensive field measurements. Sunayana et al. [
23] fused remote sensing and field analysis data to estimate carbon sequestration and potential from indicators like the normalized difference vegetation index (NDVI). Some scholars have built a multi-scenario path model to simulate future carbon sequestration potential changes in order to predict it, such as Lü et al. [
24] quantified the carbon sinks of forests in Southwest China under different climate change scenarios in the next 40 years by using forest ecosystem carbon budget model for China (FORCCHN). Zhu et al. [
25] used the InVEST model to describe the impact of land use change on coastal ecosystems carbon stocks, and Rasoul et al. [
26] used the soil carbon model(Yasso) to predict changes in forest carbon stocks under different frequencies of storms and climate change scenarios. These studies mostly covered large-scale areas such as countries and watersheds, with little mention of provincial-scale regions in interprovincial regions and counties, and they failed to specifically describe their dynamic spatial changes. The calculation of forest carbon sequestration potential is affected by the complexity of forest factors (such as age and species), uncertainty of climate conditions, variability of human activities and management policies, and differences in model methods, data sources, and scales, resulting in certain deviations in the final calculation results.
The exploration of influencing factors not only provides a new perspective on the precise prediction of carbon sequestration potential but also provides new ideas for policy-makers to issue articles to effectively leverage the benefits of carbon sequestration in forests. From the forest perspective, Huang et al. [
27] used biomass regression equations to calculate carbon stocks and revealed the influence of forest vegetation types on ecosystem carbon stocks and their distribution patterns. Francis et al. [
28] found that cutting down vines in forest trees can improve the carbon sequestration rate and wood yield. Under the external factors affecting climate conditions, Swanston et al. [
29] synthesized The Climate Change Response Framework (CCRF) to assess the impacts of forests in the Midwestern and Northern United States by the effects of climate conditions. Baker et al. [
30] used an empirical forest composition model to clarify the effects of climatic factors and other environmental parameters on the carbon sequestration of 94 forest species across the United States. In terms of human management, Sha et al. [
31] found that optimization of land management could significantly increase the carbon sink of terrestrial vegetation using simulating land management. These studies focused mostly on one aspect of the driving factors of forest carbon sequestration, neglecting the integrated analysis of various influencing factors such as terrain, government policy documents, and human activities. Forest growth is a dynamic and synergistic process, and in studying the influencing factors of forest carbon sequestration potential, it is essential to cross multiple disciplines and comprehensively consider the actual situation.
Research on carbon sequestration in forest vegetation is mostly based on field measurements, national inventory data, and satellite remote sensing data. Various models and methods are used to study the current status, potential, and drivers of carbon sequestration in forest vegetation. At the data level, large-scale national or global perspectives are carried out using national inventory or remote sensing data, while measured data are mainly provincial scale, but they are difficult to sustain due to limitations in human, material, and financial resources. The consideration of models and methods has not been comprehensive enough, focusing on the inherent properties of forest vegetation carbon and often without regard to the impact of external factors such as climate. The difficulty in obtaining relevant parameters is also a challenge, and few scholars have evaluated the carbon sequestration potential from the perspective of the carbon sequestration rate. Overall, there are three issues need to be addressed: (1) how to estimate the status of carbon sequestration in forest vegetation at the provincial scale; (2) how to clarify the spatiotemporal differentiation characteristics and evolutionary trends of carbon sequestration potential; (3) how to clarify the evolution and driving mechanism of carbon sequestration potential under the multi-scenario paths.
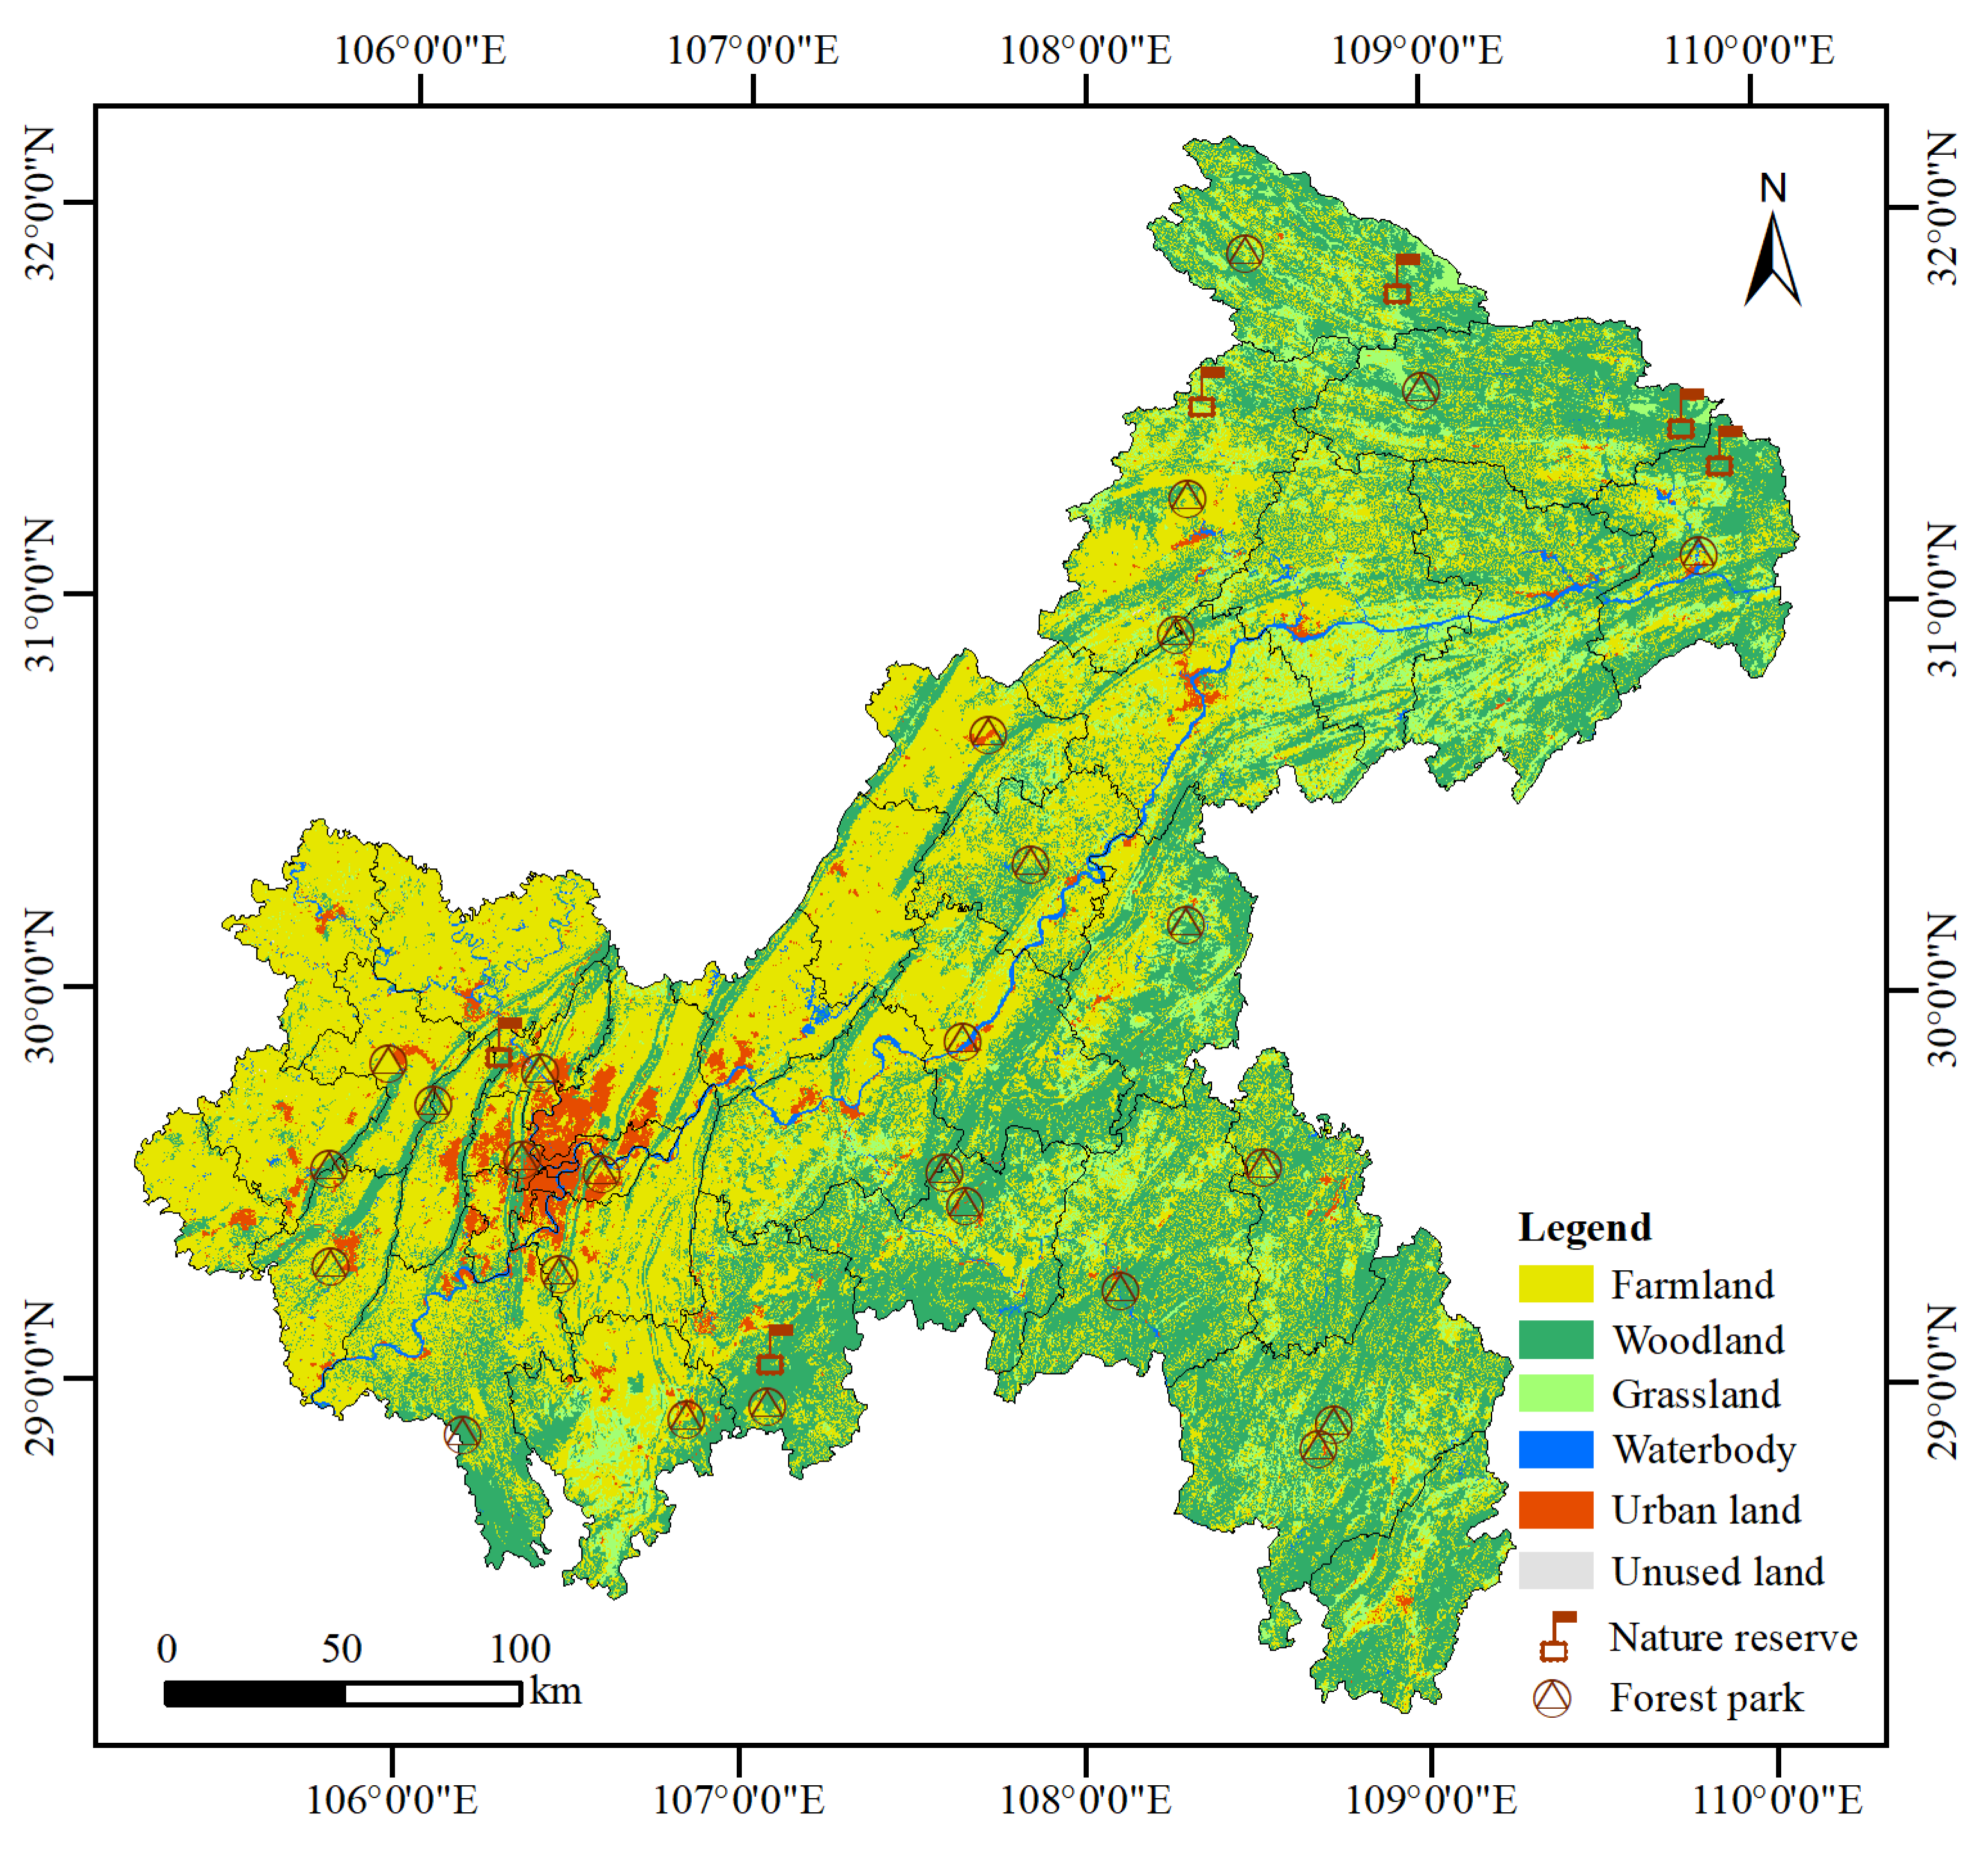
This study was designed to construct a provincial scale assessment model for the current state of carbon sequestration in forest vegetation and to estimate the carbon sequestration potential of forest vegetation on the basis of understanding the current state of carbon sequestration by combining factors such as forest vegetation growth and climate conditions, and simulate the pattern of change in the rate of carbon sequestration of forest vegetation in the future under multi-scenario pathways, the spatial dynamic trend and the driving mechanism. This study chose Chongqing to research, and first, the NPP of forest vegetation was calculated based on the CASA model to quantitatively assess the current status of carbon sequestration in Chongqing. Then, we assessed the carbon sequestration potential of forest vegetation based on the FCS model by calculating the carbon storage to analyze the spatial and temporal difference of forest carbon sequestration potential in Chongqing and analyzed the regional imbalance of forest carbon sequestration potential. Finally, we simulated the evolution trend of carbon sequestration potential in the future using multiple scenarios, revealed the feedback relationships between the carbon sequestration rate and multiple factors, fully utilized the carbon sequestration capacity, and provided a scientific basis for promoting the improvement in the carbon sequestration efficiency of forest vegetation in Chongqing and achieving the carbon neutrality goals.
3. Results
3.1. Analysis of Spatiotemporal Pattern Dynamic of the Carbon Sequestration in Chongqing Forest Vegetation
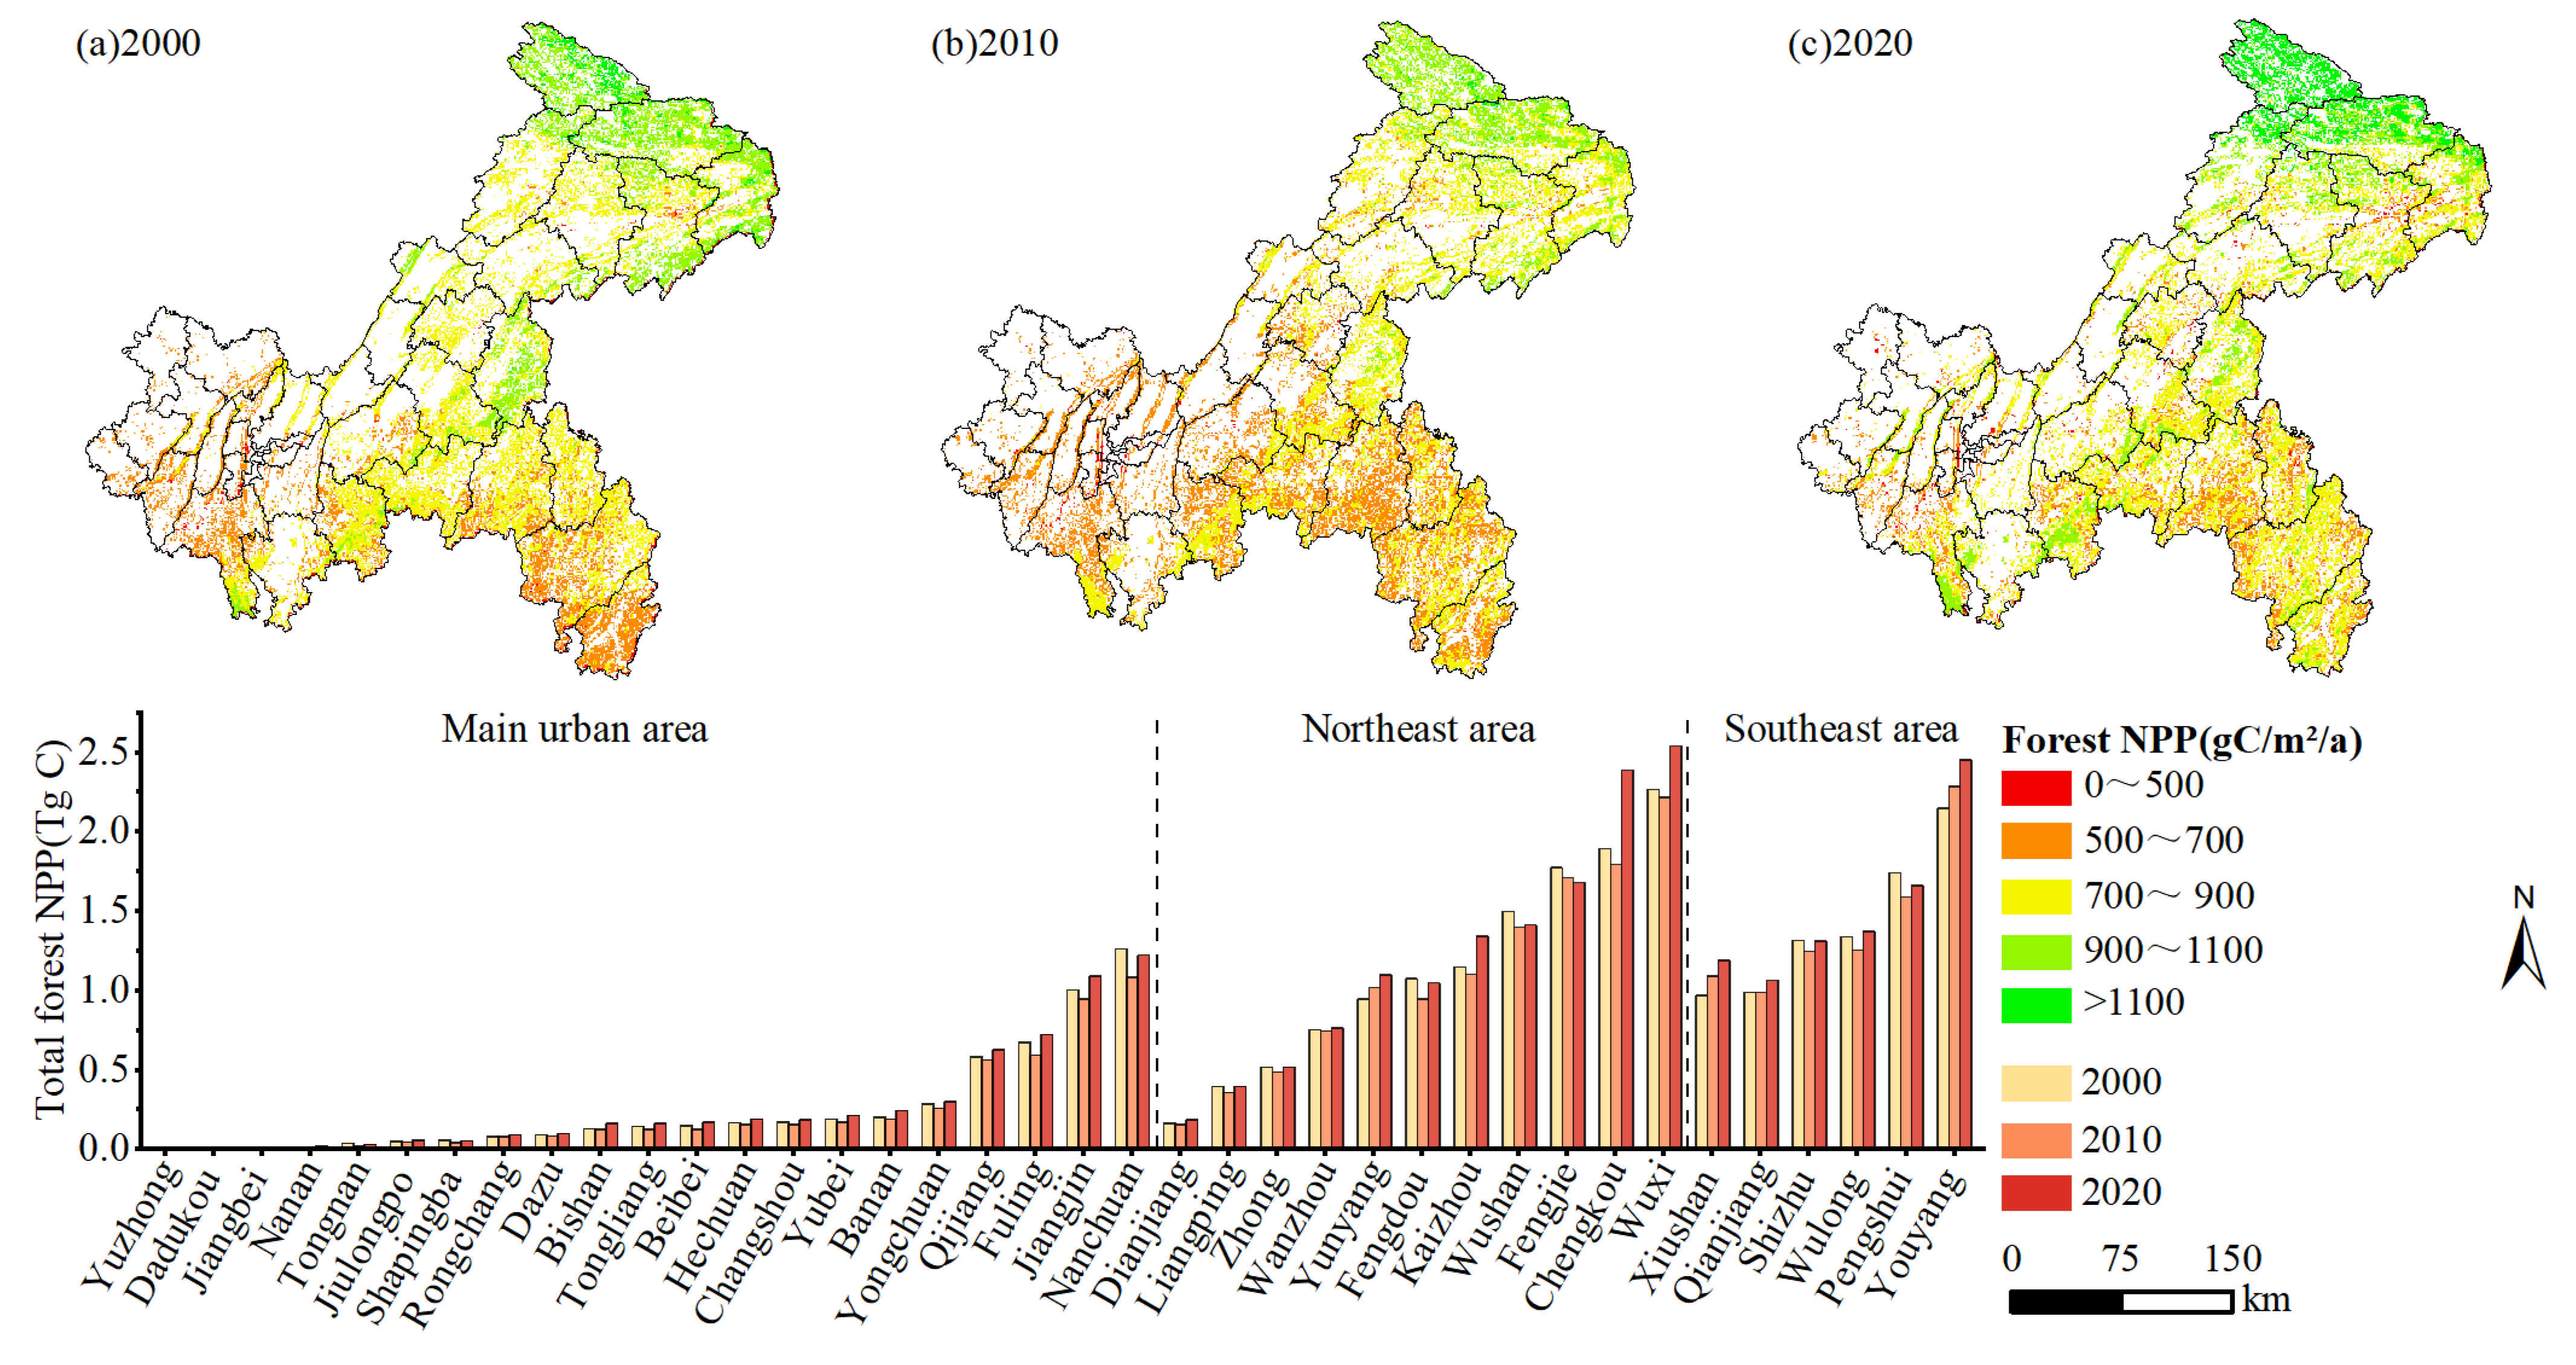
From the overall spatial distribution of forest vegetation NPP results calculated using the CASA model in
Figure 2, the forest vegetation NPP in Chongqing was characterized by a high value in the northeast, followed by a lower value in the southeast, and an even lower value in the southwest. From 2000 to 2020, the total NPP of the forest vegetation in Chongqing first decreased and then increased. From 2000 to 2010, the average NPP decreased from 805.44 g C/m
2 to 748.67 g C/m
2 and then increased to 839.75 g C/m
2 in 2020. The total amount of NPP first decreased from 26.33 Tg C to 25.29 Tg C and then increased to 28.19 Tg C.
The high-value areas of forest vegetation NPP were mainly concentrated in northeastern Chongqing, with an average vegetation NPP of more than 700 g C/m2 and an average total NPP of 12.82 Tg C, which accounts for 47.79% of the total amount in Chongqing. The low-value areas were mainly concentrated in the main urban areas, where the average vegetation NPP was below 700 g C/m2 and an average total NPP of 8.68 Tg C, accounting for 19.87% of the total amount in Chongqing. The top three districts and counties with the largest average total NPP were Youyang, Wuxi, and Chengkou. Their average total NPP is 2.34 Tg C, 2.30 Tg C, and 2.03 Tg C, respectively, accounting for 8.80%, 8.63%, and 7.62% of the total in Chongqing. The three districts and counties with the lowest average total NPP were Yuzhong, Dadukou, and Jiangbei. Their average total NPP was less than 0.01 Tg C, 0.01 Tg C, and 0.02 Tg C, respectively, accounting for 0.01%, 0.04%, and 0.06% of the total in Chongqing.
3.2. Analysis of Spatiotemporal Pattern Dynamic of the Carbon Storage in Chongqing Forest Vegetation
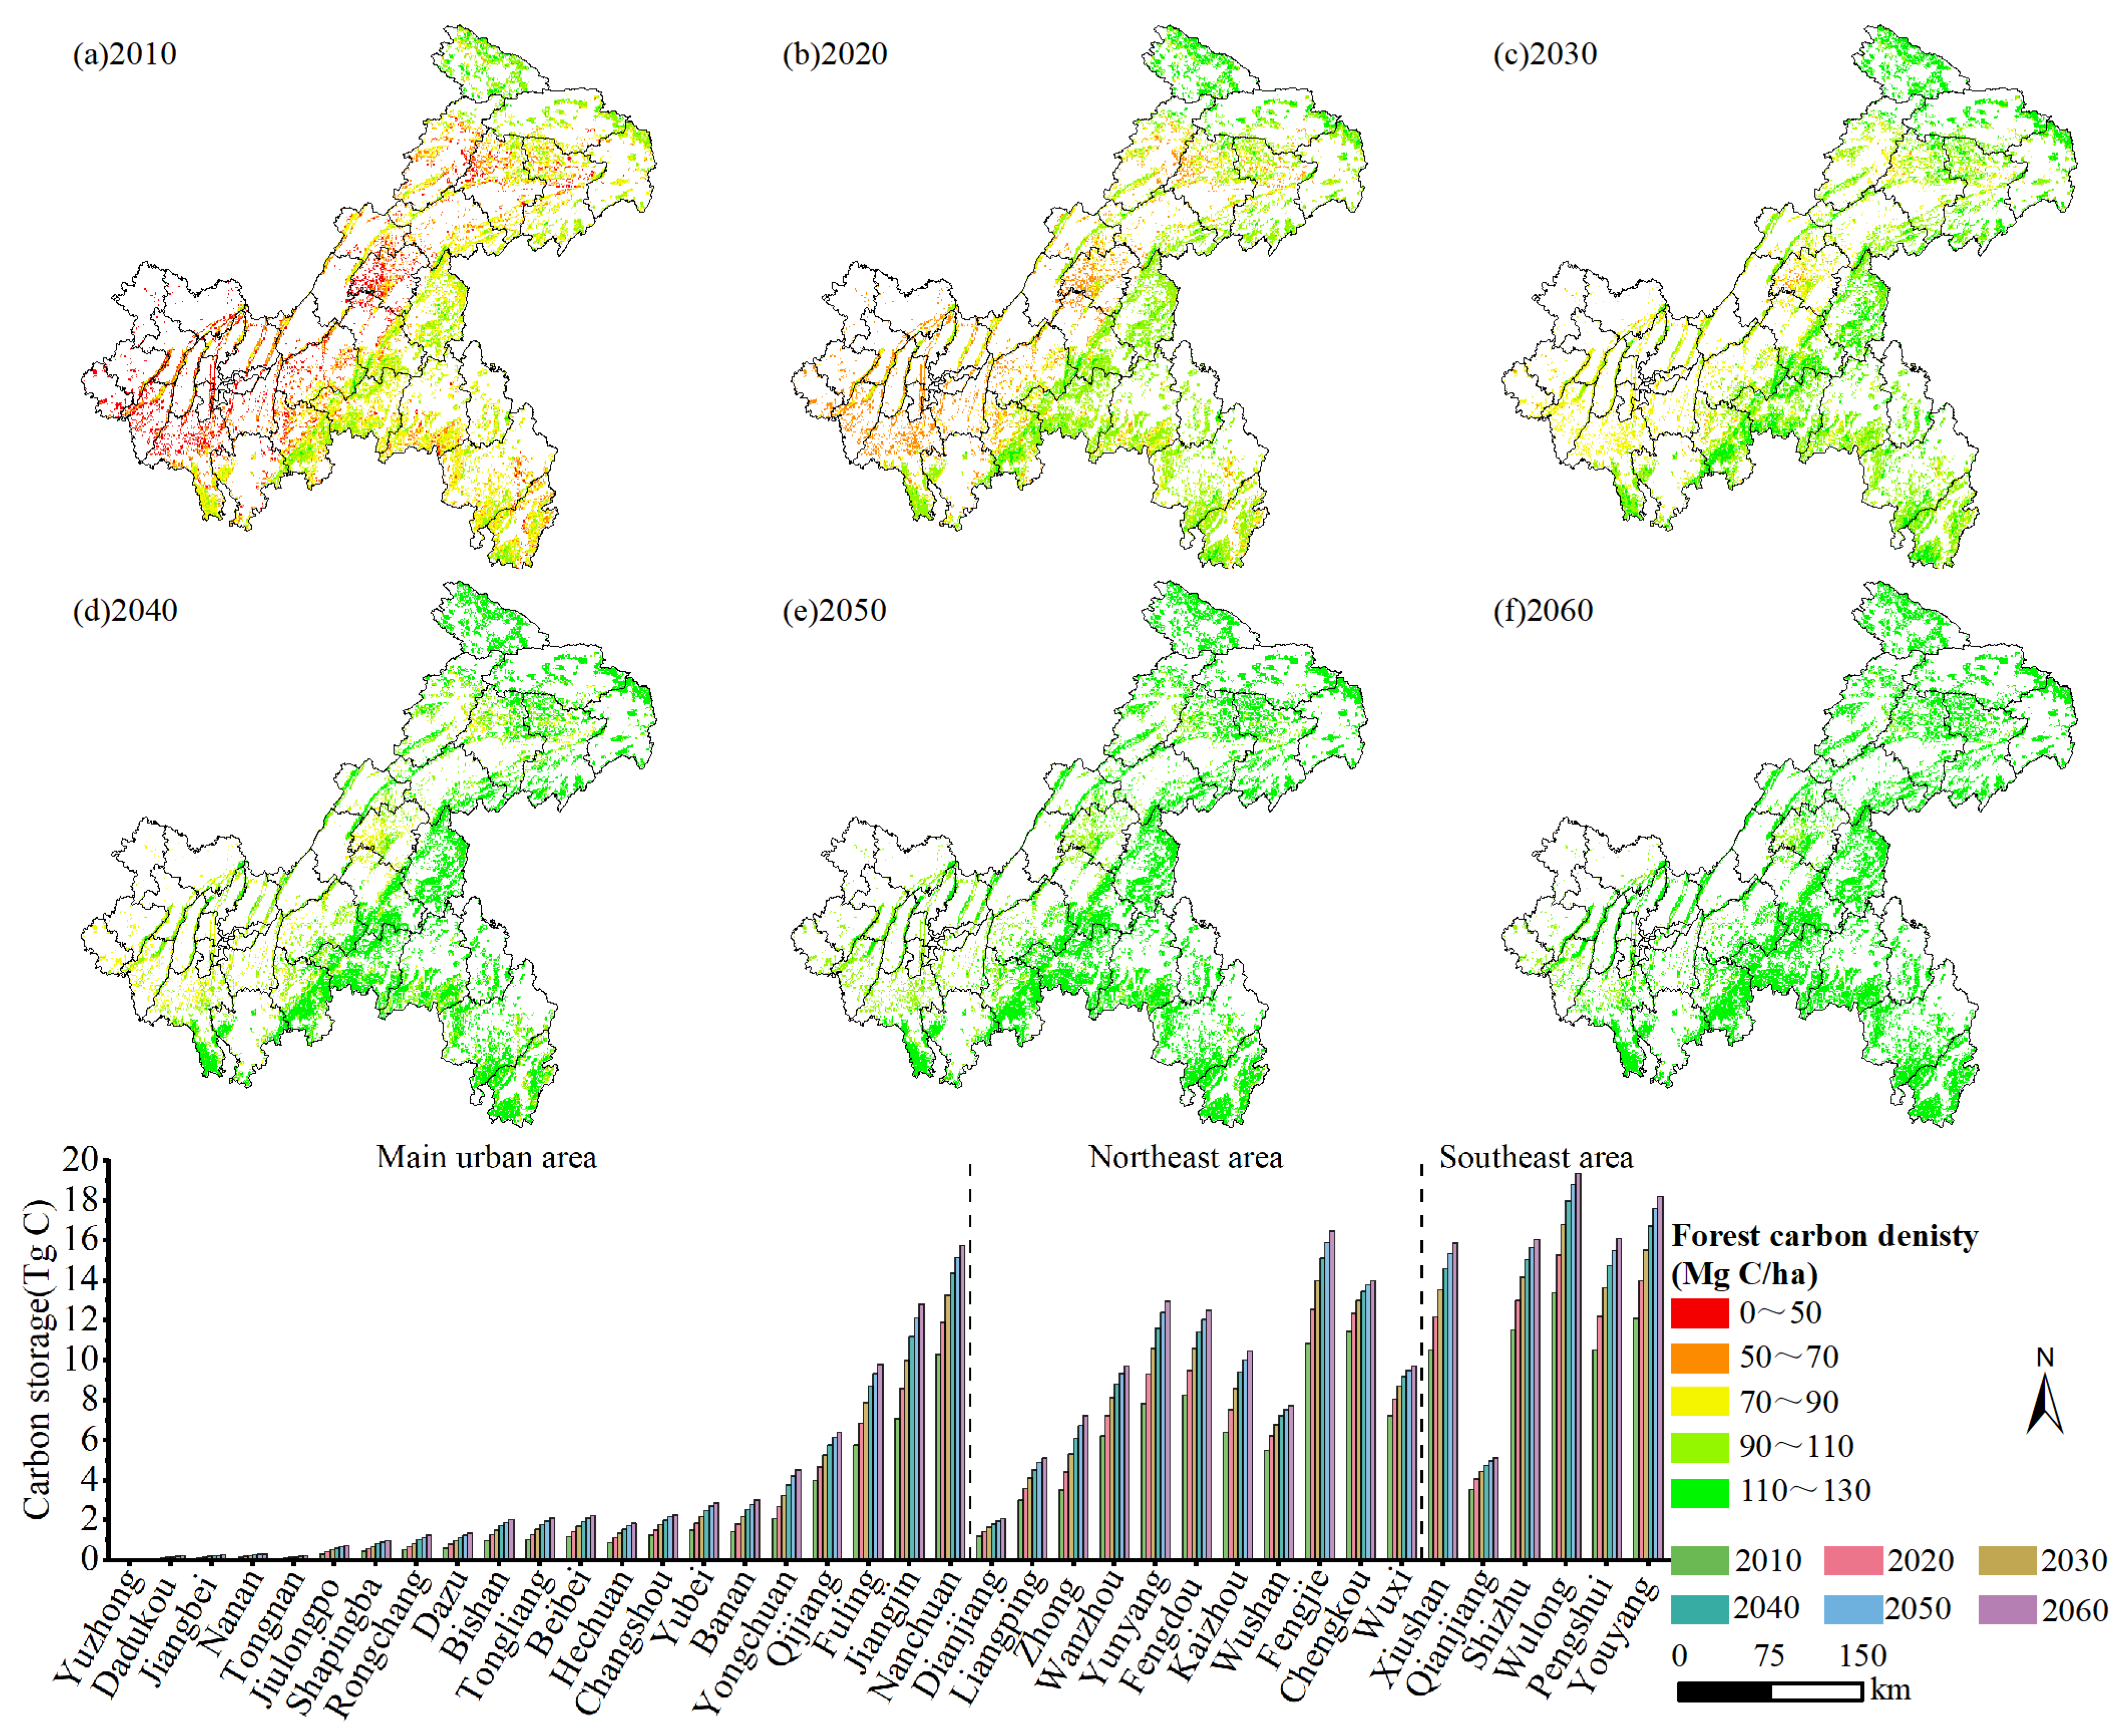
Using the FCS model to calculate the carbon storage of the forest vegetation in Chongqing from 2010 to 2060 while keeping the existing forest area unchanged and averaging the four future climate scenarios (
Figure 3). The spatial distribution pattern of carbon storage in 2010–2020 was consistent with the current NPP status, and there was no significant change. It showed a characteristic of high carbon storage in the northeast region, followed by the southeast, while the lowest carbon storage was in the southwest. Over time, the carbon storage of the forest vegetation increased yearly, gradually reaching a saturation state. By 2060, the forest carbon density will reach 130 Mg C/ha.
From 2010 to 2060, the carbon storage of forest vegetation every 10 was 173.00 Tg C, 201.19 Tg C, 225.43 Tg C, 244.85 Tg C, 259.47 Tg C, and 269.94 Tg C. Forests in the northeastern and southeastern regions had the highest carbon storage value. The carbon storage rose from 71.53 Tg C and 61.56 Tg C in 2010 to 108.03 Tg C and 90.75 Tg C in 2060, increases of 51.03% and 47.41%, respectively. Low carbon storage areas were mainly distributed near the main urban areas, with carbon storage increasing from 39.91 Tg C in 2010 to 71.16 Tg C in 2060, an increase of 78.30%. The top three counties with the highest carbon storage were Wulong, Youyang, and Shizhu, with 13.37 Tg C, 12.09 Tg C, and 11.51 Tg C, respectively, but their forest area rankings were the sixth, first, and eighth; the top three counties with the lowest carbon storage were Yuzhong, Dadukou, and Tongnan, which were all less than 0.1 Tg C, and their forest area rankings were the lowest, the second lowest and the fifth lowest. It showed that carbon storage was not only directly related to forest area but related to other factors such as climate.
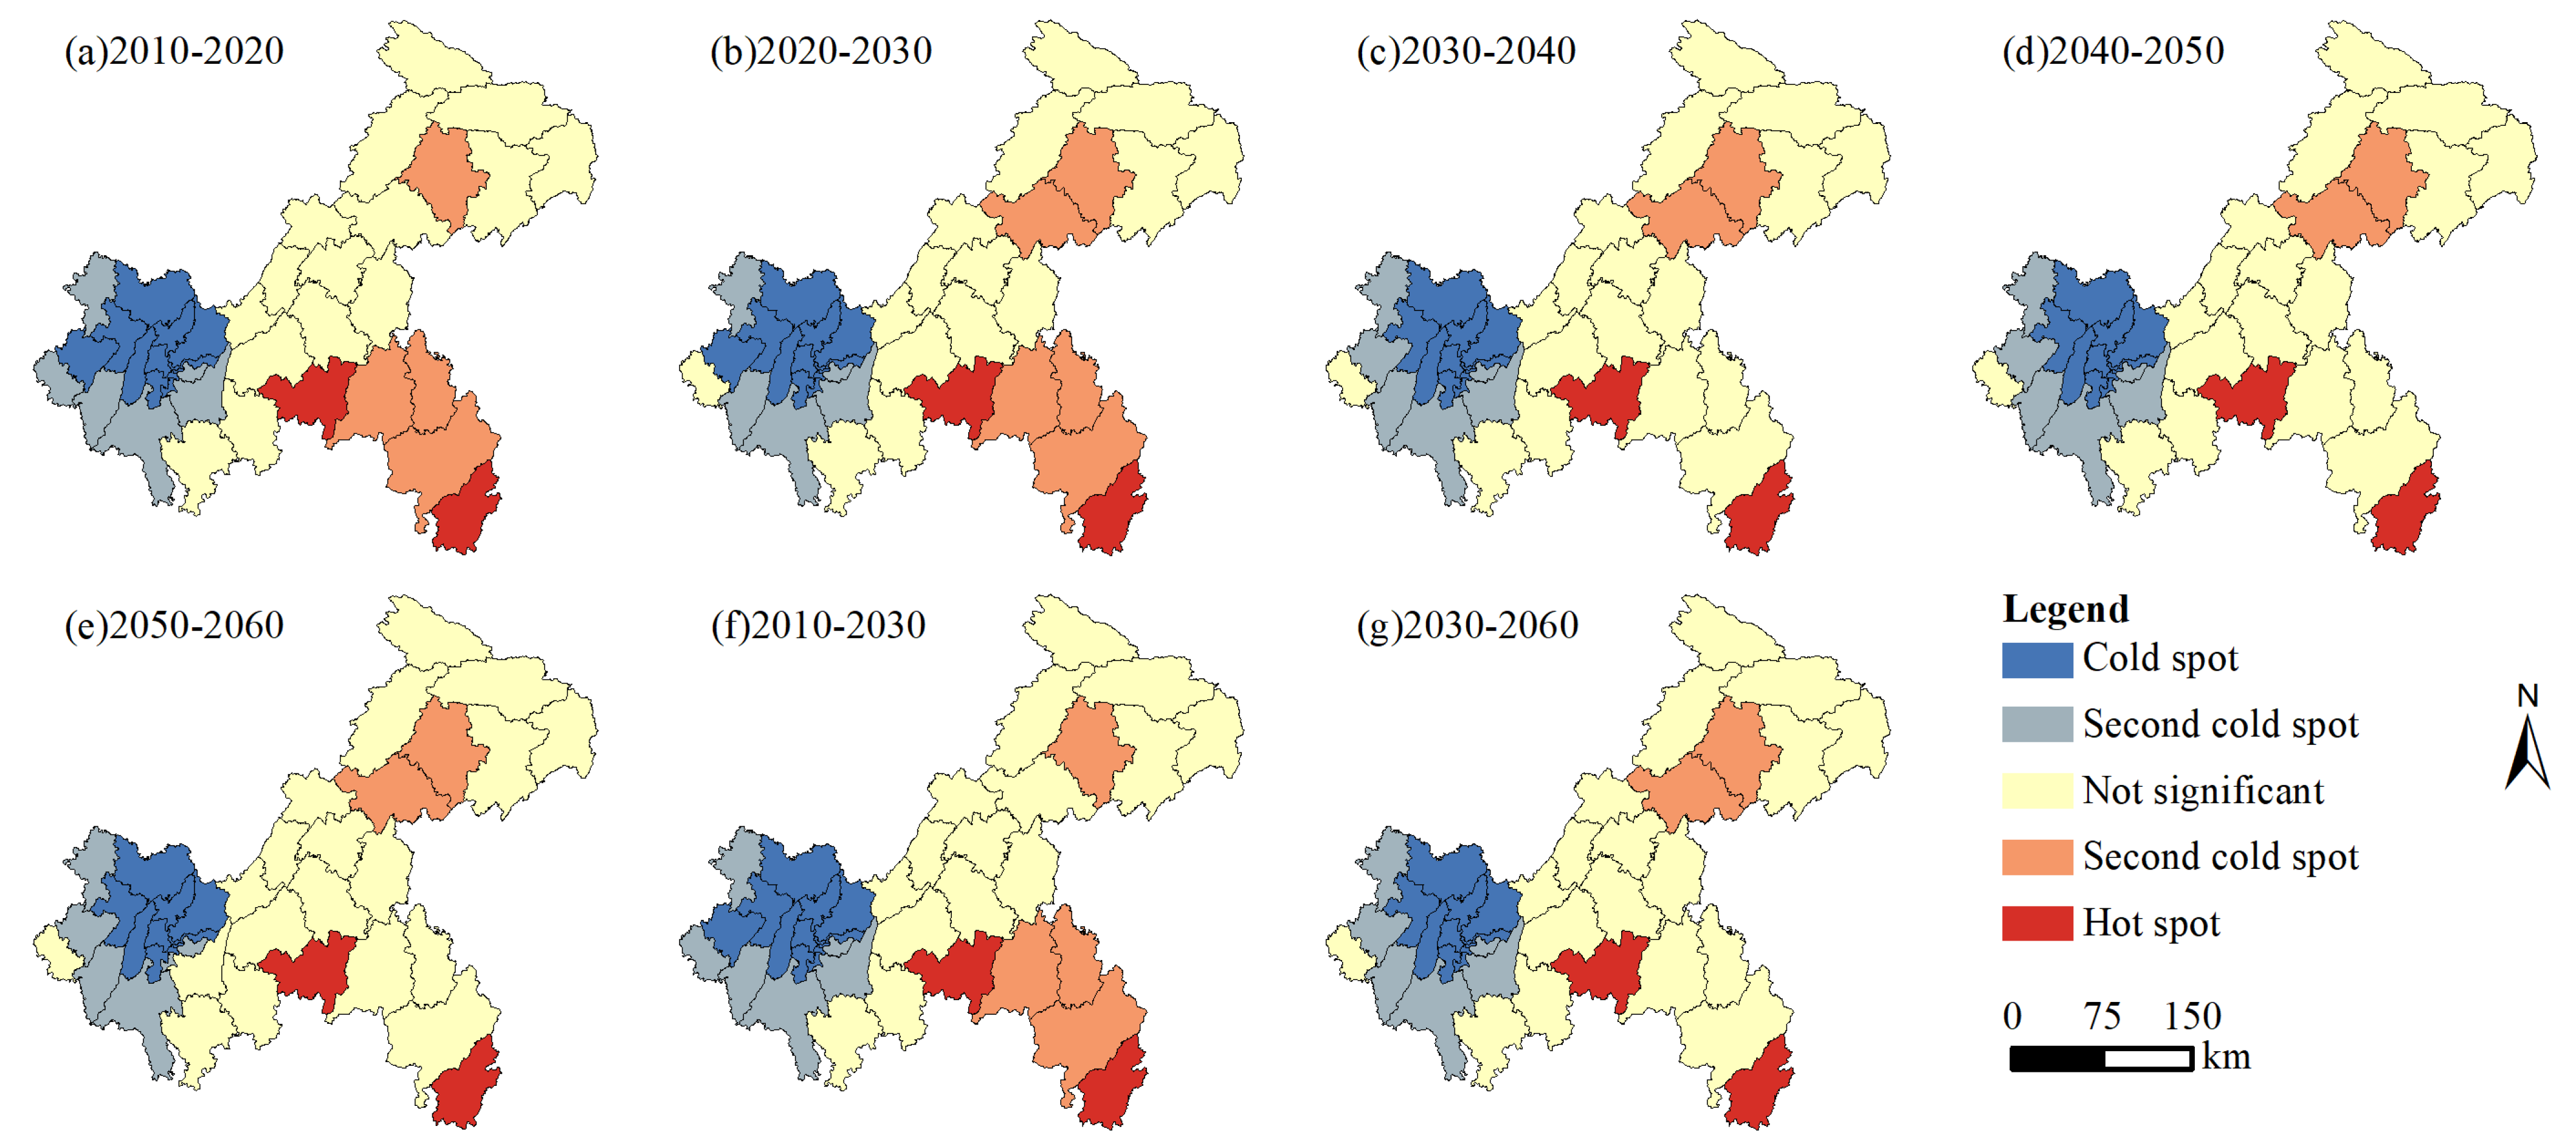
To further analyze the clustering characteristics of forest vegetation carbon storage changes, the Getis-Ord G*i index was used in ArcGIS10.5 to study the local characteristics of cold and hot spots of forest vegetation carbon storage in Chongqing from 2010 to 2060. The values of the Getis-Ord G*i index of the study unit have been divided into five categories based on the method of the natural fracture and were represented in ascending order as cold spot, second cold spot, not significant, second hot spot, and hot spot, according to
Figure 4.
From 2010 to 2060, the cold spot and hot spot areas of forest vegetation carbon storage in Chongqing were clearly separated, with clear differences and boundaries. Overall, the hot spot areas were scattered, mainly concentrated in Xiushan, Youyang, Qianjiang, Pengshui, and Wulong in southeastern Chongqing, as well as Yunyang and Wanzhou in northeastern Chongqing, while the cold spot areas were focused in the main urban areas. From 2020 to 2030, compared to the previous stage, Rongchang transformed from a second cold spot to not significant, while Wanzhou developed from not significant to a second hot spot, as shown in
Figure 4a,b. From 2030 to 2040, there were significant changes in cold and hot spot areas, with a significant reduction in hot spot areas, primarily due to the transition from second cold spot areas to not significant areas in Youyang, Qianjiang, and Pengshui, as shown in
Figure 4c. From 2040 to 2050, the classification remained consistent with the previous stage, and from 2050 to 2060, Banan developed from a second cold spot to not significant, as shown in
Figure 4d,e. Compared to 2030–2060, the spatial differences between 2010–2030 were more significant, with cold and hot spots being more concentrated and the carbon sequestration potential being greater (
Figure 4f,g).
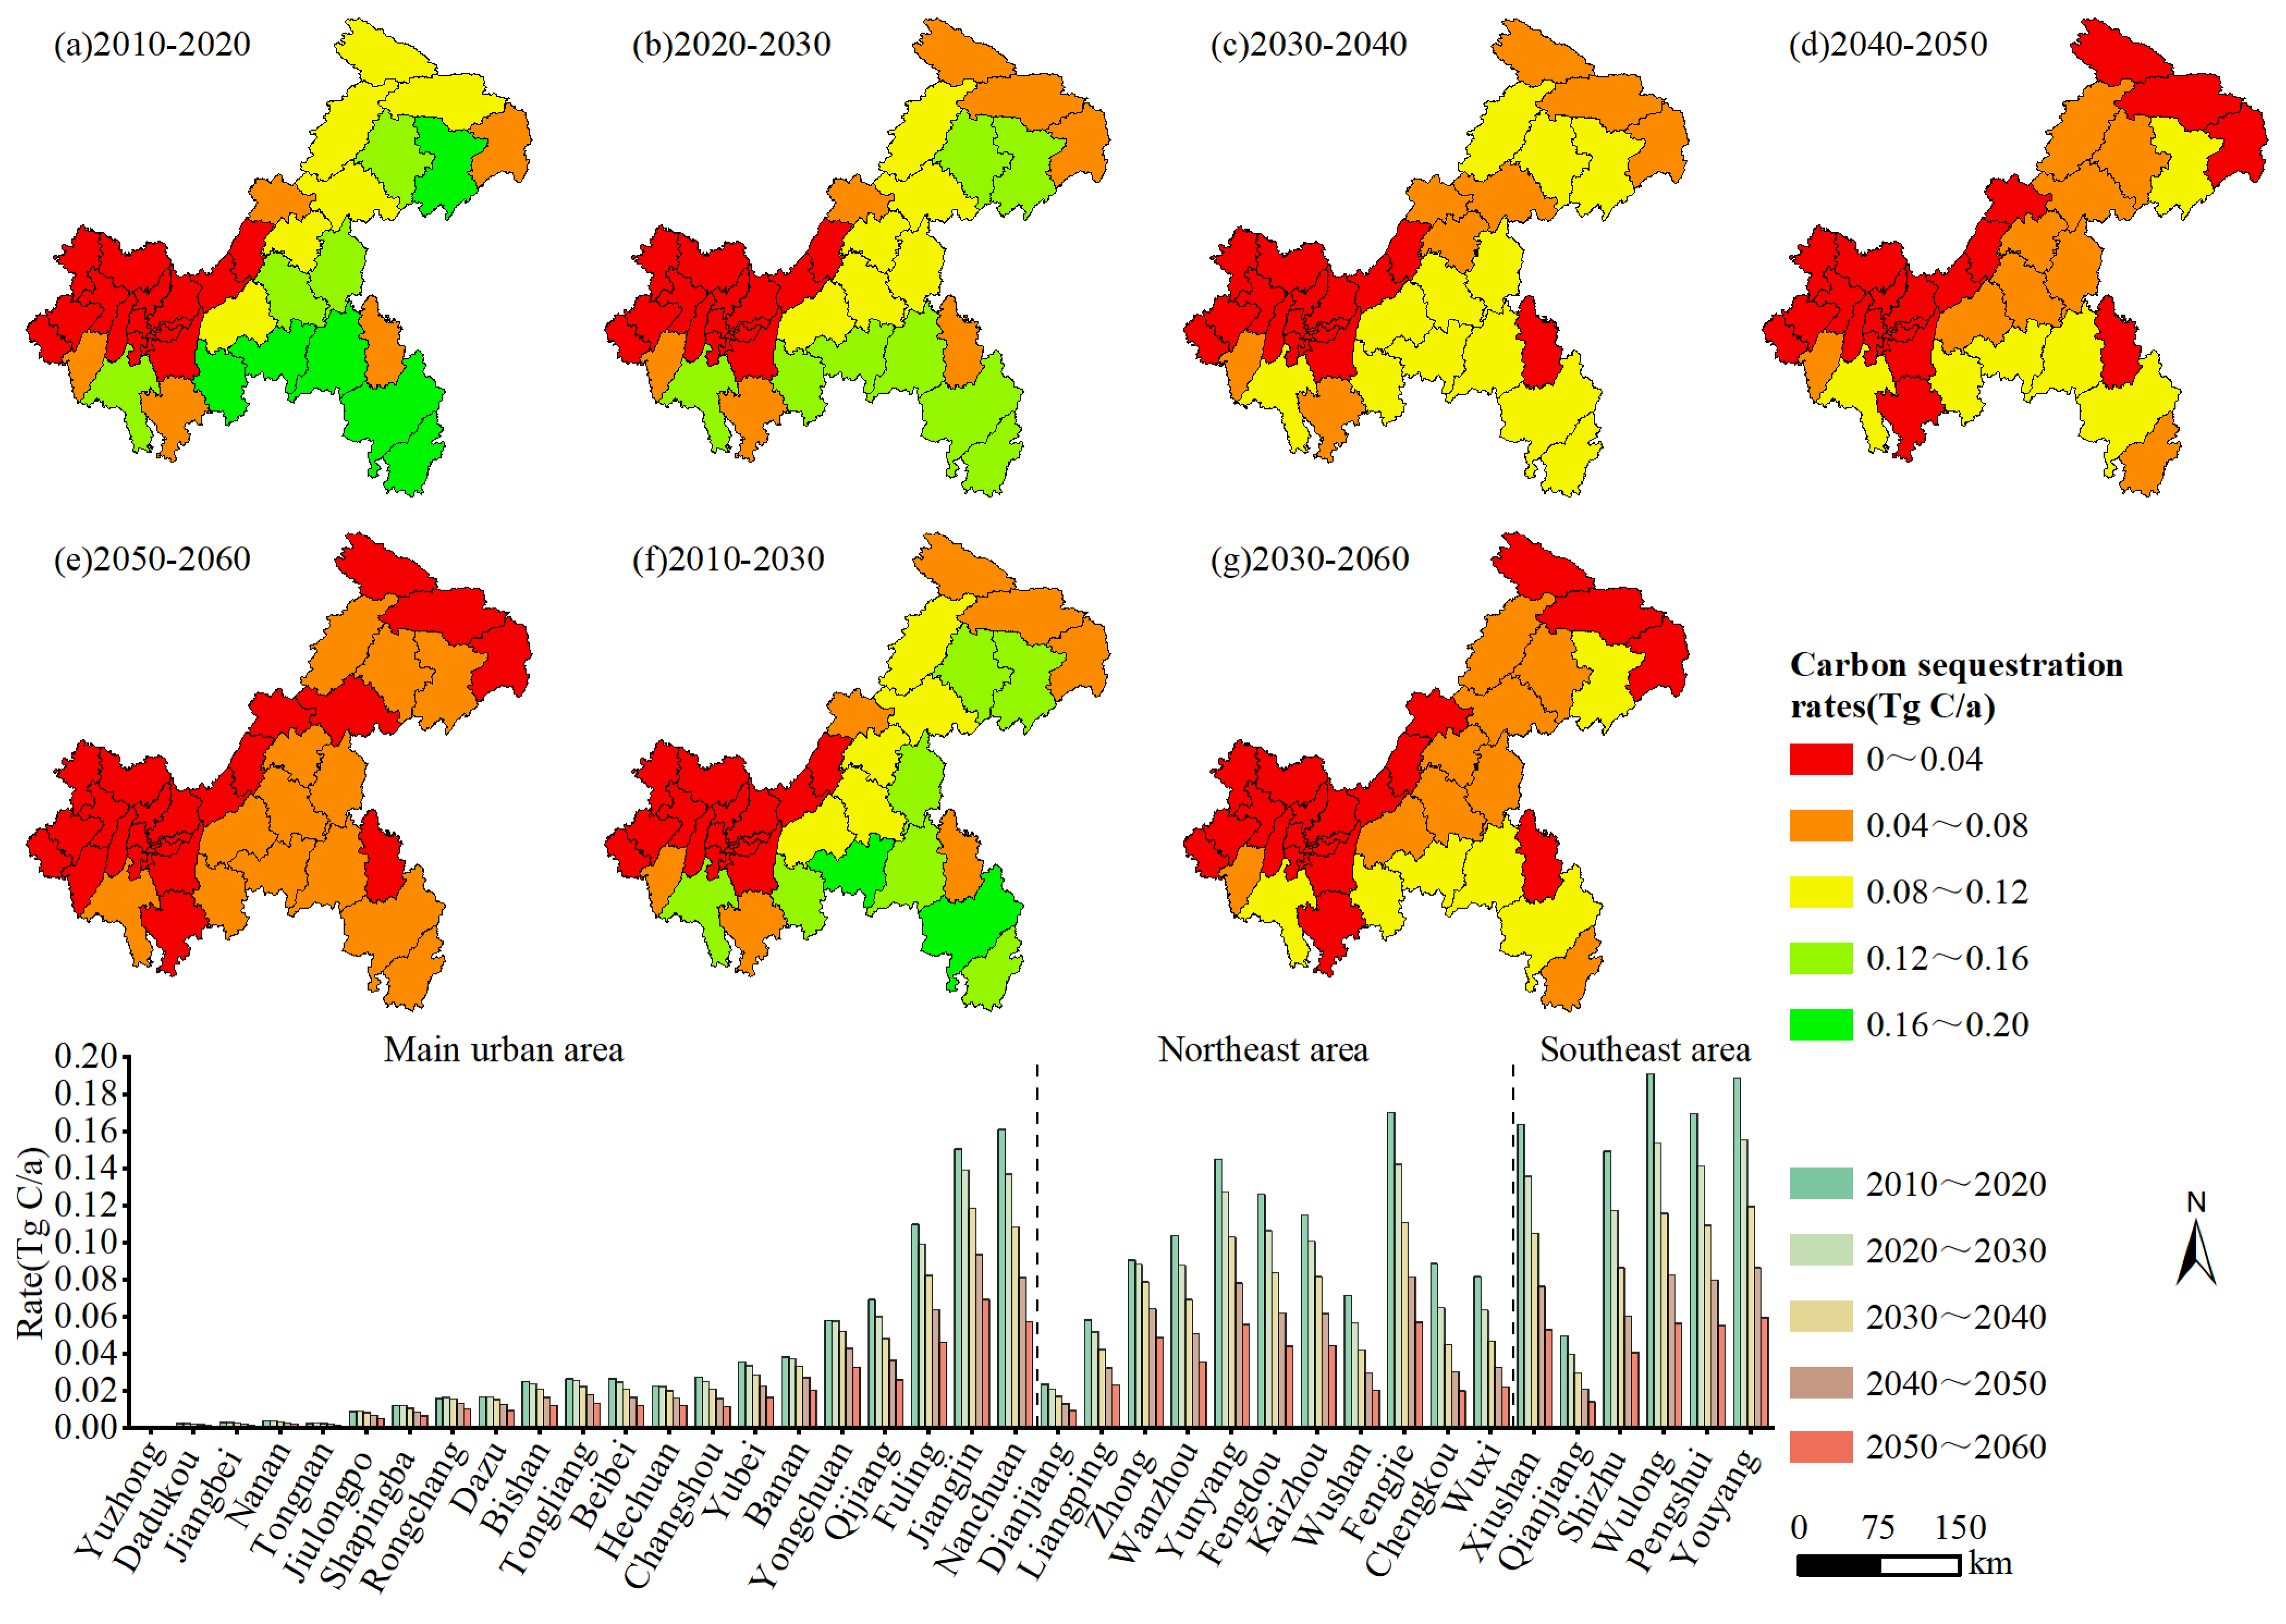
3.3. Analysis of Spatiotemporal Pattern Dynamic of the Carbon Sequestration Rate in Chongqing Forest Vegetation
The carbon sequestration rates calculated in
Figure 5 and
Figure 6 were both obtained from the average of four future climate scenarios while keeping the existing forest area unchanged. Overall, the forest vegetation in Chongqing from 2010 to 2060 had strong carbon sequestration benefits. The carbon sequestration rate in each district and county varies between <0.01 Tg C/a and 0.20 Tg C/a, and the per capita carbon sequestration rate in each district and county varies between <0.01 Mg C/a per capita and 0.54 Mg C/a per capita. The overall trend showed that over time, the forest gradually matured, and the carbon sequestration rate decreased accordingly.
From 2010 to 2060, the carbon sequestration rate of various districts and counties in Chongqing showed a trend of being highest in southeastern Chongqing, descending in northeastern Chongqing, and being lowest in the main urban area. The decrease in the carbon sequestration rate gradually became increased, as shown in
Figure 5. The three districts and counties with the highest average carbon sequestration rate were Wulong, Youyang, and Fengjie, with values of 0.122 Tg C/a, 0.120 Tg C/a, and 0.115 Tg C/a, respectively. The three districts and counties with the lowest average carbon sequestration rates were Yuzhong, Dadukou, and Tongnan, with values of <0.001 Tg C/a, 0.002 Tg C/a, and 0.003 Tg C/a, respectively. Compared to 2010–2030, the carbon sequestration rate changed significantly from 2030 to 2060, with a significant decrease in all regions except the main urban areas. Only southeastern Chongqing and some areas still maintained a moderate carbon sequestration rate, as shown in
Figure 5f,g. Overall, during these two stages, the carbon sequestration rate decreased from 0.069 Tg C/a to 0.039 Tg C/a, a decrease of 43.5%.
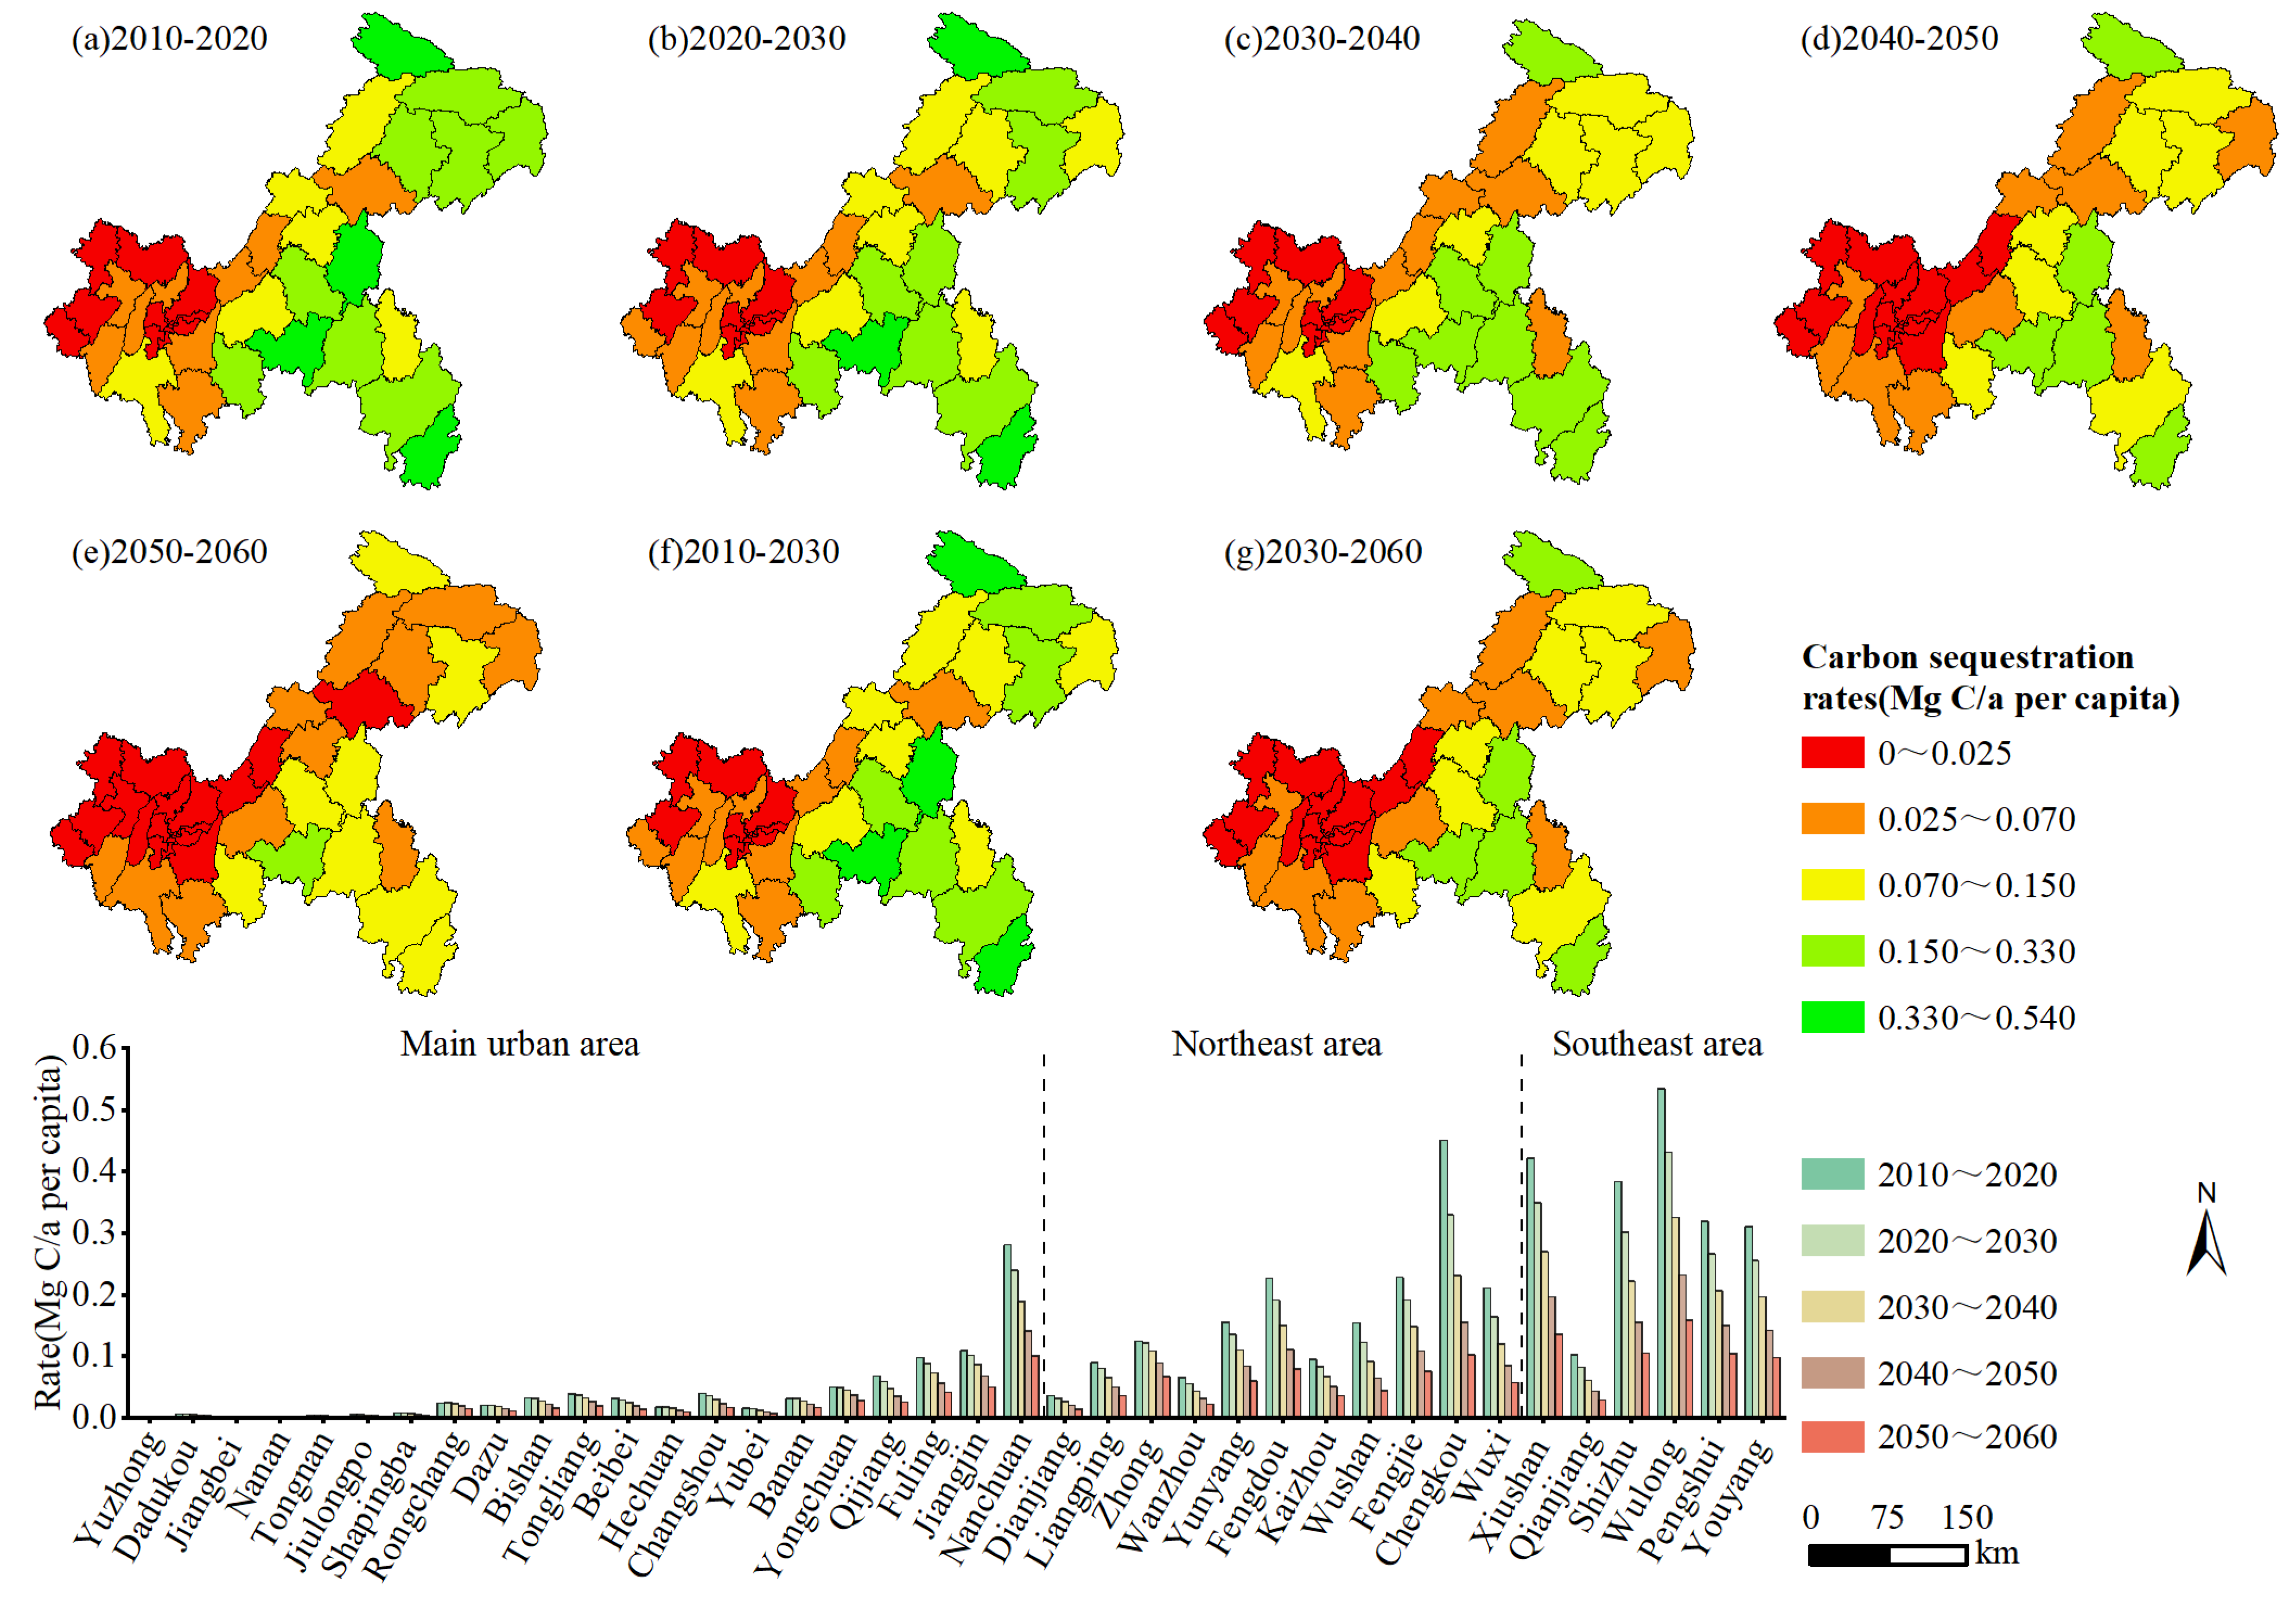
In this study, the per capita carbon sequestration rate was the ratio of the carbon sequestration rate of each district and county to the total population of the district and county. From 2010 to 2060, the per capita carbon sequestration rate of various districts and counties in Chongqing showed a tendency to be high in the southeastern and northeastern regions of Chongqing and low in the main urban areas, as shown in
Figure 6. The per capita carbon sequestration rate also gradually decreased over time and remained basically consistent with the carbon sequestration rate of districts and counties. The three districts and counties with the highest average per capita carbon sequestration rates were Wulong, Xiushan, and Chengkou, with values of 0.3373 Mg C/a per capita, 0.2755 Mg C/a per capita, and 0.2547 Mg C/a per capita, respectively. The three districts and counties with the lowest average carbon sequestration rates were Yuzhong, Nan’an, and Jiangbei, with values of <0.0001 Mg C/a per capita, 0.0031 Mg C/a per capita, and 0.0032 Mg C/a per capita, respectively. This result was mainly due to the significant differences in population density among different districts and counties, resulting in significant regional differences. Compared with 2010–2030, the per capita carbon sequestration rate in each district and county from 2030 to 2060 showed relatively small changes. Overall, the trend of high carbon sequestration rate in southeast and northeast Chongqing and low carbon sequestration rate in the main urban areas persisted, as shown in
Figure 6f,g. The district and county with the largest change in the per capita carbon sequestration rate was Chengkou, which decreased from 0.3910 Mg C/a per capita to 0.1639 Mg C/a per capita, a decrease of 58.09%.
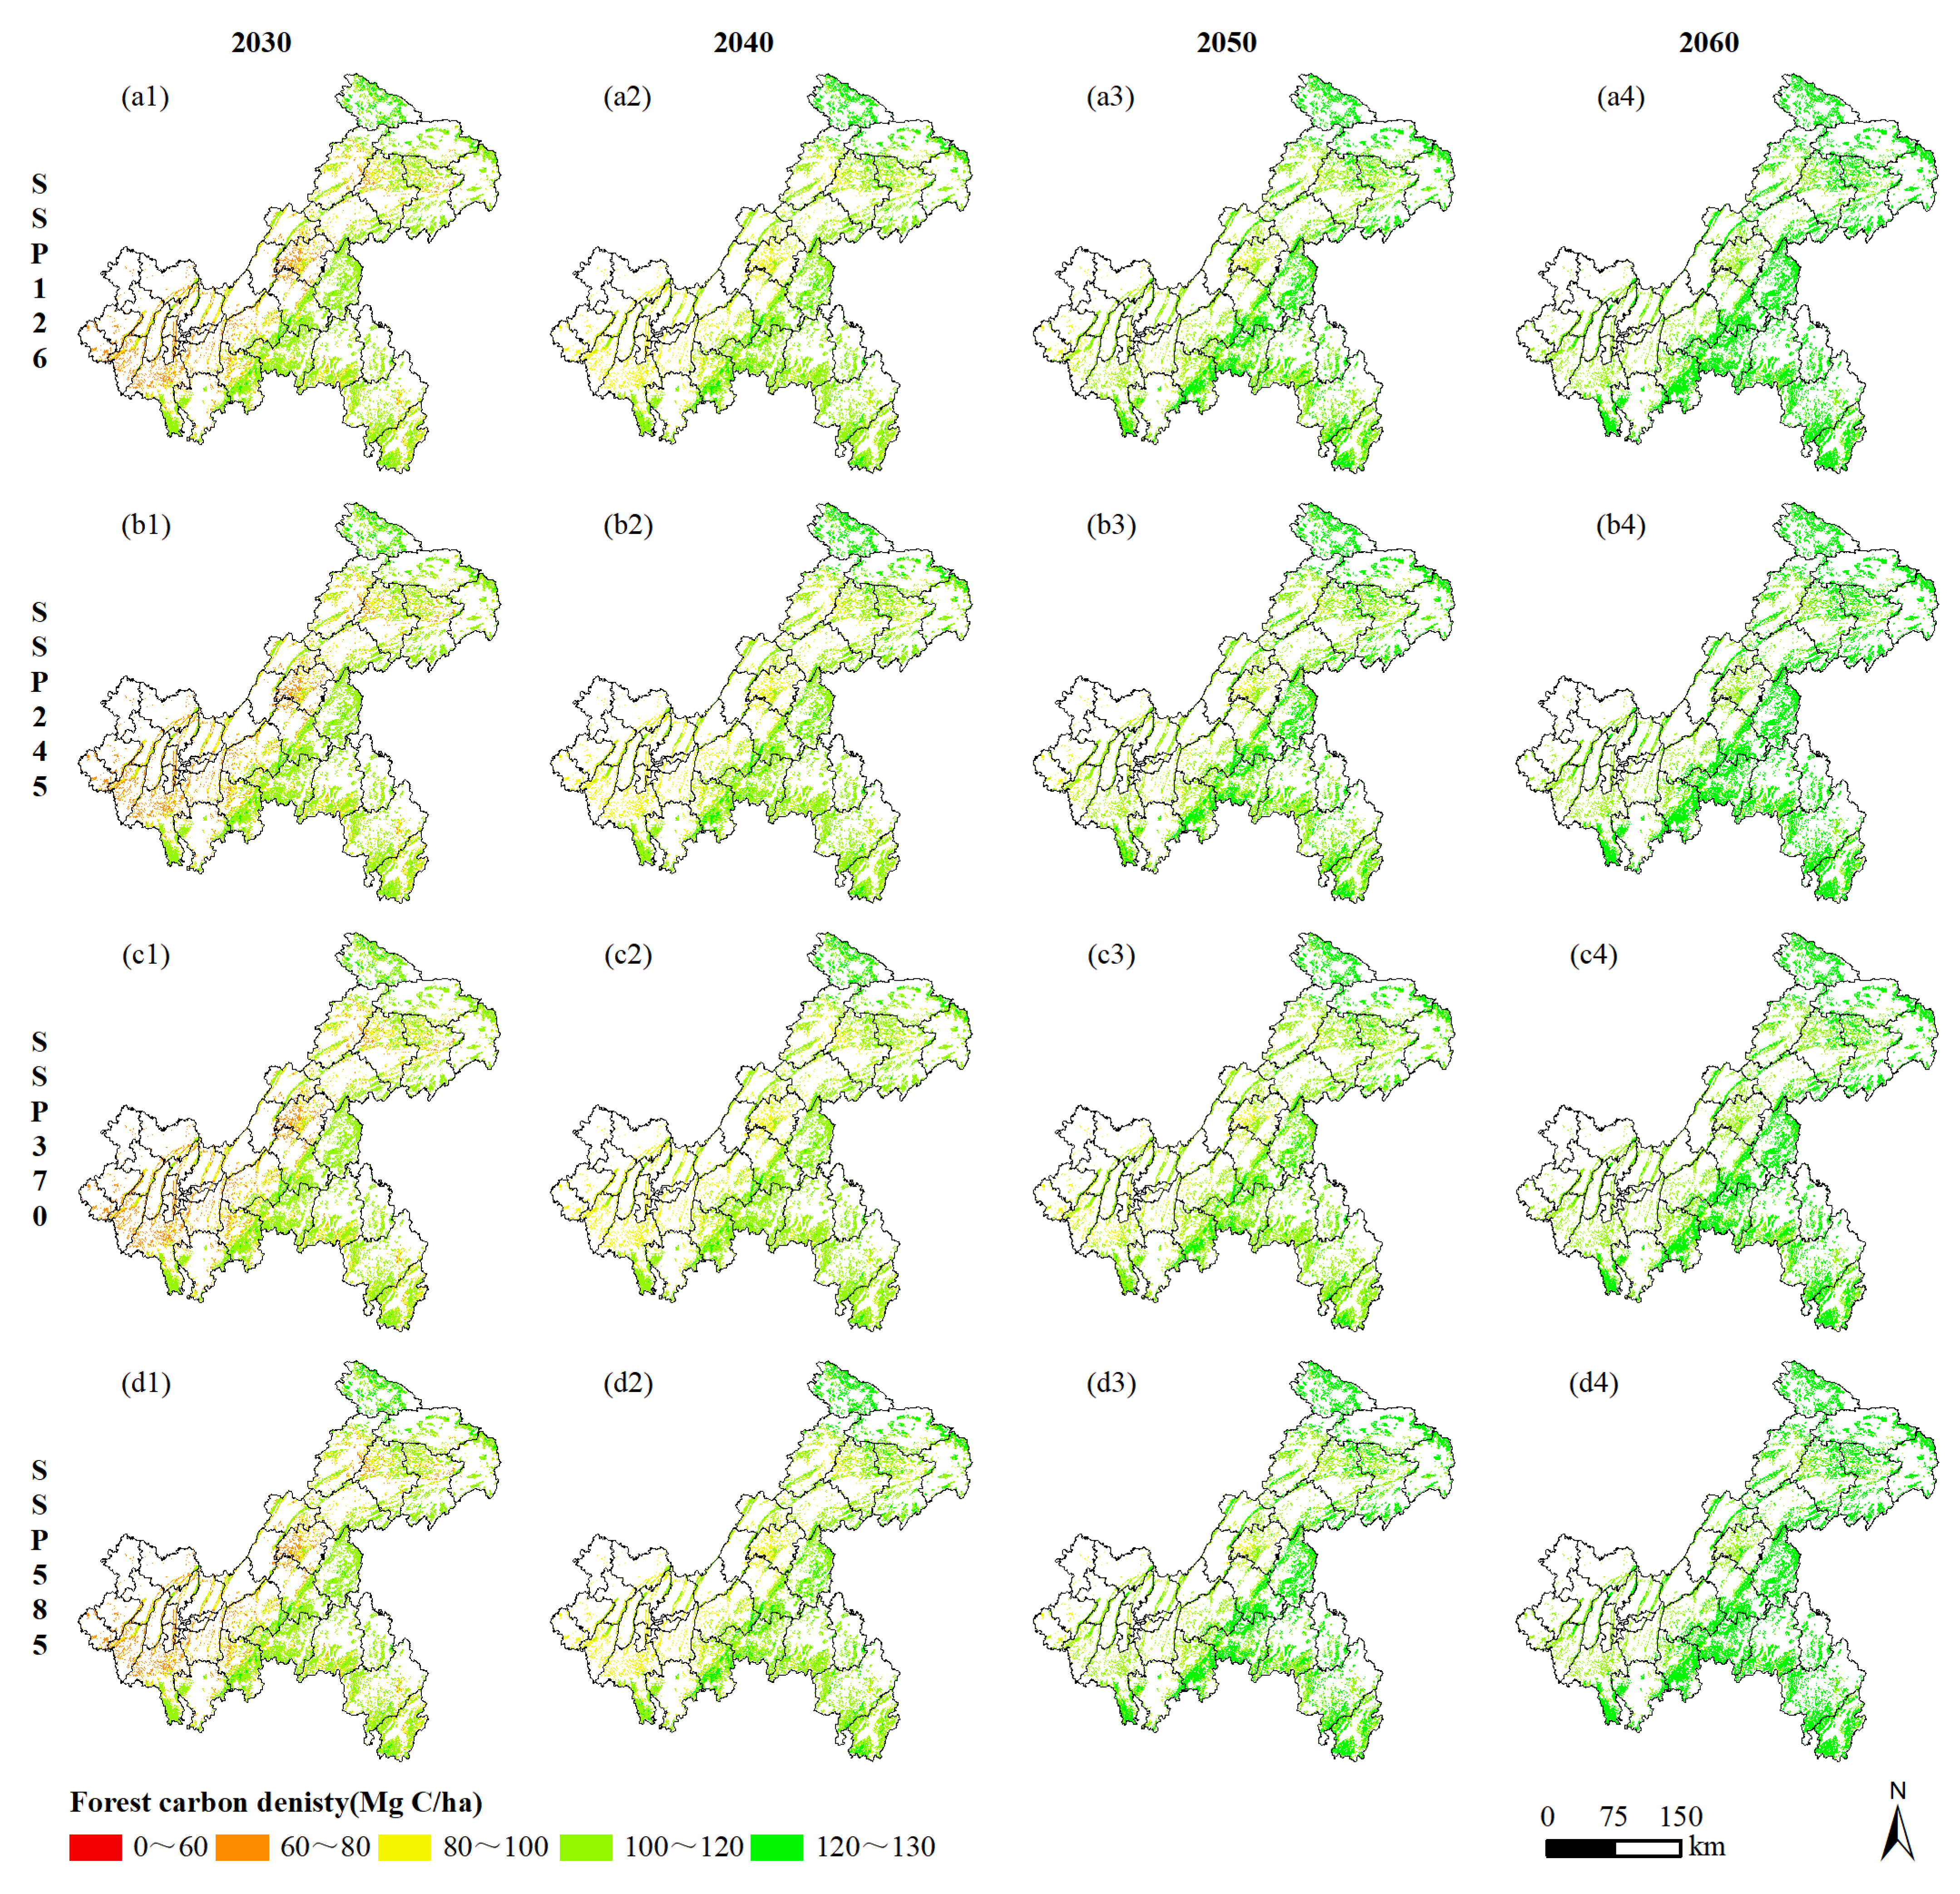
3.4. Results of Multi-Scenario Simulation for the Carbon Sequestration Potential in Chongqing Forest Vegetation
The SSP scenario matrix describes a series of future scenario combinations, each with different climate factors (precipitation, temperature, etc.) and socioeconomic factors (population, GDP, etc.), resulting in different carbon sequestration amounts and rates of forest vegetation under different scenarios. The multi-scenario prediction of the carbon sequestration capacity and the simulation results of the forest vegetation carbon sequestration rate in Chongqing are shown in
Figure 7 and
Figure 8. Overall, the spatial pattern distribution of carbon sequestration was very similar across the four climate scenarios, with little change from 2030 to 2060. High-value areas of carbon sequestration were primarily located in the northeast and southeastern regions of Chongqing, while low-value areas were primarily located near the main urban area.
For the carbon sequestration of forest vegetation from 2030 to 2060, the variations in carbon sequestration under the four scenarios were not significant, as shown in
Figure 7. Under the SSP1-2.6 scenario, the carbon sequestration increased from 225.89 Tg C to 270.80 Tg C, an increase of 19.88%. The SSP2-4.5 scenario showed an increase from 225.31 Tg C to 269.72 Tg C, an increase of 19.71%. The SSP3-7.0 scenario showed an increase from 223.34 Tg C to 266.08 Tg C, an increase of 19.14%. The SSP5-8.5 scenario showed an increase from 227.24 Tg C to 273.33 Tg C, an increase of 20.28%. Under the four climate scenarios, the SSP5-8.5 had the highest increase in carbon storage and growth rate, while the SSP3-7.0 had the lowest.
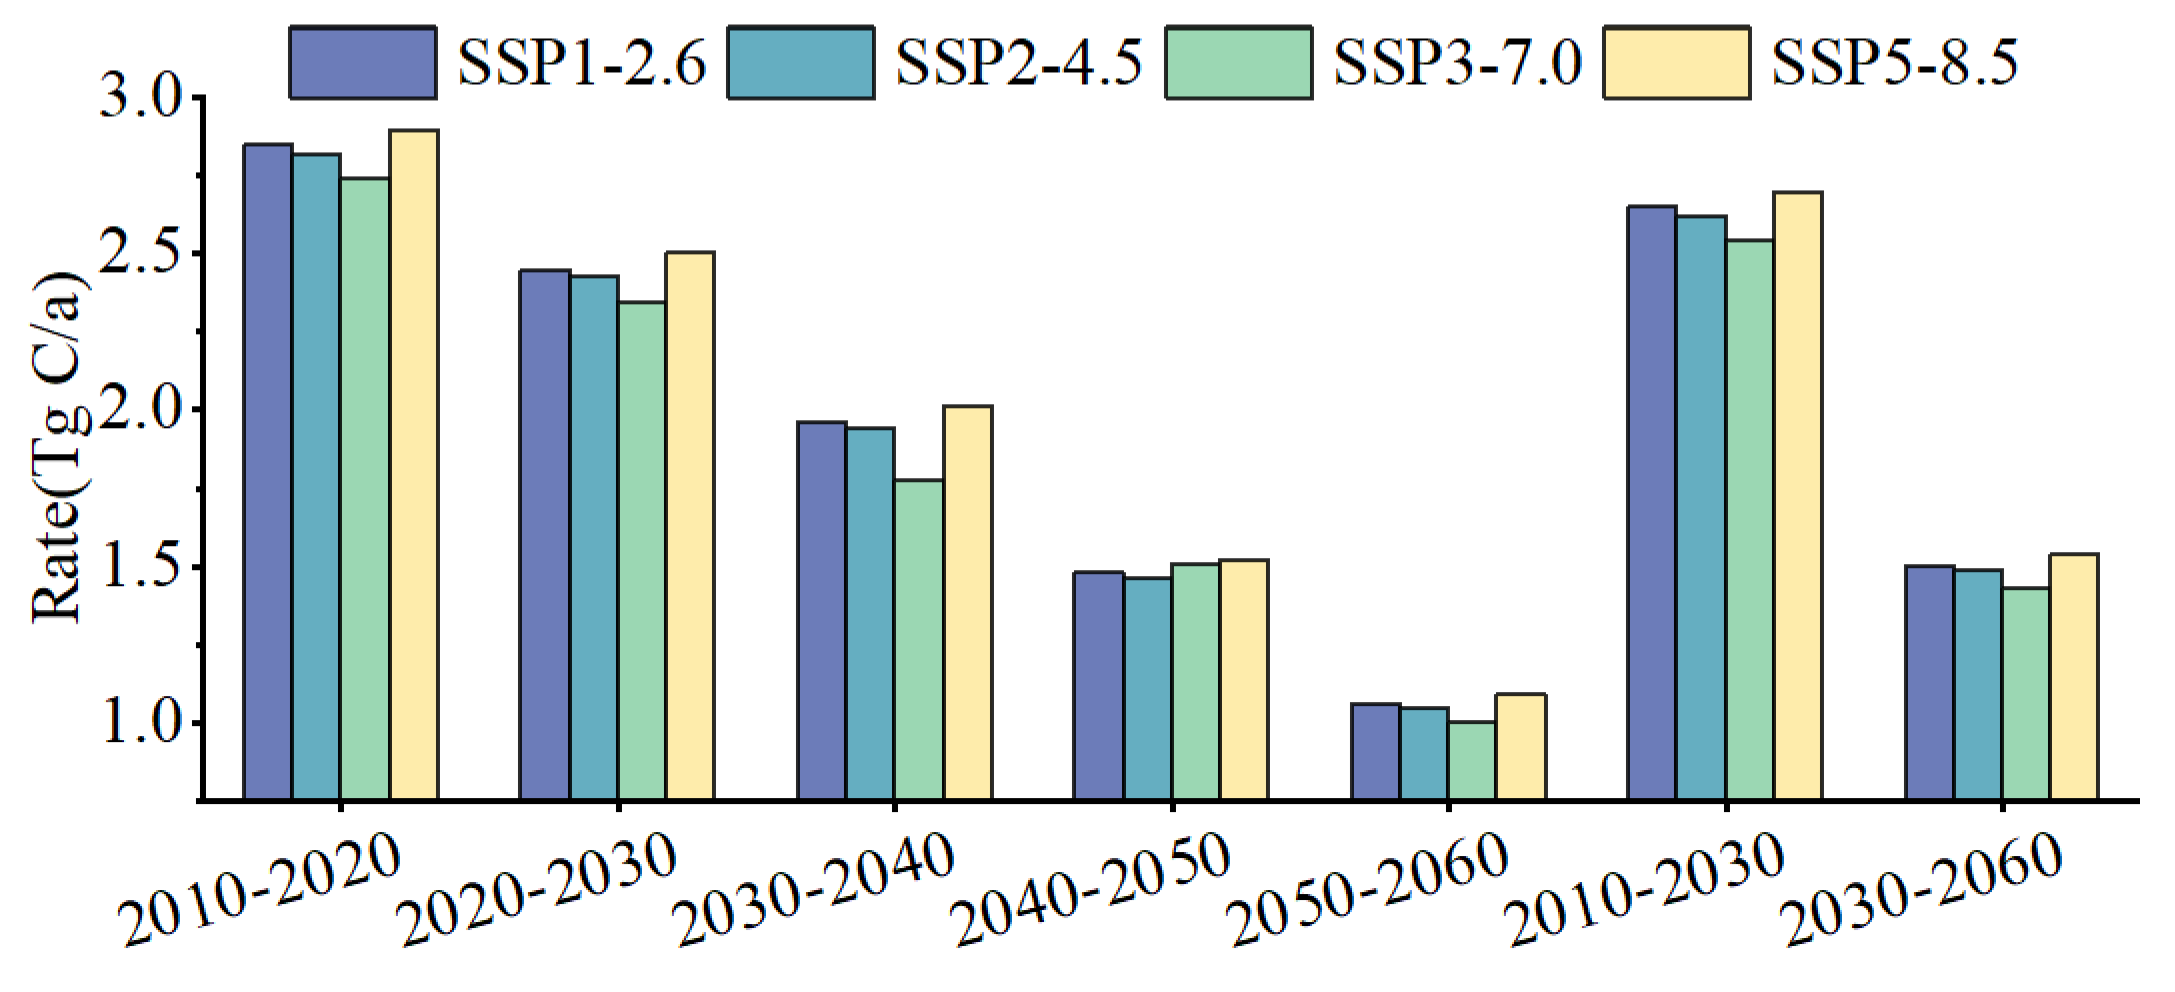
For the carbon sequestration rate of forest vegetation from 2010 to 2060, the overall carbon sequestration rate showed a decreasing trend each year under the four scenarios, and the difference gradually decreased, as shown in
Figure 8. Before 2040, there was an obvious difference in carbon sequestration rates between SSP5-8.5 and SSP3-7.0, with a maximum difference of 0.14 Tg C/a between 2030 and 2040. After 2040, the differences in the four climate scenarios gradually decreased due to the significant decrease in the overall carbon sequestration rate. Among the four climate scenarios, the carbon sequestration rate was highest in the SSP5-8.5 scenario and lowest in the SSP3-7.0 scenario.
3.5. Results of Driving Factors of the Carbon Sequestration Rate in Chongqing Forest Vegetation
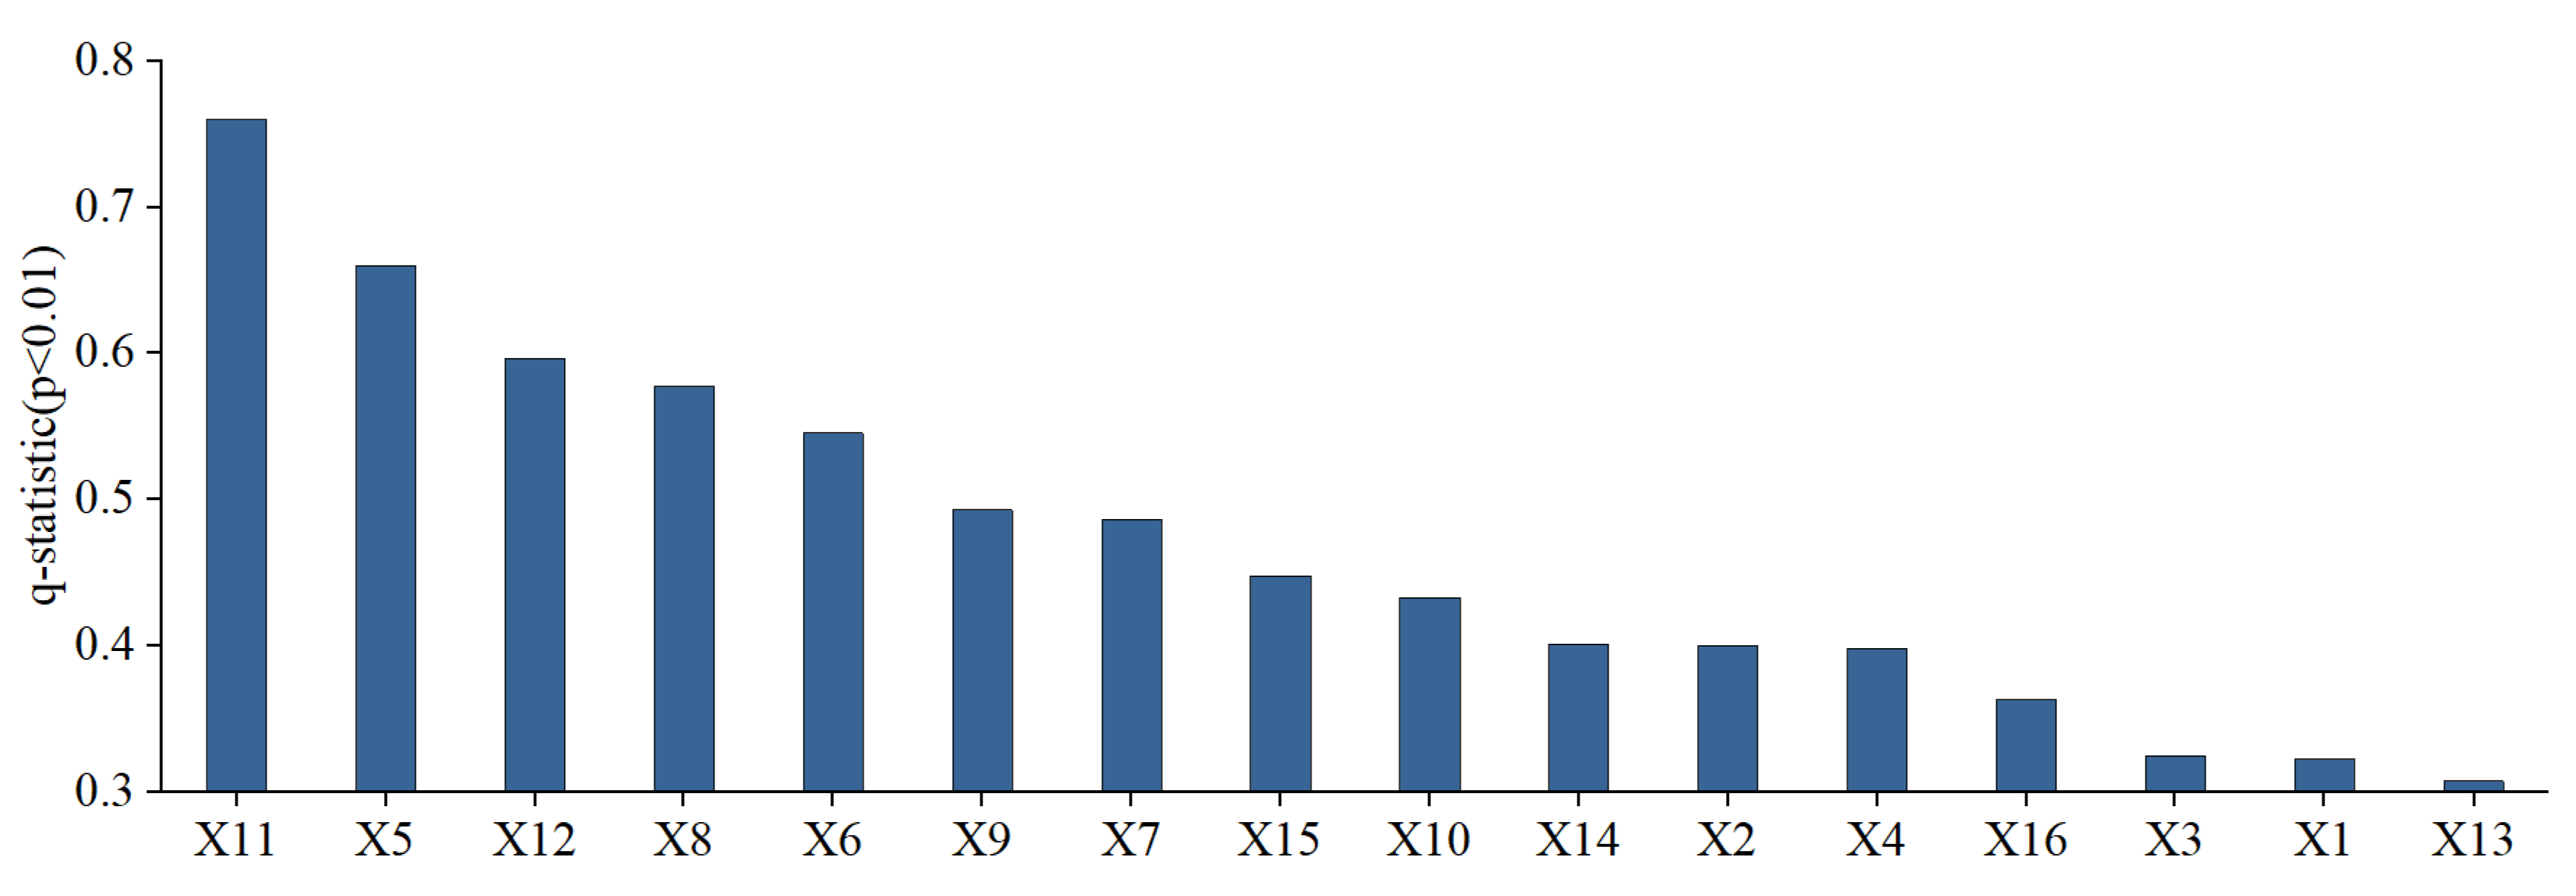
The factor detector measured the impact of all influencing factors on the carbon sequestration rate of forest vegetation (
Figure 9). The
-statistic of the influencing factors varied significantly between 0.307 and 0.760 (
p < 0.01). The first three driving factors that had the highest impact on the carbon sequestration rate were forest area, DEM, and forest age. The
-statistics were 0.760, 0.660, and 0.597, respectively, followed by natural factors such as precipitation and slope. The density of population, GDP per capita, and GDP of the tertiary industry had the smallest impacts on the carbon sequestration rate. The
-statistics were 0.307, 0.322, and 0.325, respectively. Overall, the greatest impact on the carbon sequestration rate was due to natural factors, and there was little difference in the impact of social and economic factors. As a mountain city, the larger the forest area is, the more carbon sequestration the forest will provide; additionally, a higher DEM results in steeper slopes and a corresponding reduction in the impact of human interference. The vegetation mostly maintained the state of nature, and the forest age structure was evenly distributed. Natural factors such as meteorology and the NDVI value directly impact the growth state and photosynthesis of forest vegetation, thus contributing to increased forest productivity and vegetation carbon sequestration. Slope can also cause soil erosion and water loss, affecting the absorption of forest nutrients and thereby affecting the carbon sequestration rate. The effect of forest age on forest carbon sequestration rate is higher than that of climate conditions, which is consistent with the results of Yao et al. [
44]. The impact of social and economic development had a lateral impact on the carbon sequestration rate of forest vegetation. The higher the economic value is, the higher the population density is, which will exacerbate the expansion of cities toward the surrounding area, increase the consumption of basic resources and energy, change the forest area and vegetation type, and indirectly affect the carbon sequestration rate.
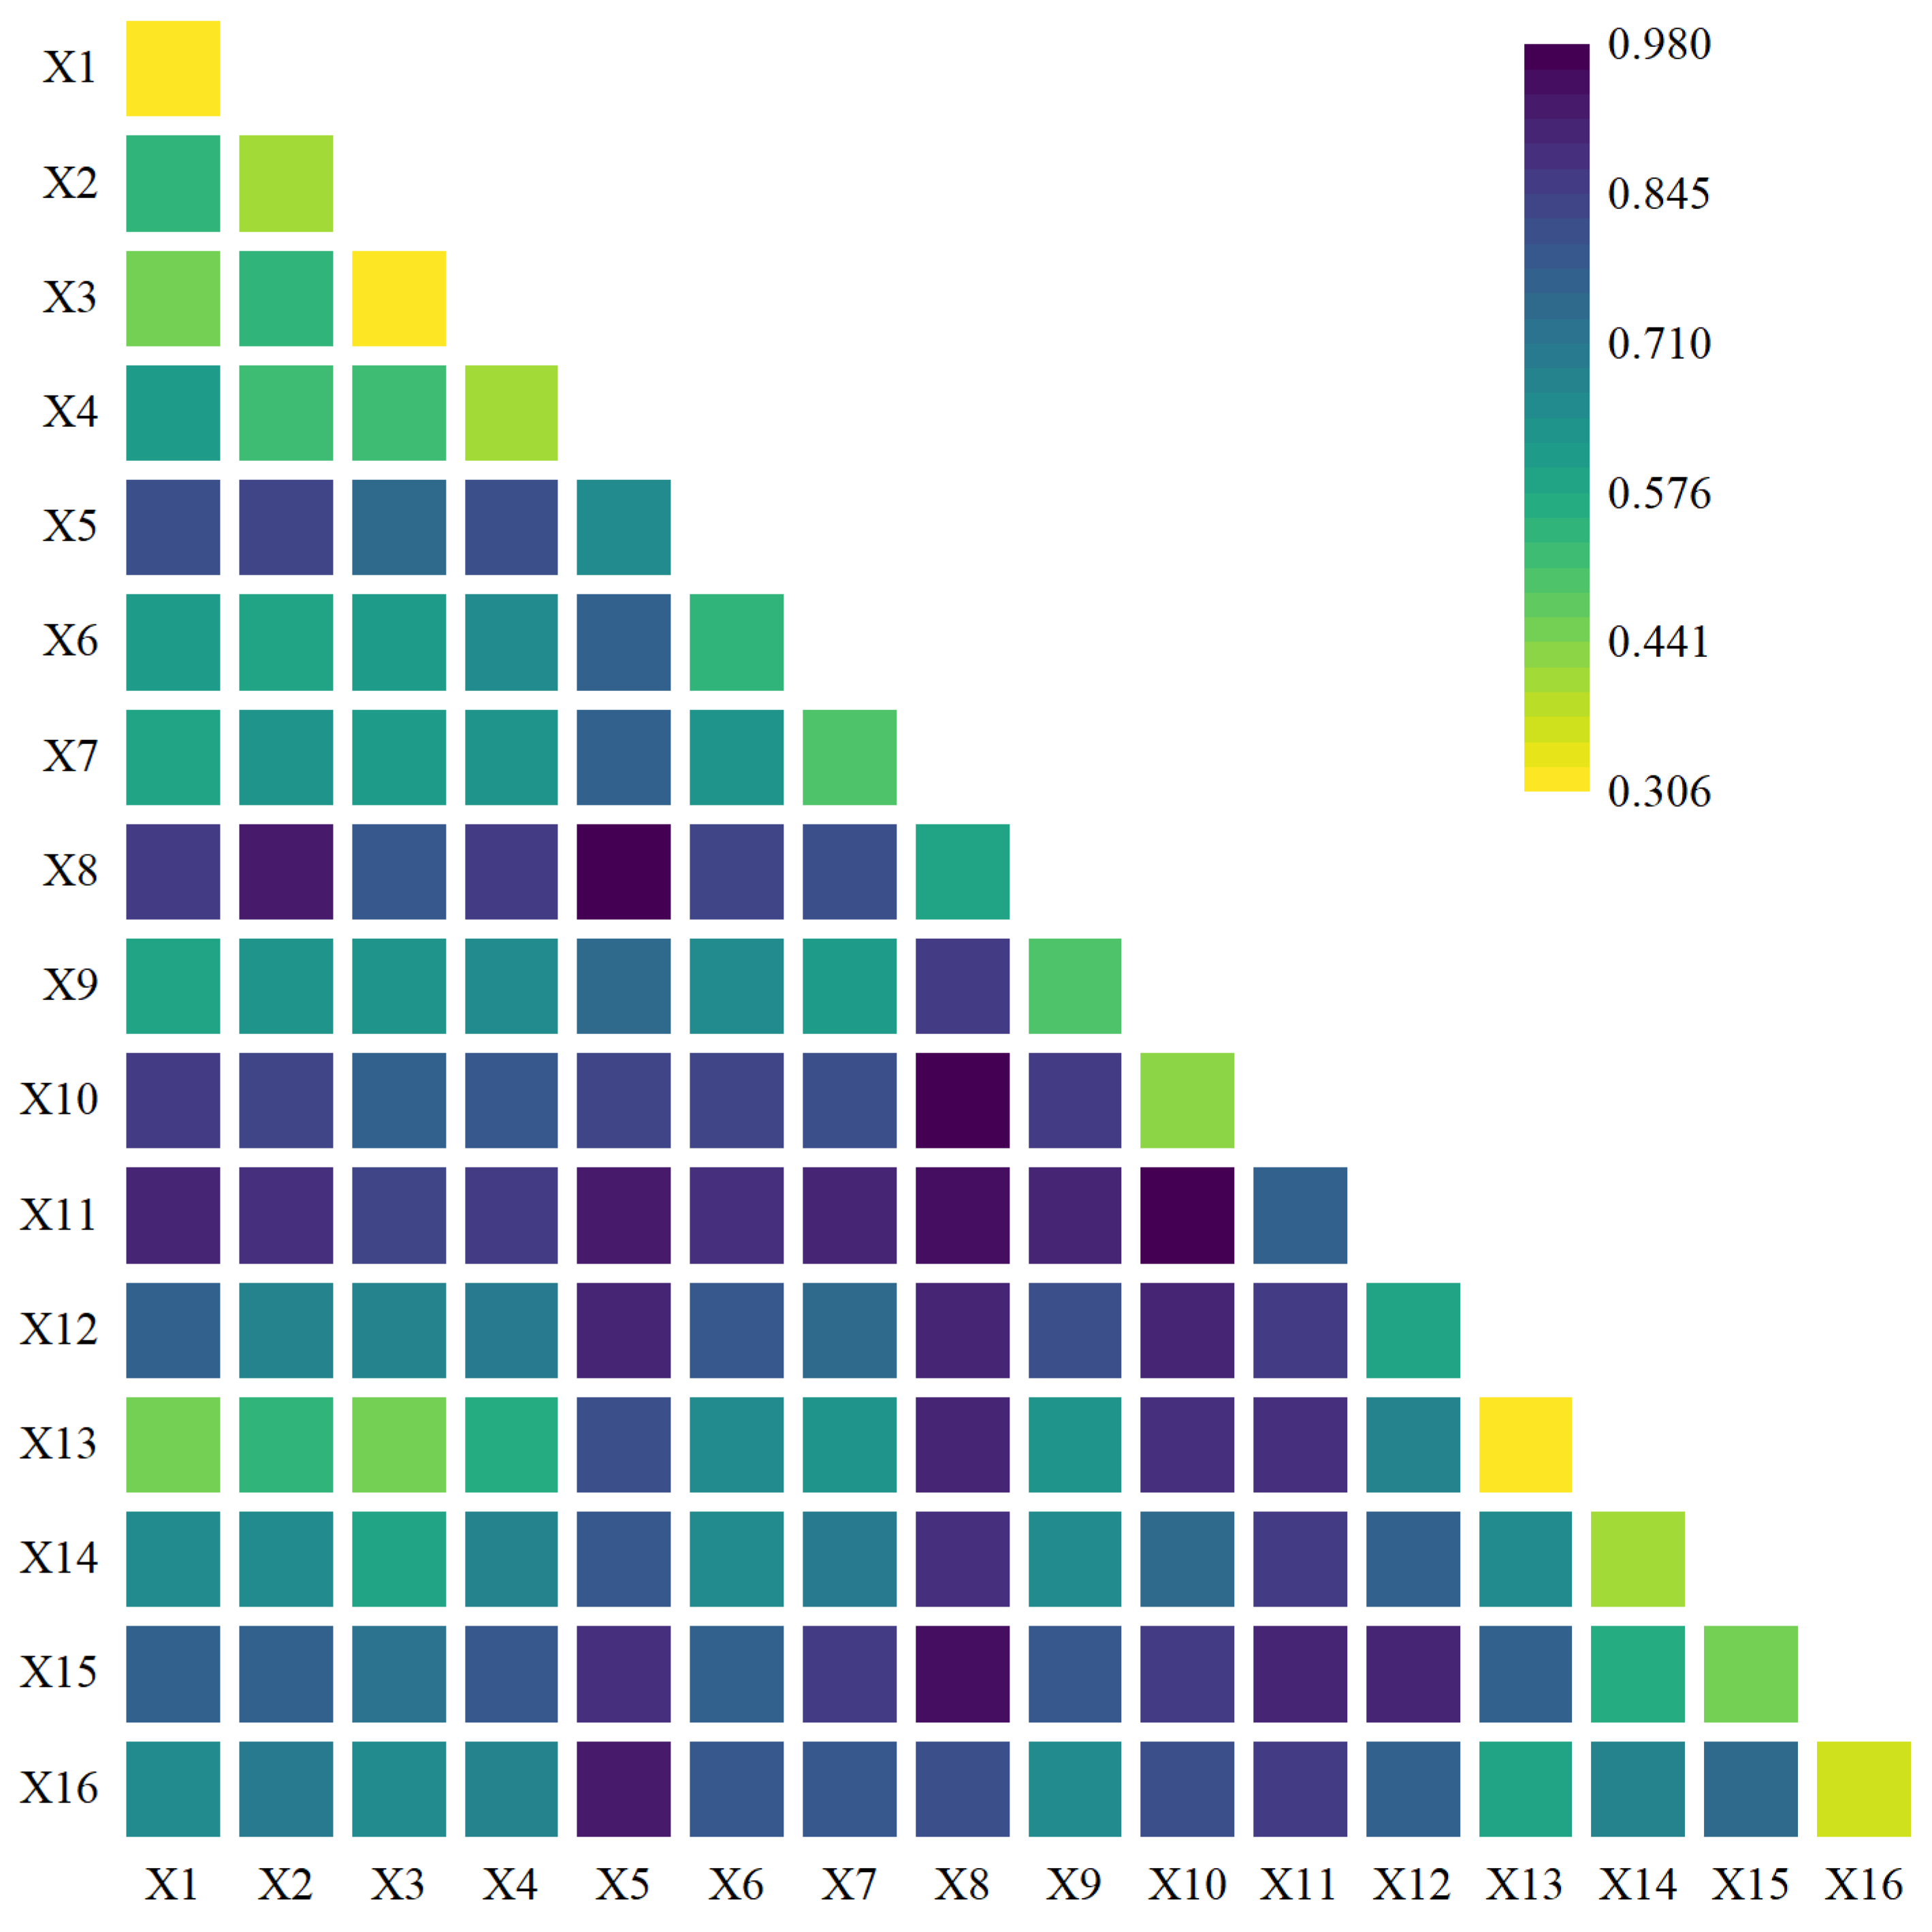
The impact of one factor is often limited, and in reality, the carbon sequestration rate is a process of multiple factors interacting with each other. The interactive detection plate in the OPGD can measure the effect of various factors on the carbon sequestration rate, according to
Figure 10. After the interaction of various influencing factors, there was a significant increase in the
q-statistic, and the effect on the rate of carbon sequestration was significantly enhanced. The interactions between forest area and NDVI, precipitation and DEM, precipitation and NDVI had the greatest impacts on carbon sequestration rate, with
-statistics of 0.979, 0.964, and 0.963, respectively. The interactions between the GDP of the tertiary industry and density of population, per capita GDP and density of population, and per capita GDP and GDP of the tertiary industry had the smallest impacts on the carbon sequestration rate, and the
-statistics were 0.441, 0.442, and 0.443, respectively. Their impact was higher than that of individual factors. The judgment conditions for the interaction detector indicated 114 two-factor enhancements and six non-linear enhancements. This result indicates that the interaction between 120 sets of two drivers had an enhanced effect on the carbon sequestration rate and no independent influencing factors. Moreover, each factor had a certain correlation with the carbon sequestration rate.
4. Discussion
4.1. Comparative Analysis of Carbon Sequestration Models in Forest Vegetation in Chongqing
Due to errors in data conversion and processing, as well as the complexity of the ecosystem itself, different NPP and carbon storage estimation models inevitably generate some errors, which are mainly related to input data, model structure, and parameter settings [
45]. Generally, the accuracy of model calculations is examined by verifying the degree of consistency between simulated and measured values. However, because of the lack of measured data and the limitations of scale inference from observation points to the entire region, this study chose to validate the model using model comparison to further evaluate the calculation results (
Table 2).
The average NPP of forest vegetation in Chongqing from 2000 to 2020 calculated using the CASA model in this study was 797.95 g C/m
2, which was higher than the NPP value calculated by Zhang et al. [
46], which was 412.29 g C/m
2. This difference is probably related to the coarser accuracy of the data used for calculation. Compared to Zhou et al. [
47] calculation of the forest vegetation NPP value of 673.4 g C/m
2 in the Sichuan Chongqing region, it was higher. Compared to Hong et al. [
48] and Xu et al. [
49], the NPP values of forest vegetation in the southwestern region calculated by Hong et al. [
48] were 963.86 g C/m
2 and 866.65 g C/m
2, respectively, which were lower. Due to the use of data standards from the Chinese Academy of Sciences for the forest classification system in this study, forest types were divided into four categories: forestland, shrub woodland, sparse woodland, and other woodland. This classification made it impossible to compare each type of data accordingly. Although there were deviations in the overall calculation results, they were still within the expected overall range.
This study estimated carbon storage and carbon sequestration rate of forest vegetation in Chongqing were similar to some recent research results. Currently, many scholars have based their estimates on a national scale as a whole without providing corresponding provincial data [
37,
50,
51], making it difficult to compare them accordingly. For the carbon storage and carbon sequestration rate, Chen et al. [
22] published a dataset showing that the carbon storage of forest vegetation in Chongqing in 2010 and 2020 was 230.34 Tg C and 264.85 Tg C, respectively, with a corresponding carbon sequestration rate of 3.45 Tg C/a. The results calculated in this study were relatively low compared to those of Cai et al. [
52], who also based on the FCS model to calculate the carbon sequestration rate of forest vegetation in Chongqing from 2010 to 2060, decreasing from 2.82 Tg C/a to 1.05 Tg C/a, but the overall trend still indicated a decrease each year. Compared to remote sensing methods for forest biomass calculation, the FCS model fully considers the relationship between forest age and biomass and can use measured data for parameterization and validation. It can better model changes in the natural successional processes of forest vegetation [
38,
52] and can be used for more systematic modeling of different forest types, forest ages, and climate regions. To a certain extent, the model utilized the classical logistic equation as the basis to establish the relationship between forest age and biomass and combined the data of different climate scenarios in the future to take into account the impact of future climate change on forest vegetation. The calculated results were highly representative. Due to the lack of field measurements, publicly available biomass data and forest age datasets were used in this study to modify empirical parameters according to the southwestern region. The results obtained are inevitably biased from the former using field measurement data, and due to differences in tree species, forest type, and climate, it is difficult to unify the definition of the mature forest age, resulting in some uncertainty.
Under the future climate change scenarios, Chou et al. [
53] simulated land use change based on SSP1-2.6, SSP2-4.5, and SSP5-8.5, fitted different tree species growth equations, and estimated the carbon sequestration storage of forest vegetation at the national scale. The results showed that the carbon sequestration potential of Southwest China was higher than other regions, with SSP1-2.6 > SSP2-4.5 > SSP5-8.5, which was different from this study. The main reason was that it simulated the change in forest area under climate change conditions. Under the SSP5-8.5 scenario, the minimum forest area leads to the minimum carbon storage. This study simulates carbon storage under the assumption that the forest area remained unchanged, and we would also include it in our future research.
4.2. Path to Enhance Carbon Sequestration Potential in Chongqing Forest Vegetation
Forest carbon density increases slowly with forest age and gradually reaches saturation, which means that forests have strong carbon sequestration potential regardless of development stage and forest type (natural forest or man-made forest) [
51]. The results of this study show that Chongqing has enormous carbon sequestration potential, whether in the present or future, especially in the northeastern and southeastern regions. To enhance the forests carbon sequestration potential in various districts and counties, long-term effective forest management and control technologies and reasonable policy guarantees are needed.
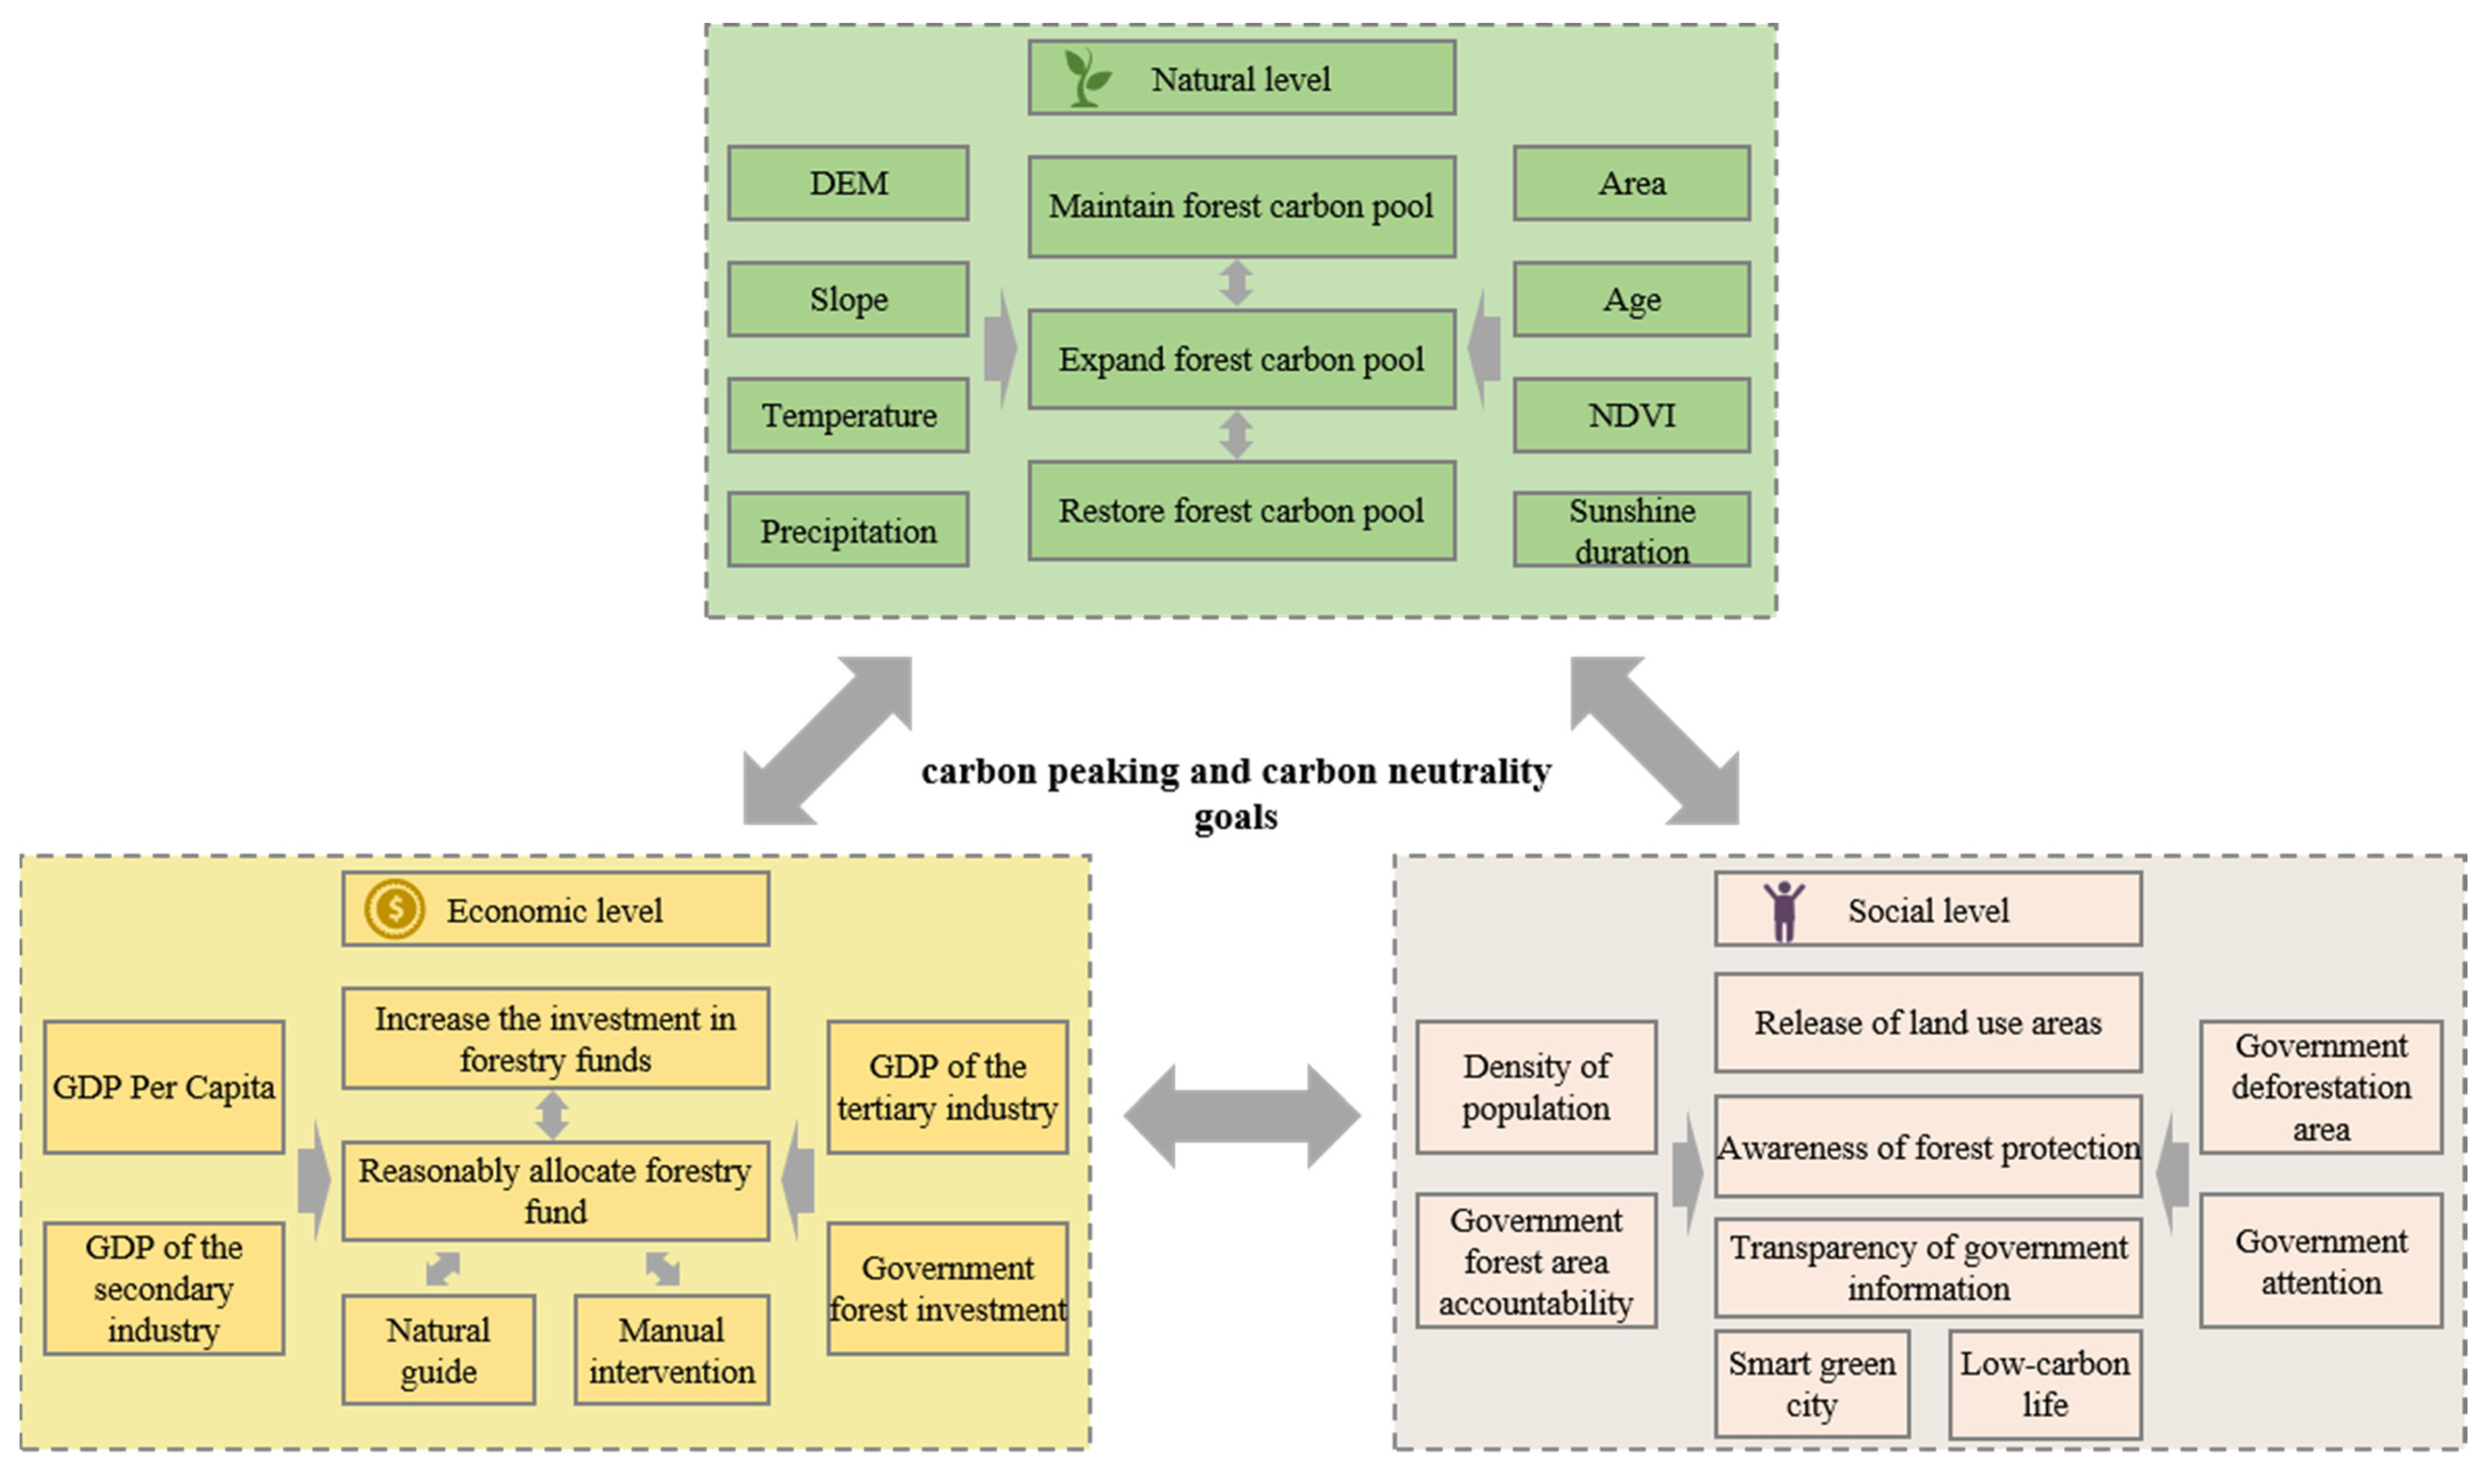
The results of the influencing factors in this study indicated that forest area, DEM, forest age, and natural factors had the greatest impacts on the carbon sequestration rate, followed by social factors, and economic development had the smallest impact. Based on this, this study proposes corresponding protection measures from the natural, economic, and social levels based on three types of impact factors and previous research by scholars [
54] (
Figure 11).
(1) At the natural level, the results of the OPGD indicated that the driving force of natural factors was the highest. In the absence of external interference, the growth of forests is dominated by their own conditions, such as forest age and forest species, as well as by external conditions, such as temperature, precipitation, and sunshine duration. Human activity contributes indirectly to these conditions. The result of carbon storage showed that there was a certain relationship between forest area and carbon storage, but it did not play a dominant role. In the case of a certain forest area, factors such as the internal conditions of forest age and the external natural environment interact and constrain each other. The focus should be on nature and increasing the proportion of natural forests. Although forest area has the highest impact factor and should be prioritized for upgrading, due to the interference of various human factors, the improvement in forest area has been limited. When working with a limited area, the focus should be on the regeneration of natural forestland rather than on economic forest. The existing forest carbon pool should be maintained by setting forest reserves to reduce the damage to natural forestland by people. It is necessary to promote improvement and fertilization, introduce various types of tree species suitable for growth in Chongqing without destroying the local species structure, increase forest species diversity, improve forest self-healing and self-resistance by changing the forest structure, further expand the forest carbon pool, and provide timely protection and rescue to reduce large-scale losses due to droughts, floods, insect pests, mountain fires, and other natural disasters. It is necessary to promulgate regulations and rules to limit the area of deforestation and restore land vegetation to its previous high carbon state within a limited forest area.
(2) At the economic level, the GDP value and government forestry investment had an indirect impact on the carbon sequestration rate, reflecting the local economic development status. The higher the value, the faster the economic development, the more the demand for resources and the environment, and the damage to forests will be intensified. However, the corresponding government forestry investment will also be more; the two are in a contradictory state. Therefore, provincial-level and municipal-level unit governments should appropriately increase investment in forestry funds. Due to the varying forest area and economic development status of each district and county, district and county governments should develop fund allocation models tailored to their own regional characteristics and strengthen real-time monitoring. The allocated forestry funds should be reasonably determined according to the needs of each city and county, and their use purposes should be determined. The improvement in the forest carbon sequestration rate should be mainly guided by nature. It would be good to increase financial investment and manual intervention in areas with poor natural conditions that are prone to damage to extend the duration of high carbon sequestration rates and achieve the forest carbon sink enhancement goal.
(3) At the social level, although the results of the optimal geographic detector showed that social factors had less influence on the rate of carbon sequestration. The influence of the social level should not be underestimated because it is a dynamic level. The population density of each district and county directly reflects the level of economic development and the ecological environment. The government forest area accountability reflects the diligence in forest protection. The government’s deforestation area directly affects the amount of forest area and the growth of forests. Additionally, the government’s attention to the forest reflects the importance that the district and county attach to the forest in the current and future. Via comparison, it could be found that the higher the level of government forest area accountability and attention, the higher the rate of carbon sequestration. However, affected by the forest area and development pattern of the district, the density of population and the deforestation area had an inverse effect on the rate of carbon sequestration. Thus, forests and other land use areas are converted due to population density expansion, and green and environmentally friendly intelligent cities are built. The government should increase its focus on forest protection, strengthen the promotion and education of basic forest knowledge using a variety of media such as the internet and TV, carry out afforestation activities and corresponding reward measures, enhance awareness of forest conservation, and reduce deforestation and destruction of forests from a cognitive level. Moreover, we should strengthen the transparency of government information, unite the broad masses of basic people, take responsibility and hold one another accountable, and encourage one another. Illegal logging activities should be monitored and stopped. Specific government departments that implement forest protection policy documents should be supervised, and people should be encouraged to plant trees for low-carbon life and improve residents’ trust in the government.
5. Conclusions
There were significant spatiotemporal differences in the carbon sequestration status of forest vegetation in Chongqing. The overall carbon sequestration status showed a trend of being high in northeastern and southeastern Chongqing and low in the main urban area. Over time, the carbon storage gradually increased and reached saturation. By 2060, the forest carbon density will reach 130 Mg C/ha. Compared with 2030 to 2060, the hot spots in 2010 to 2030 were mainly focused in the southeastern region of Chongqing, while the cold spots were focused in the main urban area, with more significant spatial differences and more concentrated cold spots.
The forest vegetation in Chongqing shows strong carbon sequestration potential. From 2010 to 2060, the carbon sequestration rate gradually decreased, and the three districts and counties with the highest average carbon sequestration rates were Wulong, Youyang, and Fengjie. Compared to 2010 to 2030, the carbon sequestration potential was low, and the carbon sequestration rate changed significantly. The trend of the per capita carbon sequestration rate of Chongqing districts and counties was basically consistent with the rate of carbon sequestration in the districts and counties. The three districts and counties with the highest per capita carbon sequestration rates were Wulong, Xiushan, and Chengkou. The calculated results agreed well with other scholars, which showed that it was feasible to calculate the carbon sequestration potential of forest vegetation in Chongqing using the FCS model. Among the different climate scenario simulations, the SSP5-8.5 had the highest carbon sequestration rate and increased carbon storage by 20.28%, while the SSP3-7.0 had the lowest and increased carbon storage by 19.14%.
The driving factor that had the greatest impact on the carbon sequestration rate was forest area, followed by DEM and forest age. Natural factors had a more significant influence on the carbon sequestration rate in forest vegetation than did economic and social factors. In general, from 2010 to 2030, the carbon sequestration rate of all districts and counties in Chongqing maintained a better growth trend than that from 2030 to 2006. This decline was primarily due to the increase in forest age when the forest area remained unchanged. This paper proposes corresponding measures at the natural, economic, and social aspects, and the concepts of focusing on nature and combining people with nature should be adhered to improve the carbon sequestration rate of forest vegetation, promote the overall protection, systematic restoration, and comprehensive management of forest; and effectively utilize their carbon sequestration potential.


