Article

YOLO-Crater Model for Small Crater Detection

1
Technology and Engineering Center for Space Utilization, Chinese Academy of Sciences, Beijing 100094, China
2
Key Laboratory of Space Utilization, Chinese Academy of Sciences, Beijing 100094, China
3
School of Aeronautics and Astronautics, University of Chinese Academy of Sciences, Beijing 100049, China
4
School of Computer Science and Artificial Intelligence, Wuhan University of Technology, Wuhan 430070, China
5
School of Sociology and Population Studies, Renmin University of China, Beijing 100872, China
*
Author to whom correspondence should be addressed.
These authors contributed equally to the paper.
Remote Sens. 2023, 15(20), 5040; https://doi.org/10.3390/rs15205040
Submission received: 28 August 2023 / Revised: 9 October 2023 / Accepted: 11 October 2023 / Published: 20 October 2023
(This article belongs to the Special Issue Laser and Optical Remote Sensing for Planetary Exploration)

Abstract

:
Craters are the most prominent geomorphological features on the surface of celestial bodies, which plays a crucial role in studying the formation and evolution of celestial bodies as well as in landing and planning for surface exploration. Currently, the main automatic crater detection models and datasets focus on the detection of large and medium craters. In this paper, we created 23 small lunar crater datasets for model training based on the Chang’E-2 (CE-2) DOM, DEM, Slope, and integrated data with 7 kinds of visualization stretching methods. Then, we proposed the YOLO-Crater model for Lunar and Martian small crater detection by replacing EioU and VariFocal loss to solve the crater sample imbalance problem and introducing a CBAM attention mechanism to mitigate interference from the complex extraterrestrial environment. The results show that the accuracy ( P = 87.86%, R = 66.04%, and F 1 = 75.41%) of the Lunar YOLO-Crater model based on the DOM-MMS (Maximum-Minimum Stretching) dataset is the highest and better than that of the YOLOX model. The Martian YOLO-Crater, trained by the Martian dataset from the 2022 GeoAI Martian Challenge, achieves good performance with P = 88.37%, R = 69.25%, and F 1 = 77.65%. It indicates that the YOLO-Crater model has strong transferability and generalization capability, which can be applied to detect small craters on the Moon and other celestial bodies.

Graphical Abstract

1. Introduction

As circular geomorphological features, craters are formed by the collision of small celestial bodies at high speed. They have great significance for geological age estimation of the Moon [1,2] and Mars [3], terrain and evolutionary history research [4], mineral resource assessment [5], safe landing [6,7], landing site selection and obstacle avoidance for rovers [8], evaluating the influence of the crater abundance on the ice occurrence [9] in the lunar polar Permanently Shadowed Regions (where ARTEMIS [10] will land), and even subsurface exploration [11]. Hence, crater detection has always been a hot topic. In the early days, crater detection mainly relied on visual interpretation with astronomical telescopes and remote sensing images. Whereas these methods based on subjective experience are unstable and time-consuming [12]. With the development of information and space technology, more and more automatic CDAs (Crater Detection Algorithms) have been brought forward with high accuracy [13]. Now, the features extracted by deep networks have stronger discrimination and generalization abilities than hand-crafted features [14], and numerous detection methods based on deep learning have been emerging.
As one of the most popular object detection models, You Only Look Once (YOLO) makes predictions based on the global information of an image and makes good use of the context [14]. Moreover, it performs well in the detection of multi-scale, small objects. Therefore, more and more researchers use YOLO to detect craters. Benedix et al. [15] developed a model based on YOLOv3 to detect kilometer-size craters on Mars using daytime infrared data (100 m/pixel) acquired by the Thermal Emission Imaging System (THEMIS) [16] with an accuracy of F 1 = 87%. In addition, YOLOv3 was able to perform well in detecting sub-kilometer craters using Lunar Reconnaissance Orbiter Camera Narrow Angle Camera (LROC-NAC) data with high accuracy ( F 1 = 84%) but low accuracy for large-scale craters ( F 1 = 62%) [17]. Cui et al. [18] trained YOLOv5 with SLDEM to detect craters of diameters ranging from 2 to 15 km in the South Pole-Aitken Basin, with an accuracy of F 1 = 95%. Tang et al. [19] utilized YOLOv5 to detect kilometer-size craters using Lunar Reconnaissance Orbiter Camera Wide Angle Camera (LROC-WAC) data, with an accuracy of F 1 = 69%. In terms of model construction, most methods directly use the baseline YOLO model to detect craters. However, the loss function (measure the difference or error between the predicted results of the model and the actual results) of the YOLO makes it difficult to solve the sample imbalance problem of small targets in the training process [20], which may lead to poor performance under complex conditions. The lunar surface has various geomorphic features [21], and some circular highlight-shadow landforms are easy to misidentify as craters, such as volcanic cones, domes, etc. Moreover, images that are taken under different illumination conditions highlight different features on the lunar surface, and topographic features of craters generate less pronounced shadows at lower incidence angles [22]. Therefore, to improve the detection accuracy of small craters (diameter < 1 km), it is necessary to improve the YOLO model.
Currently, an abundance of lunar data have been used to build crater sample datasets. For example, the main image datasets are based on Chang’E CCD, LROC-NAC, and SELENE TC (Terrain Camera). Most topographical datasets came from Chang’E-DEM (Digital Elevation Model), LOLA-DEM, SLDEM, and SELENE-DEM. In model training, the dataset requires completeness, self-consistency, timeliness (data keeps pace with the times and is not outdated), confidentiality, accuracy, standardization, unbiasedness, and ease of use [23]. That is to say, the quality and distribution of the dataset will affect the detection accuracy. However, there is no standard sample dataset for crater detection. In fact, the sample data is selected regardless of regional differences, geomorphological features, data types, resolution, object size, and so on. According to the data processing, there is no systematic analysis of the impact of the data visualization. Some models directly use the original data, while others use the processed data with different visualization stretching methods [24,25]. However, different methods will lead to different visual effects and potential information loss, which may have a great impact on detecting accuracy. The Chang’E-2 (CE-2) data has good consistency in imaging mode, coverage, data processing, and spatial resolution [26], which makes it possible to build a dataset for global small lunar crater detection.
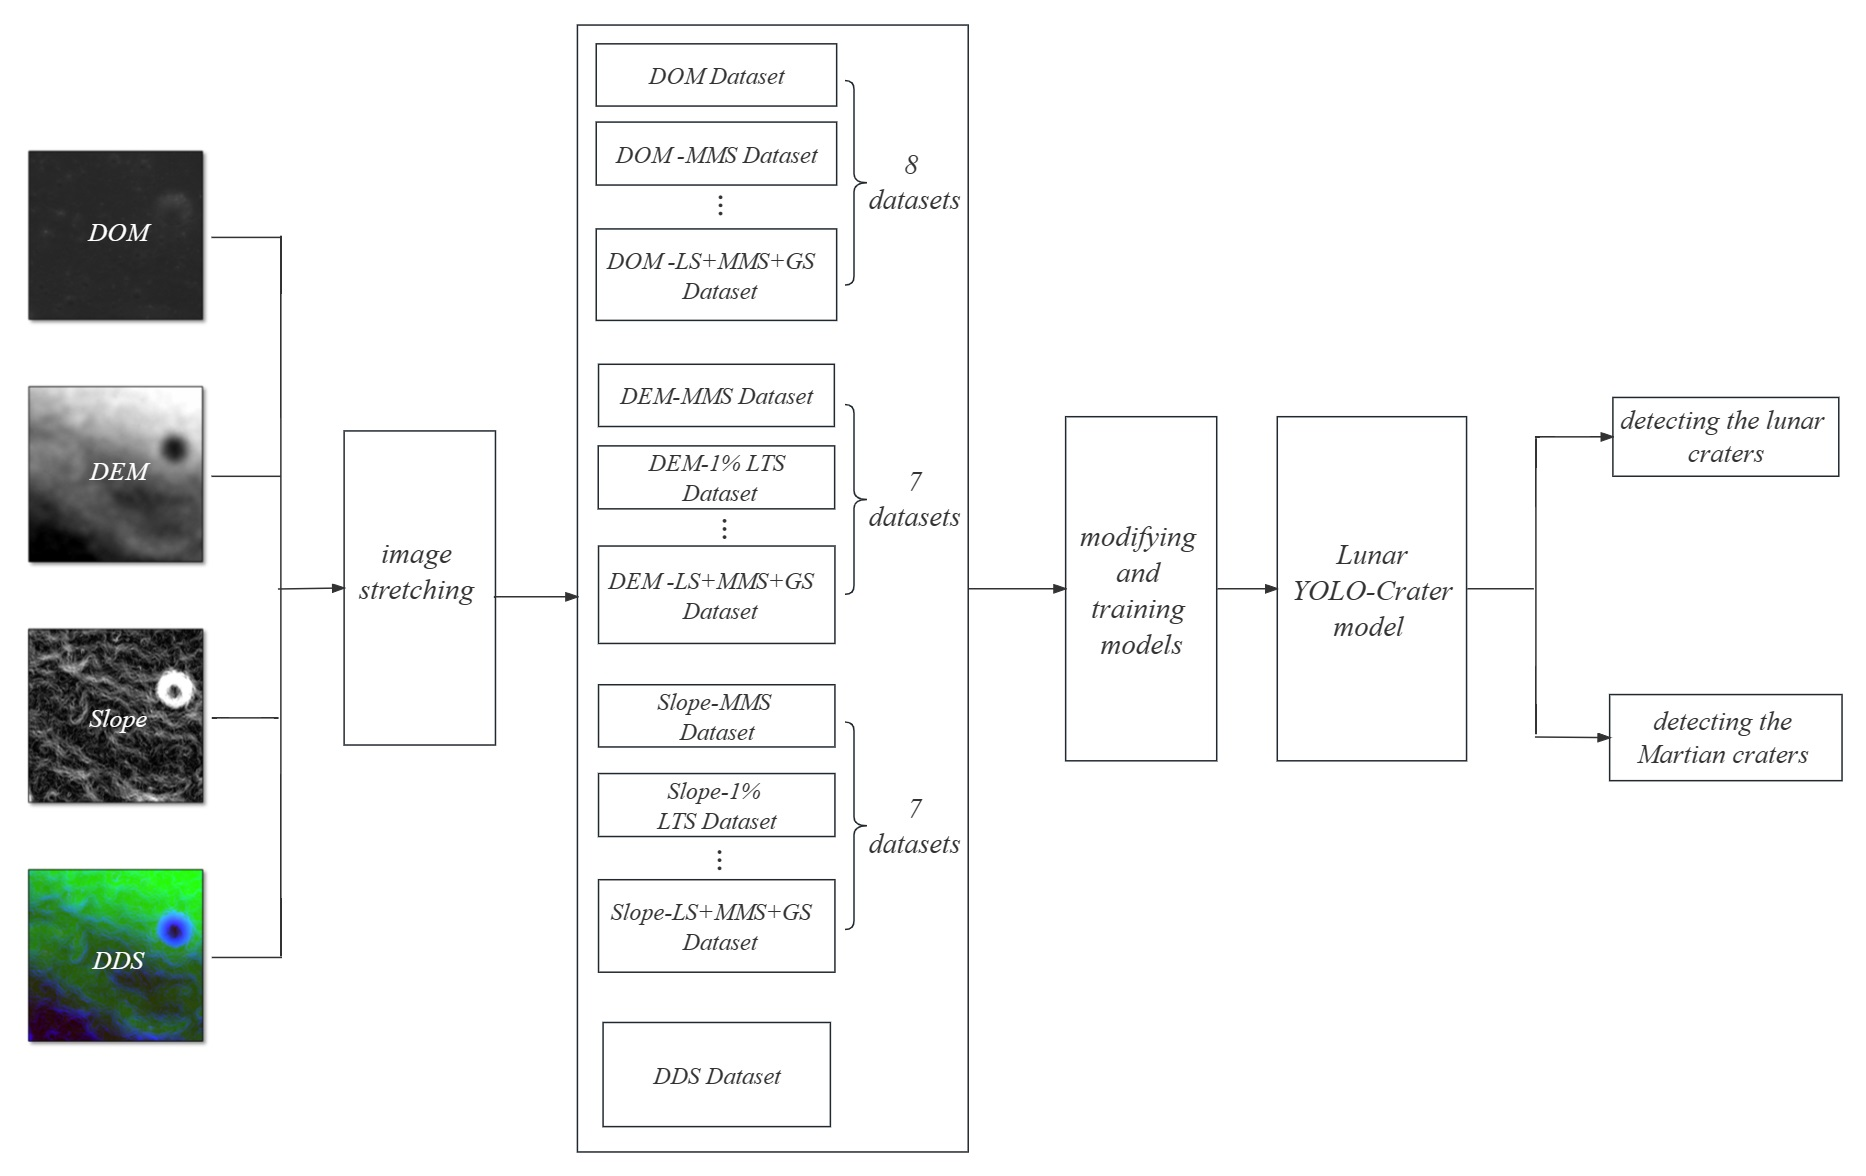
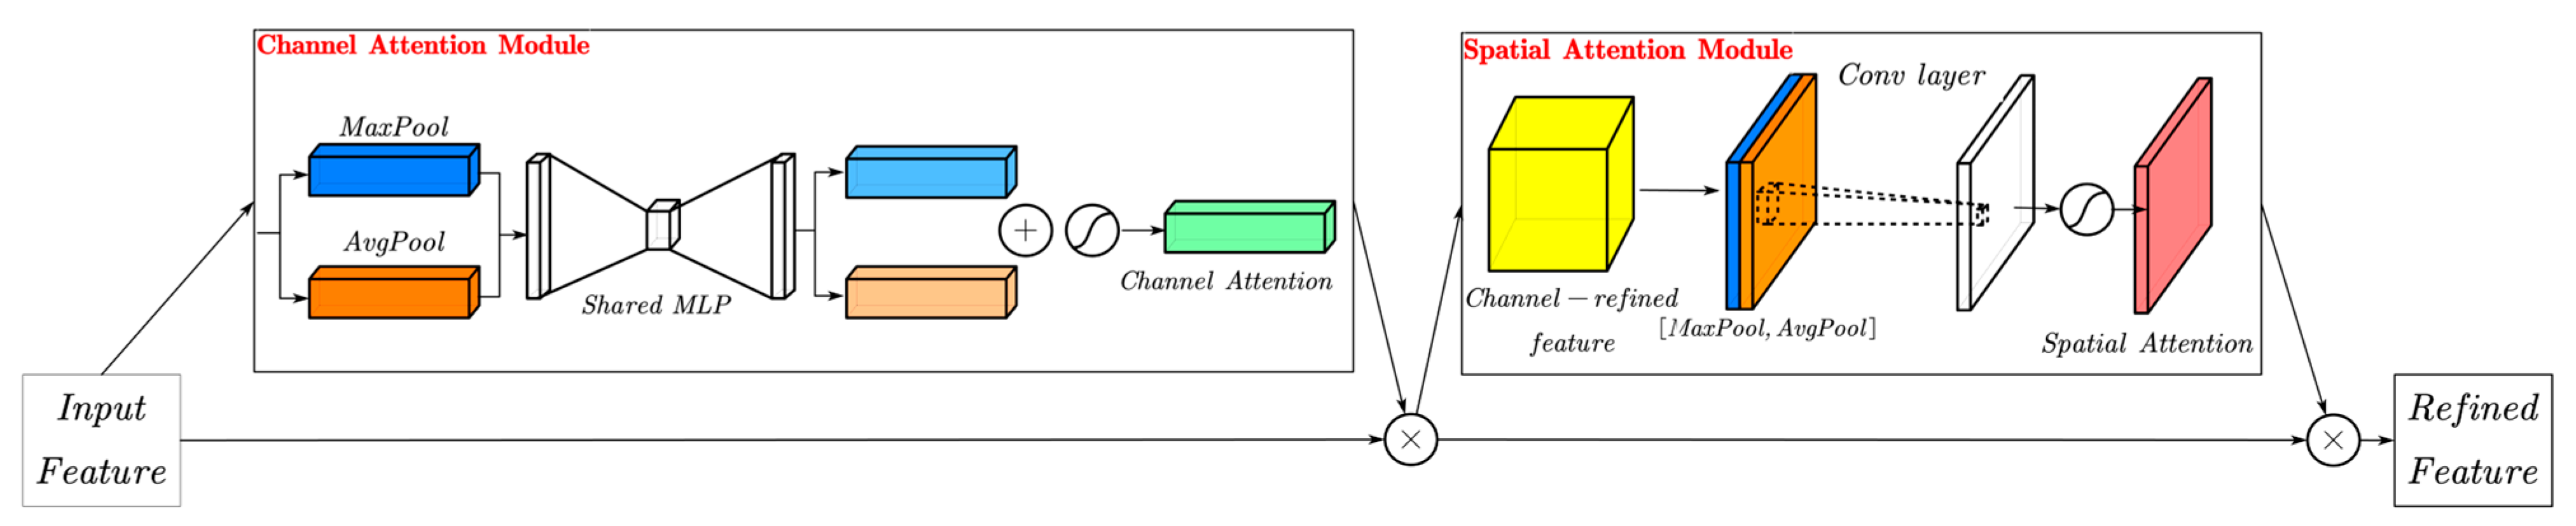
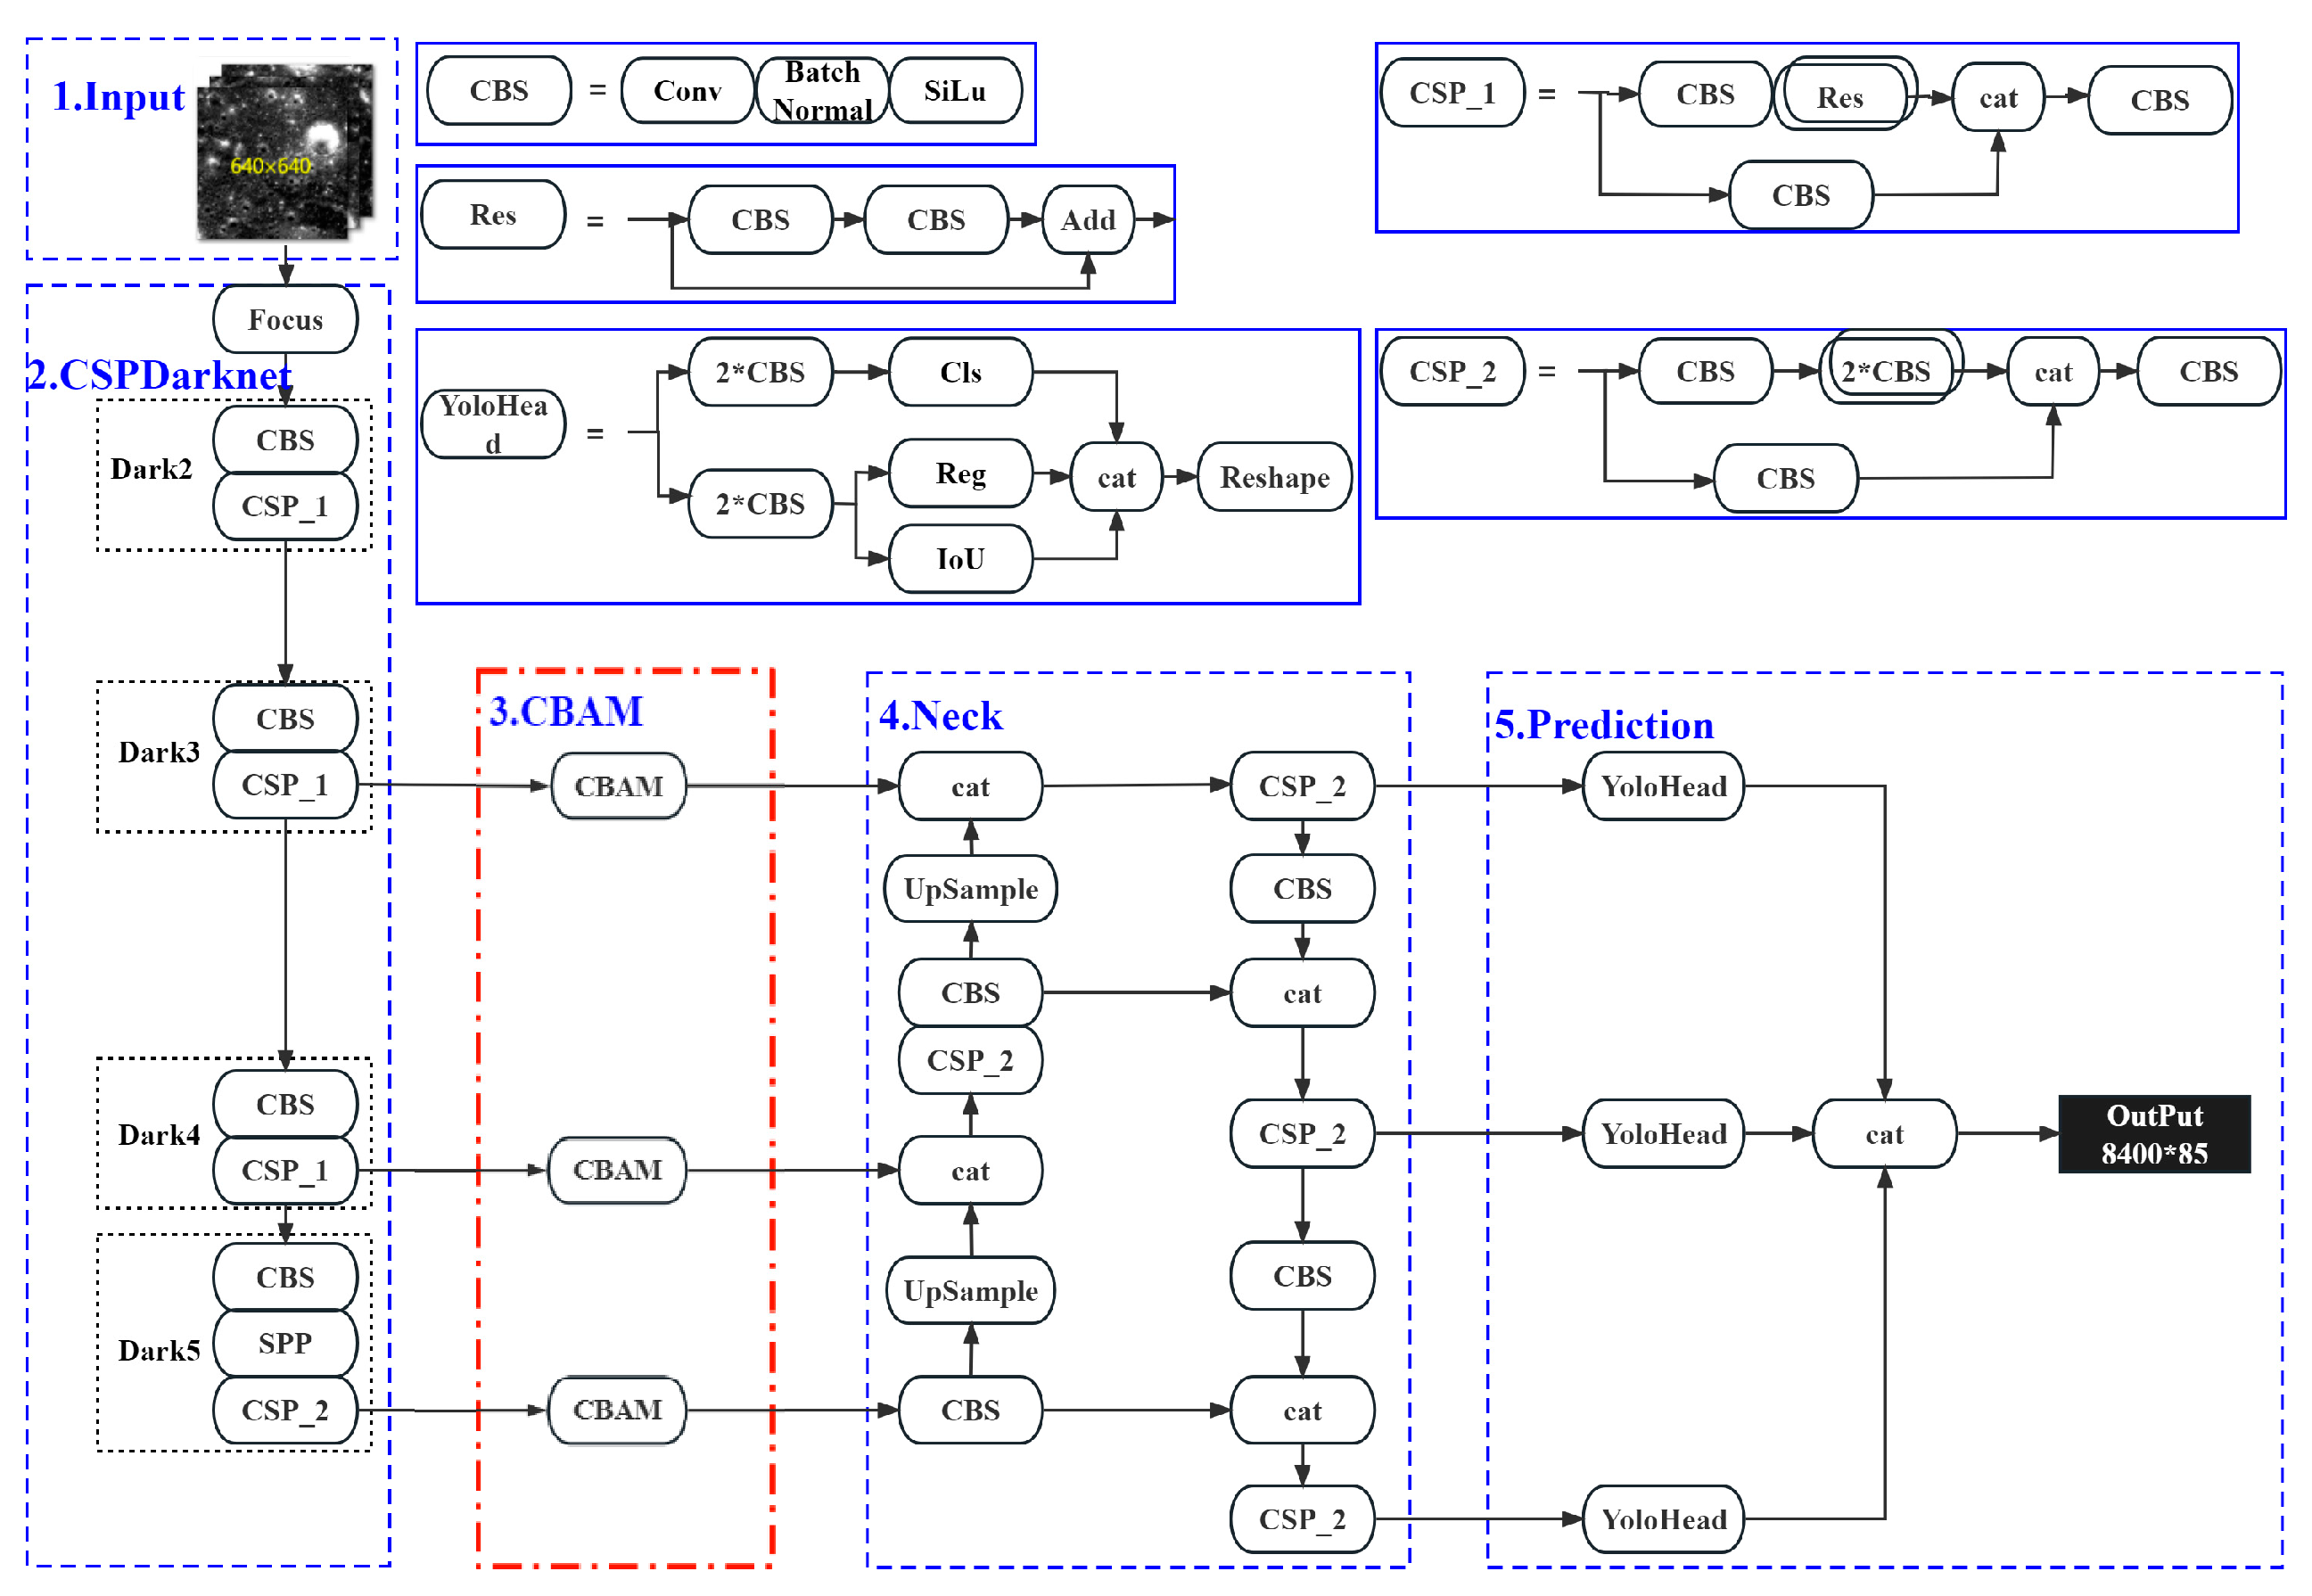
In this paper, we propose a novel crater detection model (called YOLO-Crater) by replacing the loss function and introducing the CBAM attention mechanism based on the YOLOX network structure. Then, the CE-2 DOM (Digital Orthophoto Map), DEM (Digital Elevation Model), Slope (terrain slope derived from DEM), and integrated data were used to build 23 sample datasets with different visualization stretching methods and train the YOLO-Crater models, respectively. To determine the final dataset and the corresponding Lunar YOLO-Crater model, a series of comparative experiments (see Section 4.1) were made to analyze the visualization stretching methods and the detection model accuracy. Finally, the Martian sample dataset provided by the 2022 GeoAI Martian Challenge was used to train the Lunar YOLO-Crater model to build the Martian crater detection model (called Martian YOLO-Crater) and evaluate the YOLO-Crater’s transferability and generalization capability.

2. Dataset

The dataset is used to train and test the crater detection model. The lunar dataset was based on high-spatial-resolution data and small sample craters. The sample information includes the size and position of the sample craters. Currently, the SELENE-TC, LROC-NAC, and CE-2-CCD can provide lunar image data with high resolution [26,27,28]. The resolution of SELENE-TC data is 7.4 m/pixel, and the coverage rate (the percentage of the surface that is covered) is 92.4%. However, the mosaic image has dislocation, leakage in the middle and low latitudes, and inconsistent brightness in the polar regions. The LROC-NAC data resolution covers 0.5 to 2 m/pixel. However, due to inconsistent imaging conditions, there are great differences in positioning, resolution, brightness, and shadow. Now, the CE-2 provides global DOM data (7 m/pixel) and DEM data (20 m/pixel) with consistent imaging conditions and a positioning control network, which made it possible to build a standard sample dataset for all of the lunar crater detection. As for the sample dataset, there is no publicly available and unified small crater dataset. Now, many lunar crater databases have been created by Head et al. [29], Salamunićcar et al. [30], Povilaitis et al. [31], Robbins [
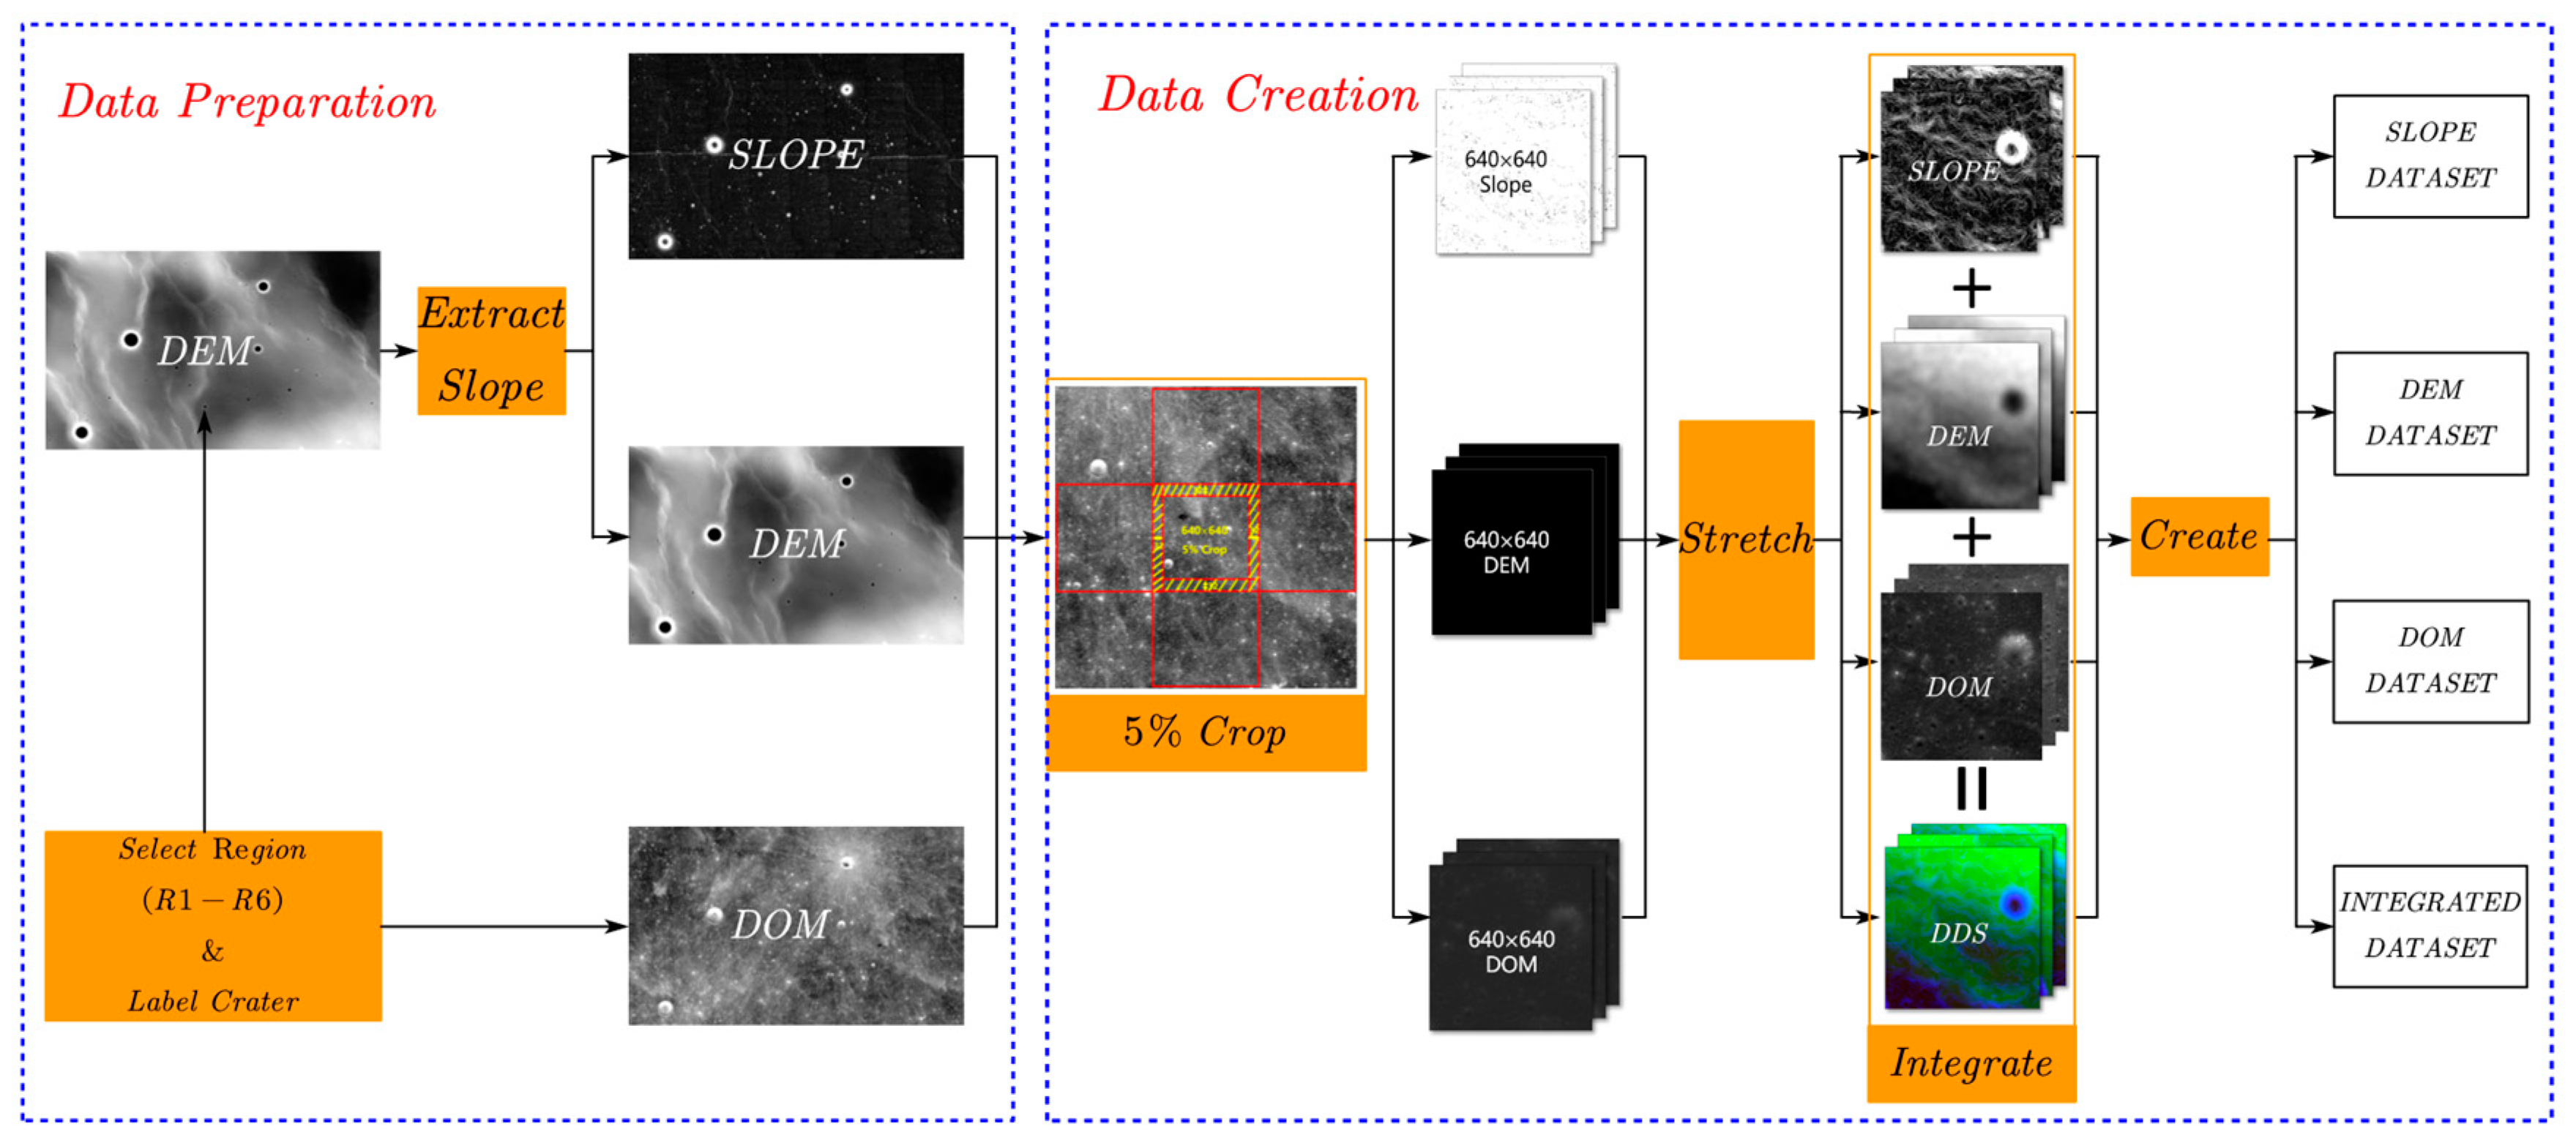
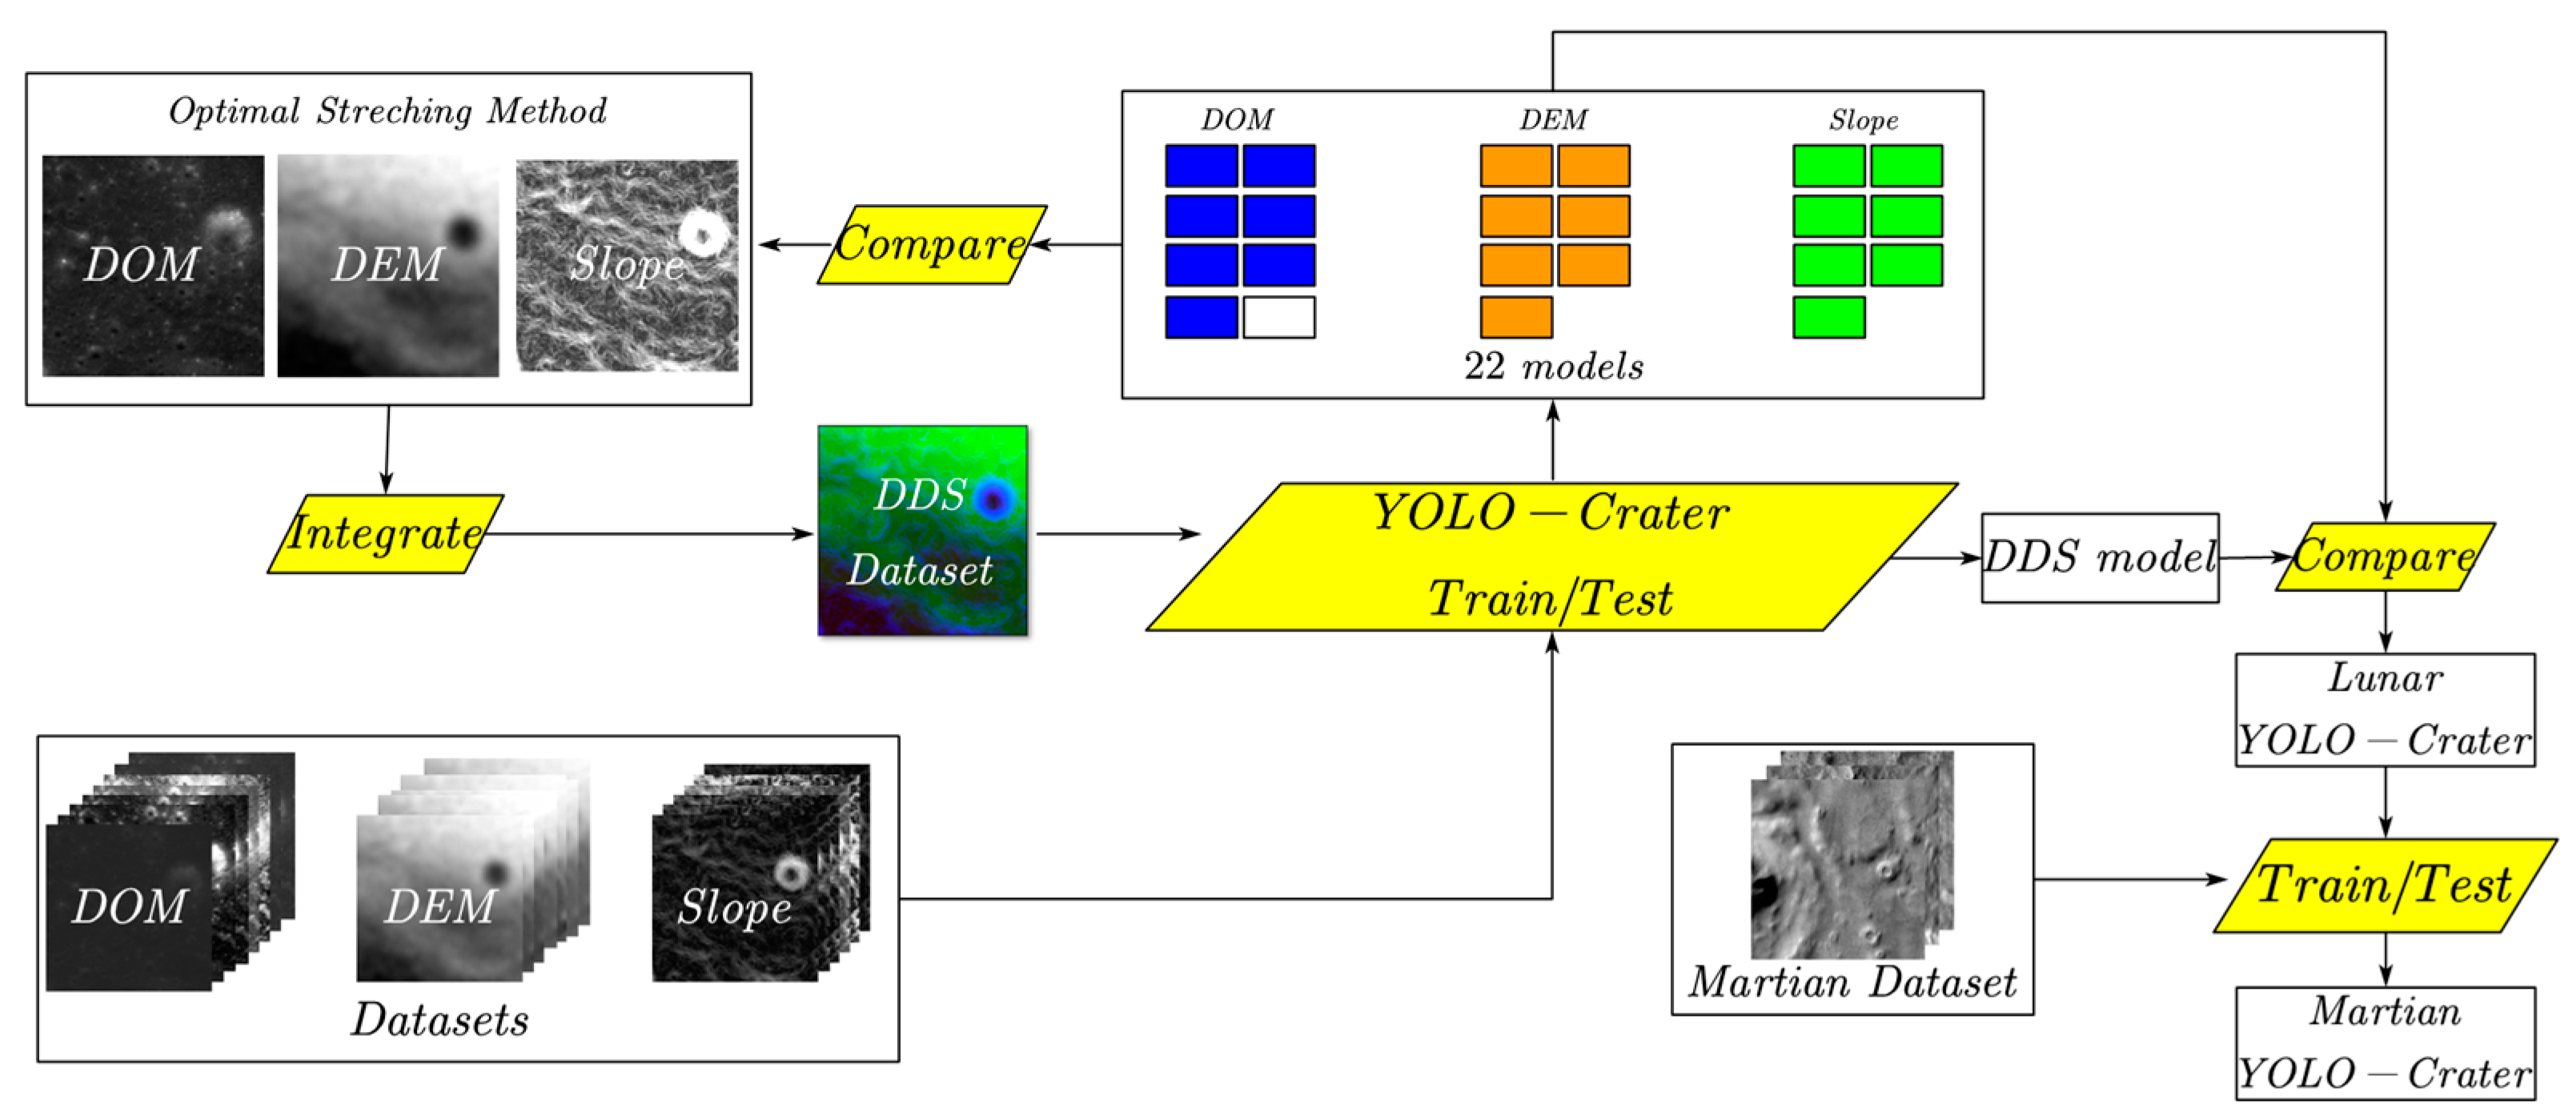
32], and so on. However, the crater size is more than a kilometer, which cannot be used to create the small crater sample dataset. Many CDAs have used the DOM, DEM, and some derived data to detect the crater, but there is no adaptation evaluation of the above data. So, we selected DOM, DEM, Slope extracted from DEM, and integrated data (DOM, DEM, and Slope: DDS) to create the small crater sample dataset in the typical sample areas and make a comparative experiment to evaluate the applicability of datasets. The dataset creation process includes data preparation and data creation (see Figure 1).

2.1. Data Preparation

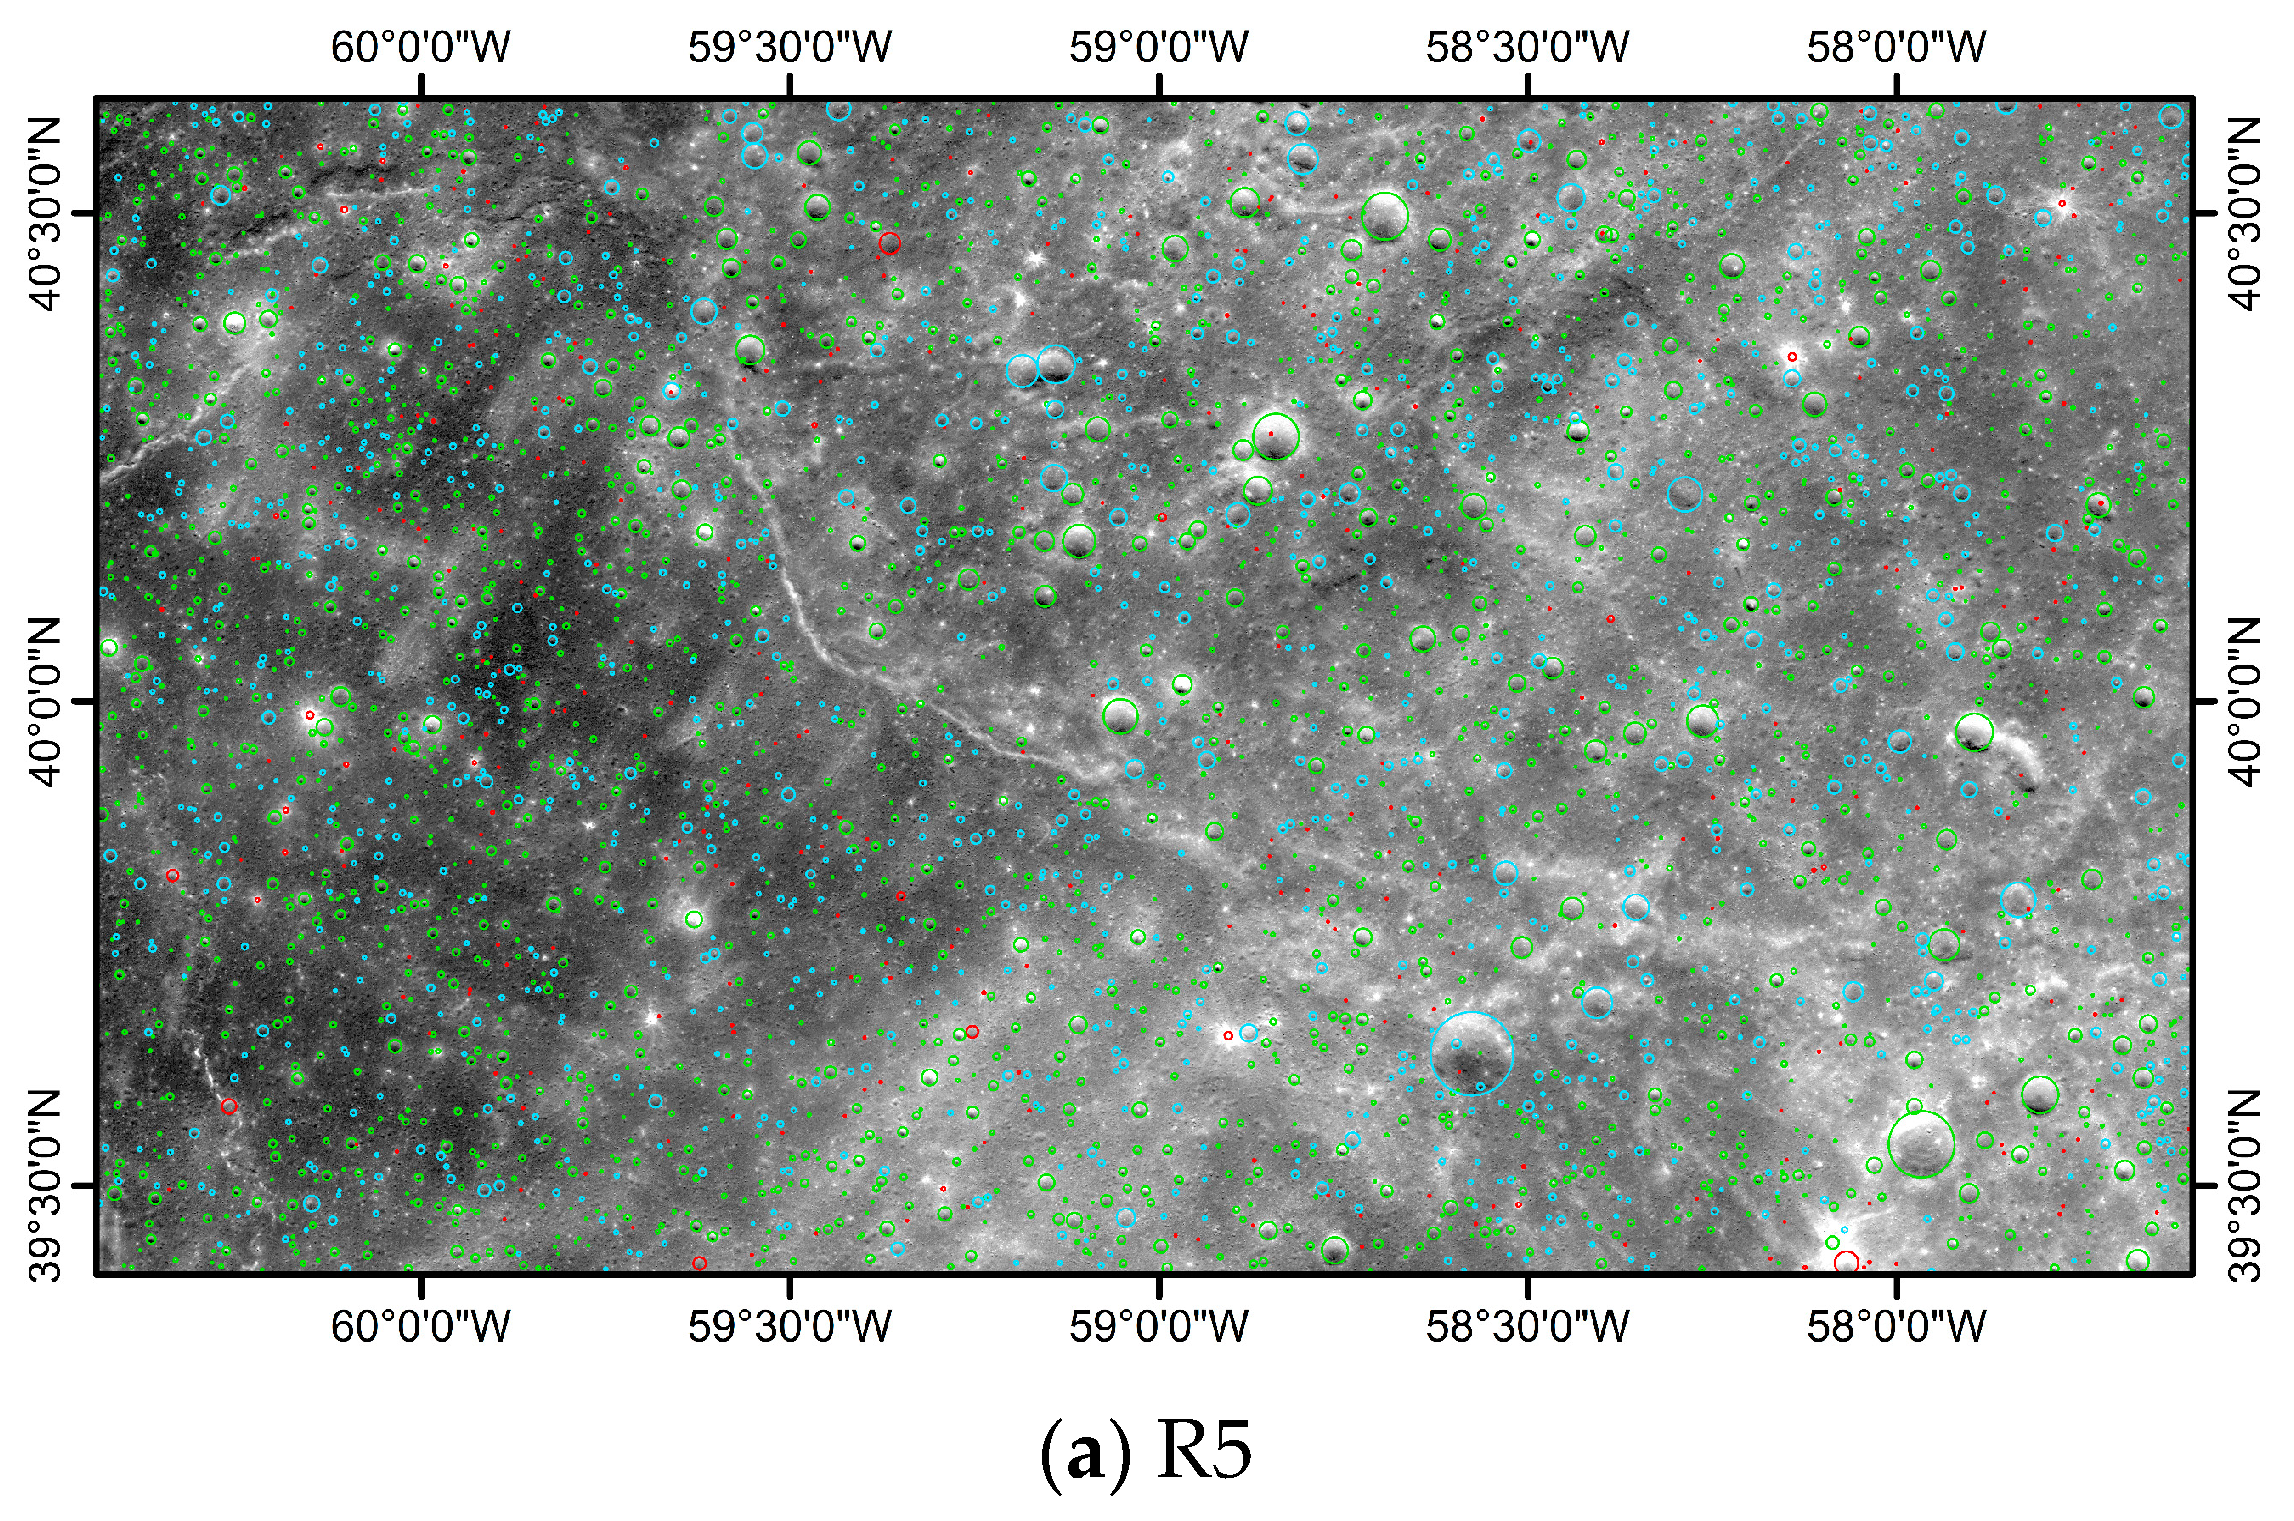
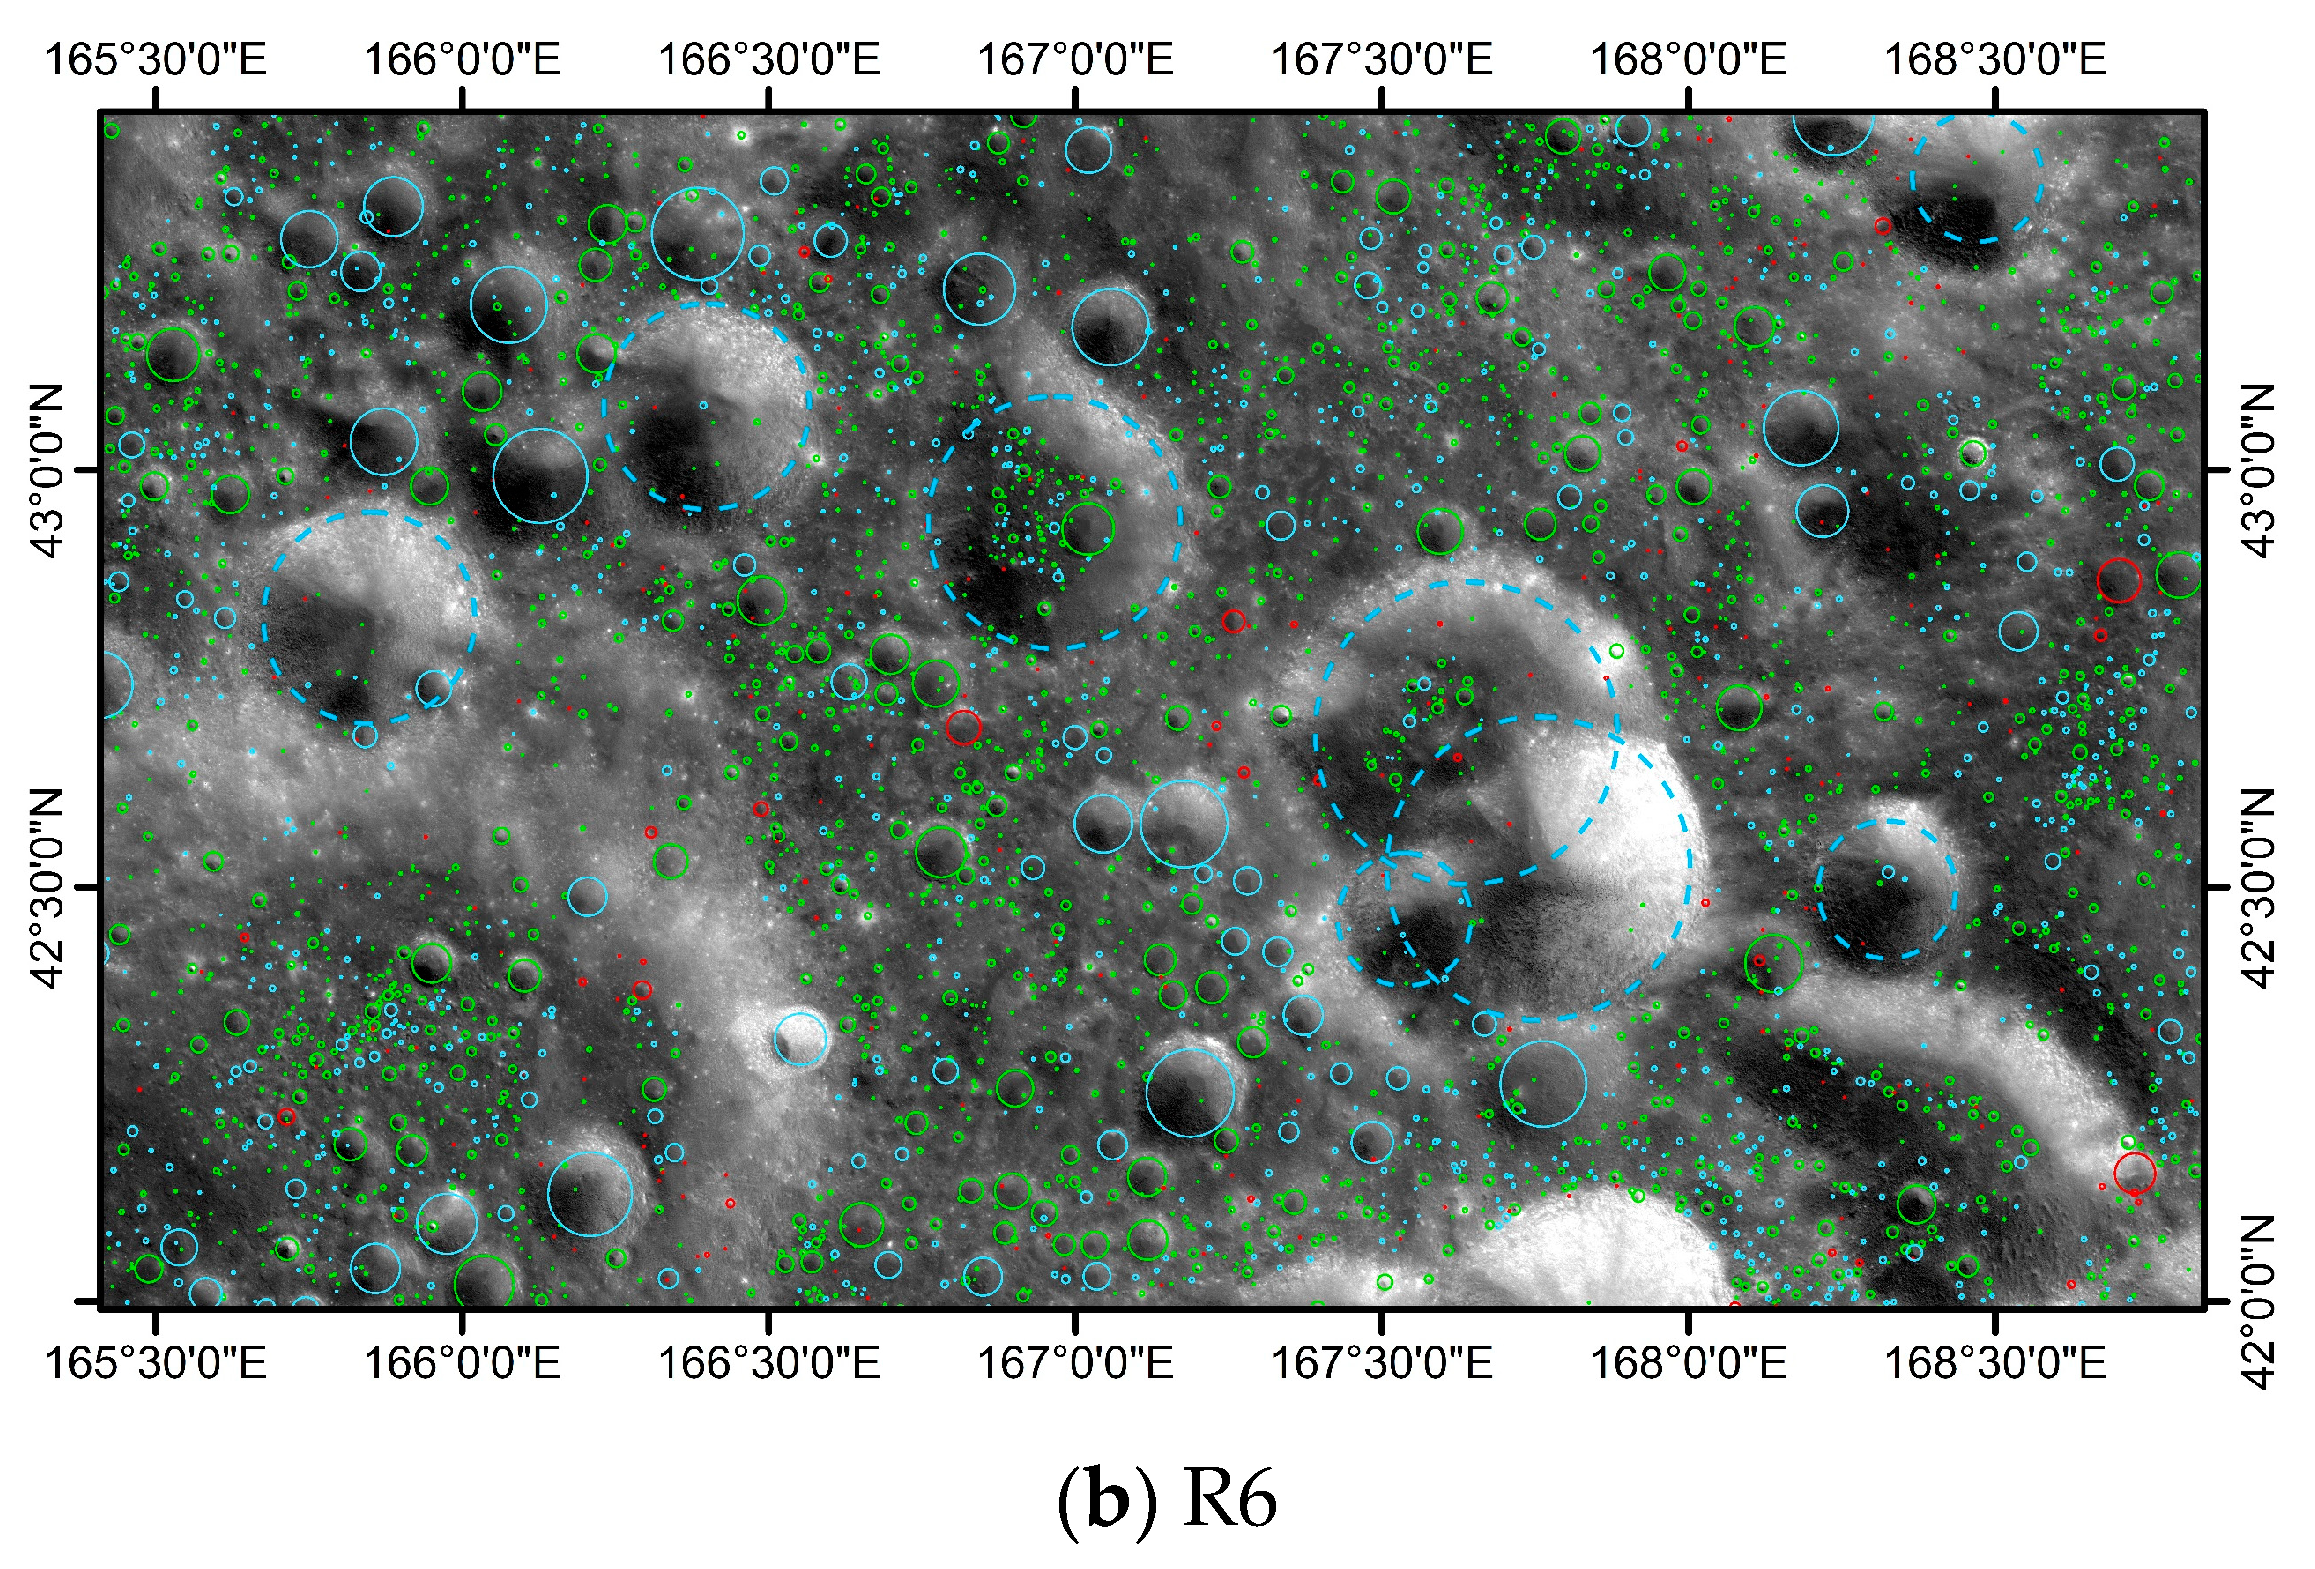
Though the CE-2 image has consistent imaging conditions, the difference in terrain and placement makes the texture different. To make the detection model have better generalization capability, the crater samples should cover different types of craters. The lunar surface has different terrains, and the types of craters on different terrains are different. Therefore, the features of craters are also different, such as reflectance, shadow direction, and so on. In this paper, we selected six sample areas in Maria and Highland. Among them, R1, R2, R3, R4, and R6 were selected by Zang et al. [33]. While R5 is reselected to expand the Maria area. R5 coves 57.59°W and 39.41°N–40.61°N, with the same extent as the R6 (in Highland).
We labeled the crater with DOM data manually using ArcMap software and recorded the center coordinates and radius of the crater. The labeling principle is that the shadow direction of any given crater in the same area is consistent [33]. However, we found that there are some missed labels and incorrect labels, such as short lunar wrinkle ridges with the same highlight-shadow features as craters. To improve the detection accuracy of the model and the completeness of the crater label set, we verified and modified the labels marked by Zang et al. [33]. In the end, a total of 83,620 labels were obtained. The number of labels is significantly higher than those labeled by Fairweather et al. [17] with 43,402, Hashimoto and Mori [34] with 4967, Yang et al. [35] with 14,406, and Lagain et al. [
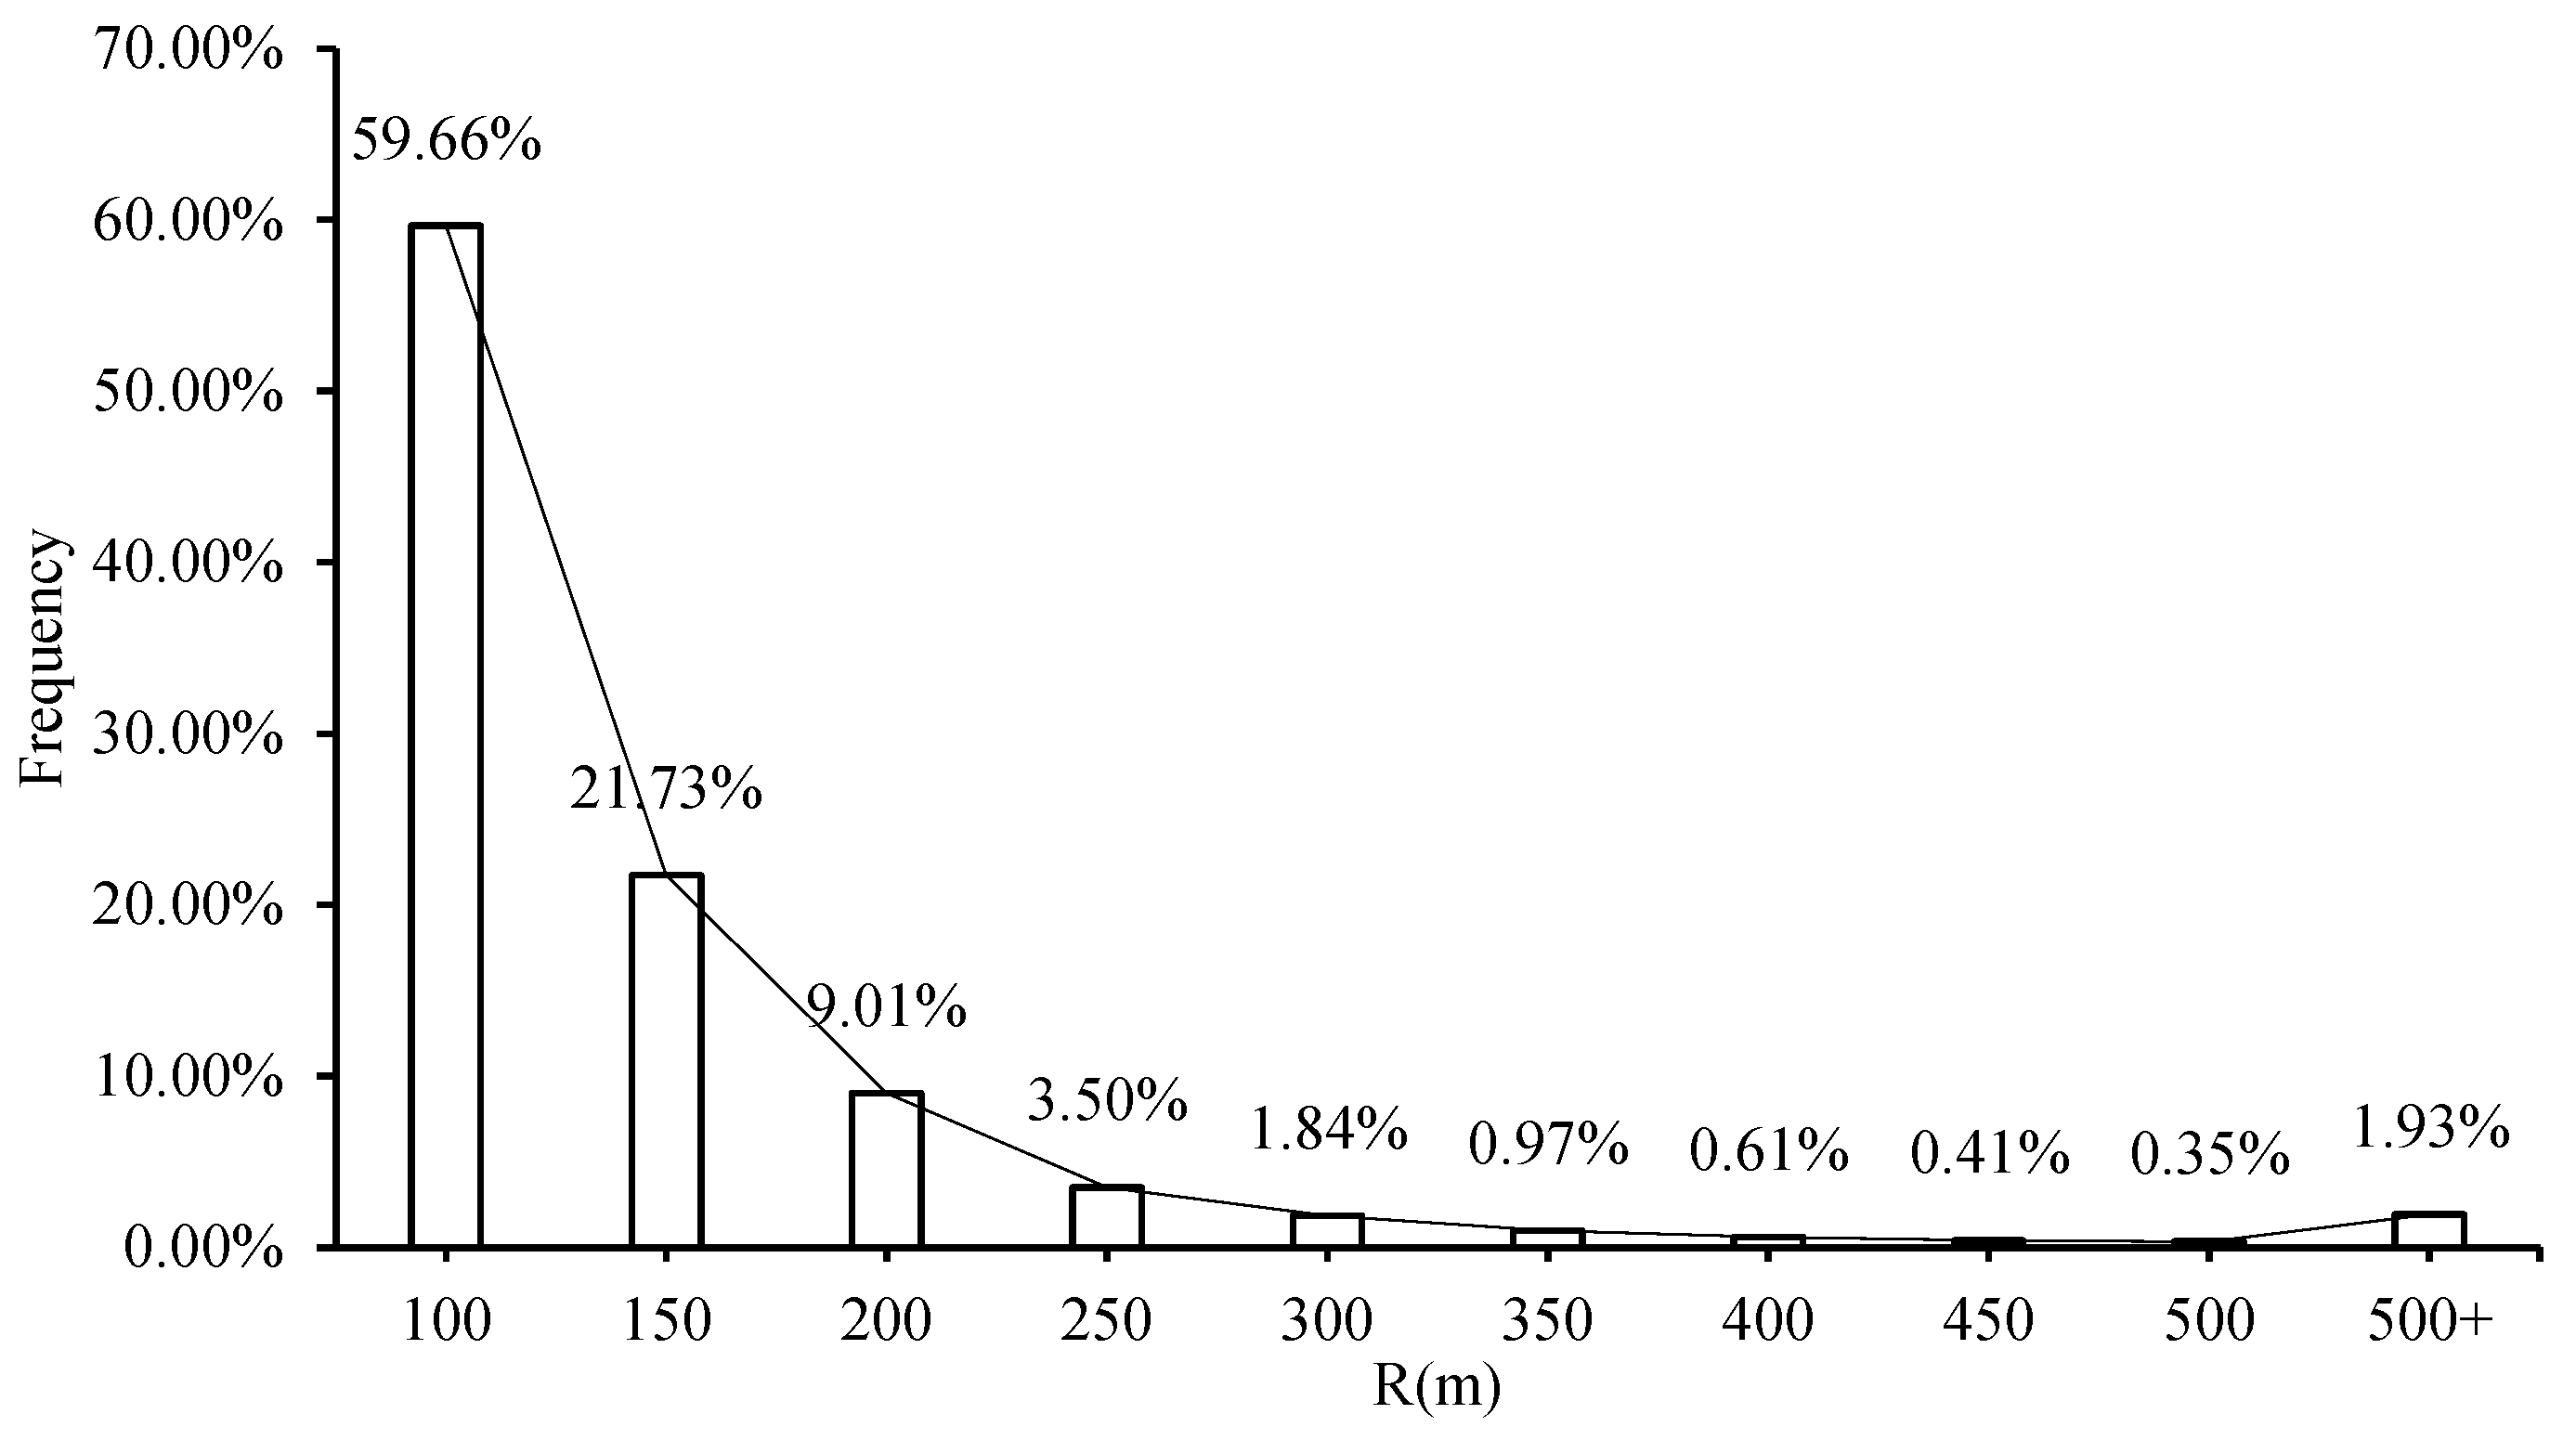
36] with 2142. The number of labels in R1 to R6 are 8632, 8857, 23,970, 34,884, 3519, and 3758, respectively. In addition, 42,006 new craters were labeled. The size-frequency distribution of labels (see Figure 2) shows that 99% are less than 1 km in diameter.
In order to evaluate the crater detection ability with DEM data, we also collected the CE-2 DEM (20 m/pixel) in the same sample areas.

2.2. Dataset Creation

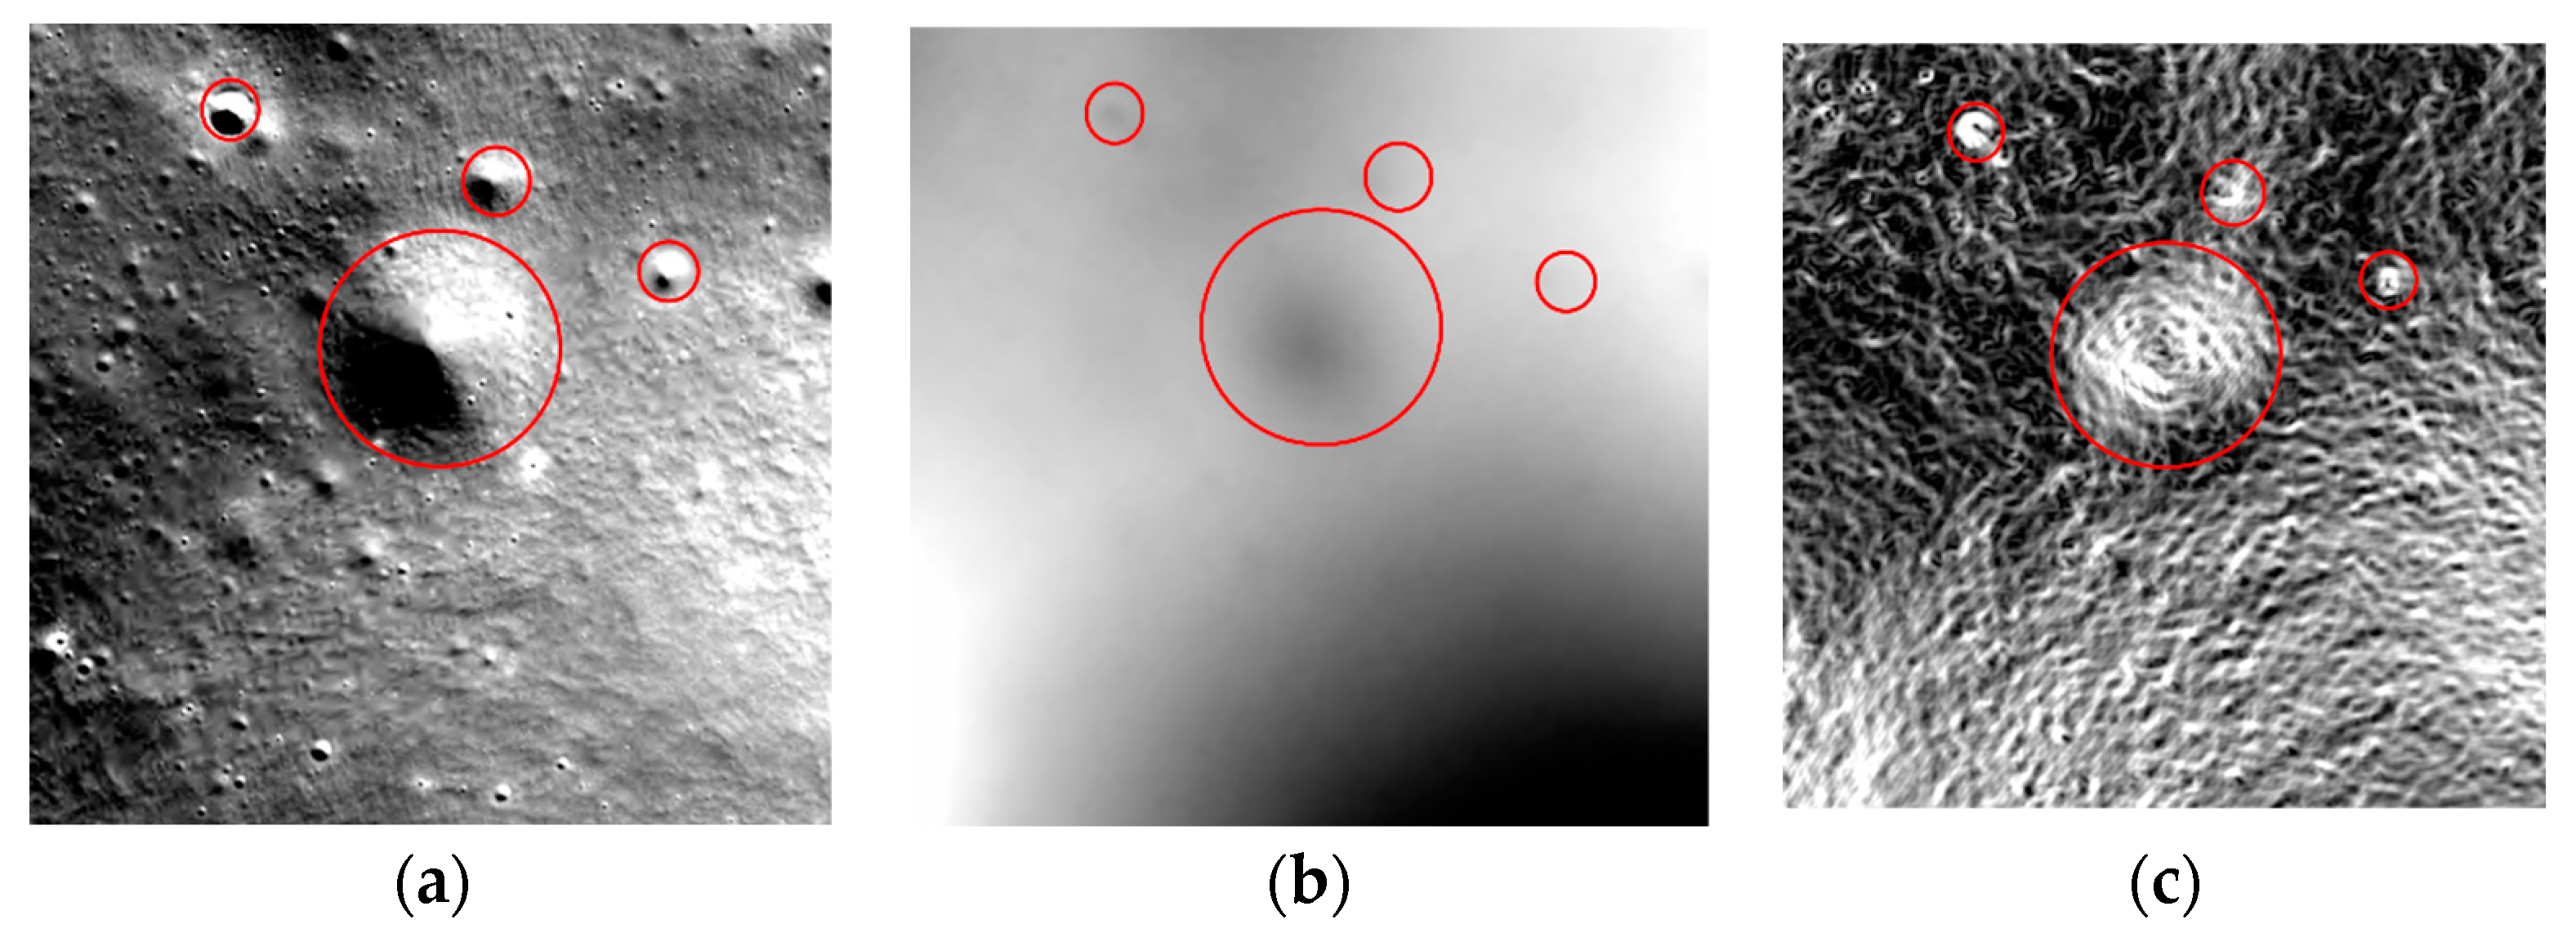
DEM data is the value of the elevation, which cannot be used to detect the craters directly in the CDAs. Thus, DEM should be transformed and visualized into an image [37]. However, there is no reference to analyze and evaluate the effect of the visualization transform, which may affect the detecting accuracy deeply. In the compilation of Chang’E-1 Topographic Atlas of the Moon [38], Mu conducted a comparative experiment about DEM visualization. If the global DEM data acquired by Chang’E-1 was divided into 188 sheets, and then each sheet was enhanced and visualized, the topographic details were very clear. In verse, if the global DEM was visualized and then divided, the topographic details in each sheet were unclear. Mu obtained the same result in compiling The Chang’E-2 High Resolution Image Atlas of Lunar Sinus Iridum [39]. So, we used the former data processing to visualize the dataset with several image stretching methods. The following are the steps for dataset creation:
Firstly, we cropped the data into 640 × 640 pixel blocks with a certain overlap to make the crater on the segmentation boundary be detected properly [40]. As shown in Figure 2, approximately 90% of craters’ radius is less than 250 m, and we weighed the completeness of the crater (it is considered that a complete crater is defined as when at least half of its area appears in the block) and the efficiency of model training and chose an overlap rate of 5% (250 m ÷ 7 m/pixel ÷ 640 pixels ≈ 5%).
Secondly, we used seven kinds of stretching methods commended by Gao [41] and ArcMap [42] to visualize and enhance the cropped data. The stretching methods include Maximum-Minimum Stretching (MMS), 1%/2% Linear Truncation Stretching (1%/2% LTS), Standard Deviation Stretching (SDS), Histogram Equalization (HE), Laplacian Sharpening (LS), and Gaussian Smoothing (GS). As a result, we obtained 22 datasets [3 kinds of data (DOM, DEM, and Slope) × 7 (methods) + 1 (DOM without any enhancement) = 22] in VOC format for model training and stretching method adaptation evaluation.
Finally, we divided the dataset into training, validation, and testing data. In each dataset, the training data and validation data with a ratio of 9:1 were randomly selected in R1, R2, R3, and R4, and the testing data contained all of the samples in R5 and R6.

2.3. Martian Dataset

The Martian dataset, downloaded from the 2022 GeoAI Martian Challenge in CodaLab (http://cici.lab.asu.edu/martian/#data-download (accessed on 20 April 2022)), was created by Hsu et al. [43]. The image data was THEMIS daytime infrared with 100 m resolution and global coverage [44]. In addition, Martian sample craters were labeled with bounding boxes (BBOXs), recording the center and length diameter provided by Robbin’s crater database [45]. The total number of labels was 301,912, with 27.3% between 0.2 km and 1 km in diameter, 38.94% between 1 and 1.5 km and nearly 90% no more than 3 km. The dataset contained 102,675 images of 256 × 256 pixels. The training data contained 50,838 images with 149,560 craters, the testing data contained 50,837 images with 149,389 craters, and the validation data contained 2963 craters.

3. Methods

3.1. YOLO-Crater

In this paper, we used YOLOX [46] as the baseline crater detection framework. In the framework, the loss function was replaced, and an attention mechanism was introduced to solve the sample imbalance problem and enhance the feature extraction ability. As shown in Figure 2, there is an imbalanced distribution in crater samples: 59.66% less than 100 m in radius, 21.73% from 100 m to 150 m, 12.51% from 150 m to 250 m, and only 6.11% more than 250 m. As for the sample type, there are simple craters, complex craters, and degraded craters. However, YOLOX uses the traditional binary cross-entropy loss to calculate the confidence loss, which makes it difficult to solve the crater sample imbalance problem [47]. VariFocal loss borrows the weighting idea from focal loss and deals with large, small, simple, and complex craters asymmetrically to solve the imbalance problem [48]. So, we replaced the traditional binary cross-entropy loss with the VariFocal loss. Furthermore, YOLOX uses the Intersection over Union (IoU) loss to calculate the localization loss. When the crater prediction box and crater ground truth box have no intersection, IoU = 0, which can result in a gradient vanishing problem for non-overlapping areas. Zheng et al. [49] suggested that a good positioning loss should consider three important geometric indicators, namely overlapping area, center point distance, and aspect ratio. Efficient-IoU (EIoU) loss combines these geometric indicators, which can relieve the gradient vanishing problem [50]. Thus, we replaced IoU loss with EIoU loss ( L E I o U ). EIoU loss is measured by the following expressions:
I o U = A B A B
L E I o U = L I o U + L d i c + L a s p = 1 I o U + ρ 2 b , b g t c w 2 + c h 2 + ρ 2 w , w g t c w 2 + ρ 2 h , h g t c h 2
where b , h , w are the central point, height, and width of the prediction box. b g t , w g t , h g t are the central point, height, and width of the ground truth box. c w and c h are the width and height of the smallest enclosing box covering the prediction box and ground truth box, respectively. ρ = b b g t 2 is the Euclidean distance.
In addition, YOLOX uses the Darknet53 backbone and Path Aggregation Network (PANet) neck to extract features, which enhance the entire feature hierarchy with accurate localization signals in lower layers by bottom-up path augmentation [51]. However, due to the complex lunar topographic surface, some circular highlight-shadow landforms are easy to misidentify as craters, such as volcanic cones, domes, etc. Moreover, if there is a low contrast between the crater and the background in the image, it is difficult to detect the crater. To enhance the circular highlight-shadow feature and make the model focus on the crater area, the Convolutional Block Attention Module (CBAM) was introduced to the YOLOX. CBAM consists of a channel attention module and a spatial attention module [52], as shown in Figure 3. Channel attention focuses on ‘what’ is meaningful given an input image, while spatial attention focuses on ‘where’ is an informative part, which is complementary to channel attention [52].
By replacing the loss function and introducing the CBAM attention mechanism, we proposed a YOLO-Crater model shown in Figure 4. In the first stage, CE-2 images of 640 × 640 pixels were input into the backbone. In the second stage, Darknet53 was used to extract crater features. In the third stage, CBAM was added to the connection channel between the backbone and neck to enhance the crater features extracted by the backbone. In the fourth stage, PANet used up-sampling and down-sampling to merge the different hierarchy features from CBAM. In the last stage, the YoloHead was used to predict crater localization and size. Additionally, the VariFocal loss and EIoU loss were used to tune the model through backward propagation.

3.2. Model Training and Testing

The model training aims to obtain the best Lunar and Martian crater detection models. The model training was performed under the PyTorch framework (torch 1.8 + cu11) using the Python language (Python 3.7) and torchvision library (version: 0.9.0 + cu11). Accuracy metrics, including Precision ( P ), Recall ( R ), and F1 score ( F 1 ) [53], were adopted to evaluate the detection accuracy using Equations (3)–(5).
P = T P T P + F P
R = T P T P + F N
F 1 = 2 × P × R P + R
where T P , F P , and F N are the number of true positives, false positives, and false negatives, respectively.
The model training and testing include the following steps (see Figure 5):
The first step is to train the YOLO-Crater model using the DOM dataset and other 21 datasets (DOM, DEM, and Slope with seven kinds of visualization stretching methods) and select the optimal stretching method for each data type and the three corresponding datasets. Then, the above three datasets were integrated into the DDS dataset (see Section 4.1.1) to train the YOLO-Crater again.
The second step is to use the testing data from the above 3 datasets and the DDS dataset to evaluate the trained models using the accuracy metrics and determine the optimal model as the Lunar YOLO-Crater (see Section 4.1.2).
The last step is based on the idea of transfer learning, which means that some knowledge is specific to individual domains or tasks, and some knowledge may be common between different domains such that they may help improve performance for the target domain or task [54]. We take the Lunar YOLO-Crater model as a pre-trained model and use the Martian dataset to train and test the Martian YOLO-Crater.
The model hyper-parameters are shown in Table 1. Due to the crater texture information in Maria being poorer than that in Highland, we set the confidence threshold to 0.4 in Maria and 0.3 in Highland.

3.3. Detection Post-Processing

In Lunar YOLO-Crater model training and testing, the detected craters were located in image coordinates, which should be transformed into geo-coordinates to put the detected craters together. Furthermore, we cropped the data with a 5% overlap rate, which may produce duplicate craters and affect the detection accuracy. Thus, the detection post-processing includes the projection coordinate transformation, the duplication crater removal, and the accuracy calculation. We used the GetGeoTransform method described in [33] to transform the image coordinates ( x , y ) into the geo-coordinates (θ, ϕ). To remove the duplicate craters, we used the Non-Maximum Suppression (NMS) method, which selected the bounding box with the highest probability and suppressed all other bounding boxes that had an IoU greater than a threshold ( θ ) [25]. The threshold is determined below.
The correct detection ( T P ), missed detection ( F N ), and false detection ( F P ), used in (3)–(5), are calculated by (6) and (7). If the coordinates of the detected crater satisfy Equations (6) and (7), which means a correct detection ( T P ) [53]. Conversely, it is a missed detection ( F N ) or false detection ( F P ).
x t x p 2 + y t y p 2 min r t , r p 2 < D x y
r t r p min r t , r p < D r
where x t , y t , r t is the center pixel coordinates and radius of the labels; x p , y p , r p is the center pixel coordinates and radius of the detected crater; D x y and D r are tunable hyper-parameters.
To determine the tunable hyper-parameters, we selected the parameter combination with the highest F 1 . The range of θ is [0, 1]. A low threshold is not conducive to detecting overlapped craters. While a high threshold is not conducive to removing duplicate craters. Thus, we selected θ ∈ [0.3–0.7] with a step size of 0.1. D x y and D r have the same range [0.5, 3] [53]. A small step size can cause slow changes and consume more computing time, so we set the step size to 0.5 for D x y and D r . In the end, a total of 180 sets of parameter combinations were obtained, with the F 1 ∈ [0.7120–0.7541]. We selected the best parameter combination ( θ = 0.3 , D x y = 1.5 , D r = 1.5 ) with the corresponding F 1 = 0.7541 (see Figure 6).

4. Results and Discussion

Based on the following comparative experiments, we used the detecting accuracy metrics to evaluate the data visualization, determine the optimal dataset for the Lunar YOLO-Crater, and analyze the detecting accuracy distribution. In addition, we used the Martian dataset downloaded from the 2022 GeoAI Martian Challenge to test the transferability and generalization capability of the YOLO-Crater model.

4.1. Comparative Analysis of Lunar Crater Detection

4.1.1. Data Visualization an Evaluation

In this experiment, accuracy metrics such as Precision ( P ), Recall ( R ), and F1 score ( F 1 ) are used to evaluate visualization enhancement methods using the testing data, which can determine the optimal stretching method for each data type.
DEM: The testing data was used to evaluate the detection accuracy shown in Table 2. The highest detection accuracy is based on the DEM-1% LTS method, with F 1 = 23.35%. However, the lowest accuracy is based on the DEM-HE method, with F 1 = 13.51%. Furthermore, the MMS and LTS methods have similar accuracy, which also means that the elevation values of the highest point and lowest point have a greater impact on the DEM visualization. Additionally, the detection accuracy of the DEM datasets is low. So, the features for detecting in DEM data are limited because they lack texture features and highlight-shadow features.
Slope: In the sample areas, the maximum value of the slope is not more than 69°. Table 3 shows the detection accuracy for different stretching methods. The Slope-SDS achieves the highest accuracy with F 1 = 22.97%, more than 1.5% than the Slope-1% LTS. However, the Slope-HE achieves the lowest accuracy, with F 1 = 19.23%. Compared with the DEM datasets, the detection accuracy of the Slope datasets has shown no apparent increase.
DOM: Table 4 shows the accuracy of the detection based on Change’E-2 DOM with different image stretching methods. The DOM-MMS obtains the highest detection accuracy, with F 1 = 75.41%. The lowest is 67.29%, corresponding to the DOM- LS+ MMS + GS. However, the DOM achieves a better result ( F 1 = 72.33%). Compared with the MMS, the others did not improve the detection accuracy, but reduced it, which means the above image stretching methods have no great impact on detecting accuracy. The main reason is that the DOM, as the processed image data, has been enhanced [28]. Compared with the DEM and Slope datasets, DOM datasets have an apparent detecting accuracy increase. If image data were used to detect the crater, the MMS may be the best-recommended stretching method.
DDS: After the above comparison and analysis, we obtained the optimal stretching method for each datatype, and then we used the corresponding datasets (DOM-MMS, DEM-1% LTS, and Slope-SDS) to form the DDS dataset by layerstacking in ENVI software.

4.1.2. Best Dataset Selection

The above step determined the optimal stretching method for each data type and the corresponding dataset. To select the best dataset, we used the best testing accuracy for each data type. As shown in Table 5, the DOM-MMS dataset achieved the highest detection accuracy, with P = 87.86%, R = 66.04%, and F 1 = 75.41%. The DDS dataset achieved good accuracy with P = 84.33%, R = 63.01%, and F 1 = 72.13%, but missed some detections (see Figure 7).
The DEM-1% LTS dataset and the Slope-SDS dataset derived from the DEM resulted in the lowest accuracy. In Figure 8, we can see more texture information in the DOM-MMS dataset than that in the DEM-1% LTS and Slope-SDS datasets. Though the illumination cannot affect the DEM and slope, the texture in the image was affected by the landscape and the illumination, as shown in Figure 8. That is to say, the DOM image contains more of the crater’s features. For example, we can see that the craters have highlight-shadow features, and the texture is directional, which becomes an apparent feature for the craters. In the DEM-1% LTS image, we cannot see the apparent features. However, in the Slope-SDS data, we can see the slope changes in and out of the crater. Thus, the detection accuracy based on Slope-SDS is better than that based on the DEM-1% LTS.

4.1.3. Accuracy Distribution Analysis

To evaluate the detection model improvements, an ablation experiment was carried out to analyze the effect of the new loss function, CBAM, and both of them. Table 6 shows the results. Without any improvement, YOLOX was used to detect the crater with F 1 = 66.75%. When the CBAM was added to the model, the P (92.51%), R (52.8%), and F 1 (67.23%) all increased a little, which indicates that the CBAM promotes extracting fine features of craters slightly. When changing the new loss function described in Section 3.1, the P decreases (by 5%), but the R (by 10%) and F 1 (by 6%) increase obviously, which indicates that the new loss function enables the model to relieve the crater sample imbalance problem and identify more small-scale craters efficiently. When both of them were embedded into the model at the same time, the model became (Lunar) YOLO-Crater with higher detection accuracy ( F 1 = 75.41%).
Figure 9 shows the distribution of craters detected by the Lunar YOLO-Crater in Maria and Highland. As shown in Figure 9, the Lunar YOLO-Crater has some missed and false detections. Some craters have severe degradation and unclear highlight-shadow features, which make it difficult to detect them. In addition, due to the limitations of the cropped image size and image resolution, the model cannot detect a crater radius of more than 2.24 km (Figure 9b, blue dashed circle). Moreover, the interference derived from other lunar circular features, which have significant highlight-shadow features, led to misidentifying them as craters. However, when we verified the false detections, we found that some “false” craters are true craters. This reflects the limitations of manually labeled crater datasets and the importance of automatic crater detection research.
As shown in Table 7, the Lunar YOLO-Crater achieved a higher detection accuracy both in the Maria and Highland than YOLOX and had a better performance in the Highland ( P = 89.56%, R = 66.18%, F 1 = 76.11%) than that in Maria ( P = 86.11%, R = 65.9%, F 1 = 74.66%). The main reason is that the features in Highland, including image contrast, image hierarchy, clarity, and texture information, are better than those in Maria [27].
In order to evaluate the ability of YOLO-Crater to detect craters at different radius scales, we made a detecting accuracy statistic as shown in Figure 10 and Table 8. We found that the F 1 is 73.97% with a radius < 100 m, greater than 80% within 100 m to 350 m, and 77.14% within 350 m to 400 m. However, a lower performance for detecting craters is shown with the radii between 400 m and 500 m. As can be seen in Figure 10, the Recall (green) and F 1 (blue) curves showed a downtrend. In addition, the scale has no obvious impact on small crater detection, as shown in Table 8.

4.2. Martian Crater Detection

There are significant geomorphological differences between Mars and the Moon, which can be used to examine the generalization ability of YOLO-Crater. As described in Section 3.2, we took the Lunar YOLO-Crater model as a pre-trained model and used the Martian dataset downloaded from the 2022 GeoAI Martian Challenge to train the pre-trained model and obtain the Martian YOLO-Crater model. Figure 11 shows the detection results (in brown) and the ground-truth labels (in green) using validation data. Figure 11a–c demonstrates the Martian YOLO-Crater model can detect craters of different sizes (Figure 11c). In addition, the model can detect unlabeled craters (see Figure 11d–f). However, there are some crater-like features undetected by the model (Figure 11e). In Table 9, the results indicate a good performance in detecting Martian craters with P = 88.37%, R = 69.25%, and F 1 = 77.65%.
The 2022 GeoAI Martian Challenge organizer only provided the testing image data without corresponding labels and required the participants to upload the testing results to the evaluation server. Based on the feedback, the organizer evaluated the detecting accuracy using the Average Precision (AP) metric. The detecting accuracy of the Martian YOLO-Crater ranked second (http://cici.lab.asu.edu/martian/#eval-award (accessed on 26 April 2023)) with AP50:95 = 46.7% and AP50 = 86.1% in the Challenge, while the first with AP50:95 = 48.4% and AP50 = 86.0% (https://codalab.lisn.upsaclay.fr/competitions/1934#results (accessed on 26 April 2023)). The above results indicate that the YOLO-Crater has strong transferability and generalization ability and can be applied to detect small craters on other celestial bodies.

5. Conclusions

In this paper, we proposed a novel small crater detection model (called YOLO-Crater) by replacing the IoU loss and traditional binary cross entropy loss with the EIoU loss and VariFocal loss and introducing the CBAM attention mechanism. To obtain more lunar small crater (Diameter < 1 km) samples (based on 7 m/pixel DOM) with high accuracy, about 42,006 labels had been remodified manually based on the existing labels made by Zang et al. [33]. A series of comparative experiments were made to systematically analyze the impact of data type, stretching method, terrain type, and crater size on the crater detection model.
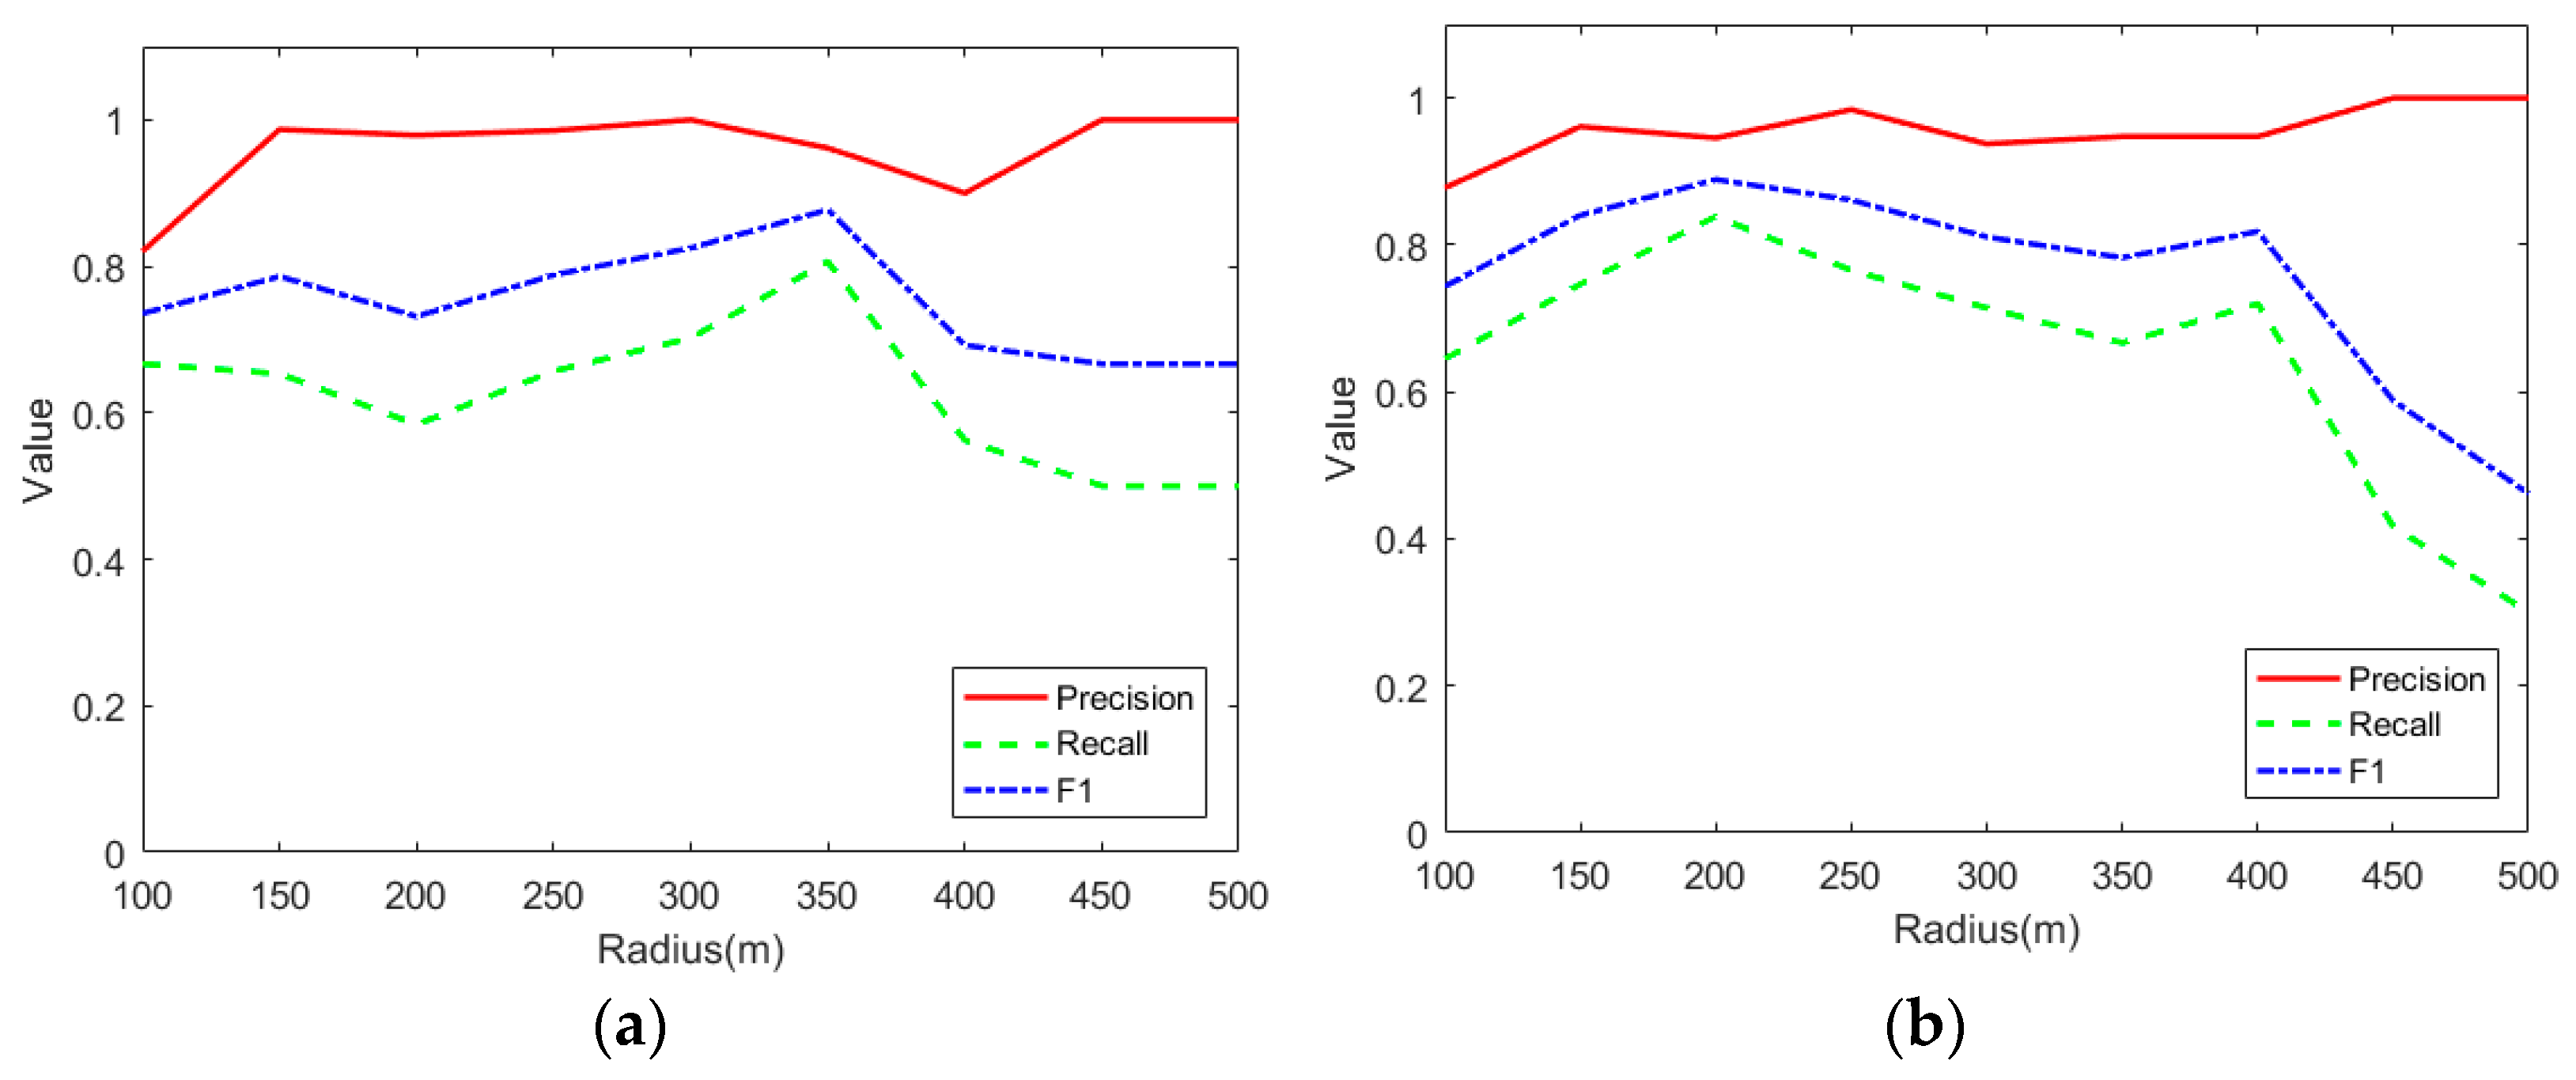
The results showed that the data type and visualization stretching methods had an important impact on detecting accuracy. The DOM is the best data type for small crater detection. CE-2 DOM-MMS (Maximum and Minimum Stretching) was found to be the best stretching method, with a total P = 87.86%, an R = 66.04%, and an F 1 = 75.41%. Compared with the YOLOX, the Lunar YOLO-Crater performs better both in Maria and Highland with accuracies of F 1 = 74.66% and 76.11%, respectively. Moreover, the Lunar YOLO-Crater obtains higher accuracy in detecting small-scale craters within 400 m in radius. In addition, the Martian crater detection model (Martian YOLO-Crater) was trained by image sample data from the 2022 GeoAI Martian Challenge and achieved second place with P = 88.37%, R = 69.25%, and F 1 = 77.65%, which means the Martian YOLO-Crater has strong transferability and generalization capability.
In the future, more and more high-resolution data will be acquired for the Moon and other celestial bodies. The remodified lunar small crater dataset could serve as a valuable supplement for GeoAI datasets, which would enable more researchers to utilize, improve, and expand it to other celestial bodies. Meanwhile, the strong transferability and generalization capability of the YOLO-Crater will make it possible to detect craters with high accuracy on other celestial bodies using image data.

Author Contributions

Conceptualization, L.M.; methodology, L.M., L.X. and G.L.; software, L.X.; validation, L.X. and L.M.; data processing, L.X. and L.L.; formal analysis, L.M. and L.X.; investigation, L.M., L.X., L.L. and M.C.; resources, L.X., L.L. and M.C; writing—original draft preparation, L.X. and L.M.; writing—review and editing, L.M., G.L. and W.Z.; visualization, L.X., L.M. and M.C.; supervision, L.M. and G.L.; project administration, L.M. and W.Z.; funding acquisition, L.M.; mapping, L.X., L.M. and L.L. All authors have read and agreed to the published version of the manuscript.

Funding

This research was funded by the National High Technology Research and Development Program of China (No. 2010AA122202) and the National Natural Science Foundation of China (No. 42230103).

Data Availability Statement

CE-2 data is available at https://moon.bao.ac.cn/searchOrder_pdsData.search (accessed on 15 July 2021). Lunar samples of training data, validation data, testing data, and code are available from the authors. Martian samples of training data, validation data, and testing data are available from http://cici.lab.asu.edu/martian/#data-download (accessed on 20 April 2022).

Acknowledgments

We thank the Ground Research and Applications System (GRAS) of the Chinese Lunar Exploration Project (CLEP) for providing data and Hsu et al. for providing the Martian dataset. Careful comments given by the anonymous reviewers helped to improve the manuscript.

Conflicts of Interest

The authors declare no conflict of interest.

References

  1. Salih, A.L.; Schulte, P.; Grumpe, A.; Wöhler, C.; Hiesinger, H. Automatic crater detection and age estimation for mare regions on the lunar surface. In Proceedings of the 25th European Signal Processing Conference (EUSIPCO), Kos, Greece, 28 August–2 September 2017; pp. 518–522. [Google Scholar] [CrossRef]
  2. Hartmann, W.K. Impact Crater Densities as a Tool for Dating Planetary Surfaces; Oxford University Press: Oxford, UK, 2022. [Google Scholar] [CrossRef]
  3. Changela, H.G.; Chatzitheodoridis, E.; Antunes, A.; Beaty, D.; Bouw, K.; Bridges, J.C.; Capova, K.A.; Cockell, C.S.; Conley, C.A.; Dadachov, E.; et al. Mars: New insights and unresolved questions—Corrigendum. Int. J. Astrobiol. 2022, 21, 46. [Google Scholar] [CrossRef]
  4. Cheng, W.; Wang, J.; Wan, C. Morphometric Characterization and Reconstruction Effect Among Lunar Impact Craters. Earth Moon Planets 2014, 111, 139–155. [Google Scholar] [CrossRef]
  5. West, M.D.; Clarke, J.D.A. Potential martian mineral resources: Mechanisms and terrestrial analogues. Planet. Space Sci. 2010, 58, 574–582. [Google Scholar] [CrossRef]
  6. Watkins, R.N.; Jolliff, B.L.; Mistick, K.; Fogerty, C.; Lawrence, S.J.; Singer, K.N.; Ghent, R.R. Boulder distributions around young, small lunar impact craters and implications for regolith production rates and landing site safety. J. Geophys. Res. Planets 2019, 124, 2754–2771. [Google Scholar] [CrossRef]
  7. Vleugels, C.; Foing, B.; Swida, O. A comparison of Perseverance rover and HiRISE data: Siteinterpretations in Jezero Crater. In Proceedings of the EGU General Assembly 2023, Vienna, Austria, 24–28 April 2023. EGU23-320. [Google Scholar] [CrossRef]
  8. Martin, I.; Parkes, S.; Dunstan, M. Modeling cratered surfaces with real and synthetic terrain for testing planetary landers. IEEE Trans. Aerosp. Electron. Syst. 2014, 50, 2916–2928. [Google Scholar] [CrossRef]
  9. Tai Udovicic, C.J.; Frizzell, K.R.; Kodikara, G.R.L.; Kopp, M.; Luchsinger, K.M.; Madera, A.; Meier, M.L.; Paladino, T.G.; Patterson, R.V.; Wroblewski, F.B.; et al. Buried ice deposits in lunar polar cold traps were disrupted by ballistic sedimentation. J. Geophys. Res. Planets 2023, 128, e2022JE007567. [Google Scholar] [CrossRef]
  10. Bernhardt, H.; Robinson, M.S.; Boyd, A.K. Geomorphic map and science target identification on the Shackleton-de Gerlache ridge. Icarus 2022, 379, 114963. [Google Scholar] [CrossRef]
  11. Akos, K. Crater wall outcrop analysis for targeting subsurface sampling on Mars. Planet. Space Sci. 2012, 67, 14–27. [Google Scholar] [CrossRef]
  12. Rodionova, Z.F.; Shevchenko, V.V.; Karlov, A.A.; Smolyakova, T.F. A Morphological Catalogue of Lunar Craters: A Preliminary Study. Lunar Planet. Sci. XVII 1986, 17, 722–723. [Google Scholar]
  13. DeLatte, D.M.; Crites, S.T.; Guttenberg, N.; Yairi, T. Automated Crater Detection Algorithms from a Machine Learning Perspective in the Convolutional Neural Network Era. Adv. Space Res. 2019, 64, 1615–1628. [Google Scholar] [CrossRef]
  14. Wang, Z.; Liu, J. A review of object detection based on convolutional neural network. In Proceedings of the 2017 36th Chinese Control Conference (CCC), Dalian, China, 26–28 July 2017; pp. 11104–11109. [Google Scholar] [CrossRef]
  15. Benedix, G.K.; Lagain, A.; Chai, K.; Meka, S.; Anderson, S.; Norman, C.; Bland, P.A.; Paxman, M.C.; Towner, T.T. Deriving surface ages on Mars using automated crater counting. Earth Space Sci. 2020, 7, e2019EA001005. [Google Scholar] [CrossRef]
  16. Ahern, A.A.; Rogers, A.D.; Edwards, C.S.; Piqueux, S. Thermophysical properties and surface heterogeneity of landing sites on Mars from overlapping Thermal Emission Imaging System (THEMIS) observations. J. Geophys. Res. Planets 2021, 126, e2020JE006713. [Google Scholar] [CrossRef]
  17. Fairweather, J.H.; Lagain, A.; Servis, K.; Benedix, G.K.; Kumar, S.S.; Bland, P.A. Automatic mapping of small lunar impact craters using LRO-NAC images. Earth Space Sci. 2022, 9, e2021EA002177. [Google Scholar] [CrossRef]
  18. Cui, X.; Ding, M.; Wang, G. Automated crater detection on the South Pole⁃Aitken basin of the Moon and absolute model ages of mid⁃sized craters based on convolution neural network. J. Nanjing Univ. Nat. Sci. 2021, 57, 905–915. [Google Scholar] [CrossRef]
  19. Tang, K.; Liang, J.; Yan, P.; Tian, X. Lunar Crater Detection based YoloV5 using CCD Data. In Proceedings of the IEEE International Conference on Artificial Intelligence and Computer Applications (ICAICA), Dalian, China, 24–26 June 2022. [Google Scholar] [CrossRef]
  20. Li, Y.; Sun, H.; Hu, Y.; Han, Y. Electrode defect YOLO detection algorithm based on attention mechanism and multi-scale feature fusion. Control Decis. 2022, 38, 2578–2586. [Google Scholar] [CrossRef]
  21. Cheng, W.; Liu, Q.; Wang, J.; Gao, W.; Liu, J. A preliminary study of classification method on Lunar topography and landforms. Adv. Earth Sci. 2018, 33, 885–897. [Google Scholar]
  22. Matthew, R.; Andrés, A.P.M.; Larry, A.L.; Jennifer, G.; Pamela, G.; Stuart, J.R.; The CosmoQuest Team. The CosmoQuest Moon mappers community science project: The effect of incidence angle on the Lunar surface crater distribution. Open J. Astrophys. 2022, 5, 2. [Google Scholar] [CrossRef]
  23. Gong, Y.; Liu, G.; Xue, Y.; Li, R.; Meng, L. A survey on dataset quality in machine learning. Inf. Softw. Technol. 2023, 162, 107268. [Google Scholar] [CrossRef]
  24. Jia, Y.; Wan, G.; Liu, L.; Wang, J.; Wu, Y.; Xue, N.; Wang, Y.; Yang, R. Split-Attention Networks with Self-Calibrated Convolution for Moon Impact Crater Detection from Multi-Source Data. Remote Sens. 2021, 13, 3193. [Google Scholar] [CrossRef]
  25. Tewari, A.; Verma, V.; Srivastava, P.; Jain, V.; Khanna, N. Automated Crater detection from Co-registered optical images, elevation maps and slope maps using deep learning. Planet. Space Sci. 2022, 218, 105500. [Google Scholar] [CrossRef]
  26. Liu, J.; Ren, X.; Wang, F.; Mu, L.; Wang, W.; Tan, X. Progress in the Lunar optical remote sensing and mapping research. Bull. Mineral. Petrol. Geochem. 2015, 34, 461–470. [Google Scholar]
  27. Wang, F.; Ren, X.; Liu, J.; Li, C. Image quality evaluation of the CCD stereo camera of Chang’E-2 lunar satellite. Astron. Res. Technol. 2016, 13, 7. [Google Scholar] [CrossRef]
  28. Liu, J.; Ren, X.; Tan, X.; Li, C. Lunar image data preprocessing and quality evaluation of CCD stereo camera on Chang’E-2. Geomat. Inf. Sci. Wuhan Univ. 2013, 38, 186–190. [Google Scholar] [CrossRef]
  29. Head, J.W., 3rd; Fassett, C.I.; Kadish, S.J.; Smith, D.E.; Zuber, M.T.; Neumann, G.A.; Mazarico, E. Global Distribution of Large Lunar Craters: Implications for Resurfacing and Impactor Populations. Science 2010, 329, 1504–1507. [Google Scholar] [CrossRef] [PubMed]
  30. Salamunićcar, G.; Lončarić, S.; Grumpe, A.; Wöhler, C. Hybrid method for crater detection based on topography reconstruction from optical images and the new LU78287GT catalogue of Lunar craters. Adv. Space Res. 2014, 53, 1783–1797. [Google Scholar] [CrossRef]
  31. Povilaitis, R.Z.; Robinson, M.S.; van der Bogert, C.H.; Hiesinger, H.; Meyer, H.M.; Ostrach, L.R. Crater density differences: Exploring regional resurfacing, secondary crater populations, and crater saturation equilibrium on the moon. Planet. Space Sci. 2018, 162, 41–51. [Google Scholar] [CrossRef]
  32. Robbins, S.J. A New Global Database of Lunar Impact Craters >1–2 km: 1. Crater Locations and Sizes, Comparisons With Published Databases, and Global Analysis. J. Geophys. Res. 2019, 124, 871–892. [Google Scholar] [CrossRef]
  33. Zang, S.; Mu, L.; Xian, L.; Zhang, W. Semi-Supervised Deep Learning for Lunar Crater Detection Using CE-2 DOM. Remote Sens. 2021, 13, 2819. [Google Scholar] [CrossRef]
  34. Hashimoto, S.; Mori, K. Lunar Crater detection based on grid partition using deep learning. In Proceedings of the IEEE 13th International Symposium on Applied Computational Intelligence and Informatics (SACI), Timisoara, Romania, 29–31 May 2019; pp. 75–80. [Google Scholar] [CrossRef]
  35. Yang, C.; Zhao, H.; Bruzzone, L.; Benediktsson, J.A.; Liang, Y.; Liu, B.; Zeng, X.; Guan, R.; Li, C.; Ouyang, Z. Lunar impact crater identification and age estimation with Chang’E data by deep and transfer learning. Nat. Commun. 2021, 11, 6358. [Google Scholar] [CrossRef]
  36. Lagain, A.; Benedix, G.K.; Servis, K.; Baratoux, D.; Doucet, L.S.; Rajšic, A.; Devillepoix, H.A.R.; Bland, P.A.; Towner, M.C.; Sansom, E.K.; et al. The Tharsis mantle source of depleted shergottites revealed by 90 million impact craters. Nat. Commun. 2021, 12, 6352. [Google Scholar] [CrossRef] [PubMed]
  37. Wu, Y.; Wan, G.; Liu, L.; Wei, Z.; Wang, S. Intelligent Crater Detection on Planetary Surface Using Convolutional Neural Network. In Proceedings of the IEEE 5th Advanced Information Technology, Electronic and Automation Control Conference (IAEAC), Chongqing, China, 12–14 March 2021; pp. 1229–1234. [Google Scholar] [CrossRef]
  38. Li, C.; Liu, J.; Mu, L.; Ren, X.; Zuo, W. The Chang’E-1 Topographic Atlas of the Moon; Springer: Berlin/Heidelberg, Germany, 2016. [Google Scholar]
  39. Li, C.; Liu, J.; Mu, L. The Chang’E-2 High Resolution Image Atlas of the Sinus Iridum; Sinomap Press: Beijing, China, 2014. [Google Scholar]
  40. Li, Z.; Wang, Y.; Zhang, N.; Zhang, Y.; Zhao, Z.; Xu, D.; Ben, G.; Gao, Y. Deep Learning-Based Object Detection Techniques for Remote Sensing Images: A Survey. Remote Sens. 2022, 14, 2385. [Google Scholar] [CrossRef]
  41. Gao, L.; Wu, Q. Optimized linear stretch for remote sensing images based on GDAL. Beijing Surv. Mapp. 2020, 34, 1508–1510. [Google Scholar] [CrossRef]
  42. Chao, Y.; Zheng, G.; Yang, N. Analysis and Application of ArcGIS Geographic Information System; Publishing House of Electronics Industry: Beijing, China, 2018. [Google Scholar]
  43. Hsu, C.Y.; Li, W.; Wang, S. Knowledge-Driven GeoAI: Integrating Spatial Knowledge into Multi-Scale Deep Learning for Mars Crater Detection. Remote Sens. 2021, 13, 2116. [Google Scholar] [CrossRef]
  44. Edwards, C.; Nowicki, K.; Christensen, P.; Hill, J.; Gorelick, N.; Murray, K. Mosaicking of global planetary image datasets: 1. Techniques and data processing for Thermal Emission Imaging System (THEMIS) multi-spectral data. J. Geophys. Res. Planets 2011, 116, E10008. [Google Scholar] [CrossRef]
  45. Robbins, S.J.; Hynek, B.M. A new global database of Mars impact craters ≥1 km: 1. Database creation, properties, and parameters. J. Geophys. Res. Planets 2012, 117, E05004. [Google Scholar] [CrossRef]
  46. Ge, Z.; Liu, S.; Wang, F. YOLOX: Exceeding YOLO Series in 2021. arXiv 2021, arXiv:2107.08430. [Google Scholar] [CrossRef]
  47. Xie, Y.; Li, X.; Li, T.; Li, C. Expression recognition based on improved ResNet and loss function. Autom. Instrum. 2022, 37, 64–69. [Google Scholar] [CrossRef]
  48. Zhang, H.; Wang, Y.; Dayoub, F.; Sunderhauf, N. VarifocalNet: An IoU-aware Dense Object Detector. In Proceedings of the IEEE/CVF Conference on Computer Vision and Pattern Recognition (CVPR), Virtual, 19–25 January 2021; pp. 8510–8519. [Google Scholar] [CrossRef]
  49. Zhang, Z.; Wang, P.; Liu, W.; Li, J.; Ye, R.; Ren, D. Distance-IoU Loss: Faster and Better Learning for Bounding Box Regression. AAAI Conf. Artif. Intell. 2020, 34, 12993–13000. [Google Scholar] [CrossRef]
  50. Zhang, Y.; Ren, W.; Zhang, Z.; Jia, Z.; Wang, L.; Tan, T. Focal and Efficient IOU Loss for Accurate Bounding Box Regression. Neurocomputing 2022, 506, 146–157. [Google Scholar] [CrossRef]
  51. Liu, S.; Qi, L.; Qin, H.; Shi, J.; Jia, J. Path Aggregation Network for Instance Segmentation. In Proceedings of the 31st IEEE/CVF Conference on Computer Vision and Pattern Recognition (CVPR), Salt Lake City, UT, USA, 18–23 January 2018; pp. 8759–8768. [Google Scholar] [CrossRef]
  52. Woo, S.H.; Park, J.; Lee, J.Y.; Kweon, I.S. CBAM: Convolutional block attention module. In Proceedings of the 15th European Conference on Computer Vision (ECCV), Munich, Germany, 8–14 September 2018. [Google Scholar] [CrossRef]
  53. Silburt, A.; Ali-Dib, M.; Zhu, C.; Jackson, A.; Valencia, D.; Kissin, Y.; Tamayo, D.; Menou, K. Lunar crater identification via deep learning. Icarus 2019, 317, 27–38. [Google Scholar] [CrossRef]
  54. Pan, S.J.; Yang, Q. A survey on transfer learning. IEEE Trans. Knowl. Data Eng. 2010, 22, 1345–1359. [Google Scholar] [CrossRef]
Figure 1. Workflow of the lunar sample dataset creation.
Remotesensing 15 05040 g001
Figure 2. Size-frequency distribution of the labeled craters.
Remotesensing 15 05040 g002
Figure 3. The schematic representation of the Convolutional Block Attention Module (CBAM).
Remotesensing 15 05040 g003
Figure 4. The detection framework of YOLO-Crater.
Remotesensing 15 05040 g004
Figure 5. Workflow of the model training and testing.
Remotesensing 15 05040 g005
Figure 6. F 1 with different parameter combinations ( θ , D x y , D r ). The red arrow points the best parameter combination with the corresponding F 1 .
Remotesensing 15 05040 g006
Figure 7. Crater detection results with DOM-MMS (a) and DDS (b): Red for correct detection, black for missed detection.
Remotesensing 15 05040 g007
Figure 8. Craters in different datasets: (a) DOM-MMS; (b) DEM-1% LTS; (c) Slope-SDS.
Remotesensing 15 05040 g008
Figure 9. Distribution of craters detected by the Lunar YOLO-Crater in Maria (a) and Highland (b): Green for correct detection, red for false detection, and blue for missed detections.
Remotesensing 15 05040 g009aRemotesensing 15 05040 g009b
Figure 10. Detecting accuracy at different radius scales in Maria (a) and Highland (b).
Remotesensing 15 05040 g010
Figure 11. (af) illustrate the results of craters detected by Martian YOLO-Crater using the validation data. The ground-truth Bounding Boxes (BBOX) are in green, and the detected results are in brown.
Remotesensing 15 05040 g011
Table 1. The model hyper-parameters.
Hyper-ParameterValue
epoch100
batch size16
nmsthre0.5
test size(640, 640)
test_conf0.4 (Maria)/0.3 (Highland)
Table 2. Detection accuracy based on DEM visualization datasets with seven kinds of stretching methods (bold indicates the minimum value; bold and underlined indicate the maximum value).
Method P R F 1
DEM-MMS0.90930.10880.1944
DEM-1% LTS0.87120.13480.2335
DEM-2% LTS0.89620.11860.2095
DEM-SDS0.91470.11200.1996
DEM-HE0.90920.07300.1351
DEM-LS+ MMS0.91350.10880.1945
DEM- LS+ MMS + GS0.91740.11140.1988
Table 3. Detection accuracy based on Slope visualization datasets with seven kinds of stretching methods (bold indicates the minimum value; bold and underlined indicate the maximum value).
Method P R F 1
Slope-MMS0.92430.11080.1978
Slope-1% LTS0.87770.12230.2147
Slope-2% LTS0.89890.11240.1998
Slope-SDS0.84100.13300.2297
Slope-HE0.89500.10770.1923
Slope-LS+ MMS0.90490.11120.1980
Slope- LS+ MMS + GS0.89220.12180.2143
Table 4. Detection accuracy based on DOM and visualization datasets with seven kinds of stretching methods (bold indicates the minimum value; bold and underlined indicate the maximum value).
Method P R F 1
DOM0.85620.62610.7233
DOM-MMS0.87860.66040.7541
DOM-1% LTS0.79560.63900.7087
DOM-2% LTS0.78150.62800.6964
DOM-SDS0.77640.65050.7079
DOM-HE0.73120.63900.6820
DOM-LS+ MMS0.86720.58860.7012
DOM- LS+ MMS + GS0.87650.54610.6729
Table 5. The best testing accuracy for each data type (bold indicates the minimum value; bold and underlined indicate the maximum value).
Dataset P R F 1
DOM-MMS0.87860.66040.7541
DDS0.84330.63010.7213
Slope-SDS0.84100.13300.2297
DEM-1% LTS0.87120.13480.2335
Table 6. Results of the ablation experiment (bold and underlined indicate the maximum value).
CBAMLoss P R F 1
0.91150.52660.6675
0.92510.52800.6723
0.86560.62570.7263
0.87860.66040.7541
Table 7. Detecting accuracy in Maria and Highland. (Underlined indicates the YOLO-Crater model’s F 1 score).
TypeModel
T P
F P
F N
P
R
F 1
Maria(R5) YOLOX194827415710.87670.55360.6786
YOLO-Crater231937412000.86110.65900.7466
Highland(R6) YOLOX18849818740.95060.50130.6564
YOLO-Crater248729012710.89560.66180.7611
Table 8. Detecting accuracy at different radius scales.
R(m) T P F P F N P R F 1
R ≤ 100353362418620.84990.65490.7397
R (100~150]646162910.97580.68940.8080
R (150~200]295121290.96090.69580.8071
R (200~250]1292540.98470.70490.8217
R (250~300]632260.96920.70790.8182
R (300~350]432150.95560.74140.8350
R (350~400]272140.93100.65850.7714
R (400~450]130171.00000.43330.6047
R (450~500]90171.00000.34620.5143
Table 9. Detecting accuracy using the validation data.
ModelAP50AP50:95 P R F 1
Martian YOLO-Crater0.84900.45500.88370.69250.7765
Disclaimer/Publisher’s Note: The statements, opinions and data contained in all publications are solely those of the individual author(s) and contributor(s) and not of MDPI and/or the editor(s). MDPI and/or the editor(s) disclaim responsibility for any injury to people or property resulting from any ideas, methods, instructions or products referred to in the content.

