
Evidence of Widespread Volcanic Activity near Hebrus Valles on Mars Revealed by SHARAD


Abstract
:1. Introduction
2. Materials and Methods
2.1. Shallow Radar (SHARAD) Profiles
2.2. Loss Tangent Inversions
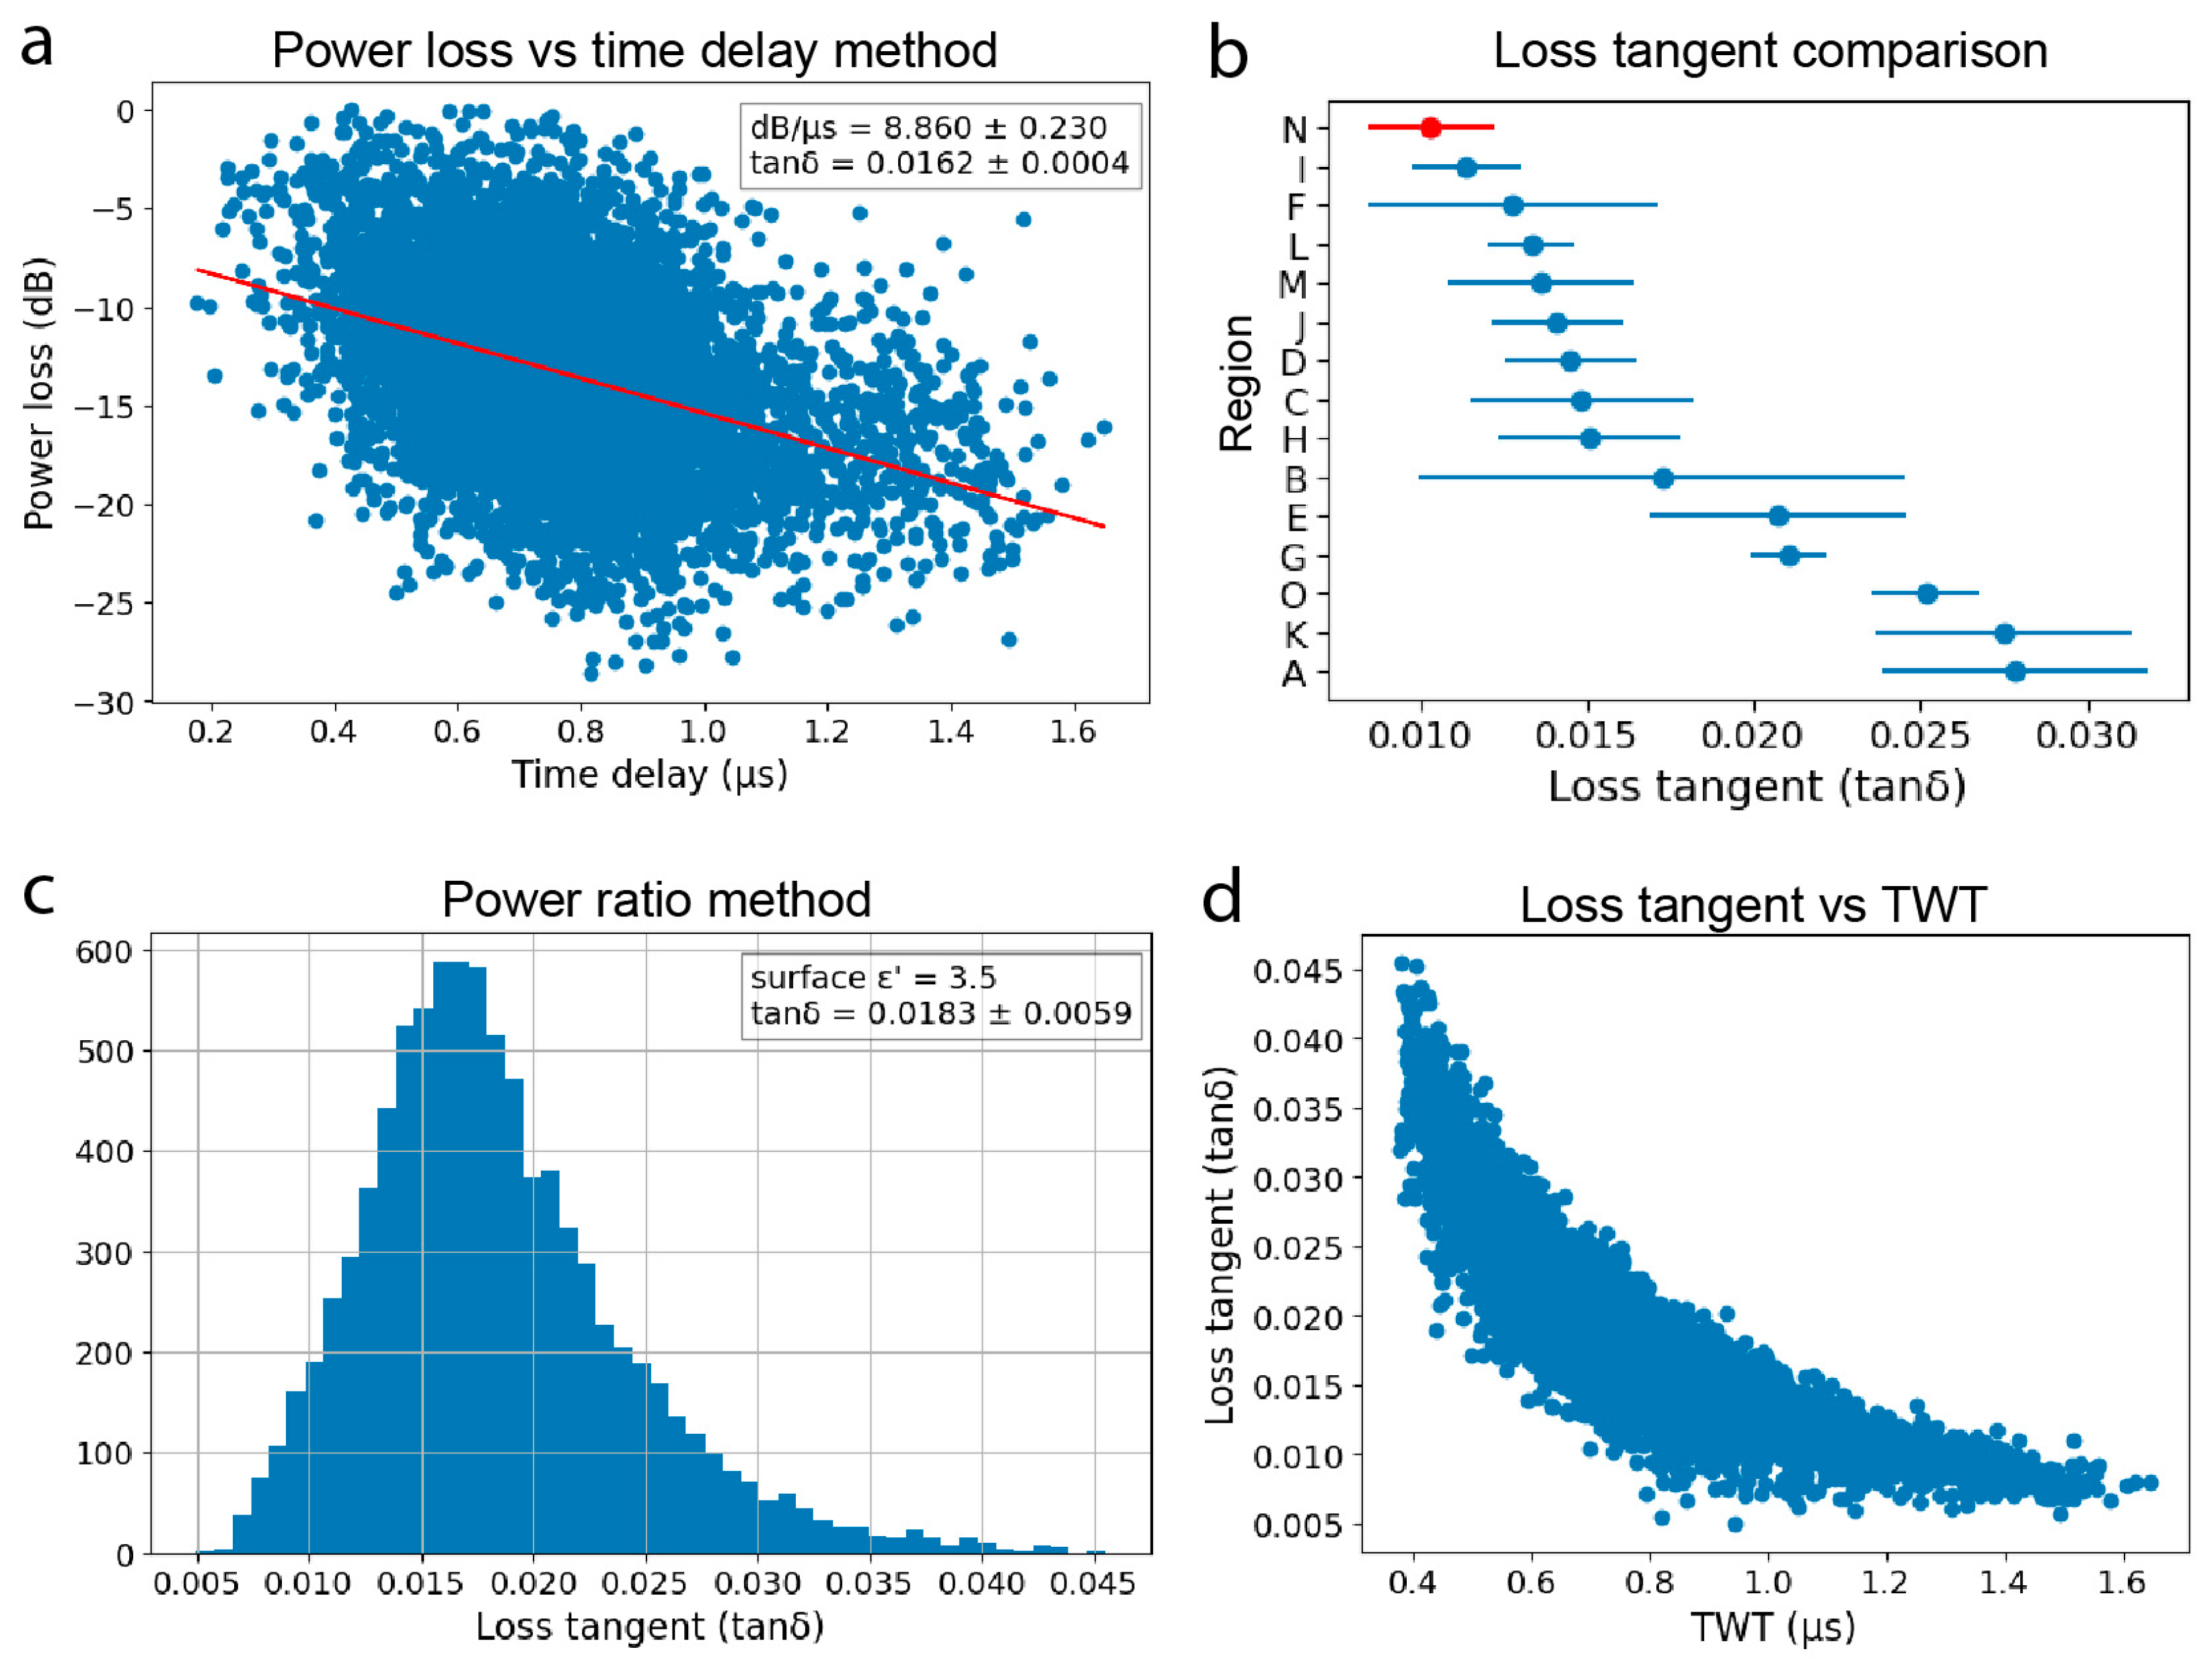
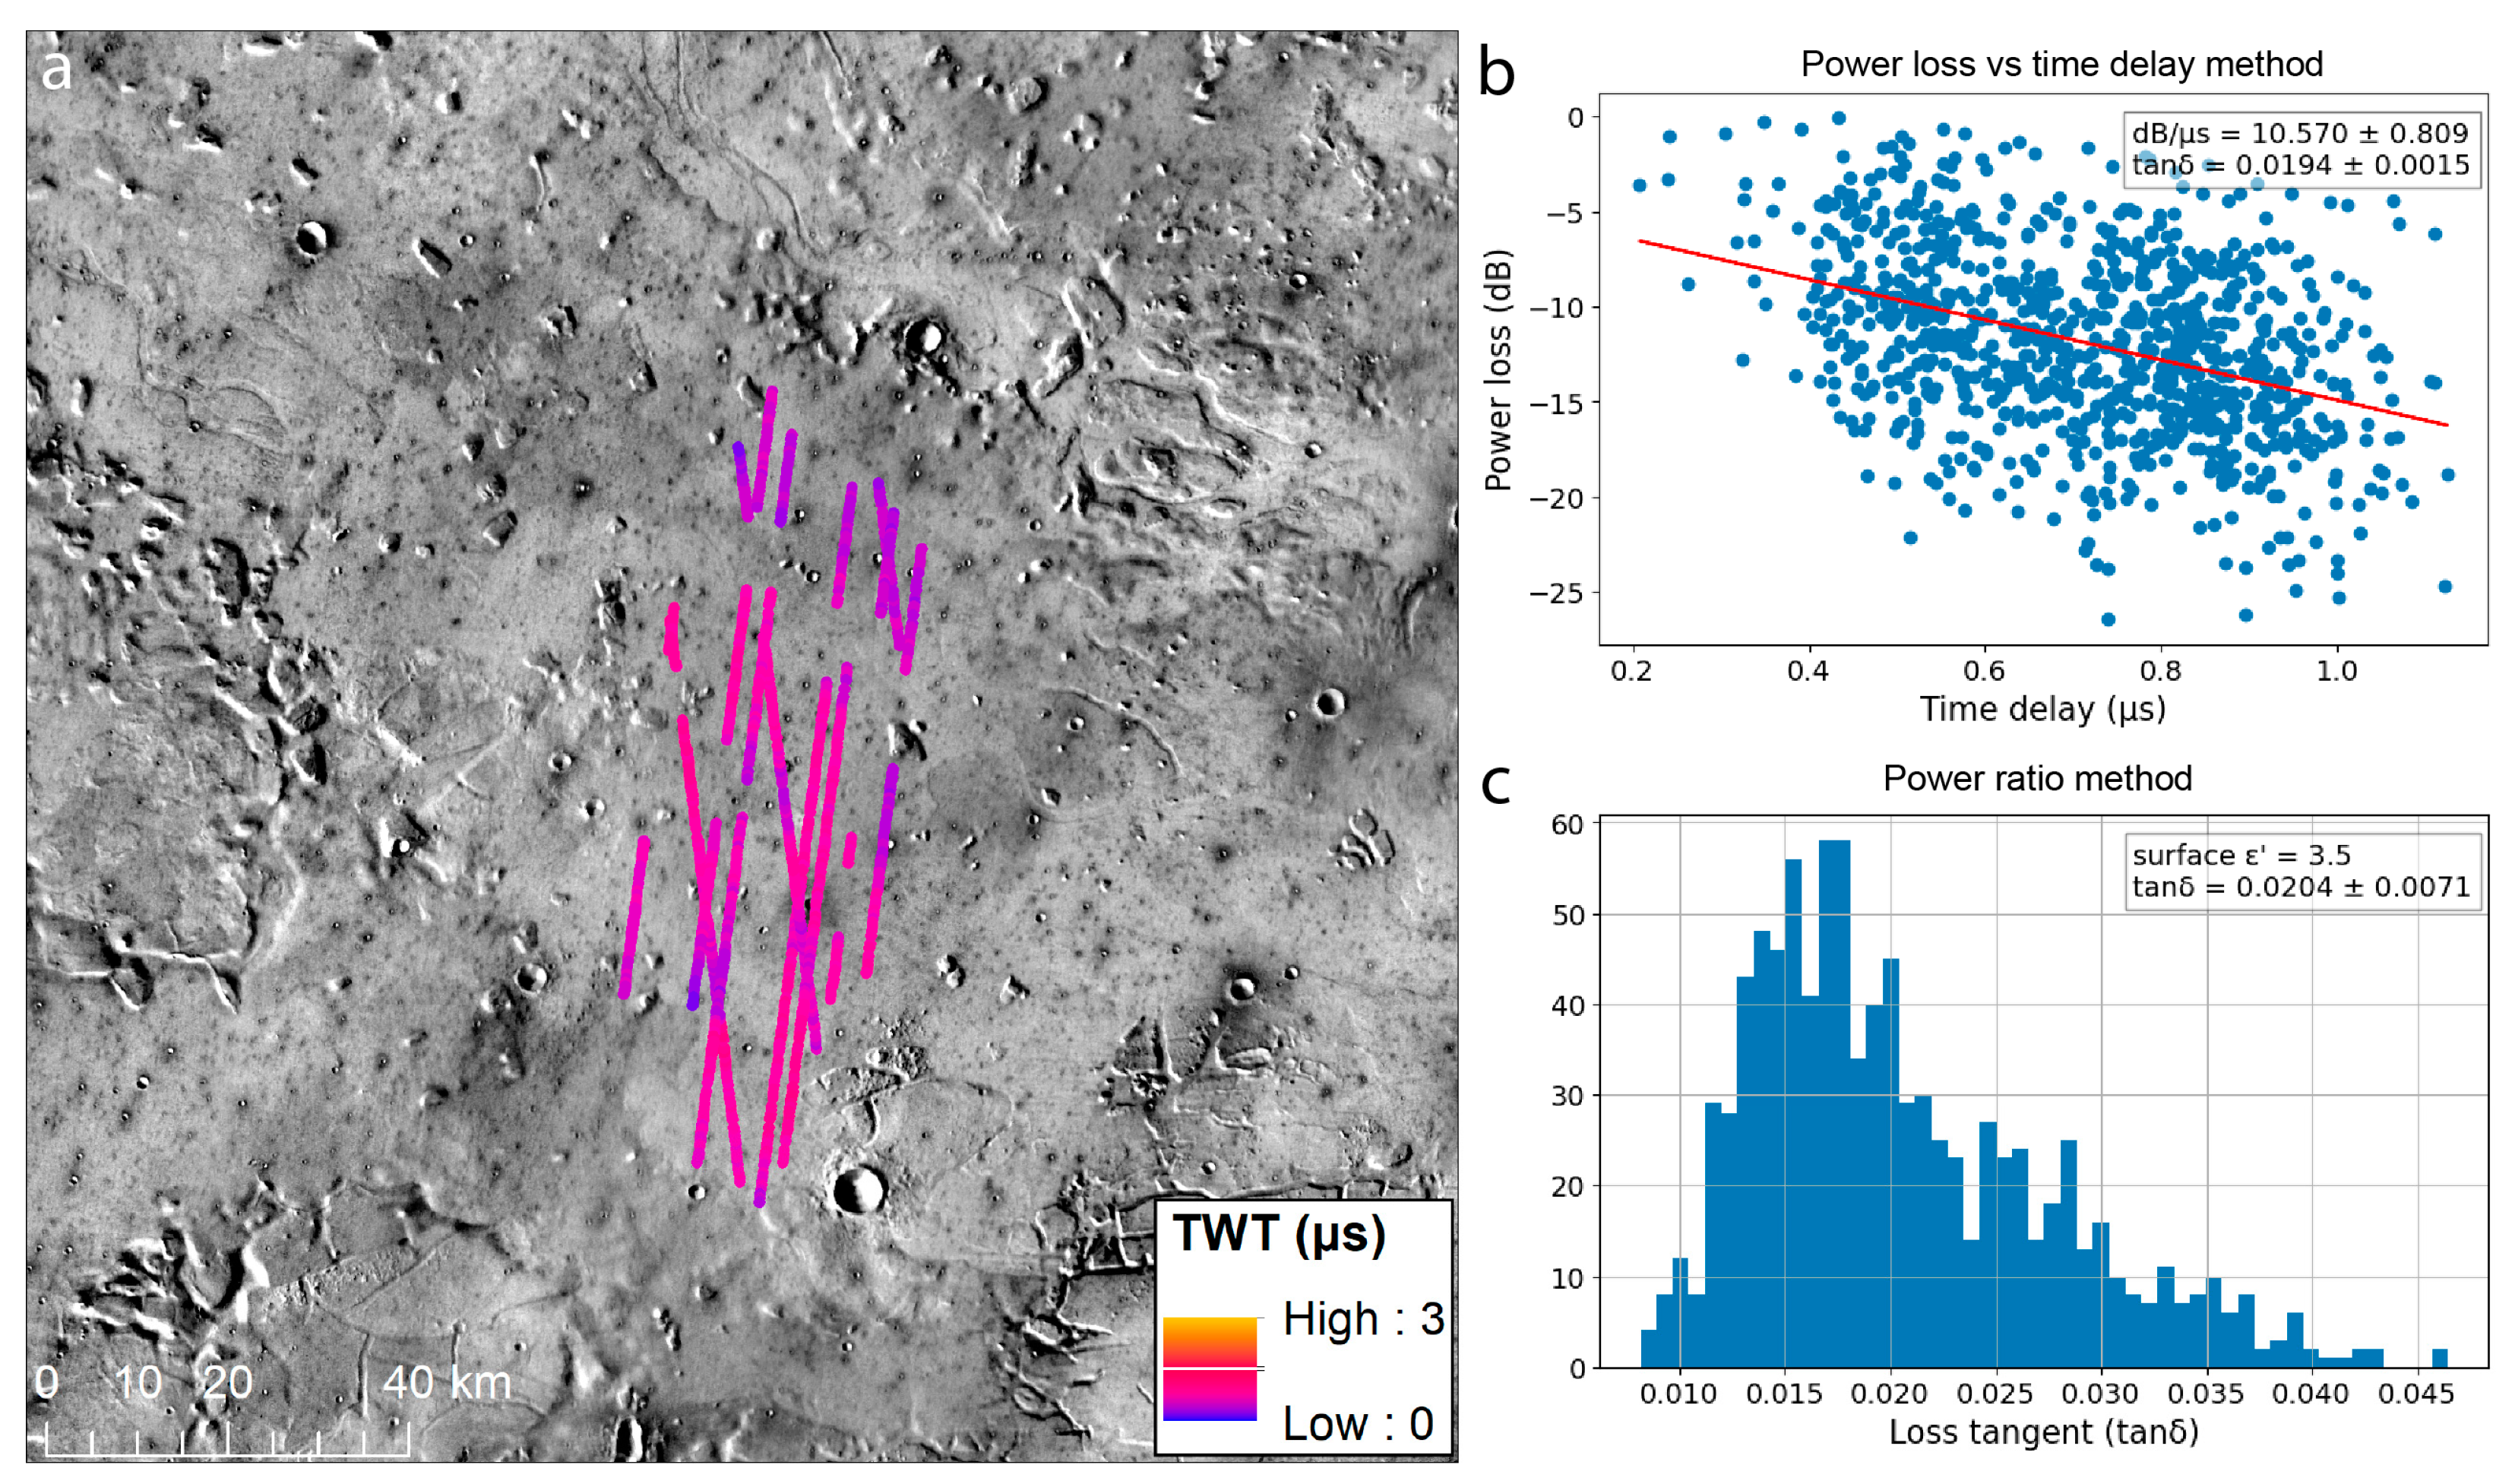
2.2.1. Power Loss vs. Time Delay Method
2.2.2. Power Ratio Method
2.2.3. Assumptions and Mitigation Strategies
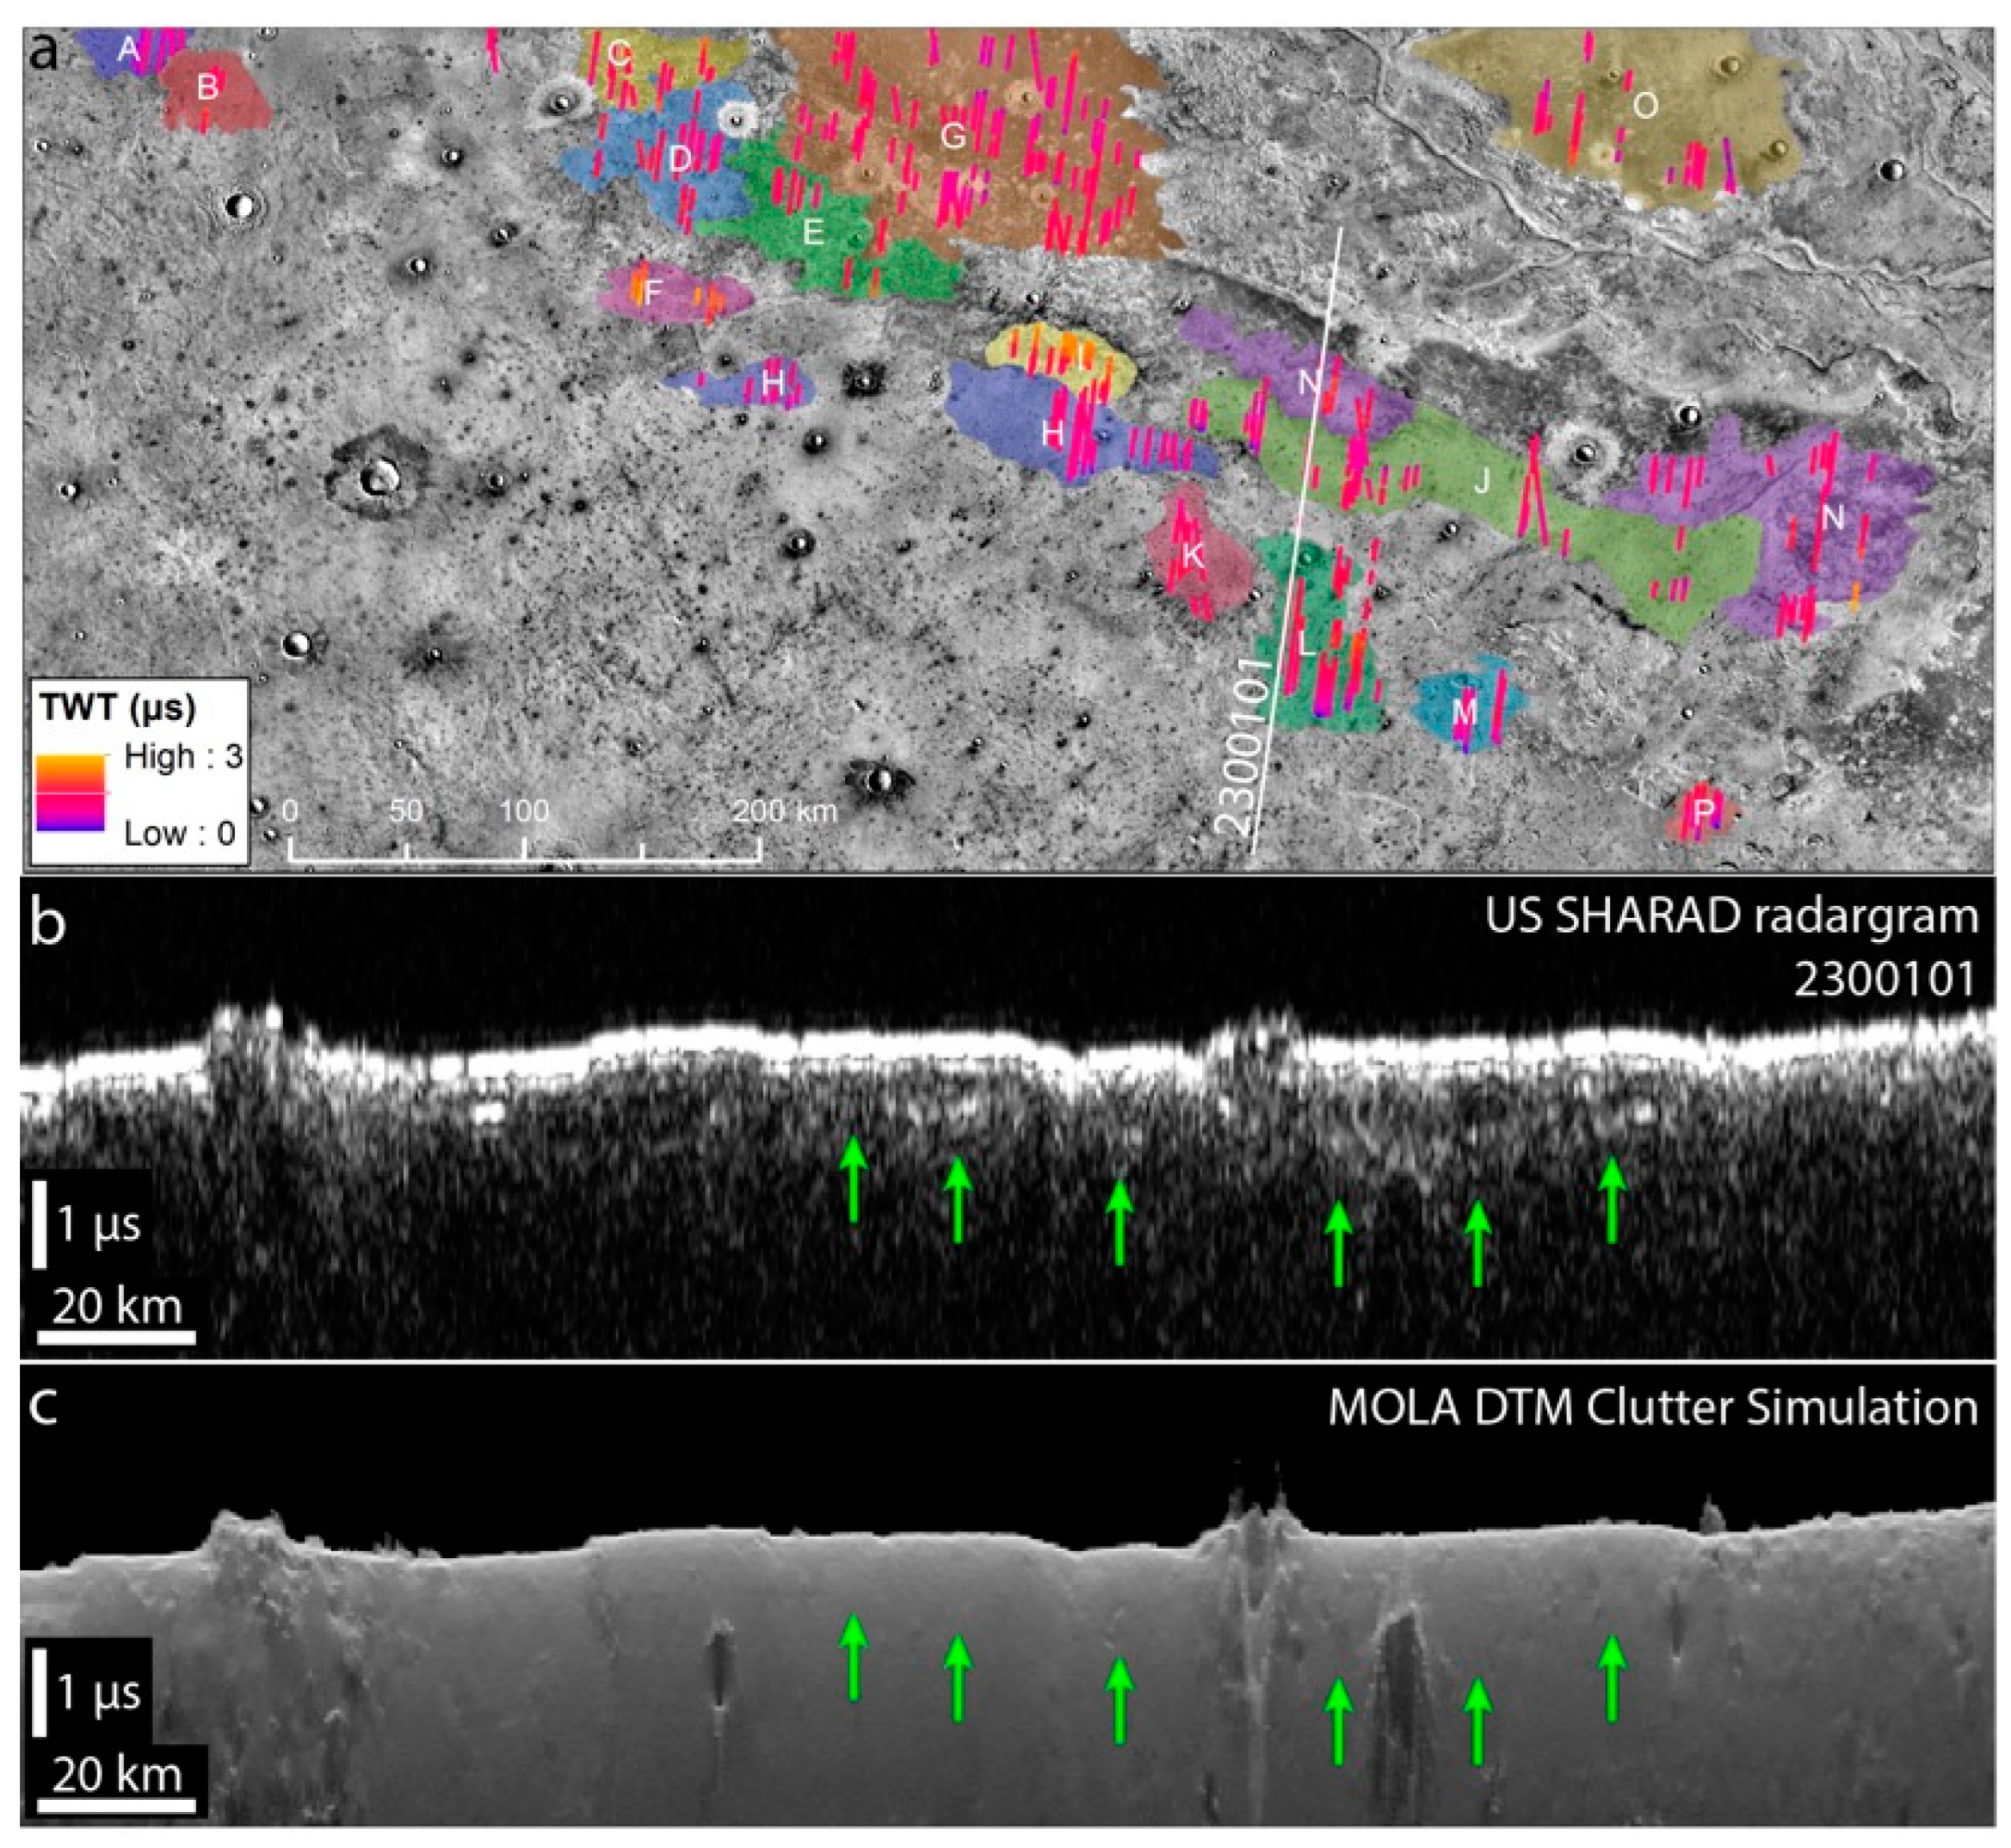
2.2.4. Mapping and Subdivision of Reflector Clusters and Further Clutter Rejection
3. Results
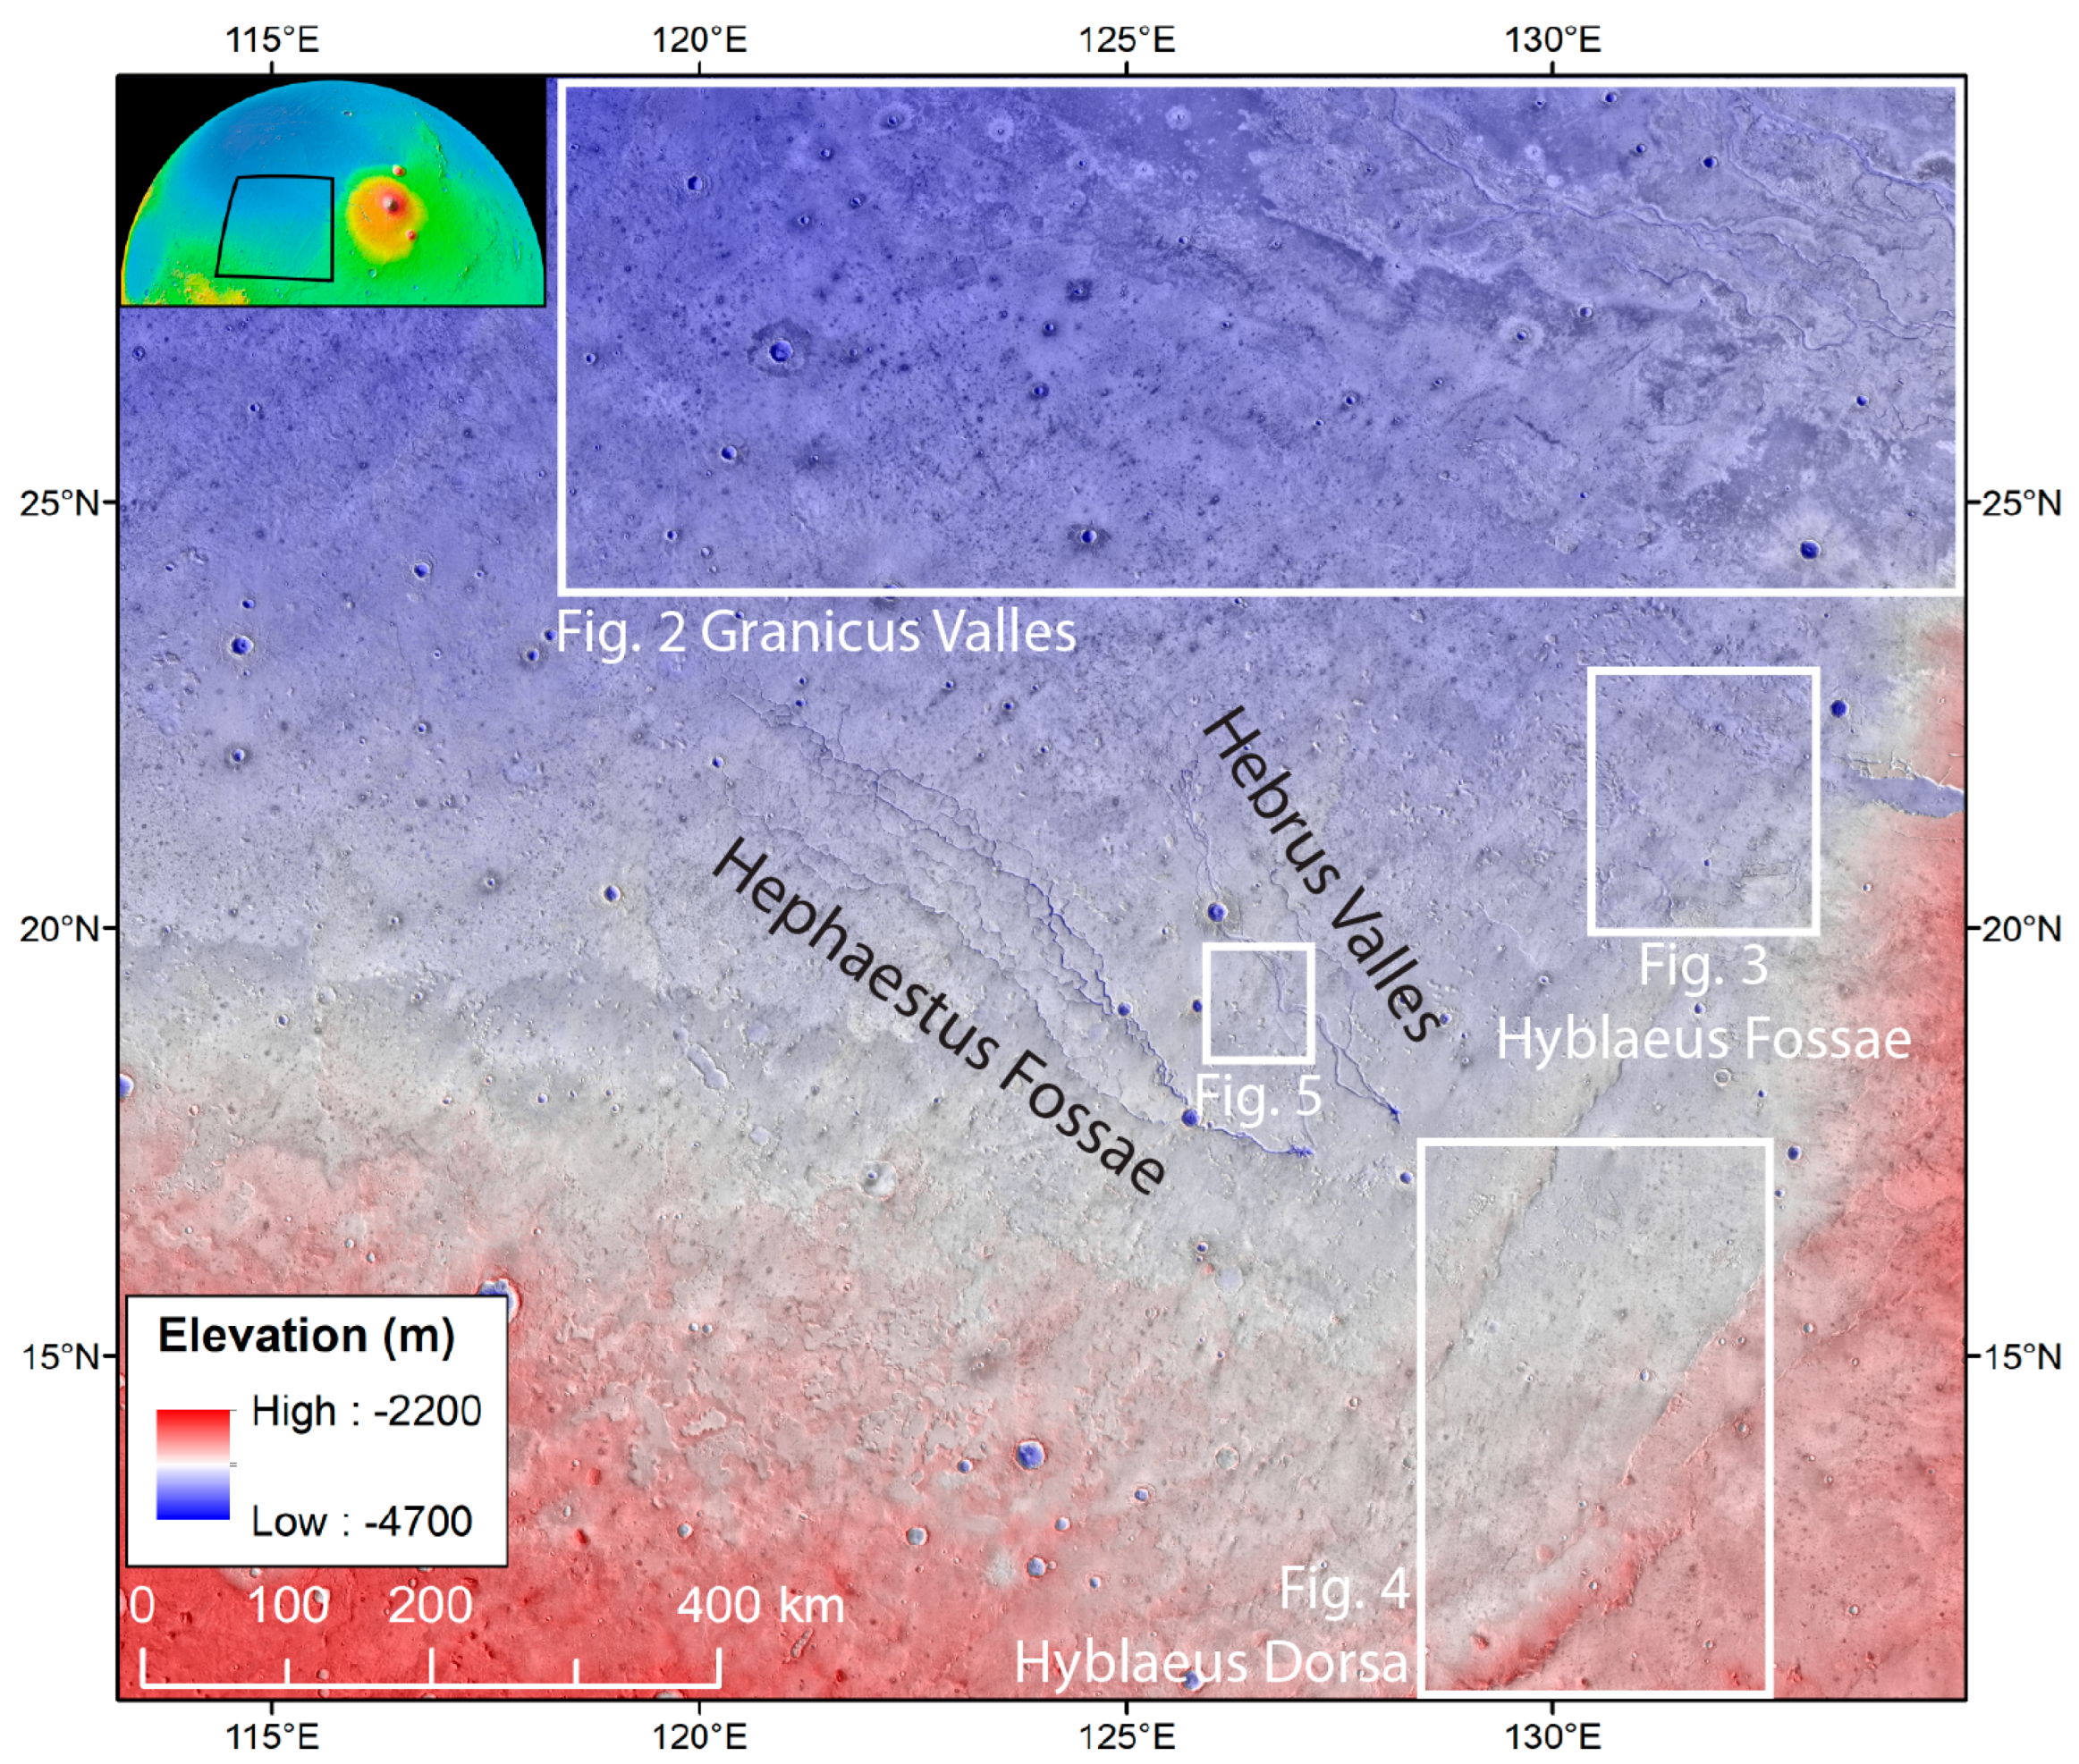
3.1. Granicus Valles and Hyblaeus Fossae
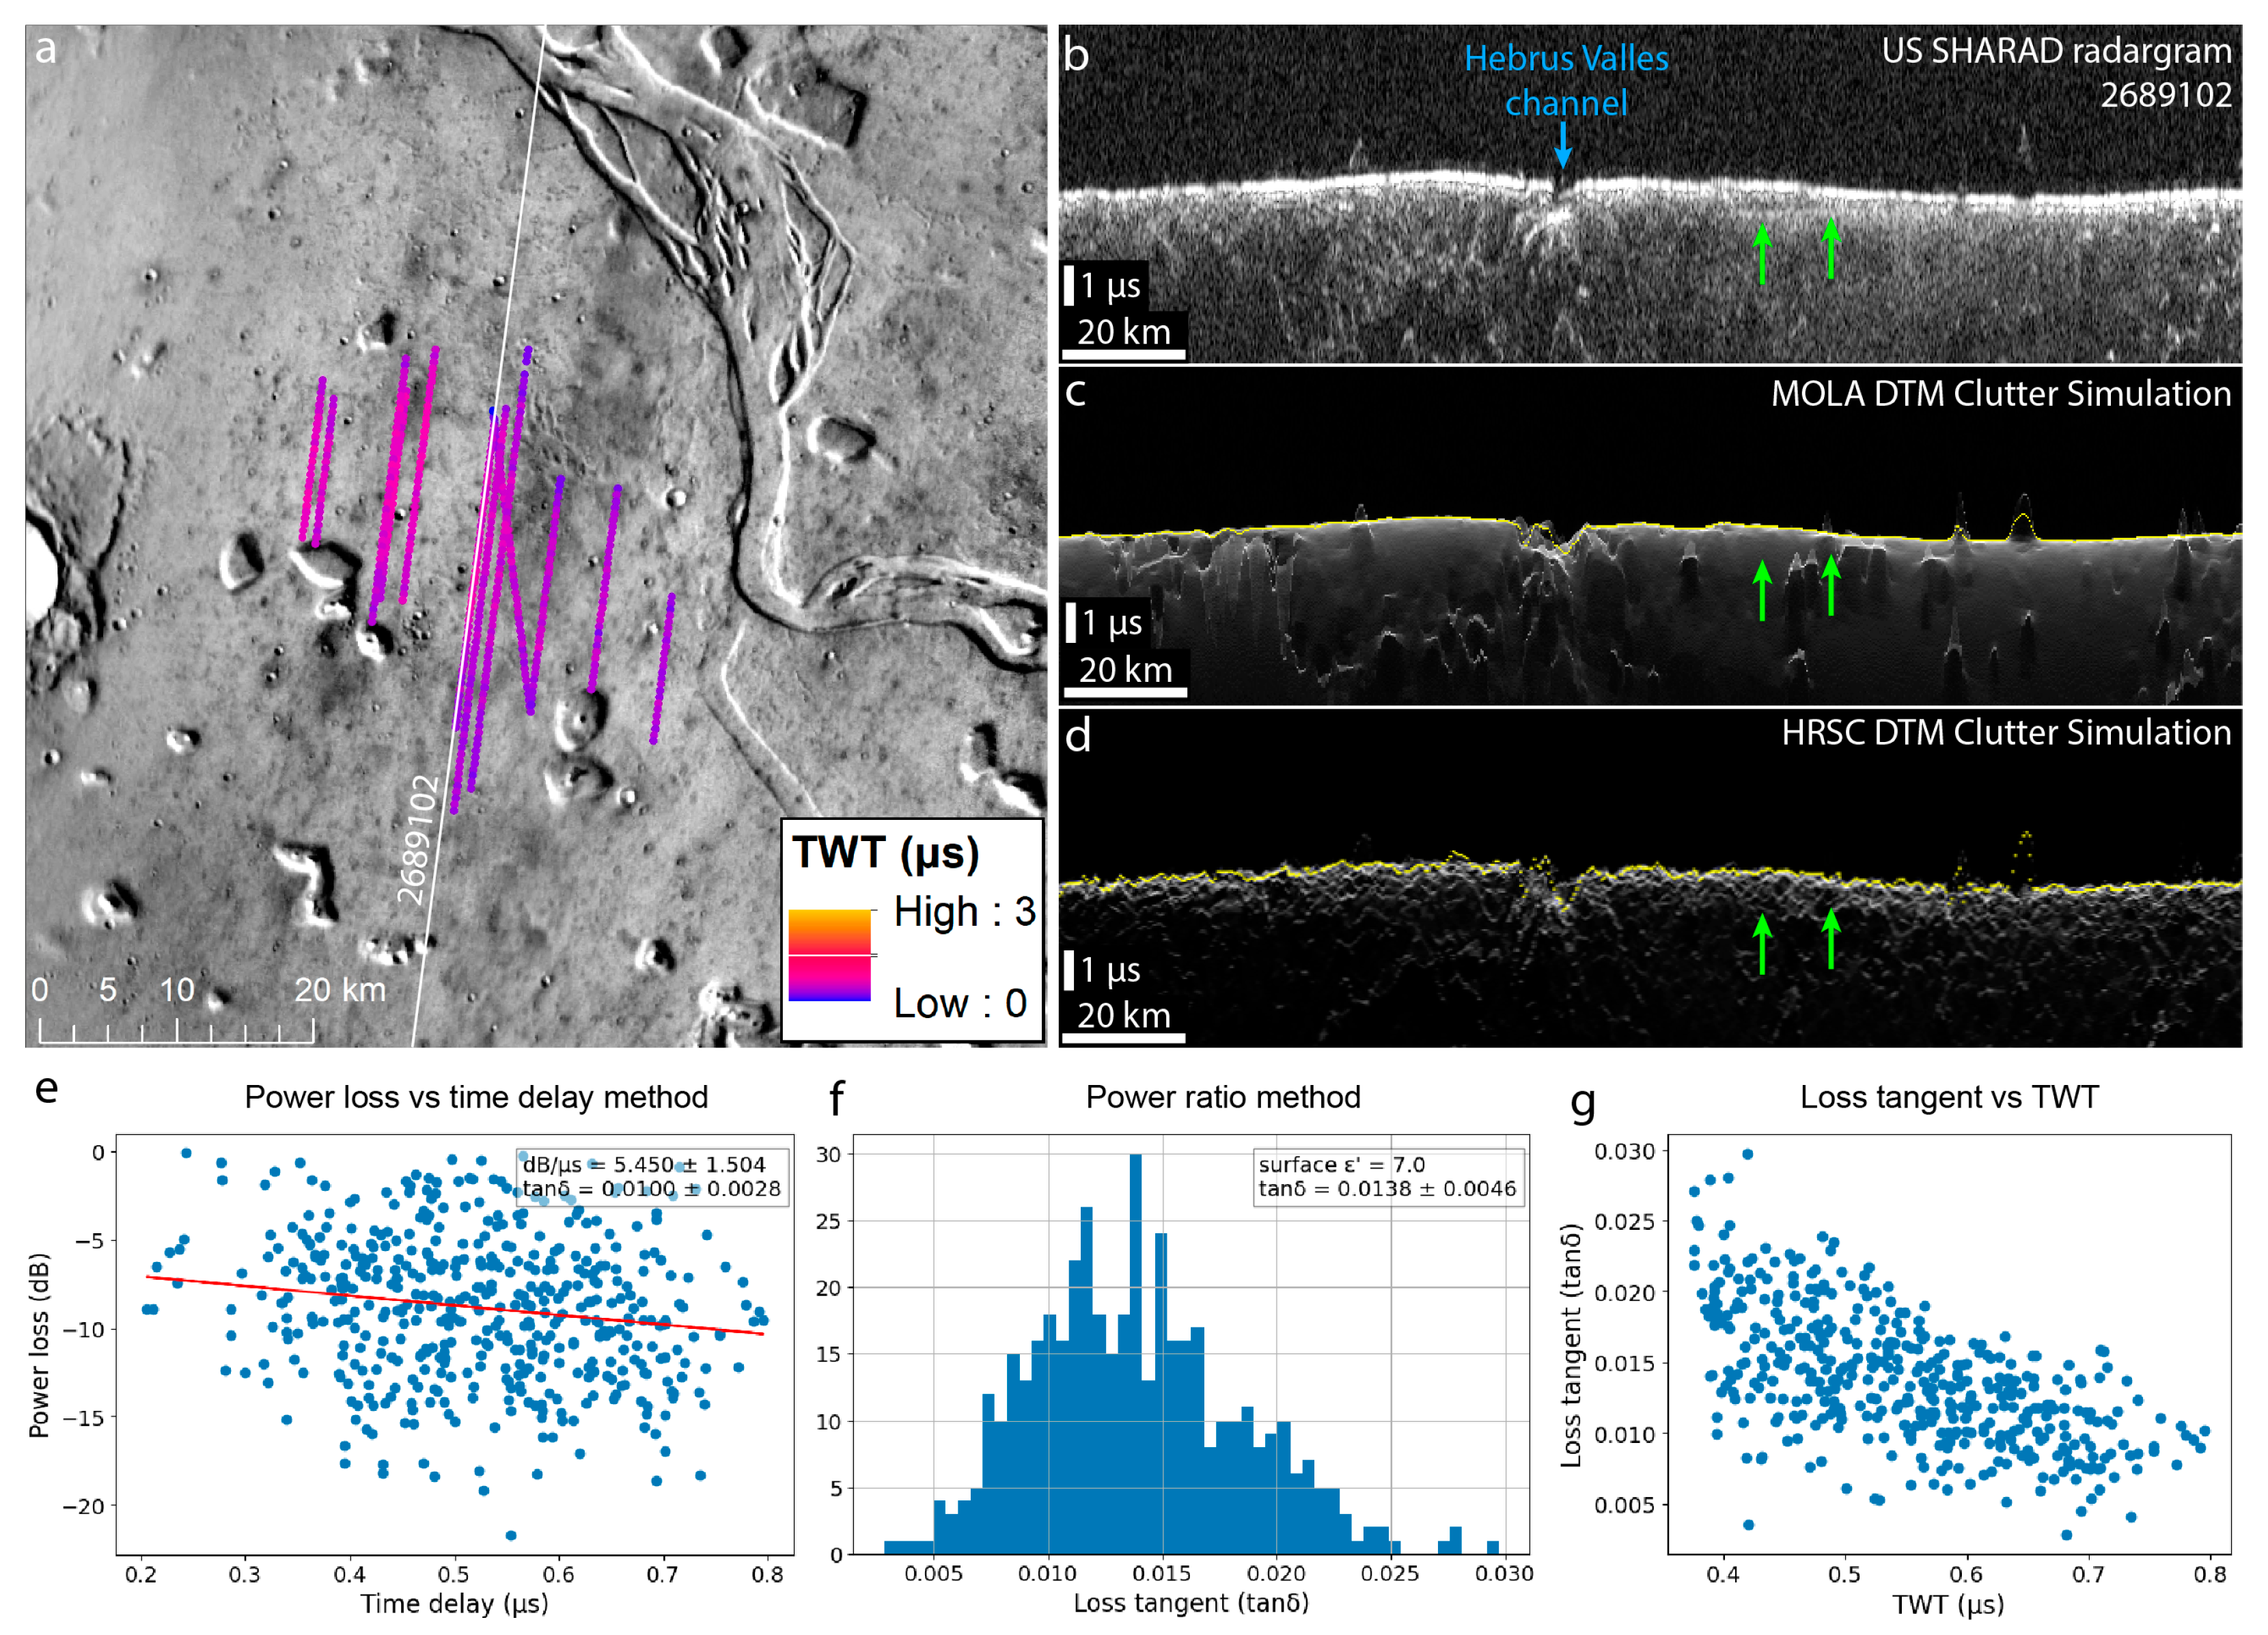
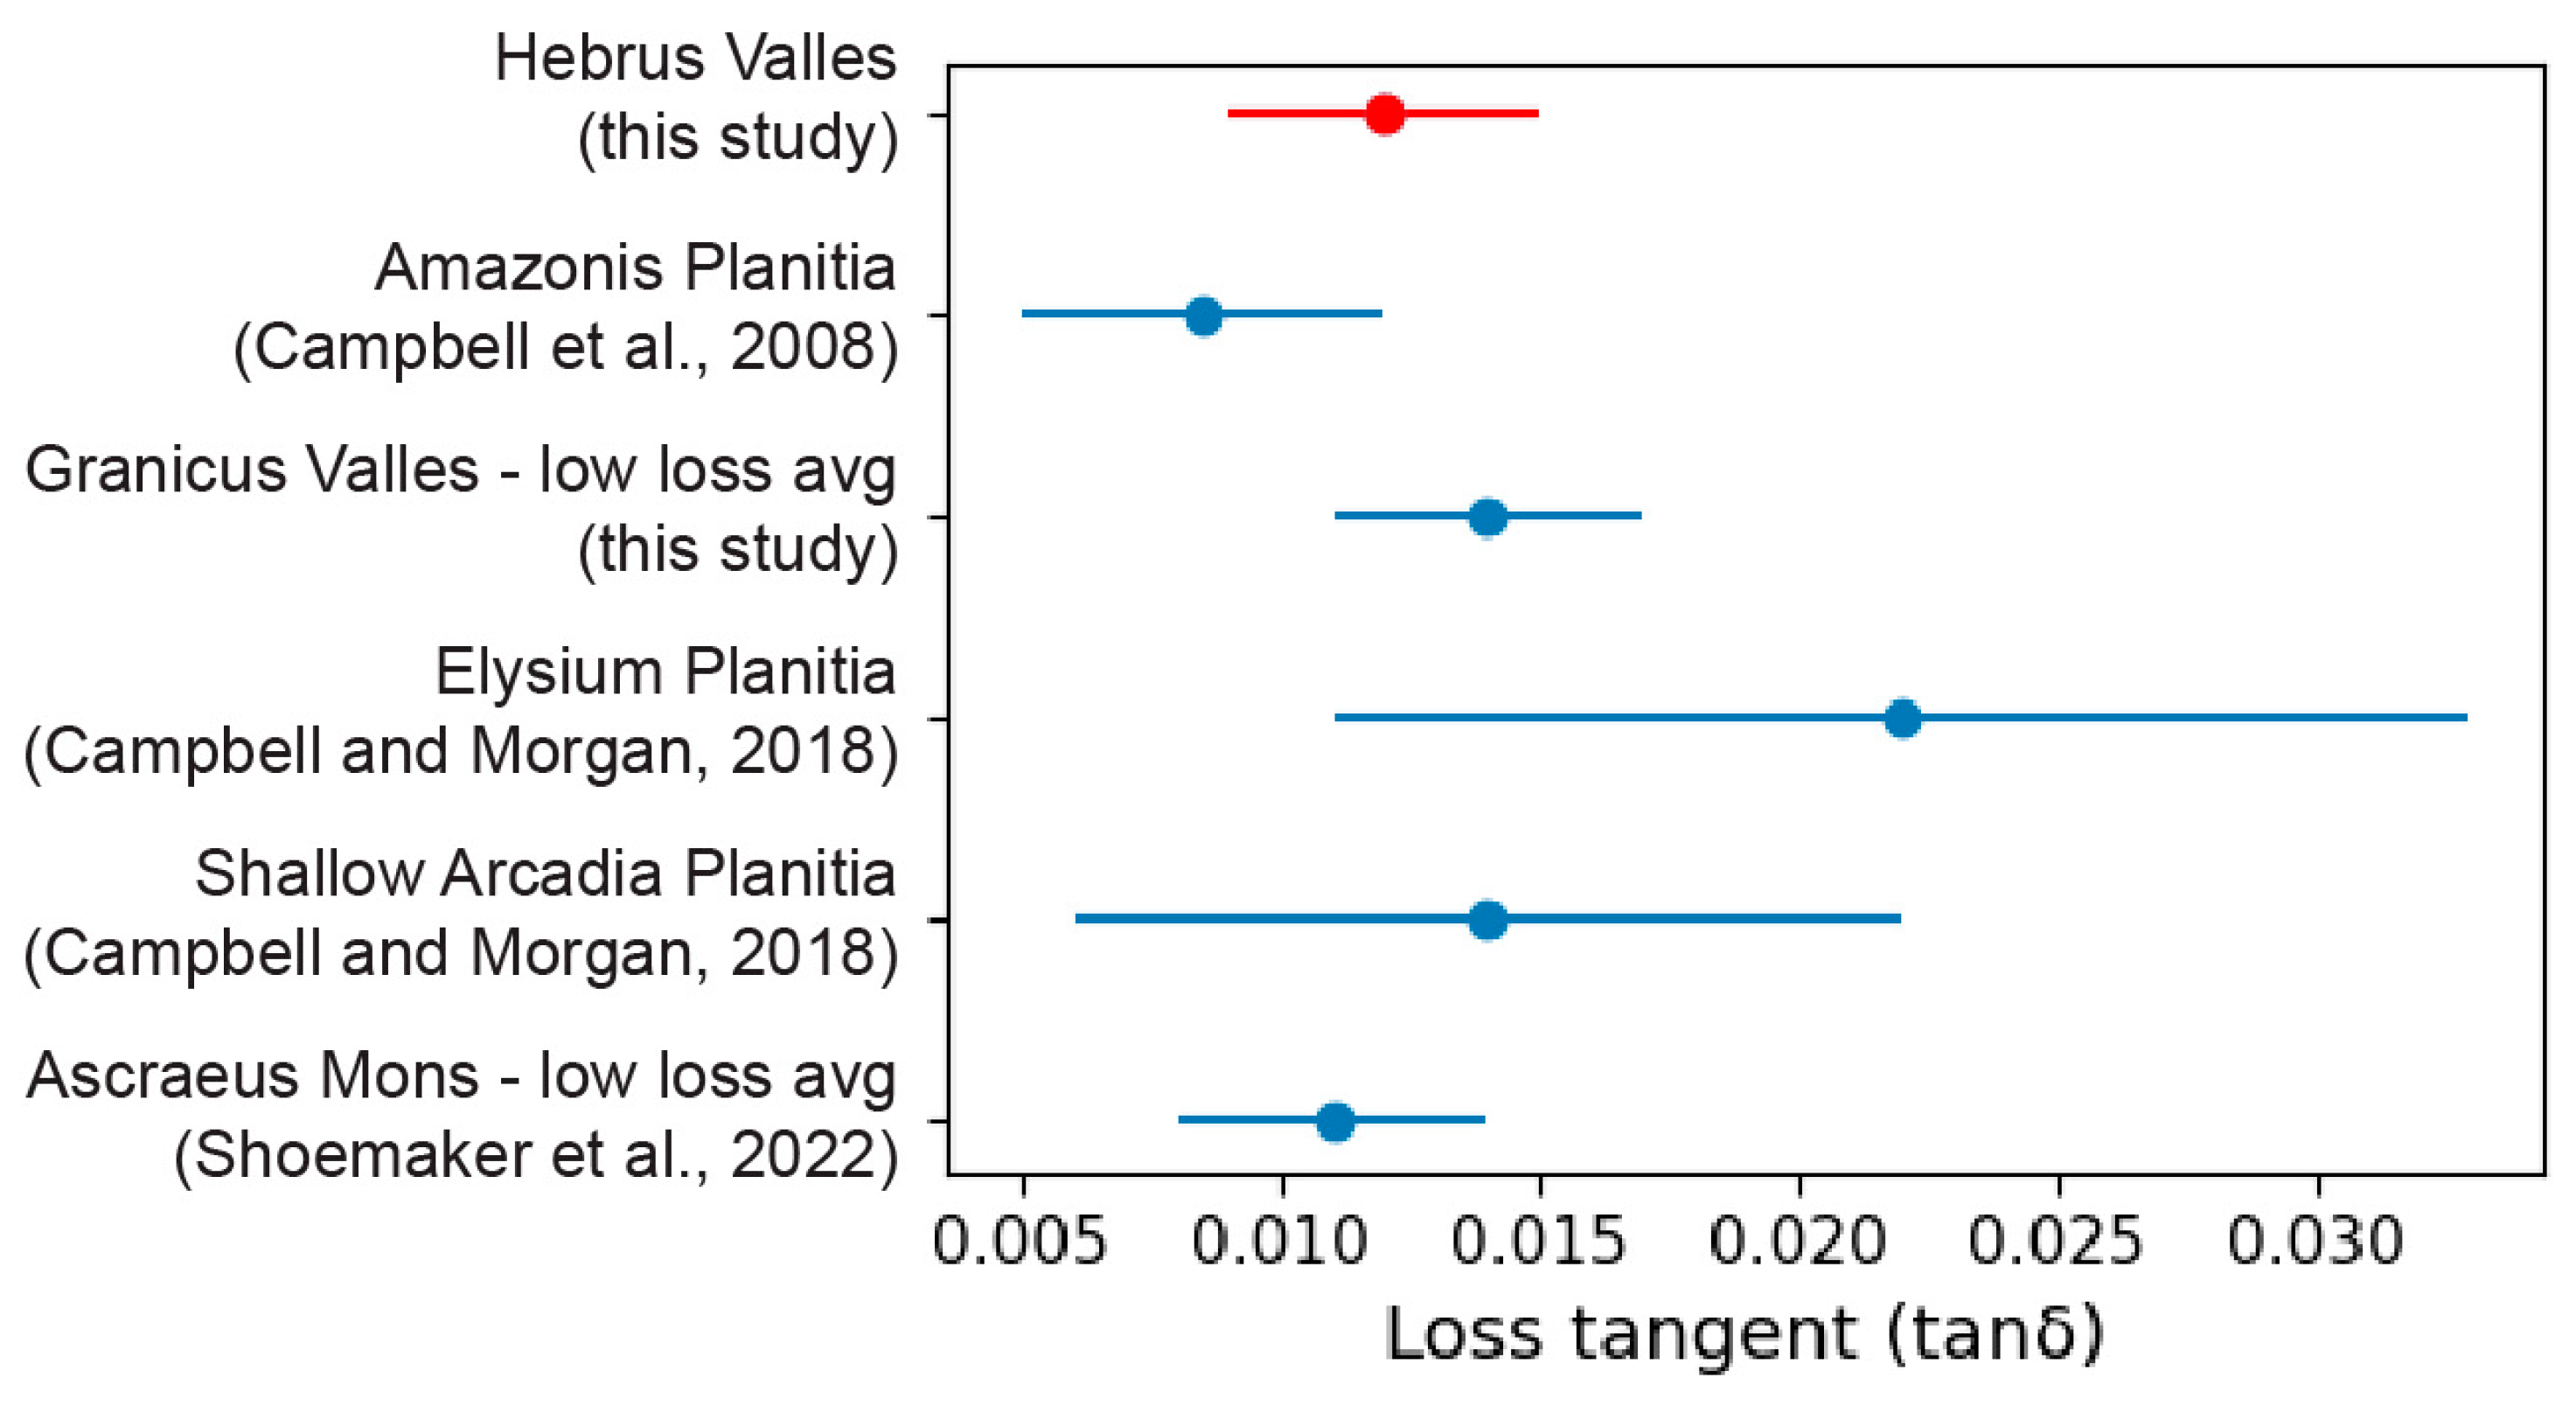
3.2. Hebrus Valles
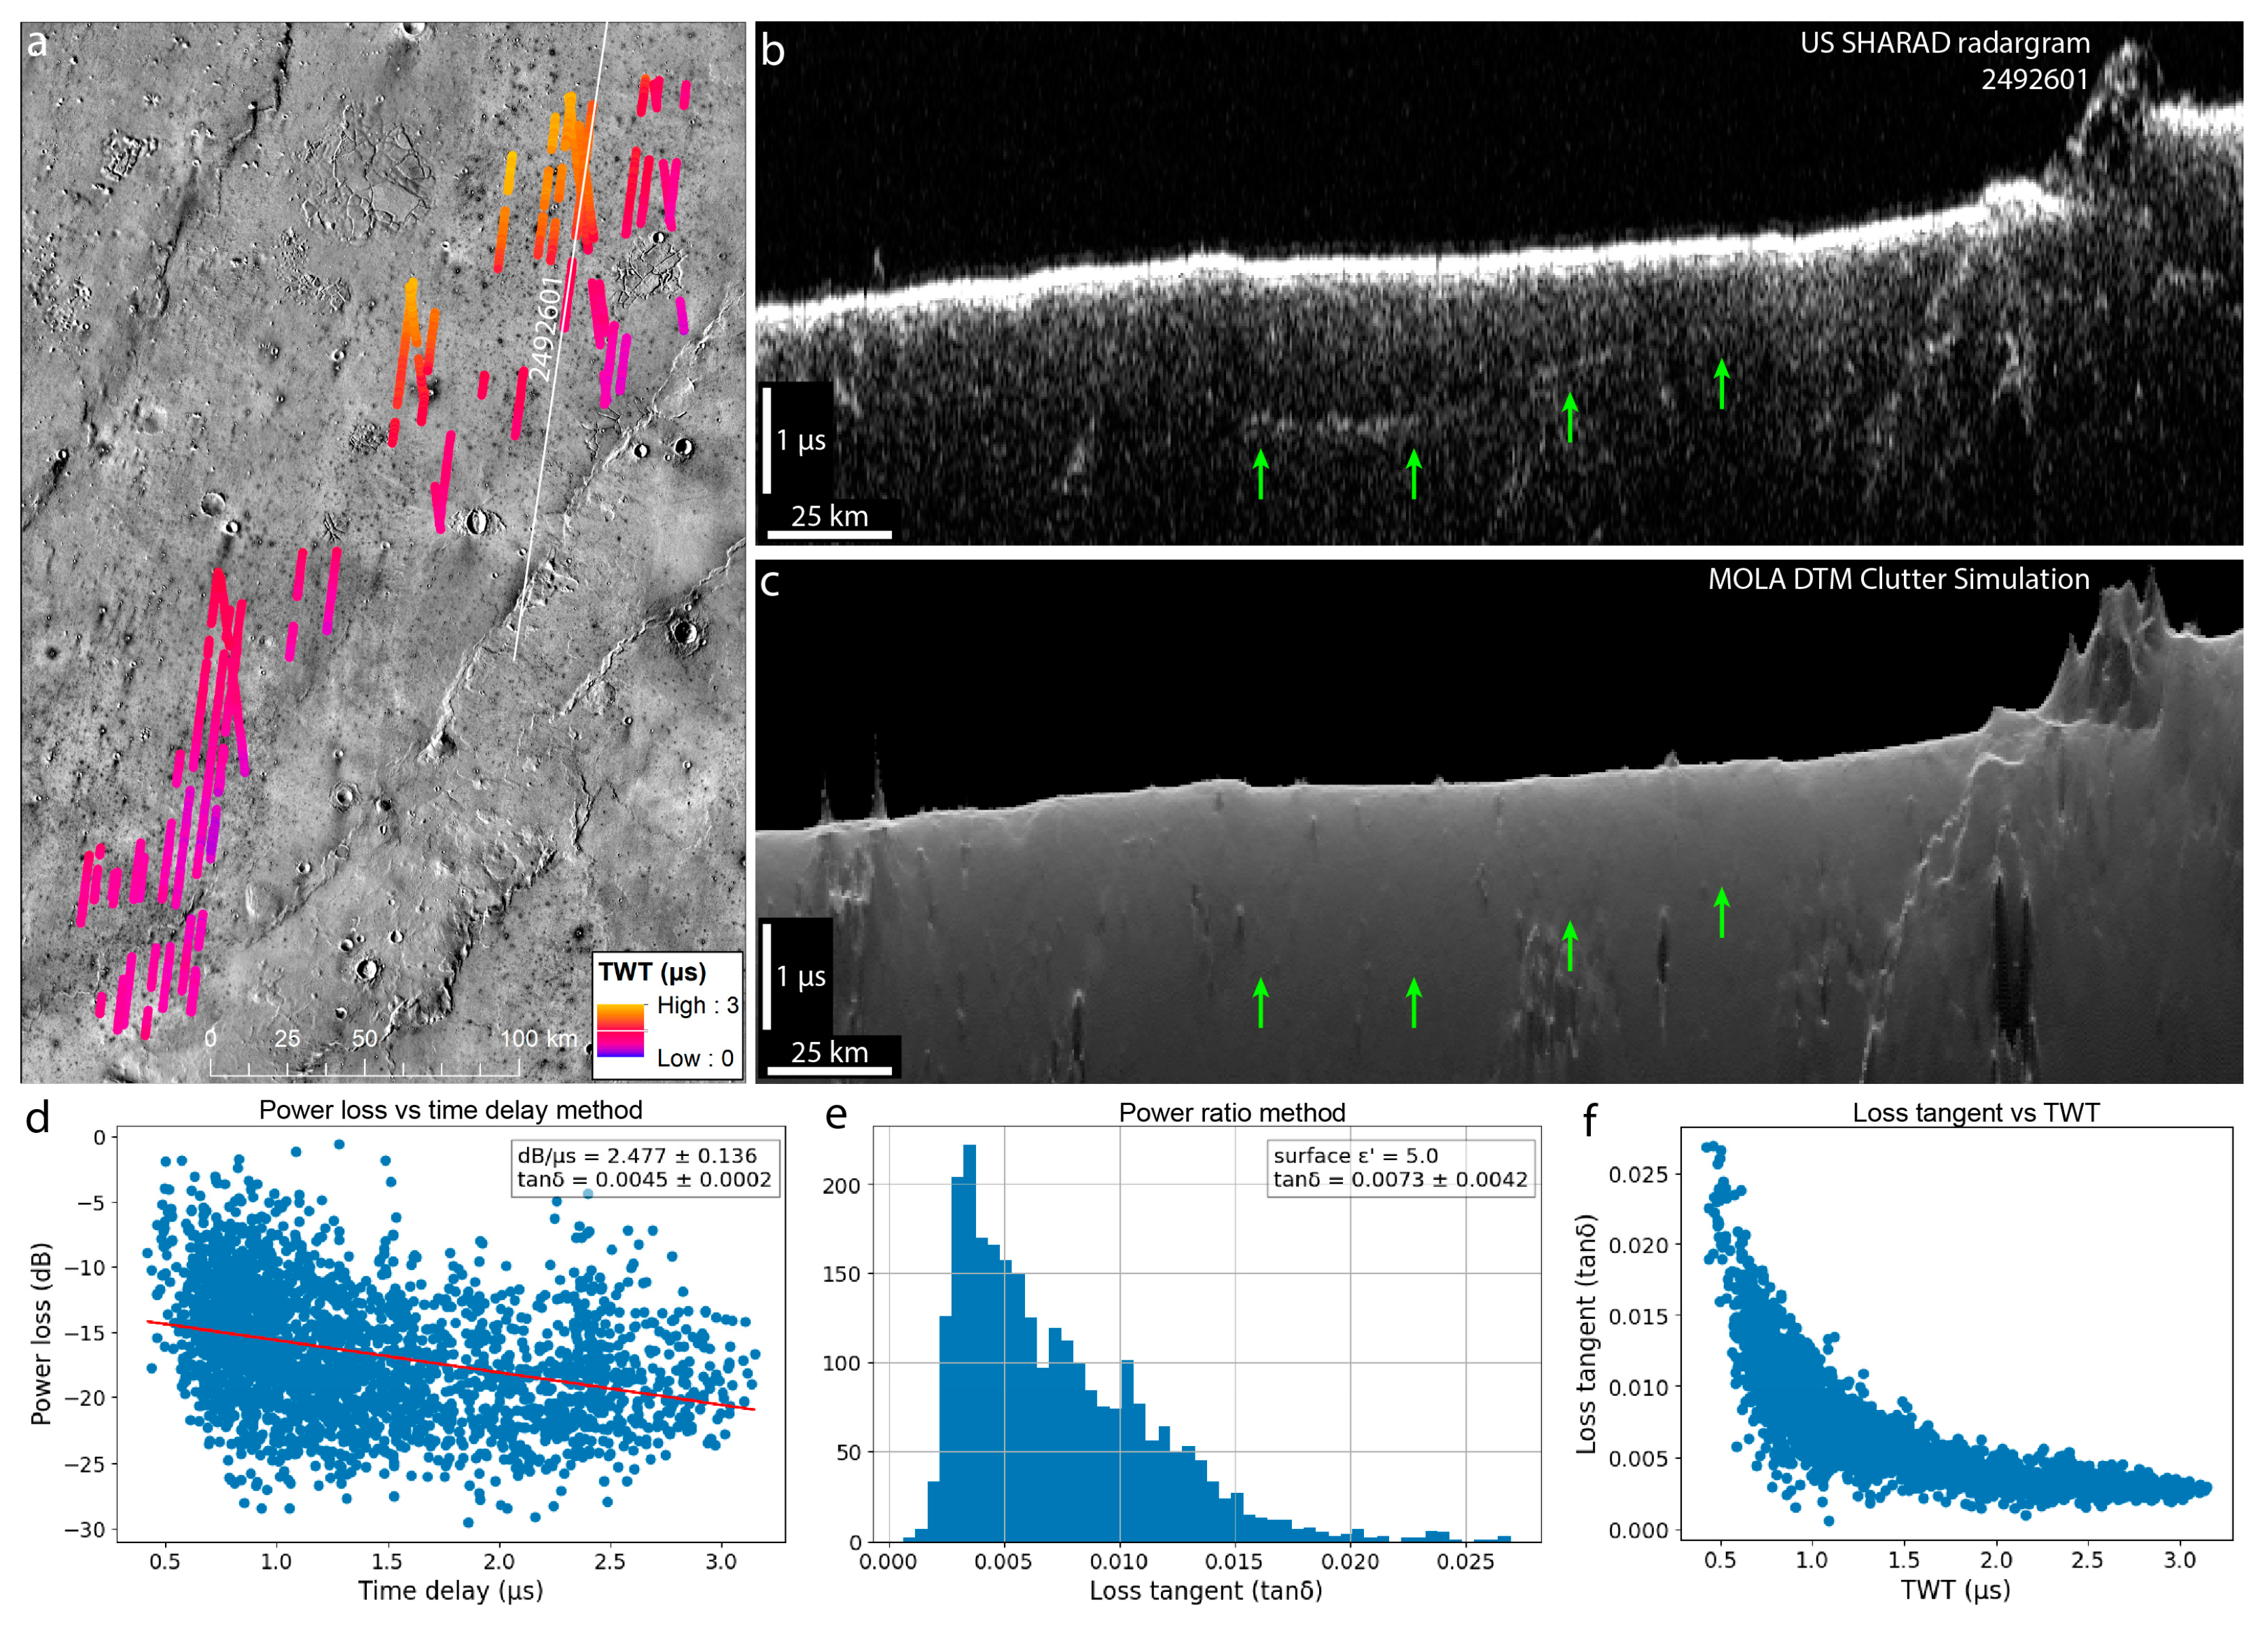
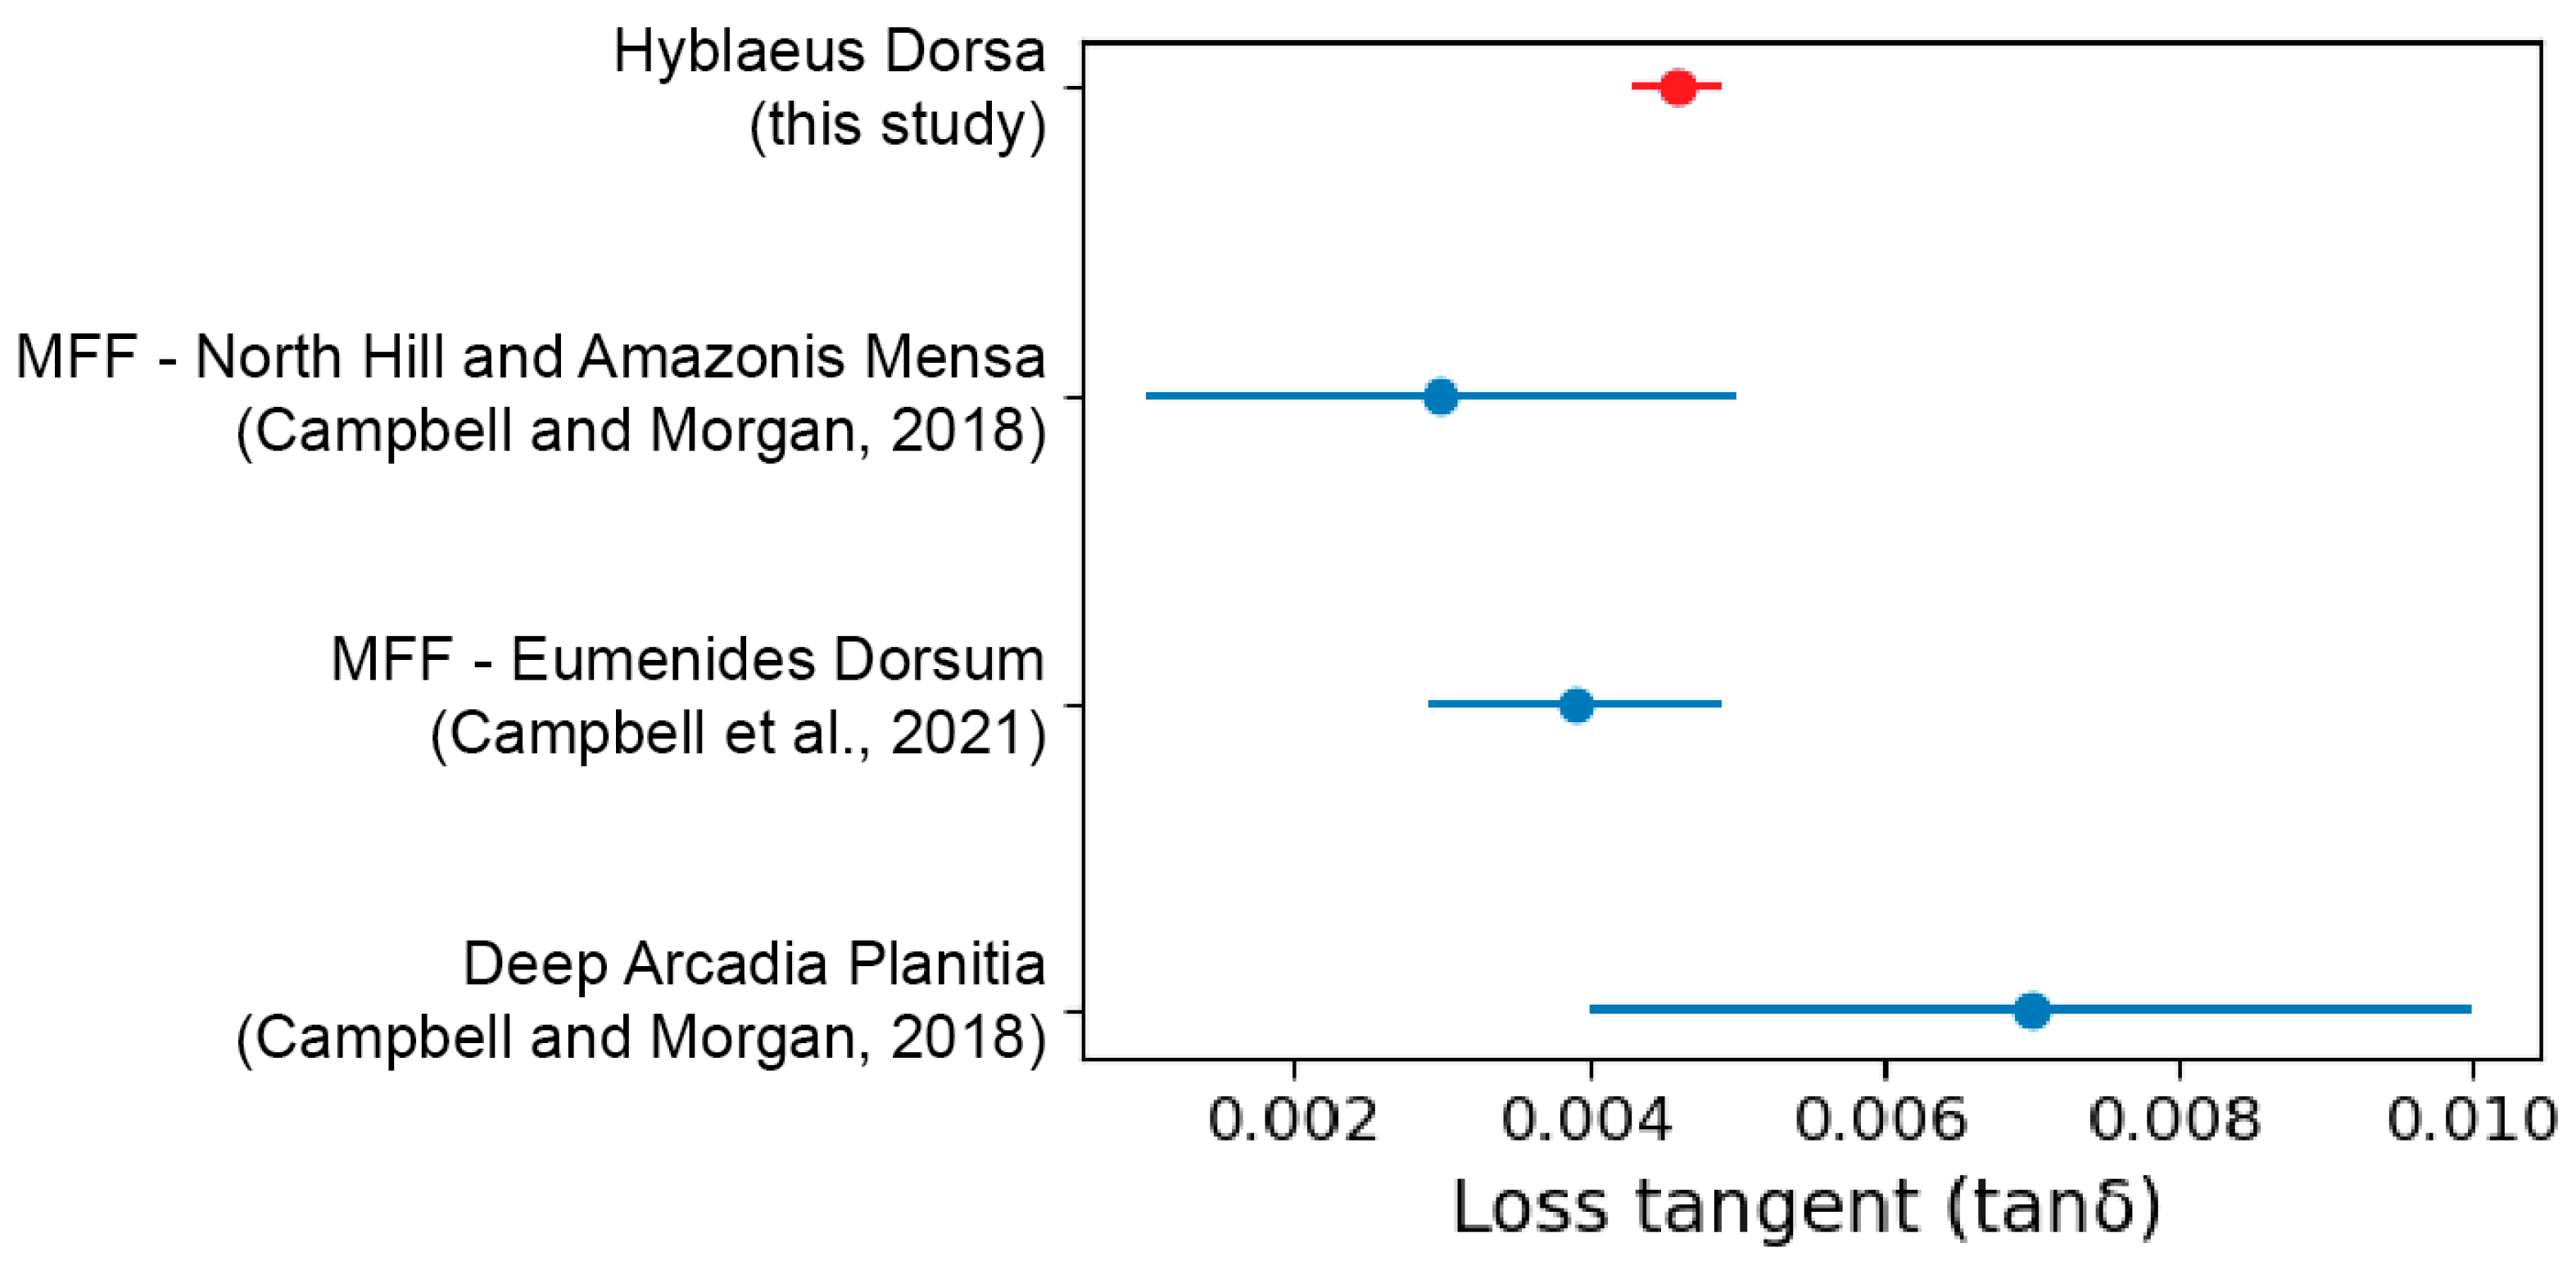
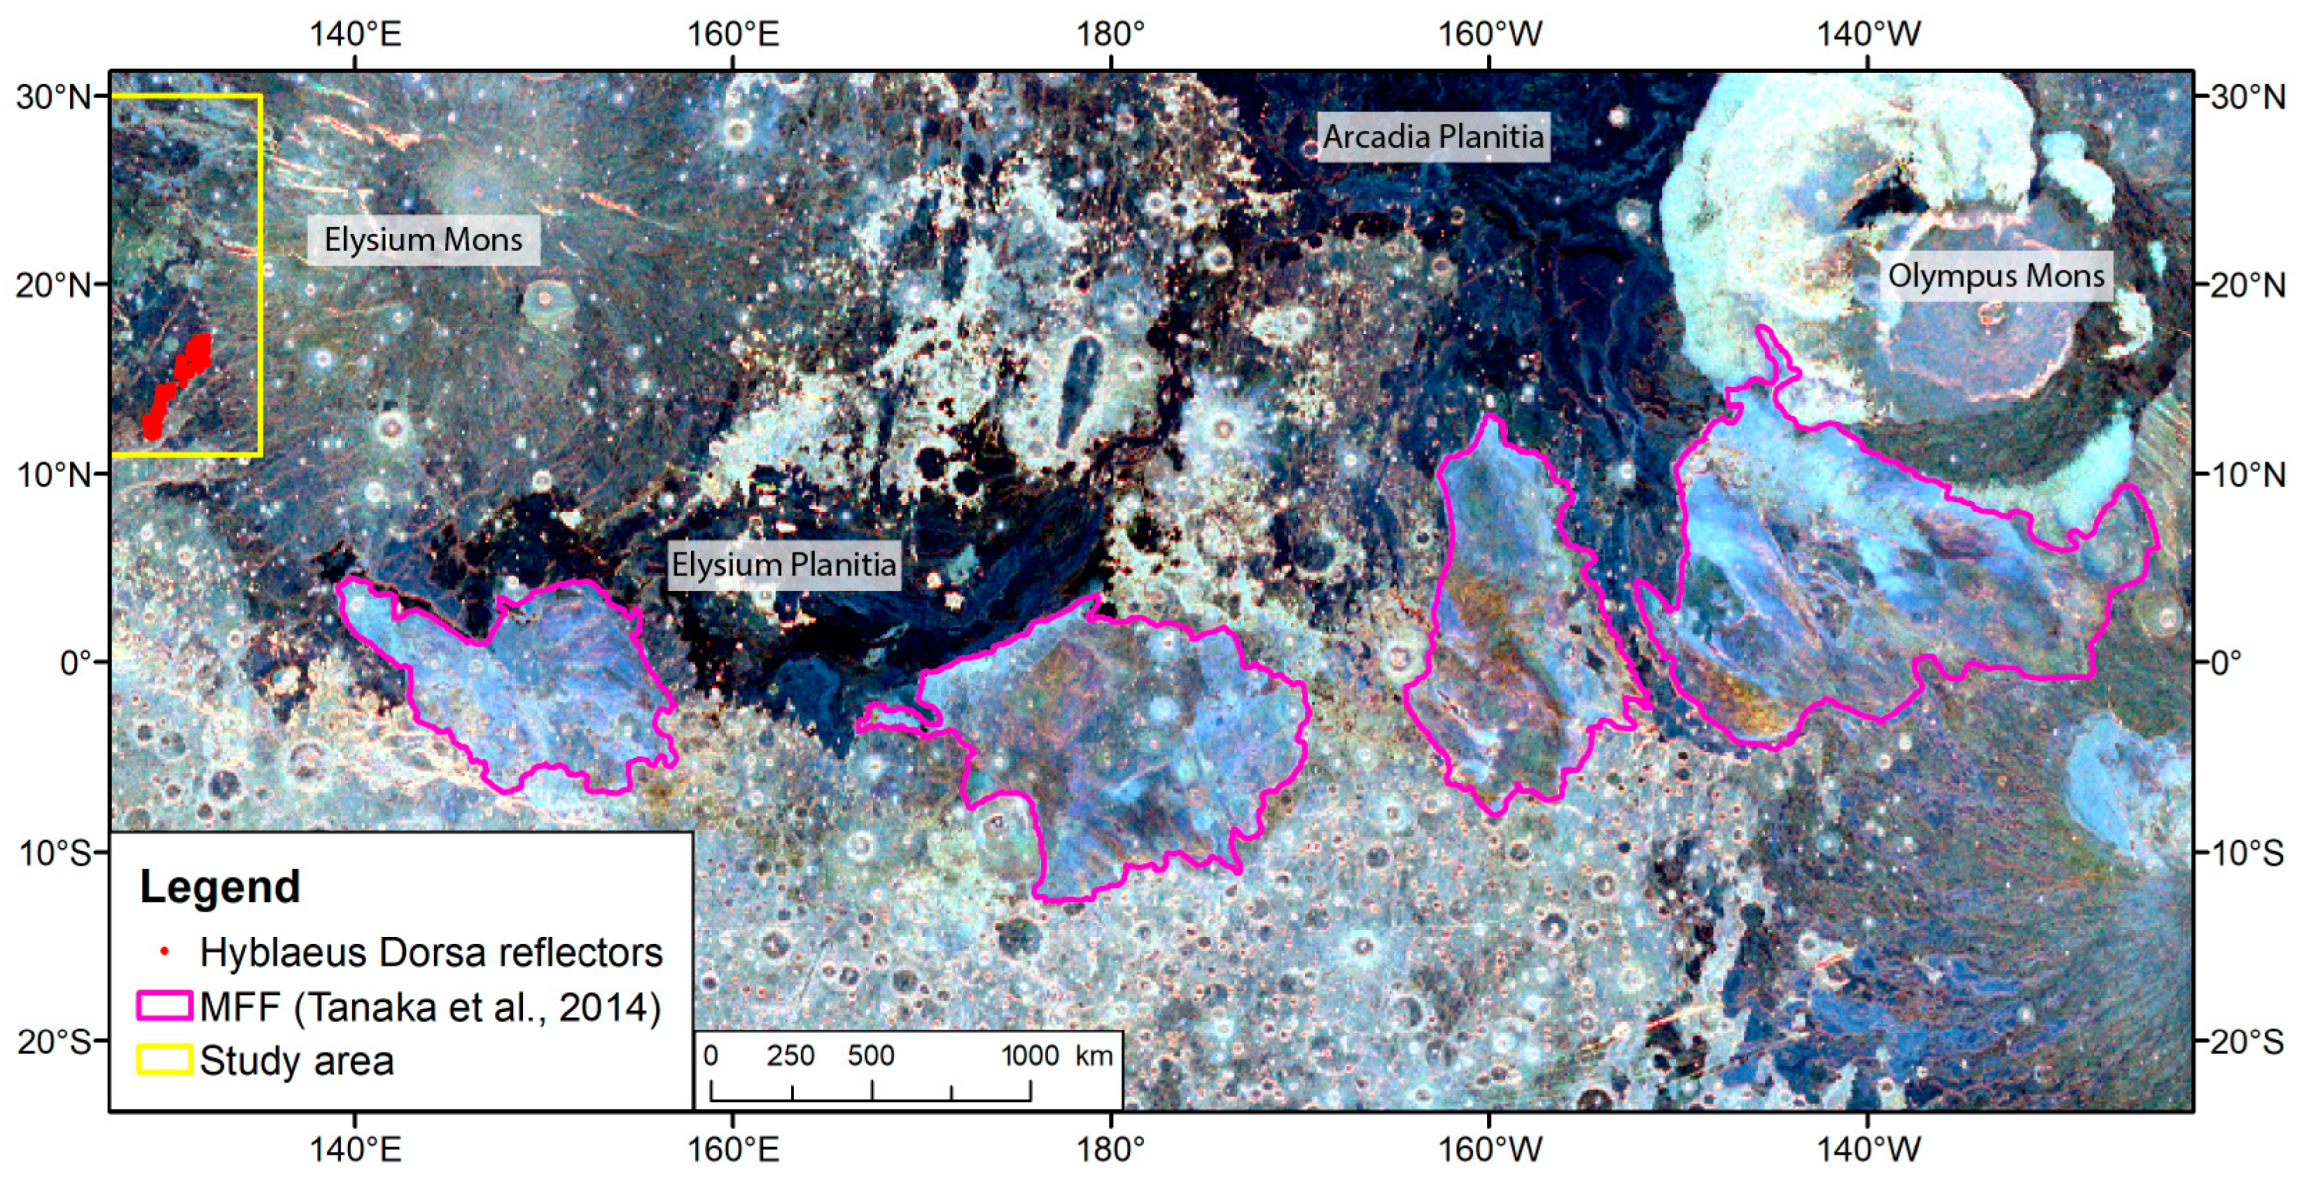
3.3. Hyblaeus Dorsa
4. Discussion
4.1. Granicus Valles and Hyblaeus Fossae
4.2. Hebrus Valles
4.3. Hyblaeus Dorsa
5. Conclusions
Supplementary Materials
Author Contributions
Funding
Data Availability Statement
Acknowledgments
Conflicts of Interest
References
- Christiansen, E.H.H. The Origin of Channels and Associated Deposits in the Elysium Region of Mars; NASA Final Technical Report. 1987. Available online: https://ntrs.nasa.gov/citations/19870019962 (accessed on 1 October 2023).
- Carr, M.H.; Malin, M.C. Meter-Scale Characteristics of Martian Channels and Valleys. Icarus 2000, 146, 366–386. [Google Scholar] [CrossRef]
- Tanaka, K.L.; Skinner, J.A.; Hare, T.M. Geologic Map of the Northern Plains of Mars; Information Services distributor; US Geological Survey: Reston, VA, USA, 2005. [Google Scholar]
- Rodriguez, J.A.P.; Bourke, M.; Tanaka, K.L.; Miyamoto, H.; Kargel, J.; Baker, V.; Fairén, A.G.; Davies, R.J.; Bridget, L.; Santiago, R.L.; et al. Infiltration of Martian outflow channel floodwaters into lowland cavernous systems. Geophys. Res. Lett. 2012, 39, L22201. [Google Scholar] [CrossRef]
- Skinner, J.A.; Tanaka, K.L. Geologic Map of the Nepenthes Planum Region, Mars; Scientific Investigations Map; US Geological Survey: Reston, VA, USA, 2018. [Google Scholar]
- Kreslavsky, M.A.; Head, J.W. Fate of outflow channel effluents in the northern lowlands of Mars: The Vastitas Borealis Formation as a sublimation residue from frozen ponded bodies of water. J. Geophys. Res. Planets 2002, 107, 5121. [Google Scholar] [CrossRef]
- Nunes, D.C.; Smrekar, S.E.; Safaeinili, A.; Holt, J.; Phillips, R.J.; Seu, R.; Campbell, B. Examination of gully sites on Mars with the shallow radar. J. Geophys. Res. Planets 2010, 115, E10004 1-20. [Google Scholar] [CrossRef]
- Ruff, S.W.; Christensen, P.R. Bright and dark regions on Mars: Particle size and mineralogical characteristics based on Thermal Emission Spectrometer data. J. Geophys. Res. Planets 2002, 107, 2-1–2-22. [Google Scholar] [CrossRef]
- Cockell, C.; Bridges, J.; Dannatt, L.; Burchell, M.; Patel, M.; Danson, M. Where to land on Mars. Astron. Geophys. 2009, 50, 6.18–6.26. [Google Scholar] [CrossRef]
- Davila, A.; Fairén, A.G.; Rodríguez, A.P.; Schulze-Makuch, D.; Rask, J.; Zavaleta, J. The Hebrus Valles Exploration Zone: Access to the Martian Surface and Subsurface. In Proceedings of the First Landing Site/Exploration Zone Workshop for Human Missions to the Surface of Mars, Houston, TX, USA, 27–30 October 2015; Volume 1879, p. 1012. [Google Scholar]
- Zubrin, R. Local Resource Creation on Mars. In Handbook of Space Resources; Badescu, V., Zacny, K., Bar-Cohen, Y., Eds.; Springer International Publishing: Cham, Switzerland, 2023; pp. 669–687. ISBN 978-3-030-97913-3. [Google Scholar]
- Westall, F.; Loizeau, D.; Foucher, F.; Bost, N.; Betrand, M.; Vago, J.; Kminek, G. Habitability on Mars from a Microbial Point of View. Astrobiology 2013, 13, 887–897. [Google Scholar] [CrossRef]
- Schorghofer, N.; Forget, F. History and anatomy of subsurface ice on Mars. Icarus 2012, 220, 1112–1120. [Google Scholar] [CrossRef]
- Becerra, P.; Smith, I.B.; Hibbard, S.; Andres, C.; Bapst, J.; Bramson, A.M.; Buhler, P.B.; Coronato, A.; Diniega, S.; Emmett, J.; et al. Past, Present, and Future of Mars Polar Science: Outcomes and Outlook from the 7th International Conference on Mars Polar Science and Exploration. Planet. Sci. J. 2021, 2, 209. [Google Scholar] [CrossRef]
- Seu, R.; Phillips, R.J.; Biccari, D.; Orosei, R.; Masdea, A.; Picardi, G.; Safaeinili, A.; Campbell, B.A.; Plaut, J.J.; Marinangeli, L.; et al. SHARAD sounding radar on the Mars Reconnaissance Orbiter. J. Geophys. Res. Planets 2007, 112, E05S05. [Google Scholar] [CrossRef]
- Seu, R.; Biccari, D.; Orosei, R.; Lorenzoni, L.V.; Phillips, R.J.; Marinangeli, L.; Picardi, G.; Masdea, A.; Zampolini, E. SHARAD: The MRO 2005 shallow radar. Planet. Space Sci. 2004, 52, 157–166. [Google Scholar] [CrossRef]
- Campbell, B.A.; Putzig, N.E.; Carter, L.M.; Phillips, R.J. Autofocus Correction of Phase Distortion Effects on SHARAD Echoes. IEEE Geosci. Remote Sens. Lett. 2011, 8, 939–942. [Google Scholar] [CrossRef]
- Campbell, B.U.S. Shallow Radar (SHARAD) Data Product Description for the Planetary Data System; Smithsonian Institute: Washington, DC, USA, 2014. [Google Scholar]
- Choudhary, P.; Holt, J.W.; Kempf, S.D. Surface Clutter and Echo Location Analysis for the Interpretation of SHARAD Data From Mars. IEEE Geosci. Remote Sens. Lett. 2016, 13, 1285–1289. [Google Scholar] [CrossRef]
- Neukum, G.; Jaumann, R. HRSC: The High Resolution Stereo Camera of Mars Express. In Mars Express: The Scientific Payload; ESA Publications Division: Noordwijk, The Netherlands, 2004; Volume 1240, pp. 17–35. [Google Scholar]
- Smith, D.E.; Zuber, M.T.; Frey, H.V.; Garvin, J.B.; Head, J.W.; Muhleman, D.O.; Pettengill, G.H.; Phillips, R.J.; Solomon, S.C.; Zwally, H.J.; et al. Mars Orbiter Laser Altimeter: Experiment summary after the first year of global mapping of Mars. J. Geophys. Res. Planets 2001, 106, 23689–23722. [Google Scholar] [CrossRef]
- Morgan, G.A.; Putzig, N.E.; Perry, M.R.; Sizemore, H.G.; Bramson, A.M.; Petersen, E.I.; Bain, Z.M.; Baker, D.M.H.; Mastrogiuseppe, M.; Hoover, R.H.; et al. Availability of subsurface water-ice resources in the northern mid-latitudes of Mars. Nat. Astron. 2021, 5, 230–236. [Google Scholar] [CrossRef]
- Putzig, N.E.; Phillips, R.J.; Campbell, B.A.; Mellon, M.T.; Holt, J.W.; Brothers, T.C. SHARAD soundings and surface roughness at past, present, and proposed landing sites on Mars: Reflections at Phoenix may be attributable to deep ground ice. J. Geophys. Res. Planets 2014, 119, 1936–1949. [Google Scholar] [CrossRef]
- Plaut, J.J.; Picardi, G.; Safaeinili, A.; Ivanov, A.B.; Milkovich, S.M.; Cicchetti, A.; Kofman, W.; Mouginot, J.; Farrell, W.M.; Phillips, R.J.; et al. Subsurface Radar Sounding of the South Polar Layered Deposits of Mars. Science 2007, 316, 92–95. [Google Scholar] [CrossRef]
- Heggy, E.; Clifford, S.M.; Cosmidis, J.; Humeaux, A.; Boisson, J.; Morris, R.V. Geoelectrical Model of the Martian North Polar Layered Deposits. In Proceedings of the 39th Annual Lunar and Planetary Science Conference, League City, TX, USA, 10–14 March 2008; Volume 39, p. 2471. [Google Scholar]
- Shoemaker, E.S.; Carter, L.M.; Garry, W.B.; Morgan, G.A.; Plaut, J.J. New Insights Into Subsurface Stratigraphy Northwest of Ascraeus Mons, Mars, Using the SHARAD and MARSIS Radar Sounders. J. Geophys. Res. Planets 2022, 127, e2022JE007210. [Google Scholar] [CrossRef]
- Campbell, B.A.; Morgan, G.A. Fine-Scale Layering of Mars Polar Deposits and Signatures of Ice Content in Nonpolar Material From Multiband SHARAD Data Processing. Geophys. Res. Lett. 2018, 45, 1759–1766. [Google Scholar] [CrossRef]
- Heggy, E.; Paillou, P.; Ruffie, G.; Malezieux, J.M.; Costard, F.; Grandjean, G. On water detection in the martian subsurface using sounding radar. Icarus 2001, 154, 244–257. [Google Scholar] [CrossRef]
- Heggy, E.; Clifford, S.M.; Grimm, R.E.; Dinwiddie, C.L.; Wyrick, D.Y.; Hill, B.E. Ground-penetrating radar sounding in mafic lava flows: Assessing attenuation and scattering losses in Mars-analog volcanic terrains. J. Geophys. Res. Planets 2006, 111. [Google Scholar] [CrossRef]
- Boivin, A.L.; Tsai, C.-A.; Hickson, D.C.; Ghent, R.R.; Daly, M.G. Determination of Broadband Complex EM Parameters of Powdered Materials: 2. Ilmenite-Bearing Lunar Analogue Materials. J. Geophys. Res. Planets 2022, 127, e2022JE007200. [Google Scholar] [CrossRef]
- Campbell, B.; Carter, L.; Phillips, R.; Plaut, J.; Putzig, N.; Safaeinili, A.; Seu, R.; Biccari, D.; Egan, A.; Orosei, R. SHARAD radar sounding of the Vastitas Borealis Formation in Amazonis Planitia. J. Geophys. Res. Planets 2008, 113, E12010. [Google Scholar] [CrossRef]
- Richter, P.H. Estimating Errors in Least-Squares Fitting. Telecommun. Data Acquis. Prog. Rep. 1995, 122, 107–137. [Google Scholar]
- Grima, C.; Kofman, W.; Mouginot, J.; Phillips, R.J.; Hérique, A.; Biccari, D.; Seu, R.; Cutigni, M. North polar deposits of Mars: Extreme purity of the water ice. Geophys. Res. Lett. 2009, 36, L03203. [Google Scholar] [CrossRef]
- Castaldo, L.; Mège, D.; Gurgurewicz, J.; Orosei, R.; Alberti, G. Global permittivity mapping of the Martian surface from SHARAD. Earth Planet. Sci. Lett. 2017, 462, 55–65. [Google Scholar] [CrossRef]
- Petersen, E.I.; Holt, J.W.; Levy, J.S. High Ice Purity of Martian Lobate Debris Aprons at the Regional Scale: Evidence From an Orbital Radar Sounding Survey in Deuteronilus and Protonilus Mensae. Geophys. Res. Lett. 2018, 45, 11595–11604. [Google Scholar] [CrossRef]
- Lalich, D.E.; Holt, J.W.; Smith, I.B. Radar Reflectivity as a Proxy for the Dust Content of Individual Layers in the Martian North Polar Layered Deposits. J. Geophys. Res. Planets 2019, 124, 1690–1703. [Google Scholar] [CrossRef]
- Christensen, P.R.; Jakosky, B.M.; Kieffer, H.H.; Malin, M.C.; McSween, H.Y.; Nealson, K.; Mehall, G.L.; Silverman, S.H.; Ferry, S.; Caplinger, M.; et al. The Thermal Emission Imaging System (THEMIS) for the Mars 2001 Odyssey Mission. Space Sci. Rev. 2004, 110, 85–130. [Google Scholar] [CrossRef]
- Edwards, C.S.; Nowicki, K.J.; Christensen, P.R.; Hill, J.; Gorelick, N.; Murray, K. Mosaicking of global planetary image datasets: 1. Techniques and data processing for Thermal Emission Imaging System (THEMIS) multi-spectral data. J. Geophys. Res. Planets 2011, 116. [Google Scholar] [CrossRef]
- Tanaka, K.L.; Skinner, J.A.; Dohm, J.M.; Irwin, R.P., III; Kolb, E.J.; Fortezzo, C.M.; Platz, T.; Michael, G.G.; Hare, T.M. Geologic map of Mars; Scientific Investigations Map; US Geological Survey: Reston, VA, USA, 2014; p. 48. [Google Scholar]
- Meng, X.; Xu, Y.; Xiao, L.; Xiao, Z. Permittivity Estimation of Subsurface Deposits in the Elysium–Utopia Region on Mars with MRO Shallow Radar Sounder Data. Astron. J. 2020, 159, 156. [Google Scholar] [CrossRef]
- Ganesh, I.; Carter, L.M.; Smith, I.B. SHARAD mapping of Arsia Mons caldera. J. Volcanol. Geotherm. Res. 2020, 390, 106748. [Google Scholar] [CrossRef]
- Russell, P.S.; Head, J.W. Elysium-Utopia flows as mega-lahars: A model of dike intrusion, cryosphere cracking, and water-sediment release. J. Geophys. Res. Planets 2003, 108. [Google Scholar] [CrossRef]
- Petersen, E.I.; Holt, J.W. Surface Roughness Prevents Radar Penetration of Some Martian Debris-Covered Glaciers. IEEE Trans. Geosci. Remote Sens. 2022, 60, 5104307. [Google Scholar] [CrossRef]
- Morgan, G.A.; Campbell, B.A.; Carter, L.M.; Plaut, J.J. Evidence for the episodic erosion of the Medusae Fossae Formation preserved within the youngest volcanic province on Mars. Geophys. Res. Lett. 2015, 42, 7336–7342. [Google Scholar] [CrossRef]
- Stillman, D.E.; Grimm, R.E. Radar penetrates only the youngest geological units on Mars. J. Geophys. Res. Planets 2011, 116. [Google Scholar] [CrossRef]
- Mellon, M.T.; Jakosky, B.M.; Postawko, S.E. The persistence of equatorial ground ice on Mars. J. Geophys. Res. Planets 1997, 102, 19357–19369. [Google Scholar] [CrossRef]
- Heggy, E.; Clifford, S.M.; Younsi, A.; Miane, J.L.; Carley, R.; Morris, R.V. On the Dielectric Properties of Dust and Ice-Dust Mixtures: Experimental Characterization of the Martian Polar-layered Deposits Analog Materials. In Proceedings of the 38th Annual Lunar and Planetary Science Conference, League City, TX, USA, 12–16 March 2007; Volume 38, p. 1756. [Google Scholar]
- Dundas, C.M.; Byrne, S.; McEwen, A.S.; Mellon, M.T.; Wu, M.R.; Daubar, I.; Saper, L. Observations of Ice-Exposing Impacts on Mars over Three Mars Years. AGU Fall Meet. Abstr. 2013, 1, P31C-07. [Google Scholar]
- Piqueux, S.; Buz, J.; Edwards, C.S.; Bandfield, J.L.; Kleinböhl, A.; Kass, D.M.; Hayne, P.O.; Mcs, T.; Teams, T. Widespread Shallow Water Ice on Mars at High Latitudes and Mid Latitudes. Geophys. Res. Lett. 2019, 46, 14290–14298. [Google Scholar] [CrossRef]
- Campbell, B.A.; Watters, T.R.; Morgan, G.A. Dielectric Properties of the Medusae Fossae Formation and Implications for Ice Content. J. Geophys. Res. Planets 2021, 126, e2020JE006601. [Google Scholar] [CrossRef]
- Kerber, L.; Head, J.W.; Madeleine, J.-B.; Forget, F.; Wilson, L. The dispersal of pyroclasts from Apollinaris Patera, Mars: Implications for the origin of the Medusae Fossae Formation. Icarus 2011, 216, 212–220. [Google Scholar] [CrossRef]
- Kreslavsky, M.A.; Head, J.W. Mars: Nature and evolution of young latitude-dependent water-ice-rich mantle. Geophys. Res. Lett. 2002, 29, 14-1–14-4. [Google Scholar] [CrossRef]


| Region | Loss Rate (dB/μs) | Loss Tangent Power Loss vs. TWT | Loss Tangent Power Ratio | Loss Tangent Power Ratio at Max TWT 1 | |
|---|---|---|---|---|---|
| Granicus Valles | A | 15.2 ± 2.2 | 0.028 ± 0.004 | 0.027 ± 0.006 | ~0.017 |
| B | 9.4 ± 4.0 | 0.017 ± 0.007 | 0.015 ± 0.002 | n/a | |
| C | 8.1 ± 1.8 | 0.015 ± 0.003 | 0.016 ± 0.004 | ~0.010 | |
| D | 7.9 ± 1.1 | 0.015 ± 0.002 | 0.015 ± 0.004 | n/a | |
| E | 11.3 ± 2.1 | 0.021 ± 0.004 | 0.016 ± 0.004 | n/a | |
| F | 7.0 ± 2.4 | 0.013 ± 0.004 | 0.010 ± 0.002 | n/a | |
| G | 11.5 ± 0.6 | 0.021 ± 0.001 | 0.020 ± 0.005 | ~0.010 | |
| H | 8.2 ± 1.5 | 0.015 ± 0.003 | 0.021 ± 0.004 | n/a | |
| I | 6.2 ± 0.9 | 0.011 ± 0.002 | 0.012 ± 0.003 | n/a | |
| J | 7.7 ± 1.1 | 0.014 ± 0.002 | 0.022 ± 0.006 | ~0.013 | |
| K | 15.0 ± 2.1 | 0.027 ± 0.004 | 0.017 ± 0.004 | n/a | |
| L | 7.3 ± 0.7 | 0.013 ± 0.001 | 0.017 ± 0.006 | ~0.009 | |
| M | 7.4 ± 1.5 | 0.014 ± 0.003 | 0.021 ± 0.006 | ~0.013 | |
| N | 5.6 ± 1.0 | 0.010 ± 0.002 | 0.015 ± 0.004 | ~0.008 | |
| O | 13.7 ± 0.9 | 0.025 ± 0.002 | 0.020 ± 0.007 | ~0.010 | |
| All 2 | 8.9 ± 0.2 | 0.0162 ± 0.0004 | 0.018 ± 0.006 | ~0.008 | |
| Hyblaeus Fossae | 10.6 ± 0.8 | 0.019 ± 0.002 | 0.020 ± 0.007 | n/a | |
| Hebrus Valles | 5.5 ± 1.5 | 0.010 ± 0.003 | 0.014 ± 0.005 | ~0.010 | |
| Hyblaeus Dorsa | 2.5 ± 0.1 | 0.0045 ± 0.0002 | 0.007 ± 0.004 | ~0.005 | |
Disclaimer/Publisher’s Note: The statements, opinions and data contained in all publications are solely those of the individual author(s) and contributor(s) and not of MDPI and/or the editor(s). MDPI and/or the editor(s) disclaim responsibility for any injury to people or property resulting from any ideas, methods, instructions or products referred to in the content. |
© 2023 by the authors. Licensee MDPI, Basel, Switzerland. This article is an open access article distributed under the terms and conditions of the Creative Commons Attribution (CC BY) license (https://creativecommons.org/licenses/by/4.0/).
Share and Cite
Nerozzi, S.; Christoffersen, M.S.; Holt, J.W.; Hamilton, C.W. Evidence of Widespread Volcanic Activity near Hebrus Valles on Mars Revealed by SHARAD. Remote Sens. 2023, 15, 4967. https://doi.org/10.3390/rs15204967
Nerozzi S, Christoffersen MS, Holt JW, Hamilton CW. Evidence of Widespread Volcanic Activity near Hebrus Valles on Mars Revealed by SHARAD. Remote Sensing. 2023; 15(20):4967. https://doi.org/10.3390/rs15204967
Chicago/Turabian StyleNerozzi, Stefano, Michael S. Christoffersen, John W. Holt, and Christopher W. Hamilton. 2023. "Evidence of Widespread Volcanic Activity near Hebrus Valles on Mars Revealed by SHARAD" Remote Sensing 15, no. 20: 4967. https://doi.org/10.3390/rs15204967