
Unveiling the Subsurface of Late Amazonian Lava Flows at Echus Chasma, on Mars

Abstract
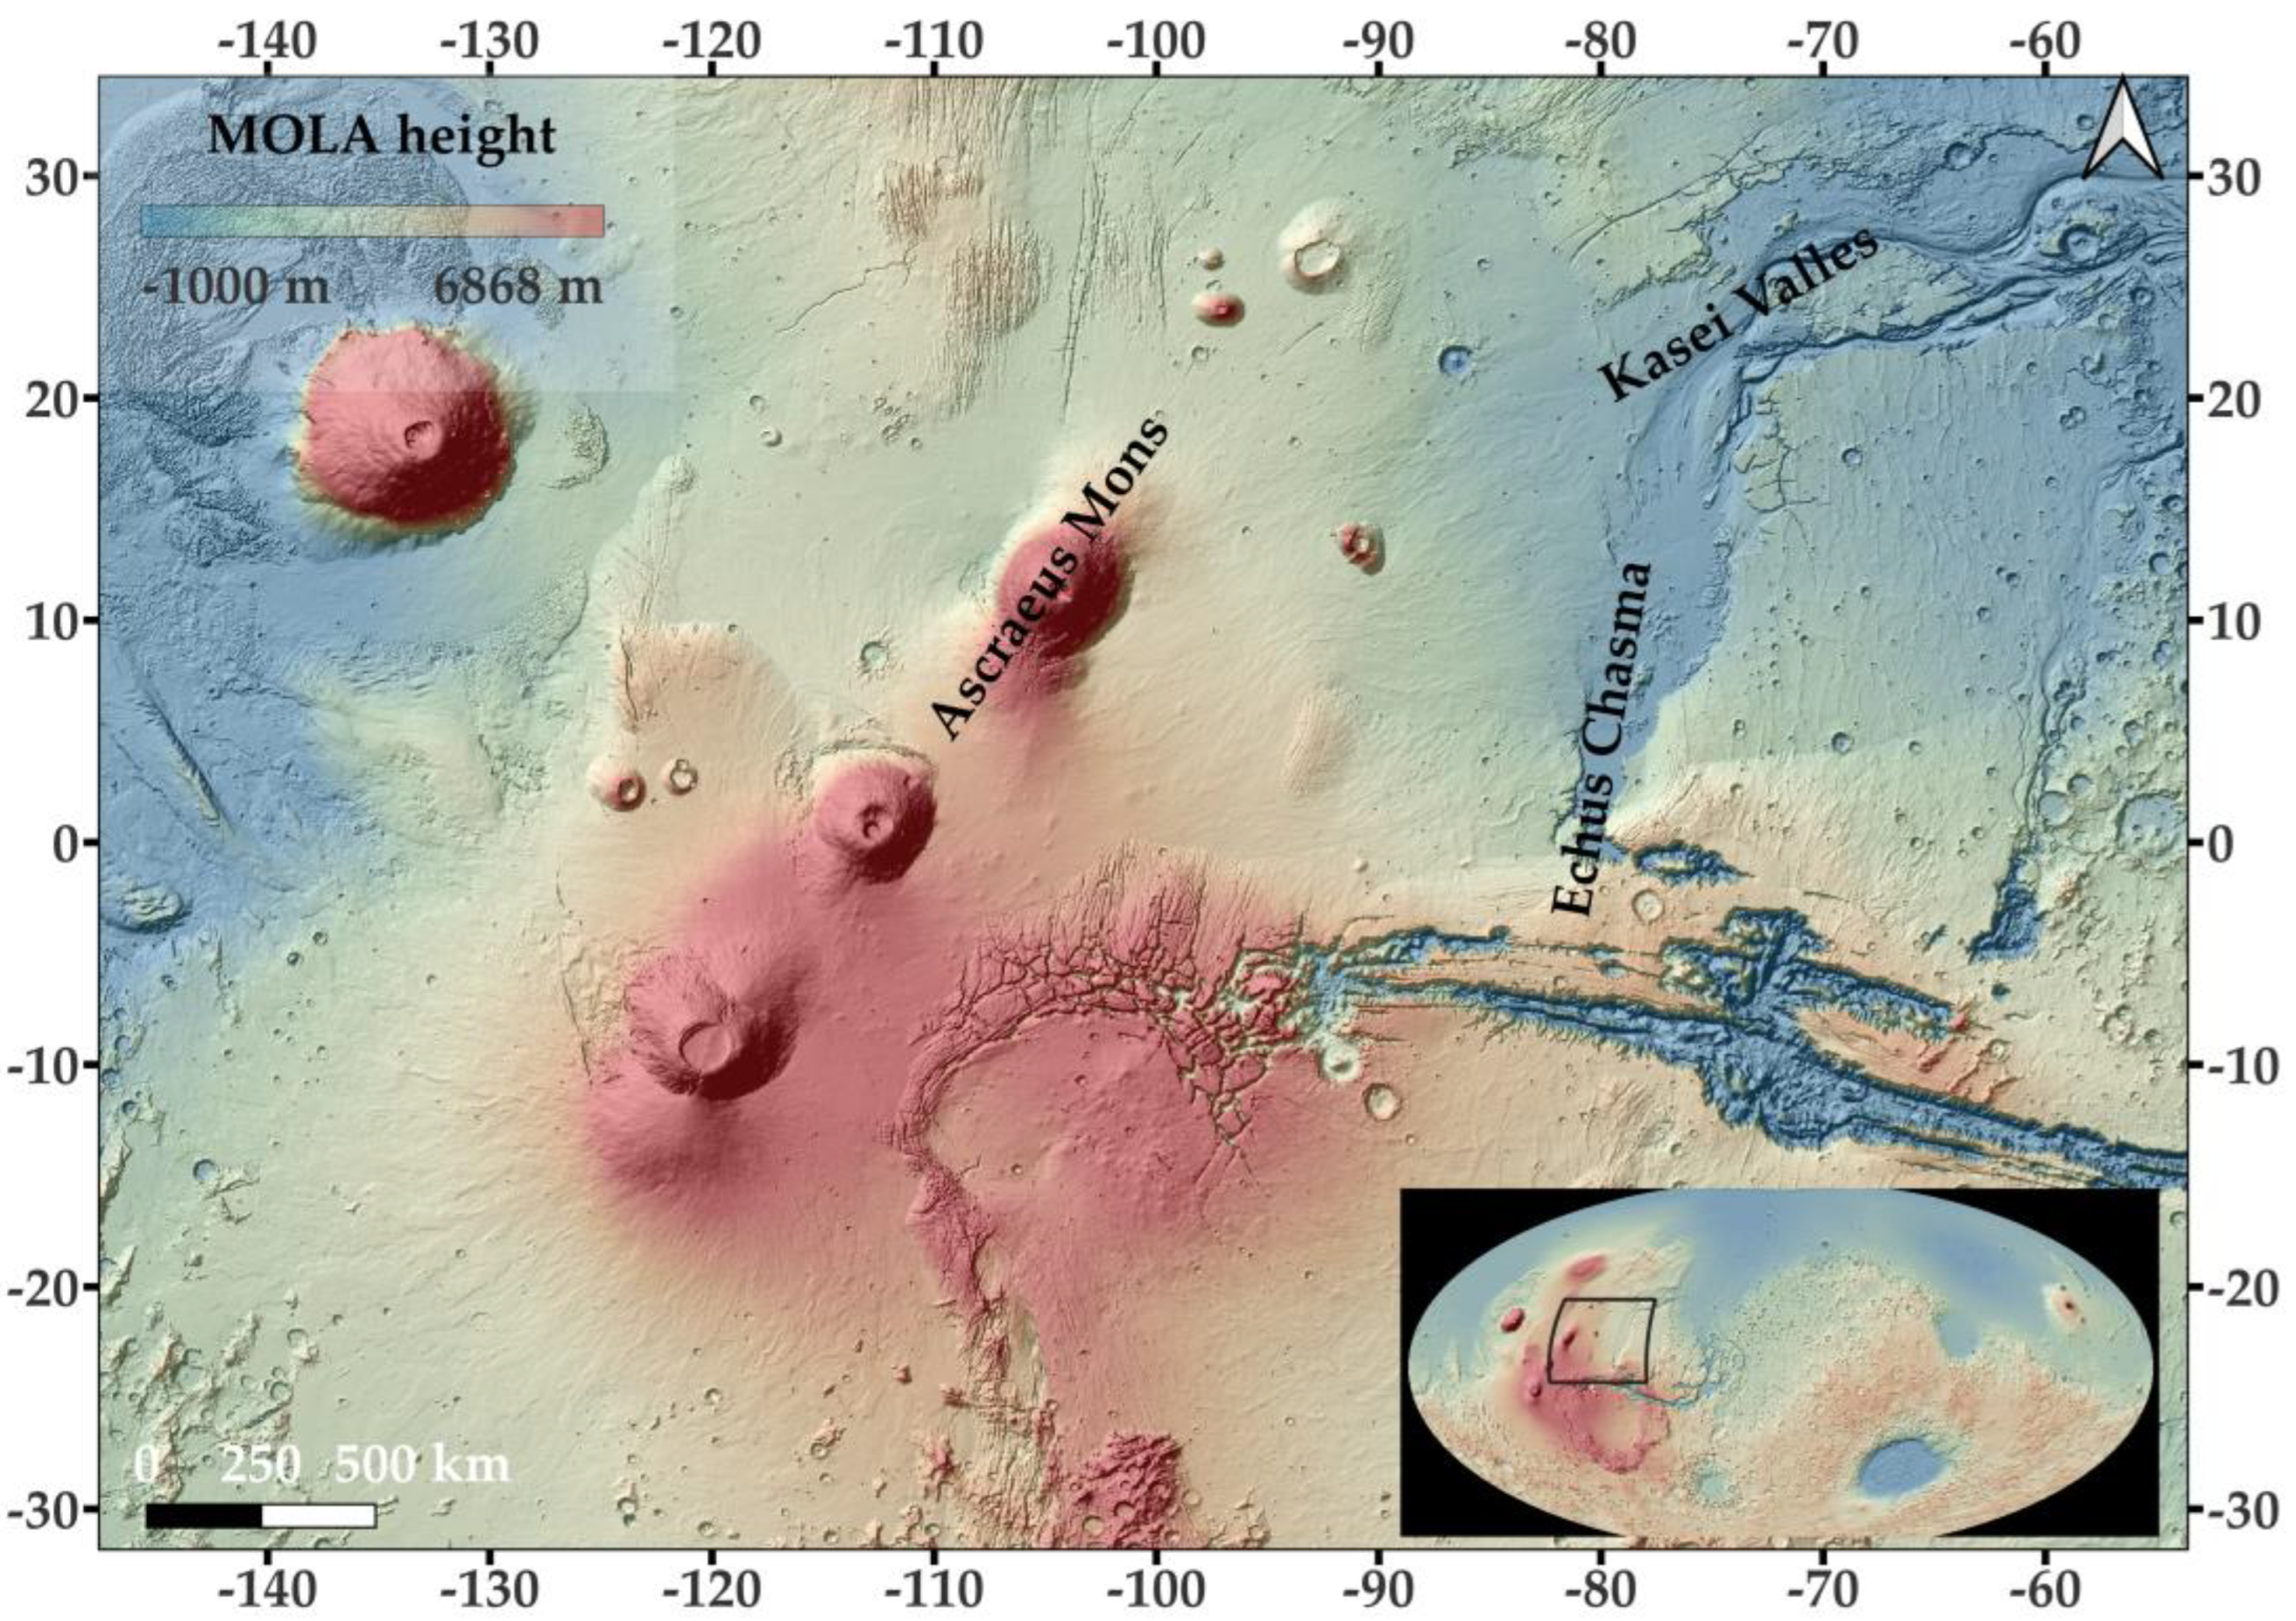
:1. Introduction
2. Materials and Methods
3. Results
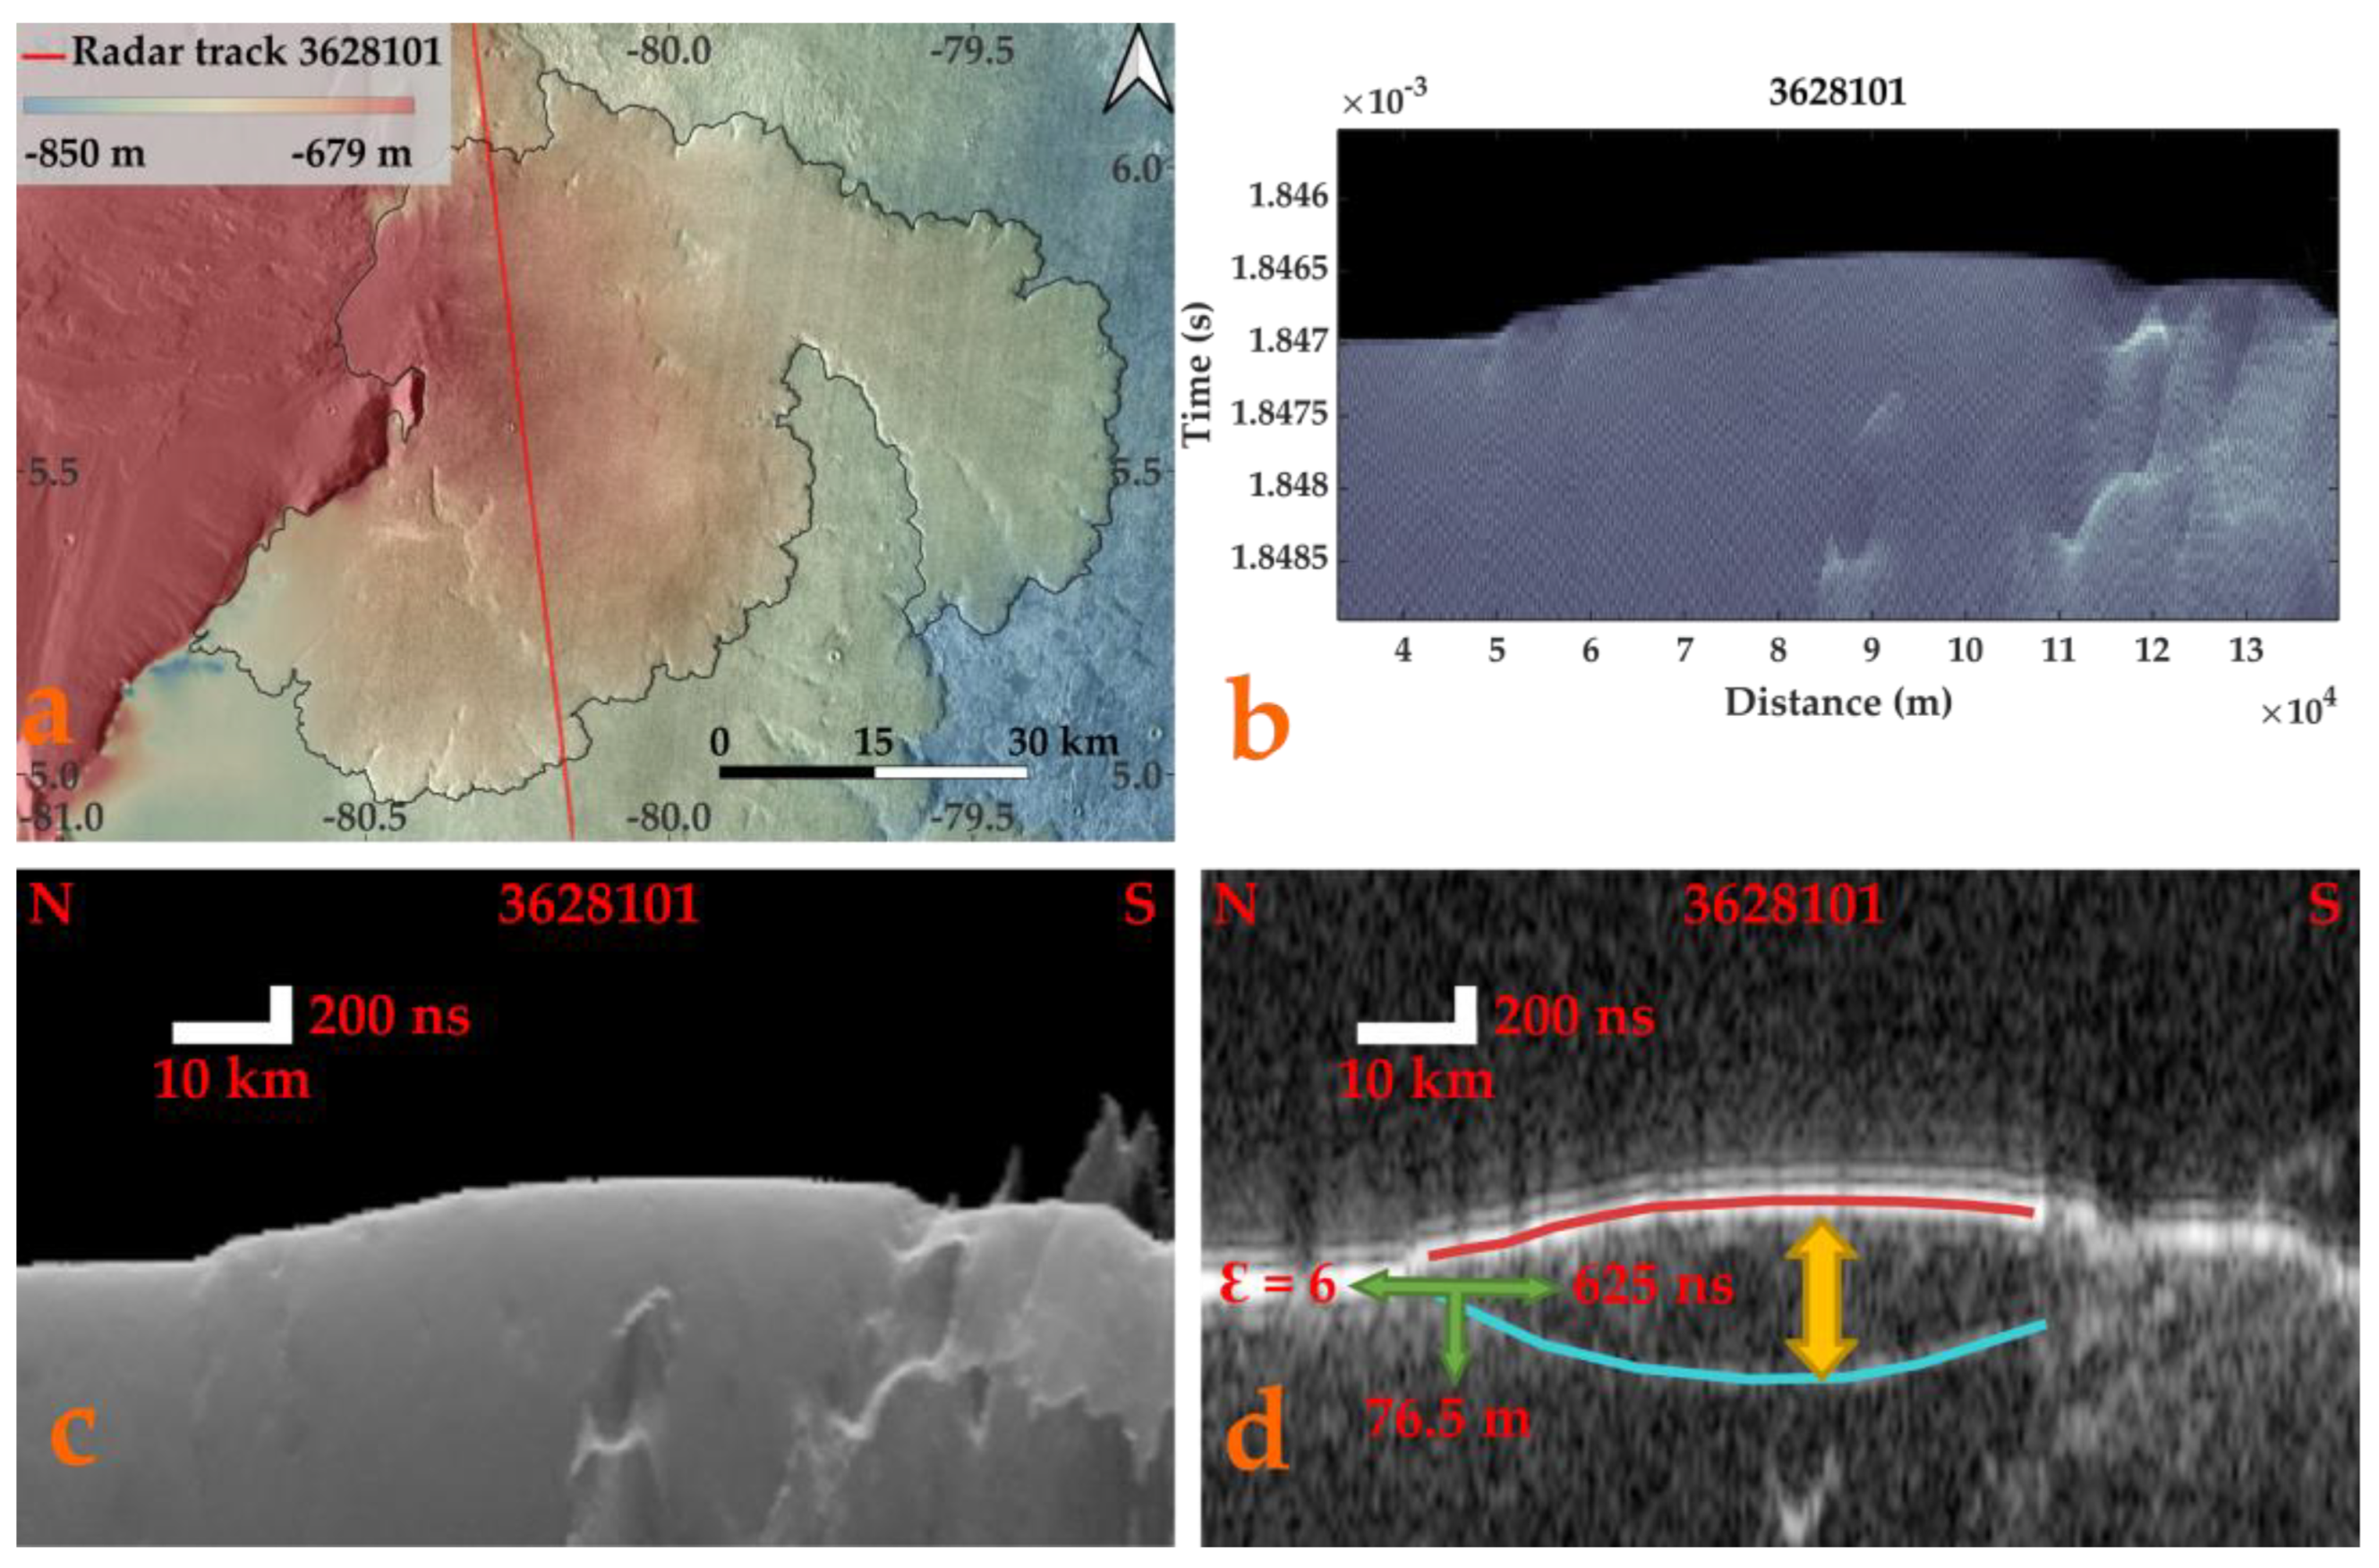
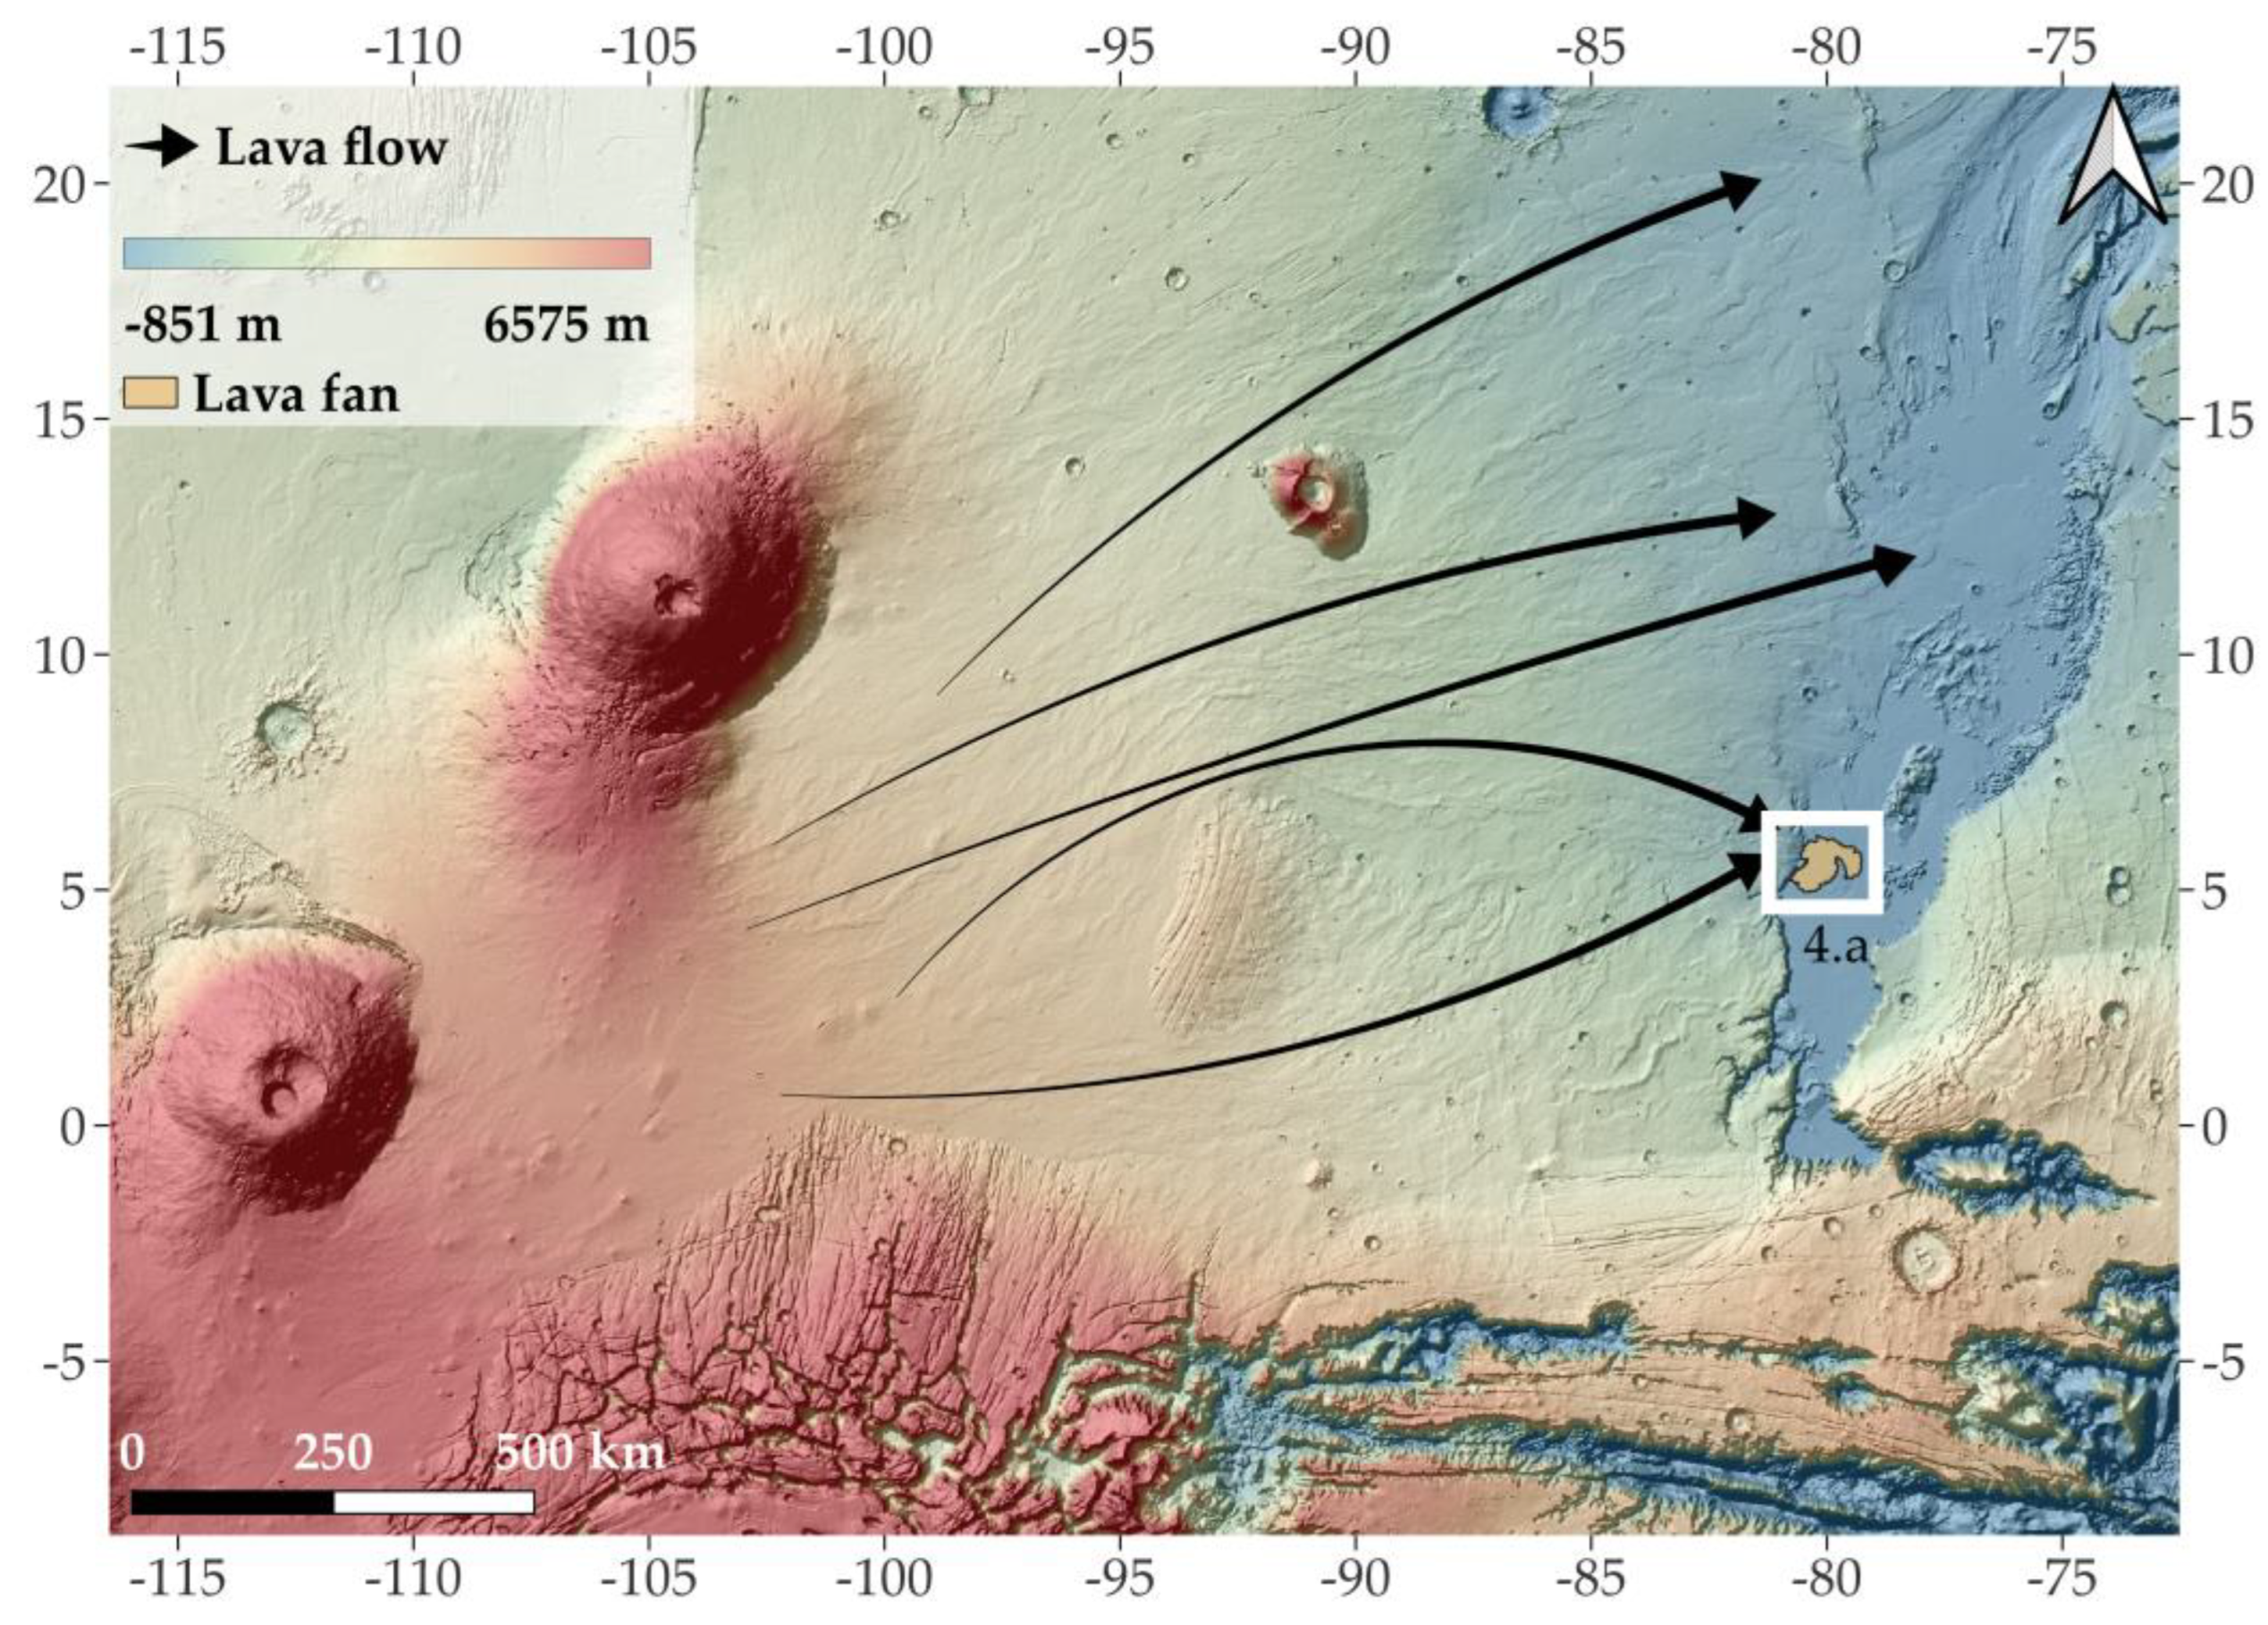
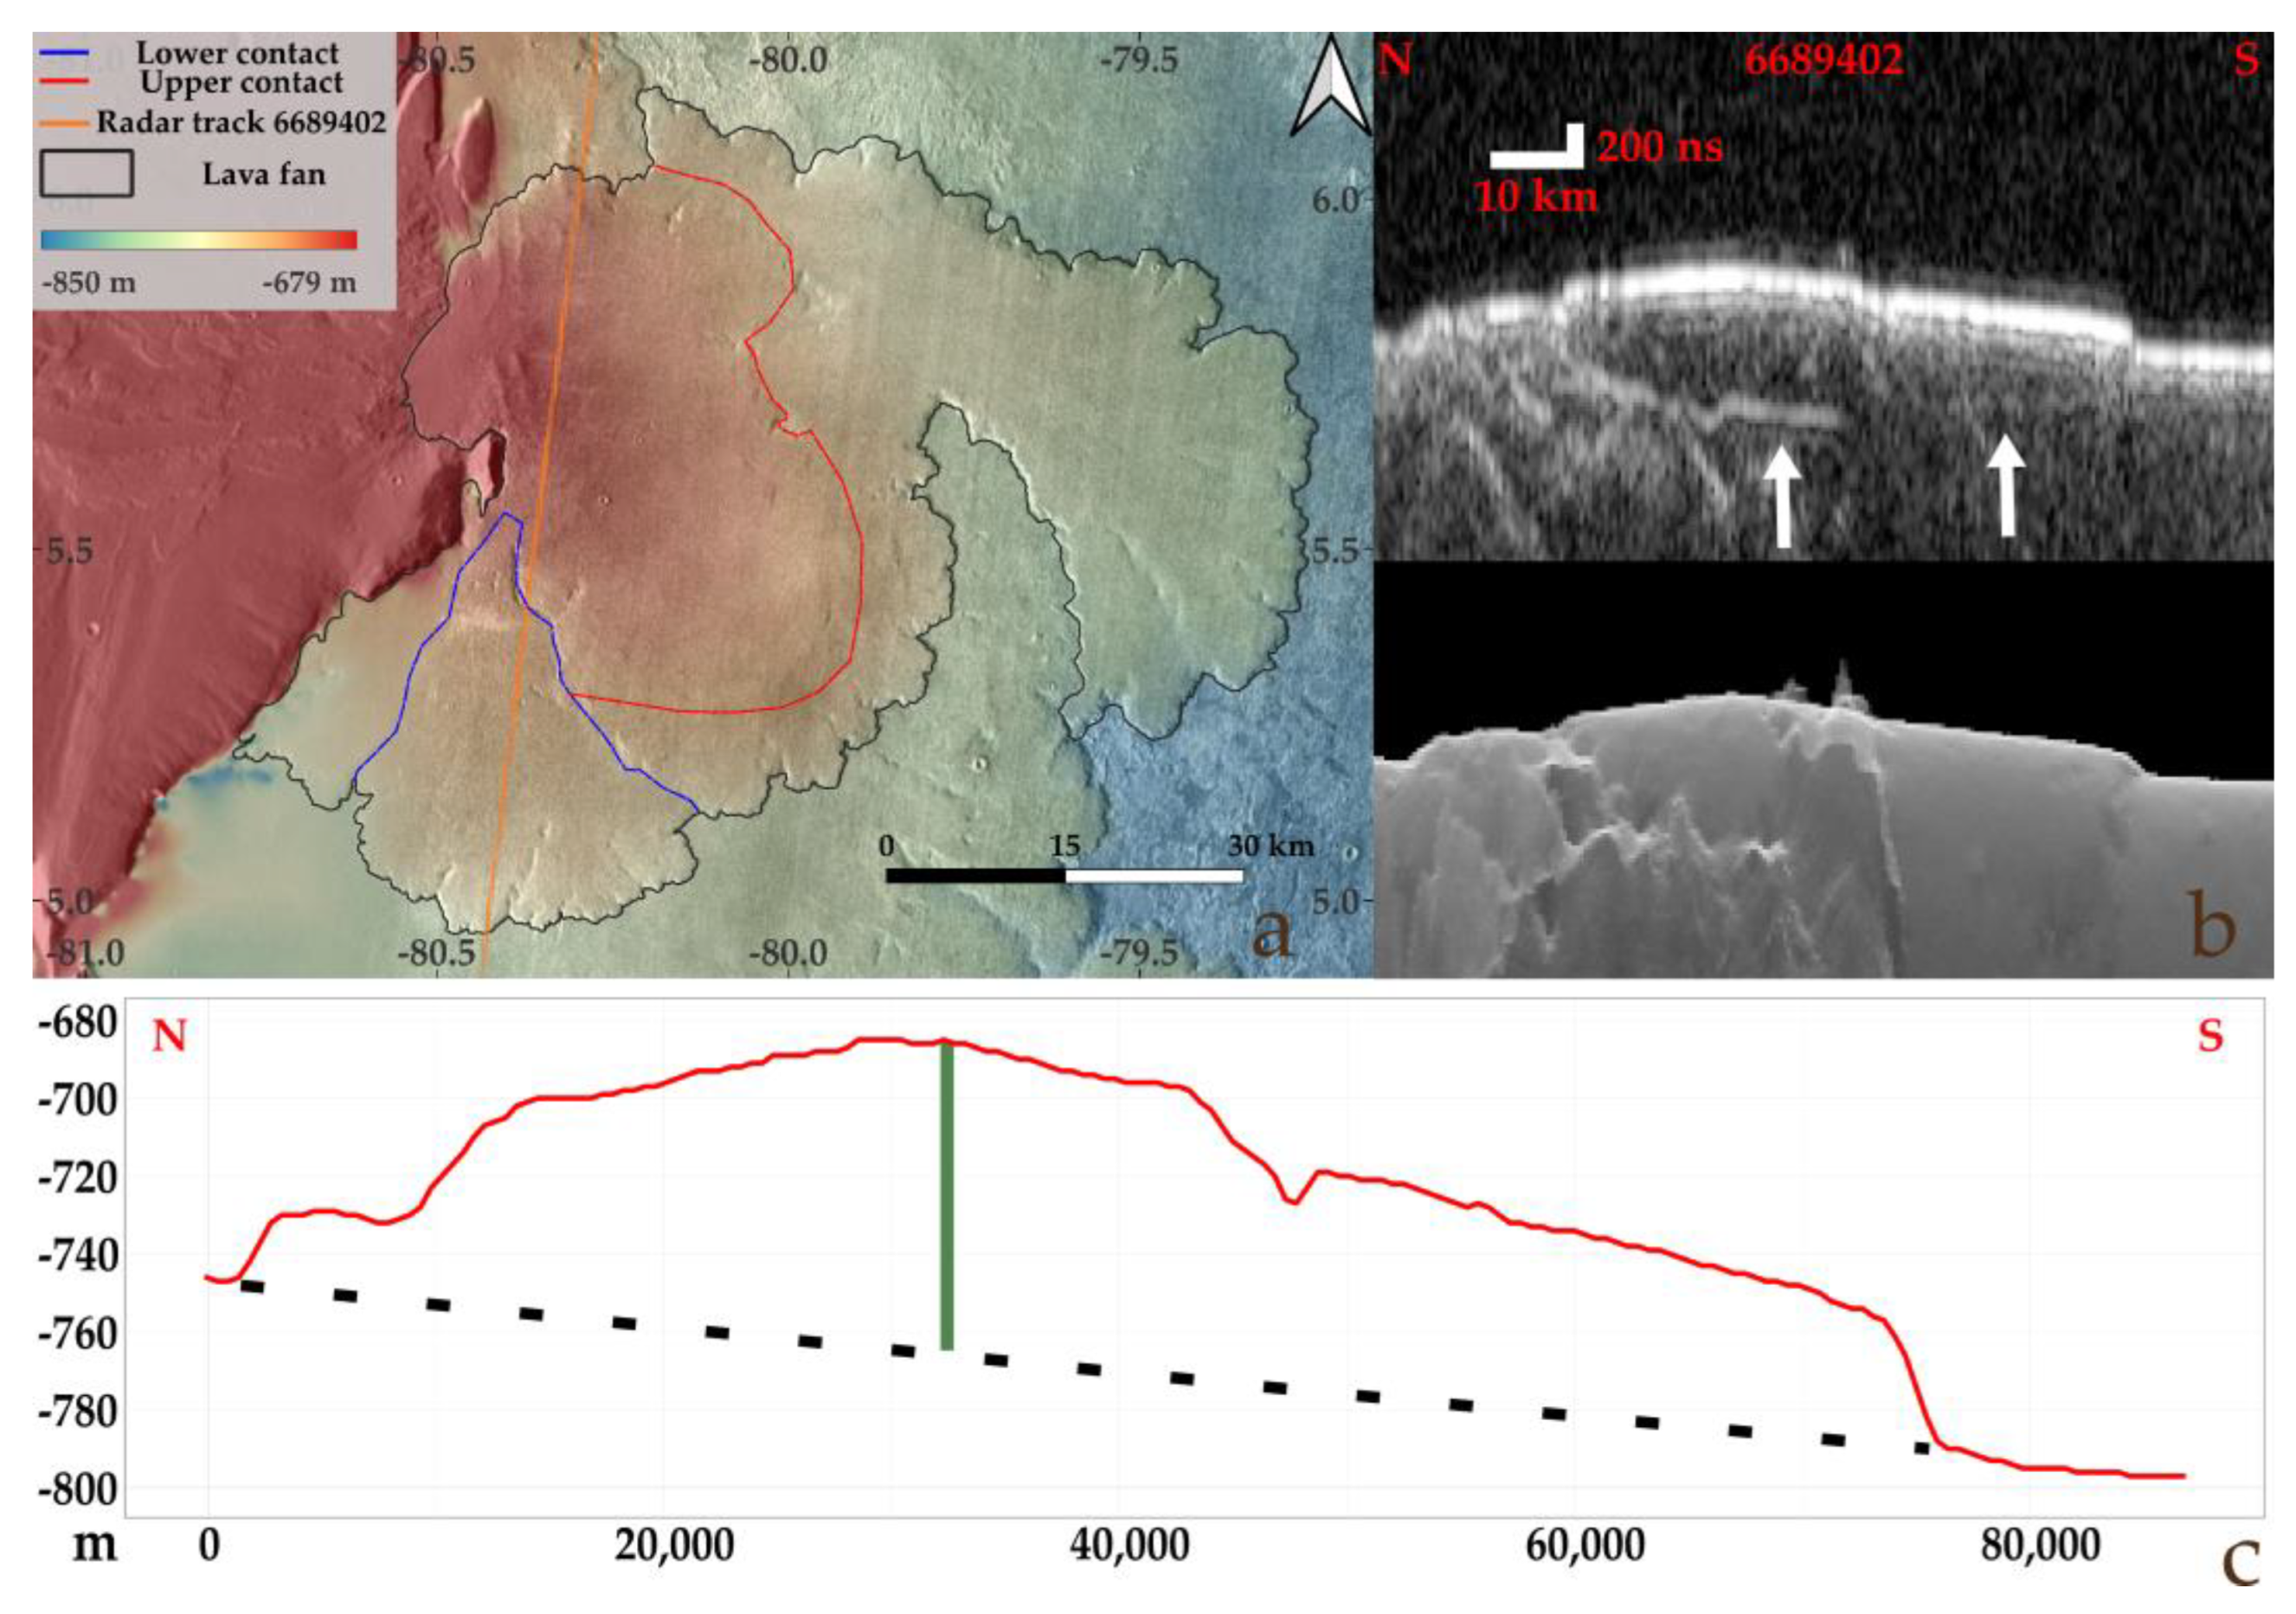
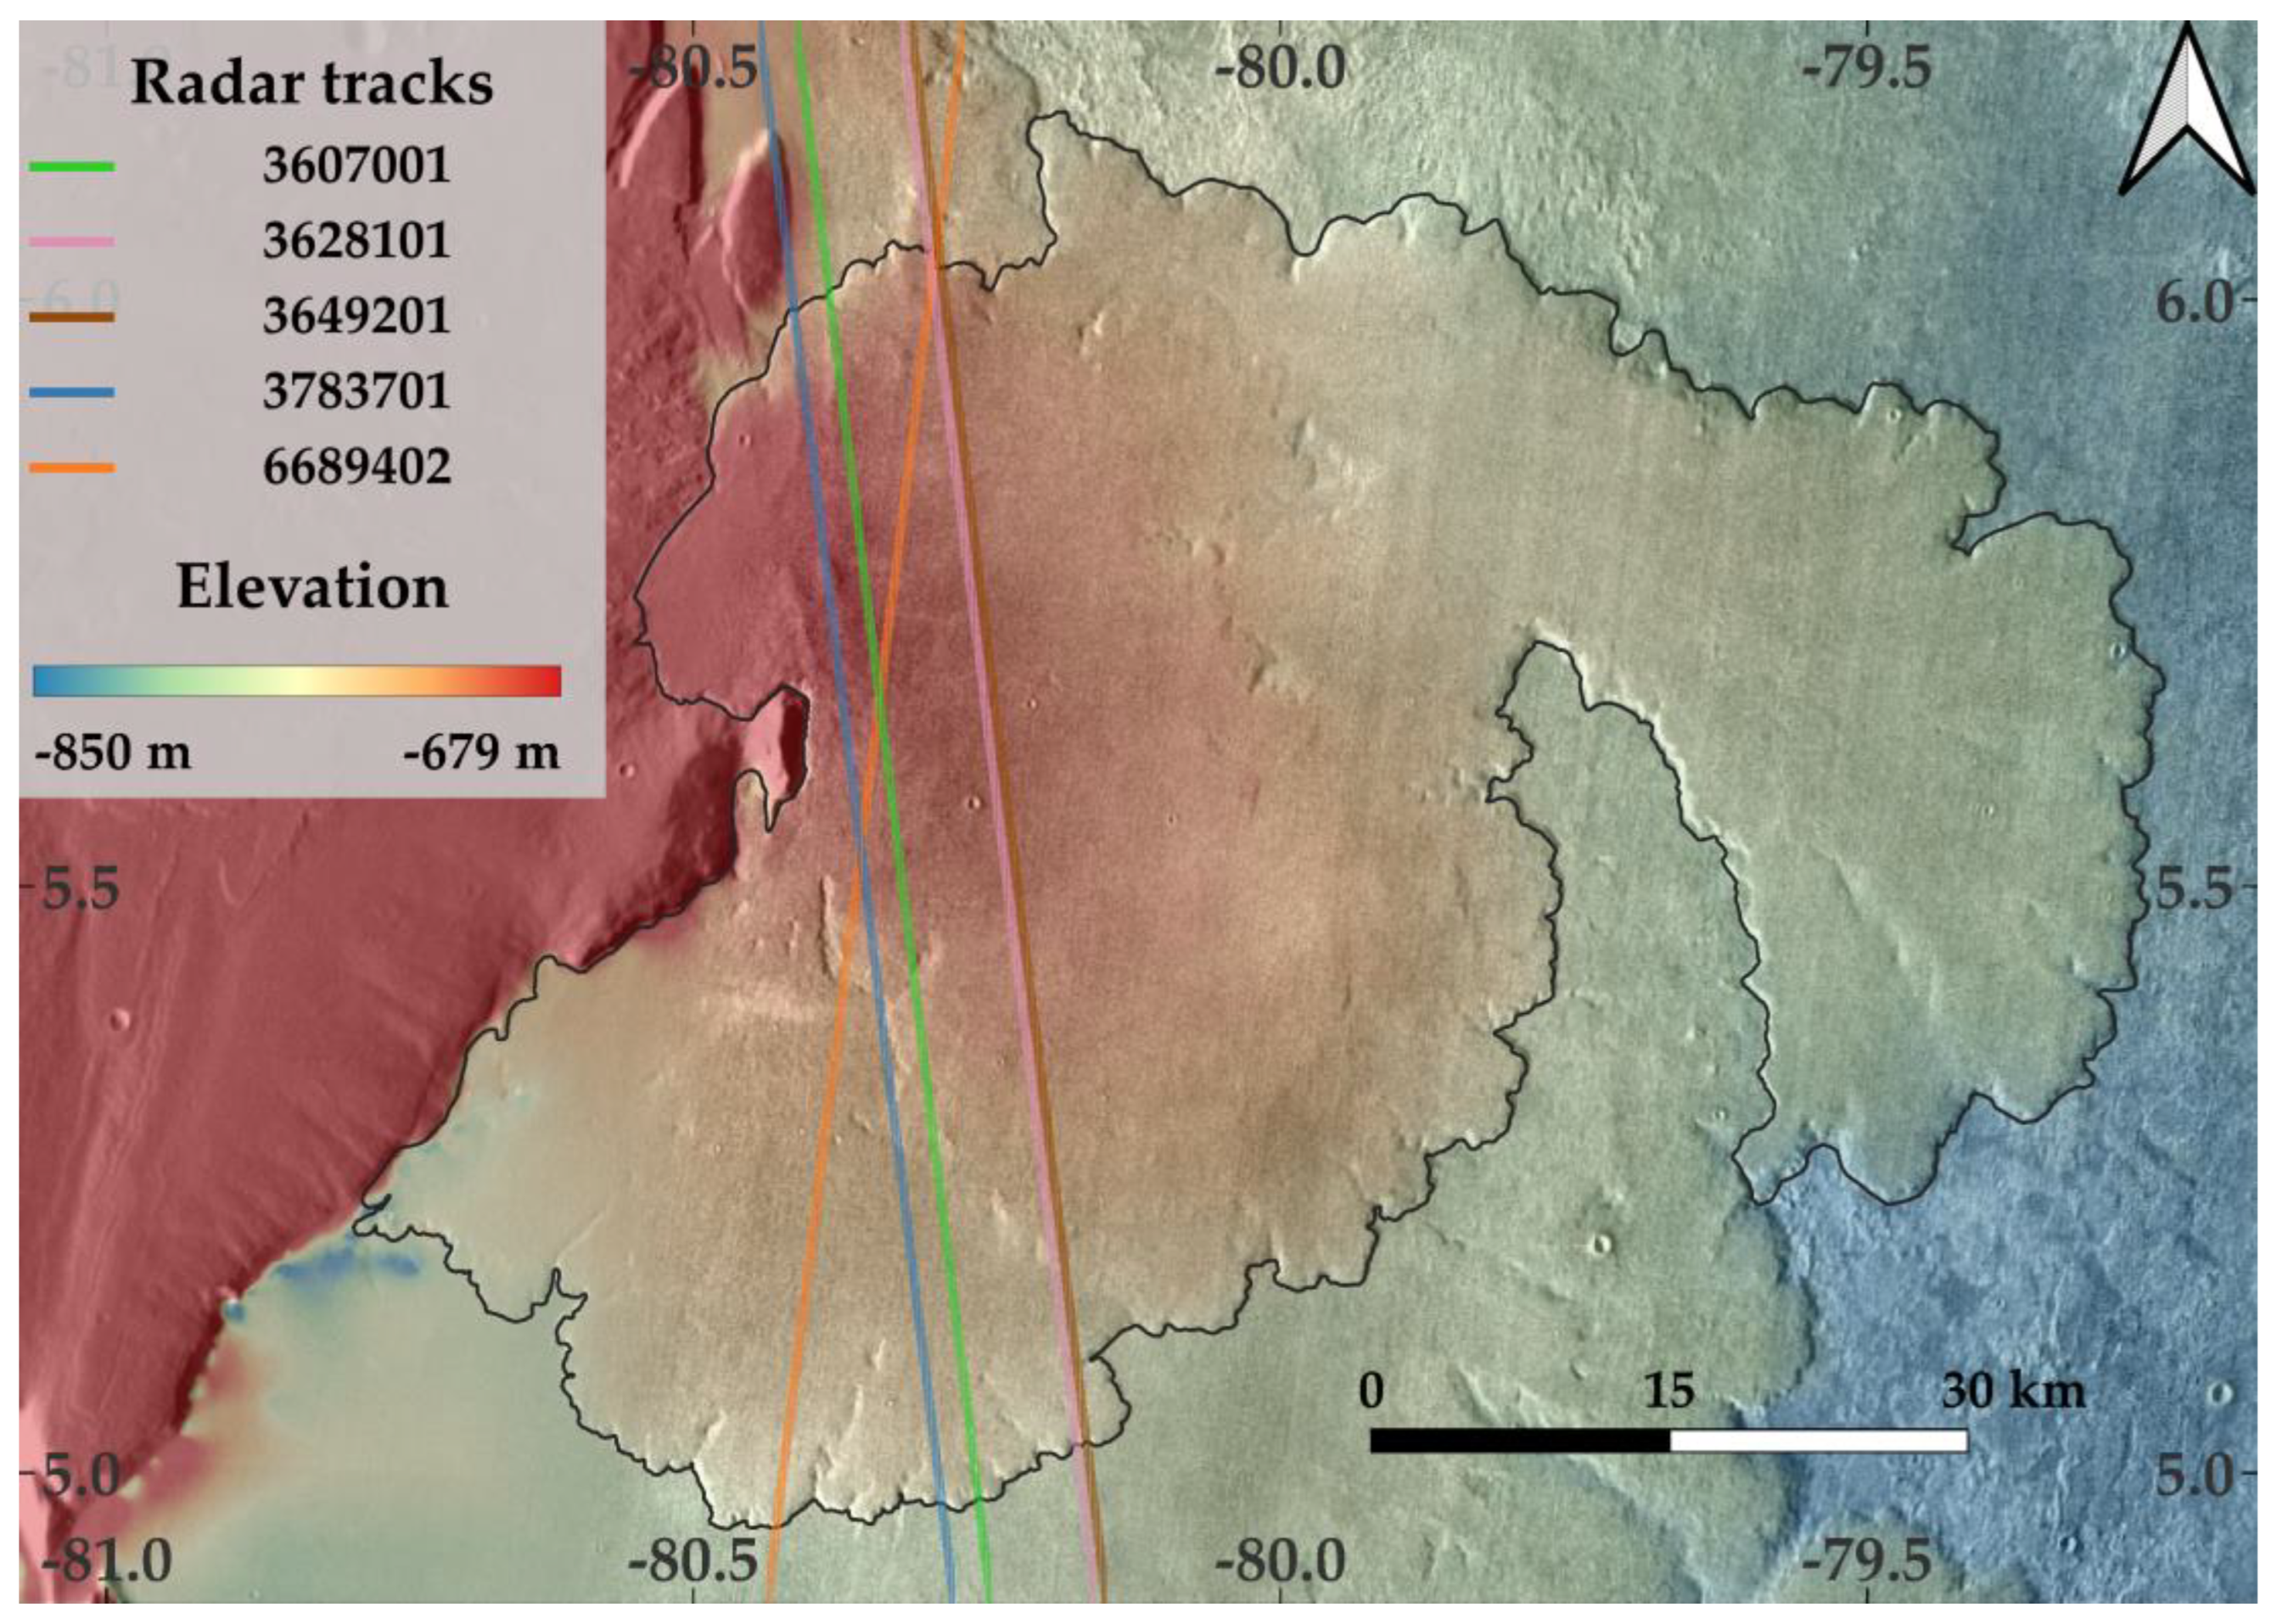
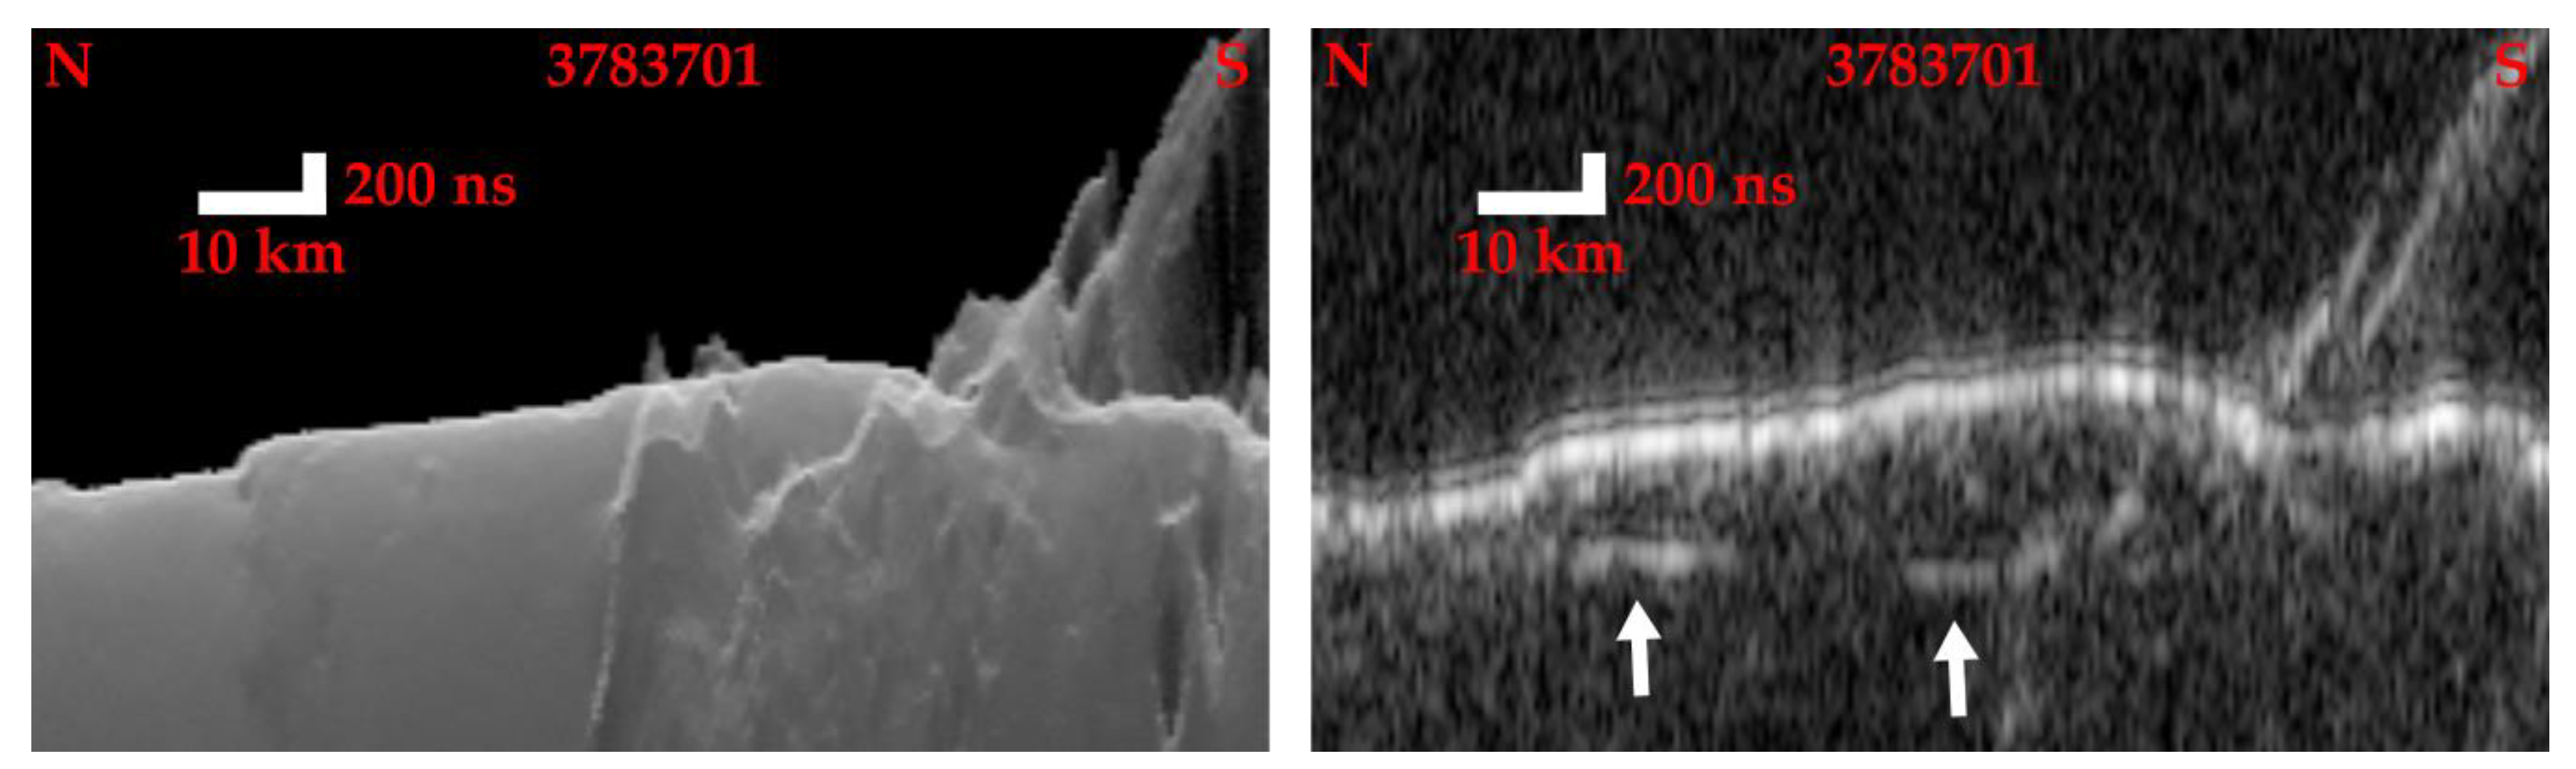
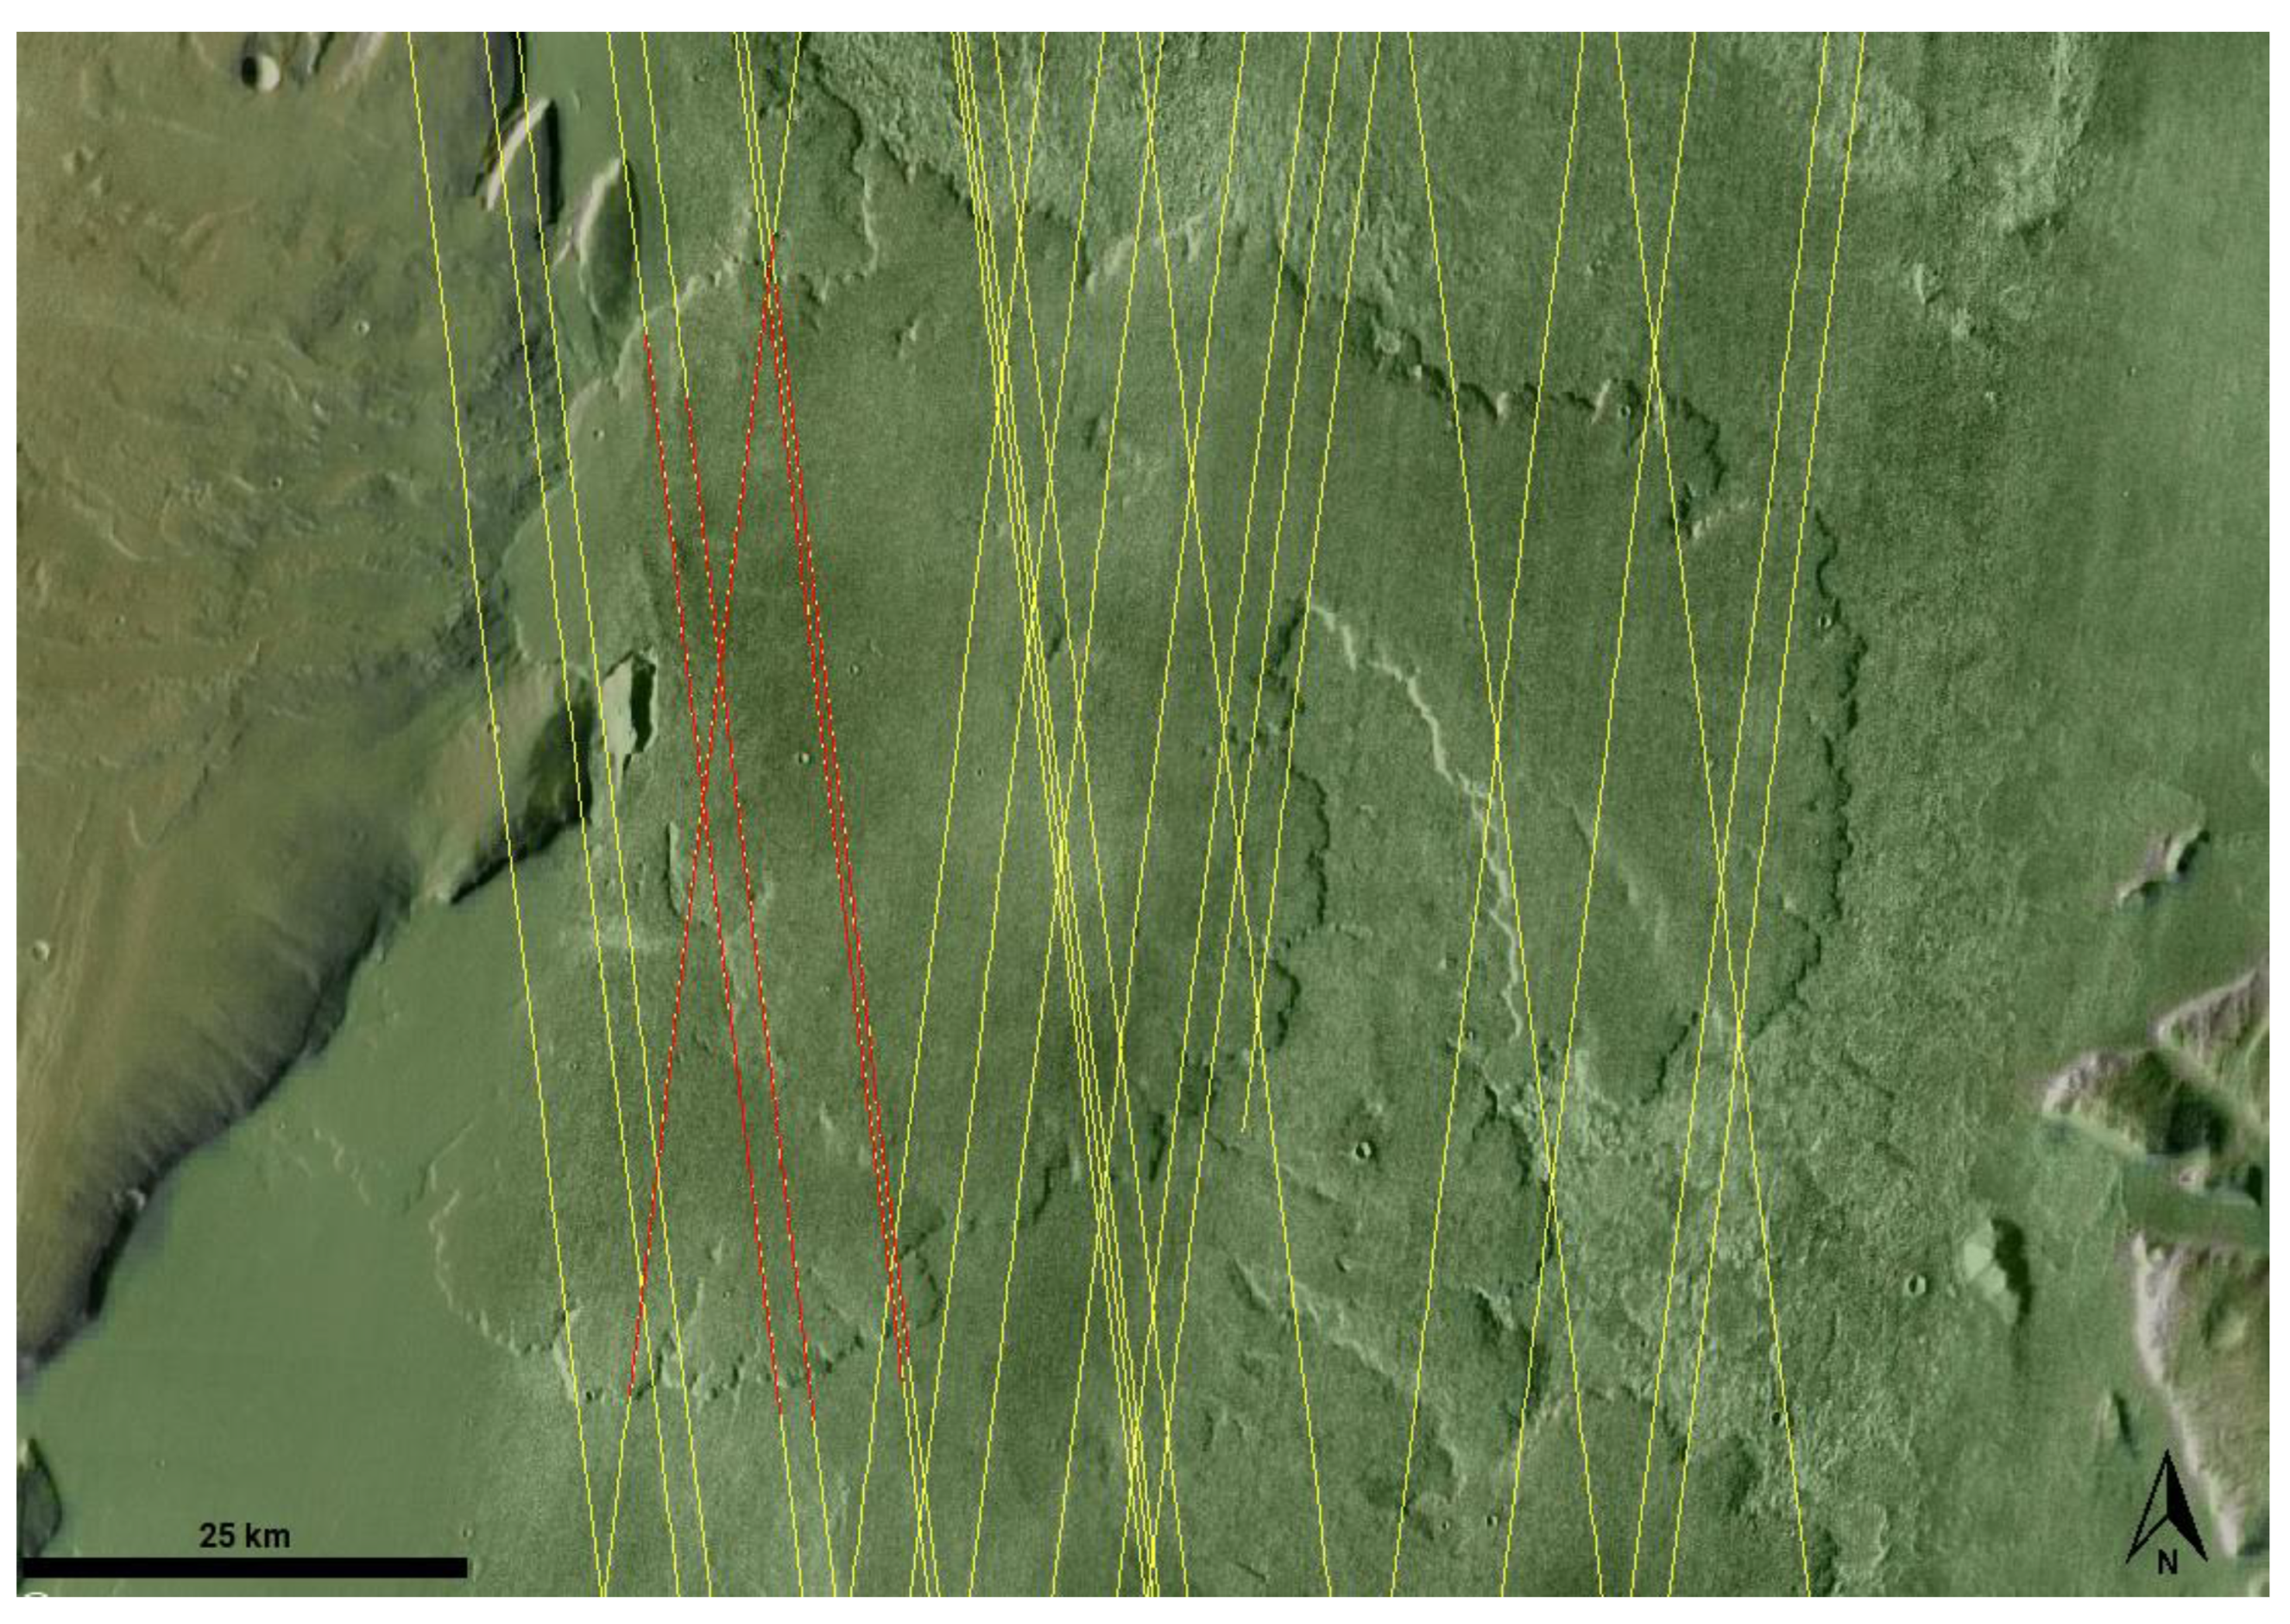
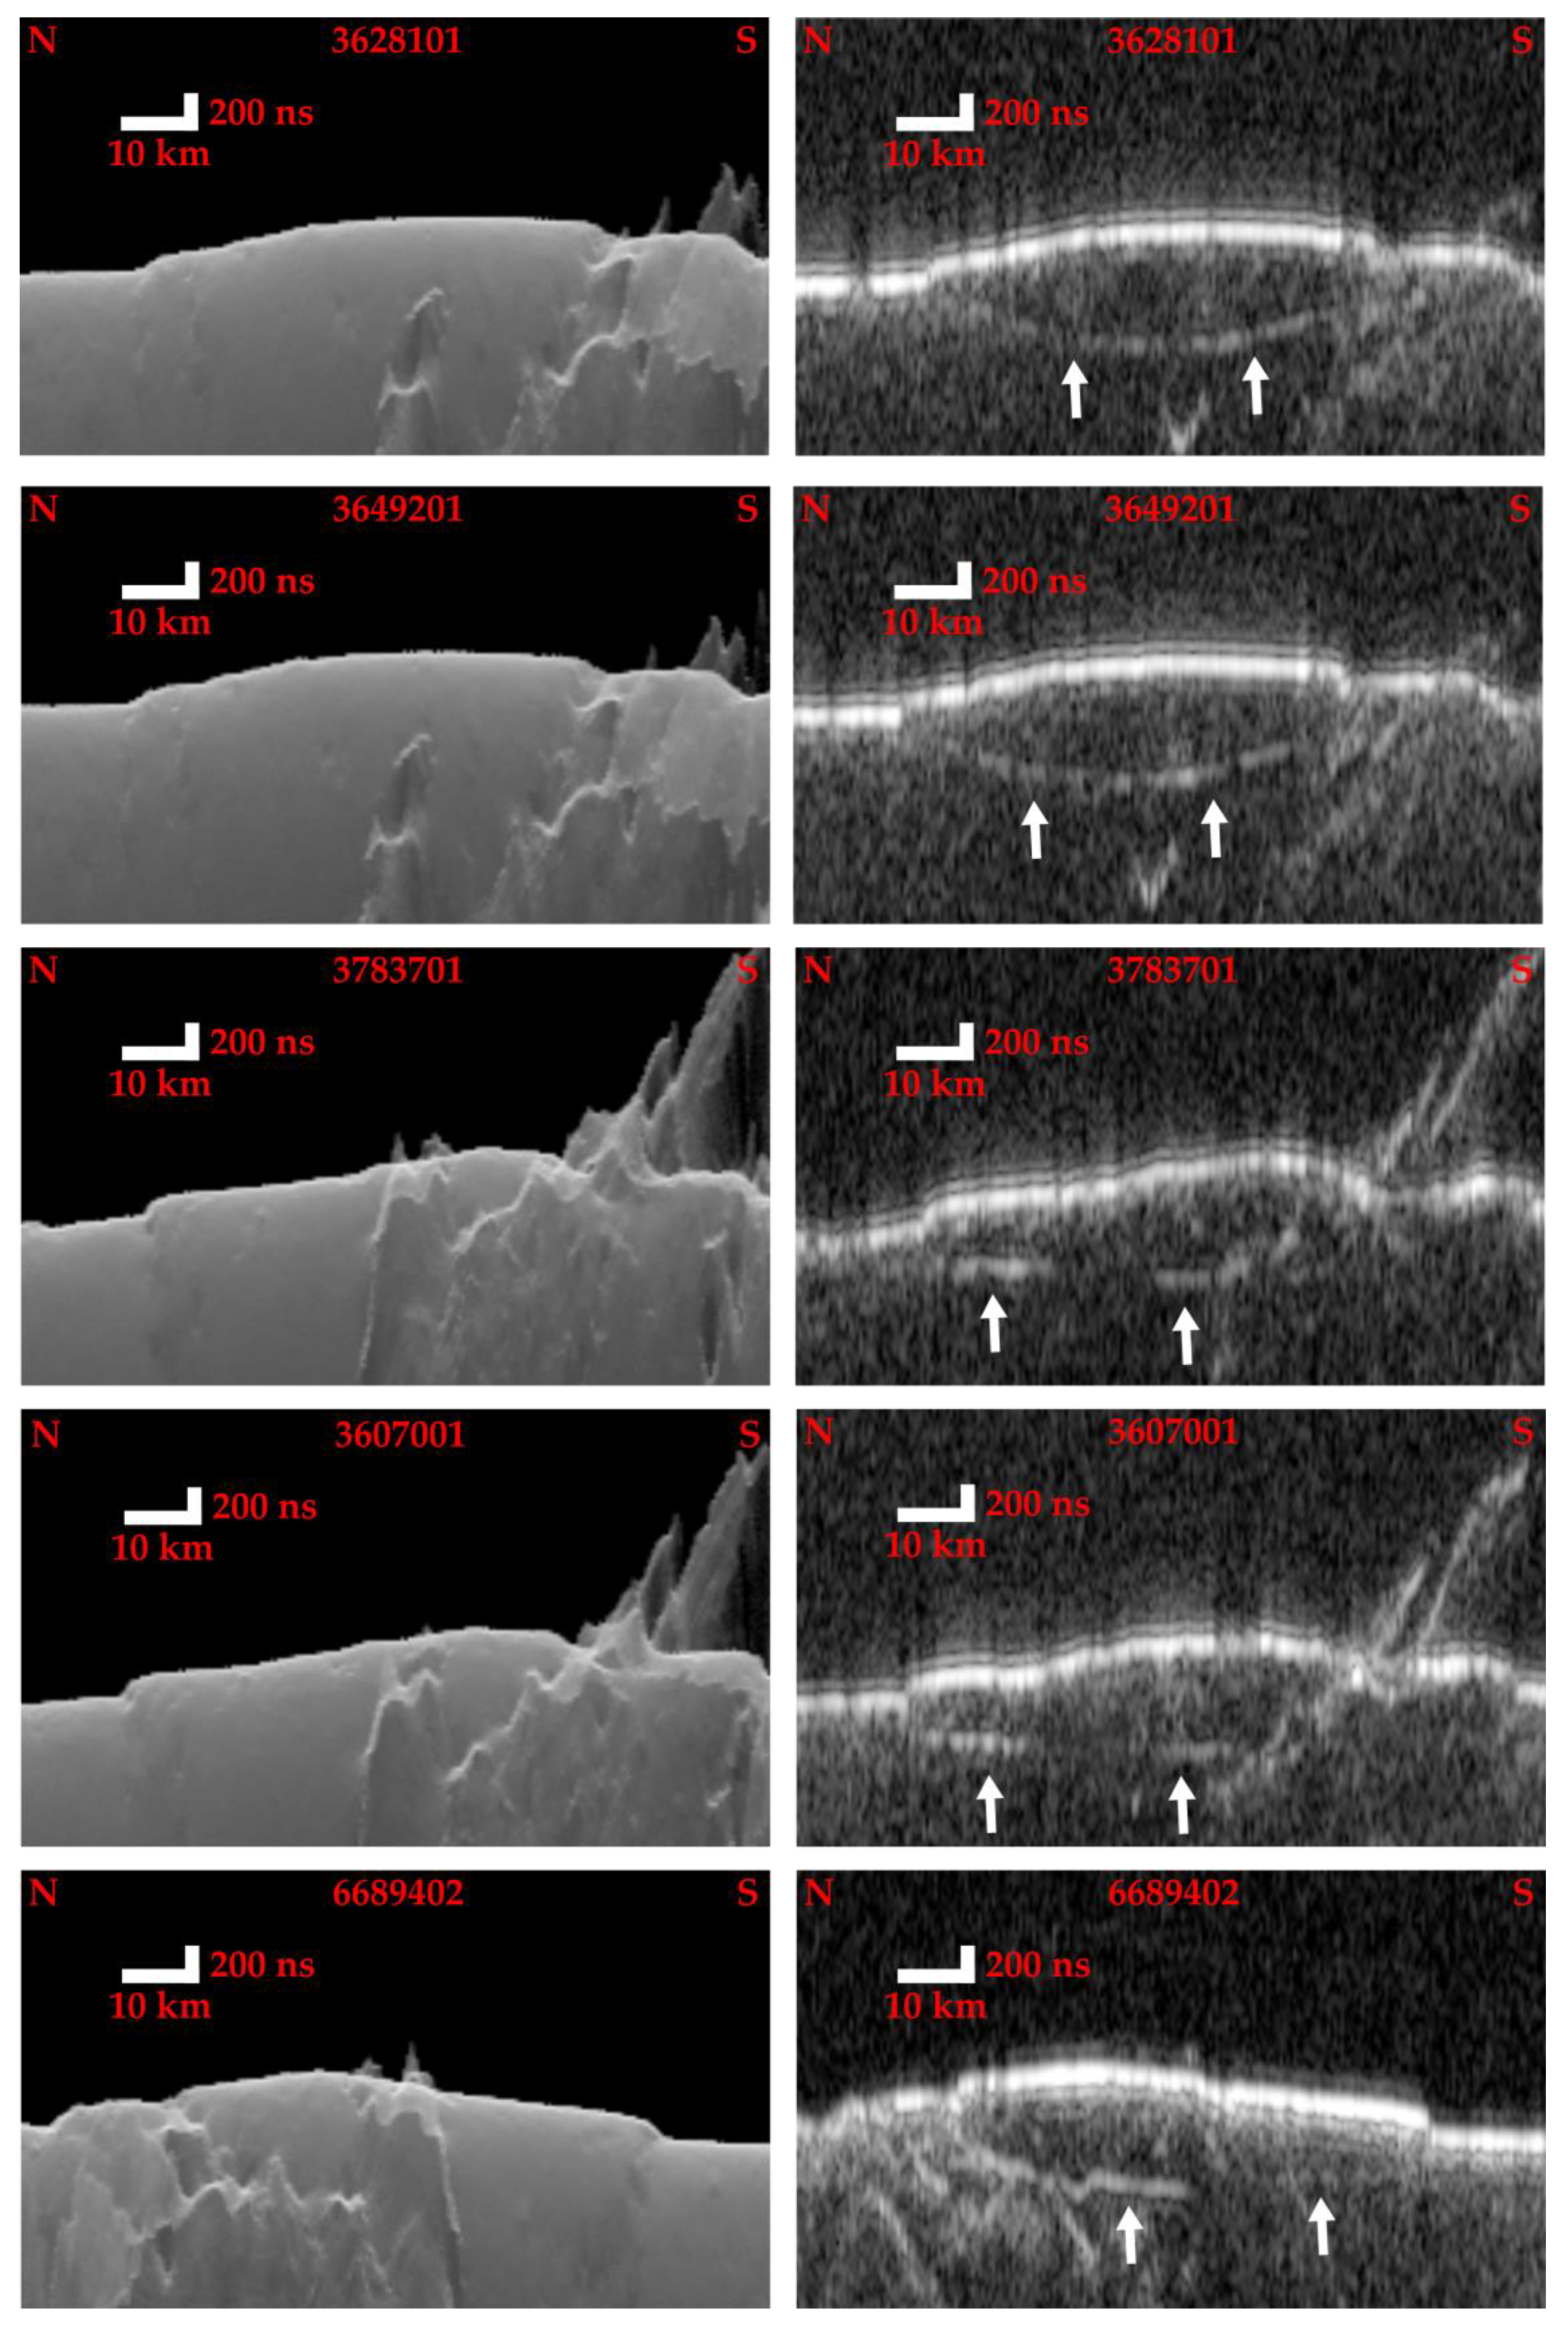
3.1. Lava Fan and Potential Reflectors
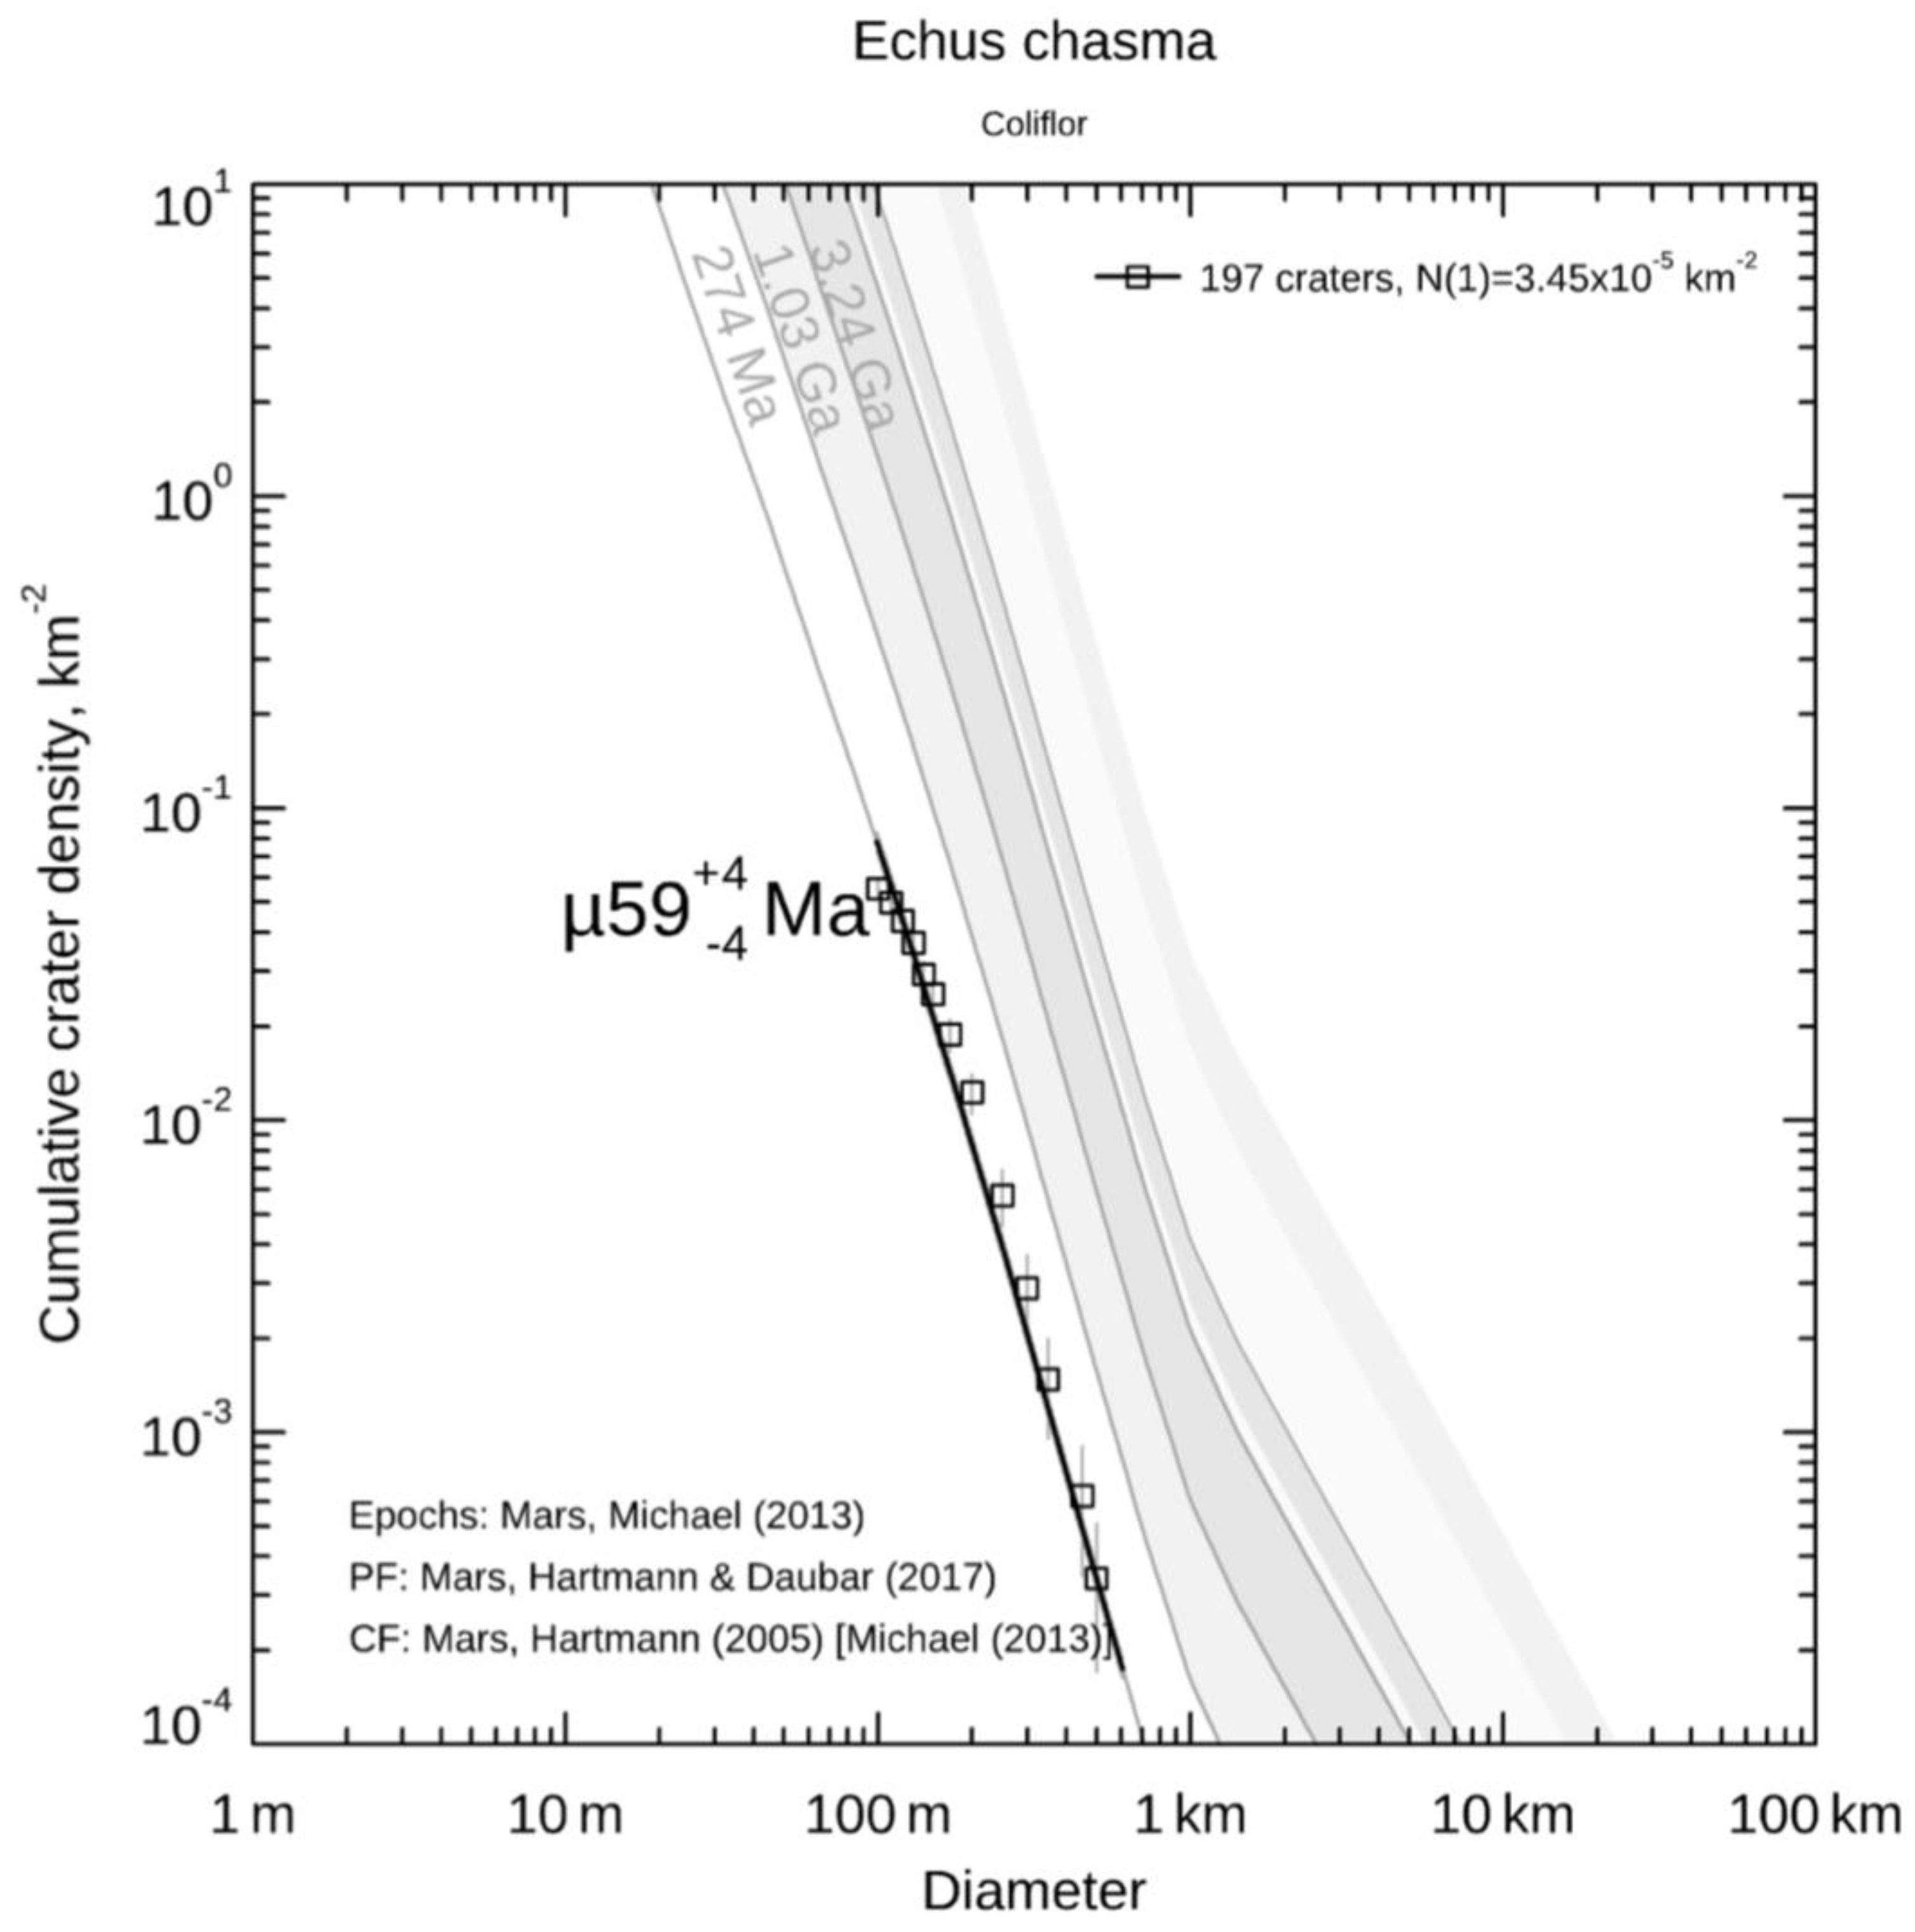
3.2. Lava Fan Age
3.3. Depth and Permittivity of Subsurface Layers
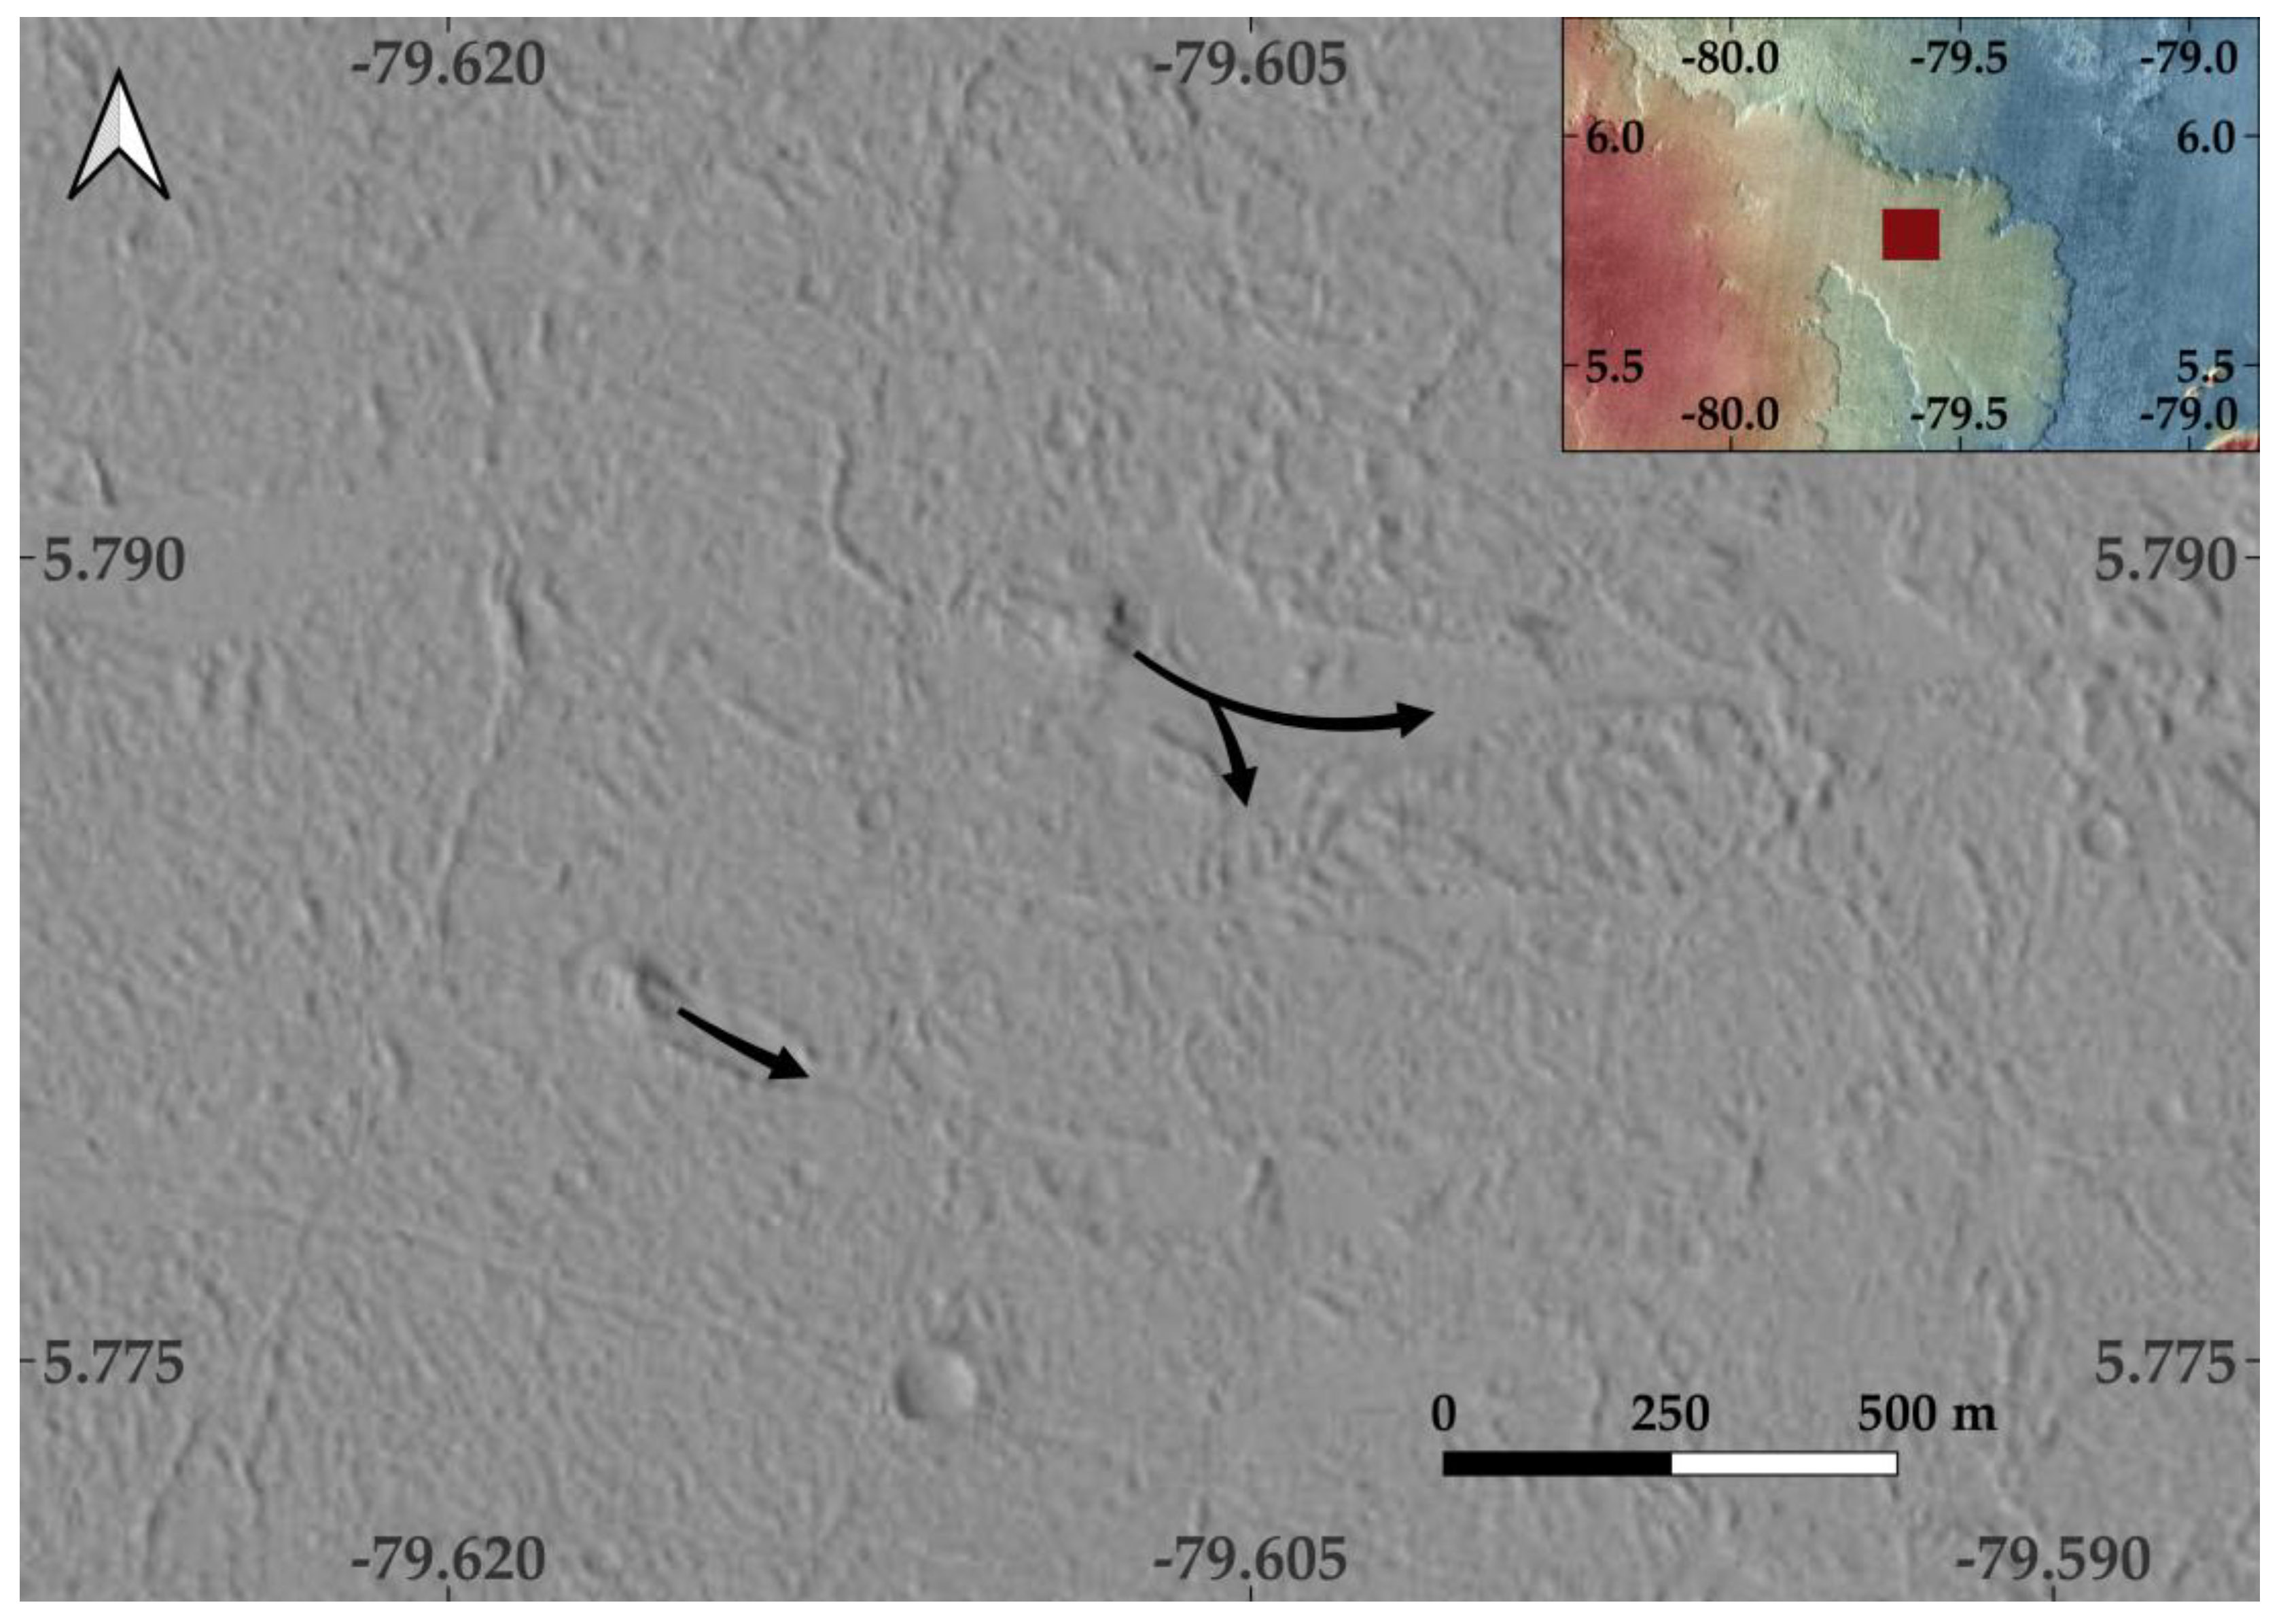
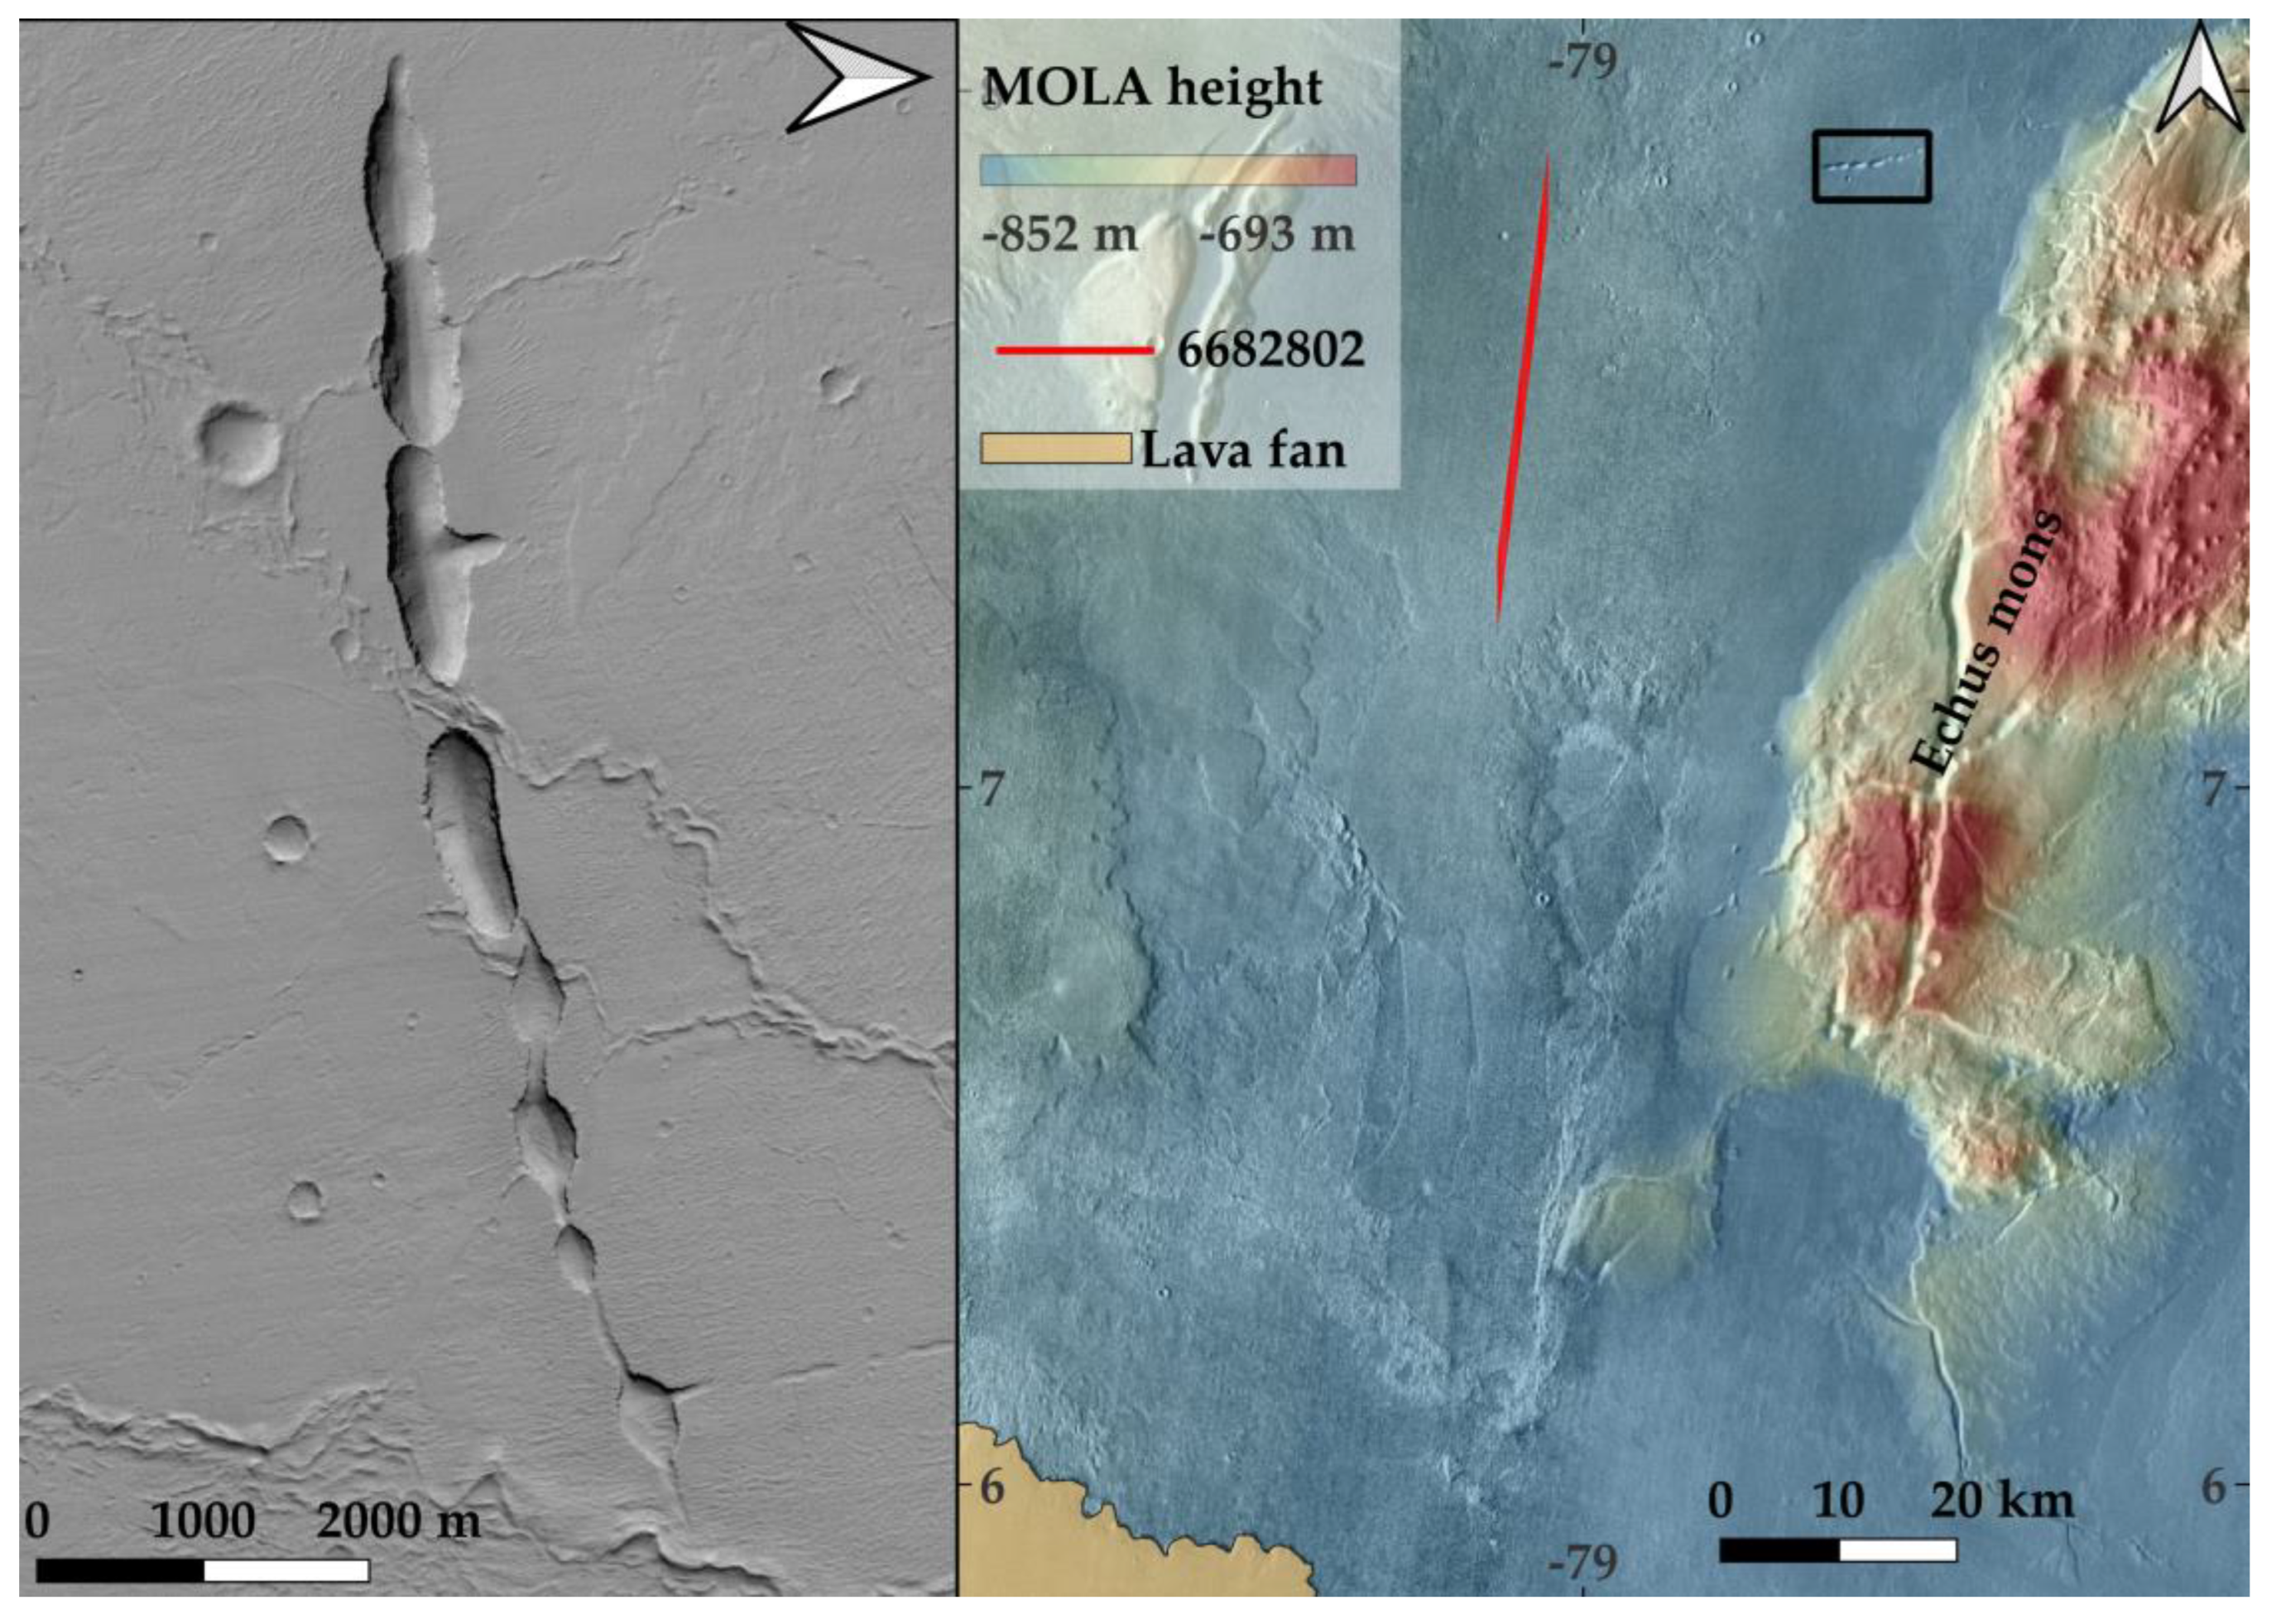
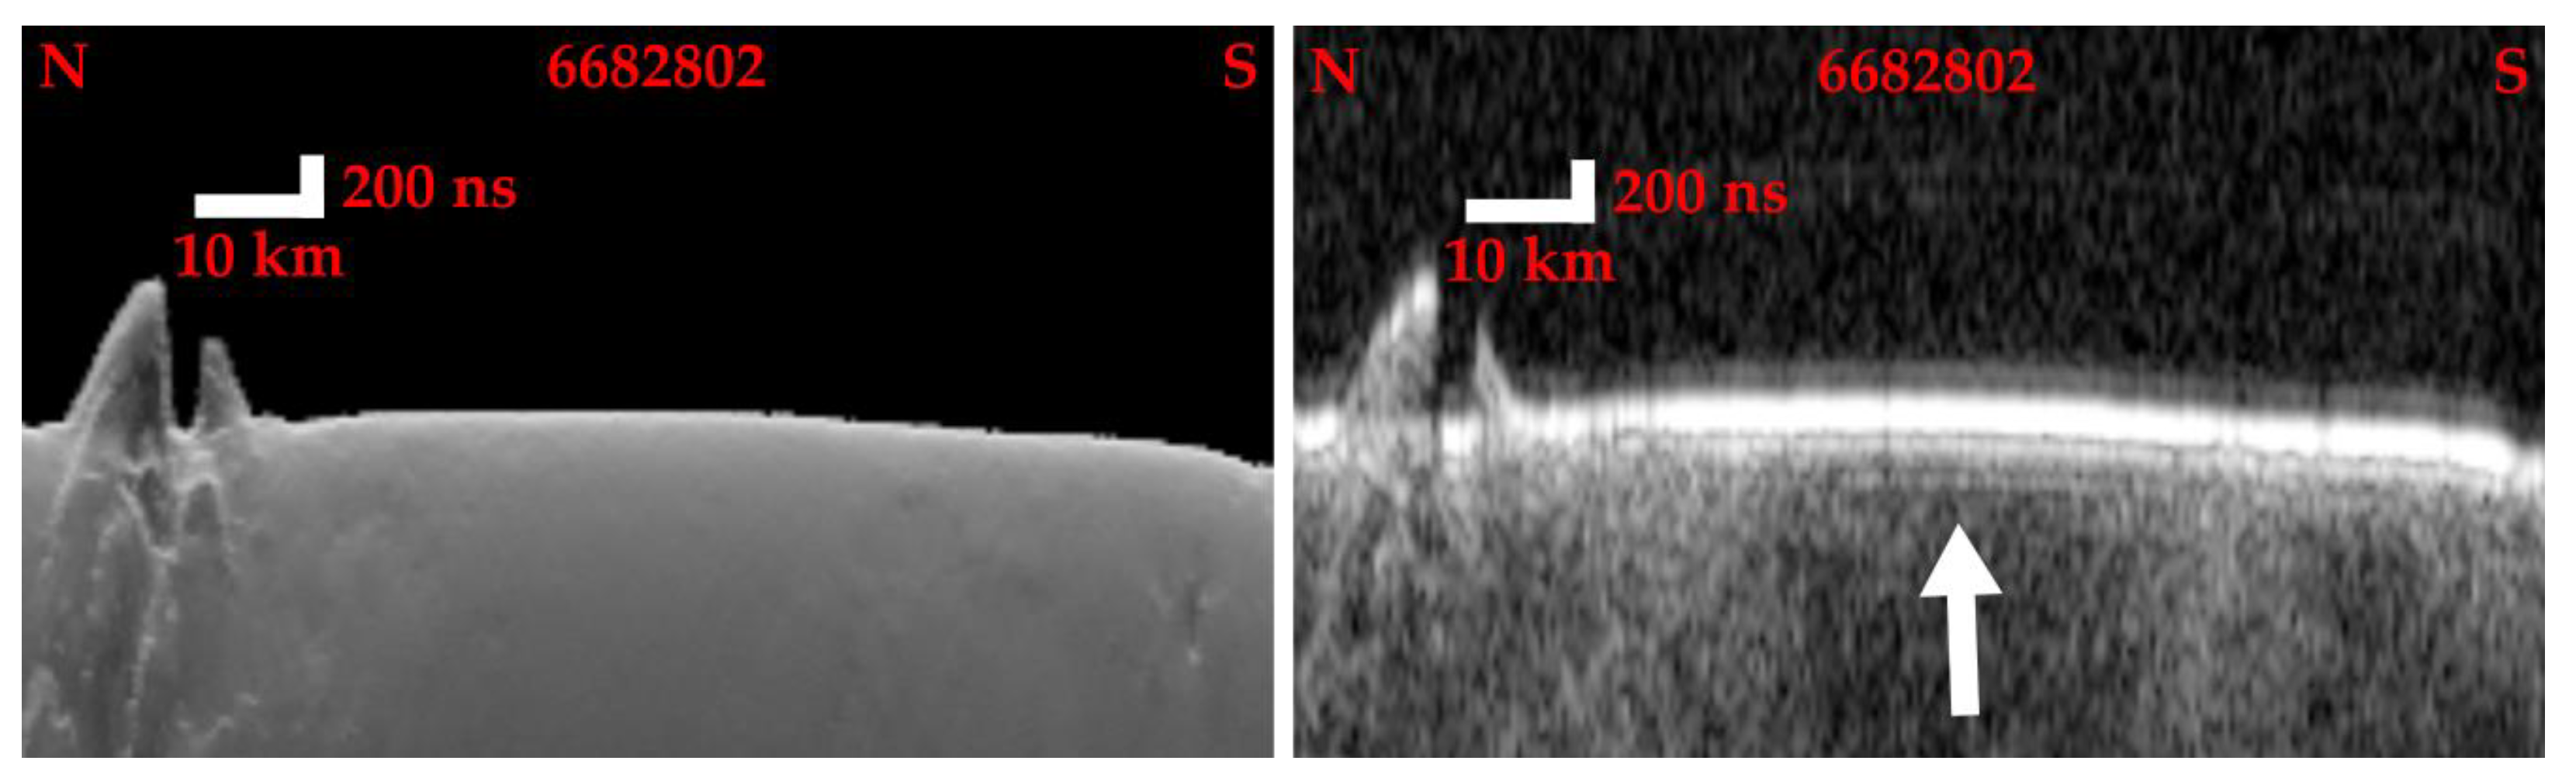
3.4. Northward Terrains: Subsurface Layers and a Volcanic Pit Chain
4. Discussion
5. Conclusions
Author Contributions
Funding
Data Availability Statement
Acknowledgments
Conflicts of Interest
Appendix A

| Product_Id | Orbit_Number | Start_Time | Stop_Time | Min_Lat | Max_Lat | Min_Lon | Max_Lon |
|---|---|---|---|---|---|---|---|
| S_00410001 | 4100 | 11-6-07 23:03 | 11-6-07 23:10 | −2.9203 | 19.8318 | 279.0911 | 281.9278 |
| S_01666601 | 16666 | 15-2-10 3:49 | 15-2-10 3:56 | −1.8656 | 20.3096 | 279.4862 | 282.2436 |
| S_01822902 | 18229 | 16-6-10 22:00 | 16-6-10 22:07 | −3.3982 | 19.6182 | 278.2445 | 281.1048 |
| S_01836702 | 18367 | 27-6-10 16:56 | 27-6-10 17:03 | −2.8902 | 19.8162 | 278.958 | 281.7788 |
| S_01844001 | 18440 | 3-7-10 8:35 | 3-7-10 8:43 | −2.9821 | 19.7163 | 277.6721 | 280.4944 |
| S_02658202 | 26582 | 28-3-12 19:49 | 28-3-12 19:58 | 1.571 | 31.3288 | 280.0101 | 283.8356 |
| S_02679301 | 26793 | 14-4-12 6:24 | 14-4-12 6:34 | −1.017 | 31.3151 | 279.3546 | 283.4961 |
| S_02700402 | 27004 | 30-4-12 16:58 | 30-4-12 17:08 | −0.9893 | 31.3583 | 279.1326 | 283.2766 |
| S_02742601 | 27426 | 2-6-12 14:06 | 2-6-12 14:15 | 1.5615 | 29.6277 | 279.3886 | 282.9802 |
| S_02763702 | 27637 | 19-6-12 0:38 | 19-6-12 0:47 | 1.5327 | 31.3059 | 279.5775 | 283.4053 |
| S_03543701 | 35437 | 16-2-14 18:57 | 16-2-14 19:09 | −19.8196 | 19.7662 | 278.6106 | 283.5576 |
| S_03564801 | 35648 | 5-3-14 5:37 | 5-3-14 5:44 | −2.9793 | 19.7798 | 278.1862 | 281.0312 |
| S_03607001 | 36070 | 7-4-14 2:41 | 7-4-14 3:02 | −19.7852 | 49.6769 | 273.3545 | 282.8225 |
| S_03628101 | 36281 | 23-4-14 13:14 | 23-4-14 13:36 | −19.7785 | 49.6844 | 273.4422 | 282.9112 |
| S_03649201 | 36492 | 9-5-14 23:48 | 10-5-14 0:00 | −19.799 | 19.7861 | 277.974 | 282.9227 |
| S_03684801 | 36848 | 6-6-14 17:38 | 6-6-14 17:50 | −19.8186 | 19.7668 | 277.7591 | 282.7086 |
| S_03699302 | 36993 | 18-6-14 0:55 | 18-6-14 1:02 | −3.016 | 19.7426 | 278.8105 | 281.6553 |
| S_03762601 | 37626 | 6-8-14 8:35 | 6-8-14 8:47 | −19.8187 | 19.7657 | 277.7287 | 282.6791 |
| S_03783701 | 37837 | 22-8-14 19:08 | 22-8-14 19:21 | −19.8313 | 19.7534 | 277.848 | 282.7982 |
| S_03797501 | 37975 | 2-9-14 14:01 | 2-9-14 14:12 | 5.2137 | 39.3474 | 280.1568 | 284.7314 |
| S_03804802 | 38048 | 8-9-14 5:40 | 8-9-14 5:53 | −21.7875 | 19.7817 | 278.1784 | 283.3845 |
| S_03922201 | 39222 | 8-12-14 16:26 | 8-12-14 16:46 | −14.4381 | 49.6829 | 273.8819 | 282.598 |
| S_06627401 | 66274 | 15-9-20 14:14 | 15-9-20 14:27 | −12.8326 | 29.7481 | 277.1595 | 282.6131 |
| S_06682802 | 66828 | 28-10-20 17:55 | 28-10-20 18:04 | 0.0274 | 29.7475 | 279.9733 | 283.8164 |
| S_06689402 | 66894 | 2-11-20 21:17 | 2-11-20 21:27 | 0.0246 | 29.7443 | 278.9569 | 282.8028 |
| S_06938802 | 69388 | 16-5-21 2:10 | 16-5-21 2:20 | 0.036 | 29.7556 | 279.9379 | 283.7863 |
| S_07187401 | 71874 | 25-11-21 18:10 | 25-11-21 18:15 | −3.9506 | 13.7761 | 278.9445 | 281.1334 |


References
- Carr, M.H. The Fluvial History of Mars. Philos. Trans. R. Soc. Math. Phys. Eng. Sci. 2012, 370, 2193–2215. [Google Scholar] [CrossRef] [Green Version]
- Cassanelli, J.P.; Head, J.W. Glaciovolcanism in the Tharsis Volcanic Province of Mars: Implications for Regional Geology and Hydrology. Planet. Space Sci. 2019, 169, 45–69. [Google Scholar] [CrossRef]
- Hepburn, A.J.; Ng, F.S.L.; Holt, T.O.; Hubbard, B. Late Amazonian Ice Survival in Kasei Valles, Mars. J. Geophys. Res. Planets 2020, 125, e2020JE006531. [Google Scholar] [CrossRef]
- Chapman, M.G.; Neukum, G.; Dumke, A.; Michael, G.; van Gasselt, S.; Kneissl, T.; Zuschneid, W.; Hauber, E.; Mangold, N. Amazonian Geologic History of the Echus Chasma and Kasei Valles System on Mars: New Data and Interpretations. Earth Planet. Sci. Lett. 2010, 294, 238–255. [Google Scholar] [CrossRef]
- Chapman, M.G.; Neukum, G.; Dumke, A.; Michael, G.; van Gasselt, S.; Kneissl, T.; Zuschneid, W.; Hauber, E.; Ansan, V.; Mangold, N.; et al. Noachian–Hesperian Geologic History of the Echus Chasma and Kasei Valles System on Mars: New Data and Interpretations. Earth Planet. Sci. Lett. 2010, 294, 256–271. [Google Scholar] [CrossRef] [Green Version]
- Plaut, J.J.; Safaeinili, A.; Holt, J.W.; Phillips, R.J.; Head, J.W.; Seu, R.; Putzig, N.E.; Frigeri, A. Radar Evidence for Ice in Lobate Debris Aprons in the Mid-Northern Latitudes of Mars: RADAR EVIDENCE FOR MID-LATITUDE MARS ICE. Geophys. Res. Lett. 2009, 36. [Google Scholar] [CrossRef] [Green Version]
- Dundas, C.M.; Cushing, G.E.; Keszthelyi, L.P. The Flood Lavas of Kasei Valles, Mars. Icarus 2019, 321, 346–357. [Google Scholar] [CrossRef]
- Richardson, J.A.; Wilson, J.A.; Connor, C.B.; Bleacher, J.E.; Kiyosugi, K. Recurrence Rate and Magma Effusion Rate for the Latest Volcanism on Arsia Mons, Mars. Earth Planet. Sci. Lett. 2017, 458, 170–178. [Google Scholar] [CrossRef] [Green Version]
- Mouginis-Mark, P.J.; Rowland, S.K. Lava Flows at Arsia Mons, Mars: Insights from a Graben Imaged by HiRISE. Icarus 2008, 198, 27–36. [Google Scholar] [CrossRef]
- Hiesinger, H.; Head, J.W.; Neukum, G. Young Lava Flows on the Eastern Flank of Ascraeus Mons: Rheological Properties Derived from High Resolution Stereo Camera (HRSC) Images and Mars Orbiter Laser Altimeter (MOLA) Data. J. Geophys. Res. 2007, 112, E05011. [Google Scholar] [CrossRef] [Green Version]
- Carter, L.M.; Campbell, B.A.; Holt, J.W.; Phillips, R.J.; Putzig, N.E.; Mattei, S.; Seu, R.; Okubo, C.H.; Egan, A.F. Dielectric Properties of Lava Flows West of Ascraeus Mons, Mars. Geophys. Res. Lett. 2009, 36, L23204. [Google Scholar] [CrossRef] [Green Version]
- Shoemaker, E.S.; Carter, L.M.; Garry, W.B.; Morgan, G.A.; Plaut, J.J. New Insights Into Subsurface Stratigraphy Northwest of Ascraeus Mons, Mars, Using the SHARAD and MARSIS Radar Sounders. J. Geophys. Res. Planets 2022, 127, e2022JE007210. [Google Scholar] [CrossRef]
- Rust, A.C.; Russell, J.K.; Knight, R.J. Dielectric Constant as a Predictor of Porosity in Dry Volcanic Rocks. J. Volcanol. Geotherm. Res. 1999, 91, 79–96. [Google Scholar] [CrossRef]
- Cushing, G. Mars Global Cave Candidate Catalog Archive Bundle. US Geol. Surv. Retrieved Astrogeology Usgs GovsearchmapMarsMarsCaveCatalogmarscavecatalog Zip. 2017. Available online: https://doi.org/10.17189/1519222 (accessed on 10 November 2022).
- Pavlov, A.A.; McLain, H.L.; Glavin, D.P.; Roussel, A.; Dwork2in, J.P.; Elsila, J.E.; Yocum, K.M. Rapid Radiolytic Degradation of Amino Acids in the Martian Shallow Subsurface: Implications for the Search for Extinct Life. Astrobiology 2022, 22, 1099–1115. [Google Scholar] [CrossRef] [PubMed]
- Rummel, J.D. Special Regions in Mars Exploration: Problems and Potential. Acta Astronaut. 2009, 64, 1293–1297. [Google Scholar] [CrossRef]
- Sauro, F.; Pozzobon, R.; Massironi, M.; De Berardinis, P.; Santagata, T.; De Waele, J. Lava Tubes on Earth, Moon and Mars: A Review on Their Size and Morphology Revealed by Comparative Planetology. Earth-Sci. Rev. 2020, 209, 103288. [Google Scholar] [CrossRef]
- Lemoine, F.G.; Smith, D.E.; Rowlands, D.D.; Zuber, M.T.; Neumann, G.A.; Chinn, D.S.; Pavlis, D.E. An Improved Solution of the Gravity Field of Mars (GMM-2B) from Mars Global Surveyor. J. Geophys. Res. Planets 2001, 106, 23359–23376. [Google Scholar] [CrossRef]
- Neukum, G.; Jaumann, R. HRSC: The High Resolution Stereo Camera of Mars Express. In Mars Express: The Scientific Payload; ESA Publications Division, ESTEC: Noordwijk, The Netherlands, 2004; Volume 1240, pp. 17–35. ISBN 92-9092-556-6. [Google Scholar]
- Malin, M.C.; Bell, J.F.; Cantor, B.A.; Caplinger, M.A.; Calvin, W.M.; Clancy, R.T.; Edgett, K.S.; Edwards, L.; Haberle, R.M.; James, P.B.; et al. Context Camera Investigation on Board the Mars Reconnaissance Orbiter. J. Geophys. Res. 2007, 112, E05S04. [Google Scholar] [CrossRef] [Green Version]
- Edwards, C.S.; Nowicki, K.J.; Christensen, P.R.; Hill, J.; Gorelick, N.; Murray, K. Mosaicking of Global Planetary Image Datasets: 1. Techniques and Data Processing for Thermal Emission Imaging System (THEMIS) Multi-Spectral Data. J. Geophys. Res. 2011, 116, E10008. [Google Scholar] [CrossRef]
- QGIS.org, 2022. QGIS Geographic Information System. QGIS Association. Available online: http://www.qgis.org (accessed on 10 November 2022).
- Christensen, P.R.; Engle, E.; Anwar, S.; Dickenshied, S.; Noss, D.; Gorelick, N.; Weiss-Malik, M. JMARS—A Planetary GIS. In Proceedings of the AGU Fall Meeting Abstracts, San Francisco, CA, USA, 14–18 December 2009; Volume 2009, p. IN22A-06. [Google Scholar]
- Seu, R.; Biccari, D.; Orosei, R.; Lorenzoni, L.V.; Phillips, R.J.; Marinangeli, L.; Picardi, G.; Masdea, A.; Zampolini, E. SHARAD: The MRO 2005 Shallow Radar. Planet. Space Sci. 2004, 52, 157–166. [Google Scholar] [CrossRef]
- Wilson, A. Mars Express: The Scientific Payload; ESA SP; ESA Publications Division: Noordwijk, The Netherlands, 2004; ISBN 978-92-9092-556-9. [Google Scholar]
- Holt, J.W.; Peters, M.E.; Kempf, S.D.; Morse, D.L.; Blankenship, D.D. Echo Source Discrimination in Single-Pass Airborne Radar Sounding Data from the Dry Valleys, Antarctica: Implications for Orbital Sounding of Mars. J. Geophys. Res. 2006, 111, E06S24. [Google Scholar] [CrossRef] [Green Version]
- Choudhary, P.; Holt, J.W.; Kempf, S.D. Surface Clutter and Echo Location Analysis for the Interpretation of SHARAD Data From Mars. IEEE Geosci. Remote Sens. Lett. 2016, 13, 1285–1289. [Google Scholar] [CrossRef]
- Mansilla, F.; Zorzano, M.P.; Giannakis, I.; Ruiz, J. No evidence of reflectors on Jezero radargrams. In Proceedings of the Europlanet Science Congress 2022, Granada, Spain, 18–23 September 2022. EPSC2022-460. [Google Scholar] [CrossRef]
- Putzig, N.E.; Phillips, R.J.; Campbell, B.A.; Plaut, J.J.; Holt, J.W.; Bernardini, F.; Egan, A.F.; Smith, I.B. Custom SHARAD Processing via the CO-SHARPS Processing Boutique. In Proceedings of the 47th Lunar and Planetary Science Conference, Woodlands, TA, USA, 21–25 March 2016; p. 3010. [Google Scholar]
- Campbell, B. MRO MARS SHARAD 5 RADARGRAM V2.0. Available online: https://doi.org/10.17189/YB1W-F075 (accessed on 28 December 2022).
- Christoffersen, M.S.; Holt, J.W.; Kempf, S.D.; O’Connell, J.D. MRO SHARAD Clutter Simulations Bundle. Available online: https://doi.org/10.17189/NBDH-2K53 (accessed on 28 December 2022).
- Hartmann, W.K.; Neukum, G. Cratering Chronology and the Evolution of Mars. Space Sci. Rev. 2001, 96, 165–194. [Google Scholar] [CrossRef]
- Michael, G.G.; Neukum, G. Planetary Surface Dating from Crater Size–Frequency Distribution Measurements: Partial Resurfacing Events and Statistical Age Uncertainty. Earth Planet. Sci. Lett. 2010, 294, 223–229. [Google Scholar] [CrossRef]
- Michael, G.G.; Platz, T.; Kneissl, T.; Schmedemann, N. Planetary Surface Dating from Crater Size–Frequency Distribution Measurements: Spatial Randomness and Clustering. Icarus 2012, 218, 169–177. [Google Scholar] [CrossRef]
- Michael, G.G. Planetary Surface Dating from Crater Size–Frequency Distribution Measurements: Multiple Resurfacing Episodes and Differential Isochron Fitting. Icarus 2013, 226, 885–890. [Google Scholar] [CrossRef]
- Riedel, C.; Michael, G.; Kneissl, T.; Orgel, C.; Hiesinger, H.; van der Bogert, C.H. A New Tool to Account for Crater Obliteration Effects in Crater Size-Frequency Distribution Measurements. Earth Space Sci. 2018, 5, 258–267. [Google Scholar] [CrossRef]
- Hartmann, W.K.; Daubar, I.J. Martian Cratering 11. Utilizing Decameter Scale Crater Populations to Study Martian History. Meteorit. Planet. Sci. 2017, 52, 493–510. [Google Scholar] [CrossRef]
- Carrier, I.W.D.; Olhoeft, G.R.; Mendell, W. Physical Properties of the Lunar Surface. In Lunar Sourcebook, A User’s Guide to the Moon; Heiken, G.H., Vaniman, D.T., French, B.M., Eds.; Cambridge University Press: Cambridge, UK; Port Chester, NY, USA, 1991; pp. 475–594. ISBN 978-0-521-33444-0. [Google Scholar]
- Heiken, G.; Vaniman, D.; French, B.M. Lunar Sourcebook: A User’s Guide to the Moon; Cambridge University Press: Cambridge, UK; Port Chester, NY, USA, 1991; ISBN 978-0-521-33444-0. [Google Scholar]
- Malakhov, A.V.; Mitrofanov, I.G.; Golovin, D.V.; Litvak, M.L.; Sanin, A.B.; Djachkova, M.V.; Lukyanov, N.V. High Resolution Map of Water in the Martian Regolith Observed by FREND Neutron Telescope Onboard ExoMars TGO. J. Geophys. Res. Planets 2022, 127, e2022JE007258. [Google Scholar] [CrossRef]
- Williams, R.M.E. Evidence for Late Stage Fluvial Activity in Kasei Valles, Mars. J. Geophys. Res. 2004, 109, E06001. [Google Scholar] [CrossRef]
- Neukum, G. Meteoritenbombardement und Datierung Planetarer Oberflächen. Habilitation Dissertation for Faculty Membership; Ludwig-Maximilians Universität: München, Germany, 1983. [Google Scholar]
- Stillman, D.E.; Grimm, R.E. Radar Penetrates Only the Youngest Geological Units on Mars. J. Geophys. Res. 2011, 116, E03001. [Google Scholar] [CrossRef] [Green Version]
- Edwards, B.; Magnússon, E.; Thordarson, T.; Guđmundsson, M.T.; Höskuldsson, A.; Oddsson, B.; Haklar, J. Interactions between Lava and Snow/Ice during the 2010 Fimmvörðuháls Eruption, South-Central Iceland: 2010 FIMMVÖRÐUHÁLS LAVA-SNOW. J. Geophys. Res. Solid Earth 2012, 117. [Google Scholar] [CrossRef]


| Maximum Depths SWT (Single Wave Travel Time) at Echus Chasma Eastern Fan | |||||
|---|---|---|---|---|---|
| Longitude (Deg. E) | Latitude (Deg. N) | Δt (ns) | Lower Bound ε Estimated Depth (m) ε = 6.2 (Carter et al., 2009) | Upper Bound ε Estimated Depth (m) ε = 17.3 (Carter et al., 2009) | |
| 3607001 | −80.36 | 5.79 | 637.50 | 77 | 46 |
| 3628101 | −80.22 | 5.43 | 656.25 | 79 | 47 |
| 3649201 | −80.37 | 5.61 | 693.75 | 84 | 50 |
| 3783701 | −80.37 | 5.63 | 656.25 | 79 | 47 |
| 6689402 | −80.34 | 5.71 | 600.00 | 72 | 43 |
Disclaimer/Publisher’s Note: The statements, opinions and data contained in all publications are solely those of the individual author(s) and contributor(s) and not of MDPI and/or the editor(s). MDPI and/or the editor(s) disclaim responsibility for any injury to people or property resulting from any ideas, methods, instructions or products referred to in the content. |
© 2023 by the authors. Licensee MDPI, Basel, Switzerland. This article is an open access article distributed under the terms and conditions of the Creative Commons Attribution (CC BY) license (https://creativecommons.org/licenses/by/4.0/).
Share and Cite
Mansilla, F.; Zorzano, M.-P.; Giannakis, I.; Ruiz, J. Unveiling the Subsurface of Late Amazonian Lava Flows at Echus Chasma, on Mars. Remote Sens. 2023, 15, 1357. https://doi.org/10.3390/rs15051357
Mansilla F, Zorzano M-P, Giannakis I, Ruiz J. Unveiling the Subsurface of Late Amazonian Lava Flows at Echus Chasma, on Mars. Remote Sensing. 2023; 15(5):1357. https://doi.org/10.3390/rs15051357
Chicago/Turabian StyleMansilla, Federico, María-Paz Zorzano, Iraklis Giannakis, and Javier Ruiz. 2023. "Unveiling the Subsurface of Late Amazonian Lava Flows at Echus Chasma, on Mars" Remote Sensing 15, no. 5: 1357. https://doi.org/10.3390/rs15051357