Article

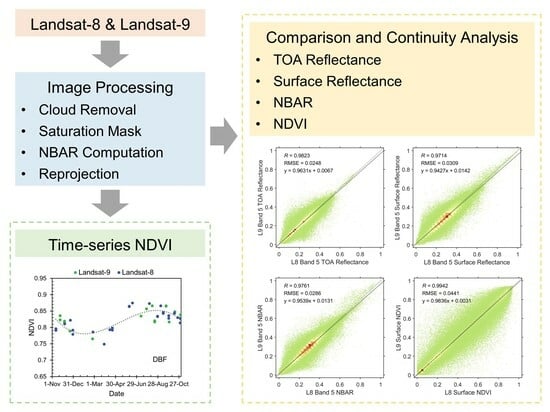
Continuity of Top-of-Atmosphere, Surface, and Nadir BRDF-Adjusted Reflectance and NDVI between Landsat-8 and Landsat-9 OLI over China Landscape

1
Environmental Information Institute, Navigation College, Dalian Maritime University, Dalian 116026, China
2
School of Environmental Science and Engineering, Tiangong University, Tianjin 300387, China
*
Author to whom correspondence should be addressed.
Remote Sens. 2023, 15(20), 4948; https://doi.org/10.3390/rs15204948
Submission received: 14 September 2023 / Revised: 7 October 2023 / Accepted: 10 October 2023 / Published: 13 October 2023
(This article belongs to the Special Issue Vegetation Mapping through Multiscale Remote Sensing)

Abstract

:
The successful launch of Landsat-9 marks a significant achievement in preserving the data legacy and ensuring the continuity of Landsat’s calibrated Earth observations. This study comprehensively assesses the continuity of reflectance and the Normalized Difference Vegetation Index (NDVI) between Landsat-8 and Landsat-9 Operational Land Imagers (OLIs) over diverse Chinese landscapes. It reveals that sensor discrepancies minimally impact reflectance and NDVI consistency. Although Landsat-9’s top-of-atmosphere (TOA) reflectance is slightly lower than that of Landsat-8, small root-mean-square errors (RMSEs) ranging from 0.0102 to 0.0248 for VNIR and SWIR bands (and larger RMSE for NDVI at 0.0422) fall within acceptable ranges for Earth observation applications. Applying atmospheric corrections markedly enhances reflectance uniformity and brings regression slopes closer to unity. Further, Bidirectional Reflectance Distribution Function (BRDF) adjustments improve comparability, ensuring measurement reliability, and the NDVI maintains robust consistency across various reflectance types, time series, and land cover classes. These findings affirm Landsat-9’s success in achieving data continuity within the Landsat program, allowing interchangeable use of Landsat-8 and Landsat-9 OLI data for diverse Earth observation purposes. Future research may explore specific sensor correlations across different vegetation types and seasons while integrating data from complementary platforms, such as Sentinel-2, to enhance the understanding of data continuity factors.

Graphical Abstract

1. Introduction

For over five decades, the Landsat mission has stood as an illustrious and prosperous collaborative endeavor between the National Aeronautics and Space Administration (NASA) and the U.S. Geological Survey (USGS). Designed, executed, and maintained with exceptional success, the mission’s overarching aim has been to amass, archive, and disseminate multispectral imagery on a global scale [1,2,3]. Since the launch of Landsat-4 in 1982, the saga of the Landsat series has been etched in the land surface imagery, with instruments such as the Landsat Thematic Mapper (TM) and Enhanced Thematic Mapper (ETM+) embarking on this journey [4]. The year of 1984 saw the advent of Landsat-5, carrying an identical TM instrument, followed by Landsat-7 in 1999, which hosted the next-generation ETM+ instrument [5]. The torch was then passed to Landsat-8, launched in 2013, ushering in the Operational Land Imager (OLI) and Thermal Infrared Sensor (TIRS) instruments as successors to ETM+ [6]. Together, these instruments orchestrate a seamless continuum of satellite imagery, encompassing six reflective wavelength bands in the visible and near-infrared (VNIR) domain, with a ground resolution of 30 m, and one or two thermal infrared (TIR) bands offering coarser spatial resolution.
Introduced as the latest satellite iteration within the esteemed Landsat series, Landsat-9 commenced its operational phase in September 2021, marking a significant stride in the domain of continuous Earth observation [7]. Aligning with its predecessor, Landsat-8, Landsat-9 is equipped with the OLI-2 and the TIRS-2, attuned to meticulously capture intricate details of the Earth’s land surface. Employing a well-orchestrated 16-day repeat cycle that spans a width of 185 km, Landsat-9 endeavors to maintain an uninterrupted continuum of invaluable observational data. Engaging in a meticulously planned week-long maneuver, the nearly identical sensors aboard Landsat-8 and Landsat-9 embarked on a crucial endeavor, capturing a collection of pivotal images necessary for their subsequent cross-calibration. The meticulous analysis of the acquired data during the underfly event yielded outcomes of profound significance [8]. Although Landsat-8 and Landsat-9 share a multitude of common attributes, it is noteworthy that Landsat-9’s technical prowess extends to augmenting the radiometric resolution of the OLI from the former’s 12 bits, as employed by Landsat-8, to a higher specification of 14 bits [7]. The resulting amplification in radiometric resolution subsequently augments sensor sensitivity, yielding tangible enhancements in terms of luminance and color rendition.
A fundamental objective of the Landsat program lies in the provision of a steadfast and comprehensive repository of radiometrically and geometrically calibrated data spanning its entire mission chronicle. The attainment of sensor consistency crucially hinges upon several intricate factors, including the relative spectral filter characteristics, the correction of atmospheric effects [9,10], the sensor misregistration concerns [11], and the diligent management of sensor degradation and calibration adjustments [12]. Additionally, the view angle of the acquired images, often slightly off nadir spanning ±7.5°, introduces subtle directional nuances in surface reflectance owing to surface reflectance anisotropy [13,14].
Moreover, the extensive Landsat imagery time series has profoundly enriched the capacity to monitor terrestrial vegetation [15]. Researchers have consistently endeavored to establish models that derive biophysical parameters from the reflectance values, effectively translating reflectance into quantities of heightened physical significance. In this context, vegetation indices (VIs) derived from satellite data have emerged as indispensable tools for appraising the dynamic variations in the physiological state and biophysical attributes of vegetation [16]. However, the intricate nuances inherent to distinct sensor characteristics often yield disparities among VIs derived from diverse sensors targeting the same terrain [17,18]. The NDVI (normalized difference vegetation index) has been widely employed in Earth observation studies to monitor vegetation health, assess land cover changes, and analyze ecosystem dynamics. With the advent of Landsat series data, which spans several decades, researchers have increasingly utilized this dataset for long-term vegetation monitoring [19]. Consequently, the pursuit of multi-sensor NDVI continuity and compatibility assumes paramount significance within the realm of multi-sensor vegetation observations, albeit remaining as a nuanced and intricate undertaking.
Previous research endeavors have provided valuable insights into the comparative analysis of Landsat-7 ETM+ and Landsat-8 OLI data in diverse geographic contexts. For instance, Flood conducted a comprehensive examination of these datasets across the Australian landscape [20]. Similarly, statistical analyses were also conducted in the contexts of China and Korea [21], South East Asia [22], Libya [23], and the contiguous United States (CONUS) [24]. In addition, another critical aspect of such studies involves assessing the continuity of NDVI measurements across different Landsat missions [25]. These findings underscored subtle yet discernible disparities in both reflectance values and vegetation indices and have predominantly conveyed a narrative of favorable continuity between Landsat-8 OLI and Landsat-7 ETM+, reaffirming the efficacy of these sensors. These collective contributions have significantly enriched our understanding of the Landsat sensor continuity landscape.
The onset of an extended science mission for Landsat-7 at a lower orbit commenced in May 2022 at an altitude of 697 km. While Landsat-7 continues to maintain operational stability and data acquisition, its pivotal role within the Landsat series has diminished. Consequently, the mantle of major data provision within the Landsat constellation now rests firmly upon Landsat-8 and Landsat-9 [7,26]. These two satellites represent the fulcrum of ongoing Earth monitoring endeavors, underpinning the program’s future data recording missions. Preliminary studies have undertaken cross-calibration and evaluation exercises, focusing on the spectral consistency of their VNIR and TIR bands. For instance, Kabri et al. [27] undertook a meticulous evaluation of Landsat-9’s OLI2 radiometric performance, particularly in the context of aquatic applications. Their findings underscored the presence of consistent reflectance values with Landsat-8’s OLI, along with heightened signal levels in OLI2 and improved signal-to-noise ratios across the VNIR and SWIR bands. Initial calibration adjustments were implemented before the culmination of the on-orbit initial verification phase, with the subsequent Phase 2 analysis culminating in refined cross-calibration gain values that have been instrumental in updating the Landsat-9 calibration [8]. Nevertheless, a conspicuous gap persists in the scholarly landscape, characterized by the absence of an exhaustive comparative analysis across extensive regions with diverse land covers and over extended time periods, encompassing both reflectance and derived vegetation indices—a critical knowledge deficit that this study seeks to address.
In response to the aforementioned research gap, this paper aims to provide a comprehensive characterization of the continuity in Landsat-8 and Landsat-9 OLI sensor data, with a specific focus on reflectance and the NDVI, the most widely used vegetation index, across the diverse landscape of China. This investigation encompasses an evaluation of the corresponding bands’ reflectance and derived NDVI values. The assessment is conducted both at the top-of-atmosphere (TOA) reflectance level and after meticulous atmospheric correction to yield surface reflectance data. Additionally, the surface reflectance values undergo an adjustment process to account for the nadir view and local solar observation geometry, yielding nadir bi-directional reflectance distribution function (BRDF)-adjusted surface reflectance values that are systematically compared between the two sensors.
The organization of this article is as follows. Section 2 describes the material used in this study, which includes Landsat-8 and Landsat-9 images and a spectral reflectance library. Detailed descriptions regarding the implementation of the analysis, including the data pre-processing and comparison, are described in Section 3. Comparison results are presented in Section 4. Section 5 discusses the causes of uncertainty in consistency analyses and future research directions. This article concludes in Section 6 with a summary of the results.

2. Materials

2.1. Landsat-8 and Landsat-9 Images

This study relies on the utilization of Landsat-8 and Landsat-9 Collection 2 Level 1 Precision and Terrain (L1TP)-corrected data, along with Level 2 Science Products (L2SPs). The Collection 2 dataset augments the existing metadata with essential angle coefficients, facilitating the derivation of per-pixel solar and viewing geometry parameters. Additionally, it offers invaluable per-pixel masks, encompassing cloud, cloud shadow, cirrus cloud, and snow, derived through the CFmask algorithm [28]. The analysis primarily centers on four VNIR bands and two SWIR bands from the OLI sensor, specifically corresponding to bands 2 through 7 (as illustrated in Figure 1). These bands are processed to yield orthorectified top-of-atmosphere (TOA) reflectance or Surface Reflectance (SR).
The L1TP product encompasses a comprehensive suite of corrections, encompassing radiometric, geometric, and precision adjustments. It leverages Digital Elevation Models (DEMs) to rectify parallax errors stemming from local topographic variations. The accuracy of the precision/terrain-corrected product is contingent upon the availability of Ground Control Points (GCPs) and the resolution of the most optimal DEM at hand. Conversely, the L2SP products are derived through the Land Surface Reflectance Code (LaSRC) [10]. The LaSRC is instrumental in generating TOA reflectance, harnessing calibration parameters gleaned from the metadata. Subsequently, the dataset undergoes meticulous atmospheric correction routines, facilitated by auxiliary input data, including water vapor, ozone, and Aerosol Optical Thickness (AOT), sourced from the Moderate-Resolution Imaging Spectroradiometer (MODIS). Moreover, digital elevation data derived from the Earth Topography Five-Minute Grid (ETOPO5) are harnessed to compute surface reflectance. The culminating output is presented as the Landsat SR data product, which forms the foundation for the ensuing analyses.
Landsat-8 and Landsat-9, operating in a synchronized orbit offset by 8 days, inherently exhibit an overlapping acquisition pattern. This design results in the western side of a sensor’s acquisition footprint being juxtaposed with the eastern side of the other sensor’s footprint, and vice versa. Consequently, these adjacent acquisitions transpire with a mere one-day separation. While this brief temporal gap may witness alterations in atmospheric conditions, it remains an acceptable timeframe for capturing surface changes, which are less likely to occur within such a compressed interval. For the purpose of this study, we identify and employ fifteen strategically selected regions across the expansive Chinese landscape (Figure 2) where Landsat-8 and Landsat-9 acquisitions exhibit this side-overlapping configuration. These regions encapsulate a diverse spectrum of major land cover types, including evergreen needleleaf forests (ENFs), evergreen broadleaf forests (EBFs), deciduous needleleaf forests (DNFs), deciduous broadleaf forests (DBFs), grasslands, croplands, urban and built-up areas, barren terrain, and water bodies, classified in accordance with the International Geosphere-Biosphere Program (IGBP) scheme adopted from the MODIS land cover product (MCD12Q1) [29].
In order to encompass a wide array of surface and atmospheric conditions, we meticulously curate four Landsat data pairs for each region, corresponding to the distinct seasonal periods of January–March, April–June, July–September, and October–December of the year 2022. However, it is noteworthy that certain regions encounter limitations in the form of high cloud cover within the available Landsat imagery during specific seasons. Consequently, we judiciously select 53 Landsat-8 and Landsat-9 data pairs that satisfy the requisite criteria, thus forming the foundation for our comparative analysis.
Furthermore, to facilitate a comprehensive time-series analysis of NDVI data, we assemble a complete annual dataset encompassing Landsat-8 and Landsat-9 imagery spanning from November 2021 to October 2022. This extensive dataset is meticulously curated to encompass the specific regions of interest, known as the six Benchmark Land Multisite Analysis and Intercomparison of Products (BELMANIP) sites [30], strategically situated across China (Figure 2). Each of these sites represents distinct land cover types, including DNF, DBF, EBF, grasslands, croplands, and barren terrain. This dataset serves as a resource for conducting cross-sensor comparisons of NDVI time-series data, offering insights into the temporal dynamics of vegetation across various land cover categories within the selected regions.

2.2. Spectral Library and Simulated Dataset

To explore potential differences in reflectance between Landsat-8 and Landsat-9 arising solely from disparities in their spectral response characteristics, we conduct an extensive simulation study. This involves the generation of a substantial volume of simulated sensor reflectance values, particularly focusing on Landsat-9 and Landsat-8 OLI band reflectance data. The derivation of these reflectance values is accomplished by convolving laboratory spectra with sensor-specific spectral response functions, a methodology well documented in previous research [31]. The formulation for computing the simulated reflectance for a specific Landsat-9 or Landsat-8 band (Figure 1) is expressed as follows:
ρ b a n d = λ m i n λ m a x R S R λ ρ λ d λ λ m i n λ m a x R S R λ d λ
where ρ b a n d signifies the simulated reflectance specific to the Landsat-9 or Landsat-8 band, while R S R λ represents the relative spectral response function associated with the respective band of Landsat-9 or Landsat-8. Furthermore, λ m i n and λ m a x denote the minimum and maximum wavelengths, respectively, where R S R λ has a value greater than zero, while ρ λ stands for the reflectance spectral library data for a given spectrum.
Our simulation endeavors incorporate a total of 344 spectra, spanning various categories including 45 vegetation spectra, 25 soil spectra, 33 man-made material spectra, 160 mineral spectra, 3 water spectra, 4 snow cover spectra, and 74 dry vegetation spectra. These spectra are meticulously sourced from three distinct spectral libraries: the Version 6 USGS spectral library [32], the spectral library affiliated with Johns Hopkins University (JHU), and the Chris Elvidge dry and green vegetation spectral library. The simulated NDVI is derived as the simulated NIR reflectance minus the simulated red reflectance divided by their sum [33].

3. Methods

A flowchart depicting the methodology employed in this research is presented in Figure 3, including image processing, the comparison of Landsat-8 and Landsat-9 reflectance and NDVI, as well as time-series NDVI analysis.

3.1. Landsat Data Pre-Processing

3.1.1. Cloud, Cloud Shadow, Snow, and Spectral Saturation Masking

The initial data preprocessing involved the removal of cloud, cloud shadow, and snow pixels, which were identified using the Landsat quality assessment (QA) band. Additionally, pixel observations were excluded if any of the six Landsat-8 or Landsat-9 VNIR and SWIR bands (as illustrated in Figure 1) were flagged as saturated. Consequently, only Landsat data pairs with observations that exhibited no indications of cloud cover, snow contamination, or saturation were retained for further analysis. Subsequently, a filter based on blue band TOA reflectance was applied to screen out pairs of Landsat-8 and Landsat-9 pixels [24,31]. This filtering criterion is expressed as follows:
ρ b l u e T O A ,   L 9 ρ b l u e T O A ,   L 8 0.5 ρ b l u e T O A ,   L 9 + ρ b l u e T O A ,   L 8 > 1.0
where ρ b l u e T O A ,   L 9 and ρ b l u e T O A ,   L 8 represent the blue band TOA reflectance values for Landsat-9 and Landsat-8, respectively. This filter was devised to exclude observation pairs where substantial atmospheric changes were detected. The selection of the blue band is strategic, given its heightened sensitivity to atmospheric effects [34,35]. Moreover, the filter tends to reject observation pairs when either of the two observations is obscured by cloud or snow cover. This is attributed to the fact that vegetation and soil typically exhibit considerably lower blue reflectance compared to cloud or snow [36].

3.1.2. Nadir BRDF-Adjusted Reflectance (NBAR) Computation

Most terrestrial surfaces do not exhibit the Lambertian Bidirectional Reflectance Distribution Function (BRDF), causing variations in reflectance solely due to alterations in solar and viewing geometry. Within the Landsat swath, red and near-infrared (NIR) reflectance can fluctuate by up to 0.02 and 0.06, respectively, primarily due to BRDF effects [13]. These variations can introduce significant noise into various applications, as they often rival or surpass sensor calibration errors [37]. In this study, we employed a semi-physical approach previously developed for Landsat applications [13] to adjust the surface reflectance values for Landsat-8 and Landsat-9 sensor bands to a nadir view (0° view zenith) and a fixed 30° solar zenith angle.
To independently normalize pairs of Landsat-8 and Landsat-9 reflectance values to nadir BRDF-adjusted reflectance (NBAR) equivalents, we adopted the c-factor approach as introduced in [38]. This approach facilitates the adjustment of Landsat reflectance to specified viewing and solar geometry conditions. The normalization process is represented as follows:
N B A R λ s e n s o r θ v = 0 ,   θ s = θ s L 8 + θ s L 9 2 = c λ × ρ λ s e n s o r θ v s e n s o r ,   θ s s e n s o r c λ = ρ ^ λ M O D I S θ v = 0 ,   θ s = θ s L 8 + θ s L 9 2 ρ λ M O D I S θ v s e n s o r ,   θ s s e n s o r
where “sensor” corresponds to either Landsat-8 or Landsat-9 OLI, and each pair of N B A R λ s e n s o r values is defined with a solar zenith angle set as the mean of the solar zenith angles of the Landsat-8 ( θ s L 8 ) and Landsat-9 ( θ s L 9 ) observations, along with a nadir view zenith angle ( θ v s e n s o r ) of 0°. Due to the one-day separation between the Landsat data pairs used in this study, the difference in θ v s e n s o r between the two sensors is typically only 0.2°, which can be neglected. NBAR values were derived for the six Landsat VNIR and SWIR bands, as illustrated in Figure 1.
The MODIS spectral reflectance values for the specified viewing and solar geometry conditions were predicted utilizing a Ross–Thick/Li–Sparse-Reciprocal BRDF model as follows:
ρ λ ,   Ω ,   Ω = f i s o λ + f v o l λ K v o l Ω ,   Ω + f g e o λ K g e o Ω ,   Ω
This model defines reflectance as a weighted sum of an isotropic parameter and two functions (or kernels) of viewing and illumination geometry, with one kernel derived from radiative transfer models and the other based on surface scattering and geometric shadow casting theory [39,40,41]. The fixed BRDF model parameters ( f i s o , f v o l , f g e o ) for each Landsat band were referenced from [13] for both Landsat-8 and Landsat-9, as the relative spectral responses are very similar between their OLI sensors.

3.1.3. Reprojection

In cases where adjacent paths from the Landsat swath fall under different Universal Transverse Mercator (UTM) zones, it becomes essential to harmonize the coordinate systems by projecting one of the images to match the projection system of the other. This projection process involves the conversion of the coordinate system of one Landsat image to align with the projection system of the other, thereby ensuring compatibility and enabling a smooth integration for subsequent analyses. To achieve this, we opted for the UTM zone with a central meridian closest to the overlapped region as the target projection system, and subsequently transformed the projection of the other image to align with it. This approach ensures consistency in the spatial representation of the data, facilitating accurate and coherent analysis.

3.2. Reflectance and NDVI Comparison Method

The level of agreement between Landsat-8 and Landsat-9 reflectance and NDVI was assessed through ordinary least squares (OLS) regression analysis. Additionally, quantitative evaluation of their continuity was performed by calculating the root-mean-square difference (RMSE) and correlation coefficient (R) using the following formulas:
R M S E = 1 n i = 1 n v i L 9 v i L 8 2
R = i = 1 n v i L 9 v ¯ L 9 v i L 8 v ¯ L 8 i = 1 n v i L 9 v ¯ L 9 2 i = 1 n v i L 8 v ¯ L 8 2
where v i L 9 and v i L 8 represent specific variables (such as reflectance or NDVI) from Landsat-9 and Landsat-8, respectively. In the case of NDVI comparisons, only NDVI values within the range of zero to one were considered to reflect typical land surface NDVI values. This rigorous statistical analysis provides a robust assessment of the agreement and continuity between the two datasets.

4. Results

4.1. Simulated Spectral Reflectance and NDVI Comparison

The simulated spectra employed in this study encompass a wide range of reflectance and NDVI values, clustered around the 1:1 line. Remarkably, the regression slopes for all bands and derived NDVI closely approach unity (ranging from 0.9997 to 1.0002). It is important to note that the tiny differences are solely attributed to simulated spectral response function disparities. The simulation inherently assumes surface homogeneity with Lambertian reflectance, devoid of calibration errors, geolocation discrepancies, atmospheric scattering or absorption, residual cloud cover, or shadows. However, it is crucial to acknowledge that the actual Landsat-8 and Landsat-9 data, as examined in the subsequent section, deviate from these idealized conditions.

4.2. Spectral Reflectance and NDVI Cross-Sensor Comparison

4.2.1. TOA Spectral Reflectance and NDVI Cross-Sensor Comparison

A comprehensive dataset comprising 59,490,068 30 m pixel values for each spectral band was extracted from the overlapping sensor data over the Chinese landscape in 2022. As depicted in Figure 4, the TOA reflectance scatterplots are devoid of saturated pixels, clouds, and snow, thanks to the application of the filtering criteria defined in Equation (2). Notably, the Landsat-8 and Landsat-9 TOA reflectance values span a broad spectral range, corresponding to diverse surface types and conditions.
In Figure 4, the solid black lines represent the ordinary least squares (OLS) regression fits. In an ideal scenario where Landsat-8 and Landsat-9 observations are perfectly identical, all data points in each scatterplot in Figure 4 would align precisely on the 1:1 line, resulting in regression fits with zero intercepts and slopes equal to unity. However, deviations from the 1:1 line can be attributed to several factors: (a) disparities in spectral response between the sensors, (b) surface and atmospheric alterations occurring over the one-day interval, and (c) bi-directional reflectance effects [20,24]. The effects of surface changes due to the one-day time difference between sensor acquisitions are assumed to be mitigated by the application of Equation (2). Furthermore, bi-directional reflectance effects can largely be discounted due to the specific acquisition geometry within the sensor overlap region. This region is consistently acquired in the forward scattering direction from one sensor and the backward scattering direction from the other sensor. Bi-directional effects typically result in higher reflectance in the backscatter direction than in the forward scatter direction, except for cases of specular reflectance in the forward scattering direction [42]. For all spectral bands, the OLS regression intercepts closely approach zero. However, the OLS slopes exhibit values less than unity for all VNIR and SWIR wavelength bands (as observed in Figure 4). In other words, the TOA reflectance of Landsat-9 is consistently lower than that of Landsat-8, with minimal RMSEs ranging from 0.0102 to 0.0248 for the VNIR and SWIR bands, and a larger RMSE of 0.0422 for the NDVI.

4.2.2. Surface Spectral Reflectance and NDVI Cross-Sensor Comparison

In Figure 5, we present the outcomes of the atmospheric correction process, which is reflected in the differences observed between the surface reflectance and surface NDVI data from Landsat-8 and Landsat-9. Notably, atmospheric correction leads to an expanded data range, particularly pronounced in the VNIR bands when compared to the TOA results (as seen in Figure 5 in comparison to Figure 4). This phenomenon aligns with findings in similar studies [24,31] and is attributed to the impact of atmospheric contamination. Specifically, atmospheric interference tends to reduce the contrast in surface reflectance due to the combined influence of Rayleigh and aerosol backscatter, which positively contributes to the sensor signal over darker surfaces, and aerosol absorption, which diminishes the sensor signal over brighter surfaces [43].
An interesting observation is that the OLS regression slopes for surface reflectance exhibit closer proximity to unity for the VNIR bands when compared to the TOA reflectance regressions. This phenomenon is likely attributed to the heightened susceptibility of VNIR bands to atmospheric contamination [43,44]. Conversely, there is minimal deviation between the OLS slopes for the SWIR bands and NDVI between the TOA and surface reflectance datasets. Additionally, the RMSE values follow a consistent pattern, with smaller values observed for the visible bands in contrast to the NIR and SWIR bands.

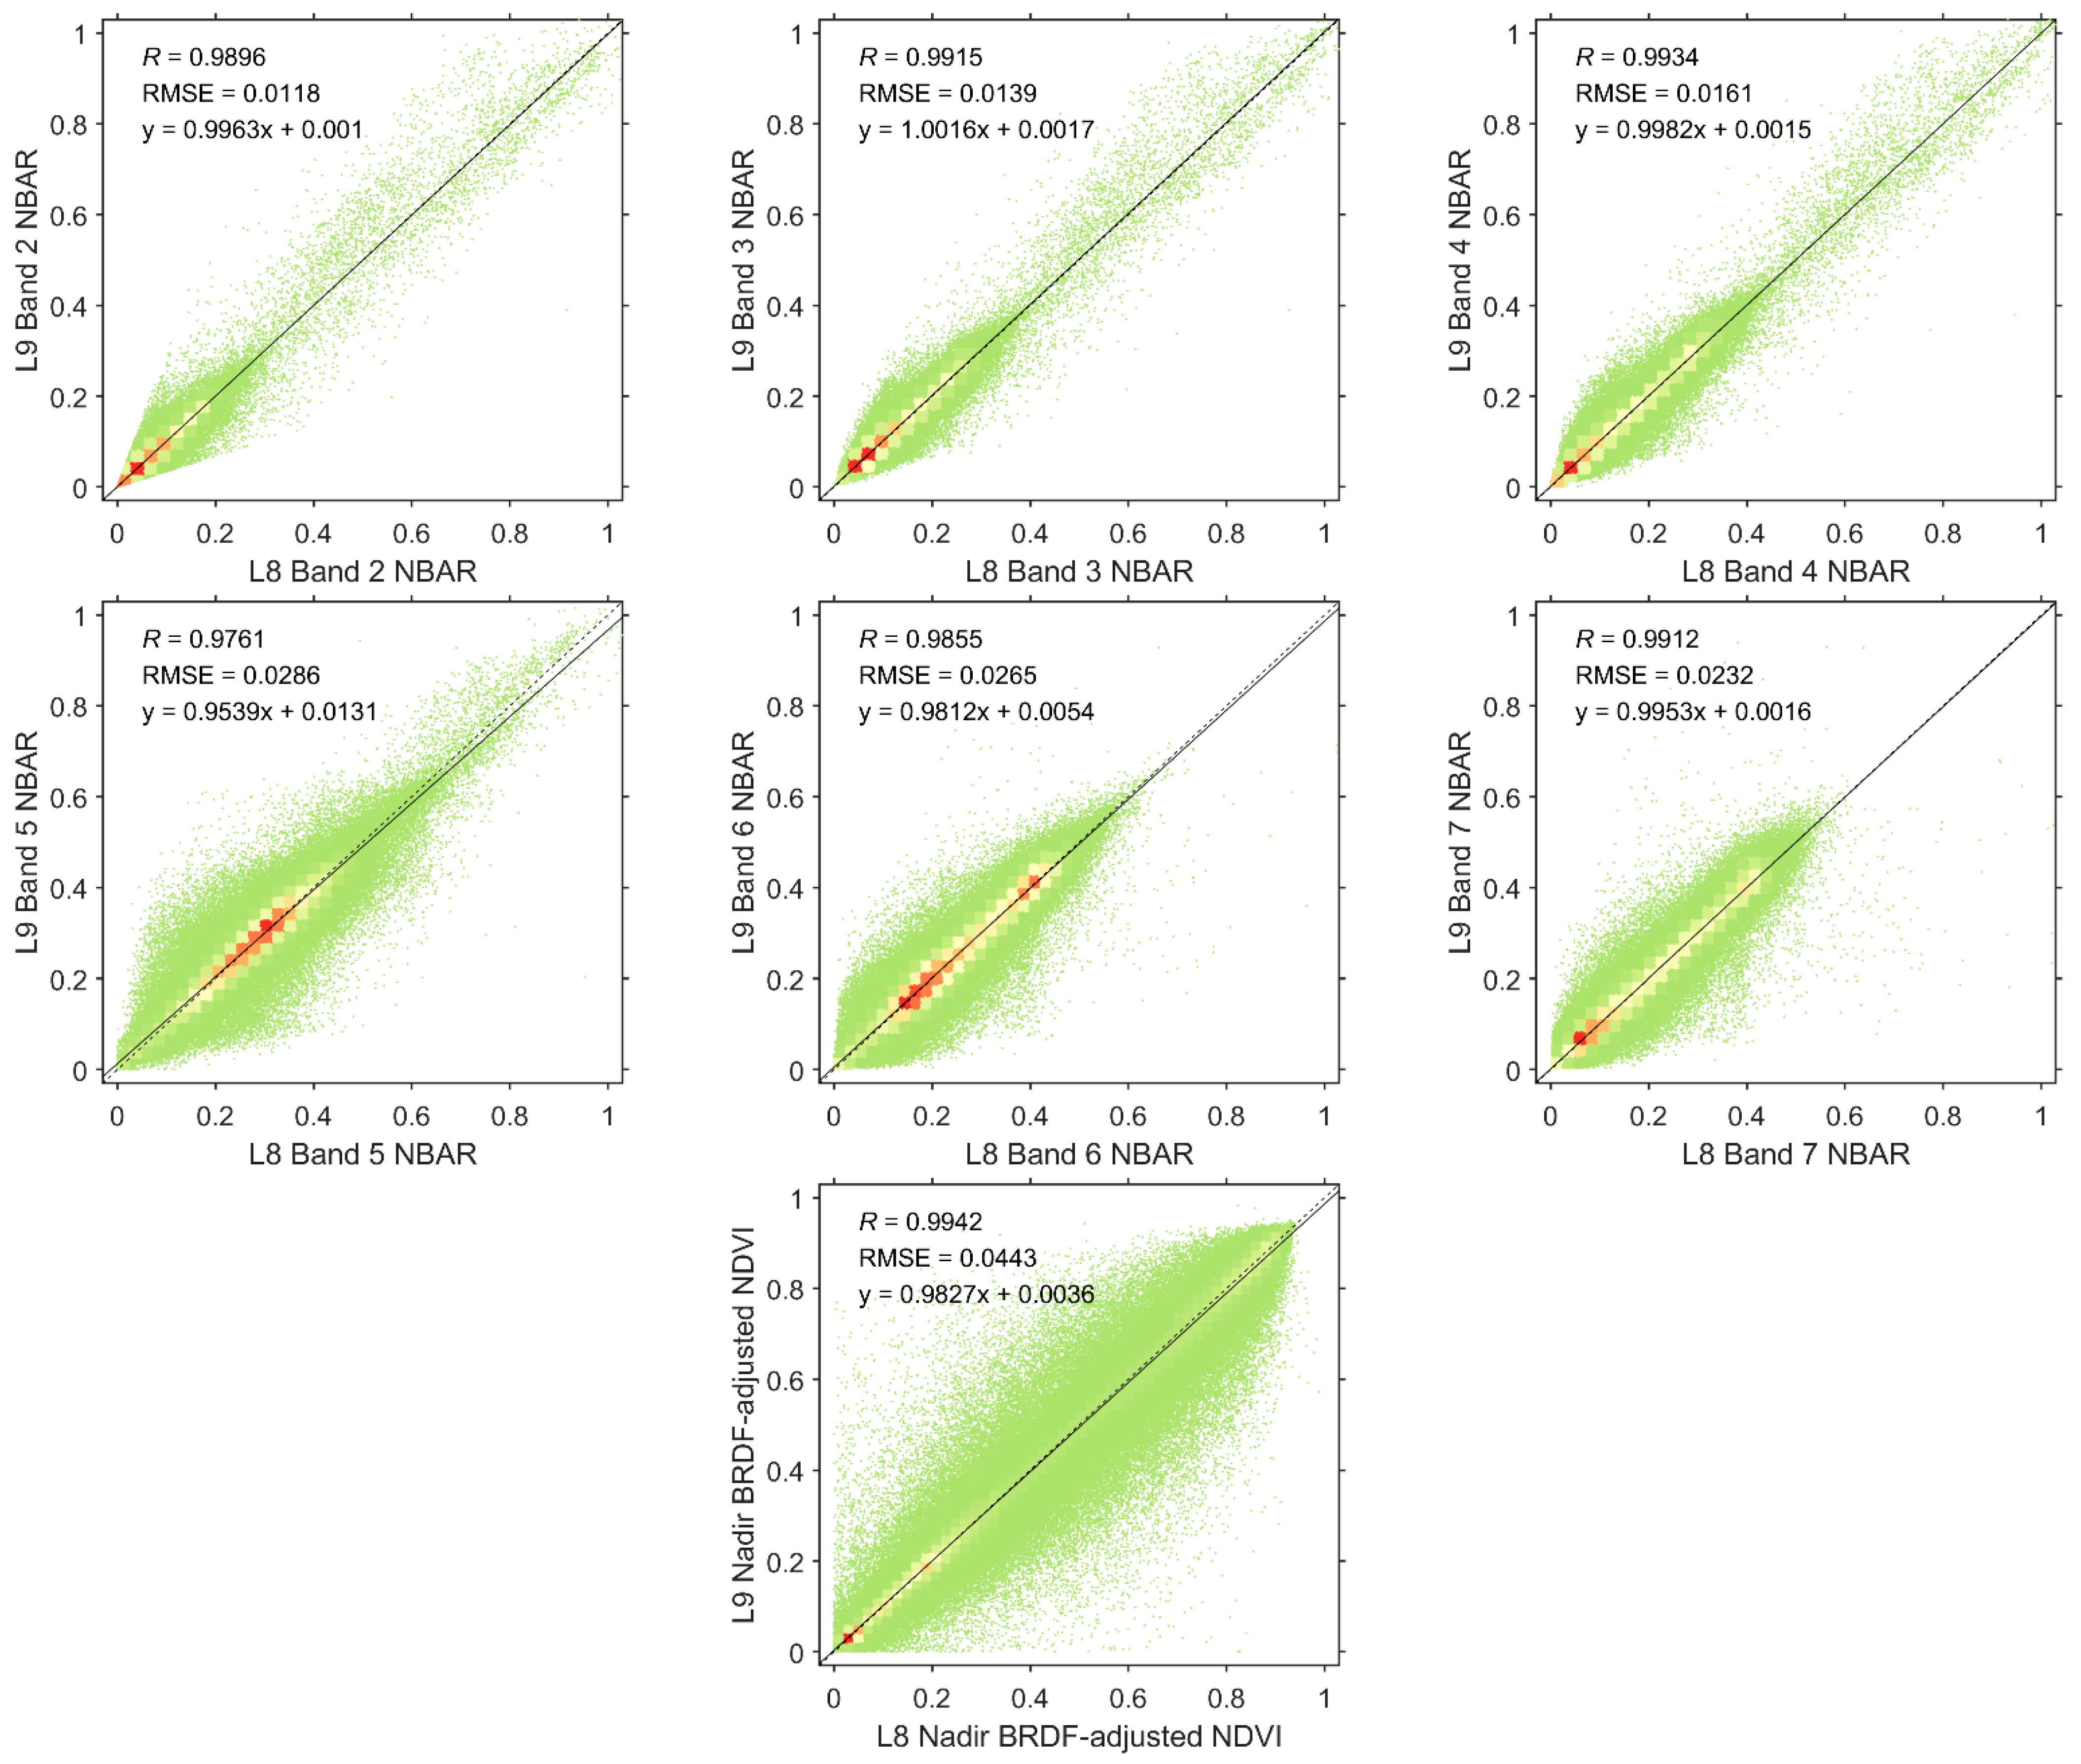
4.2.3. BRDF-Adjusted Spectral Reflectance and NDVI Cross-Sensor Comparison

In Figure 6, we present analogous results to those depicted in Figure 5, but with a focus on the nadir BRDF-adjusted data, referred to as surface NBAR (Nadir Bi-Directional Reflectance) and surface NBAR NDVI. When comparing the data corrected for BRDF effects to the atmospherically corrected data (as seen in Figure 5), we observe that BRDF correction contributes to increased reflectance consistency, as indicated by the OLS regression R2 values, across all bands. However, it is worth noting a slight increase in the absolute difference, as reflected in the RMSE values.
Notably, the OLS regression slopes for surface NBAR (Figure 6) are closer to unity than those observed for surface reflectance (Figure 5). This improvement can be attributed to the nadir BRDF correction, which effectively addresses variations in solar and viewing geometry. In the context of the observations in this study, it is important to highlight that the differences in solar zenith angles (Landsat-9 minus Landsat-8) were relatively small, with a mean of 0.0663° and a standard deviation of 0.7257°. These observations were captured within a single day of each other. In contrast, the differences in view zenith angles exhibited a wider range, with a mean of −0.0074° and a standard deviation of 3.2347°. Negative angles in this context represent the forward scatter direction, and these larger view zenith differences introduce non-negligible BRDF effects, particularly over non-Lambertian surfaces.
Conversely, when examining the surface NBAR NDVI regression slopes (Figure 6), we find them to be consistent with those observed for surface NDVI (Figure 5), with similar OLS regression R2 values. This alignment with the NDVI formulation’s reduced sensitivity to BRDF effects, in comparison to red and NIR reflectance [45], is expected. Furthermore, the influence of BRDF effects on Landsat NDVI data is generally limited in this study due to the small variations in solar zenith angles between the observations, as previously noted.

4.3. Time-Series NDVI Cross-Sensor Comparison

To assess the temporal coherence of Landsat-8 and Landsat-9 NDVI data further, we examine the time-series NDVI profiles derived from surface reflectance across six distinct land cover types (DNF, DBF, EBF, grasslands, croplands, and barren) at BELMANIP sites spanning from November 2021 to October 2022, as illustrated in Figure 7. The blue and green dots on the graph represent Landsat-8 and Landsat-9 NDVI values, respectively. Additionally, the grey dashed lines indicate polynomial fitting curves applied to the data.
In general, the NDVI profiles from Landsat-8 and Landsat-9 exhibit a high level of agreement across all land cover types. Their combination serves to significantly enhance the sampling frequency, which proves valuable for revealing phenological variations. For both EBF and DBF, the NDVI time series demonstrates subtle seasonal dynamics, with higher values observed in August and smaller values in February. In contrast, the NDVI time series for DNF and grasslands exhibit more pronounced seasonal fluctuations, with peaks and valleys also occurring in August and February. Notably, the cropland NDVI profile displays a bimodal pattern of seasonality. This pattern is attributed to the rotational agricultural practices involving wheat and maize throughout the year, with the peak for wheat growth occurring in March and for maize in August [46]. Lastly, barren land exhibits consistently low NDVI values throughout the year. However, it is worth noting that this site benefits from the densest Landsat-8 and Landsat-9 observations, owing to reduced cloud contamination in arid regions.

5. Discussion

The Landsat program has played a pivotal role in supplying consistent and long-term Earth observation data, thereby facilitating a multitude of applications, including land cover mapping, change detection, and vegetation monitoring [2]. The continuity of reflectance measurements between Landsat-8 and Landsat-9 is fundamental for ensuring the seamless integration of data and the capability to compare and analyze temporal trends effectively [47]. In this study, we focused on scrutinizing the continuity of TOA, surface, and nadir BRDF-adjusted reflectance, as well as the NDVI, across the diverse landscape of China.
The spectral response functions of Landsat-8 and Landsat-9’s OLI sensors exhibit a remarkable degree of similarity (Figure 1), underscoring the robust match in their spectral characteristics. This alignment allows for a confident assessment of the continuity of reflectance measurements between the two sensors, a confirmation supported by the comparison of simulated reflectance values derived from a spectral library analysis (Figure 3).
However, it is vital to acknowledge that real images obtained by Landsat-8 and Landsat-9 may exhibit variations in reflectance due to atmospheric effects. These atmospheric effects, encompassing the scattering and absorption of light by atmospheric constituents, introduce uncertainties and can impact the consistency of reflectance measurements [43]. Notably, our findings reveal that the TOA reflectance of Landsat-9 consistently registers lower values than those of Landsat-8, with RMSEs ranging from 0.0102 to 0.0248 (Figure 4). To mitigate these effects and enhance data comparability, the application of atmospheric correction to Landsat-8 and Landsat-9 images becomes paramount. By eliminating the influence of atmospheric effects, we observed that the slopes of the ordinary least squares (OLS) regressions converge toward unity, yielding more precise and harmonious data (Figure 5). It is essential to recognize that atmospheric effects can vary based on geographic location, time of acquisition, and atmospheric conditions, thus emphasizing the need to account for these effects for reliable and consistent data analysis.
Another crucial factor contributing to variations in reflectance measurements is the BRDF effect, which characterizes the directional reflectance properties of surfaces [13,40,45]. This effect can significantly impact the comparability of reflectance data, particularly for surfaces with varying angles and orientations. To address this, BRDF adjustments, such as those based on the Ross–Li models [40], can be employed to minimize the influence of BRDF on reflectance measurements. These adjustments take into account sensor-specific spectral and geometric characteristics, as well as surface properties, to correct for variations introduced by the BRDF effect. Implementation of these adjustments enhances the comparability of reflectance measurements, resulting in more consistent and dependable data analysis (Figure 6).
The NDVI, a widely employed vegetation index computed based on the ratio of NIR and red reflectance, demonstrates strong consistency across different types of reflectance data, including TOA, surface, and BRDF-adjusted reflectance. The consistent measurements of NDVI between Landsat-8 and Landsat-9 are of paramount importance for various applications. For instance, in land cover classification, the continuity of NDVI data ensures the accurate discrimination of different land cover types, aiding in climate change–human activity analysis [48], agriculture management, and forest monitoring [49]. Additionally, the assessment of phenological changes, such as the timing of vegetation growth and senescence, relies heavily on reliable NDVI data. This consistency signifies that the vegetation dynamics captured by NDVI remain comparable between Landsat-8 and Landsat-9, thus enabling consistent monitoring of vegetation health and changes across various land cover types (Figure 7). The ability to compare NDVI values between Landsat-8 and Landsat-9 provides assurance that data from these sensors can be seamlessly interchanged for such applications, thereby ensuring the continuity of vegetation monitoring endeavors, and underpins its relevance for various practical applications, emphasizing the importance of long-term, consistent Earth observation data for informed decision making and environmental management.
The continuity of TOA, surface, and nadir BRDF-adjusted reflectance, in conjunction with NDVI, is paramount for sustaining precise and consistent long-term monitoring of land surface dynamics. The amalgamation of data from both satellites empowers researchers to expand and enrich existing time series analyses, fostering a more comprehensive comprehension of land cover alterations, vegetation dynamics, and ecosystem health. Moreover, the integration of Landsat-8 and Landsat-9 data with Sentinel-2, another widely utilized Earth observation satellite, holds substantial potential for advancing our understanding of land surface dynamics [50]. Sentinel-2 offers analogous spectral bands and spatial resolution to Landsat sensors, facilitating synergistic analysis and enhancing temporal and spatial coverage [51]. The amalgamation of these datasets further elevates the accuracy and reliability of numerous applications necessitating multi-source and multi-temporal data. This integration allows for the optimization of both sensors’ strengths and ameliorates limitations such as cloud cover, temporal gaps, and spatial heterogeneity, thus providing a more exhaustive and accurate portrayal of land surface changes, ultimately culminating in a more holistic comprehension of land surface dynamics [52]. This harmonization of data is poised to significantly contribute to advancing scientific knowledge and bolstering decision-making processes across diverse domains, including ecology, agriculture, and land management, thereby promoting sustainable development and effective environmental conservation in China.

6. Conclusions

This study thoroughly investigated the continuity of reflectance and NDVI datasets derived from Landsat-8 and Landsat-9 OLI sensors, focusing on the diverse landscapes of China. The findings of this investigation suggest that the differences in sensor characteristics between Landsat-8 and Landsat-9 have a minimal impact on the overall continuity of reflectance and NDVI measurements. Specifically, while some variations in TOA reflectance were observed, predominantly in the VNIR and SWIR bands, their magnitudes, as indicated by the small RMSE values ranging from 0.0102 to 0.0248 for these bands and the larger RMSE for NDVI (0.0422), remain within an acceptable range for many Earth observation applications. Moreover, the application of atmospheric correction procedures significantly enhanced the consistency of reflectance measurements, bringing the regression slopes closer to unity. The subsequent implementation of BRDF adjustments further improved the comparability of reflectance data, ensuring the reliability of the measurements. Notably, NDVI exhibited robust consistency across different types of reflectance data over various time series and land cover categories. The findings collectively underline the overall success of Landsat-9 in ensuring the continuity of Landsat data, facilitating seamless integration and enabling robust temporal analysis. To delve deeper into this continuity, future research should explore specific correlational relationships between the two sensors, considering various vegetation cover types and seasonal variations. The potential integration of Sentinel-2 data offers an exciting avenue for expanding our understanding of the factors influencing data continuity, enhancing the accuracy and reliability of Earth observation data for a multitude of applications.

Author Contributions

Conceptualization, Y.S. and B.L.; methodology, Y.S. and B.W.; validation, Y.S. and B.W.; formal analysis, S.T.; investigation, Y.S., B.W., S.T. and Z.Z.; data curation, Y.S., Z.Z. and Y.L.; writing—original draft preparation, Y.S. and B.L.; writing—review and editing, Y.S.; funding acquisition, Y.S. All authors have read and agreed to the published version of the manuscript.

Funding

This research was funded by the National Natural Science Foundation of China (42301391) and Fundamental Research Funds for the Central Universities of China (3132023146).

Data Availability Statement

The Landsat TOA and surface reflectance data are available from https://earthexplorer.usgs.gov/ (accessed on 3 February 2023). The Landsat NBAR data generated in this study can be obtained from the corresponding author on request.

Conflicts of Interest

The authors declare no conflict of interest.

References

  1. Wulder, M.A.; White, J.C.; Loveland, T.R.; Woodcock, C.E.; Belward, A.S.; Cohen, W.B.; Fosnight, E.A.; Shaw, J.; Masek, J.G.; Roy, D.P. The global Landsat archive: Status, consolidation, and direction. Remote Sens. Environ. 2016, 185, 271–283. [Google Scholar] [CrossRef]
  2. Wulder, M.A.; Loveland, T.R.; Roy, D.P.; Crawford, C.J.; Masek, J.G.; Woodcock, C.E.; Allen, R.G.; Anderson, M.C.; Belward, A.S.; Cohen, W.B.; et al. Current status of Landsat program, science, and applications. Remote Sens. Environ. 2019, 225, 127–147. [Google Scholar] [CrossRef]
  3. Wu, Z.; Snyder, G.; Vadnais, C.; Arora, R.; Babcock, M.; Stensaas, G.; Doucette, P.; Newman, T. User needs for future Landsat missions. Remote Sens. Environ. 2019, 231, 111214. [Google Scholar] [CrossRef]
  4. Kovalskyy, V.; Roy, D.P. The global availability of Landsat 5 TM and Landsat 7 ETM+ land surface observations and implications for global 30 m Landsat data product generation. Remote Sens. Environ. 2013, 130, 280–293. [Google Scholar] [CrossRef]
  5. Chander, G.; Helder, D.L.; Markham, B.L.; Dewald, J.D.; Kaita, E.; Thome, K.J.; Micijevic, E.; Ruggles, T.A. Landsat-5 TM reflective-band absolute radiometric calibration. IEEE Trans. Geosci. Remote Sens. 2004, 42, 2747–2760. [Google Scholar] [CrossRef]
  6. Roy, D.P.; Wulder, M.A.; Loveland, T.R.; Woodcock, C.E.; Allen, R.G.; Anderson, M.C.; Helder, D.; Irons, J.R.; Johnson, D.M.; Kennedy, R.; et al. Landsat-8: Science and product vision for terrestrial global change research. Remote Sens. Environ. 2014, 145, 154–172. [Google Scholar] [CrossRef]
  7. Masek, J.G.; Wulder, M.A.; Markham, B.; McCorkel, J.; Crawford, C.J.; Storey, J.; Jenstrom, D.T. Landsat 9: Empowering open science and applications through continuity. Remote Sens. Environ. 2020, 248, 111968. [Google Scholar] [CrossRef]
  8. Gross, G.; Helder, D.; Begeman, C.; Leigh, L.; Kaewmanee, M.; Shah, R. Initial Cross-Calibration of Landsat 8 and Landsat 9 Using the Simultaneous Underfly Event. Remote Sens. 2022, 14, 2418. [Google Scholar] [CrossRef]
  9. Kaufman, Y.J. The effect of subpixel clouds on remote sensing. Adv. Space Res. 1987, 7, 207–210. [Google Scholar] [CrossRef]
  10. Vermote, E.; Justice, C.; Claverie, M.; Franch, B. Preliminary analysis of the performance of the Landsat 8/OLI land surface reflectance product. Remote Sens. Environ. 2016, 185, 46–56. [Google Scholar] [CrossRef]
  11. Skakun, S.; Roger, J.-C.; Vermote, E.F.; Masek, J.G.; Justice, C.O. Automatic sub-pixel co-registration of Landsat-8 Operational Land Imager and Sentinel-2A Multi-Spectral Instrument images using phase correlation and machine learning based mapping. Int. J. Digit. Earth 2017, 10, 1253–1269. [Google Scholar] [CrossRef] [PubMed]
  12. Markham, B.L.; Helder, D.L. Forty-year calibrated record of earth-reflected radiance from Landsat: A review. Remote Sens. Environ. 2012, 122, 30–40. [Google Scholar] [CrossRef]
  13. Roy, D.P.; Zhang, H.K.; Ju, J.; Gomez-Dans, J.L.; Lewis, P.E.; Schaaf, C.B.; Sun, Q.; Li, J.; Huang, H.; Kovalskyy, V. A general method to normalize Landsat reflectance data to nadir BRDF adjusted reflectance. Remote Sens. Environ. 2016, 176, 255–271. [Google Scholar] [CrossRef]
  14. Roy, D.P.; Li, J.; Zhang, H.K.; Yan, L.; Huang, H.; Li, Z. Examination of Sentinel-2A multi-spectral instrument (MSI) reflectance anisotropy and the suitability of a general method to normalize MSI reflectance to nadir BRDF adjusted reflectance. Remote Sens. Environ. 2017, 199, 25–38. [Google Scholar] [CrossRef]
  15. Schwieder, M.; Leitão, P.J.; da Cunha Bustamante, M.M.; Ferreira, L.G.; Rabe, A.; Hostert, P. Mapping Brazilian savanna vegetation gradients with Landsat time series. Int. J. Appl. Earth Obs. Geoinf. 2016, 52, 361–370. [Google Scholar] [CrossRef]
  16. Sun, Y.; Qin, Q.; Ren, H.; Zhang, T.; Chen, S. Red-Edge Band Vegetation Indices for Leaf Area Index Estimation From Sentinel-2/MSI Imagery. IEEE Trans. Geosci. Remote Sens. 2020, 58, 826–840. [Google Scholar] [CrossRef]
  17. She, X.; Zhang, L.; Cen, Y.; Wu, T.; Huang, C.; Baig, M.H.A. Comparison of the Continuity of Vegetation Indices Derived from Landsat 8 OLI and Landsat 7 ETM+ Data among Different Vegetation Types. Remote Sens. 2015, 7, 13485–13506. [Google Scholar] [CrossRef]
  18. Sun, Y.; Knyazikhin, Y.; She, X.; Ni, X.; Chen, C.; Ren, H.; Myneni, R.B. Seasonal and long-term variations in leaf area of Congolese rainforest. Remote Sens. Environ. 2022, 268, 112762. [Google Scholar] [CrossRef]
  19. Sun, Y.; Li, J.; Zhang, C.; Li, F.; Chen, W.; Li, Y. Environment monitoring of mining area with comprehensive mining ecological index (CMEI): A case study in Xilinhot of Inner Mongolia, China. Int. J. Sustain. Dev. World Ecol. 2023, 30, 814–825. [Google Scholar] [CrossRef]
  20. Flood, N. Continuity of Reflectance Data between Landsat-7 ETM+ and Landsat-8 OLI, for Both Top-of-Atmosphere and Surface Reflectance: A Study in the Australian Landscape. Remote Sens. 2014, 6, 7952–7970. [Google Scholar] [CrossRef]
  21. Ke, Y.; Im, J.; Lee, J.; Gong, H.; Ryu, Y. Characteristics of Landsat 8 OLI-derived NDVI by comparison with multiple satellite sensors and in-situ observations. Remote Sens. Environ. 2015, 164, 298–313. [Google Scholar] [CrossRef]
  22. Li, P.; Jiang, L.; Feng, Z. Cross-Comparison of Vegetation Indices Derived from Landsat-7 Enhanced Thematic Mapper Plus (ETM+) and Landsat-8 Operational Land Imager (OLI) Sensors. Remote Sens. 2014, 6, 310–329. [Google Scholar] [CrossRef]
  23. Mishra, N.; Haque, M.O.; Leigh, L.; Aaron, D.; Helder, D.; Markham, B. Radiometric Cross Calibration of Landsat 8 Operational Land Imager (OLI) and Landsat 7 Enhanced Thematic Mapper Plus (ETM+). Remote Sens. 2014, 6, 12619–12638. [Google Scholar] [CrossRef]
  24. Roy, D.P.; Kovalskyy, V.; Zhang, H.K.; Vermote, E.F.; Yan, L.; Kumar, S.S.; Egorov, A. Characterization of Landsat-7 to Landsat-8 reflective wavelength and normalized difference vegetation index continuity. Remote Sens. Environ. 2016, 185, 57–70. [Google Scholar] [CrossRef]
  25. Chen, F.; Lou, S.; Fan, Q.; Wang, C.; Claverie, M.; Wang, C.; Li, J. Normalized Difference Vegetation Index Continuity of the Landsat 4-5 MSS and TM: Investigations Based on Simulation. Remote Sens. 2019, 11, 1681. [Google Scholar] [CrossRef]
  26. Lulla, K.; Nellis, M.D.; Rundquist, B.; Srivastava, P.K.; Szabo, S. Mission to earth: LANDSAT 9 will continue to view the world. Geocarto Int. 2021, 36, 2261–2263. [Google Scholar] [CrossRef]
  27. Kabir, S.; Pahlevan, N.; O’Shea, R.E.; Barnes, B.B. Leveraging Landsat-8/-9 underfly observations to evaluate consistency in reflectance products over aquatic environments. Remote Sens. Environ. 2023, 296, 113755. [Google Scholar] [CrossRef]
  28. Foga, S.; Scaramuzza, P.L.; Guo, S.; Zhu, Z.; Dilley, R.D.; Beckmann, T.; Schmidt, G.L.; Dwyer, J.L.; Joseph Hughes, M.; Laue, B. Cloud detection algorithm comparison and validation for operational Landsat data products. Remote Sens. Environ. 2017, 194, 379–390. [Google Scholar] [CrossRef]
  29. Friedl, M.A.; Sulla-Menashe, D.; Tan, B.; Schneider, A.; Ramankutty, N.; Sibley, A.; Huang, X. MODIS Collection 5 global land cover: Algorithm refinements and characterization of new datasets. Remote Sens. Environ. 2010, 114, 168–182. [Google Scholar] [CrossRef]
  30. Baret, F.; Morissette, J.T.; Fernandes, R.A.; Champeaux, J.L.; Myneni, R.B.; Chen, J.; Plummer, S.; Weiss, M.; Bacour, C.; Garrigues, S.; et al. Evaluation of the representativeness of networks of sites for the global validation and intercomparison of land biophysical products: Proposition of the CEOS-BELMANIP. IEEE Trans. Geosci. Remote Sens. 2006, 44, 1794–1803. [Google Scholar] [CrossRef]
  31. Zhang, H.K.; Roy, D.P.; Yan, L.; Li, Z.; Huang, H.; Vermote, E.; Skakun, S.; Roger, J.-C. Characterization of Sentinel-2A and Landsat-8 top of atmosphere, surface, and nadir BRDF adjusted reflectance and NDVI differences. Remote Sens. Environ. 2018, 215, 482–494. [Google Scholar] [CrossRef]
  32. Kokaly, R.F.; Clark, R.N.; Swayze, G.A.; Livo, K.E.; Hoefen, T.M.; Pearson, N.C.; Wise, R.A.; Benzel, W.; Lowers, H.A.; Driscoll, R.L.; et al. USGS Spectral Library Version 7; United States Geological Survey: Reston, VA, USA, 2017. [Google Scholar]
  33. Rouse, J.W.; Haas, R.H.; Schell, J.A.; Deering, D.W. Monitoring Vegetation Systems in the Great Plains with ERTS; NASA: Las Cruces, NM, USA, 1974.
  34. Ju, J.; Roy, D.P.; Vermote, E.; Masek, J.; Kovalskyy, V. Continental-scale validation of MODIS-based and LEDAPS Landsat ETM+ atmospheric correction methods. Remote Sens. Environ. 2012, 122, 175–184. [Google Scholar] [CrossRef]
  35. Wagner, T.; Beirle, S.; Sihler, H.; Mies, K. A feasibility study for the retrieval of the total column precipitable water vapour from satellite observations in the blue spectral range. Atmos. Meas. Tech. 2013, 6, 2593–2605. [Google Scholar] [CrossRef]
  36. Hagolle, O.; Huc, M.; Pascual, D.V.; Dedieu, G. A multi-temporal method for cloud detection, applied to FORMOSAT-2, VENµS, LANDSAT and SENTINEL-2 images. Remote Sens. Environ. 2010, 114, 1747–1755. [Google Scholar] [CrossRef]
  37. Van doninck, J.; Tuomisto, H. Evaluation of directional normalization methods for Landsat TM/ETM plus over primary Amazonian lowland forests. Int. J. Appl. Earth Obs.Geoinf. 2017, 58, 249–263. [Google Scholar]
  38. Roy, D.P.; Ju, J.; Lewis, P.; Schaaf, C.; Gao, F.; Hansen, M.; Lindquist, E. Multi-temporal MODIS–Landsat data fusion for relative radiometric normalization, gap filling, and prediction of Landsat data. Remote Sens. Environ. 2008, 112, 3112–3130. [Google Scholar] [CrossRef]
  39. Li, X.; Strahler, A.H. Geometric-optical bidirectional reflectance modeling of the discrete crown vegetation canopy: Effect of crown shape and mutual shadowing. IEEE Trans. Geosci. Remote Sens. 1992, 30, 276–292. [Google Scholar] [CrossRef]
  40. Wanner, W.; Li, X.; Strahler, A.H. On the derivation of kernels for kernel-driven models of bidirectional reflectance. J. Geophys. Res. Atmos. 1995, 100, 21077–21089. [Google Scholar] [CrossRef]
  41. Lucht, W.; Schaaf, C.B.; Strahler, A.H. An algorithm for the retrieval of albedo from space using semiempirical BRDF models. IEEE Trans. Geosci. Remote Sens. 2000, 38, 977–998. [Google Scholar] [CrossRef]
  42. Kokhanovsky, A.A.; Breon, F.M. Validation of an Analytical Snow BRDF Model Using PARASOL Multi-Angular and Multispectral Observations. IEEE Geosci. Remote Sens. Lett. 2012, 9, 928–932. [Google Scholar] [CrossRef]
  43. Li, J.; Carlson, B.E.; Yung, Y.L.; Lv, D.; Hansen, J.; Penner, J.E.; Liao, H.; Ramaswamy, V.; Kahn, R.A.; Zhang, P.; et al. Scattering and absorbing aerosols in the climate system. Nat. Rev. Earth Environ. 2022, 3, 363–379. [Google Scholar] [CrossRef]
  44. Menang, K.P. Sensitivity of near-infrared transmittance calculations for remote sensing applications to recent changes in spectroscopic information. Atmos. Sci. Lett. 2019, 20, e942. [Google Scholar] [CrossRef]
  45. Gao, F.; Jin, Y.; Schaaf, C.B.; Strahler, A.H. Bidirectional NDVI and atmospherically resistant BRDF inversion for vegetation canopy. IEEE Trans. Geosci. Remote Sens. 2002, 40, 1269–1278. [Google Scholar] [CrossRef]
  46. Sun, Y.; Qin, Q.; Ren, H.; Zhang, Y. Decameter Cropland LAI/FPAR Estimation From Sentinel-2 Imagery Using Google Earth Engine. IEEE Trans. Geosci. Remote Sens. 2022, 60, 1–14. [Google Scholar] [CrossRef]
  47. Wulder, M.A.; White, J.C.; Masek, J.G.; Dwyer, J.; Roy, D.P. Continuity of Landsat observations: Short term considerations. Remote Sens. Environ. 2011, 115, 747–751. [Google Scholar] [CrossRef]
  48. Guo, B.; Liu, Y.; Fan, J.; Lu, M.; Zang, W.; Liu, C.; Wang, B.; Huang, X.; Lai, J.; Wu, H. The salinization process and its response to the combined processes of climate change–human activity in the Yellow River Delta between 1984 and 2022. CATENA 2023, 231, 107301. [Google Scholar] [CrossRef]
  49. Schultz, M.; Clevers, J.G.P.W.; Carter, S.; Verbesselt, J.; Avitabile, V.; Quang, H.V.; Herold, M. Performance of vegetation indices from Landsat time series in deforestation monitoring. Int. J. Appl. Earth Obs. Geoinf. 2016, 52, 318–327. [Google Scholar] [CrossRef]
  50. Cao, H.; Han, L.; Li, L. Harmonizing surface reflectance between Landsat-7 ETM + , Landsat-8 OLI, and Sentinel-2 MSI over China. Environ. Sci. Pollut. Res. 2022, 29, 70882–70898. [Google Scholar] [CrossRef] [PubMed]
  51. Drusch, M.; Del Bello, U.; Carlier, S.; Colin, O.; Fernandez, V.; Gascon, F.; Hoersch, B.; Isola, C.; Laberinti, P.; Martimort, P.; et al. Sentinel-2: ESA’s Optical High-Resolution Mission for GMES Operational Services. Remote Sens. Environ. 2012, 120, 25–36. [Google Scholar] [CrossRef]
  52. Claverie, M.; Ju, J.; Masek, J.G.; Dungan, J.L.; Vermote, E.F.; Roger, J.-C.; Skakun, S.V.; Justice, C. The Harmonized Landsat and Sentinel-2 surface reflectance data set. Remote Sens. Environ. 2018, 219, 145–161. [Google Scholar] [CrossRef]
Figure 1. Relative spectral response functions of OLI for the corresponding reflectance bands used in this research. The solid lines depict the spectral filters for Landsat-8, while the dashed lines represent those for Landsat-9.
Remotesensing 15 04948 g001
Figure 2. Geographical distribution of data pairs and BELMANIP sites employed for comparisons between Landsat-8 and Landsat-9 OLI sensors across China landscape.
Remotesensing 15 04948 g002
Figure 3. Flowchart illustrating the overall methodology for analyzing the continuity of reflectance and NDVI data between Landsat-8 and Landsat-9 OLI sensors.
Remotesensing 15 04948 g003
Figure 4. Scatter plot of the Landsat-8 and Landsat-9 top-of-atmosphere (TOA) reflectance and NDVI. The red color signifies areas with a high dot density, while the green color corresponds to regions with a lower density. The black solid lines are fitted using the ordinary least squares (OLS) regression with corresponding equations provided in the top left corner. The black dashed lines are 1:1 lines for reference. The root-mean-square error (RMSE) and correlation coefficient are calculated using Equations (5) and (6), respectively.
Remotesensing 15 04948 g004
Figure 5. Scatter plot of the Landsat-8 and Landsat-9 atmospherically corrected surface reflectance and NDVI. The red color signifies areas with a high dot density, while the green color corresponds to regions with a lower density. The black solid lines are fitted using the ordinary least squares (OLS) regression with corresponding equations provided in the top left corner. The black dashed lines are 1:1 lines for reference. The root-mean-square error (RMSE) and correlation coefficient are calculated using Equations (5) and (6), respectively.
Remotesensing 15 04948 g005
Figure 6. Scatter plot of the Landsat-8 and Landsat-9 BRDF-adjusted to a nadir view and the observed solar zenith reflectance and NDVI. The red color signifies areas with a high dot density, while the green color corresponds to regions with a lower density. The black solid lines are fitted using the ordinary least squares (OLS) regression with corresponding equations provided in the top left corner. The black dashed lines are 1:1 lines for reference. The root-mean-square error (RMSE) and correlation coefficient are calculated as Equations (5) and (6).
Remotesensing 15 04948 g006
Figure 7. Time-series profiles of Landsat-8 and Landsat-9 surface-reflectance-derived NDVI at various BELMANIP sites spanning from November 2021 to October 2022. Polynomial fitting is applied, and the resulting curves are represented by grey dashed lines.
Remotesensing 15 04948 g007aRemotesensing 15 04948 g007b
Disclaimer/Publisher’s Note: The statements, opinions and data contained in all publications are solely those of the individual author(s) and contributor(s) and not of MDPI and/or the editor(s). MDPI and/or the editor(s) disclaim responsibility for any injury to people or property resulting from any ideas, methods, instructions or products referred to in the content.

