
Multi-Scale Feature Map Aggregation and Supervised Domain Adaptation of Fully Convolutional Networks for Urban Building Footprint Extraction


Abstract
:1. Introduction
- Loss of context information at different scales of feature maps in CNNs.
- The domain-shift problem due to the difference in training and testing data.
- Development of MSA-UNET and MSA-ResUNET networks to tackle the loss of context information at different scales of feature maps in CNNs.
- Development of a high-resolution dataset for an experimental design within DL framework.
- Evaluation of four settings of supervised domain adaptation to tackle the problem of domain-shift in different datasets.
- A comprehensive evaluation approach in cross-domain settings.
2. Related Works
2.1. Dl-Based Urban Feature Extraction from VHR EO Imagery
2.1.1. CNNs and FCNs for Building Footprint Extraction
2.1.2. Encoder–Decoder Network Architectures
2.1.3. Multi-Scale Feature Aggregation on Encoder–Decoder Networks
2.2. The Domain-Shift Problem, Transfer Learning, and Domain Adaptation
3. Method
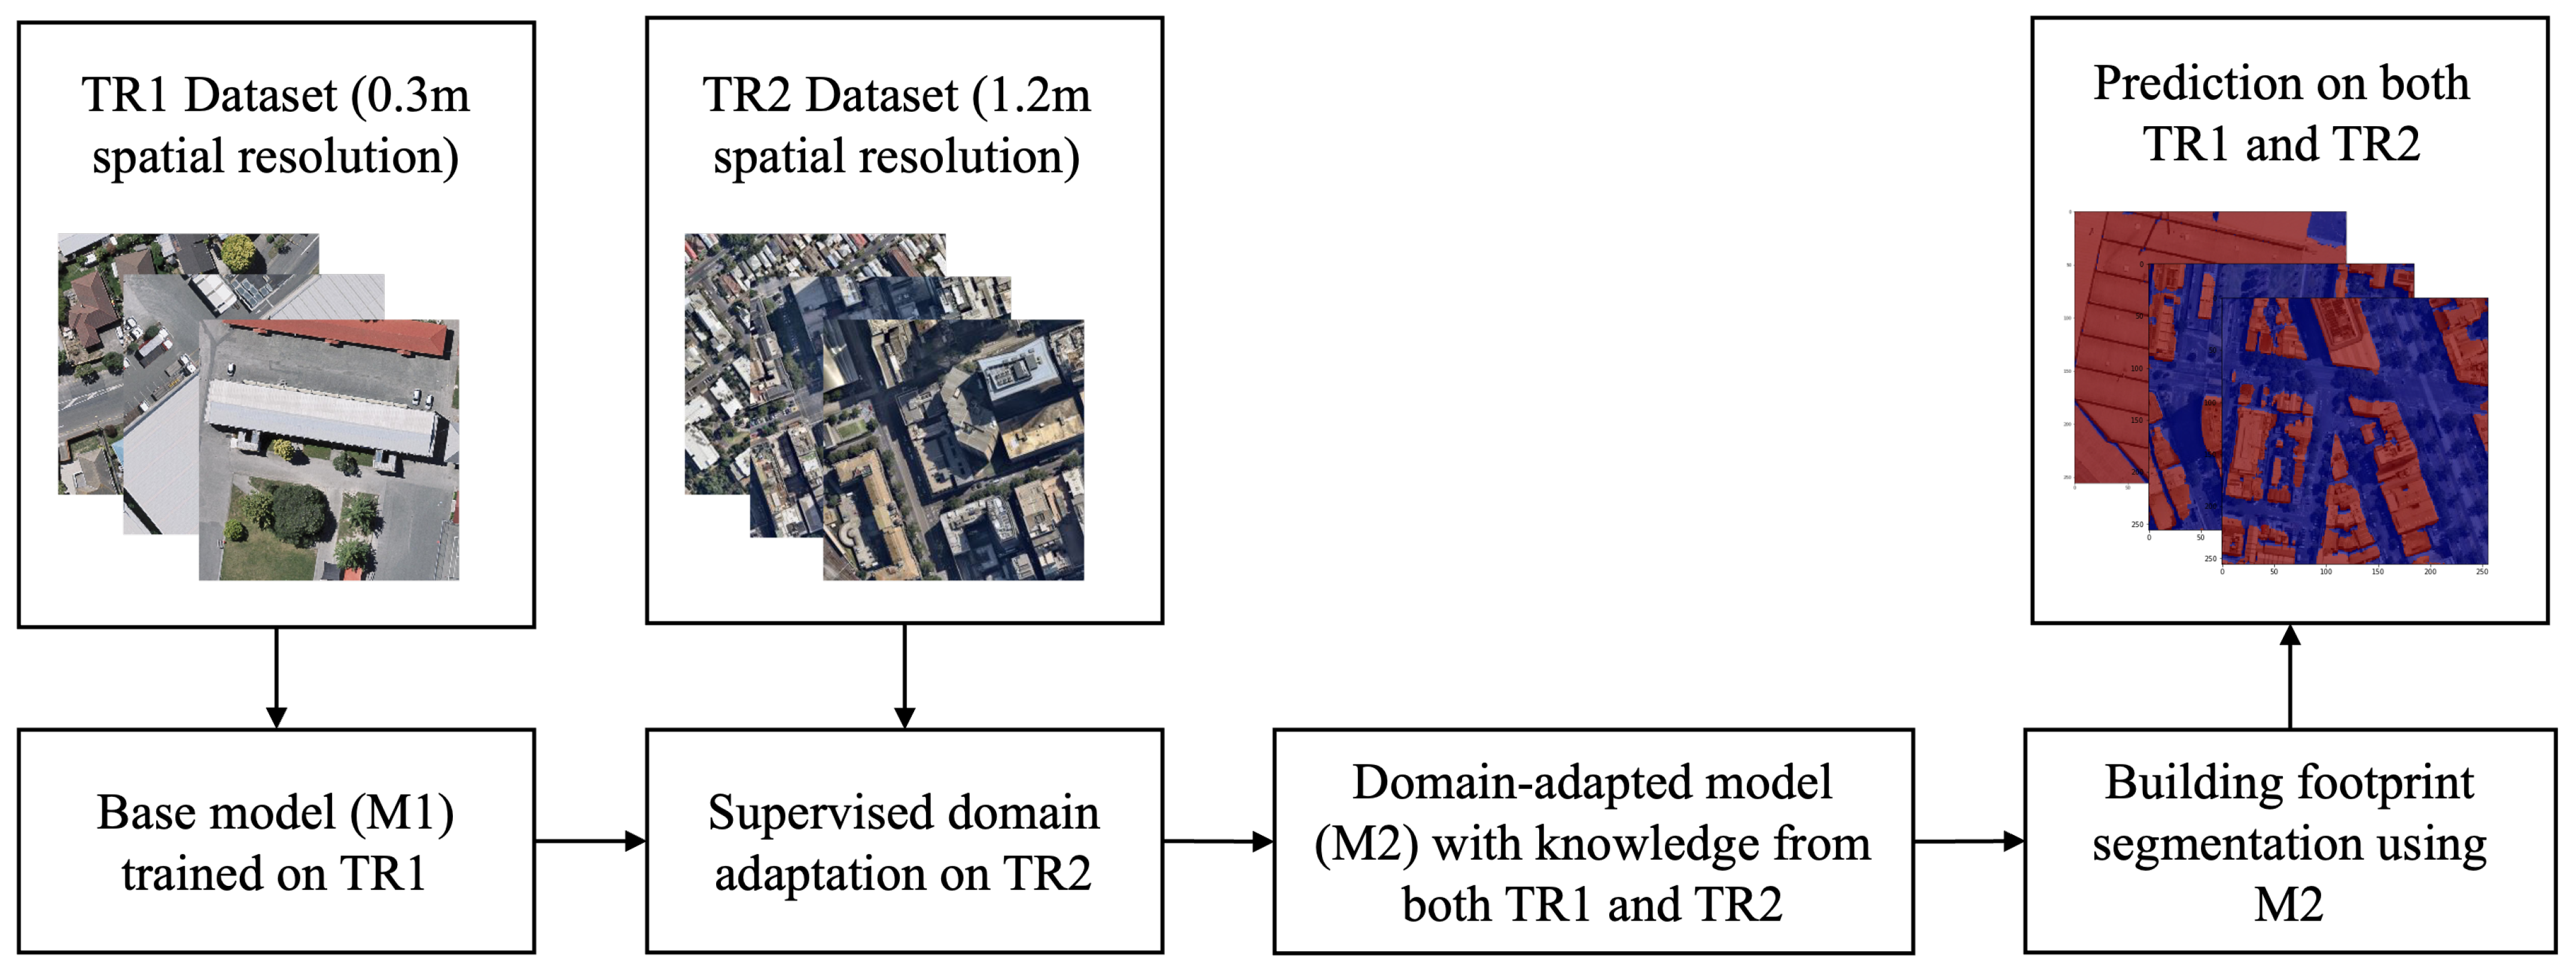
3.1. Data Preparation
3.2. MSA-UNET
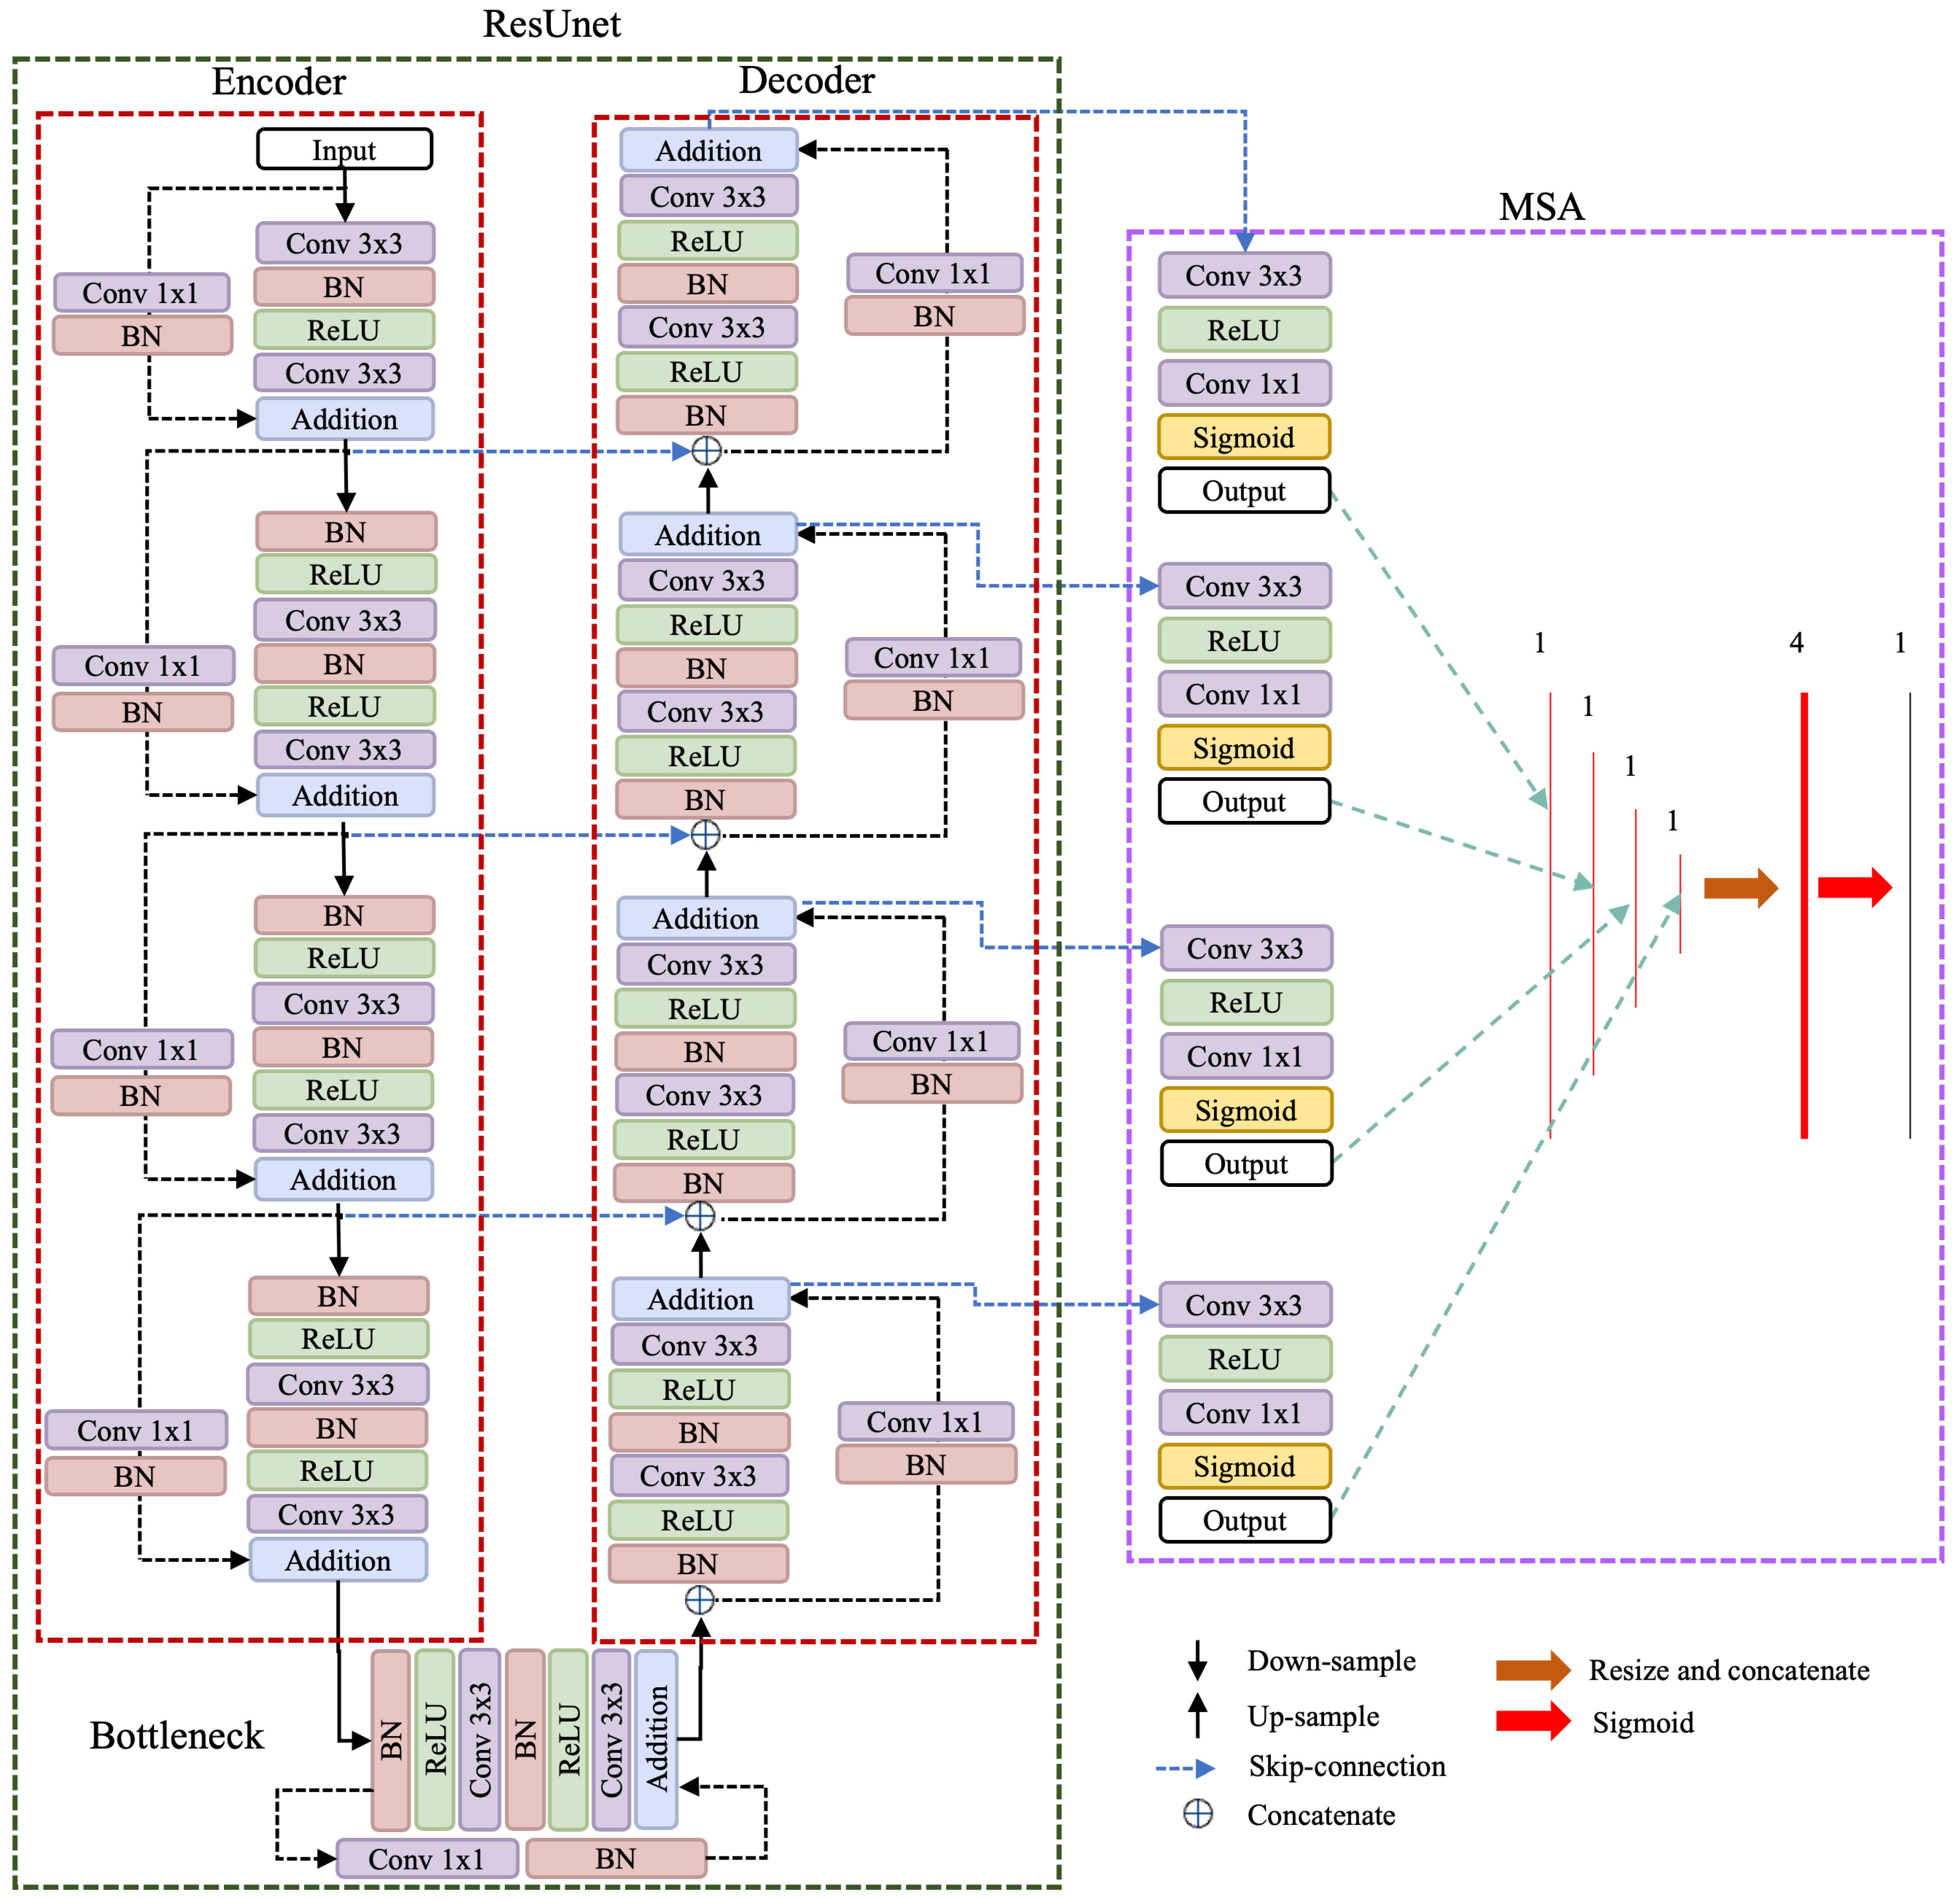
3.3. MSA-ResUNET
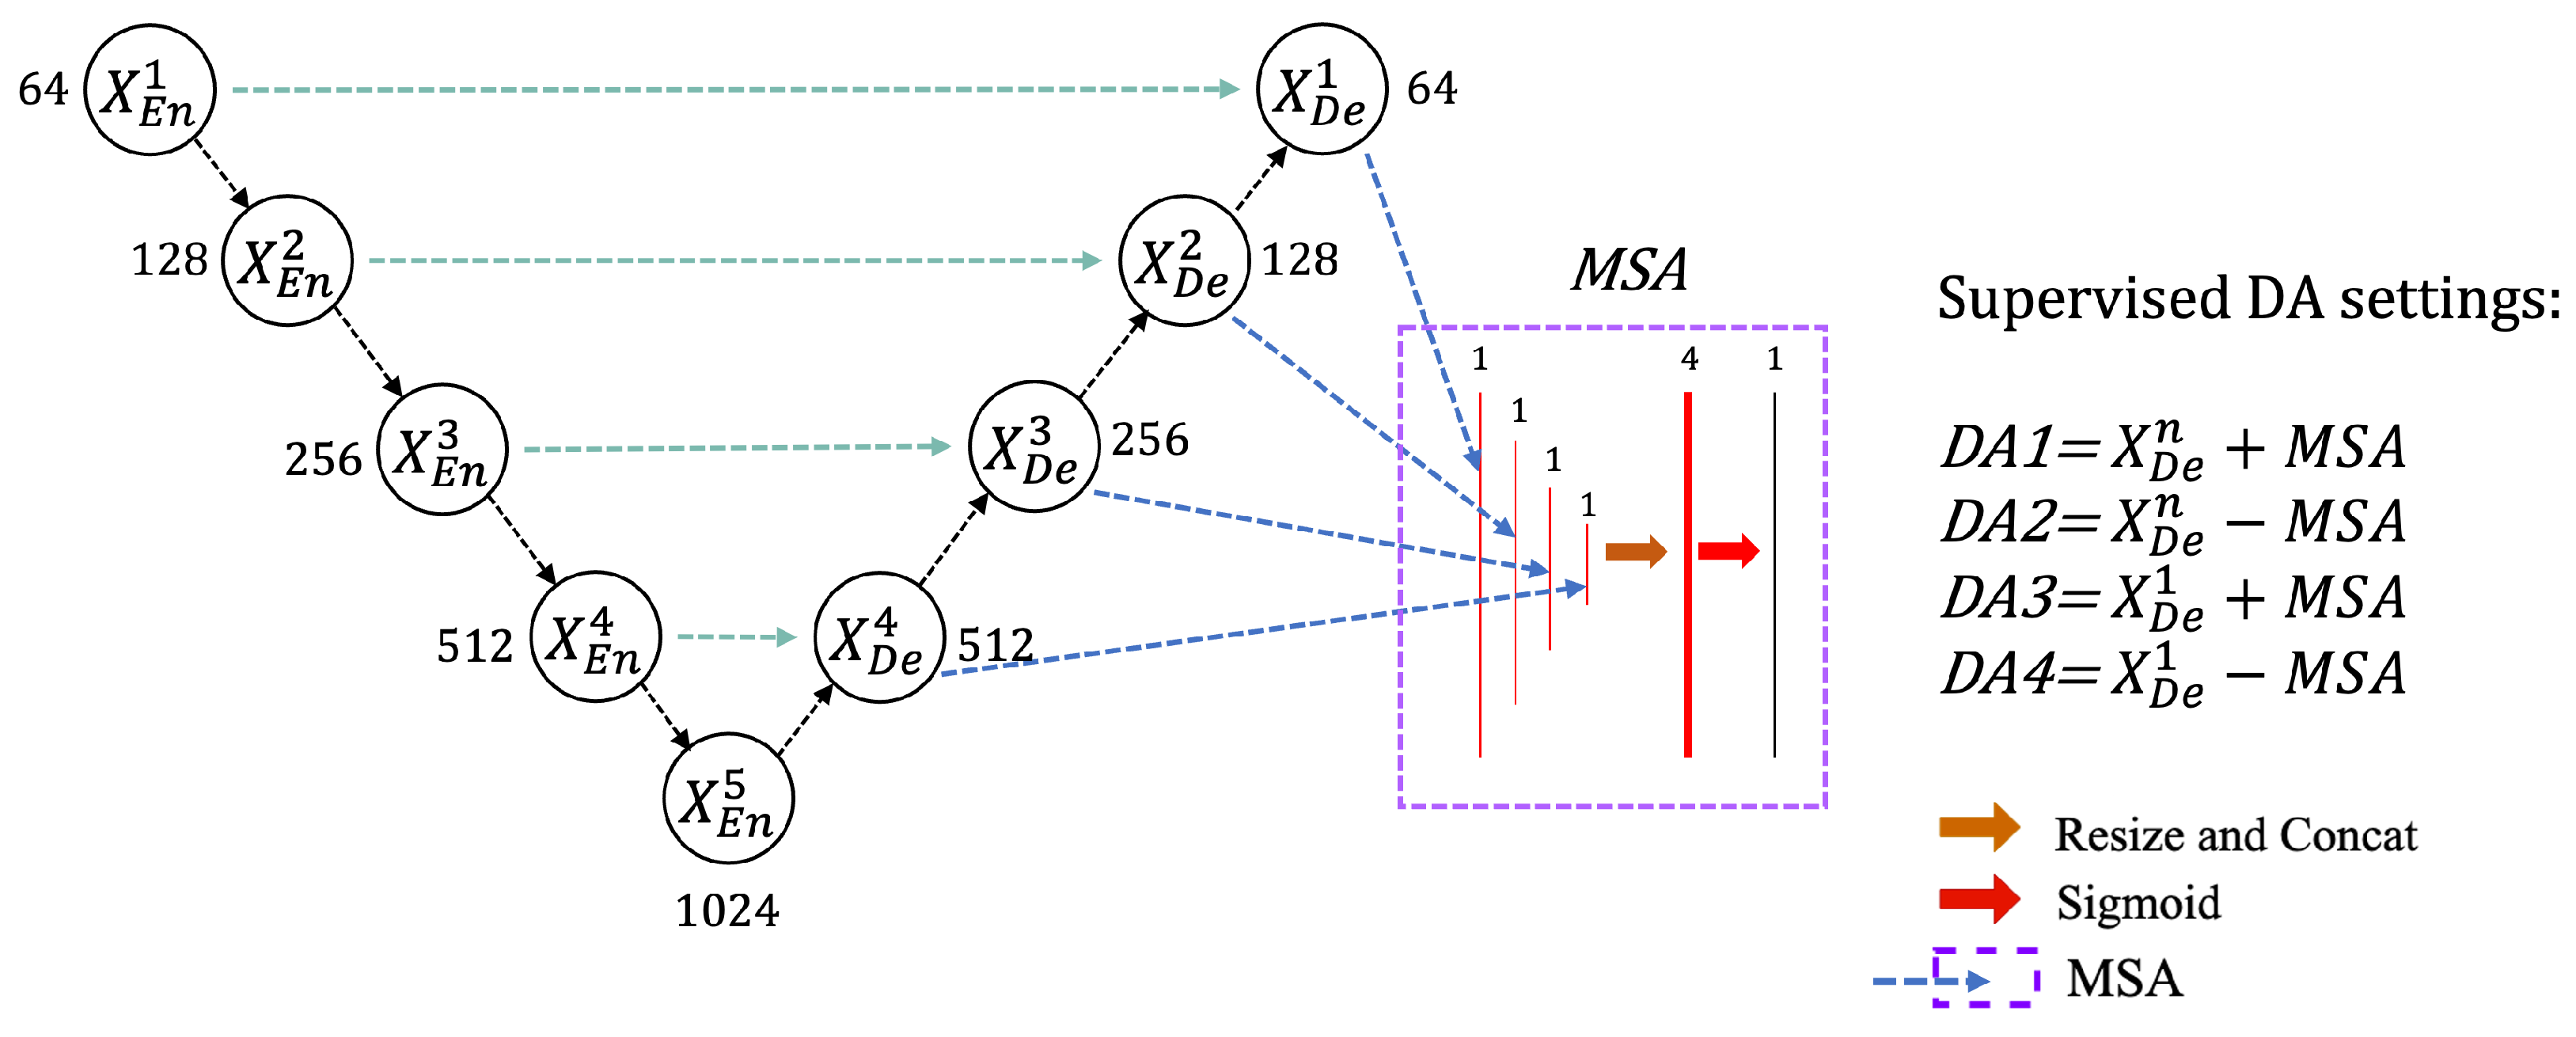
3.4. Training and Supervised Domain Adaptation of MSA-UNET
4. Experiments and Results
4.1. Evaluation Metrics
4.2. Training Details
4.3. MSA-UNET and MSA-ResUNET
4.4. Comparison to the SOTA
4.5. Effects of Domain Shift
4.6. Supervised Domain Adaptation
5. Discussion
5.1. Domain-Shift and Supervised Domain Adaptation
5.2. Melbourne Building Dataset in Cross-Domain Validation
5.3. Limitations and Future Direction
6. Conclusions
Author Contributions
Funding
Institutional Review Board Statement
Informed Consent Statement
Data Availability Statement
Acknowledgments
Conflicts of Interest
References
- Neupane, B.; Horanont, T.; Aryal, J. Deep learning-based semantic segmentation of urban features in satellite images: A review and meta-analysis. Remote Sens. 2021, 13, 808. [Google Scholar] [CrossRef]
- Long, J.; Shelhamer, E.; Darrell, T. Fully convolutional networks for semantic segmentation. In Proceedings of the IEEE Conference on Computer Vision and Pattern Recognition, Boston, MA, USA, 7–12 June 2015; pp. 3431–3440. [Google Scholar]
- Ronneberger, O.; Fischer, P.; Brox, T. U-net: Convolutional networks for biomedical image segmentation. In Proceedings of the International Conference on Medical Image Computing and Computer-Assisted Intervention, Munich, Germany, 5–9 October 2015; pp. 234–241. [Google Scholar]
- Zhang, Z.; Liu, Q.; Wang, Y. Road extraction by deep residual u-net. IEEE Geosci. Remote Sens. Lett. 2018, 15, 749–753. [Google Scholar] [CrossRef] [Green Version]
- Badrinarayanan, V.; Kendall, A.; Cipolla, R. Segnet: A deep convolutional encoder-decoder architecture for image segmentation. IEEE Trans. Pattern Anal. Mach. Intell. 2017, 39, 2481–2495. [Google Scholar] [CrossRef]
- Wei, S.; Ji, S.; Lu, M. Toward automatic building footprint delineation from aerial images using CNN and regularization. IEEE Trans. Geosci. Remote Sens. 2019, 58, 2178–2189. [Google Scholar] [CrossRef]
- Lin, T.Y.; Dollár, P.; Girshick, R.; He, K.; Hariharan, B.; Belongie, S. Feature pyramid networks for object detection. In Proceedings of the IEEE Conference on Computer Vision and Pattern Recognition, Honolulu, HI, USA, 21–26 July 2017; pp. 2117–2125. [Google Scholar]
- Pan, S.J.; Yang, Q. A survey on transfer learning. IEEE Trans. Knowl. Data Eng. 2009, 22, 1345–1359. [Google Scholar] [CrossRef]
- Ji, S.; Wei, S.; Lu, M. Fully convolutional networks for multisource building extraction from an open aerial and satellite imagery data set. IEEE Trans. Geosci. Remote Sens. 2018, 57, 574–586. [Google Scholar] [CrossRef]
- Stein, A.; Aryal, J.; Gort, G. Use of the Bradley-Terry model to quantify association in remotely sensed images. IEEE Trans. Geosci. Remote Sens. 2005, 43, 852–856. [Google Scholar] [CrossRef]
- Shadman Roodposhti, M.; Aryal, J.; Lucieer, A.; Bryan, B.A. Uncertainty assessment of hyperspectral image classification: Deep learning vs. random forest. Entropy 2019, 21, 78. [Google Scholar] [CrossRef] [Green Version]
- Neupane, B.; Horanont, T.; Duy, H.N.; Suebvong, S.; Mahattanawutakorn, T. An Open-Source UAV Image Processing Web Service for Crop Health Monitoring. In Proceedings of the 2019 8th International Congress on Advanced Applied Informatics (IIAI-AAI), Toyama, Japan, 7–11 July 2019; pp. 11–16. [Google Scholar]
- Neupane, B.; Horanont, T.; Hung, N.D. Deep learning based banana plant detection and counting using high-resolution red-green-blue (RGB) images collected from unmanned aerial vehicle (UAV). PLoS ONE 2019, 14, e0223906. [Google Scholar] [CrossRef]
- Neupane, B.; Horanont, T.; Aryal, J. Real-Time Vehicle Classification and Tracking Using a Transfer Learning-Improved Deep Learning Network. Sensors 2022, 22, 3813. [Google Scholar] [CrossRef]
- Xie, Y.; Cai, J.; Bhojwani, R.; Shekhar, S.; Knight, J. A locally-constrained yolo framework for detecting small and densely-distributed building footprints. Int. J. Geogr. Inf. Sci. 2020, 34, 777–801. [Google Scholar] [CrossRef]
- Aryal, J.; Dutta, R. Smart city and geospatiality: Hobart deeply learned. In Proceedings of the 2015 31st IEEE International Conference on Data Engineering Workshops, Seoul, Republic of Korea, 13–17 April 2015; pp. 108–109. [Google Scholar]
- LeCun, Y.; Boser, B.; Denker, J.S.; Henderson, D.; Howard, R.E.; Hubbard, W.; Jackel, L.D. Backpropagation applied to handwritten zip code recognition. Neural Comput. 1989, 1, 541–551. [Google Scholar] [CrossRef]
- Krizhevsky, A.; Sutskever, I.; Hinton, G.E. Imagenet classification with deep convolutional neural networks. In Proceedings of the Advances in Neural Information Processing Systems, Lake Tahoe, NV, USA, 3–6 December 2012; pp. 1097–1105. [Google Scholar]
- Simonyan, K.; Zisserman, A. Very deep convolutional networks for large-scale image recognition. arXiv 2014, arXiv:1409.1556. [Google Scholar]
- Szegedy, C.; Liu, W.; Jia, Y.; Sermanet, P.; Reed, S.; Anguelov, D.; Erhan, D.; Vanhoucke, V.; Rabinovich, A. Going deeper with convolutions. In Proceedings of the IEEE Conference on Computer Vision and Pattern Recognition, Boston, MA, USA, 7–12 June 2015; pp. 1–9. [Google Scholar]
- He, K.; Zhang, X.; Ren, S.; Sun, J. Deep residual learning for image recognition. In Proceedings of the IEEE Conference on Computer Vision and Pattern Recognition, Las Vegas, NV, USA, 26 June – 1 July 2016; pp. 770–778. [Google Scholar]
- Chollet, F. Xception: Deep learning with depthwise separable convolutions. In Proceedings of the IEEE Conference on Computer Vision and Pattern Recognition, Honolulu, HI, USA, 21–26 July 2017; pp. 1251–1258. [Google Scholar]
- Lin, G.; Milan, A.; Shen, C.; Reid, I. Refinenet: Multi-path refinement networks for high-resolution semantic segmentation. In Proceedings of the IEEE Conference on Computer Vision and Pattern Recognition, Honolulu, HI, USA, 21–26 July 2017; pp. 1925–1934. [Google Scholar]
- Mnih, V.; Hinton, G.E. Learning to detect roads in high-resolution aerial images. In Proceedings of the European Conference on Computer Vision, Crete, Greece, 5–11 September 2010; pp. 210–223. [Google Scholar]
- Mnih, V. Machine Learning for Aerial Image Labeling. Ph.D. Thesis, University of Toronto, Toronto, ON, Canada, 2013. [Google Scholar]
- Saito, S.; Aoki, Y. Building and road detection from large aerial imagery. In Proceedings of the Image Processing: Machine Vision Applications VIII. International Society for Optics and Photonics, San Francisco, CA, USA, 8–12 February 2015; Volume 9405, p. 94050K. [Google Scholar]
- Saito, S.; Yamashita, T.; Aoki, Y. Multiple object extraction from aerial imagery with convolutional neural networks. Electron. Imaging 2016, 2016, 1–9. [Google Scholar] [CrossRef]
- Vakalopoulou, M.; Karantzalos, K.; Komodakis, N.; Paragios, N. Building detection in very high resolution multispectral data with deep learning features. In Proceedings of the 2015 IEEE International Geoscience and Remote Sensing Symposium (IGARSS), Milan, Italy, 26–31 July 2015; pp. 1873–1876. [Google Scholar]
- Zhong, Z.; Li, J.; Cui, W.; Jiang, H. Fully convolutional networks for building and road extraction: Preliminary results. In Proceedings of the 2016 IEEE International Geoscience and Remote Sensing Symposium (IGARSS), Beijing, China, 10–15 July 2016; pp. 1591–1594. [Google Scholar]
- Maggiori, E.; Tarabalka, Y.; Charpiat, G.; Alliez, P. Convolutional neural networks for large-scale remote-sensing image classification. IEEE Trans. Geosci. Remote Sens. 2016, 55, 645–657. [Google Scholar] [CrossRef] [Green Version]
- Marcu, A.E.; Leordeanu, M. Object contra context: Dual local-global semantic segmentation in aerial images. In Proceedings of the Workshops at the Thirty-First AAAI Conference on Artificial Intelligence, San Francisco, CA, USA, 4–9 February 2017. [Google Scholar]
- Zhao, K.; Kang, J.; Jung, J.; Sohn, G. Building extraction from satellite images using mask R-CNN with building boundary regularization. In Proceedings of the IEEE Conference on Computer Vision and Pattern Recognition Workshops, Salt Lake City, UT, USA, 18–22 June 2018; pp. 247–251. [Google Scholar]
- Yang, H.L.; Yuan, J.; Lunga, D.; Laverdiere, M.; Rose, A.; Bhaduri, B. Building extraction at scale using convolutional neural network: Mapping of the united states. IEEE J. Sel. Top. Appl. Earth Obs. Remote Sens. 2018, 11, 2600–2614. [Google Scholar] [CrossRef] [Green Version]
- Griffiths, D.; Boehm, J. Improving public data for building segmentation from Convolutional Neural Networks (CNNs) for fused airborne lidar and image data using active contours. ISPRS J. Photogramm. Remote Sens. 2019, 154, 70–83. [Google Scholar] [CrossRef]
- Zhang, M.; Gao, F.; Dong, J.; Qi, L. Multi-Scale Feature Fusion for Hyperspectral and Lidar Data Joint Classification. In Proceedings of the IGARSS 2022–2022 IEEE International Geoscience and Remote Sensing Symposium, Kuala Lumpur, Malaysia, 17–22 July 2022; pp. 2856–2859. [Google Scholar]
- Huang, L.; Chen, C.; Yun, J.; Sun, Y.; Tian, J.; Hao, Z.; Yu, H.; Ma, H. Multi-Scale Feature Fusion Convolutional Neural Network for Indoor Small Target Detection. Front. Neurorobot. 2022, 16, 881021. [Google Scholar] [CrossRef]
- Zhou, Z.; Siddiquee, M.M.R.; Tajbakhsh, N.; Liang, J. Unet++: Redesigning skip connections to exploit multiscale features in image segmentation. IEEE Trans. Med. Imaging 2019, 39, 1856–1867. [Google Scholar] [CrossRef] [Green Version]
- Huang, H.; Lin, L.; Tong, R.; Hu, H.; Zhang, Q.; Iwamoto, Y.; Han, X.; Chen, Y.W.; Wu, J. Unet 3+: A full-scale connected unet for medical image segmentation. In Proceedings of the ICASSP 2020-2020 IEEE International Conference on Acoustics, Speech and Signal Processing (ICASSP), Barcelona, Spain, 4–8 May 2020; pp. 1055–1059. [Google Scholar]
- Xu, Y.; Wu, L.; Xie, Z.; Chen, Z. Building extraction in very high resolution remote sensing imagery using deep learning and guided filters. Remote Sens. 2018, 10, 144. [Google Scholar] [CrossRef] [Green Version]
- Li, W.; He, C.; Fang, J.; Zheng, J.; Fu, H.; Yu, L. Semantic segmentation-based building footprint extraction using very high-resolution satellite images and multi-source GIS data. Remote Sens. 2019, 11, 403. [Google Scholar] [CrossRef]
- Yi, Y.; Zhang, Z.; Zhang, W.; Zhang, C.; Li, W.; Zhao, T. Semantic segmentation of urban buildings from vhr remote sensing imagery using a deep convolutional neural network. Remote Sens. 2019, 11, 1774. [Google Scholar] [CrossRef] [Green Version]
- Bischke, B.; Helber, P.; Folz, J.; Borth, D.; Dengel, A. Multi-task learning for segmentation of building footprints with deep neural networks. In Proceedings of the 2019 IEEE International Conference on Image Processing (ICIP), Taipei, Taiwan, 22–25 September 2019; pp. 1480–1484. [Google Scholar]
- Qin, Y.; Wu, Y.; Li, B.; Gao, S.; Liu, M.; Zhan, Y. Semantic segmentation of building roof in dense urban environment with deep convolutional neural network: A case study using GF2 VHR imagery in China. Sensors 2019, 19, 1164. [Google Scholar] [CrossRef] [PubMed] [Green Version]
- Abdollahi, A.; Pradhan, B.; Alamri, A.M. An Ensemble Architecture of Deep Convolutional Segnet and Unet Networks for Building Semantic Segmentation from High-resolution Aerial Images. Geocarto Int. 2020, 1–13. [Google Scholar] [CrossRef]
- Pan, Z.; Xu, J.; Guo, Y.; Hu, Y.; Wang, G. Deep Learning Segmentation and Classification for Urban Village Using a Worldview Satellite Image Based on U-Net. Remote Sens. 2020, 12, 1574. [Google Scholar] [CrossRef]
- Sariturk, B.; Bayram, B.; Duran, Z.; Seker, D.Z. Feature Extraction from Satellite Images Using Segnet and Fully Convolutional Networks (FCN). Int. J. Eng. Geosci. 2020, 5, 138–143. [Google Scholar] [CrossRef]
- Ayala, C.; Sesma, R.; Aranda, C.; Galar, M. A Deep Learning Approach to an Enhanced Building Footprint and Road Detection in High-Resolution Satellite Imagery. Remote Sens. 2021, 13, 3135. [Google Scholar] [CrossRef]
- Jian, M.; Wang, J.; Yu, H.; Wang, G.; Meng, X.; Yang, L.; Dong, J.; Yin, Y. Visual saliency detection by integrating spatial position prior of object with background cues. Expert Syst. Appl. 2021, 168, 114219. [Google Scholar] [CrossRef]
- Yang, D.; Liu, G.; Ren, M.; Xu, B.; Wang, J. A multi-scale feature fusion method based on U-Net for retinal vessel segmentation. Entropy 2020, 22, 811. [Google Scholar] [CrossRef]
- Su, R.; Zhang, D.; Liu, J.; Cheng, C. MSU-net: Multi-scale U-net for 2D medical image segmentation. Front. Genet. 2021, 12, 639930. [Google Scholar] [CrossRef]
- Lu, D.; Cheng, S.; Wang, L.; Song, S. Multi-scale feature progressive fusion network for remote sensing image change detection. Sci. Rep. 2022, 12, 11968. [Google Scholar] [CrossRef] [PubMed]
- Liu, Y.; Fan, B.; Wang, L.; Bai, J.; Xiang, S.; Pan, C. Semantic labeling in very high resolution images via a self-cascaded convolutional neural network. ISPRS J. Photogramm. Remote Sens. 2018, 145, 78–95. [Google Scholar] [CrossRef] [Green Version]
- Yang, H.; Wu, P.; Yao, X.; Wu, Y.; Wang, B.; Xu, Y. Building extraction in very high resolution imagery by dense-attention networks. Remote Sens. 2018, 10, 1768. [Google Scholar] [CrossRef] [Green Version]
- Wu, G.; Shao, X.; Guo, Z.; Chen, Q.; Yuan, W.; Shi, X.; Xu, Y.; Shibasaki, R. Automatic building segmentation of aerial imagery using multi-constraint fully convolutional networks. Remote Sens. 2018, 10, 407. [Google Scholar] [CrossRef] [Green Version]
- Chen, Q.; Wang, L.; Wu, Y.; Wu, G.; Guo, Z.; Waslander, S.L. Aerial imagery for roof segmentation: A large-scale dataset towards automatic mapping of buildings. arXiv 2018, arXiv:1807.09532. [Google Scholar] [CrossRef] [Green Version]
- Ji, S.; Wei, S.; Lu, M. A scale robust convolutional neural network for automatic building extraction from aerial and satellite imagery. Int. J. Remote Sens. 2019, 40, 3308–3322. [Google Scholar] [CrossRef]
- Chen, L.C.; Zhu, Y.; Papandreou, G.; Schroff, F.; Adam, H. Encoder-decoder with atrous separable convolution for semantic image segmentation. In Proceedings of the European Conference on Computer Vision (ECCV), Munich, Germany, 8–14 September 2018; pp. 801–818. [Google Scholar]
- Bozinovski, S.; Fulgosi, A. The influence of pattern similarity and transfer learning upon training of a base perceptron B2. In Proceedings of the Symposium Informatica; 1976; Volume 3, pp. 121–126. Available online: https://www.informatica.si/index.php/informatica/article/view/2828 (accessed on 25 November 2022).
- Weiss, K.; Khoshgoftaar, T.M.; Wang, D. A survey of transfer learning. J. Big Data 2016, 3, 9. [Google Scholar] [CrossRef] [Green Version]
- Saha, A.; Rai, P.; Daumé, H.; Venkatasubramanian, S.; DuVall, S.L. Active supervised domain adaptation. In Proceedings of the Joint European Conference on Machine Learning and Knowledge Discovery in Databases, Athens, Greece, 5–9 September 2011; pp. 97–112. [Google Scholar]
- Motiian, S.; Piccirilli, M.; Adjeroh, D.A.; Doretto, G. Unified deep supervised domain adaptation and generalization. In Proceedings of the IEEE International Conference on Computer Vision, Venice, Italy, 22–29 October 2017; pp. 5715–5725. [Google Scholar]
- Panboonyuen, T.; Jitkajornwanich, K.; Lawawirojwong, S.; Srestasathiern, P.; Vateekul, P. Semantic segmentation on remotely sensed images using an enhanced global convolutional network with channel attention and domain specific transfer learning. Remote Sens. 2019, 11, 83. [Google Scholar] [CrossRef] [Green Version]
- Wurm, M.; Stark, T.; Zhu, X.X.; Weigand, M.; Taubenböck, H. Semantic segmentation of slums in satellite images using transfer learning on fully convolutional neural networks. ISPRS J. Photogramm. Remote Sens. 2019, 150, 59–69. [Google Scholar] [CrossRef]
- Everingham, M.; Van Gool, L.; Williams, C.K.; Winn, J.; Zisserman, A. The pascal visual object classes (voc) challenge. Int. J. Comput. Vis. 2010, 88, 303–338. [Google Scholar] [CrossRef] [Green Version]
- Deng, J.; Dong, W.; Socher, R.; Li, L.J.; Li, K.; Fei-Fei, L. Imagenet: A large-scale hierarchical image database. In Proceedings of the 2009 IEEE Conference on Computer Vision and Pattern Recognition, Miami, FL, USA, 20–25 June 2009; pp. 248–255. [Google Scholar]
- Liu, W.; Su, F.; Jin, X.; Li, H.; Qin, R. Bispace Domain Adaptation Network for Remotely Sensed Semantic Segmentation. IEEE Trans. Geosci. Remote Sens. 2020. [Google Scholar] [CrossRef]
- Neupane, B.; Aryal, J.; Rajabifard, A. Building Footprint Segmentation using Transfer Learning: A case study of the City of Melbourne. ISPRS Ann. Photogramm. Remote Sens. Spatial Inf. Sci. 2022, 10, 173–179. [Google Scholar] [CrossRef]
- Tan, C.; Sun, F.; Kong, T.; Zhang, W.; Yang, C.; Liu, C. A survey on deep transfer learning. In Proceedings of the International Conference on Artificial Neural Networks, Rhodes, Greece, 4–7 October 2018; pp. 270–279. [Google Scholar]
- Taormina, V.; Cascio, D.; Abbene, L.; Raso, G. Performance of fine-tuning convolutional neural networks for HEP-2 image classification. Appl. Sci. 2020, 10, 6940. [Google Scholar] [CrossRef]
- Sudre, C.H.; Li, W.; Vercauteren, T.; Ourselin, S.; Jorge Cardoso, M. Generalised dice overlap as a deep learning loss function for highly unbalanced segmentations. In Deep Learning in Medical Image Analysis and Multimodal Learning for Clinical Decision Support; Springer: Berlin, Germany, 2017; pp. 240–248. [Google Scholar]
- Chicco, D.; Jurman, G. The advantages of the Matthews correlation coefficient (MCC) over F1 score and accuracy in binary classification evaluation. BMC Genom. 2020, 21, 6. [Google Scholar] [CrossRef] [PubMed]


| Dataset | Base Models | Pixel Acc. | Adjusted Acc. | F1 Score | IoU | MCC |
|---|---|---|---|---|---|---|
| TR1 | MSA-UNET | 0.979 | 0.863 | 0.735 | 0.672 | 0.718 |
| MSA-ResUNET | 0.981 | 0.861 | 0.734 | 0.673 | 0.725 | |
| TR2 | MSA-UNET | 0.951 | 0.722 | 0.477 | 0.383 | 0.453 |
| MSA-ResUNET | 0.928 | 0.764 | 0.414 | 0.321 | 0.430 |
| Dataset | FCN Variant | Base Models | Pixel Acc. | Adjusted Acc. | F1 Score | IoU | MCC |
|---|---|---|---|---|---|---|---|
| TR1 | U-Net variant | MSA-UNET | 0.979 | 0.863 | 0.735 | 0.672 | 0.718 |
| U-Net | 0.973 | 0.826 | 0.844 | 0.770 | 0.681 | ||
| ResUNET variant | MSA-ResUNET | 0.981 | 0.861 | 0.734 | 0.673 | 0.725 | |
| ResUNET | 0.969 | 0.833 | 0.822 | 0.741 | 0.665 | ||
| VGG-16 encoder | MA-FCN | 0.981 | 0.862 | 0.729 | 0.667 | 0.725 | |
| SegNet | 0.969 | 0.831 | 0.666 | 0.584 | 0.673 | ||
| U-Net++ | 0.974 | 0.828 | 0.823 | 0.749 | 0.685 | ||
| U-Net3+ | 0.981 | 0.855 | 0.688 | 0.615 | 0.723 | ||
| TR2 | U-Net variant | MSA-UNET | 0.951 | 0.722 | 0.477 | 0.383 | 0.453 |
| U-Net | 0.928 | 0.760 | 0.437 | 0.342 | 0.479 | ||
| ResUNET variant | MSA-ResUNET | 0.928 | 0.764 | 0.414 | 0.321 | 0.430 | |
| ResUNET | 0.872 | 0.745 | 0.520 | 0.423 | 0.351 | ||
| VGG-16 encoder | MA-FCN | 0.945 | 0.729 | 0.453 | 0.360 | 0.436 | |
| SegNet | 0.854 | 0.735 | 0.376 | 0.277 | 0.376 | ||
| U-Net++ | 0.930 | 0.728 | 0.602 | 0.510 | 0.389 | ||
| U-Net3+ | 0.953 | 0.778 | 0.471 | 0.380 | 0.496 | ||
| Evaluation Metrics | M1(TR1) Validated on TR2 | M1(TR2) Validated on TR1 | ||||
|---|---|---|---|---|---|---|
| MA-FCN | MSA-UNET | MSA-ResUNET | MA-FCN | MSA-UNET | MSA-ResUNET | |
| Pixel Acc. | 0.907 | 0.909 | 0.909 | 0.927 | 0.928 | 0.878 |
| Adjusted Acc. | 0.560 | 0.576 | 0.538 | 0.761 | 0.757 | 0.772 |
| F1 score | 0.154 | 0.217 | 0.120 | 0.522 | 0.529 | 0.451 |
| IoU | 0.092 | 0.138 | 0.072 | 0.401 | 0.412 | 0.327 |
| MCC | 0.165 | 0.206 | 0.141 | 0.499 | 0.500 | 0.450 |
| Evaluation Metric | DA1 | DA2 | DA3 | DA4 |
|---|---|---|---|---|
| Time/step (ms) | 256 | 242 | 152 | 137 |
| Pixel Acc. | 0.942 | 0.943 | 0.937 | 0.934 |
| Adjusted Acc. | 0.736 | 0.740 | 0.712 | 0.741 |
| F1 score | 0.649 | 0.486 | 0.586 | 0.449 |
| IoU | 0.558 | 0.388 | 0.485 | 0.346 |
| MCC | 0.431 | 0.453 | 0.402 | 0.427 |
| Network | Evaluation Metrics | M1(TR1) Validated on TR2 (before DA) | M2 on TR2 (after DA) | M1(TR2) Validated on TR1 (before DA) | M2 on TR1 (after DA) |
|---|---|---|---|---|---|
| MSA-UNET | Pixel Acc. | 0.909 | 0.942 | 0.928 | 0.949 |
| Adjusted Acc. | 0.576 | 0.736 | 0.757 | 0.828 | |
| F1 score | 0.217 | 0.649 | 0.529 | 0.710 | |
| IoU | 0.138 | 0.558 | 0.412 | 0.602 | |
| MCC | 0.206 | 0.431 | 0.500 | 0.606 | |
| MSA-ResUNET | Pixel Acc. | 0.909 | 0.945 | 0.878 | 0.926 |
| Adjusted Acc. | 0.538 | 0.767 | 0.772 | 0.809 | |
| F1 score | 0.120 | 0.627 | 0.451 | 0.599 | |
| IoU | 0.072 | 0.531 | 0.327 | 0.486 | |
| MCC | 0.141 | 0.452 | 0.450 | 0.552 |
Disclaimer/Publisher’s Note: The statements, opinions and data contained in all publications are solely those of the individual author(s) and contributor(s) and not of MDPI and/or the editor(s). MDPI and/or the editor(s) disclaim responsibility for any injury to people or property resulting from any ideas, methods, instructions or products referred to in the content. |
© 2023 by the authors. Licensee MDPI, Basel, Switzerland. This article is an open access article distributed under the terms and conditions of the Creative Commons Attribution (CC BY) license (https://creativecommons.org/licenses/by/4.0/).
Share and Cite
Aryal, J.; Neupane, B. Multi-Scale Feature Map Aggregation and Supervised Domain Adaptation of Fully Convolutional Networks for Urban Building Footprint Extraction. Remote Sens. 2023, 15, 488. https://doi.org/10.3390/rs15020488
Aryal J, Neupane B. Multi-Scale Feature Map Aggregation and Supervised Domain Adaptation of Fully Convolutional Networks for Urban Building Footprint Extraction. Remote Sensing. 2023; 15(2):488. https://doi.org/10.3390/rs15020488
Chicago/Turabian StyleAryal, Jagannath, and Bipul Neupane. 2023. "Multi-Scale Feature Map Aggregation and Supervised Domain Adaptation of Fully Convolutional Networks for Urban Building Footprint Extraction" Remote Sensing 15, no. 2: 488. https://doi.org/10.3390/rs15020488