Next Issue
Volume 15, February-1
Previous Issue
Volume 15, January-1
 
 
remotesensing-logo

Journal Browser

Journal Browser

Remote Sens., Volume 15, Issue 2 (January-2 2023) – 254 articles

Cover Story (view full-size image): 
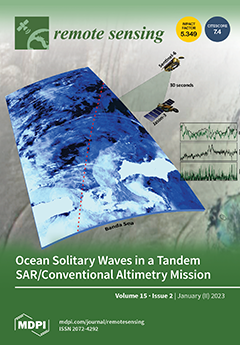
Satellite altimetry has been providing a continuous record of measurements since 1992. However, Sentinel‐6 now provides Synthetic Aperture Radar processing and improves the along‐track resolution from a few kilometres to about 300 metres. This means a major leap towards higher frequencies of the ocean spectrum, which means reconciling conventional and SAR altimetry. To that end, this study uses the Sentinel‐6/Jason‐3 tandem flight to compare simultaneous Internal Solitary Wave measurements between SAR and conventional altimetry. A new and striking feature is found when comparing Sentinel‐6 and Jason‐3, in which backscatter are in anti-phase. These intriguing results are discussed in light of the intrinsically different acquisition geometries of SAR and conventional altimeters as well as possible implications thereof. View this paper
  • Issues are regarded as officially published after their release is announced to the table of contents alert mailing list.
  • You may sign up for e-mail alerts to receive table of contents of newly released issues.
  • PDF is the official format for papers published in both, html and pdf forms. To view the papers in pdf format, click on the "PDF Full-text" link, and use the free Adobe Reader to open them.
Order results
Result details
Section
Select all
Export citation of selected articles as:
18 pages, 3670 KiB  
Article
Detection of the Large Surface Explosion Coupling Experiment by a Sparse Network of Balloon-Borne Infrasound Sensors
by Elizabeth A. Silber, Daniel C. Bowman and Miro Ronac Giannone
Remote Sens. 2023, 15(2), 542; https://doi.org/10.3390/rs15020542 - 16 Jan 2023
Cited by 5 | Viewed by 2443
Abstract
In recent years, high-altitude infrasound sensing has become more prolific, demonstrating an enormous value especially when utilized over regions inaccessible to traditional ground-based sensing. Similar to ground-based infrasound detectors, airborne sensors take advantage of the fact that impulsive atmospheric events such as explosions [...] Read more.
In recent years, high-altitude infrasound sensing has become more prolific, demonstrating an enormous value especially when utilized over regions inaccessible to traditional ground-based sensing. Similar to ground-based infrasound detectors, airborne sensors take advantage of the fact that impulsive atmospheric events such as explosions can generate low frequency acoustic waves, also known as infrasound. Due to negligible attenuation, infrasonic waves can travel over long distances, and provide important clues about their source. Here, we report infrasound detections of the Apollo detonation that was carried on 29 October 2020 as part of the Large Surface Explosion Coupling Experiment in Nevada, USA. Infrasound sensors attached to solar hot air balloons floating in the stratosphere detected the signals generated by the explosion at distances 170–210 km. Three distinct arrival phases seen in the signals are indicative of multipathing caused by the small-scale perturbations in the atmosphere. We also found that the local acoustic environment at these altitudes is more complex than previously thought. Full article
(This article belongs to the Special Issue Infrasound, Acoustic-Gravity Waves, and Atmospheric Dynamics)
Show Figures

Figure 1

16 pages, 5126 KiB  
Article
Geometrical Characterization of Hazelnut Trees in an Intensive Orchard by an Unmanned Aerial Vehicle (UAV) for Precision Agriculture Applications
by Alessandra Vinci, Raffaella Brigante, Chiara Traini and Daniela Farinelli
Remote Sens. 2023, 15(2), 541; https://doi.org/10.3390/rs15020541 - 16 Jan 2023
Cited by 10 | Viewed by 2372
Abstract
Knowledge of tree size is of great importance for the precision management of a hazelnut orchard. In fact, it has been shown that site-specific crop management allows for the best possible management and efficiency of the use of inputs. Generally, measurements of tree [...] Read more.
Knowledge of tree size is of great importance for the precision management of a hazelnut orchard. In fact, it has been shown that site-specific crop management allows for the best possible management and efficiency of the use of inputs. Generally, measurements of tree parameters are carried out using manual techniques that are time-consuming, labor-intensive and not very precise. The aim of this study was to propose, evaluate and validate a simple and innovative procedure using images acquired by an unmanned aerial vehicle (UAV) for canopy characterization in an intensive hazelnut orchard. The parameters considered were the radius (Rc), the height of the canopy (hc), the height of the tree (htree) and of the trunk (htrunk). Two different methods were used for the assessment of the canopy volume using the UAV images. The performance of the method was evaluated by comparing manual and UAV data using the Pearson correlation coefficient and root mean square error (RMSE). High correlation values were obtained for Rc, hc and htree while a very low correlation was obtained for htrunk. The method proposed for the volume calculation was promising. Full article
(This article belongs to the Special Issue 3D Modelling and Mapping for Precision Agriculture)
Show Figures

Figure 1

24 pages, 8038 KiB  
Article
Ecosystem Service Synergies Promote Ecological Tea Gardens: A Case Study in Fuzhou, China
by Chunyi Wang, Mingyue Zhao, Yinlong Xu, Yuncheng Zhao and Xiao Zhang
Remote Sens. 2023, 15(2), 540; https://doi.org/10.3390/rs15020540 - 16 Jan 2023
Cited by 3 | Viewed by 1741
Abstract
Exploring the trade-off/synergy among ecosystem services (ESs) of agroecosystems could provide effective support for improving agricultural resilience for sustainable development. The construction of ecological tea gardens is emerging, aims to achieve a win-win situation for the tea industry and ecological environment protection. However, [...] Read more.
Exploring the trade-off/synergy among ecosystem services (ESs) of agroecosystems could provide effective support for improving agricultural resilience for sustainable development. The construction of ecological tea gardens is emerging, aims to achieve a win-win situation for the tea industry and ecological environment protection. However, the effect of ES trade-offs/synergies on tea production is still not clear. In this study, we selected Fuzhou city, China, as a case study and explored the relationship among tea production and ESs in 2010 and 2020. Integrated Valuation of Ecosystem Services and Trade-offs (InVEST) and Intelligent Urban Ecosystem Management System (IUEMS) models were used to assess the ecosystem (dis)services, which were tea production, water yield, soil retention, net primary productivity (NPP), climate regulation, soil erosion and carbon emissions. Then, the sum of trade-off/synergy coefficients of ESs (Cts) were defined to reveal the trade-off/synergy in tea gardens and areas except tea gardens (ETG areas). K-means clustering was used to assess the spatiotemporal change of traditional tea garden and ecological tea garden, reflecting the effect of ecological tea garden construction. The results showed that: (1) the high-value areas of tea production were mainly distributed in Lianjiang County, with yields up to 3.6 t/ha, and the low-value areas in Yongtai County, with yields from 0.1–1.0 t/ha. Other ESs showed spatial heterogeneity. (2) The trade-offs in ETG areas intensified from 2010 to 2020, with Cts decreasing from −0.28 to −0.73, and the synergy in tea garden was at risk of decline, with Cts decreasing from 4.46 to 1.02. (3) From 2010 to 2020, 96.72% of traditional tea gardens (Area I) were transformed into ecological tea gardens (Areas IV and V). (4) Further, we classified the tea garden into five zones based on tea yield, with Zone I as the low tea yield areas and Zone V as the highest. From Zone I to Zone V, the Cts increased from 2.6 to 7.5 in 2010, and from 1.9 to 6.5 in 2020, respectively. These results demonstrate the effectiveness of the construction of ecological tea gardens in Fuzhou and provide a reference for subsequent studies on the ESs of tea gardens and governance of ecological tea gardens. Full article
(This article belongs to the Section Ecological Remote Sensing)
Show Figures

Graphical abstract

17 pages, 8610 KiB  
Article
Deep Object Detection of Crop Weeds: Performance of YOLOv7 on a Real Case Dataset from UAV Images
by Ignazio Gallo, Anwar Ur Rehman, Ramin Heidarian Dehkordi, Nicola Landro, Riccardo La Grassa and Mirco Boschetti
Remote Sens. 2023, 15(2), 539; https://doi.org/10.3390/rs15020539 - 16 Jan 2023
Cited by 51 | Viewed by 9740
Abstract
Weeds are a crucial threat to agriculture, and in order to preserve crop productivity, spreading agrochemicals is a common practice with a potential negative impact on the environment. Methods that can support intelligent application are needed. Therefore, identification and mapping is a critical [...] Read more.
Weeds are a crucial threat to agriculture, and in order to preserve crop productivity, spreading agrochemicals is a common practice with a potential negative impact on the environment. Methods that can support intelligent application are needed. Therefore, identification and mapping is a critical step in performing site-specific weed management. Unmanned aerial vehicle (UAV) data streams are considered the best for weed detection due to the high resolution and flexibility of data acquisition and the spatial explicit dimensions of imagery. However, with the existence of unstructured crop conditions and the high biological variation of weeds, it remains a difficult challenge to generate accurate weed recognition and detection models. Two critical barriers to tackling this challenge are related to (1) a lack of case-specific, large, and comprehensive weed UAV image datasets for the crop of interest, (2) defining the most appropriate computer vision (CV) weed detection models to assess the operationality of detection approaches in real case conditions. Deep Learning (DL) algorithms, appropriately trained to deal with the real case complexity of UAV data in agriculture, can provide valid alternative solutions with respect to standard CV approaches for an accurate weed recognition model. In this framework, this paper first introduces a new weed and crop dataset named Chicory Plant (CP) and then tests state-of-the-art DL algorithms for object detection. A total of 12,113 bounding box annotations were generated to identify weed targets (Mercurialis annua) from more than 3000 RGB images of chicory plantations, collected using a UAV system at various stages of crop and weed growth. Deep weed object detection was conducted by testing the most recent You Only Look Once version 7 (YOLOv7) on both the CP and publicly available datasets (Lincoln beet (LB)), for which a previous version of YOLO was used to map weeds and crops. The YOLOv7 results obtained for the CP dataset were encouraging, outperforming the other YOLO variants by producing value metrics of 56.6%, 62.1%, and 61.3% for the mAP@0.5 scores, recall, and precision, respectively. Furthermore, the YOLOv7 model applied to the LB dataset surpassed the existing published results by increasing the mAP@0.5 scores from 51% to 61%, 67.5% to 74.1%, and 34.6% to 48% for the total mAP, mAP for weeds, and mAP for sugar beets, respectively. This study illustrates the potential of the YOLOv7 model for weed detection but remarks on the fundamental needs of large-scale, annotated weed datasets to develop and evaluate models in real-case field circumstances. Full article
Show Figures

Graphical abstract

23 pages, 14857 KiB  
Article
Deep Network Architectures as Feature Extractors for Multi-Label Classification of Remote Sensing Images
by Marjan Stoimchev, Dragi Kocev and Sašo Džeroski
Remote Sens. 2023, 15(2), 538; https://doi.org/10.3390/rs15020538 - 16 Jan 2023
Cited by 7 | Viewed by 3515
Abstract
Data in the form of images are now generated at an unprecedented rate. A case in point is remote sensing images (RSI), now available in large-scale RSI archives, which have attracted a considerable amount of research on image classification within the remote sensing [...] Read more.
Data in the form of images are now generated at an unprecedented rate. A case in point is remote sensing images (RSI), now available in large-scale RSI archives, which have attracted a considerable amount of research on image classification within the remote sensing community. The basic task of single-target multi-class image classification considers the case where each image is assigned exactly one label from a predefined finite set of class labels. Recently, however, image annotations have become increasingly complex, with images labeled with several labels (instead of just one). In other words, the goal is to assign multiple semantic categories to an image, based on its high-level context. The corresponding machine learning tasks is called multi-label classification (MLC). The classification of RSI is currently predominantly addressed by deep neural network (DNN) approaches, especially convolutional neural networks (CNNs), which can be utilized as feature extractors as well as end-to-end methods. After only considering single-target classification for a long period, DNNs have recently emerged that address the task of MLC. On the other hand, trees and tree ensembles for MLC have a long tradition and are the best-performing class of MLC methods, but need predefined feature representations to operate on. In this work, we explore different strategies for model training based on the transfer learning paradigm, where we utilize different families of (pre-trained) CNN architectures, such as VGG, EfficientNet, and ResNet. The architectures are trained in an end-to-end manner and used in two different modes of operation, namely, as standalone models that directly perform the MLC task, and as feature extractors. In the latter case, the learned representations are used with tree ensemble methods for MLC, such as random forests and extremely randomized trees. We conduct an extensive experimental analysis of methods over several publicly available RSI datasets and evaluate their effectiveness in terms of standard MLC measures. Of these, ranking-based evaluation measures are most relevant, especially ranking loss. The results show that, for addressing the RSI-MLC task, it is favorable to use lightweight network architectures, such as EfficientNet-B2, which is the best performing end-to-end approach, as well as a feature extractor. Furthermore, in the datasets with a limited number of images, using traditional tree ensembles for MLC can yield better performance compared to end-to-end deep approaches. Full article
(This article belongs to the Special Issue Deep Learning and Computer Vision in Remote Sensing-II)
Show Figures

Figure 1

22 pages, 6907 KiB  
Article
A Geometric Multigrid Method for 3D Magnetotelluric Forward Modeling Using Finite-Element Method
by Xianyang Huang, Changchun Yin, Luyuan Wang, Yunhe Liu, Bo Zhang, Xiuyan Ren, Yang Su, Jun Li and Hui Chen
Remote Sens. 2023, 15(2), 537; https://doi.org/10.3390/rs15020537 - 16 Jan 2023
Cited by 5 | Viewed by 1706
Abstract
The traditional three-dimensional (3D) magnetotelluric (MT) forward modeling using Krylov subspace algorithms has the problem of low modeling efficiency. To improve the computational efficiency of 3D MT forward modeling, we present a novel geometric multigrid algorithm for the finite element method. We use [...] Read more.
The traditional three-dimensional (3D) magnetotelluric (MT) forward modeling using Krylov subspace algorithms has the problem of low modeling efficiency. To improve the computational efficiency of 3D MT forward modeling, we present a novel geometric multigrid algorithm for the finite element method. We use the vector finite element to discretize Maxwell’s equations in the frequency domain and apply the Dirichlet boundary conditions to obtain large sparse complex linear equations for the solution of EM responses. To improve the convergence of the solution at low frequencies we use the divergence correction to correct the electric field. Then, we develop a V-cycle geometric multigrid algorithm to solve the linear equations system. To demonstrate the efficiency and effectiveness of our geometric multigrid method, we take three synthetic models (COMMEMI 3D-2 model, Dublin test model 1, modified SEG/EAEG salt dome model) and compare our results with the published ones. Numerical results show that the geometric multigrid algorithm proposed in this paper is much better than the commonly used Krylov subspace algorithms (such as SOR-GMRES, ILU-BICGSTAB, SOR-BICGSTAB) in terms of the iteration number, the solution time, and the stability, and thus is more suitable for large-scale 3D MT forward modeling. Full article
Show Figures

Graphical abstract

12 pages, 7989 KiB  
Communication
Texture-Mapping Error Removal Based on the BRIEF Operator in Image-Based Three-Dimensional Reconstruction
by Junxing Yang, Lu Lu, Ge Peng, He Huang, Jian Wang and Fei Deng
Remote Sens. 2023, 15(2), 536; https://doi.org/10.3390/rs15020536 - 16 Jan 2023
Cited by 2 | Viewed by 1376
Abstract
In image-based three-dimensional (3D) reconstruction, texture-mapping techniques can give the model realistic textures. When the geometric surface in some regions is not reconstructed, such as for moving cars, powerlines, and telegraph poles, the textures in the corresponding image are textured to other regions, [...] Read more.
In image-based three-dimensional (3D) reconstruction, texture-mapping techniques can give the model realistic textures. When the geometric surface in some regions is not reconstructed, such as for moving cars, powerlines, and telegraph poles, the textures in the corresponding image are textured to other regions, resulting in errors. To solve this problem, this letter proposes an image consistency detection method based on the Binary Robust Independent Elementary Features (BRIEF) descriptor. The method is composed of two parts. First, each triangle in the mesh and its neighboring triangles are sampled uniformly to obtain sampling points. Then, these sampled points are projected into the visible image of the triangle, and the corresponding sampled points and their RGB color values are obtained on the corresponding image. Based on the sampled points on these images, a BRIEF descriptor is calculated for each image corresponding to that triangle. In the second step, the Hamming distance between these BRIEF descriptors is calculated, outliers are removed according to the method, and noisy images are also removed. In addition, we propose adding semantic information to Markov energy optimization to reduce errors further. The two methods effectively reduced errors in texture mapping caused by objects not reconstructed, improving the texture quality of 3D models. Full article
Show Figures

Figure 1

24 pages, 9038 KiB  
Article
Analysis of Space-Based Observed Infrared Characteristics of Aircraft in the Air
by Jiyuan Li, Huijie Zhao, Xingfa Gu, Lifeng Yang, Bin Bai, Guorui Jia and Zengren Li
Remote Sens. 2023, 15(2), 535; https://doi.org/10.3390/rs15020535 - 16 Jan 2023
Cited by 6 | Viewed by 2229
Abstract
The space-based infrared observatory of aircraft in the air has the advantages of wide-area, full-time, and passive detection. The optical design parameters for space-based infrared sensors strongly rely on target observed radiation, but there is still a lack of insight into the causes [...] Read more.
The space-based infrared observatory of aircraft in the air has the advantages of wide-area, full-time, and passive detection. The optical design parameters for space-based infrared sensors strongly rely on target observed radiation, but there is still a lack of insight into the causes of aircraft observation properties and the impact of instrument performance. A simulation model of space-based observed aircraft infrared characteristics was constructed for this provision, coupling the aircraft radiance with background radiance and instrument performance effects. It was validated by comparing the model predictions to data from both space-based and ground-based measurements. The validation results reveal the alignment between measurements and model predictions and the dependence of overall model accuracy on the background. Based on simulations, the radiance contributions of aircraft and background are quantitatively evaluated, and the detection spectral window for flying aircraft and its causes are discussed in association with instrumental performance effects. The analysis results indicate that the target-background (T-B) contrast is higher in the spectral ranges where aircraft radiation makes an important contribution. The background radiance plays a significant role overall, while the observed radiance at 2.5–3μm is mainly from skin reflection and plume radiance. The skin-reflected radiation absence affects the model reliability, and its reduction at nighttime reduces the T-B contrast. The difference in T-B self-radiation and the stronger atmospheric attenuation for background contribute to the higher contrast at 2.7 μm compared to the other spectral bands. Full article
(This article belongs to the Special Issue Advances in Thermal Infrared Remote Sensing)
Show Figures

Figure 1

23 pages, 9041 KiB  
Article
A Uniformity Index for Precipitation Particle Axis Ratios Derived from Radar Polarimetric Parameters for the Identification and Analysis of Raindrop Areas
by Yue Sun, Hui Xiao, Huiling Yang, Haonan Chen, Liang Feng, Weixi Shu and Han Yao
Remote Sens. 2023, 15(2), 534; https://doi.org/10.3390/rs15020534 - 16 Jan 2023
Cited by 2 | Viewed by 1480
Abstract
A uniformity index for the axis ratios (Uar) derived from dual polarization weather radar data is proposed for raindrop area identification and analysis. The derivation of this new parameter is based on radar scattering simulations and assumptions. Uar is [...] Read more.
A uniformity index for the axis ratios (Uar) derived from dual polarization weather radar data is proposed for raindrop area identification and analysis. The derivation of this new parameter is based on radar scattering simulations and assumptions. Uar is between 0 and 1 and can be calculated from the differential reflectivity (ZDR) and the copolar correlation coefficient (ρhv), which reflects the uniformity of the axis ratio (r) of the particle group. For raindrops, Uar is close to 1 under ideal conditions, but is clearly different from that of ice particles whose value is close to 0. Studies conducted during two convective weather events observed by X-band and S-band radar are presented to show the Uar features. In convective areas, high Uar presents a U-shaped vertical structure. One branch corresponds to the ZDR column, while the other branch is located at the rear of the convective cloud zone and is lower in altitude, representing the process of ice particles melting into raindrops and then being transported upward by a strong updraft. In stratiform cloud areas, a more than 95% overall identification ratio is obtained when the threshold of Uar is set to 0.2~0.3 for discriminating rain layers. Full article
(This article belongs to the Special Issue Processing and Application of Weather Radar Data)
Show Figures

Figure 1

20 pages, 10653 KiB  
Article
Cooperative Navigation Algorithm of Extended Kalman Filter Based on Combined Observation for AUVs
by Guangrun Sheng, Xixiang Liu, Yehua Sheng, Xiangzhi Cheng and Hao Luo
Remote Sens. 2023, 15(2), 533; https://doi.org/10.3390/rs15020533 - 16 Jan 2023
Cited by 5 | Viewed by 1873
Abstract
The navigation and positioning of multi-autonomous underwater vehicles (AUVs) in the complex and variable marine environment is a significant and much-needed area of attention, especially considering the fact that cooperative navigation technology is the essential method for multiple AUVs to solve positioning problems. [...] Read more.
The navigation and positioning of multi-autonomous underwater vehicles (AUVs) in the complex and variable marine environment is a significant and much-needed area of attention, especially considering the fact that cooperative navigation technology is the essential method for multiple AUVs to solve positioning problems. When the extended Kalman filter (EKF) is applied for underwater cooperative localization, the outliers in the sensor observations cause unknown errors in the measurement system due to deep-sea environmental factors, which are difficult to calibrate and cause a significant reduction in the co-location accuracy of AUVs, and can even cause problems with a divergence of estimation error. In this paper, we proposed a cooperative navigation method of the EKF algorithm based on the combined observation of multiple AUVs. Firstly, the corresponding cooperative navigation model is established, and the corresponding measurement model is designed. Then, the EKF model based on combined observation is designed and constructed, and the unknown error is eliminated by introducing a previously measured value. Finally, simulation tests and lake experiments are designed to verify the effectiveness of the algorithm. The results indicate that the EKF algorithm based on combined observation can approximately eliminate errors and improve the accuracy of cooperative localization when the unknown measurement error cannot be calibrated by common EKF methods. The effect of state estimation is improved, and the accuracy of co-location can be effectively improved to avoid serious declines in—and divergence of—estimation accuracy. Full article
(This article belongs to the Special Issue Advances on Autonomous Underwater Vehicles (AUV))
Show Figures

Graphical abstract

22 pages, 17907 KiB  
Article
Detecting Urban Floods with Small and Large Scale Analysis of ALOS-2/PALSAR-2 Data
by Hideomi Gokon, Fuyuki Endo and Shunichi Koshimura
Remote Sens. 2023, 15(2), 532; https://doi.org/10.3390/rs15020532 - 16 Jan 2023
Cited by 4 | Viewed by 1992
Abstract
When a large-scale flood disaster occurs, it is important to identify the flood areas in a short time in order to effectively support the affected areas afterwards. Synthetic Aperture Radar (SAR) is promising for flood detection. A number of change detection methods have [...] Read more.
When a large-scale flood disaster occurs, it is important to identify the flood areas in a short time in order to effectively support the affected areas afterwards. Synthetic Aperture Radar (SAR) is promising for flood detection. A number of change detection methods have been proposed to detect flooded areas with pre- and post-event SAR data. However, it remains difficult to detect flooded areas in built-up areas due to the complicated scattering of microwaves. To solve this issue, in this paper we propose the idea of analyzing the local changes in pre- and post-event SAR data as well as the larger-scale changes, which may improve accuracy for detecting floods in built-up areas. Therefore, we aimed at evaluating the effectiveness of multi-scale SAR analysis for flood detection in built-up areas using ALOS-2/PALSAR-2 data. First, several features were determined by calculating standard deviation images, difference images, and correlation coefficient images with several sizes of kernels. Then, segmentation on both small and large scales was applied to the correlation coefficient image and calculated explanatory variables with the features at each segment. Finally, machine learning models were tested for their flood detection performance in built-up areas by comparing a small-scale approach and multi-scale approach. Ten-fold cross-validation was used to validate the model, showing that highest accuracy was offered by the AdaBoost model, which improved the F1 Score from 0.89 in the small-scale analysis to 0.98 in the multi-scale analysis. The main contribution of this manuscript is that, from our results, it can be inferred that multi-scale analysis shows better performance in the quantitative detection of floods in built-up areas. Full article
Show Figures

Figure 1

19 pages, 49764 KiB  
Article
Improved Automatic Classification of Litho-Geomorphological Units by Using Raster Image Blending, Vipava Valley (SW Slovenia)
by Galena Jordanova and Timotej Verbovšek
Remote Sens. 2023, 15(2), 531; https://doi.org/10.3390/rs15020531 - 16 Jan 2023
Viewed by 1642
Abstract
Automatic landslide classification based on digital elevation models has become a powerful complementary tool to field mapping. Many studies focus on the automatic classification of landslides’ geomorphological features, such as their steep main scarps, but in many cases, the scarps and other morphological [...] Read more.
Automatic landslide classification based on digital elevation models has become a powerful complementary tool to field mapping. Many studies focus on the automatic classification of landslides’ geomorphological features, such as their steep main scarps, but in many cases, the scarps and other morphological features are difficult for algorithms to detect. In this study, we performed an automatic classification of different litho-geomorphological units to differentiate slope mass movements in field maps by using Maximum Likelihood Classification. The classification was based on high-resolution lidar-derived DEM of the Vipava Valley, SW Slovenia. The results show an improvement over previous approaches as we used a blended image (VAT, which included four different raster layers with different weights) along with other common raster layers for morphometric analysis of the surface (e.g., slope, elevation, aspect, TRI, curvature, etc.). The newly created map showed better classification of the five classes we used in the study and recognizes alluvial deposits, carbonate cliffs (including landslide scarps), carbonate plateaus, flysch, and slope deposits better than previous studies. Multivariate statistics recognized the VAT layer as the most important layer with the highest eigenvalues, and when combined with Aspect and Elevation layers, it explained 90% of the total variance. The paper also discusses the correlations between the different layers and which layers are better suited for certain geomorphological surface analyses. Full article
Show Figures

Figure 1

40 pages, 16165 KiB  
Article
Air Quality Improvement Following COVID-19 Lockdown Measures and Projected Benefits for Environmental Health
by Yuei-An Liou, Trong-Hoang Vo, Kim-Anh Nguyen and James P. Terry
Remote Sens. 2023, 15(2), 530; https://doi.org/10.3390/rs15020530 - 16 Jan 2023
Cited by 7 | Viewed by 2299
Abstract
Many regions worldwide suffer from heavy air pollution caused by particulate matter (PM2.5) and nitrogen dioxide (NO2), resulting in a huge annual disease burden and significant welfare costs. Following the outbreak of the COVID-19 global pandemic, enforced curfews and [...] Read more.
Many regions worldwide suffer from heavy air pollution caused by particulate matter (PM2.5) and nitrogen dioxide (NO2), resulting in a huge annual disease burden and significant welfare costs. Following the outbreak of the COVID-19 global pandemic, enforced curfews and restrictions on human mobility (so-called periods of ‘lockdown’) have become important measures to control the spread of the virus. This study aims to investigate the improvement in air quality following COVID-19 lockdown measures and the projected benefits for environmental health. China was chosen as a case study. The work projects annual premature deaths and welfare costs by integrating PM2.5 and NO2 pollutant measurements derived from satellite imagery (MODIS instruments on Terra and Aqua, and TROPOMI on Sentinel-5P) with census data archived by the Organization for Economic Co-operation and Development (OECD). A 91-day timeframe centred on the initial lockdown date of 23 January 2020 was investigated. To perform the projections, OECD data on five variables from 1990 to 2019 (mean population exposure to ambient PM2.5, premature deaths, welfare costs, gross domestic product and population) were used as training data to run the Autoregressive Integrated Moving Average (ARIMA) and multiple regression models. The analysis of the satellite imagery revealed that across the regions of Beijing, Hebei, Shandong, Henan, Xi’an, Shanghai and Hubei, the average concentrations of PM2.5 decreased by 6.2, 30.7, 14.1, 20.7, 29.3, 5.5 and 17.3%, while the NO2 decreased by 45.5, 54.7, 60.5, 58.7, 63.6, 50.5 and 66.5%, respectively, during the period of lockdown restrictions in 2020, as compared with the equivalent period in 2019. Such improvements in air quality were found to be beneficial, reducing in 2020 both the number of premature deaths by approximately 97,390 and welfare costs by over USD 74 billion. Full article
(This article belongs to the Special Issue Earth Observations for Sustainable Development Goals)
Show Figures

Graphical abstract

25 pages, 9935 KiB  
Article
Mapping of Mean Deformation Rates Based on APS-Corrected InSAR Data Using Unsupervised Clustering Algorithms
by Mohammad Amin Khalili, Behzad Voosoghi, Luigi Guerriero, Saeid Haji-Aghajany, Domenico Calcaterra and Diego Di Martire
Remote Sens. 2023, 15(2), 529; https://doi.org/10.3390/rs15020529 - 16 Jan 2023
Cited by 6 | Viewed by 2090
Abstract
Different interferometric approaches have been developed over the past few decades to process SAR data and recover surface deformation, and each approach has advantages and limitations. Finding an accurate and reliable interval for preparing mean deformation rate maps (MDRMs) remains challenging. The primary [...] Read more.
Different interferometric approaches have been developed over the past few decades to process SAR data and recover surface deformation, and each approach has advantages and limitations. Finding an accurate and reliable interval for preparing mean deformation rate maps (MDRMs) remains challenging. The primary purpose of this paper is to implement an application consisting of three unsupervised clustering algorithms (UCAs) for determining the best interval from SAR-derived deformation data, which can be used to interpret long-term deformation processes, such as subsidence, and identify displacement patterns. Considering Port Harcourt (in the Niger Delta) as the study area, it was essential to remove the sources of error in extracting deformation signals from SAR data, spatially ionospheric and tropospheric delays, before using UCAs to obtain its characteristics and real deformation data. Moreover, another purpose of this paper is to implement the advanced integration method (AIM) for atmospheric phase screen (APS) correction to enhance deformation signals obtained through different SAR processing approaches, including interferometric SARs (two-pass interferometry, InSAR) and multitemporal interferometry SARs (n-pass interferometry, DInSAR; permanent scatterer interferometry (PSI); and small baseline subset (SBAS)). Two methods were chosen to evaluate and find the best technique with which to create an MDRM: The first one was to compare the signals corrected by the AIM and the vertical component of the GPS station, which showed the AIM providing 58%, 42%, and 28% of the matching with GNSS station outputs for InSAR, PSI, and SBAS, respectively. Secondly, similarity measures and Davies–Bouldin index scores were implemented to find an accurate and reliable interval in which the SBAS technique with the unsupervised K-medians method has been chosen. Based on GNSS vertical deformation in a 500 m radius around the station, the SBAS K-medians technique expressed up to 5.5% better deformation patterns than the map of SAR processing techniques. Full article
Show Figures

Figure 1

28 pages, 984 KiB  
Article
On the Importance of Non-Gaussianity in Chlorophyll Fluorescence Imaging
by Angelina El Ghaziri, Nizar Bouhlel, Natalia Sapoukhina and David Rousseau
Remote Sens. 2023, 15(2), 528; https://doi.org/10.3390/rs15020528 - 16 Jan 2023
Cited by 1 | Viewed by 1325
Abstract
We propose a mathematical study of the statistics of chlorophyll fluorescence indices. While most of the literature assumes Gaussian distributions for these indices, we demonstrate their fundamental non-Gaussian nature. Indeed, while the noise in the raw fluorescence images can be assumed as Gaussian [...] Read more.
We propose a mathematical study of the statistics of chlorophyll fluorescence indices. While most of the literature assumes Gaussian distributions for these indices, we demonstrate their fundamental non-Gaussian nature. Indeed, while the noise in the raw fluorescence images can be assumed as Gaussian additive, the deterministic ratio between them produces nonlinear non-Gaussian distributions. We investigate the states in which this non-Gaussianity can affect the statistical estimation when wrongly approached with linear estimators. We provide an expectation–maximization estimator adapted to the non-Gaussian distributions. We illustrate the interest of this estimator with simulations from images of chlorophyll fluorescence indices.. We demonstrate the benefits of our approach by comparison with the standard Gaussian assumption. Our expectation–maximization estimator shows low estimation errors reaching seven percent for a more pronounced deviation from Gaussianity compared to Gaussianity assumptions estimators rising to more than 70 percent estimation error. These results show the importance of considering rigorous mathematical estimation approaches in chlorophyll fluorescence indices. The application of this work could be extended to various vegetation indices also made up of a ratio of Gaussian distributions. Full article
Show Figures

Figure 1

24 pages, 2011 KiB  
Article
A Single-Site Vehicle Positioning Method in the Rectangular Tunnel Environment
by Suying Jiang, Wei Wang and Peng Peng
Remote Sens. 2023, 15(2), 527; https://doi.org/10.3390/rs15020527 - 16 Jan 2023
Cited by 1 | Viewed by 1580
Abstract
Due to the satellite signals are blocked, it is difficult to obtain the vehicle position in the tunnels. We propose a single-site vehicle localization scheme for the rectangular tunnel environment, where most satellite-based positioning methods can not provide the required localization accuracy. In [...] Read more.
Due to the satellite signals are blocked, it is difficult to obtain the vehicle position in the tunnels. We propose a single-site vehicle localization scheme for the rectangular tunnel environment, where most satellite-based positioning methods can not provide the required localization accuracy. In the non-line-of-sight (NLOS) scenarios, we make use of the reflection paths as assistants for vehicle positioning. Specifically, first, the virtual stations are established based on the actual geometrical structure of the tunnel. Second, we use the direction-of-arrival (DOA) and time-of-arrival (TOA) information of reflection paths from two tunnel walls to achieve vehicle positioning. Especially, the Cramer-Rao lower bound (CRLB) of the joint TOA and DOA localization for NLOS propagations in a two-dimensional (2D) space is derived. In addition, based on the localization algorithms with and without filters, we assess the localization performance. In the line-of-sight (LOS) scenarios, we use the LOS path and two reflection paths from the tunnel walls to estimate the vehicle location. First, virtual base stations are established. Second, based on the obtained TOA information, different positioning algorithms are used to estimate the vehicle location. Simulation results illustrate that the proposed positioning approach can provide a small root mean square error. The localization algorithms using filters improve the localization accuracy, compared with the positioning algorithm without using filters, namely, the two-stage weighted least squares (TSWLS) algorithm. Moreover, the Unscented Particle Filter (UPF) algorithm achieves better positioning accuracy than other methods (i.e., Unscented Kalman Filter (UKF), Extended Kalman Filter (EKF), TSWLS algorithms). Full article
Show Figures

Figure 1

22 pages, 20918 KiB  
Article
Hybrid Attention-Based Encoder–Decoder Fully Convolutional Network for PolSAR Image Classification
by Zheng Fang, Gong Zhang, Qijun Dai, Biao Xue and Peng Wang
Remote Sens. 2023, 15(2), 526; https://doi.org/10.3390/rs15020526 - 16 Jan 2023
Cited by 8 | Viewed by 1784
Abstract
Recently, methods based on convolutional neural networks (CNNs) achieve superior performance in polarimetric synthetic aperture radar (PolSAR) image classification. However, the current CNN-based classifiers follow patch-based frameworks, which need input images to be divided into overlapping patches. Consequently, these classification approaches have the [...] Read more.
Recently, methods based on convolutional neural networks (CNNs) achieve superior performance in polarimetric synthetic aperture radar (PolSAR) image classification. However, the current CNN-based classifiers follow patch-based frameworks, which need input images to be divided into overlapping patches. Consequently, these classification approaches have the drawback of requiring repeated calculations and only relying on local information. In addition, the receptive field size in conventional CNN-based methods is fixed, which limits the potential to extract features. In this paper, a hybrid attention-based encoder–decoder fully convolutional network (HA-EDNet) is presented for PolSAR classification. Unlike traditional CNN-based approaches, the encoder–decoder fully convolutional network (EDNet) can use an arbitrary-size image as input without dividing. Then, the output is the whole image classification result. Meanwhile, the self-attention module is used to establish global spatial dependence and extract context characteristics, which can improve the performance of classification. Moreover, an attention-based selective kernel module (SK module) is included in the network. In the module, softmax attention is employed to fuse several branches with different receptive field sizes. Consequently, the module can capture features with different scales and further boost classification accuracy. The experiment results demonstrate that the HA-EDNet achieves superior performance compared to CNN-based and traditional fully convolutional network methods. Full article
(This article belongs to the Special Issue Recent Advances in Processing Mixed Pixels for Hyperspectral Image)
Show Figures

Figure 1

14 pages, 4296 KiB  
Article
Effect of ENSO on the Ozone Valley over the Tibetan Plateau Based on the WACCM4 Model
by Yongchi Li, Feng Xu, Lingfeng Wan, Peng Chen, Dong Guo, Shujie Chang and Chen Yang
Remote Sens. 2023, 15(2), 525; https://doi.org/10.3390/rs15020525 - 16 Jan 2023
Cited by 2 | Viewed by 1502
Abstract
El Niño-Southern Oscillation (ENSO) is the most significant global ocean–atmosphere coupled signal in the tropical Pacific Ocean, and it can affect the stratosphere. However, the ENSO-related dynamical processes that influence the ozone valley during summer are still not well understood and are under-investigated. [...] Read more.
El Niño-Southern Oscillation (ENSO) is the most significant global ocean–atmosphere coupled signal in the tropical Pacific Ocean, and it can affect the stratosphere. However, the ENSO-related dynamical processes that influence the ozone valley during summer are still not well understood and are under-investigated. In this study, we used the ERA5 and MERRA-2 reanalysis data from 1979 to 2021 combined with numerical simulations to analyze the mechanisms through which ENSO affects the ozone valley over the Tibetan Plateau in the upper troposphere and the lower stratosphere (UTLS) in summer. The results showed that the two cores of the ozone valley in UTLS were more evident in the summer following La Niña than in the summer following El Niño. At low latitudes, negative O3 anomalies in UTLS were observed in the summer following El Niño and positive O3 anomalies were observed in the summer following La Niña. At middle latitudes, negative O3 anomalies in UTLS were found near 60°E in the summer following El Niño, while negative anomalies were found at 40°E and 120°E in the summer following La Niña. The analysis of the flow and vorticity fields suggested that the field anomalies can cause vertical motion, which in turn leads to the mixing of different ozone concentrations and affects the ozone valley in UTLS over the Tibetan Plateau. In particular, the warming of the Indian Ocean sea-surface temperature (SST) in the summer following El Niño enhances the South Asian High (SAH) through two-stage thermal adaptation, leading to ozone anomalies at low latitudes in the ozone-valley region. These conclusions were verified by a simulation using the WACCM4 model, the results of which were consistent with the original observations. Full article
Show Figures

Figure 1

18 pages, 14322 KiB  
Article
A Novel Index for Daily Flood Inundation Retrieval from CYGNSS Measurements
by Ting Yang, Zhigang Sun and Lulu Jiang
Remote Sens. 2023, 15(2), 524; https://doi.org/10.3390/rs15020524 - 16 Jan 2023
Cited by 1 | Viewed by 2712
Abstract
Since flood inundation hampers human life and the economy, flood inundation retrieval with high temporal resolution and accuracy is essential for the projection of the environmental impact. In this study, a novel cyclone global navigation satellite system (CYGNSS)-based index, named the annual threshold [...] Read more.
Since flood inundation hampers human life and the economy, flood inundation retrieval with high temporal resolution and accuracy is essential for the projection of the environmental impact. In this study, a novel cyclone global navigation satellite system (CYGNSS)-based index, named the annual threshold flood inundation index (ATFII) for flood inundation retrieval, is proposed, and the grades of flood inundation are quantified. First, the CYGNSS surface reflectivity with land surface properties (i.e., vegetation and surface roughness) calibration is derived based on the zeroth-order radiative transfer model. Then, an index named ATFII is proposed to achieve inundation retrieval, and the inundation grades are classified. The results are validated with the Visible Infrared Imaging Radiometer Suite (VIIRS) flood product and GPM precipitation data. The validation results between ATFII and GPM precipitation indicate that the ATFII enables flood inundation retrieval at rapid timescales and quantifies the inundation variation grades. Likewise, for monthly results, the R value between the VIIRS flood product and ATFII varies from 0.51 to 0.64, with an acceptable significance level (p < 0.05). The study makes contributions in two aspects: (1) it provides an index-based method for mapping daily flood inundation on a large scale, with the advantages of fast speed and convenience, and (2) it provides a new way to derive inundation grade variations, which can help in studying the behavior of inundation in response to environmental impacts directly. Full article
Show Figures

Figure 1

23 pages, 9772 KiB  
Article
Assessment of Restoration Degree and Restoration Potential of Key Ecosystem-Regulating Services in the Three-River Headwaters Region Based on Vegetation Coverage
by Guobo Liu, Quanqin Shao, Jiangwen Fan, Haibo Huang, Jiyuan Liu and Jianfeng He
Remote Sens. 2023, 15(2), 523; https://doi.org/10.3390/rs15020523 - 16 Jan 2023
Cited by 7 | Viewed by 1384
Abstract
The Three-River Headwaters Region (TRHR) is an important part of the ecological security barrier of the Qinghai–Tibet Plateau in China. Twenty years after the implementation of the TRHR ecological protection and construction project, the restoration degree and restoration potential of its major ecosystem [...] Read more.
The Three-River Headwaters Region (TRHR) is an important part of the ecological security barrier of the Qinghai–Tibet Plateau in China. Twenty years after the implementation of the TRHR ecological protection and construction project, the restoration degree and restoration potential of its major ecosystem services still lack clear quantification. In this paper, taking the core area of the nature reserve as the climax background of the TRHR zonal ecosystem, based on the multiple regression analysis (MLR) and model parameter control method based on the eco-geographical area, ecosystem types, and climate factors; the climax background, restoration degree, and restoration potential of TRHR’s water retention (WR), soil retention (SR), and windbreak and sand fixation (WD) services were quantitatively researched. The main conclusions were as follows: (1) The evaluation method of climax background, restoration degree, and restoration potential based on fractional vegetation cover (FVC) can accurately quantify the regional differences of the restoration degree and restoration potential of TRHR’s key ecosystem-regulating services. The restoration degree and restoration potential of WR and SR services showed a spatial pattern of high in the southeast and low in the northwest, and the restoration degree and restoration potential of WD services showed a spatial pattern of high in the west and low in the east, which was closely related to natural conditions such as precipitation and wind speed. (2) The proportion of restoration potential to climax background for WR, SR, and WD services were 48.38%, 62.15%, and 56.37%, respectively. (3) The implementation of the TRHR ecological project in the future should focus on the vicinity of the 400 mm dry and wet zone dividing line, as well as in the southeastern mountains, hills, and river valleys, to carry out degraded vegetation restoration and soil and water conservation measures to improve ecosystem services. Near-natural restoration measures should be considered in Zhiduo and Geermu in the western part of the TRHR, where wind erosion is high, and the restoration goals of ecological projects should be formulated in combination with local climatic conditions and restoration potential. Full article
Show Figures

Graphical abstract

18 pages, 53148 KiB  
Article
Image Compression Network Structure Based on Multiscale Region of Interest Attention Network
by Jing Zhang, Shaobo Zhang, Hui Wang, Yunsong Li and Ruitao Lu
Remote Sens. 2023, 15(2), 522; https://doi.org/10.3390/rs15020522 - 16 Jan 2023
Cited by 2 | Viewed by 1492
Abstract
In this study, we proposed a region of interest (ROI) compression algorithm under the deep learning self-encoder framework to improve the reconstruction performance of the image and reduce the distortion of the ROI. First, we adopted a remote sensing image cloud detection algorithm [...] Read more.
In this study, we proposed a region of interest (ROI) compression algorithm under the deep learning self-encoder framework to improve the reconstruction performance of the image and reduce the distortion of the ROI. First, we adopted a remote sensing image cloud detection algorithm for detecting important targets in images, that is, separating the remote sensing background from important regions in remote sensing images and then determining the target regions because most traditional ROI-based image compression algorithms utilize the manual labeling of the ROI to achieve region separation in images. We designed a multiscale ROI self-coding network from coarse to fine with a hierarchical super priority layer to synthesize images to reduce the spatial redundancy more effectively, thus greatly improving the distortion rate performance of image compression. By using a spatial attention mechanism for the ROI in the image compression network, we achieved better compression performance. Full article
Show Figures

Figure 1

21 pages, 19365 KiB  
Article
Mapping Tropical Forest Cover and Deforestation with Planet NICFI Satellite Images and Deep Learning in Mato Grosso State (Brazil) from 2015 to 2021
by Fabien H. Wagner, Ricardo Dalagnol, Celso H. L. Silva-Junior, Griffin Carter, Alison L. Ritz, Mayumi C. M. Hirye, Jean P. H. B. Ometto and Sassan Saatchi
Remote Sens. 2023, 15(2), 521; https://doi.org/10.3390/rs15020521 - 16 Jan 2023
Cited by 12 | Viewed by 5068
Abstract
Monitoring changes in tree cover for assessment of deforestation is a premise for policies to reduce carbon emission in the tropics. Here, a U-net deep learning model was used to map monthly tropical tree cover in the Brazilian state of Mato Grosso between [...] Read more.
Monitoring changes in tree cover for assessment of deforestation is a premise for policies to reduce carbon emission in the tropics. Here, a U-net deep learning model was used to map monthly tropical tree cover in the Brazilian state of Mato Grosso between 2015 and 2021 using 5 m spatial resolution Planet NICFI satellite images. The accuracy of the tree cover model was extremely high, with an F1-score >0.98, further confirmed by an independent LiDAR validation showing that 95% of tree cover pixels had a height >5 m while 98% of non-tree cover pixels had a height <5 m. The biannual map of deforestation was then built from the monthly tree cover map. The deforestation map showed relatively consistent agreement with the official deforestation map from Brazil (67.2%) but deviated significantly from Global Forest Change (GFC)’s year of forest loss, showing that our product is closest to the product made by visual interpretation. Finally, we estimated that 14.8% of Mato Grosso’s total area had undergone clear-cut logging between 2015 and 2021, and that deforestation was increasing, with December 2021, the last date, being the highest. High-resolution imagery from Planet NICFI in conjunction with deep learning techniques can significantly improve the mapping of deforestation extent in tropical regions. Full article
(This article belongs to the Special Issue Remote Sensing of the Amazon Region)
Show Figures

Figure 1

20 pages, 52705 KiB  
Article
Inversion of Regional Groundwater Storage Changes Based on the Fusion of GNSS and GRACE Data: A Case Study of Shaanxi–Gansu–Ningxia
by Wanqiu Li, Chuanyin Zhang, Wei Wang, Jinyun Guo, Yingchun Shen, Zhiwei Wang, Jingxue Bi, Qiuying Guo, Yulong Zhong, Wei Li, Chengcheng Zhu and Pengfei Xu
Remote Sens. 2023, 15(2), 520; https://doi.org/10.3390/rs15020520 - 15 Jan 2023
Cited by 3 | Viewed by 1750
Abstract
This paper aims to address the limitations of the distribution number and uniformity of Continuously Operating Reference Stations (CORS) and their impact on the reliability of inverting regional groundwater storage (GWS) based on Green’s function method and using global navigation satellite system (GNSS) [...] Read more.
This paper aims to address the limitations of the distribution number and uniformity of Continuously Operating Reference Stations (CORS) and their impact on the reliability of inverting regional groundwater storage (GWS) based on Green’s function method and using global navigation satellite system (GNSS) data. A fusion method on the inversion of regional GWS changes from GNSS and the Gravity Recovery and Climate Experiment (GRACE) was proposed in this paper. Taking the Shaanxi–Gansu–Ningxia (SGN) region as an example, the in situ groundwater level data from ten CORS stations and eight wells were used for test analyses. In this paper, an atmospheric pressure model from the European Centre for Medium-Range Weather Forecasts (ECMWF), a global land data assimilation system (GLDAS), a WaterGAP global hydrology model (WGHM), and mean sea level anomaly (MSLA) data were used to quantitatively monitor the influence of vertical deformation caused by non-tidal environmental load. After deducing these loading deformations from the filtered time series of non-linear monthly geodetic height from the GNSS, the GWS changes in the SGN region from 2011 to 2014 were inverted. Meanwhile, the change in surface water storage from the GLDAS and WGHM models were removed from the terrestrial water storage (TWS) changes derived from GRACE. On this basis, the remove–restore theory in the Earth’s gravity field was introduced to both fuse the inversion results and obtain the regional GWS changes based on the fusion method. The results showed the following: (1) The local characteristics from the fusion results were more prominent than those of GRACE on the spatial scale, such as in the southwest and northeast in the study area. In addition, the fusion results were more uniform than those from GNSS, especially for the sparse and missing areas in which CORS stations were located, and the local effect was weakened. (2) On the time scale, compared with GRACE, the trends in GWS changes obtained from the fusion method and from GNSS inversion were roughly the same as the in situ groundwater level changes. (3) For the in situ groundwater wells “6105010031” and “6101260010”, the correlation coefficients of the fusion result were 0.53 and 0.56, respectively. The accuracy of the fusion method was slightly higher than that from GNSS, which indicates that the fusion method may be more effective for areas where CORS stations are missing or sparsely distributed. The methods in this paper can provide significant reference material for hydrodynamic research, sustainable management of water resources, and the dynamic maintenance of height data. Full article
(This article belongs to the Special Issue Remote Sensing in Space Geodesy and Cartography Methods)
Show Figures

Figure 1

17 pages, 19246 KiB  
Article
Very High Resolution Images and Superpixel-Enhanced Deep Neural Forest Promote Urban Tree Canopy Detection
by Yang Liu, Huaiqing Zhang, Zeyu Cui, Kexin Lei, Yuanqing Zuo, Jiansen Wang, Xingtao Hu and Hanqing Qiu
Remote Sens. 2023, 15(2), 519; https://doi.org/10.3390/rs15020519 - 15 Jan 2023
Cited by 5 | Viewed by 1690
Abstract
Urban tree canopy (UTC) area is an important index for evaluating the urban ecological environment; the very high resolution (VHR) images are essential for improving urban tree canopy survey efficiency. However, the traditional image classification methods often show low robustness when extracting complex [...] Read more.
Urban tree canopy (UTC) area is an important index for evaluating the urban ecological environment; the very high resolution (VHR) images are essential for improving urban tree canopy survey efficiency. However, the traditional image classification methods often show low robustness when extracting complex objects from VHR images, with insufficient feature learning, object edge blur and noise. Our objective was to develop a repeatable method—superpixel-enhanced deep neural forests (SDNF)—to detect the UTC distribution from VHR images. Eight data expansion methods was used to construct the UTC training sample sets, four sample size gradients were set to test the optimal sample size selection of SDNF method, and the best training times with the shortest model convergence and time-consumption was selected. The accuracy performance of SDNF was tested by three indexes: F1 score (F1), intersection over union (IoU) and overall accuracy (OA). To compare the detection accuracy of SDNF, the random forest (RF) was used to conduct a control experiment with synchronization. Compared with the RF model, SDNF always performed better in OA under the same training sample size. SDNF had more epoch times than RF, converged at the 200 and 160 epoch, respectively. When SDNF and RF are kept in a convergence state, the training accuracy is 95.16% and 83.16%, and the verification accuracy is 94.87% and 87.73%, respectively. The OA of SDNF improved 10.00%, reaching 89.00% compared with the RF model. This study proves the effectiveness of SDNF in UTC detection based on VHR images. It can provide a more accurate solution for UTC detection in urban environmental monitoring, urban forest resource survey, and national forest city assessment. Full article
Show Figures

Figure 1

24 pages, 5913 KiB  
Article
Automatic Modulation Recognition of Radiation Source Signals Based on Data Rearrangement and the 2D FFT
by Yangtian Liu, Xiaopeng Yan, Xinhong Hao, Guanghua Yi and Dingkun Huang
Remote Sens. 2023, 15(2), 518; https://doi.org/10.3390/rs15020518 - 15 Jan 2023
Cited by 4 | Viewed by 1416
Abstract
It is a challenge for automatic modulation recognition (AMR) methods for radiation source signals to work in environments with low signal-to-noise ratios (SNRs). This paper proposes a modulation feature extraction method based on data rearrangement and the 2D fast Fourier transform (FFT) (DR2D), [...] Read more.
It is a challenge for automatic modulation recognition (AMR) methods for radiation source signals to work in environments with low signal-to-noise ratios (SNRs). This paper proposes a modulation feature extraction method based on data rearrangement and the 2D fast Fourier transform (FFT) (DR2D), and a DenseNet feature extraction network with early fusion is constructed to recognize the extracted modulation features. First, the input signal is preprocessed by DR2D to obtain three types of joint frequency feature bins with multiple time scales. Second, the feature fusion operation is performed on the inputs of the different layers of the proposed network. Finally, feature recognition is completed in the subsequent layers. The theoretical analysis and simulation results show that DR2D is a fast and robust preprocessing method for extracting the features of modulated radiation source signals with less computational complexity. The proposed DenseNet feature extraction network with early fusion can identify the extracted modulation features with less spatial complexity than other types of convolutional neural networks (CNNs) and performs well in low-SNR environments. Full article
Show Figures

Figure 1

28 pages, 8176 KiB  
Article
DirecTES: A Direct Method for Land and Sea Surface Temperature and Emissivity Separation for Thermal Infrared Sensors—Application to TRISHNA and ECOSTRESS
by Sébastien Marcq, Emilie Delogu, Morgane Chapelier and Thomas H. G. Vidal
Remote Sens. 2023, 15(2), 517; https://doi.org/10.3390/rs15020517 - 15 Jan 2023
Cited by 1 | Viewed by 1659
Abstract
The coming years will see the launch of several missions (TRISHNA, LSTM, SBG), which will acquire images in four or more spectral bands in thermal infrared (TIR) at high spatial resolution (~50–60 m) and with high temporal revisit (~2–3 days). The derivation of [...] Read more.
The coming years will see the launch of several missions (TRISHNA, LSTM, SBG), which will acquire images in four or more spectral bands in thermal infrared (TIR) at high spatial resolution (~50–60 m) and with high temporal revisit (~2–3 days). The derivation of surface temperature and emissivity values from top-of-atmosphere radiances is not straightforward, as it is a non-deterministic process requiring additional information. In this paper, we propose the algorithm DirecTES to efficiently separate surface temperature and emissivity. This algorithm is based on the use of a comprehensive spectral database of emissivity, resulting in a well-posed deterministic problem while not assuming strong hypotheses. The algorithm can also benefit from non-TIR information, such as the acquisitions from the same satellite but in the visible and near-infrared domains, or exogenous data—land/sea mask or soil-occupation map. These would help identify the nature of the surface and therefore improve the temperature and emissivity retrievals. After the complete description of the method, we evaluate the performances of DirecTES on theoretical landscapes in TRISHNA’s context under a large range of atmospheric conditions. The retrievals of surface temperature reach RMSEs of 0.8 K over vegetation and 0.5 K over water, including both sensor and atmospheric uncertainties. We then evaluate DirecTES on ECOSTRESS images on sites where the ECOSTRESS Land Surface Temperature (LST) performance has been documented; DirecTES surface temperature retrievals are consistent with the ECOSTRESS LST product and the in-situ data. Full article
Show Figures

Figure 1

24 pages, 24036 KiB  
Article
Arctic Sea Ice Lead Detection from Chinese HY-2B Radar Altimeter Data
by Wenqing Zhong, Maofei Jiang, Ke Xu and Yongjun Jia
Remote Sens. 2023, 15(2), 516; https://doi.org/10.3390/rs15020516 - 15 Jan 2023
Cited by 3 | Viewed by 1641
Abstract
Sea ice thickness is one of the essential characteristics of sea ice. Sea ice lead detection is the key to sea ice thickness estimation from radar altimetry data. This research studies ten different surface type classification methods, including supervised learning, unsupervised learning, and [...] Read more.
Sea ice thickness is one of the essential characteristics of sea ice. Sea ice lead detection is the key to sea ice thickness estimation from radar altimetry data. This research studies ten different surface type classification methods, including supervised learning, unsupervised learning, and threshold methods, being applied to the HY-2B radar altimeter data collected in October 2019 in the Arctic Ocean. The Sentinel-1 Synthetic Aperture Radar (SAR) images were used for training and validation of the classifiers. Compared with other classifiers, the supervised Bagging ensemble learning classifier showed excellent and robust performance with overall accuracy up to 95.69%. In order to assess the performance of the Bagging classifier in practical applications, lead fractions from January 2019 to March 2021 based on the HY-2B radar altimeter data were mapped using the trained Bagging classifier and compared to the CryoSat-2 L2I data product. The results of the lead fraction showed the monthly variability of ice lead, and the ice lead had a reasonable spatial distribution and was consistent with CryoSat-2 L2I data products. According to these results, the Bagging classifier can provide an essential reference for future studies of Arctic sea ice thickness and sea level estimation from HY-2B radar altimeter data. Full article
Show Figures

Figure 1

17 pages, 2700 KiB  
Article
Mapping Large-Scale Bamboo Forest Based on Phenology and Morphology Features
by Xueliang Feng, Shen Tan, Yun Dong, Xin Zhang, Jiaming Xu, Liheng Zhong and Le Yu
Remote Sens. 2023, 15(2), 515; https://doi.org/10.3390/rs15020515 - 15 Jan 2023
Cited by 3 | Viewed by 2159
Abstract
Bamboo forest is a unique forest landscape that is mainly composed of herbal plants. It has a stronger capability to increase terrestrial carbon sinks than woody forests in the same environment, thus playing a special role in absorbing atmospheric CO2. Accurate [...] Read more.
Bamboo forest is a unique forest landscape that is mainly composed of herbal plants. It has a stronger capability to increase terrestrial carbon sinks than woody forests in the same environment, thus playing a special role in absorbing atmospheric CO2. Accurate and timely bamboo forest maps are necessary to better understand and quantify their contribution to the carbon and hydrological cycles. Previous studies have reported that the unique phenology pattern of bamboo forests, i.e., the on- and off-year cycle, can be detected with time-series high spatial resolution remote sensing (RS) images. Nevertheless, this information has not yet been applied in large-scale bamboo mapping. In this study, we innovatively incorporate newly designed phenology features reflecting the aforementioned on- and off-year cycles into a typical end-to-end classification workflow, including two features describing growing efficiency during the green-up season and two features describing the difference between annual peak greenness. Additionally, two horizonal morphology features and one tree height feature were employed, simultaneously. An experiment in southeast China was carried out to test the method’s performance, in which seven categories were focused. A total of 987 field samples were used for training and validation (70% and 30%, respectively). The results show that combining the time-series features based on spectral bands and vegetation indices and newly designed phenology and morphology patterns can differentiate bamboo forests from other vegetation categories. Based on these features, the classification results exhibit a reasonable spatial distribution and a satisfactory overall accuracy (0.89). The detected bamboo area proportion in 82 counties agrees with the statistics from China’s Third National Land Survey, which was produced based on high resolution images from commercial satellites and human interpretation (correlation coefficient = 0.69, and root mean squared error = 5.1%). This study demonstrates that the new scheme incorporating phenology features helps to map bamboo forests accurately while reducing the sample size requirement. Full article
(This article belongs to the Special Issue Remote Sensing Applications in Vegetation Classification)
Show Figures

Figure 1

17 pages, 3626 KiB  
Article
The Effect of Negative Samples on the Accuracy of Water Body Extraction Using Deep Learning Networks
by Jia Song and Xiangbing Yan
Remote Sens. 2023, 15(2), 514; https://doi.org/10.3390/rs15020514 - 15 Jan 2023
Cited by 2 | Viewed by 1588
Abstract
Water resources are important strategic resources related to human survival and development. Water body extraction from remote sensing images is a very important research topic for the monitoring of global and regional surface water changes. Deep learning networks are one of the most [...] Read more.
Water resources are important strategic resources related to human survival and development. Water body extraction from remote sensing images is a very important research topic for the monitoring of global and regional surface water changes. Deep learning networks are one of the most effective approaches and training data is indispensable for ensuring the network accurately extracts water bodies. The training data for water body extraction includes water body samples and non-water negative samples. Cloud shadows are essential negative samples due to the high similarity between water bodies and cloud shadows, but few studies quantitatively evaluate the impact of cloud shadow samples on the accuracy of water body extraction. Therefore, the training datasets with different proportions of cloud shadows were produced, and each of them includes two types of cloud shadow samples: the manually-labeled cloud shadows and unlabeled cloud shadows. The training datasets are applied on a novel transformer-based water body extraction network to investigate how the negative samples affect the accuracy of the water body extraction network. The evaluation results of Overall Accuracy (OA) of 0.9973, mean Intersection over Union (mIoU) of 0.9753, and Kappa of 0.9747 were obtained, and it was found that when the training dataset contains a certain proportion of cloud shadows, the trained network can handle the misclassification of cloud shadows well and more accurately extract water bodies. Full article
(This article belongs to the Topic Geocomputation and Artificial Intelligence for Mapping)
(This article belongs to the Section AI Remote Sensing)
Show Figures

Figure 1

11 pages, 249 KiB  
Editorial
Status of Earth Observation and Remote Sensing Applications in Svalbard
by Shridhar D. Jawak, Veijo Pohjola, Andreas Kääb, Bo N. Andersen, Małgorzata Błaszczyk, Roberto Salzano, Bartłomiej Luks, Hiroyuki Enomoto, Kjell Arild Høgda, Geir Moholdt, Frode Dinessen and Ann Mari Fjæraa
Remote Sens. 2023, 15(2), 513; https://doi.org/10.3390/rs15020513 - 15 Jan 2023
Cited by 1 | Viewed by 2125
Abstract
Remarkable developments in the fields of earth observation (EO) satellites and remote sensing (RS) technology over the past four decades have substantially contributed to spatial, spectral, and temporal sampling [...] Full article
Previous Issue
Back to TopTop