
Vegetation Change and Eco-Environmental Quality Evaluation in the Loess Plateau of China from 2000 to 2020

 , ,
, ,
Abstract
:1. Introduction
2. Data and Methods
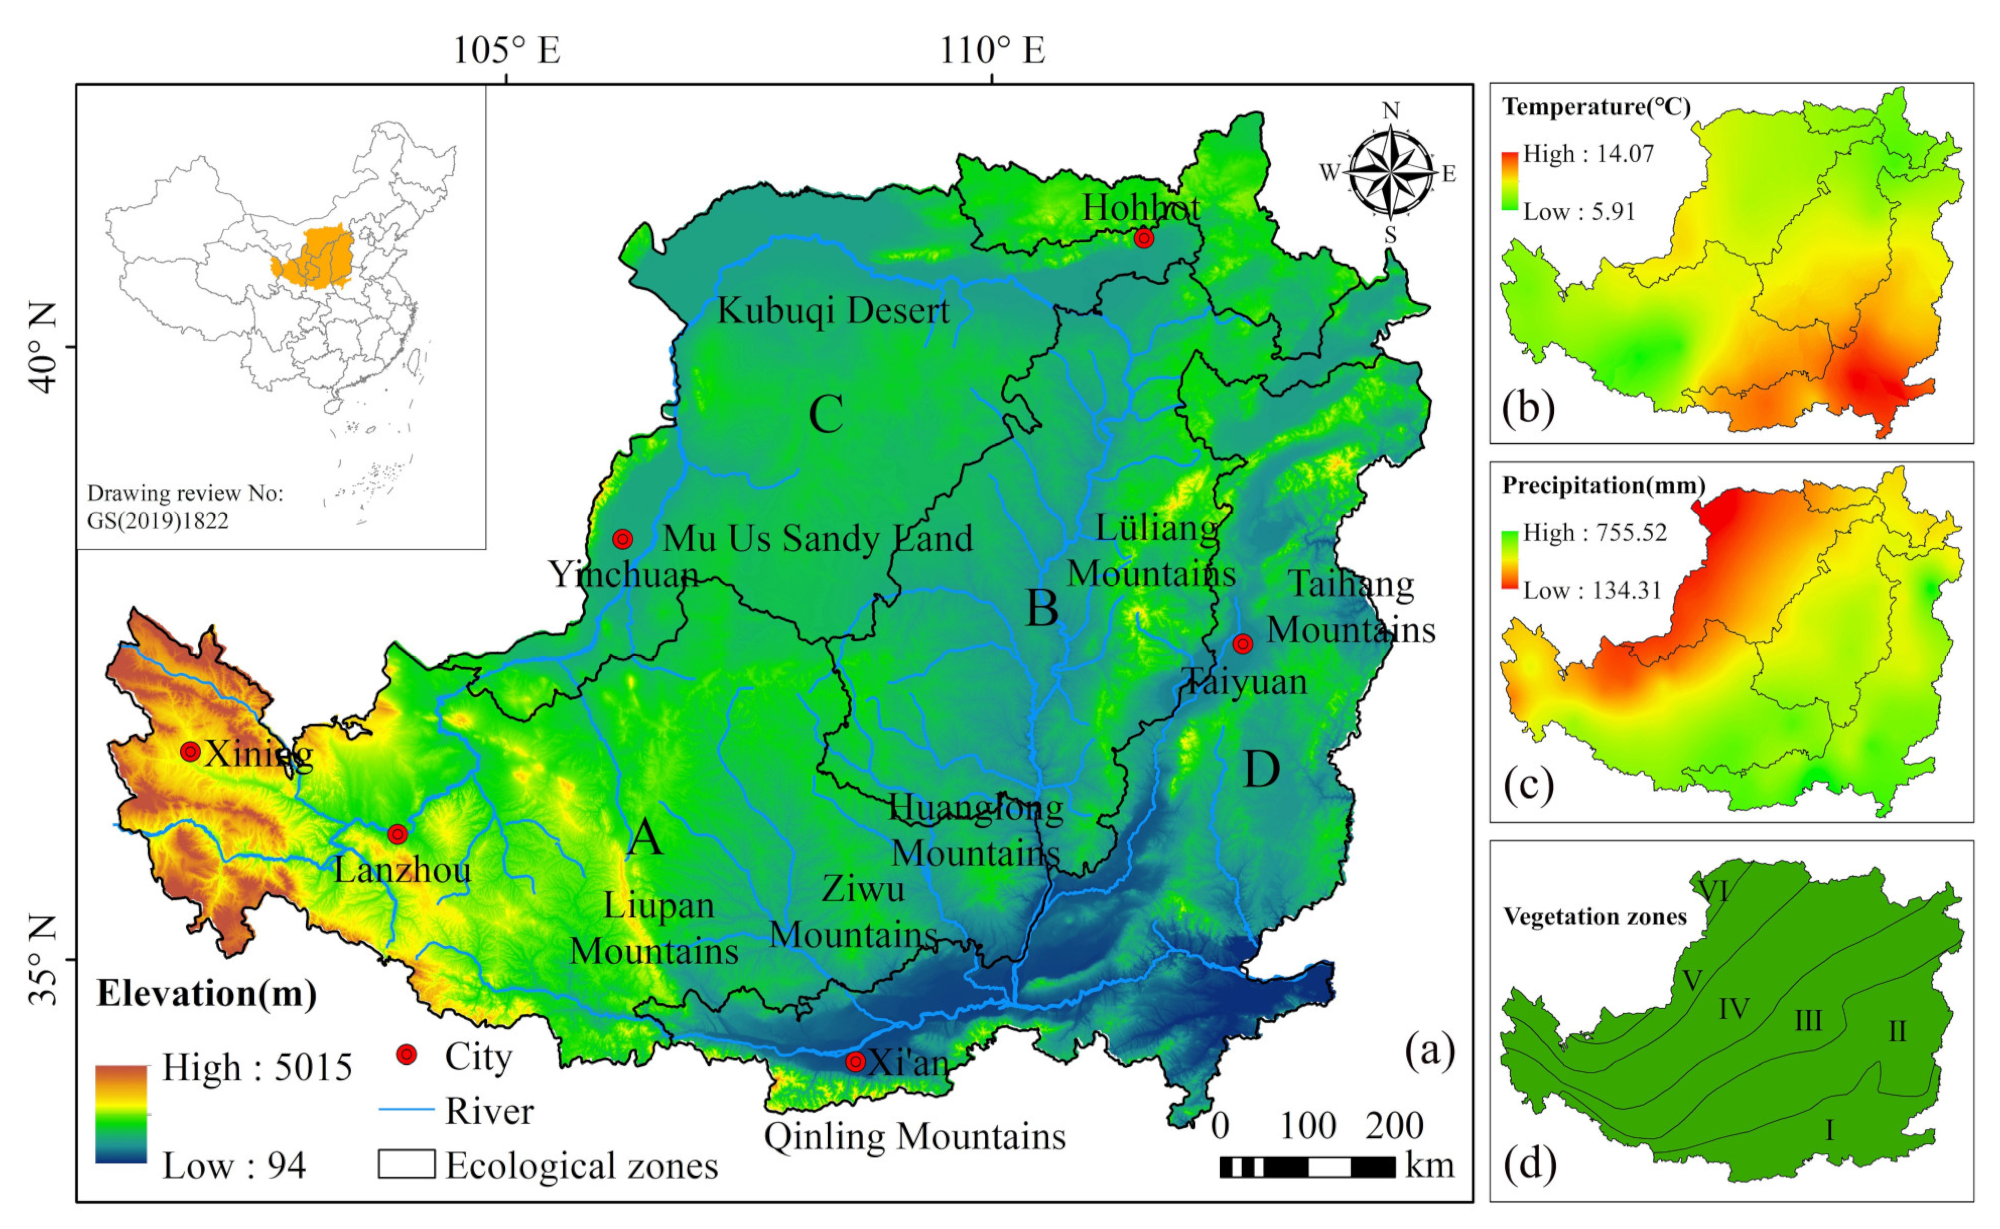
2.1. Study Area
2.2. Materials
2.3. Methods
2.3.1. Calculation of FVC
2.3.2. Estimation of NPP
2.3.3. Construction of RSEI
2.3.4. Change Trend and Inspection
3. Results and Analysis
3.1. Vegetation Changes in the LP
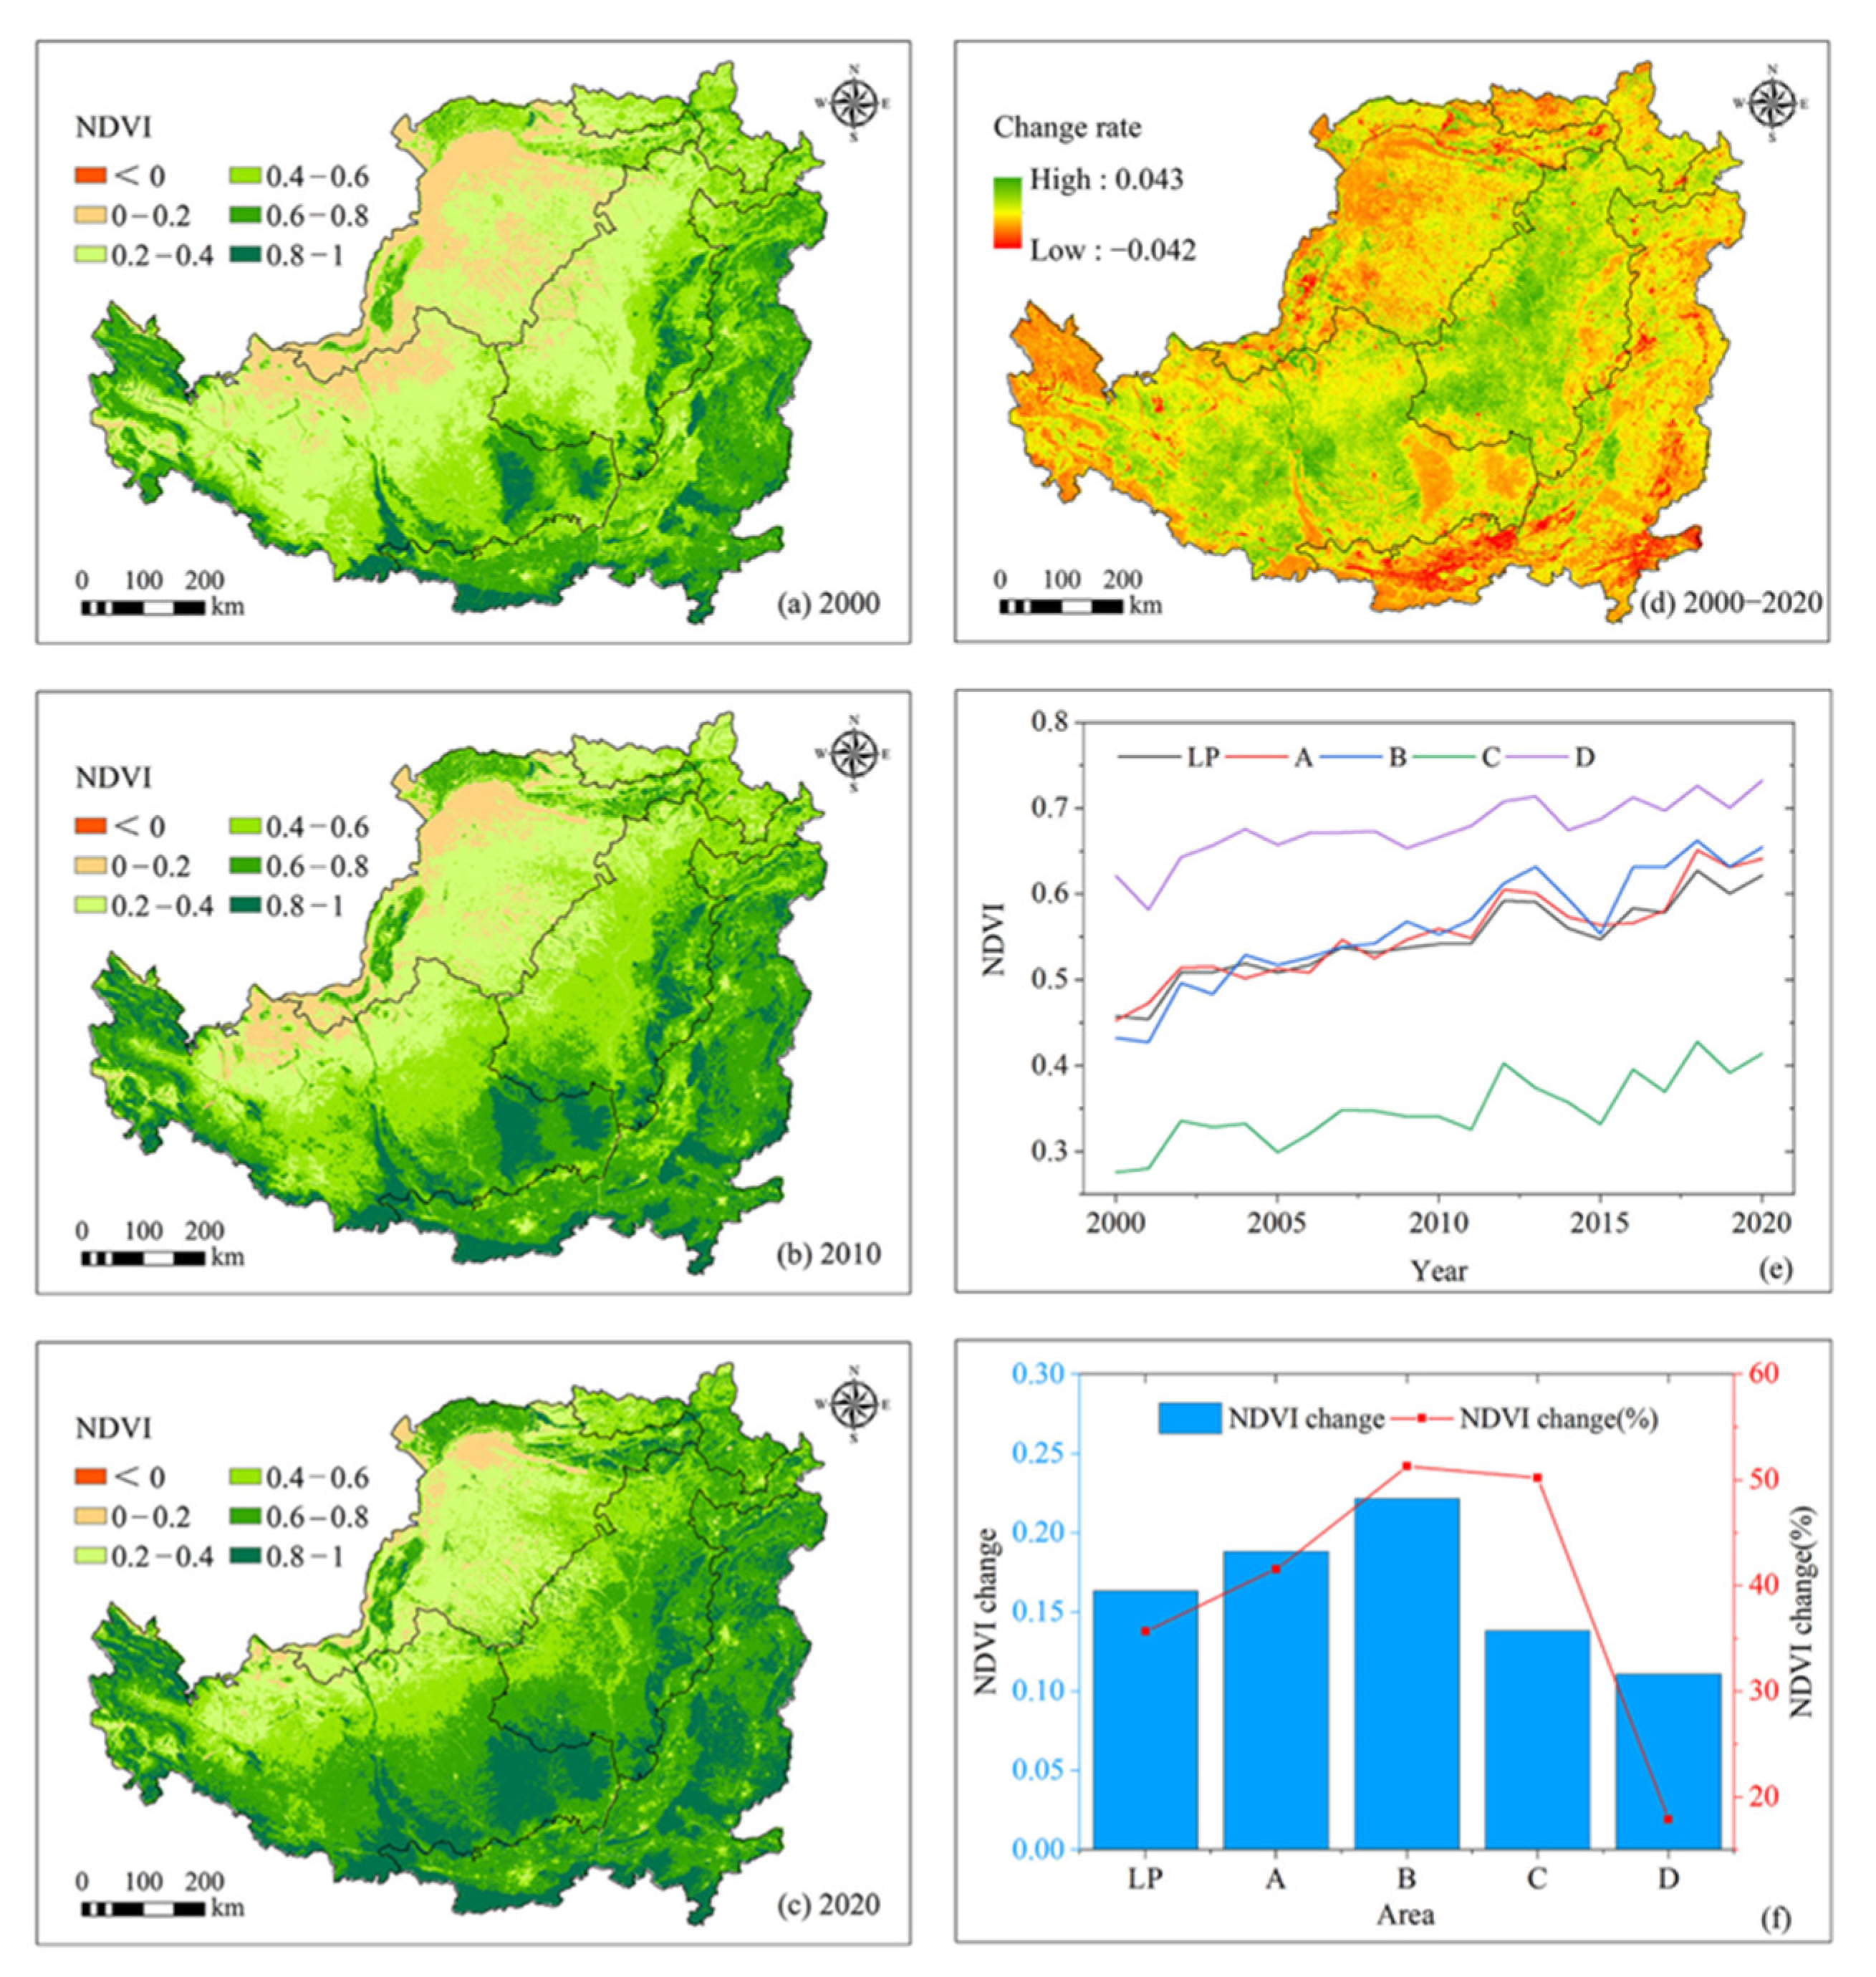
3.1.1. Changes in the NDVI
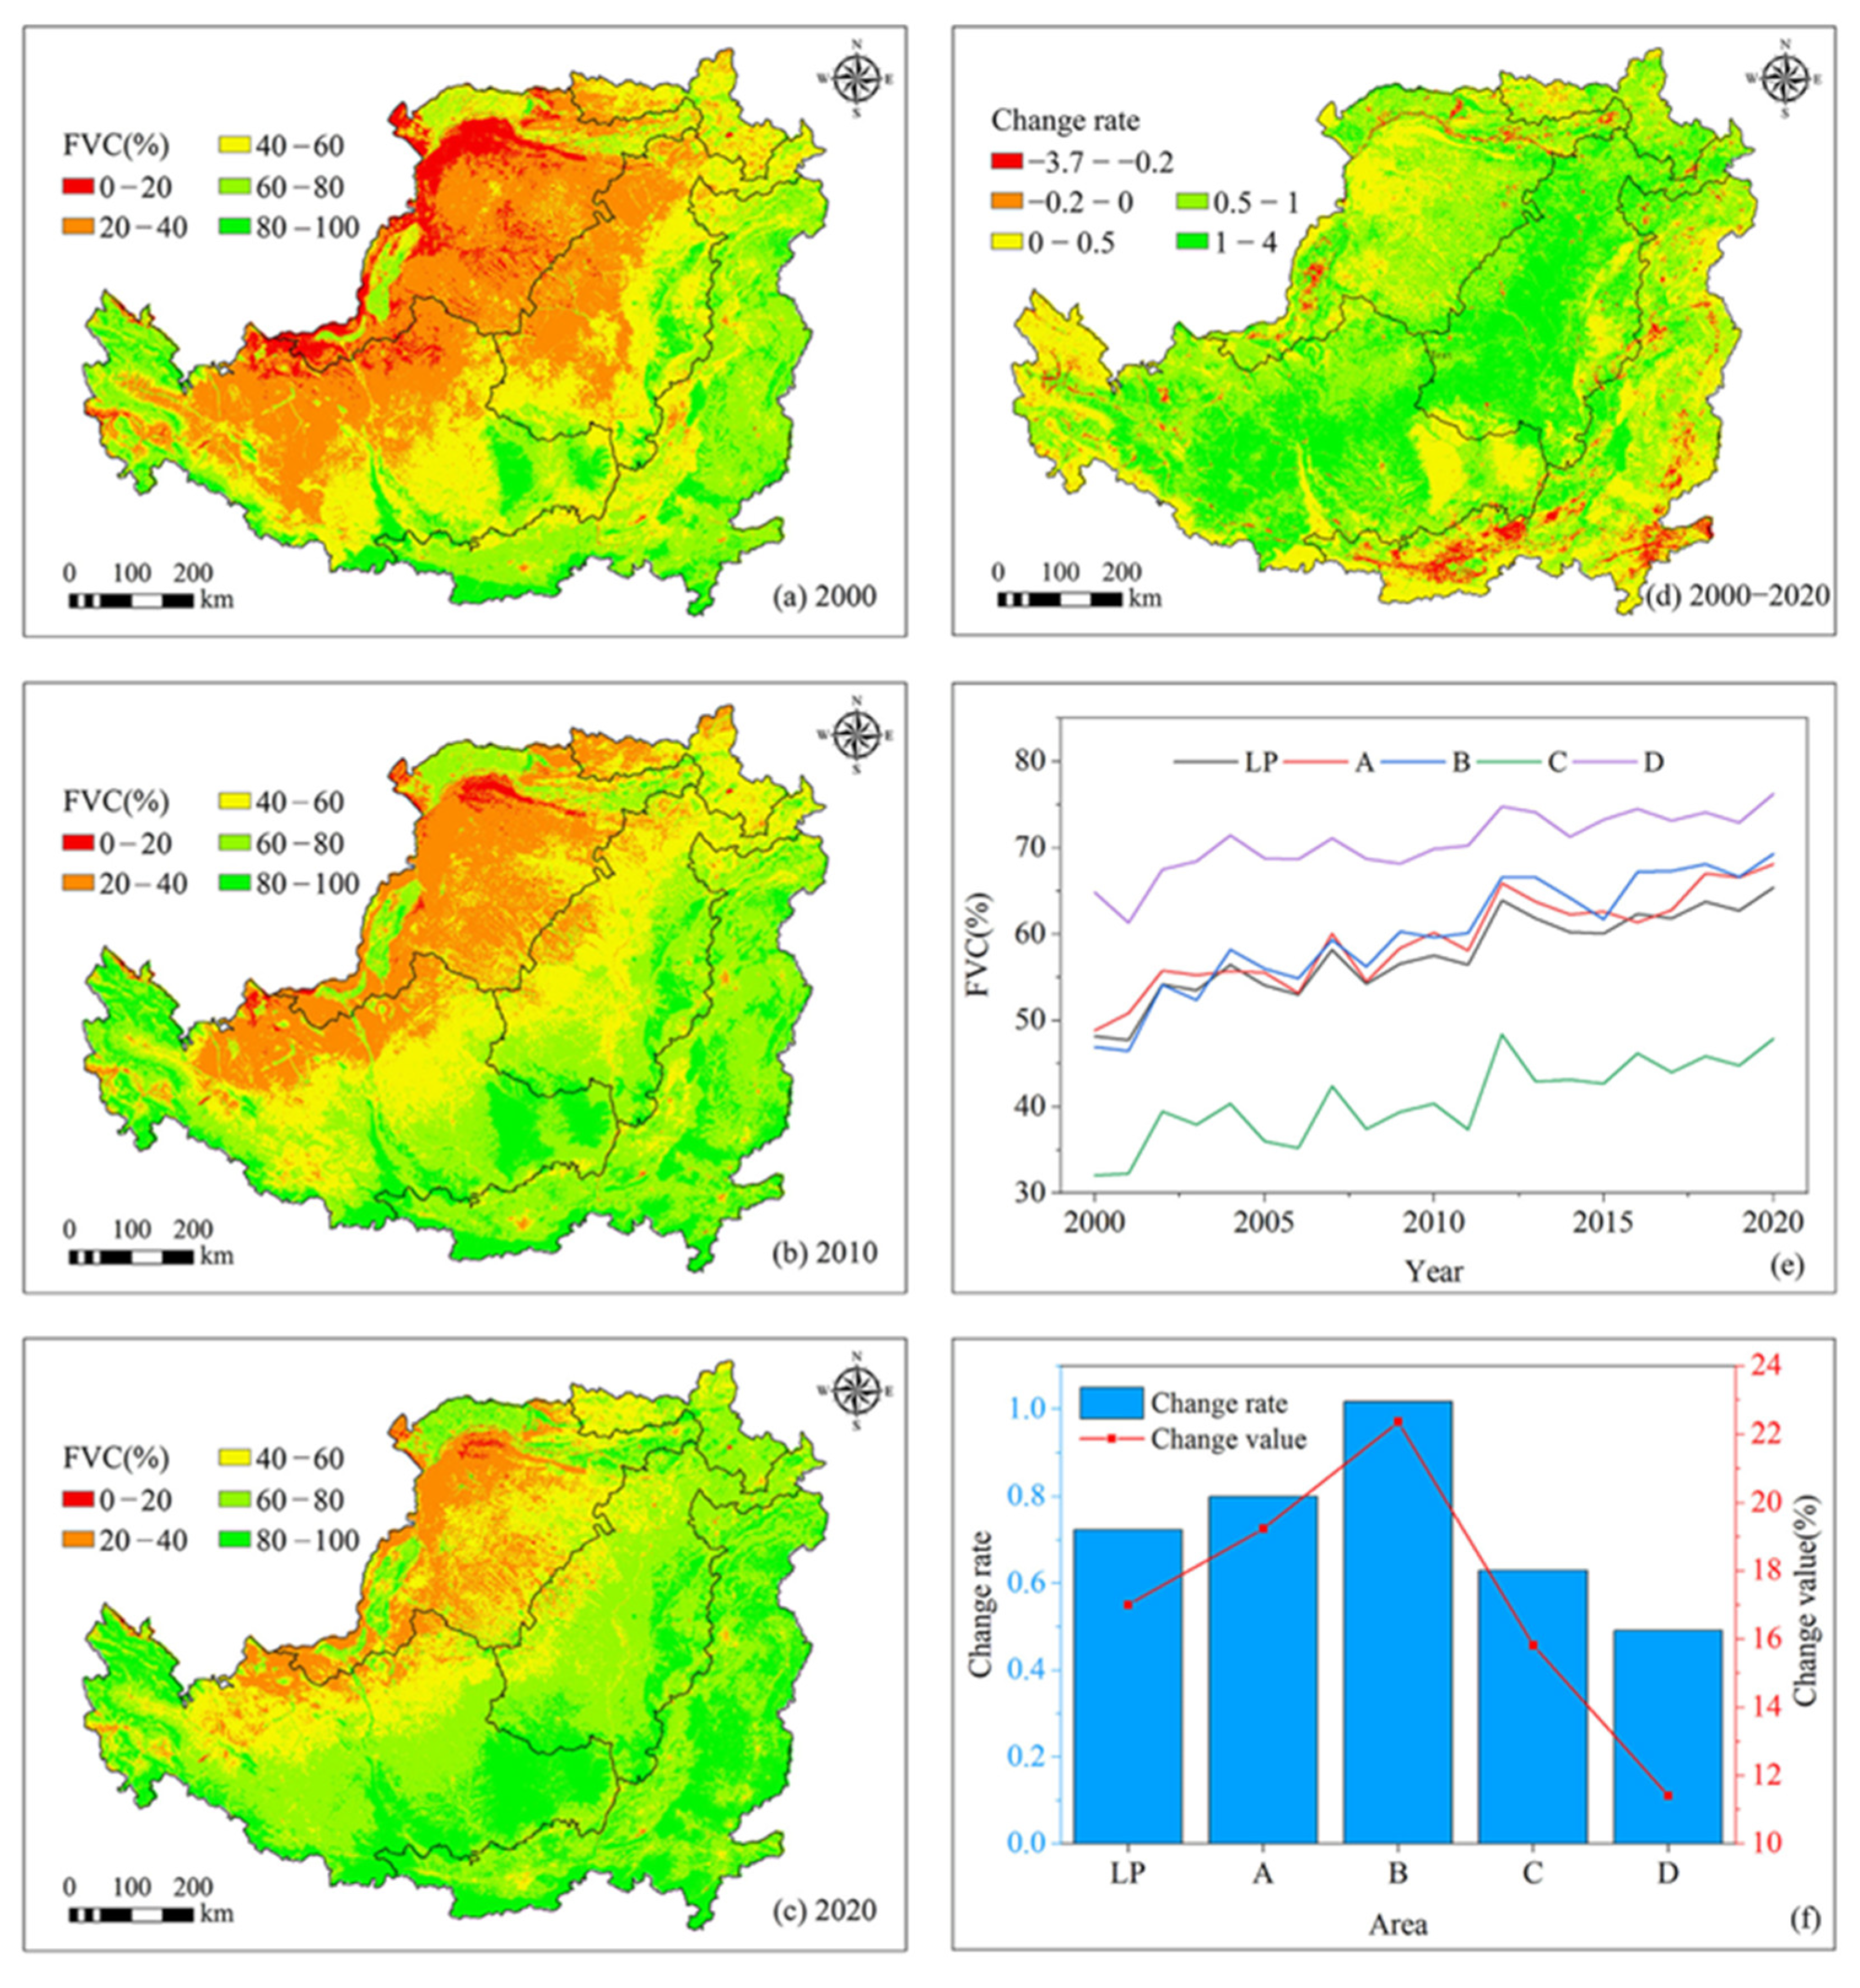
3.1.2. Changes in FVC
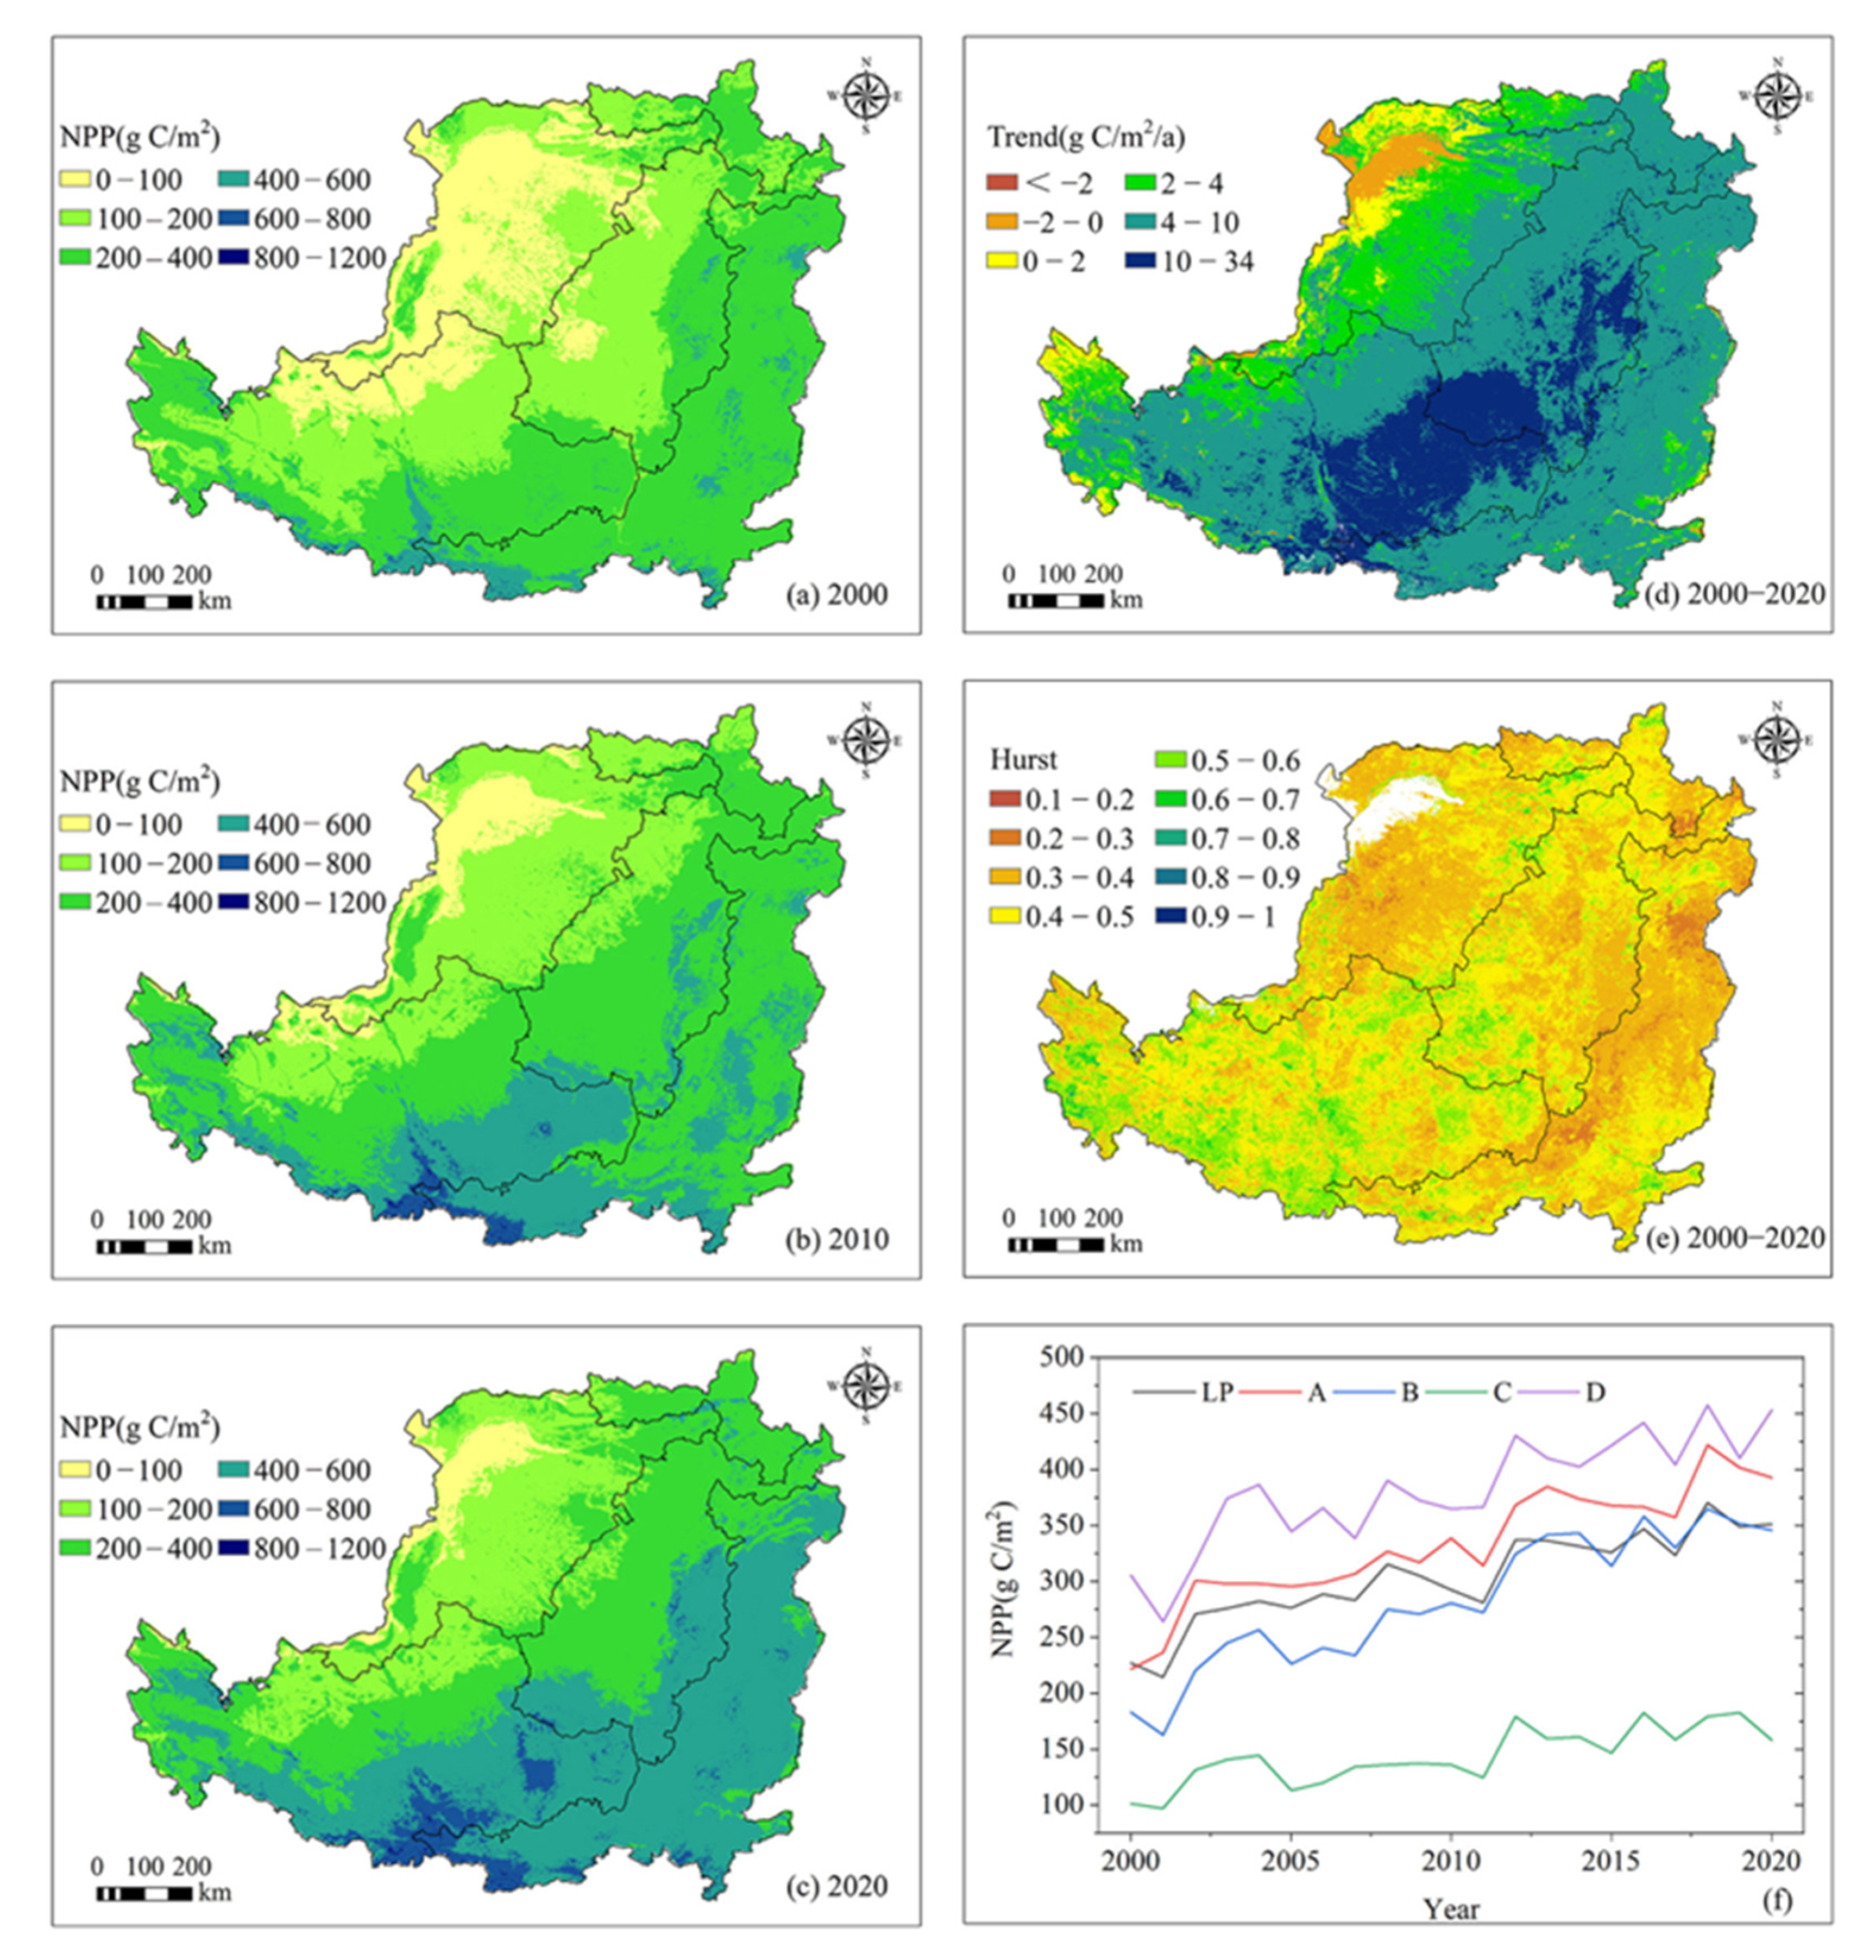
3.1.3. Changes in the NPP
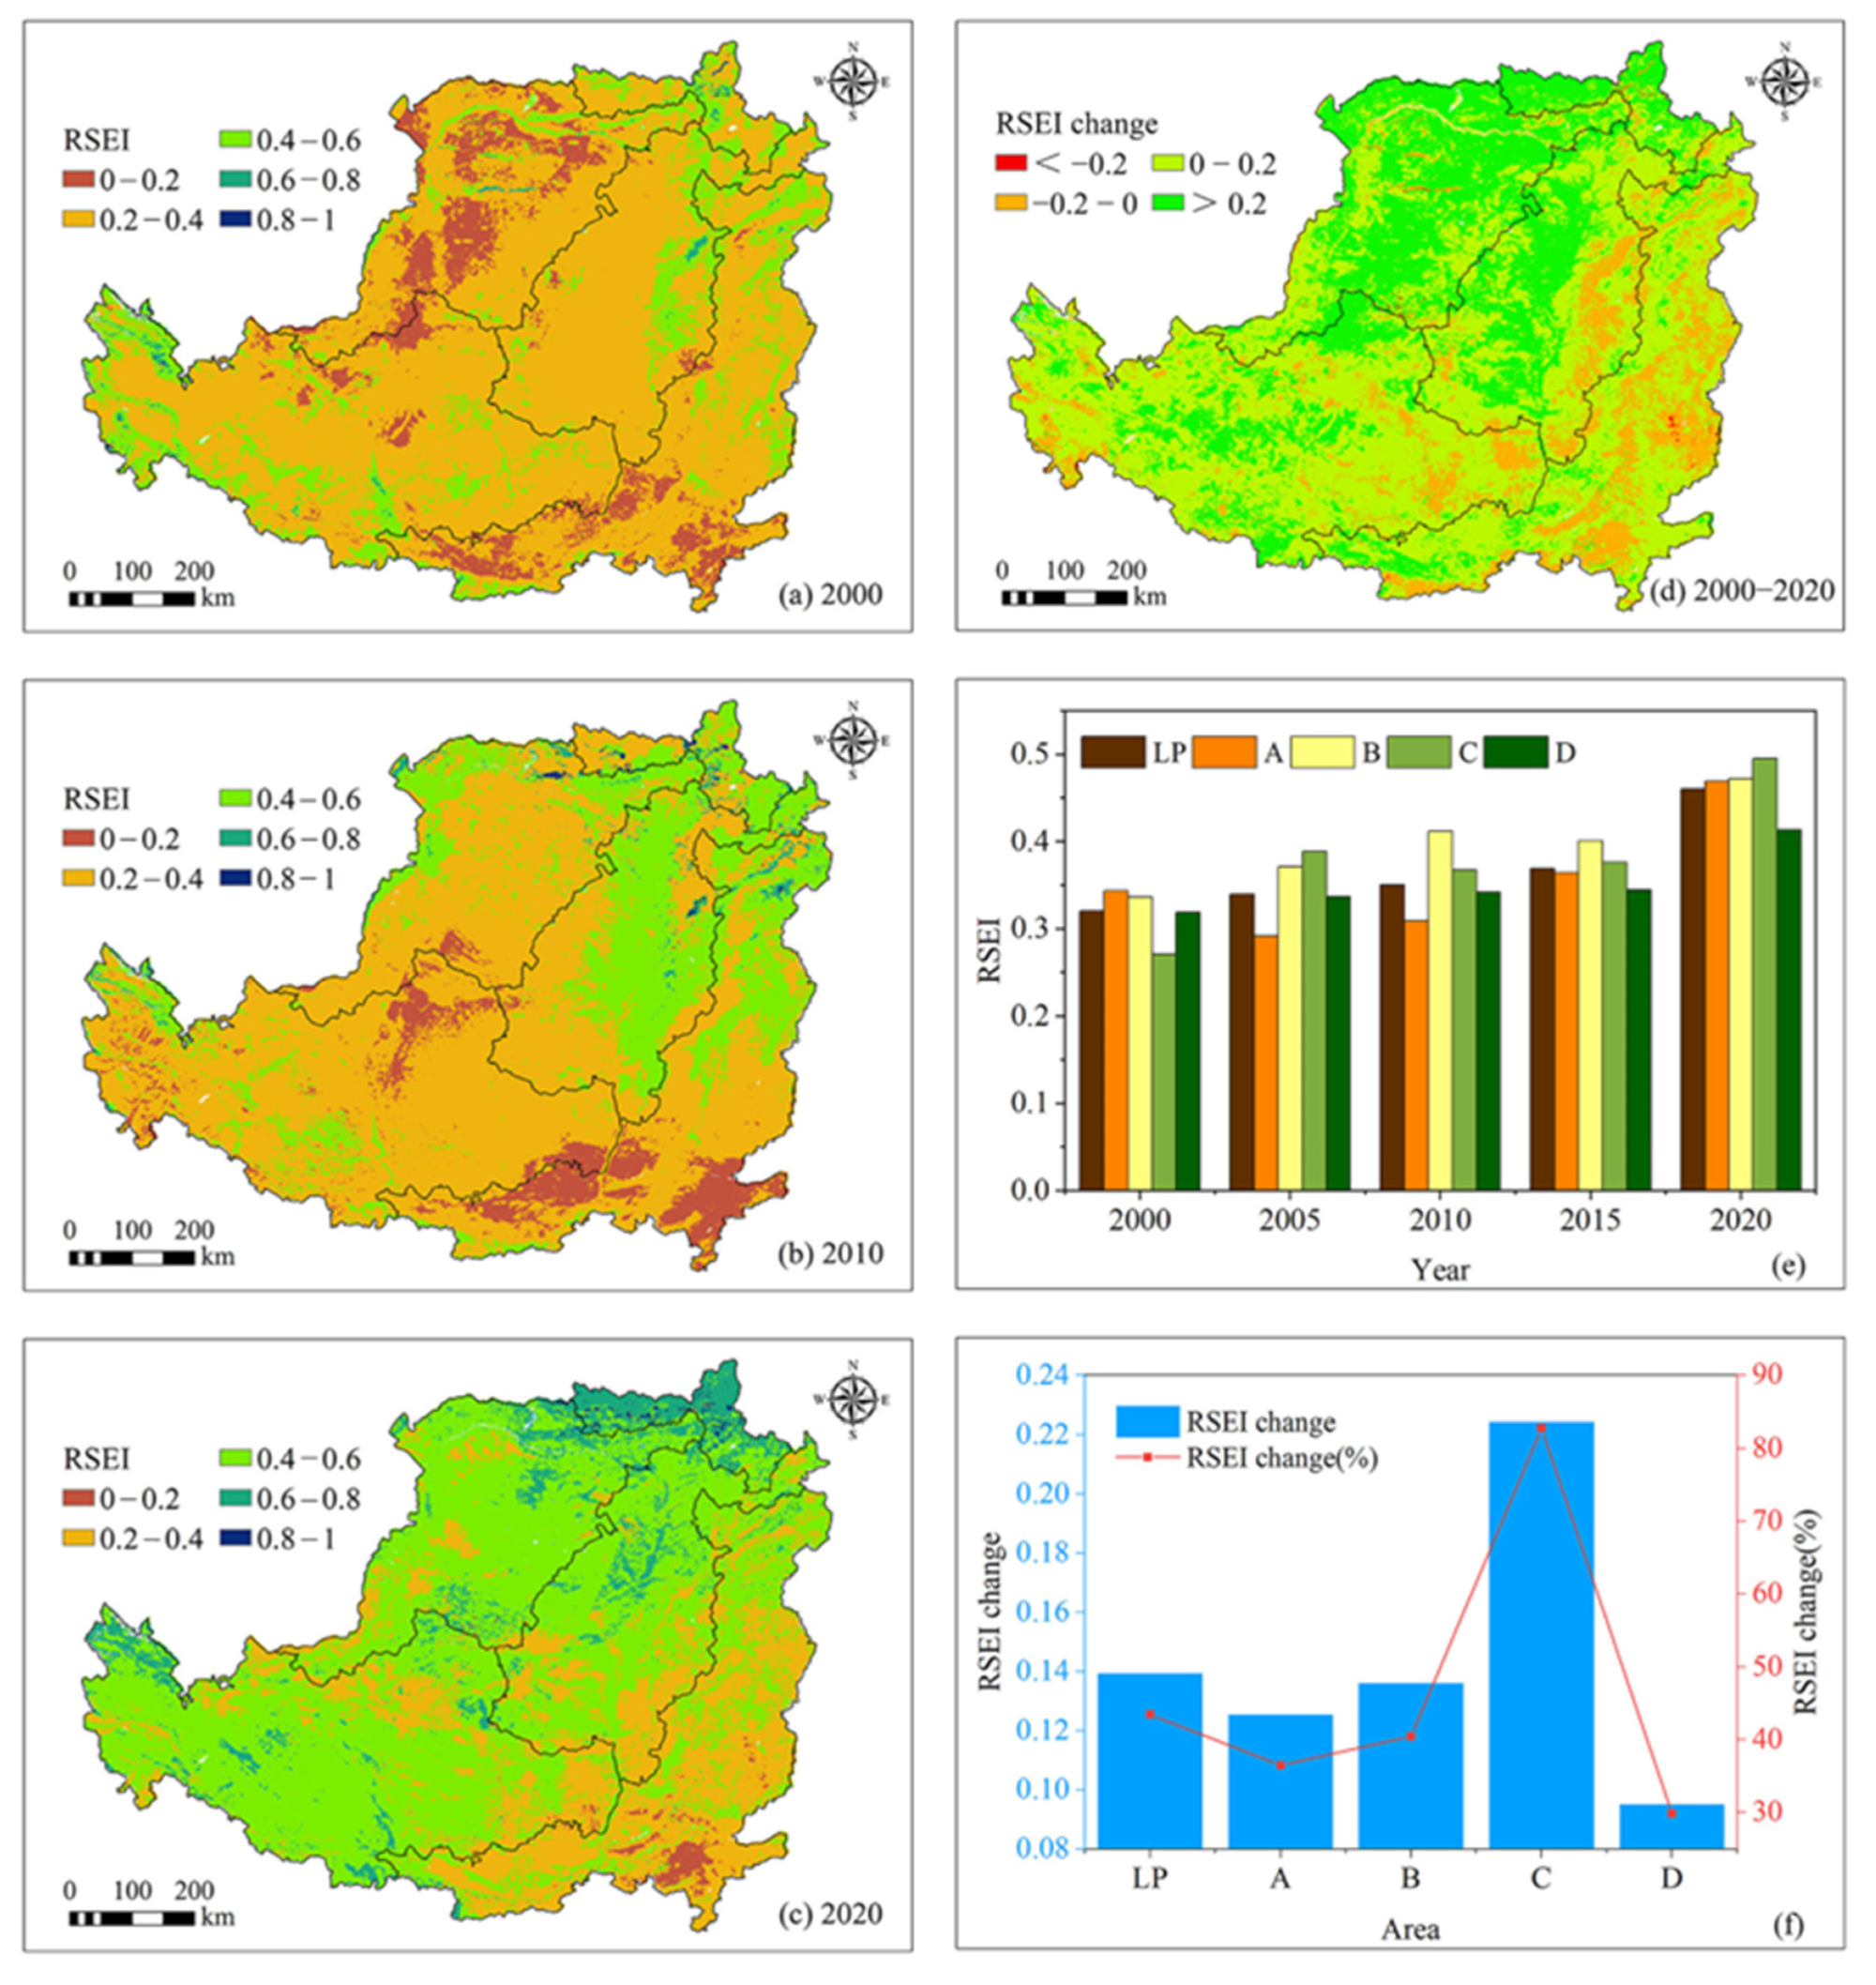
3.2. Ecological Environment Quality Evaluation of the LP
3.3. Analysis on the Causes of Vegetation Change
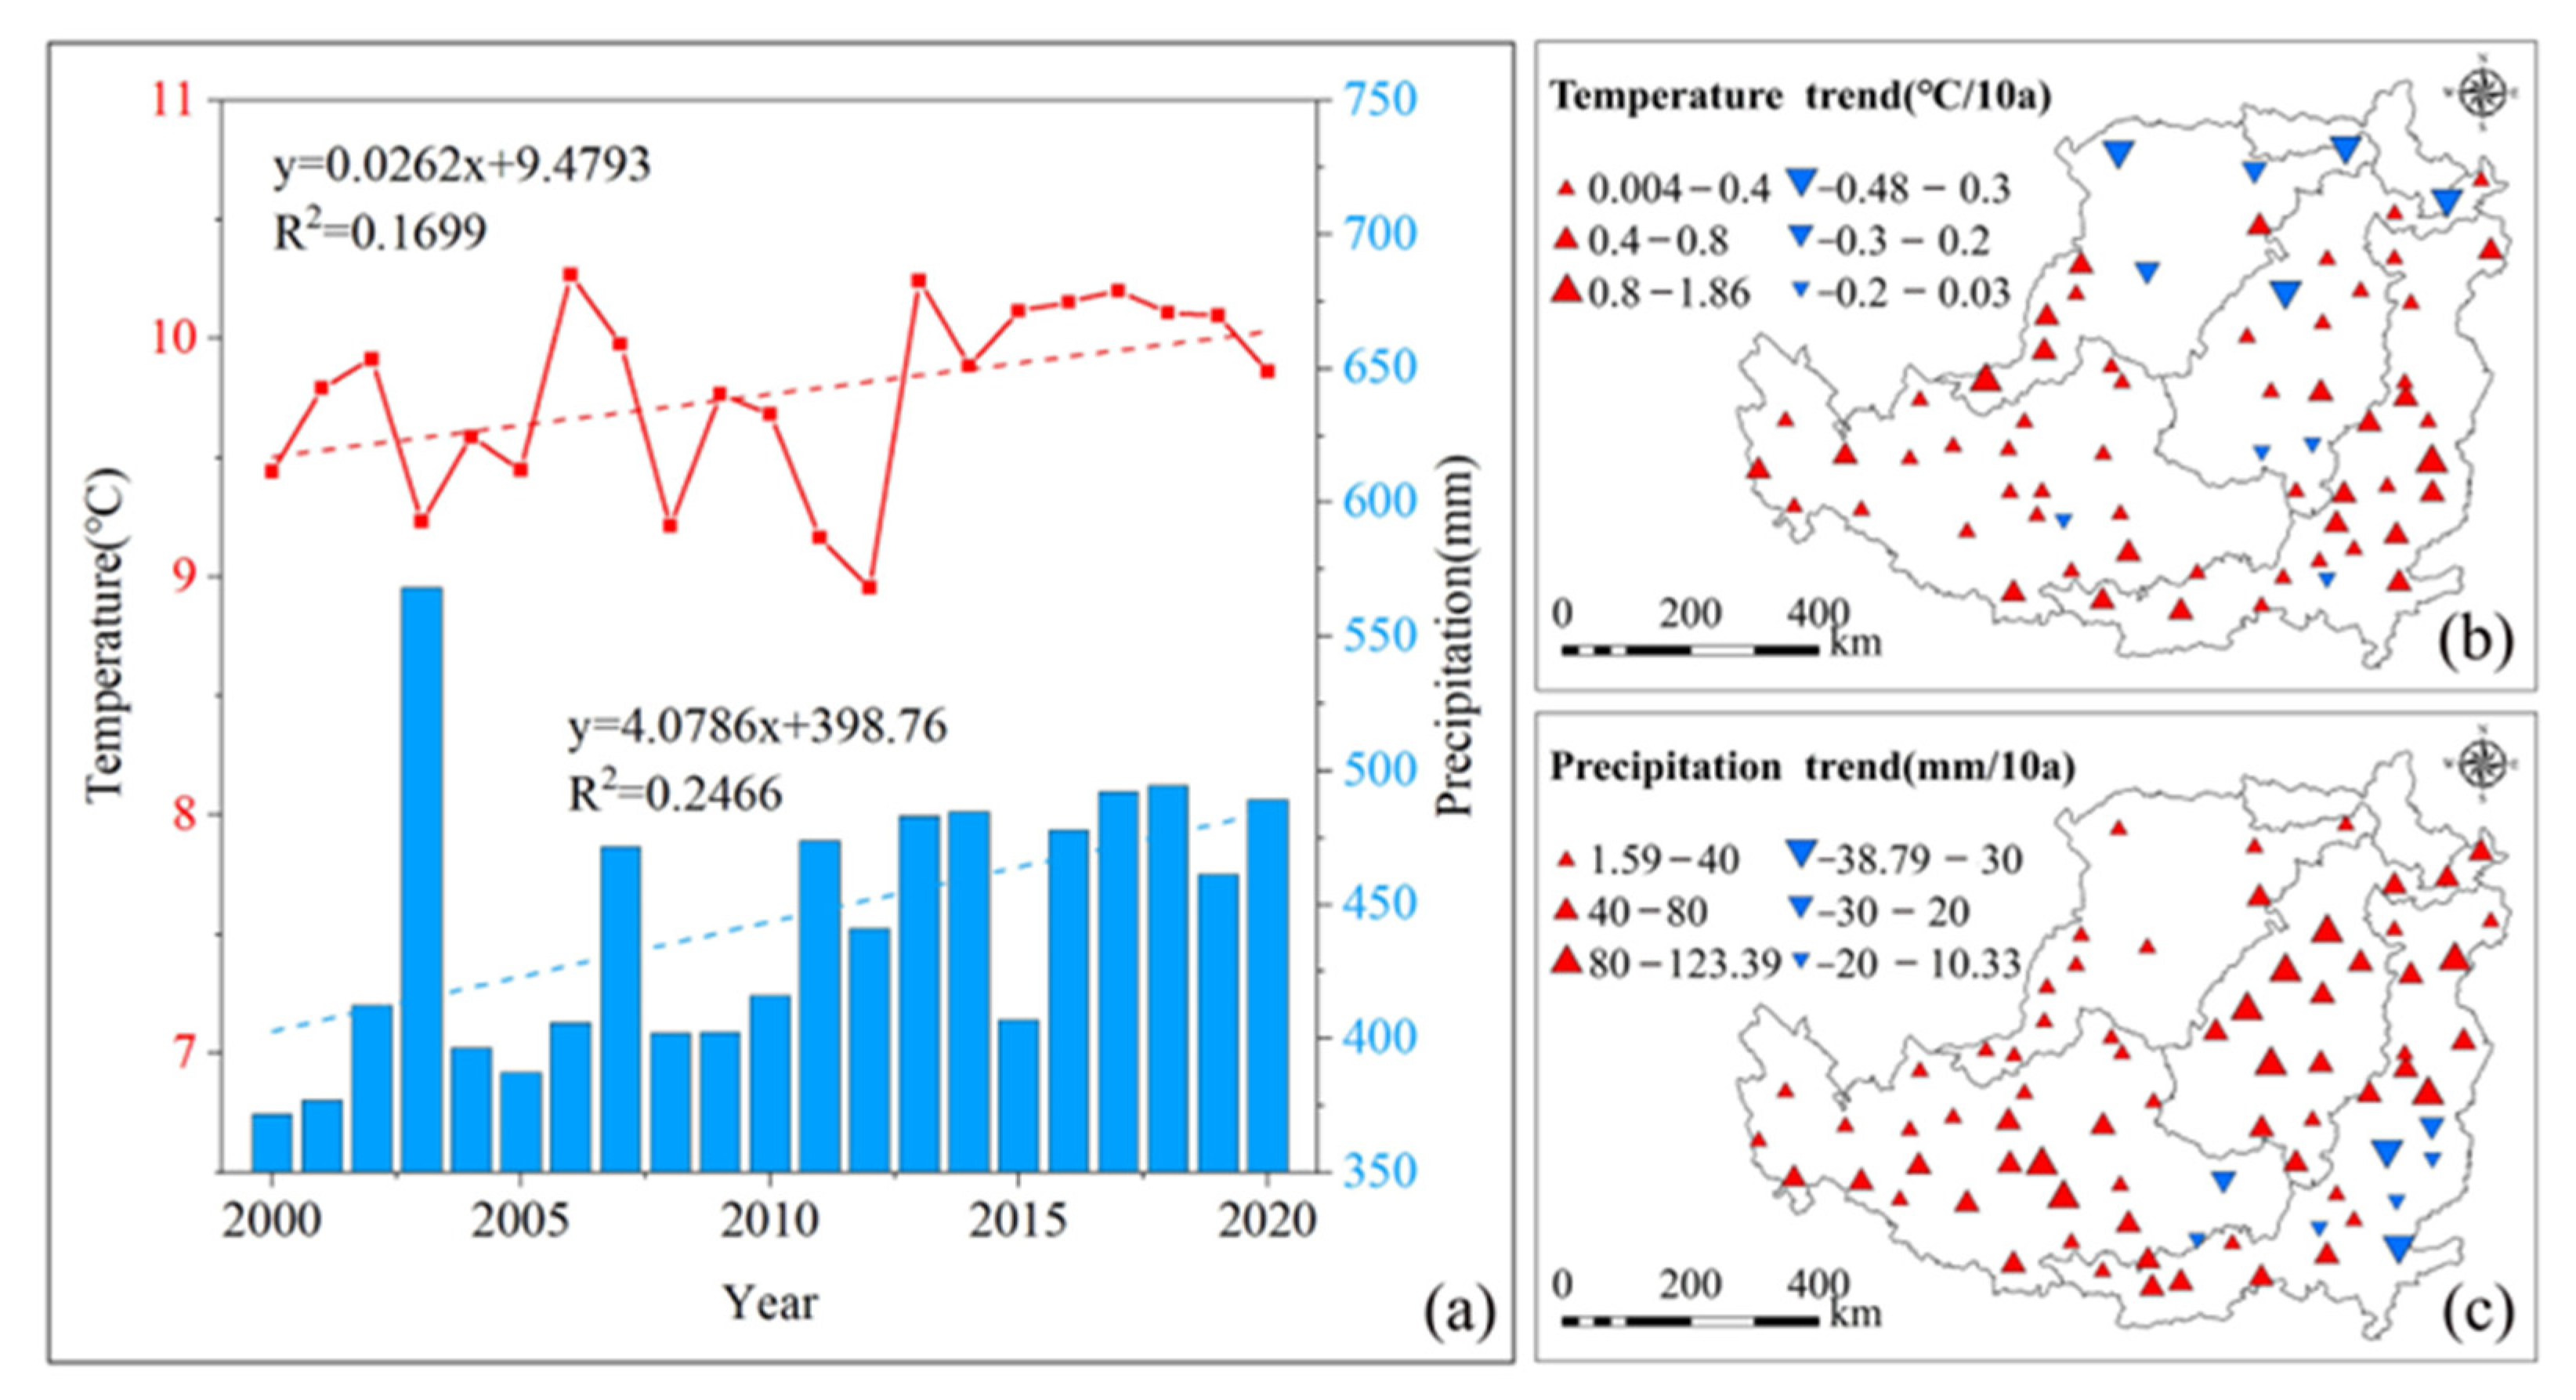
3.3.1. Climatic Factors
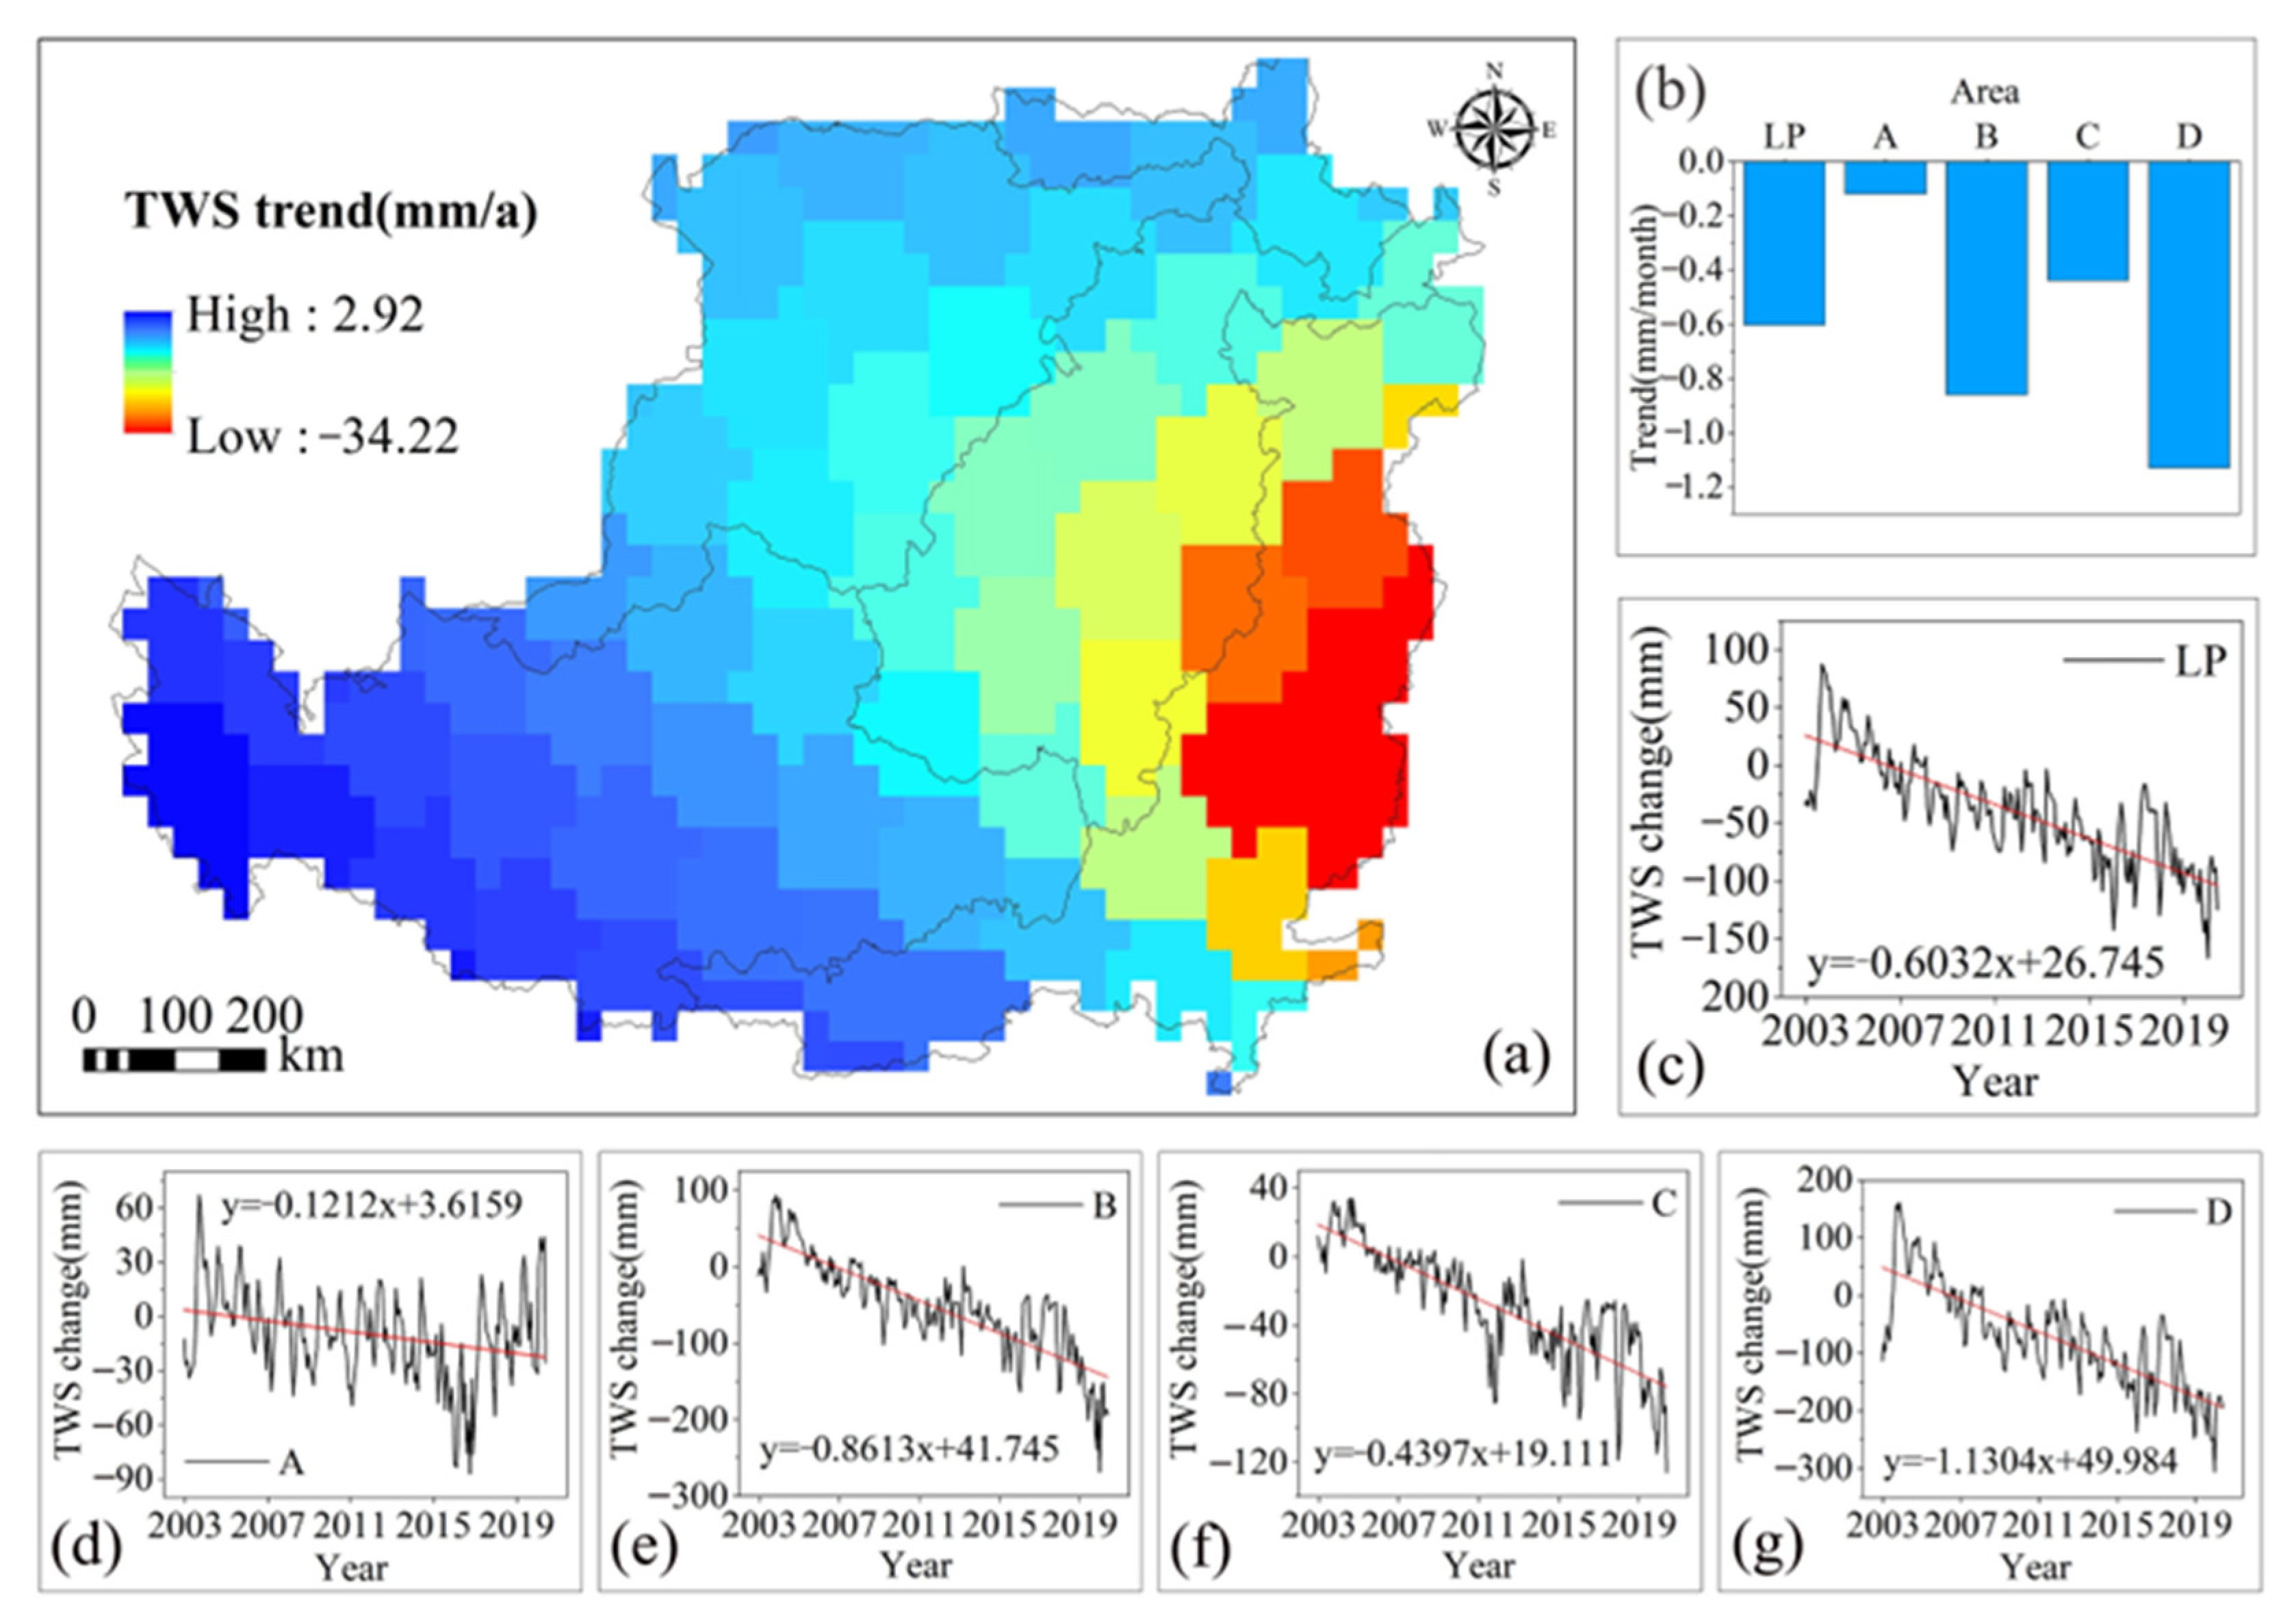
3.3.2. TWS Factor
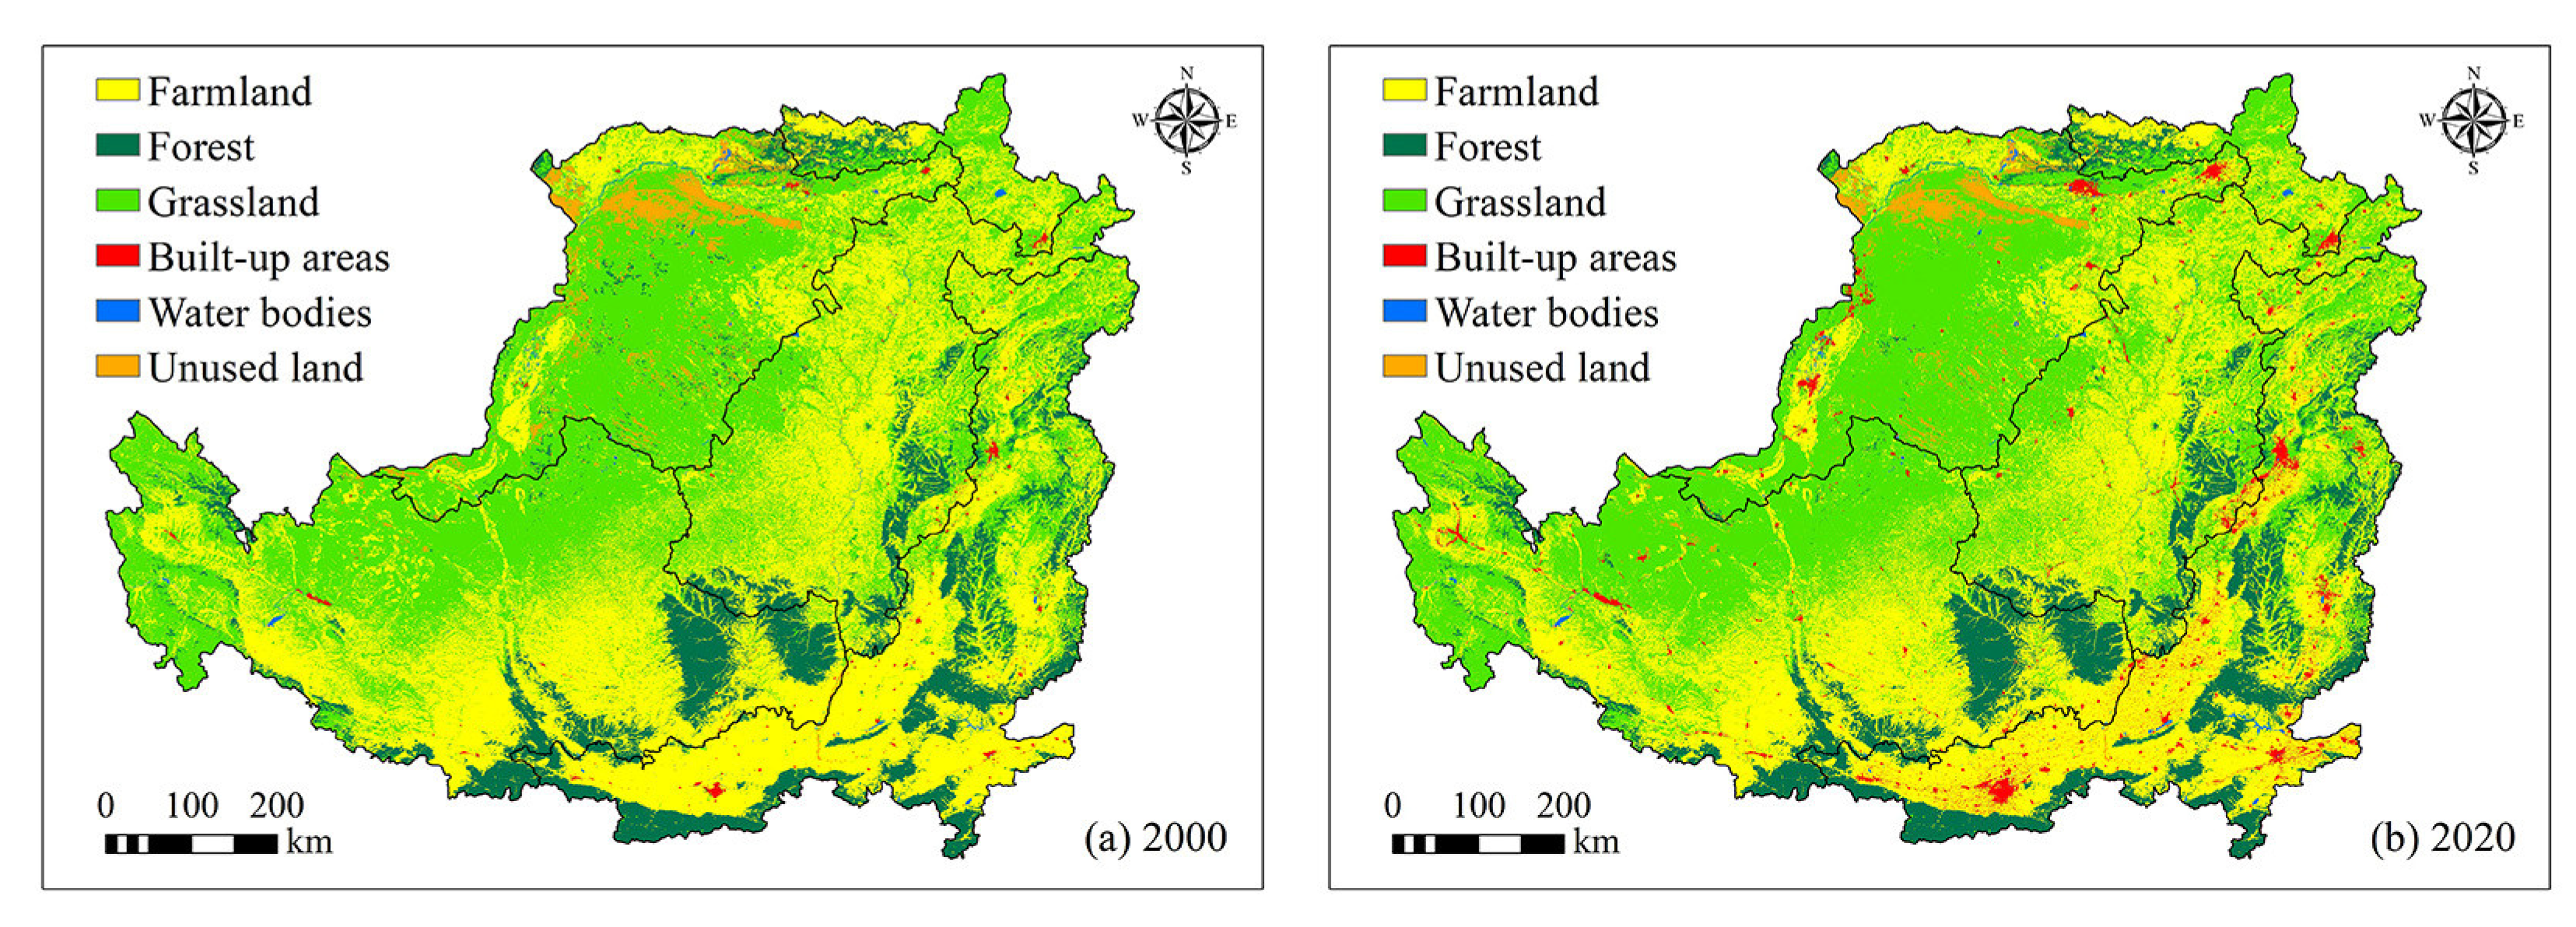
3.3.3. LUCC Factors
4. Discussion
5. Conclusions
Author Contributions
Funding
Institutional Review Board Statement
Informed Consent Statement
Data Availability Statement
Acknowledgments
Conflicts of Interest
References
- Li, Y.P.; Chen, Y.N.; Sun, F.; Li, Z. Recent vegetation browning and its drivers on Tianshan Mountain, Central Asia. Ecol. Indic. 2021, 129, 107912. [Google Scholar] [CrossRef]
- Sun, W.Y.; Song, X.Y.; Mu, X.M.; Gao, P.; Wang, F.; Zhao, G.J. Spatiotemporal vegetation cover variations associated with climate change and ecological restoration in the Loess Plateau. Agric. For. Meteorol. 2015, 209, 87–99. [Google Scholar] [CrossRef]
- Pan, Y.D.; Birdsey, R.A.; Fang, J.Y.; Houghton, R.; Kauppi, P.E.; Kurz, W.A.; Phillips, O.L.; Shvidenko, A.; Lewis, S.L.; Canadell, J.G.; et al. A Large and Persistent Carbon Sink in the World’s Forests. Science 2011, 333, 988–993. [Google Scholar] [CrossRef] [PubMed] [Green Version]
- Gao, J.; Zhang, Y.; Zheng, Z.; Cong, N.; Zhao, G.; Zhu, Y.; Chen, Y.; Sun, Y.; Zhang, J.; Zhang, Y. Ecological Engi-neering Projects Shifted the Dominance of Human Activity and Climate Variability on Vegetation Dynamics. Remote Sens. 2022, 14, 2386. [Google Scholar] [CrossRef]
- Feng, X.M.; Fu, B.J.; Zhang, Y.; Pan, N.Q.; Zeng, Z.Z.; Tian, H.Q.; Lyu, Y.H.; Chen, Y.Z.; Ciais, P.; Wang, Y.P. Recent leveling off of vegetation greenness and primary production reveals the increasing soil water limitations on the greening Earth. Sci. Bull. 2021, 66, 1462–1471. [Google Scholar] [CrossRef]
- Zhang, Y.L.; Song, C.H.; Band, L.E.; Sun, G.; Li, J.X. Reanalysis of global terrestrial vegetation trends from MODIS products: Browning or greening? Remote Sens. Environ. 2017, 191, 145–155. [Google Scholar] [CrossRef] [Green Version]
- Ding, Z.; Peng, J.; Qiu, S.; Zhao, Y. Nearly Half of Global Vegetated Area Experienced Inconsistent Vegetation Growth in Terms of Greenness, Cover, and Productivity. Earths Future 2020, 8, e2020EF001618. [Google Scholar] [CrossRef]
- Chen, C.; Park, T.; Wang, X.H.; Piao, S.L.; Xu, B.D.; Chaturvedi, R.K.; Fuchs, R.; Brovkin, V.; Ciais, P.; Fensholt, R.; et al. China and India lead in greening of the world through land-use management. Nat. Sustain. 2019, 2, 122–129. [Google Scholar] [CrossRef]
- Li, J.; Xi, M.; Wang, L.; Li, N.; Wang, H.; Qin, F. Vegetation responses to climate change and anthropogenic activity in China, 1982 to 2018. Int. J. Environ. Res. Public Health 2022, 19, 7391. [Google Scholar] [CrossRef]
- Fang, H.L.; Baret, F.; Plummer, S.; Schaepman-Strub, G. An Overview of Global Leaf Area Index (LAI): Methods, Products, Validation, and Applications. Rev. Geophys. 2019, 57, 739–799. [Google Scholar] [CrossRef]
- Zhang, X.L.; Huang, X.R. Human disturbance caused stronger influences on global vegetation change than climate change. Peerj 2019, 7, e7763. [Google Scholar] [CrossRef]
- Zhu, Z.C.; Piao, S.L.; Myneni, R.B.; Huang, M.T.; Zeng, Z.Z.; Canadell, J.G.; Ciais, P.; Sitch, S.; Friedlingstein, P.; Arneth, A.; et al. Greening of the earth and its drivers. Nat. Clim. Change 2016, 6, 791–795. [Google Scholar] [CrossRef]
- Zheng, H.; Miao, C.; Li, X.; Kong, D.; Gou, J.; Wu, J.; Zhang, S. Effects of vegetation changes and multiple environmental factors on evapotranspiration across China over the past 34 years. Earths Future 2022, 10, e2021EF002564. [Google Scholar] [CrossRef]
- Feng, X.; Fu, B.; Piao, S.; Wang, S.; Ciais, P.; Zeng, Z.; Lü, Y.; Zeng, Y.; Li, Y.; Jiang, X.; et al. Revegetation in China’s Loess Plateau is approaching sustainable water resource limits. Nat. Clim. Change 2016, 6, 1019–1022. [Google Scholar] [CrossRef]
- Hu, Y.F.; Dao, R.N.; Hu, Y. Vegetation change and driving factors: Contribution analysis in the Loess Plateau of China during 2000–2015. Sustainability 2019, 11, 1320. [Google Scholar] [CrossRef] [Green Version]
- Fu, B.J.; Wu, X.T.; Wang, Z.Z.; Wu, X.L.; Wang, S. Coupling human and natural systems for sustainability: Experience from China’s Loess Plateau. Earth Syst. Dynam. 2022, 13, 795–808. [Google Scholar] [CrossRef]
- Wang, D.; Yue, D.X.; Zhou, Y.Y.; Huo, F.B.; Bao, Q.; Li, K. Drought resistance of vegetation and its change characteristics before and after the implementation of the Grain for Green Program on the Loess Plateau, China. Remote Sens. 2022, 14, 5142. [Google Scholar] [CrossRef]
- Fu, B.J.; Wang, S.; Liu, Y.; Liu, J.B.; Liang, W.; Miao, C.Y. Hydrogeomorphic ecosystem responses to natural and anthropogenic changes in the Loess Plateau of China. Annu. Rev. Earth Planet. Sci. 2017, 45, 223–243. [Google Scholar] [CrossRef]
- Zhu, C.; Ma, C.M.; Chen, G. Introduction to Global Change Science, 4th ed.; Science Press: Beijing, China, 2017; pp. 415–416. [Google Scholar]
- Naeem, S.; Zhang, Y.Q.; Zhang, X.Z.; Tian, J.; Abbas, S.; Luo, L.L.; Meresa, H.K. Both climate and socioeconomic drivers contribute to vegetation greening of the Loess Plateau. Sci. Bull. 2021, 66, 1160–1163. [Google Scholar] [CrossRef]
- Xiao, J. Satellite evidence for significant biophysical consequences of the “Grain for Green” Program on the Loess Plateau in China. J. Geophys. Res. Biogeosci. 2014, 119, 2261–2275. [Google Scholar] [CrossRef]
- Kou, P.L.; Xu, Q.; Jin, Z.; Yunus, A.P.; Luo, X.B.; Liu, M.H. Complex anthropogenic interaction on vegetation greening in the Chinese Loess Plateau. Sci. Total Environ. 2021, 778, 146065. [Google Scholar] [CrossRef] [PubMed]
- Ni, X.N.; Guo, W.; Li, X.T.; Li, S.H. Heterogeneity of increases in net primary production under intensified human activity and climate variability on the Loess Plateau of China. Remote Sens. 2022, 14, 4706. [Google Scholar] [CrossRef]
- Zhang, K.; Lu, Y.H.; Fu, B.J.; Yin, L.C.; Yu, D.D. Impact of vegetation cover change on ecosystem services in the Loess Plateau and its threshold. J. Geogr. 2020, 75, 949–960. [Google Scholar]
- Zhang, S.L.; Yang, D.; Yang, Y.T.; Piao, S.; Yang, H.B.; Lei, H.M.; Fu, B.J. Excessive afforestation and soil drying on China’s Loess Plateau. J. Geophys. Res.-Biogeosci. 2018, 123, 923–935. [Google Scholar] [CrossRef]
- Zhang, X.Z.; Zhang, Z.F.; Song, S.F. Modulation of vegetation restoration on outdoor thermal comfort over the Loess Plateau, China from 1982 to 2015. Environ. Res. Commun. 2021, 3, 015002. [Google Scholar] [CrossRef]
- Jin, K.; Wang, F.; Zong, Q.L.; Qin, P.; Liu, C.X. Impact of variations in vegetation on surface air temperature change over the Chinese Loess Plateau. Sci. Total Environ. 2020, 716, 136967. [Google Scholar] [CrossRef] [PubMed]
- Zhang, B.Q.; Tian, L.; Zhao, X.N.; Wu, P. Feedbacks between vegetation restoration and local precipitation over the Loess Plateau in China. Sci. China Earth Sci. 2021, 64, 920–931. [Google Scholar] [CrossRef]
- Feng, D.R.; Fu, M.C.; Sun, Y.F.; Bao, W.K.; Zhang, M.; Zhang, Y.F.; Wu, J.J. How large-scale anthropogenic activities influence vegetation cover change in China? A review. Forests 2021, 12, 320. [Google Scholar] [CrossRef]
- Yang, Z.K.; Tian, J.; Li, W.Y.; Su, W.R.; Guo, R.Y.; Liu, W.J. Spatio-temporal pattern and evolution trend of eco-environmental quality in the Yellow River Basin. Acta Ecol. Sin. 2021, 41, 7627–7636. [Google Scholar]
- Kumari, N.; Srivastava, A.; Dumka, U.C. A Long-Term Spatiotemporal Analysis of Vegetation Greenness over the Himalayan Region Using Google Earth Engine. Climate 2021, 9, 109. [Google Scholar] [CrossRef]
- Jiang, X.D.; Shen, W.; Bai, X.Y. Response of net primary productivity to vegetation restoration in Chinese Loess Plateau during 1986–2015. PLoS ONE 2019, 14, e219270. [Google Scholar] [CrossRef] [Green Version]
- Dong, Y.; Yin, D.; Li, X.; Huang, J.; Su, W.; Li, X.; Wang, H. Spatial–Temporal Evolution of Vegetation NDVI in Association with Climatic, Environmental and Anthropogenic Factors in the Loess Plateau, China during 2000–2015: Quantitative Analysis Based on Geographical Detector Model. Remote Sens. 2021, 13, 4380. [Google Scholar] [CrossRef]
- Gang, C.C.; Zhao, W.; Zhao, T.; Zhang, Y.; Gao, X.R.; Wen, Z.M. The impacts of land conversion and management measures on the grassland net primary productivity over the Loess Plateau, Northern China. Sci. Total Environ. 2018, 645, 827–836. [Google Scholar] [CrossRef]
- Xu, H.Q. A remote sensing index for assessment of regional ecological changes. China Environ. Sci. 2013, 33, 889–897. [Google Scholar]
- Xu, H.Q.; Wang, Y.F.; Guan, H.D.; Shi, T.T.; Hu, X.S. Detecting Ecological Changes with a Remote Sensing Based Ecological Index (RSEI) Produced Time Series and Change Vector Analysis. Remote Sens. 2019, 11, 2345. [Google Scholar] [CrossRef] [Green Version]
- Xiong, Y.; Xu, W.; Lu, N.; Huang, S.; Wu, C.; Wang, L.; Dai, F.; Kou, W. Assessment of spatial–temporal changes of ecological environment quality based on RSEI and GEE: A case study in Erhai Lake Basin, Yunnan province, China. Ecol. Indic. 2021, 125, 107518. [Google Scholar] [CrossRef]
- Li, N.; Wang, J.Y.; Qin, F. The improvement of ecological environment index model RSEI. Arab. J. Geosci. 2020, 13, 403. [Google Scholar]
- Wang, S.; Cui, C.; Dai, Q. Contributions of Vegetation Greening and Climate Change to Evapotranspiration Trend after Large-Scale Vegetation Restoration on the Loess Plateau, China. Water 2021, 13, 1755. [Google Scholar] [CrossRef]
- Jia, X.; Xie, B.; Shao, M.A.; Zhao, C. Primary Productivity and Precipitation-Use Efficiency in Temperate Grassland in the Loess Plateau of China. PLoS ONE 2015, 10, e135490. [Google Scholar] [CrossRef] [Green Version]
- Zhao, G.; Mu, X.; Wen, Z.; Wang, F.; Gao, P. Soil erosion, conservation, and eco- environment changes in the Loess Plateau of China. Land Degrad. Dev. 2013, 24, 499–510. [Google Scholar] [CrossRef]
- Wang, S.; Fu, B.J.; Wu, X.T.; Wang, Y.P. Dynamics and sustainability of social-ecological systems in the Loess Plateau. Resour. Sci. 2020, 42, 96–103. [Google Scholar] [CrossRef]
- Yang, Y.F.; Wang, B.; Wang, G.L.; Li, Z.S. Ecological regionalization and overview of the Loess Plateau. Acta Ecol. Sin. 2019, 39, 7389–7397. [Google Scholar]
- Hu, X.S.; Xu, H.Q. A new remote sensing index for assessing the spatial heterogeneity in urban ecological quality: A case from Fuzhou City, China. Ecol. Indic. 2018, 89, 11–21. [Google Scholar] [CrossRef]
- Gou, R.K.; Zhao, J. Eco-Environmental Quality Monitoring in Beijing, China, Using an RSEI-Based Approach Combined With Random Forest Algorithms. IEEE Access 2020, 8, 196657–196666. [Google Scholar] [CrossRef]
- Yang, C.; Fu, M.; Feng, D.; Sun, Y.; Zhai, G. Spatiotemporal Changes in Vegetation Cover and Its Influencing Factors in the Loess Plateau of China Based on the Geographically Weighted Regression Model. Forests 2021, 12, 673. [Google Scholar] [CrossRef]
- Deng, Y.J.; Jia, L.; Guo, Y.J.; Li, H.; Yao, S.B.; Chu, L.Q.; Lu, W.N.; Hou, M.Y.; Mo, B.B.; Wang, Y.M.; et al. Evaluation of the ecological effects of ecological restoration programs: A case study of the sloping land conversion program on the Loess Plateau, China. Int. J. Environ. Res. Public Health 2022, 19, 7841. [Google Scholar] [CrossRef]
- Ge, W.Y.; Deng, L.Q.; Wang, F.; Han, J.Q. Quantifying the contributions of human activities and climate change to vegetation net primary productivity dynamics in China from 2001 to 2016. Sci. Total Environ. 2021, 773, 145648. [Google Scholar] [CrossRef]
- Li, J.J.; Peng, S.Z.; Li, Z. Detecting and attributing vegetation changes on China’s Loess Plateau. Agric. For. Meteorol. 2017, 247, 260–270. [Google Scholar] [CrossRef]
- Chen, Y.L.; Jiao, J.Y.; Tian, H.W.; Xu, Q.; Feng, L.Q.; Wang, N.; Bai, L.C.; Yang, X. Spatial correlation analysis between vegetation NDVI and natural environmental factors based on geographical detector on the Loess Plateau. Acta Ecol. Sin. 2022, 42, 3569–3580. [Google Scholar]
- Xie, B.; Jia, X.; Qin, Z.; Shen, J.; Chang, Q. Vegetation dynamics and climate change on the Loess Plateau, China: 1982–2011. Reg. Environ. Change 2016, 16, 1583–1594. [Google Scholar] [CrossRef]
- Zhao, Y.L.; Huang, W.J.; Cao, M.; Qi, W.; Li, J.S. Potential Evapotranspiration and Influence Factors of Vegetation in the Loess Plateau. Res. Environ. Sci. 2021, 5, 40. [Google Scholar]
- Li, G.; Sun, S.B.; Han, J.C.; Yan, J.W.; Liu, W.B.; Wei, Y.; Lu, N.; Sun, Y.Y. Impacts of Chinese Grain for Green program and climate change on vegetation in the Loess Plateau during 1982–2015. Sci. Total Environ. 2019, 660, 177–187. [Google Scholar] [CrossRef]
- Wang, K.B. Comparative Assessment of Vegetation Dynamics under the Influence of Climate Change and Human Activities in Five Ecologically Vulnerable Regions of China from 2000 to 2015. Forests 2015, 10, 317. [Google Scholar] [CrossRef] [Green Version]
- Han, Z.M.; Huang, S.Z.; Huang, Q.; Bai, Q.J.; Leng, G.Y.; Wang, H.; Zhao, J.; Wei, X.T.; Zheng, X.D. Effects of vegetation restoration on groundwater drought in the Loess Plateau. J. Hydrol. 2020, 591, 125566. [Google Scholar] [CrossRef]
- Li, C.C.; Zhang, Y.Q.; Shen, Y.J.; Yu, Q. Decadal water storage decrease driven by vegetation changes in the Yellow River Basin. Sci. Bull. 2020, 65, S2095927320304771. [Google Scholar] [CrossRef]
- Guo, Y.Q. Attribution Analysis of Vegetation Coverage Change and Its Impact on Water Storage on the Loess Plateau. Ph.D. Thesis, Northwest A&F University, Xianyang, China, 2020. [Google Scholar]
- Gou, Q.P.; Zhu, Q.K. Response of deep soil moisture to different vegetation types in the Loess Plateau of northern Shannxi, China. Sci. Rep. 2021, 11, 15098. [Google Scholar] [CrossRef]
- Liu, Z.; Wang, J.; Wang, X.; Wang, Y. Understanding the impacts of ‘Grain for Green’ land management practice on land greening dynamics over the Loess Plateau of China. Land Use Policy 2020, 99, 105084. [Google Scholar] [CrossRef]
- Chang, X.G.; Wang, Z.H.; Wei, F.Y.; Xiao, P.Q.; Shen, Z.Z.; Lv, X.Z.; Shi, Y.L. Determining the Contributions of Vegetation and Climate Change to Ecosystem WUE Variation over the Last Two Decades on the Loess Plateau, China. Forests 2021, 12, 1442. [Google Scholar] [CrossRef]
- Zhao, H.F.; He, H.M.; Wang, J.J.; Bai, C.Y.; Zhang, C.J. Vegetation Restoration and Its Environmental Effects on the Loess Plateau. Sustainability 2018, 10, 4676. [Google Scholar] [CrossRef] [Green Version]
- Wang, S.; Fu, B.J.; Piao, S.L.; Lü, Y.H.; Ciais, P.; Feng, X.M.; Wang, Y.F. Reduced sediment transport in the Yellow River due to anthropogenic changes. Nat. Geosci. 2016, 9, 38–41. [Google Scholar] [CrossRef]
- Zhang, J.J.; Gao, G.Y.; Fu, B.J.; Gupta, H.V. Formulating an elasticity approach to quantify the effects of climate variability and ecological restoration on sediment discharge change in the Loess Plateau, China. Water Resour. Res. 2019, 55, 9604–9622. [Google Scholar] [CrossRef]
- Ma, R.X.; Cui, X.M.; Wang, D.C.; Wang, S.D.; Wang, H.S.; Yao, X.J.; Li, S.S. Spatial and temporal characteristics of water use efficiency in typical ecosystems on the Loess Plateau in the last 20 years, with drivers and implications for ecological restoration. Remote Sens. 2022, 14, 5632. [Google Scholar] [CrossRef]
- Wang, K.B.; Deng, L.; Shangguan, Z.P.; Chen, Y.P.; Lin, X. Sustainability of eco-environment in semi-arid regions: Lessons from the Chinese Loess Plateau. Environ. Sci. Policy 2021, 125, 126–134. [Google Scholar] [CrossRef]
- Martín-Ortega, P.; García-Montero, L.G.; Sibelet, N. Temporal Patterns in Illumination Conditions and Its Effect on Vegetation Indices Using Landsat on Google Earth Engine. Remote Sens. 2020, 12, 211. [Google Scholar] [CrossRef]


| Product | Variable | Spatial Resolution | Time Resolution | Data Sources |
|---|---|---|---|---|
| Ecological zoning of the Loess Plateau | http://www.geodata.cn/ accessed on 15 May 2022 | |||
| MOD13A1/Q1 | NDVI | 500/250 m | 16 days | https://modis.gsfc.nasa.gov/ accessed on 10 November 2021 |
| MOD09A1 | reflectivity | 500 m | 8 days | https://modis.gsfc.nasa.gov/ accessed on 10 November 2021 |
| MOD11A2 | surface temperature | 1 km | 8 days | https://modis.gsfc.nasa.gov/ accessed on 10 November 2021 |
| MOD15A3H | effective radiation absorption ratio | 500 m | 8 days | https://modis.gsfc.nasa.gov/ accessed on 10 November 2021 |
| NOAA/CDR/AVHRR/NDVI/V5 | NDVI | 0.05° | 1 day | https://www.ncei.noaa.gov/ accessed on 10 November 2021 |
| MCD12Q1 | land-cover type | 500 m | 96 days | https://modis.gsfc.nasa.gov/ accessed on 10 November 2021 |
| Terraclimate | total solar radiation | 4 km | moon | https://www.ecmwf.int accessed on 10 November 2021 |
| Terraclimate | precipitation | 4 km | moon | https://www.ecmwf.int accessed on 10 November 2021 |
| T3H(GLDAS) | air temperature | 0.25° | 3 h | http:/ldas.gsfc.nasa.gov/ accessed on 10 November 2021 |
| GRACE–CSR | GRACE | 0.25° | moon | http://www2.csr.utexas.edu/grace/RL06_mascons.html/ accessed on 10 November 2021 |
| Meteorological station | temperature/precipitation | year | http://cdc.cma.gov.cn/ accessed on 10 November 2021 | |
| LUCC Data | 300 m | year | https://www.esa.int/ accessed on 15 May 2022 |
| Basin | Variables | High FVC | Medium-High FVC | Medium FVC | Medium-Low FVC | Low FVC |
|---|---|---|---|---|---|---|
| LP | Average (%) | 85.50 | 70.13 | 50.40 | 31.79 | 17.55 |
| Slope | 0.077 | 0.038 | 0.051 | 0.107 | 0.02 | |
| Z-value | 4.86 (**) | 3.35 (**) | 2.87 (**) | 3.17 (**) | 0.63 | |
| Change (%) | 1.43 | 1.20 | 0.94 | 2.53 | 1.14 | |
| A | Average (%) | 85.98 | 69.87 | 50.30 | 32.34 | 16.69 |
| Slope | 0.04 | 0.01 | 0.078 | 0.102 | −0.078 | |
| Z-value | 2.39 (*) | 0 | 2.99 (**) | 1.66 | −1.78 | |
| Change (%) | 0.26 | 0.87 | 1.72 | 3.02 | −2.01 | |
| B | Average (%) | 86.02 | 68.56 | 51.32 | 33.58 | 16.12 |
| Slope | 0.046 | 0.056 | 0.236 | 0.142 | −0.233 | |
| Z-value | 0.82 | 1.24 | 4.86 (**) | 3.17 (**) | −3.17 (**) | |
| Change (%) | 2.21 | −0.32 | 4.82 | 2.35 | −2.21 | |
| C | Average (%) | 85.21 | 69.82 | 48.05 | 30.62 | 17.02 |
| Slope | −0.016 | 0.05 | 0.013 | 0.127 | 0.057 | |
| Z-value | 0.75 | 2.20 (*) | 0.88 | 3.77 (**) | 2.14 (*) | |
| Change (%) | −1.13 | 1.82 | −0.79 | 3.36 | 1.36 | |
| D | Average (%) | 85.60 | 71.11 | 51.78 | 34.30 | 13.55 |
| Slope | 0.06 | 0.085 | 0.057 | 0.085 | 0.008 | |
| Z-value | 3.47 (**) | 2.99 (**) | 2.02 (*) | 1.84 | 0.33 | |
| Change (%) | 0.36 | 2.24 | 0.76 | 1.53 | −1.83 |
| Variable | LP | A | B | C | D |
|---|---|---|---|---|---|
| NDVI | −0.806 ** | −0.258 | −0.803 ** | −0.718 ** | −0.673 ** |
| FVC | −0.784 ** | −0.285 | −0.797 ** | −0.743 ** | −0.644 ** |
| NPP | −0.791 ** | −0.387 | −0.778 ** | −0.631 ** | −0.679 ** |
| Regional | Area Change | Farmland | Forest | Grassland | Built-Up Areas | Water Bodies | Unused Land |
|---|---|---|---|---|---|---|---|
| LP | km2 | −14693 | 1584.65 | 6059.2 | 11,140.51 | 193.05 | −4284.49 |
| % | −5.10% | 2.04% | 2.20% | 488.95% | 11.32% | −25.97% | |
| A | km2 | −5298.76 | 382.56 | 3288.89 | 1608.72 | 18.21 | 0.39 |
| % | −5.65% | 1.40% | 3.432% | 479.73% | 5.90% | 0.06% | |
| B | km2 | −3066.74 | 530.25 | 1317.67 | 1238.04 | 14.2 | −33.41 |
| % | −4.52% | 5.10% | 2.63% | 688.91% | 6.75% | −8.73% | |
| C | km2 | −372.37 | −1020.38 | 2976.93 | 2277.08 | 73.54 | −3934.8 |
| % | −1.30% | −27.78% | 3.425% | 702.80% | 10.20% | −26.81% | |
| D | km2 | −5955.09 | 1692.21 | −1524.23 | 6016.67 | 87.12 | −316.67 |
| % | −6.10% | 4.67% | −3.59% | 417.99% | 18.70% | −39.01% |
| Variable | LP | A | B | C | D |
|---|---|---|---|---|---|
| NDVI | 0.941 * | 0.704 | 0.988 ** | 0.907 * | 0.939 * |
| FVC | 0.900 * | 0.67 | 0.971 ** | 0.889 * | 0.879 * |
| NPP | 0.868 | 0.565 | 0.938 * | 0.813 | 0.856 |
Disclaimer/Publisher’s Note: The statements, opinions and data contained in all publications are solely those of the individual author(s) and contributor(s) and not of MDPI and/or the editor(s). MDPI and/or the editor(s) disclaim responsibility for any injury to people or property resulting from any ideas, methods, instructions or products referred to in the content. |
© 2023 by the authors. Licensee MDPI, Basel, Switzerland. This article is an open access article distributed under the terms and conditions of the Creative Commons Attribution (CC BY) license (https://creativecommons.org/licenses/by/4.0/).
Share and Cite
Chen, S.; Zhang, Q.; Chen, Y.; Zhou, H.; Xiang, Y.; Liu, Z.; Hou, Y. Vegetation Change and Eco-Environmental Quality Evaluation in the Loess Plateau of China from 2000 to 2020. Remote Sens. 2023, 15, 424. https://doi.org/10.3390/rs15020424
Chen S, Zhang Q, Chen Y, Zhou H, Xiang Y, Liu Z, Hou Y. Vegetation Change and Eco-Environmental Quality Evaluation in the Loess Plateau of China from 2000 to 2020. Remote Sensing. 2023; 15(2):424. https://doi.org/10.3390/rs15020424
Chicago/Turabian StyleChen, Shifeng, Qifei Zhang, Yaning Chen, Honghua Zhou, Yanyun Xiang, Zhihui Liu, and Yifeng Hou. 2023. "Vegetation Change and Eco-Environmental Quality Evaluation in the Loess Plateau of China from 2000 to 2020" Remote Sensing 15, no. 2: 424. https://doi.org/10.3390/rs15020424