Article

The Spatiotemporal Characteristics and Driving Factors of Dust Emissions in East Asia (2000–2021)

1
School of Remote Sensing and Geomatics Engineering, Nanjing University of Information Science and Technology, Nanjing 210044, China
2
School of Geographical Sciences, Nanjing University of Information Science and Technology, Nanjing 210044, China
*
Author to whom correspondence should be addressed.
Remote Sens. 2023, 15(2), 410; https://doi.org/10.3390/rs15020410
Submission received: 27 September 2022 / Revised: 4 January 2023 / Accepted: 6 January 2023 / Published: 9 January 2023

Abstract

:
The climate effect and environmental pollution caused by dust discharged into the atmosphere have attracted much attention. However, the driving factors of dust emissions have not been studied thoroughly. Here, spatiotemporal variations in dust emissions and the relationship between dust emissions and large-scale atmospheric circulation in East Asia from 2000 to 2021 were investigated using Modern-Era Retrospective Analysis for Research and Applications version 2, Cloud-Aerosol Lidar Pathfinder Satellite Observations, ERA5 reanalysis data, and climate indices. Results showed that the Taklimakan Desert in the Tarim Basin, the Gurbantonggut Desert in the Junggar Basin, the Turpan Basin, and the Gobi Desert in western Inner Mongolia and southern Mongolia are the main sources of dust emissions in East Asia. The period of strong dust emissions is from March to May, and emissions to the atmosphere were mainly distributed at 0–4 km in the troposphere. In the eastern and southwestern Tarim Basin, northern Junggar Basin, and parts of the Gobi Desert in southern Mongolia, dust emissions have significantly increased over the past 22 years, whereas in the southwestern Tibetan Plateau, southwestern Inner Mongolia, and a small part of the northern Mongolian Gobi Desert there was a significant decreasing trend. The winter North Atlantic Oscillation (NAO) and Arctic Oscillation (AO) were significantly negatively correlated with East Asian dust emissions the following spring. The various phases of the AO/NAO coupling have clear different effects on East Asian dust emissions in the spring. When the AO/NAO coupling was negative (positive), the East Asian trough and Siberian High were strengthened (weakened), the frequency of cold air activity increased (weakened), 800 hPa wind speed strengthened (weakened), and East Asian emissions increased (decreased). In AO−/NAO+ years, the Asian polar vortex was stronger to the south and the East Asian trough was stronger to the west. The Lake Baikal trough was in the deepening phase, which caused more polar cold air to move into East Asia, aggravating the intensity of dust activity. In the AO+/NAO− years, the Siberian High and East Asian trough weakened, which was unfavorable to the southward movement of cold air from Siberia. Therefore, the frequency of windy weather in East Asia decreased, partly weakening dust emissions. However, a positive geopotential anomaly in northeast China and a negative geopotential anomaly in South Asia triggered an anomalous enhancement in easterly wind in the tropospheric area over northwest China. Strengthening of the Balkhash trough provides favorable conditions for gale weather in northwest China. The frequency of gale weather increased, and dust emissions were enhanced in northwest China.

Graphical Abstract

1. Introduction

In recent years, with the changing global climate and deteriorating ecological environment, dust emissions have attracted increasing attention [1,2]. Dust particles emitted into the atmosphere can directly affect the planetary albedo of the Earth–atmosphere system by absorbing and scattering solar and long-wave radiation. Additionally, it can indirectly affect the Earth–atmosphere system’s radiation balance by changing the microphysical properties of clouds [3,4,5]. It also has a significant semi-direct effect that changes the relative humidity and stability of the atmosphere by absorbing solar radiation and creating local heating, which subsequently affects cloud lifetimes and the liquid water content of clouds [6]. Furthermore, there is long-distance transport of dust particles carrying nutrients such as iron, phosphorus, and nitrogen to other areas and the sea, largely regulating land and ocean biogeochemical processes [7].
The Gobi Desert (GD) in East Asia is a large source of global dust, accounting for 70% of the total annual dust emissions in Asia [8]. Variations in large-scale atmospheric circulation affect the frequency and severity of dust events in East Asia [9,10]. These variations also affect the southern and northern hemisphere annular modes [11,12], cyclone frequency [13], and East Asian monsoon intensity [14,15]. Changes in large-scale atmospheric circulation create favorable circumstances for the formation of weather systems that directly affect dust activity and can also regulate the transport volume and direction of dust in the air [16,17,18]. Consequently, it is crucial to investigate the physical mechanisms of sand activity in East Asia, particularly its relationship with large-scale circulation systems and long-term changes in dust activity.
The Arctic Oscillation (AO) is the dominant mode of winter circulation in the northern hemisphere and is intimately related to East Asian dust activity [12]. Many studies have extensively investigated this. For example, Mao et al. [19] found that the AO can control the intensity and frequency of cold air in northern East Asia. Negative (positive) AO causes cold air over Mongolia to strengthen (weaken), which in turn leads to an increase (decrease) in dust activity frequency in East Asia. Gao et al. [20] found that during negative (positive) AO, the northerly wind from Siberia was very strong (weak) and could (could not) cross the barrier in the northern Tarim Basin (TB), and the wind speed in the basin rapidly increased (decreased), thereby increasing (weakening) dust emissions in the basin. Liu et al. [21] discovered that a negative AO decreases East Asia’s surface temperature in spring, leading to an increase in snow albedo and cloud albedo feedback (which regulates regional atmospheric circulation), thus strengthening the dust cycle. Mao et al. [22] investigated the effect of the AO on dust events in East Asia through ground-based observations and model simulations, demonstrating that variations in geopotential height and the northward shift of the westerly jet in the middle troposphere were the primary causes of the AO–dust relationship. Gong et al. [23] investigated the relationships between the AO and sandstorms, as well as the vortex growth rate in northern China, and considered that the AO can regulate weather disturbance and sandstorm activity by affecting atmospheric instability.
In addition to the AO, variations in planetary-scale indices, such as the North Atlantic Oscillation (NAO), Antarctic Oscillation (AAO), and El Niño-Southern Oscillation (ENSO), highly influence dust activity in East Asia. For example, Zhao et al. [24] discovered a significant positive relationship between the winter NAO and the frequency of sandstorms in the TB in the following spring and identified two possible physical mechanisms for this. One is related to spring circulation anomalies in the troposphere, modulated by the winter NAO that provides the stimulus for dust storm outbreaks. The other is related to changes in local pressure gradients and near-surface wind speeds that correspond to spring circulation anomalies. Fan and Wang [25] investigated the relationship between the AAO and the frequency of dusty weather in northern China and identified two possible mechanisms for coupling frequency: one possible mechanism is connected to a pattern of meridional teleconnection, while the other is connected to a pattern of regional circulation over the Pacific Ocean. Gong et al. [26] found an interannual correlation coefficient of 0.6 between the Pacific/North American (PNA) pattern and the number of sandstorm days in northern China. The main factor leading to the occurrence of sandstorms is the change in atmospheric circulation caused by the PNA pattern, particularly the change in the East Asian jet. Liu et al. [27] observed enhanced Arctic amplification and a stronger northern hemisphere annular mode, resulting in a weakening of cold air activity and a reduction in midlatitude westerly winds in East Asia. Furthermore, this was the primary cause of the declining frequency of spring dust activity in northern China that has been occurring since the 1980s. Fan et al. [28] investigated the impact of winter sea ice cover in the Barents Sea on dust activity in North China in spring. Lower ice cover in winter was more likely to result in atmospheric circulation anomalies linked to dust activities, such as an enhanced East Asian jet stream, intensified atmospheric thermal instability, and increased cyclone frequency. Furthermore, the ENSO has a large impact on alterations to dust transport paths in Asia in the spring and a lower impact on the frequency and intensity of regional dust activity [29,30].
These findings provide a foundation for understanding the connection between the frequency of dust events and large-scale circulation in East Asia. Numerous atmospheric causes of dust activity have been investigated. However, climate teleconnections have been used independently to investigate the connection with long-term variations in dust activity. More studies have focused on the effects of large-scale circulation changes on dust frequency and transport than on the underlying physical mechanisms. Large-scale climate teleconnections are an important driving force of spring dust activity in East Asia, as they affect regional weather and climate. However, some large-scale circulation patterns do not exist independently, and most play an integral role in the variability of regional weather systems. In addition, there are limited studies on the role of different types of large-scale climate variability and their coupling effects in the generation of dust events. In particular, it is unclear how these climatic factors interact dynamically to cause dust events in East Asia.
Consequently, this study aimed to explore the connection between various types of climate variability and dust emissions in East Asia and investigate potential mechanisms of climate variability coupling, which drive dust emissions in East Asia. Our study not only has important scientific significance in terms of revealing the relationship between different climate variability couplings and dust emissions, but also contributes to a more detailed understanding of the underlying physical processes and the response of East Asian dust activities to global or regional climate change.
This paper is organized as follows. The study area, research data, and methods are introduced in Section 2. The spatiotemporal characteristics and driving factors of dust emissions in East Asia from 2000 to 2021 are then presented in Section 3. Finally, the conclusions of the study are presented in Section 4.

2. Materials and Methods

2.1. Study Area

East Asia (4°N–53°N, 73°E–150°E) borders the west coast of the Pacific Ocean and includes China, Japan, South Korea, North Korea, and Mongolia (Figure 1). Most inland areas in the west are plateaus and mountains, whereas the eastern coast generally comprises plains and hills. It is one of the regions with the most typical monsoon climate globally. The eastern region has a temperate and subtropical monsoon climate with wet and warm summers and cold and dry winters. However, the western region is located in the interior of the Eurasian continent and belongs to the semi-arid and arid climate zone. Owing to the distance from the ocean, ocean water vapor is limited, precipitation is low, and the annual range is large. Figure 1 shows the types of land cover in East Asia, which were extracted from China’s environmental disaster monitoring and forecasting small satellite (HJ-1A/B), China’s high-resolution earth observation system satellite 1 (GF-1), and Landsat satellite images [31]. The main land cover in northwest China and southern Mongolia is barren land, i.e., land with low vegetation cover, including desert, sand, gravel, bare rock, and saline and alkaline land.

2.2. Datasets

2.2.1. MERRA-2

Modern-Era Retrospective Analysis for Research and Applications version 2 (MERRA-2) is a satellite-era global atmospheric reanalysis product provided by the National Aeronautics and Space Administration (NASA) Global Modeling and Assimilation Office. The MERRA-2 datasets were produced by the Goddard Earth Observing System (GEOS) data assimilation system, which is based on the GEOS-5 climate model and the Gridpoint Statistical Interpolation analysis scheme [32,33]. The monthly dust emission data used in this study were from the “tavgM_2d_adg_Nx” dataset, with a spatial resolution of 0.625° × 0.5° (https://disc.gsfc.nasa.gov/) (accessed on 20 June 2022). Dust emissions are wind-driven for five size bins, namely bin001, bin002, bin003, bin004, and bin005, with particle radii of 0.1–1, 1–1.8, 1.8–3, 3–6, and 6–10 μm, respectively [34,35]. Dust emission simulations relied on a map of potential dust source locations based on the observed correlation of dust emitting regions with large-scale topographic depressions [36]. Dust emissions near dust-affected areas correlated best with observations [35]. The following formula was used to calculate dust emissions:
Dust Emissions (DUEM) = Dust Emission Bin001+ Dust Emission Bin002 + Dust Emission Bin003 + Dust Emission Bin004 + Dust Emission Bin005
Many optimization improvements in aerosol modeling algorithms have recently emerged. However, owing to insufficient constraints on emissions and physical process parameterizations, the estimation of dust emissions by the MERRA-2 aerosol model involves some uncertainty [34]. Similarly, aerosol observations from terrestrial and satellite remote sensing are subject to uncertainty owing to limited data, contextual biases, and the limitations of retrieval algorithms [37]. These errors and uncertainties influence the results of studies using these data. However, many studies have demonstrated the dependability of MERRA-2 dust emission data in various ways. For example, Jing et al. [38] demonstrated that the MERRA-2 dust emission dataset is credible by comparing MERRA-2 global annual average dust emissions and dust emissions from the multi-model AeroCom platform. Yao et al. [39] compared MERRA-2 dust emissions with ground-based and satellite observations and found that MERRA-2 data have numerous advantages when estimating dust emission and settlement and are effective for quantitative estimation of a dust balance. To further evaluate the precision of long-term trends in global dust emissions obtained from MERRA-2, Shi et al. [40] compared the long-term changes in dust emissions from 16 major global dust sources to previous studies and found that the interannual changes and extreme value intervals were consistent with previous research results. These findings suggest that dust emission data from MEERA-2 are credible for studying regional or global long-term trends and changes in dust emissions.

2.2.2. CALIPSO Data

In April 2006, the world’s first applied Cloud-Aerosol Lidar and Infrared Pathfinder Satellite Observations (CALIPSO) satellite, co-developed by the NASA Langley Research Center (LARC) and the Center National d’Etudes Spatiales, was successfully launched. To date, the Cloud-Aerosol Lidar with Orthogonal Polarization (CALIOP) instrument onboard the CALIPSO satellite is the most stable, longest-running, most established, and most widely used satellite-based lidar in orbit. It can emit 532 nm and 1064 nm lasers to the ground simultaneously, and the 532 nm channel has an orthogonal polarization ability [41]. Owing to the advantages of CALIOP active remote sensing and depolarization monitoring technology, the vertical distribution information of atmospheric particles at a global or regional scale can be obtained in all weather conditions. The CALIPSO datasets are widely used to study aerosol–cloud interactions, climate effects, and optical properties, among other topics [42]. The greatest advantage of CALIPSO detection is that it can obtain vertical distribution information related to aerosols. Additionally, its active detection and depolarization technology can recognize small-diameter particles (such as aerosols, atmospheric molecules, and even irregular-shaped dust particles) due to its more accurate high-resolution identification capabilities [43].
The CALIPSO Level 3 (L3) dataset is a monthly global product that has a horizontal resolution of 5° × 2° and a vertical resolution of 60 m from a ground level of −0.5 km to an altitude of 12 km. All L3 parameters were based on CALIPSO Level 2 (L2) 5 km aerosol profile products. The L3 data provide variables from L2 data as monthly averages. Prior to generating L3 statistics, all L2 data must be quality screened to exclude samples with low confidence [44]. The CALIPSO data are available from June 2006 to the present and can be downloaded from https://asdc.larc.nasa.gov/ (accessed on 20 June 2022).
The lidar signals are highly susceptible to solar background signals during the daytime, which makes daytime signal-to-noise ratio reduction and accurate layer detection more difficult [45]. Therefore, the reliability of data retrieved at nighttime is considered higher than the reliability of data retrieved during the daytime. To reduce the influence of solar background signals on data quality, this study only used CALIPSO nighttime observation data. A total of 184 L3 sample data points were observed by CALIPSO from June 2006 to December 2021. These samples are classified into monthly (January to December) and quarterly (spring, summer, autumn, and winter) samples according to the time of observation. Among them, there are 15 samples each for January, March, May, and December; 14 samples each for February and April; and 16 samples each for June to November (February 2016, April 2021, and 2021 data for December are missing). Therefore, there are 44 available data points for spring (March, April, and May) and winter (December, January, and February), and 48 available data points for summer (June, July, and August) and autumn (September, October, and November). In the study, only quality-screened and classified dust aerosol-type data, including data on dust aerosols and polluted dust aerosols, were used. Owing to some uncertainty regarding the retrieval of optical attributes by the CALIPSO satellite, only extinction data obtained above a height of 180 m were retained to exclude biases due to the physical interpretation of near-surface aerosols [46]. Additionally, according to the findings of Winker et al. [41], only data with an extinction coefficient greater than 0.001 km−1 were retained to guarantee the reliability of results.

2.2.3. ERA5/Land

The latest atmospheric reanalysis product from the European Center for Medium-Range Weather Forecasting (ECMWF), ERA5, is the follow-up to ERA-Interim [47]. The significant advantages of the updated ERA5 are as follows: (i) its higher spatiotemporal resolution; (ii) measured data are used to explain the discrepancy between the forecast model data and observed data; (iii) ERA5 employs more satellite data in sophisticated data assimilation models and systems to produce a more accurate estimation of atmospheric conditions; and (iv) the number of variables offered by ERA5 increased from 100 to 240 [48]. This study used ERA5 monthly averaged data on pressure levels with a spatial resolution of 0.25° × 0.25° that included 500 hPa geopotential, mean sea level pressure, and eastward and northward components of wind at 800 hPa.
The ECMWF also provides a downscaled land product, ERA5-Land. The biggest advantage of ERA5-Land over ERA5 is the horizontal resolution, which has improved to 9 km globally [49]. This study used ERA5-Land monthly mean data that includes surface temperature and total precipitation.
These data are available at https://www.ecmwf.int/en/forecasts/datasets (accessed on 1 July 2022).

2.2.4. Climate Indices

(1) AO index. The monthly AO index is constructed by projecting the monthly mean 1000 hPa height anomalies poleward of 20°N–90°N onto the AO loading pattern [50]. The AO loading pattern was chosen as the first mode for empirical orthogonal function (EOF) analysis using monthly mean 1000 hPa height anomaly data from 1979 to 2000 over a latitude range of 20°N–90°N. Each monthly value has been standardized by the standard deviation of the monthly AO index from 1979 to 2000.
(2) NAO index. The NAO index was calculated by projecting the monthly anomaly 500 hPa height field over 0°–90°N onto the NAO loading pattern [51]. The NAO loading pattern was chosen as the first mode of a rotated EOF analysis using monthly mean 500 hPa height anomaly data from 1950 to 2000 over the latitude of 0°–90°N. Each monthly value has been standardized by the standard deviation of the monthly NAO index from 1950 to 2000 interpolated to the day in question.
The data source is from https://origin.cpc.ncep.noaa.gov (accessed on 1 June 2022).

2.2.5. Other Datasets

The monthly soil moisture and evaporation flux data are sourced from version 2 of the NASA Global Land Data Assimilation System, with a spatial resolution of 0.25° × 0.25°. Data are available at https://disc.gsfc.nasa.gov/datasets/GLDAS_NOAH025_M_2.1/ (accessed on 1 October 2022).
Monthly mean MODIS normalized difference vegetation index (NDVI) composite grid data (MOD13C2) were provided by NASA, with a resolution of 0.05° × 0.05°. The data can be downloaded from https://modis.gsfc.nasa.gov/ (accessed on 3 October 2022).

2.3. Methods

2.3.1. Theil–Sen Median Trend Analysis and the Mann–Kendall Test

The Theil–Sen median trend analysis method is also described as Sen slope estimation. It is more robust than linear regression analysis and is a reliable nonparametric statistical trend calculation method [52]. It is computationally efficient and desensitized to measurement errors and discrete data, making it suitable for trend analysis of long time-series data. It is calculated using Equation (1):
β = M e d i a n x j x i j i , j > i
where β refers to the Theil–Sen median and xi and xj represent the data values of years i and j, respectively. A positive β value shows an increasing trend, whereas a negative value shows a decreasing trend.
Theil–Sen slope estimation can effectively reduce the interference of noise by calculating the median of the sequence; however, it cannot judge the significance of the sequence’s change trend. Meanwhile, the Mann–Kendall test is a nonparametric method for testing the trend in a time series. It does not require positively distributed measured values, is unaffected by missing values and discrete data, and is suitable for trend significance testing of long time-series data [53]. The process is as follows. For the sequence xt = x1, x2, x3, …, xn, the relationship between the magnitudes of xi and xj for all pairs of values (xi, xj, j > i) is set to S, assuming the following: H0: the data in the sequence are arranged randomly (there is no significant trend), and H1: there is a monotonous trend in the data. The formula for calculating the test statistic S is as follows:
S = i = 1 n j = i + 1 n s g n x j x i
where sgn is a sign function calculated by the following:
s g n x j x i = 1 ,   x j x i > 0 0 ,   x j x i = 0 1 ,   x j x i < 0
The trend test was performed using the test statistic Z. The value of the standardized test statistic, Z, was calculated using Equation (4):
Z = S 1 V a r S ,   ( S > 0 ) 0 ,           S = 0 S + 1 V a r S , ( S < 0 )
where Var is the variance of the S statistic, which was calculated using Equation (5):
V a r S = n n 1 2 n + 5 i = 1 m t i t i 1 2 t i + 5 18
where n is the amount of data in the sequence, m is the number of knots in the sequence, and ti is the width of the knot.
The bilateral trend test was used to determine the critical value Z1−α/2 in the normal distribution table at a specific significance level, α. If |Z| ≤ Z1−α/2 accepts the original assumption of H0, then the changing trend is not significant. If |Z| > Z1−α/2 rejects the original hypothesis H1, then the changing trend is regarded as significant. In this study, α = 0.1, 0.05, and 0.01 were chosen to test the significance of changes in dust emission trends in East Asia from 2000 to 2021 at a pixel scale. When the absolute value of Z is greater than 1.645, 1.96, and 2.576, it means that the trend passes the significance test with a confidence level of 90%, 95%, and 99%, respectively.

2.3.2. Correlation Analysis

The Pearson correlation coefficient (PCC) is the most widely adopted correlation statistic and is used to measure the linear correlation between two groups of continuous variables, with a value between −1 and 1. The correlation coefficient was considered statistically significant because the zero hypotheses exceeded the probability level of 0.1. PCC can be calculated using Equation (6):
r x y = n x i y i x i y i n x i 2 ( x i ) 2 n y i 2 ( y i ) 2
where rxy is the PCC of variables x and y, n is the number of objects observed, xi and yi are the i-th values of x and y, respectively, and i = 1, 2, 3, ….

3. Results and Discussion

3.1. Spatiotemporal Distribution of Dust Emissions

Figure 2 shows the annual variation in dust emissions in East Asia. Based on the long-term average of dust emissions in Figure 2, significant sources of dust emissions in East Asia include the Taklimakan Desert (TKD) in the TB, the Turpan Basin, the Gurbantunggut Desert in the Junggar Basin (JB), the GD region in western Inner Mongolia (IM), and the eastern, central, and southern Gobi provinces of Mongolia. These dust sources were also reported by Shi et al. [40] and Song et al. [54]. There are a few dust emission areas in the Tibetan Plateau, the North China Plain, western Mongolia, and the northeastern Korean Peninsula.
From Figure 2, it can be seen that the dust emissions have clear annual variation characteristics. Dust emissions in East Asia increased significantly from March to May and gradually decreased from June onwards. The lowest amount of dust emission was observed in January and December, whereas the highest amount of dust emission was recorded in April and May. Relatively high emissions were detected in March, April, and May; lower emissions occurred mainly in December, January, and February. This annual variation in emissions in East Asia is consistent with the findings of Song et al. [54], who reported the highest and lowest dust emissions in East Asia in spring (March, April, and May) and winter (December, January, and February), respectively. Annual variations in dust emissions in the GD in western IM, the TKD in the TB, and the Gurbantunggut Desert in the JB were most significant and showed a consistent annual variation trend. The area with the highest dust emissions in the TB is located at the eastern outlet of the basin. The areas with the highest emissions from the GD in western IM are the Badain Jaran Desert, Ulan Buh Desert, and Kubuqi Desert. Emissions from the Turpan Basin were high from February to November and decreased in January and December. However, in the GD of southern Mongolia, there was no significant annual variation, as the area consistently displayed high dust emissions. Additionally, dust emissions in the TB and western IM desert areas from November to February were lower than those in the other months. Emission intensity in January, February, November, and December in the western desert region of IM was significantly higher than that in the TB.
Dust, which is emitted into the atmosphere, is a very common type of atmospheric aerosol in the troposphere, and its vertical movement plays a unique role in global climate change [1,4]. Therefore, it is imperative to study the vertical distribution of airborne dust particles. The CALIPSO satellite is the most efficient tool for studying the vertical distribution properties of airborne dust particles. The distribution of the average extinction coefficient of dust aerosols in different seasons and at different heights in East Asia from 2006 to 2021 is shown in Figure 3.
From Figure 3, the extinction coefficient of dust at an altitude of 0–2 km in spring in northwest China was higher than in the other seasons. The maximum value exceeds 0.4 km−1, indicating that spring has higher atmospheric dust concentrations within 0–2 km than other seasons. The extinction coefficient of the TB and its surrounding areas was higher than that of the other areas. The high value of the extinction coefficient in the TB was closely related to the springtime intensity of dust activity in East Asia. Except for southern Mongolia and northwest China, the extinction coefficient of dust in the lower atmosphere in East Asia in spring was also significantly higher than in the other seasons. The air quality problem in the lower reaches of the East Asian GD in spring is affected by not only human activities, but also the emission and spread of dust in desert areas [46]. In summer, specifically in the eastern coastal region, the extinction coefficient of dust in the air at an altitude of 0 to 2 km was significantly lower than in autumn and winter. This difference is closely associated with seasonal climate change in East Asia. Simultaneous summer rains and heat decrease the intensity of dust weather in East Asia. However, the highest extinction coefficients for dust aerosols at 0–2 km in autumn and winter were concentrated in northern China.
At an altitude of 2–4 km in the atmosphere, dust concentrations remained higher in spring than in the other seasons. At 2–4 km, the dust concentration in summer was higher than in autumn and winter. The upward transport of dust during autumn and winter was not high. The extinction coefficient of dust decreased at a faster rate with increasing height, and at an altitude of 4–6 km, the dust concentration was lower than in spring and summer. The maximum height of dust uplift in summer was similar to that in spring, and the extinction coefficient decreased slowly with increasing height. A large amount of dust in the lower atmosphere may be transported to the upper troposphere due to strong radiative heating surface convection in summer. However, at 6–8 km, regardless of season, no information on dust can be observed.
From Figure 3, dust content above 0–4 km for the main dust sources in East Asia, as captured by CALIPSO, was significantly higher than that of the other places, which is in good agreement with the high-value area of MERRA-2 dust emissions. The reliability of MERRA-2 dust emission data was further demonstrated by comparing the variations and spatial relationships obtained from the MERRA-2 dust emissions and the dust extinction coefficient of CALIPSO. From Figure 4a, it can be seen that the dust emissions from East Asia from 2006 to 2021 had roughly the same variation characteristics as the CALIPSO dust extinction coefficient. The correlation coefficient was 0.5 and passed the significance test of 0.01. In particular, the peak and trough periods of dust emissions are basically the same as the peak and trough periods of the average extinction coefficient of dust at an altitude of 0–4 km. From the spatial distribution map of their correlation, the MERRA-2 dust emissions and the CALIPSO observation dust aerosol extinction coefficient showed a good correlation in the East Asian dust source area, and the overall positive correlation was significantly significant (Figure 4b). Most regions passed the significance test at the 0.1 confidence level. The correlation coefficient between dust emissions and extinction coefficient in the TKD, Qaidam Desert, and Turpan Basin was at least approximately 0.5. The correlation coefficient between dust emissions and extinction coefficient in the GD in western IM and southern Mongolia was approximately 0.4, reaching 0.5 in some areas.
The biggest advantages of CALIPSO are as follows: it can obtain information on the vertical distribution of aerosols in the atmosphere and it is an effective tool when studying the distribution and transport of atmospheric aerosols. However, it has some limitations. First, CALIPSO can only provide a limited number of observations, and missing data reduce the reliability of the comparison results to a certain extent. Second, CALIPSO is limited by its spatial and temporal resolution, long observation period (16 days), and narrow coverage, which thus prevents the observation of some dust events [46]. Nevertheless, through the comparison of limited CALIPSO observation samples and MERRA-2 dust emissions, we found that MERRA-2 dust emissions and CALIPSO dust extinction coefficients showed a consistent variation trend and that there was a significant positive correlation between them, especially in the main dust source areas in East Asia. Therefore, MERRA-2 dust emissions data can be considered reliable. They can present the characteristics of long-term spatial distribution and variation trends related to East Asian dust emissions.

3.2. Interannual Variation and Trends in Dust Emissions

Figure 5a shows the interannual variation in monthly dust emissions in East Asia. As analyzed previously, dust emissions were significantly higher from March to June compared to other months and were particularly high from April to May, with a progressively declining trend following this period. The intensity of dust activities was lowest from December of the previous year to February of the following year. Additionally, 2007 showed a turning point for dust emission changes in April and May (Figure 5b). April was usually the month with the highest dust emissions each year from 2000 to 2006. However, annual dust emissions in May from 2007 to 2021 were generally higher than those in April. Dust emissions in May 2007 were the highest in East Asia since the start of the 21st century, at approximately 56 × 10−11 kg·m−2·s−1.
Theil–Sen median trend analysis and the Mann–Kendall test can effectively characterize the variation trend in each pixel to reflect the spatial distribution characteristics of the variation trend in East Asian dust emissions. First, the values of β (Theil–Sen median) can be divided into three cases, namely β > 0, β < 0, and β = 0, indicating an upward trend, downward trend, and no change, respectively. Second, at significance levels of α = 0.1, 0.05, and 0.01, the significance test results of the Mann–Kendall test are classified as follows: extremely significant variation (2.576 ≤ |Z|), significant variation (1.96 ≤ |Z| < 2.576), slightly significant variation (1.645 ≤ |Z| < 1.96), and no significant variation (|Z| < 1.645). Integrating Theil–Sen media trend analysis and Mann–Kendall significance test results, the interannual variation trends in dust emissions are divided into nine categories. The method for judging the significance of the trend is shown in Table 1.
Figure 6 shows the spatial distribution of the interannual variation trend in East Asian dust emissions from 2000 to 2021. The areas with significant increases in dust emissions were the eastern and southwestern parts of the TB, the northern part of the JB, and the southern part of Mongolia. The areas with extremely significant increases in emissions were the southwestern Taklimakan Desert and the Gurbantonggut Desert. The eastern exit of the TB had a slightly significant increase in dust emissions. Meanwhile, the southwestern Tibetan Plateau, southwestern IM, parts of North China, and parts of the northern GD in Mongolia showed extremely significant decreases in dust emissions. Dust emissions significantly decreased in Mu Us sandy land and the Kubuqi Desert in western IM. Except for the above-mentioned sand–dust source areas, the emission trends in the other areas in East Asia mainly showed no significant increase or decrease.

3.3. Correlation of Interannual Variation in Spring Dust Emissions with Climate Indices

Figure 2 and Figure 3 show that March to May (East Asia spring) had the strongest dust emissions in East Asia for the study period, and Figure 7a shows the spring average from 2000 to 2021. The main sources of spring dust emissions from East Asia were the Gurbantonggut Desert. in the JB, the TKD in the TB, and the GD in southern Mongolia and western IM. Furthermore, based on the interannual variation trend in spring dust emissions in East Asia in Figure 7b, the areas with significantly increasing emission trends were located in the south and southwest of the TB and the northern part of the JB. The areas with significantly decreasing trends were located in the desert areas of western IM. The areas with an extremely significant decreasing trend were mainly located in the south and southwest of the GD in western IM and west of the Qaidam Desert.
Many studies have shown that the ENSO, AAO, PNA, AO, NAO, and Southern Oscillation (SO) have significant effects on climate change in East Asia [25,26,35]. However, they are generally most active during winter in the northern hemisphere. Therefore, we studied the correlation between average dust emissions in East Asia in spring from 2000 to 2021 and these climate indices in winter (Figure 8). The overall correlation coefficients between dust emissions in East Asia in spring and the ENSO, SO, AAO, and PNA pattern indices were 0.1, 0, −0.2, and 0.1, respectively, which failed the significance test (confidence level of 90%). Based on the spatial distribution of correlations (Figure 6), these climate indices were not significantly associated with East Asian dust emissions overall and were only associated at a small regional scale. Therefore, the relationship between these climate indices and dust emissions has not been further investigated in this study.
However, spring dust emissions in East Asia significantly correlated with the AO and NAO (Figure 8e,f), with overall correlation coefficients of approximately −0.5 that therefore passed the significance test (90% confidence level). The PCC between the AO and dust emissions in southwest Mongolia and western IM reached −0.7, and the correlation values were above the minimum 90% confidence level. The PCC between dust emissions and the NAO in the BJD and nearby areas in western IM was more than −0.6, with correlation values surpassing the 90% confidence level demonstrating statistical significance. Additionally, the correlation between the AO, NAO, and East Asian dust emissions during the same period displayed high consistency in spatial distribution. Therefore, it is necessary to study the association of the NAO/AO with spring East Asian dust emissions, particularly the mechanism of NAO/AO coupling driving dust activity.

3.4. Effect of Winter NAO/AO Coupling on Dust Emissions in Spring

AO/NAO was strongest in the northern hemisphere in winter, and its effects persisted in the following spring [35]. Therefore, we analyzed the time delay correlation between the average climate indices during the peak period (from December to February) and the dust emissions in East Asia from March to May, aiming to uncover the driving mechanisms of the effect of large-scale atmospheric circulation on dust emissions. Although the spatial modes and positions of the AO and NAO were very similar, relevant studies clearly showed that the main difference between the AO and NAO is that the NAO has no center of action over the Pacific Ocean, while the AO has a larger center of action in the Arctic than in the Pacific Ocean, thus showing a zonally symmetrical structure [12,55]. Furthermore, the coupling between the AO leading EOF and Eurasian land surface air temperature was stronger than the coupling for NAO [12]. Therefore, the synergistic impact of the AO and NAO on dust emissions is of great concern.
Table 2 summarizes the years when AO−/NAO+, AO−/NAO−, AO+/NAO+, and AO+/NAO− occurred simultaneously in northern winters from 2000 to 2021. The most frequent combination was AO+/NAO+, with 11 occurrences in the 22 years (50%). The second most frequent was AO−/NAO+, with a rate of 27% in 22 years. AO−/NAO− occurred simultaneously in the winters of 2003, 2010, 2011, and 2021, accounting for approximately 18% of total occurrences. Meanwhile, AO+/NAO− only occurred simultaneously in the winter of 2009.
Figure 9 shows the variation characteristics of dust emissions in the spring following the winter AO−/NAO−, AO−/NAO+, AO+/NAO−, and AO+/NAO+ years. In the winter of AO−/NAO− coupled years (Figure 7a), dust emissions increased abnormally in the GD of southern Mongolia and western IM and the central and eastern TB (Figure 9a); however, dust emissions in the southern TB and JB showed an abnormal decrease. In AO−/NAO+ coupled years, the main dust discharge areas in East Asia showed an abnormally increasing trend (Figure 9b). In the winter of the AO+/NAO− year, the dust emissions in southern Mongolia and most parts of western IM showed an abnormal decreasing trend in spring (Figure 9c). However, the TD in southwest IM showed an unusual increase in emissions. Similarly, the dust emissions in the JB and TB showed an abnormal growth trend. When the northern hemisphere’s winter was in an AO+/NAO+ coupling year, dust emissions were abnormally low in the following spring (Figure 9d), opposite to AO−/NAO+ coupling years.

3.4.1. Synoptic System

As shown in Figure 9, East Asian dust emissions showed different characteristics in spring following AO−/NAO−, AO−/NAO+, AO+/NAO−, and AO+/NAO+ years in winter in the northern hemisphere. As the primary mode of winter circulation in the northern hemisphere, AO/NAO can influence dust emissions in East Asia by affecting atmospheric circulation at middle and high latitudes [12,35]. Figure 10 shows the distribution of mean geopotential heights and anomalies at 500 hPa in spring during the different coupling years. As shown in Figure 10a,e, the northern hemisphere polar vortex situation in the winter of AO−/NAO− years had a dipole-type distribution, with the main polar vortex centers located in the Queen Elizabeth Islands (60.85°W–96°W, 74.57°N–83.53°N) of northern North America and the Kara Sea (72.3°E–76.5°E, 63.1°N–70°N) region of northern Asia. The central pressure of the polar vortex in northern Canada was less than 515 dagpm. The height distance level field was dominated by the positive distance level control area, and the intensity of the polar vortex was close to or slightly weaker than the same period within a normal year. The center of the Asian polar vortex was located northeast of Novaya Zemlya (41°E–69°E, 70°N–74°N), and the low pressure at the center of the polar vortex was lower than that at 520 dagpm. The center of the polar vortex was significantly negative, and the polar vortex as a whole was stronger than in the same period of previous years. The height field from Novaya Zemlya to the Urals (67.46°E, 66.1°N) was abnormally high, and the center value of the positive height anomaly was more than 3.2 dagpm. The Ural high pressure ridge was strengthened, and the high pressure was blocked at a higher frequency, which was beneficial to the strengthening of meridional circulation over Eurasia. The low trough on the west side of Lake Baikal (103.41°E–109.57°E, 5.29°N–55.46°N) continued to deepen and develop. The majority of East Asia was extremely exposed to the effects of cold polar air because it was in front of a trough of low pressure and behind a ridge of high pressure. In addition, the East Asian trough (EAT) was deeper and had higher strength. The northerly air behind the trough constantly guided the cold air southward, which also made dust activity more intense in the GD region of southern Mongolia and western IM. As shown in Figure 10b,f, the polar vortices in the northern hemisphere were dipolar in the winter of AO−/NAO+ years and located in northwest Siberia and northern Canada. The Asian polar vortex was located further south than normal, with a central intensity of 518 dagpm. From the distance level field, the Asian polar vortex showed a significant negative distance level, with a central value of less than −3.2 dagpm, indicating that the polar vortex was stronger than the average value for the same period. The EAT located to the west was very intense. There was a significant negative geopotential height anomaly near the Ural Mountains, and this negative anomaly area extended eastward to the Okhuozi Sea (136.7°E–163.5°E, 48.5°N–61.95°N), which was extremely favorable to polar cold air being transported southward from the eastern Ural Mountains along the negative geopotential height anomaly region of Siberia, resulting in gale weather in most parts of East Asia. The Baikal trough was in a deepened phase, which caused more cold air from western and northern Siberia to enter the Mongolian Plateau and later affected northern China. In addition, the deepening development of the westerly trough in the Baikal region triggered the appearance of more cyclones. In East Asia, frequent cold air activities increased the frequency of gales, which was beneficial for dust emissions.
Based on the average geopotential height and anomaly distribution of 500 hPa in the winter of the AO+/ NAO− years (Figure 10c,g), the northern hemisphere polar vortex had a unipolar distribution, with the main body located in the Arctic Circle and a central pressure value less than 515 dagpm. This corresponds to a negative pitch level center in the pitch level field, with a central pole exceeding −3.2 dagpm that indicates a stronger northern hemisphere polar vortex in the seasonal AO+/NAO− years than in the same period of normal years. The European trough located in eastern Europe was significantly stronger and deeper. The area east of Lake Balkhash (73.2°E–79.1°E, 45°N–46.44°N) and Lake Baikal was controlled by the trough area, and the Lake Balkhash trough was significantly deepened. Generally, the cold air on the west road carried by Lake Balkhash is weak and does not reach the intensity of the cold wave. However, it was an important trigger for strong winds in western China, which increased the intensity of dust emissions in northwest China to a certain extent [56]. The negative geopotential height anomaly in Siberia extended from the Ural Mountains to the western region of the Eastern European Plain, which was not conducive to the development of the Ural high-pressure ridge. The position of the EAT was westward and the intensity was low. The circulation in the middle and high latitudes of Asia was flat, which was unfavorable to the southward movement of cold air from Siberia. However, there was a remarkable positive geopotential anomaly over northeast China and a significant negative geopotential anomaly over South Asia. Positive and negative anomalies formed an abnormal convergence in northwest China, resulting in an unusually strong easterly wind in the troposphere over northwest China and higher dust emissions in and around this area. In the winter of AO+/NAO+ years (Figure 10d,h), the northern hemisphere polar vortex had a dipolar distribution. The center of the Canadian polar vortex was west of Greenland, with a central intensity of 515 dagpm, and the polar vortex center extended and split along 90°E and 90°W to the south. The polar vortex in the northern region of western Siberia was west–north, corresponding to the negative anomaly center, and the anomaly value was less than −1.6 dagpm. The polar vortex was the same or slightly stronger than the same period in previous years. The Ural Mountains saw a positive geopotential anomaly that extended eastward to the Sea of Okhotsk in the Russian Far East. This was conducive to the establishment of the blocking high near the Ural Mountain and Okhotsk Sea and a stable downstream situation. Although there were small troughs along the northwest airflow continuously invading the southeast, these did not cause a large area of high-intensity southward cold waves. Additionally, there was a large area of positive geopotential height distance level at mid-latitudes. The longitude of the atmospheric circulation in the middle and high latitudes of Eurasia was greater. The cold air transported to the south turns eastward at a latitude of approximately 45°N, and the influence range of cold air is limited. The EAT was eastward and weaker than usual, which was not beneficial to the southward movement of cold polar air. Consequently, East Asia experienced significantly less wind and lower levels of dust emissions.
Dusty weather usually occurs in the spring in East Asia, mainly due to cold air moving from north to south [10,13,15]. Therefore, strong winds are the primary trigger for dust emissions. In spring, there is frequent activity from low vortices and troughs in the middle and high latitudes of the northern hemisphere, and East Asia is highly susceptible to cold air from high latitudes. Along with the southward movement of the cold air, windy weather can release dust particles from the surface. Figure 11 shows 800 hPa height level mean wind field distribution and anomalies in the spring of the AO/NAO phase coupling years. Dust emissions in the TKD region were not statistically correlated with AO/NAO, and the wind in this area was largely affected by the topography of the TB [36]. Therefore, wind field analysis was excluded in the TKD region.
Figure 11a,e show a significant positive anomaly in 800 hPa mean wind speed between western IM and southern Mongolia in the spring of AO−/NAO− years. The wind speed in the GD of southwest Mongolia and western IM was approximately 0.6 m/s higher than that in the same period of normal years. The regional average wind speed reached 4.5 m/s, with local average wind speeds reaching 10 m/s. This was beneficial for dust emissions in the GD of East Asia. In the spring of AO−/NAO+ years, there was a significant positive wind speed anomaly in southern Mongolia, northern China, and the JB (Figure 11f). The value of the anomaly center in western IM was more than 2 m/s. Overall, the wind speed increased in northwestern and southern Mongolia. Cold air from middle and high latitudes increased wind speeds in the region, with local winds of up to 7 m/s in central and western IM (Figure 11b) significantly enhancing regional dust emissions. In the winter of the AO+/NAO− year, the 800 hPa wind speed in southern Mongolia and northern China showed a significant negative anomaly, with a central value of less than 2 m/s (Figure 11c,g). Correspondingly, dust emissions in this region decreased. In the spring of the AO+/NAO+ years, the cold air from Siberia decreased in activity, and the average wind speed at 800 hPa in the GD of East Asia was approximately 3.5 m/s (Figure 11d). The wind speed from the western part of the JB to central–western IM showed a significant negative pitch level (Figure 11h). The wind speed in the GD region of East Asia was significantly weaker than in the same period of normal years. Wind speed showed a significant negative anomaly from the west of the JB to central IM. Wind speed in the GD was significantly weaker than during the same period of normal years, resulting in a significant reduction in the number of dust events in East Asia.
Changes in horizontal pressure gradient force affect wind speed and the direction of its movement. Therefore, we analyzed the effect of mean sea level pressure (MSLP) on winds in East Asia during different phases of AO/NAO coupling (Figure 12). In the subsequent spring of winter AO/NAO coupling years, a cold high-pressure center was located near Lake Balkhash and Lake Baikal, which had a significant impact on cold air activity in East Asia. In AO−/NAO− years (Figure 12a,e), the intensity of the Siberian High (SH) center reached 1024 hPa, and the North Pacific area of northern China showed a positive anomaly area of more than 2 hPa. The SH had an obvious upward trend, which increased the frequency of cold air intrusion to the south. Cold air from western Siberia followed a northwesterly path and increased wind speeds in northwest China and Mongolia, causing a significant rise in dust emissions in the GD region of East Asia. As shown in Figure 12b,f, the SH was close to or weaker than it was in the same period of AO−/NAO+ years. Consequently, there was a negative anomaly from Mongolia to northwest China, and the central pressure was less than −2 hPa. To a certain extent, this increased the pressure gradient between western China and Mongolia and the Asian high, leading to the prevalence of northwesterly winds in Mongolia and the vast GD of northwest China. However, there was a significant positive anomaly from the northwest to the southeast of the Tibetan Plateau. Therefore, wind speed and dust emission variability in this area were low. In the AO+/NAO− years, the MSLP in northwest China showed a significant negative anomaly, whereas sea level pressure in eastern China and the Korean Peninsula showed significant positive anomalies (Figure 12c,g). Therefore, the regional horizontal pressure gradient tended to level off, and the wind speed decreased in the downstream areas. The SH and significant negative mean sea level pressure in northwest China led to increased horizontal pressure gradient force between the two regions, resulting in enhanced wind speed in this region. However, in AO+/NAO+ years (Figure 12d,h), the central pressure of the high pressure zone was weaker than in normal years. Overall, variation in sea level pressure in East Asia was a positive anomaly. This pressure distribution reduces the probability of gale weather in East Asia. Dust emissions were significantly reduced in East Asia.

3.4.2. Possible Mechanism

Generally, the negative phase of the AO will lead to additional cold air activity in East Asia [12]. In the winter of negative AO phase years, sea level pressure near the SH increases in spring. When the SH reaches a certain intensity and moves toward the quasi-stationary EAT, the eastward high-altitude shortwave trough over Lake Balkhash and Lake Baikal strengthens. At this time, the surface anticyclone and cold air that accumulated east of the SH moved eastward and southward, causing more polar cold air and leading to cooling and gale weather. The negative phase of AO can also regulate the formation of the Ural blocking high. With the enhancement and maintenance of the Ural blocking high, the atmospheric baroclinic in front of it is greatly enhanced. Mass convergence in the upper troposphere is accelerated and driven southward by the emergence of cold northerly advection. This drives the southward strengthening and expansion of the SH, causing a cold air outbreak in East Asia. However, in the normal AO phase, the Ural high ridge is weak, the EAT is weak, zonal circulation prevails over Eurasia, and cold air activity is weak. Additionally, Park et al. [57] found that when the SH extended southeastward across Eurasia, a cold wave occurred in East Asia in the positive AO phase. On an interannual scale, the atmospheric circulation anomaly in Siberia may be the bridge between the AO and cold waves in East Asia and could also be the main factor promoting dust emission in East Asia. Although the NAO is a regional phenomenon occurring far from East Asia, there is a certain lag effect on East Asia [51,58,59], facilitated by teleconnections and anomalous stationary wave activity. The impact of NAO can be extended to East Asia through two routes. Among them, one propagates eastward along the subpolar waveguide into northern Eurasia, corresponding to the intensification of the SH and deepening of the EAT during the negative NAO phase [60,61]. For the positive NAO phase, the reverse is true. Therefore, AO/NAO coupling can indirectly affect dust emissions in East Asia by adjusting the SH and EAT. When AO/NAO was in a negative (positive) phase in winter, SH and EAT activity increased (weakened), cold air activity frequency increased (decreased) in middle and high latitudes, the frequency of windy weather related to cold air and cyclone activity increased (decreased), and East Asian dust emissions increased (decreased). Additionally, the SH itself can deflect the westerly jet stream to the south by changing its path. Influenced by the southward shift of the westerly winds, the northerly wind becomes stronger in East Asia in spring, which, to a certain extent, provides the stimulation for dust activity in this region.

3.5. Influence of Surface Conditions on Spring Dust Emissions

Dust emissions are generally controlled by a threshold friction velocity, which is affected by a combination of regional atmospheric and surface conditions, such as atmospheric stability, precipitation, soil moisture, soil evaporation, surface temperature, and vegetation coverage [10,35,54]. In addition to natural factors, soil erodibility is also affected by human activities, such as the reclamation of farmland and pastures and extensive deforestation [62]. Figure 13a–e show the spatial distribution of mean spring vegetation cover, land surface temperature, precipitation, soil moisture, and soil evapotranspiration flux in East Asia from 2000 to 2021.
The GD areas in western and southern Mongolia and northwestern China are the main sources of dust emissions in East Asia. From 2000 to 2021, the NDVI in spring in these areas was generally lower than 0.1, which was not conducive to windbreak and sand fixation or soil and water protection (Figure 13a). To protect the environment, many countries have been planting trees and returning farmland to forests [63,64]. These measures have effectively prevented desert expansion and soil desertification. However, they have not improved vegetation cover in the desert interior. Climate change also affects the distribution and coverage of vegetation in East Asia. Over the past 22 years, the average spring surface temperature of the main dust source regions in East Asia was between 280 and 290 K (Figure 13b). In the middle and high latitudes of the northern hemisphere, higher surface temperatures in spring are favorable for snow melt and vegetation growth, which is beneficial for the suppression of dust activity. However, higher surface temperatures also lead to increased atmospheric instability, and frequent atmospheric convective movements may result in increased dust emissions.
From Figure 13c, it can be seen that there was very limited spring precipitation in most parts of East Asia. In the arid and semi-arid regions located in northwestern China and western and southern Mongolia, the average precipitation in spring was less than 0.4 mm. Precipitation in these areas was also sporadic. Even if higher surface temperatures are good for snow and ice melt, they cannot meet the needs of vegetation growth. The extremely low rainfall in spring is unfavorable to the growth of vegetation and cannot moisten the large areas of dry loose soil exposed in the dust source areas of East Asia. In addition, higher surface temperature and very limited precipitation favor the evaporation of surface water, subsequently leading to a sharp decrease in soil water content (Figure 13c,e). However, when the soil is drier, the cohesion between soil particles decreases, increasing the soil’s erodibility [35,65]. In regions with low precipitation and high evapotranspiration, this effect occurs within a short time scale. This further explains the frequent dust activity in East Asia from March to May.

4. Conclusions

This study investigated the spatiotemporal characteristics and variation trends in dust emissions in East Asia from 2000 to 2021. In addition, the effect of winter AO/NAO coupling on spring dust emissions was investigated. The following conclusions were drawn from this study.
(1)
The TKD in the TB, the Turpan Basin, the Gurbantonggut Desert in the JB, and the GD in western IM and southern Mongolia were the main sources of dust emissions in East Asia. The dust emitted into the air was concentrated in the middle and lower troposphere, particularly at 0–2 km above the Earth’s surface.
(2)
The dust emissions in East Asia showed clear annual variation characteristics. Dust emissions increased significantly from March to May and gradually decreased from June onwards. April and May were the months with the highest emissions, whereas January and December had the lowest emissions. Interestingly, 2007 was the turning point in terms of largest monthly emissions for the 2000–2021 period. April had the highest emissions from 2000 to 2006, whereas from 2007 to 2021 May had the highest emissions. Regarding interannual variation trends, the eastern and southwestern TB, the northern JB, and parts of the GD in southern Mongolia had significantly increasing emissions over the past 22 years. However, the southwestern Tibetan Plateau, southwestern IM, and a small part of the northern Mongolian GD showed a significant downward trend.
(3)
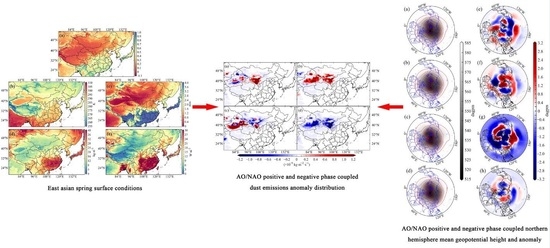
There were significant negative correlations between the AO and NAO in winter and dust emissions in the following spring. In years with different AO/NAO phase couplings, dust emissions showed different change characteristics. In AO−/NAO− years, dust emissions increased abnormally in the northern TB, western IM, and southern Mongolia, whereas dust emissions in the JB and part of the southern TKD decreased. In AO−/NAO+ years, dust emissions in the GD of East Asia increased abnormally. In the AO+/NAO− year, emissions in southern Mongolia, western IM, and the northern region of the TB decreased abnormally, whereas those in the southern region of the TB and JB increased abnormally. AO+/NAO+ years had opposite trends to those in AO−/NAO+ years, with a significant reduction in dust emissions.
(4)
Through a composite analysis of atmospheric variables, the potential physical mechanism of the AO/NAO coupling on dust emissions in East Asia was studied. In AO−/NAO− years, the Asian polar vortex, Ural high ridge, EAT, and SH were stronger in the following spring. Most parts of East Asia are located in front of the Baikal trough and behind the Ural ridge, thus making them areas conducive to the formation of more cold events. Dust emissions in East Asia were accelerated by frequent cold air activity. The position of the Asian polar vortex in the AO−/NAO+ years was stronger to the south than normal, causing more polar cold air to be transported southward along the Siberian negative geopotential height anomaly region. Despite weakening of the SH, deepening and development of the Baikal trough increased the frequency and intensity of Siberian cold air entering East Asia. In the AO+/NAO− year, the position of the Asian polar vortex was west by north, the intensity of the EAT was weak, and the SH had a clear declining trend. However, the positive geopotential anomaly over northeast China and the negative geopotential anomaly over South Asia formed an abnormal convergence in northwest China, which resulted in a strong easterly wind anomaly over northwest China. At the same time, the strengthening of the Balkhash trough provided favorable conditions for gale weather in northwest China, leading to an abnormal increase in emissions in northwest China. The AO+/NAO+ annual polar vortex was northward, and the East Asian trough and Siberian High were weak, decreasing the frequency of cold air. Thus, the intensity of dust activity in East Asia was reduced, and emissions were subsequently significantly reduced.
(5)
Precipitation in the GD is low in spring, and the high near-surface temperature accelerated the evaporation of soil water, resulting in low soil water moisture. Extremely low precipitation and low soil moisture are not conducive to vegetation growth and reduce the adhesion and cohesion of the topsoil. Large areas of exposed, dry, and loose soil in the GD in East Asia make it highly susceptible to wind erosion and diffusion into the air.

Author Contributions

Conceptualization, methodology, data curation, writing—original draft preparation, visualization, software, N.W.; writing—review and editing, J.C., Y.Z., Y.X. and W.Y. All authors have read and agreed to the published version of the manuscript.

Funding

This research was funded by the National Natural Science Foundation of China (NO. U20A2098) and the Environmental Monitoring Foundation of Jiangsu Province (NO. 1903).

Acknowledgments

The authors would like to thank the National Geomatics Center of China for providing 30 m global surface coverage data.

Conflicts of Interest

The authors declare no conflict of interest.

References

  1. Li, Z.Q.; Lau, W.K.M.; Ramanathan, V.; Wu, G.; Ding, Y.; Manoj, M.G.; Liu, J.; Qian, Y.; Li, J.; Zhou, T.; et al. Aerosol and monsoon climate interactions over Asia. Rev. Geophys. 2016, 54, 866–929. [Google Scholar] [CrossRef]
  2. Chen, S.Y.; Huang, J.P.; Li, J.X.; Jia, R.; Jiang, N.X.; Kang, L.T.; Ma, X.J.; Xie, T.T. Comparison of dust emissions, transport, and deposition between the Taklimakan Desert and Gobi Desert from 2007 to 2011. Sci. China Earth Sci. 2017, 60, 1338–1355. [Google Scholar] [CrossRef]
  3. Perlwitz, J.; Tegen, I.; Miller, R.L. Interactive soil dust aerosol model in the GISS GCM: 1. Sensitivity of the soil dust cycle to radiative properties of soil dust aerosols. J. Geophys. Res.-Atmos. 2001, 106, 18167–19192. [Google Scholar] [CrossRef]
  4. Choobari, O.A.; Zawar-Reza, P.; Sturman, A. The global distribution of mineral dust and its impacts on the climate system: A review. Atmos. Res. 2014, 138, 152–165. [Google Scholar] [CrossRef]
  5. Ross, A.D.; Holz, R.E.; Quinn, G.; Reid, J.S.; Xian, P.; Turk, F.J.; Posselt, D.J. Exploring the first aerosol indirect effect over Southeast Asia using a 10-year collocated MODIS, CALIOP, and model dataset. Atmos. Chem. Phys. 2018, 18, 12747–12764. [Google Scholar] [CrossRef] [Green Version]
  6. Tsikerdekis, A.; Zanis, P.; Georgoulias, A.K.; Alexandri, G.; Katragkou, E.; Karacostas, T.; Solomon, F. Direct and semi-direct radiative effect of North African dust in present and future regional climate simulations. Clim. Dynam. 2019, 53, 4311–4336. [Google Scholar] [CrossRef]
  7. Richon, C.; Dutay, J.C.; Dulac, F.; Wang, R.; Balkanski, Y. Modeling the biogeochemical impact of atmospheric phosphate deposition from desert dust and combustion sources to the Mediterranean Sea. Biogeosciences 2018, 15, 2499–2524. [Google Scholar] [CrossRef] [Green Version]
  8. Zhang, X.Y.; Gong, S.L.; Zhao, T.L.; Arimoto, R.; Wang, Y.Q.; Zhou, Z.J. Sources of Asian dust and role of climate change versus desertification in Asian dust emission. Geophys. Res. Lett. 2003, 32, L01103. [Google Scholar] [CrossRef] [Green Version]
  9. Yang, M.Z.; Zhu, X.Y.; Pan, H.X.; Ai, W.X.; Song, W.L.; Pan, Y.P. Changes of the relationship between spring sand dust frequency and large-scale atmospheric circulation. Atmos. Res. 2019, 226, 102–109. [Google Scholar] [CrossRef]
  10. Guan, Q.Y.; Sun, X.Z.; Yang, J.; Pan, B.T.; Zhao, S.L.; Wang, L. Dust storms in northern China: Long-term spatiotemporal characteristics and climate controls. J. Clim. 2017, 30, 6683–6700. [Google Scholar] [CrossRef]
  11. Zhang, Z.Y.; Gong, D.Y.; Mao, R.; Qiao, L.; Kim, S.J.; Liu, S.C. Possible influence of the Antarctic oscillation on haze pollution in North China. J. Geophys. Res.-Atmos. 2019, 124, 1307–1321. [Google Scholar] [CrossRef]
  12. He, S.P.; Gao, Y.Q.; Li, F.; Wang, H.J.; He, Y.C. Impact of Arctic Oscillation on the East Asian climate: A review. Earth-Sci. Rev. 2017, 164, 48–62. [Google Scholar] [CrossRef] [Green Version]
  13. Zhu, C.W.; Wang, B.; Qian, W.H. Why do dust storms decrease in northern China concurrently with the recent global warming? Geophys. Res. Lett. 2008, 35, l18702. [Google Scholar] [CrossRef] [Green Version]
  14. Kang, D.J.; Wang, H.J. Analysis on the decadal scale variation of the dust storm in North China. Sci. China D 2005, 48, 2260–2266. [Google Scholar] [CrossRef]
  15. Wu, Y.F.; Zhang, R.J.; Han, Z.W.; Zeng, Z.M. Relationship between East Asian monsoon and dust weather frequency over Beijing. Adv. Atmos. Sci. 2010, 27, 1389–1398. [Google Scholar] [CrossRef]
  16. Sun, J.M.; Zhang, M.Y.; Liu, T.S. Spatial and temporal characteristics of dust storms in China and its surrounding regions, 1960–1999: Relations to source area and climate. J. Geophys. Res.-Atmos. 2001, 106, 10325–10333. [Google Scholar] [CrossRef]
  17. Gong, S.L.; Zhang, X.Y.; Zhao, T.L.; Zhang, X.B.; Barrie, L.A.; McKendry, I.G.; Zhao, C.S. A simulated climatology of Asian dust aerosol and its trans-Pacific transport. Part II: Interannual variability and climate connections. J. Clim. 2006, 19, 104–122. [Google Scholar] [CrossRef]
  18. Nagashima, K.; Suzuki, Y.; Irino, T.; Nakagawa, T.; Tada, R.; Hara, Y.; Yamada, K.; Kurosaki, Y. Asian dust transport during the last century recorded in Lake Suigetsu sediments. Geophys. Res. Lett. 2016, 43, 2835–2842. [Google Scholar] [CrossRef] [Green Version]
  19. Mao, R.; Gong, D.Y.; Bao, J.D.; Fan, Y.D. Possible influence of Arctic Oscillation on dust storm frequency in North China. J. Geogr. Sci. 2011, 21, 207–218. [Google Scholar] [CrossRef]
  20. Gao, H.; Washington, R. Arctic oscillation and the interannual variability of dust emissions from the Tarim Basin: A TOMS AI based study. Clim. Dynam. 2010, 35, 511–522. [Google Scholar] [CrossRef]
  21. Liu, H.; Liu, X.D.; Dong, B.W. Influence of Central Siberian Snow-Albedo Feedback on the Spring East Asian Dust Cycle and Connection with the Preceding Winter Arctic Oscillation. J. Geophys. Res.-Atmos. 2018, 123, 13368–13385. [Google Scholar] [CrossRef]
  22. Mao, R.; Ho, C.H.; Shao, Y.P.; Gong, D.Y.; Kim, J. Influence of Arctic Oscillation on dust activity over northeast Asia. Atmos. Environ. 2011, 45, 326–337. [Google Scholar] [CrossRef]
  23. Gong, D.Y.; Mao, R.; Fan, Y.D. East Asian dust storm and weather disturbance: Possible links to the Arctic Oscillation. Int. J. Climatol. 2006, 26, 1379–1396. [Google Scholar] [CrossRef]
  24. Zhao, Y.; Huang, A.N.; Zhu, X.S.; Zhou, Y.; Huang, Y. The impact of the winter North Atlantic Oscillation on the frequency of spring dust storms over Tarim Basin in northwest China in the past half-century. Environ. Res. Lett. 2013, 8, 024026. [Google Scholar] [CrossRef] [Green Version]
  25. Fan, K.; Wang, H.J. Antarctic oscillation and the dust weather frequency in North China. Geophys. Res. Lett. 2004, 31, L10201. [Google Scholar] [CrossRef] [Green Version]
  26. Gong, D.Y.; Mao, R.; Shi, P.J.; Fan, Y.D. Correlation between east Asian dust storm frequency and PNA. Geophys. Res. Lett. 2007, 34, L14710. [Google Scholar] [CrossRef]
  27. Liu, J.; Wu, D.Y.; Liu, G.J.; Mao, R.; Chen, S.Y.; Ji, M.X.; Fu, P.Q.; Sun, Y.L.; Pan, X.L.; Jin, H.C.; et al. Impact of Arctic amplification on declining spring dust events in East Asia. Clim. Dynam. 2020, 54, 1913–1935. [Google Scholar] [CrossRef] [Green Version]
  28. Fan, K.; Xie, Z.M.; Wang, H.J.; Xu, Z.Q.; Liu, J.P. Frequency of spring dust weather in North China linked to sea ice variability in the Barents Sea. Clim. Dynam. 2018, 51, 4439–4450. [Google Scholar] [CrossRef]
  29. Lee, Y.G.; Kim, J.; Ho, C.H.; An, S.I.; Cho, H.K.; Mao, R.; Tian, B.J.; Wu, D.; Lee, J.N.; Kalashnikova, O.; et al. The effects of ENSO under negative AO phase on spring dust activity over northern China: An observational investigation. Int. J. Climatol. 2015, 35, 935–947. [Google Scholar] [CrossRef]
  30. Hara, Y.; Uno, I.; Wang, Z.F. Long-term variation of Asian dust and related climate factors. Atmos. Environ. 2006, 40, 6730–6740. [Google Scholar] [CrossRef]
  31. Jun, C.; Ban, Y.F.; Li, S.N. Open access to Earth land-cover map. Nature 2014, 514, 434. [Google Scholar] [CrossRef] [Green Version]
  32. Rienecker, M.M.; Suarez, M.J.; Gelaro, R.; Todling, R.; Bacmeister, J.; Liu, E.; Bosilovich, M.G.; Schubert, S.D.; Takacs, L.; Kim, G.K.; et al. MERRA: NASA’s modern-era retrospective analysis for research and applications. J. Clim. 2014, 24, 3624–3648. [Google Scholar] [CrossRef]
  33. Gelaro, R.; McCarty, W.; Suárez, M.J.; Todling, R.; Molod, A.; Takacs, L.; Randles, C.A.; Darmenov, A.; Bosilovich, M.G.; Reichle, R.; et al. The modern-era retrospective analysis for research and applications, version 2 (MERRA-2). J. Clim. 2017, 30, 5419–5454. [Google Scholar] [CrossRef]
  34. Randles, C.A.; Da Silva, A.M.; Buchard, V.; Colarco, P.R.; Darmenov, A.; Govindaraju, R.; Smirnov, A.; Holben, B.; Ferrare, R.; Hair, J.; et al. The MERRA-2 aerosol reanalysis, 1980 onward. Part I: System description and data assimilation evaluation. J. Clim. 2017, 30, 6823–6850. [Google Scholar] [CrossRef]
  35. Shi, L.M.; Zhang, J.H.; Yao, F.M.; Zhang, D.; Guo, H.D. Temporal variation of dust emissions in dust sources over Central Asia in recent decades and the climate linkages. Atmos. Environ. 2020, 222, 117176. [Google Scholar] [CrossRef]
  36. Ginoux, P.; Chin, M.; Tegen, I.; Prospero, J.M.; Holben, B.; Dubovil, O.; Lin, S.J. Sources and distributions of dust aerosols simulated with the GOCART model. J. Geophys. Res.-Atmos. 2001, 10, 20255–20273. [Google Scholar] [CrossRef]
  37. Colarco, P.R.; Nowottnick, E.P.; Randles, C.A.; Yi, B.Q.; Yang, P.; Kim, K.M.; Smith, J.A.; Bardeen, C.G. Impact of radiatively interactive dust aerosols in the NASA GEOS-5 climate model: Sensitivity to dust particle shape and refractive index. J. Geophys. Res.-Atmos. 2014, 119, 753–786. [Google Scholar] [CrossRef]
  38. Jing, Y.Y.; Zhang, P.; Chen, L.; Xu, N. Integrated analysis of dust transport and budget in a severe Asian dust event. Aerosol. Air Qual. Res. 2017, 17, 2390–2400. [Google Scholar] [CrossRef] [Green Version]
  39. Yao, W.R.; Che, H.Z.; Gui, K.; Wang, Y.Q.; Zhang, X.Y. Can MERRA-2 reanalysis data reproduce the three-dimensional evolution characteristics of a typical dust process in East Asia? A case study of the dust event in May 2017. Remote Sens. 2020, 12, 902. [Google Scholar] [CrossRef] [Green Version]
  40. Shi, L.M.; Zhang, J.H.; Yao, F.M.; Zhang, D.; Guo, H.D. Drivers to dust emissions over dust belt from 1980 to 2018 and their variation in two global warming phases. Sci. Total Environ. 2021, 767, 144860. [Google Scholar] [CrossRef]
  41. Winker, D.M.; Tackett, J.L.; Getzewich, B.J.; Liu, Z.; Vaughan, M.A.; Rogers, R.R. The global 3-D distribution of tropospheric aerosols as characterized by CALIOP. Atmos. Chem. Phys. 2013, 13, 3345–3361. [Google Scholar] [CrossRef] [Green Version]
  42. Huang, J.P.; Wang, T.H.; Wang, W.C.; Li, Z.Q.; Yan, H.R. Climate effects of dust aerosols over East Asian arid and semiarid regions. J. Geophys. Res.-Atmos. 2014, 119, 11398–11416. [Google Scholar] [CrossRef]
  43. Liu, Z.; Liu, D.; Huang, J.P.; Vaughan, M.; Uno, I.; Sugimoto, N.; Kittaka, C.; Trepte, C.; Wang, Z.; Hostetler, C.; et al. Airborne dust distributions over the Tibetan Plateau and surrounding areas derived from the first year of CALIPSO lidar observations. Atmos. Chem. Phys. 2008, 8, 5045–5060. [Google Scholar] [CrossRef] [Green Version]
  44. Tackett, J.L.; Winker, D.M.; Getzewich, B.J.; Vaughan, M.A.; Young, S.A.; Kar, J. CALIPSO lidar level 3 aerosol profile product: Version 3 algorithm design. Atmos. Meas. Tech. 2018, 11, 4129–4152. [Google Scholar] [CrossRef] [Green Version]
  45. Young, S.A.; Vaughan, M.A.; Garnier, A.; Tackett, J.L.; Lambeth, J.D.; Powell, K.A. Extinction and optical depth retrievals for CALIPSO’s Version 4 data release. Atmos. Meas. Tech. 2018, 11, 5701–5727. [Google Scholar] [CrossRef] [Green Version]
  46. Liu, D.; Zhao, T.L.; Boiyo, R.; Chen, S.Y.; Lu, Z.Q.; Wu, Y.; Zhao, Y. Vertical structures of dust aerosols over East Asia based on CALIPSO retrievals. Remote Sens. 2019, 11, 701. [Google Scholar] [CrossRef] [Green Version]
  47. Hoffmann, L.; Günther, G.; Li, D.; Stein, O.; Wu, X.; Griessbach, S.; Heng, Y.; Konopka, P.; Müller, R.; Bärbel, V.; et al. From ERA-Interim to ERA5: The considerable impact of ECMWF’s next-generation reanalysis on Lagrangian transport simulations. Atmos. Chem. Phys. 2019, 19, 3097–3124. [Google Scholar] [CrossRef] [Green Version]
  48. Shi, H.Y.; Cao, X.F.; Li, Q.J.; Li, D.; Sun, J.C.; You, Z.J.; Sun, Q.Y. Evaluating the accuracy of ERA5 wave reanalysis in the water around China. J. Ocean. Univ. China 2021, 20, 1–9. [Google Scholar] [CrossRef]
  49. Muñoz-Sabater, J.; Dutra, E.; Agustí-Panareda, A.; Albergel, C.; Arduini, G.; Balsamo, G.; Boussetta, S.; Choulga, M.; Harrigan, S.; Hersbach, H.; et al. ERA5-Land: A state-of-the-art global reanalysis dataset for land applications. Earth Syst. Sci. Data 2021, 13, 4349–4383. [Google Scholar] [CrossRef]
  50. Thompson, D.W.J.; Wallace, J.M. Regional climate impacts of the Northern Hemisphere annular mode. Science 2001, 293, 85–89. [Google Scholar] [CrossRef] [PubMed]
  51. Hurrell, J.W. Decadal trends in the North Atlantic Oscillation: Regional temperatures and precipitation. Science 1995, 269, 676–679. [Google Scholar] [CrossRef] [Green Version]
  52. Jiang, W.G.; Yuan, L.H.; Wang, W.J.; Cao, R.; Zhang, Y.F.; Shen, W.M. Spatio-temporal analysis of vegetation variation in the Yellow River Basin. Ecol. Indic. 2015, 51, 117–126. [Google Scholar] [CrossRef]
  53. Neeti, N.; Eastman, J.R. A contextual Mann-Kendall approach for the assessment of trend significance in image time series. Trans. Gis. 2011, 15, 599–611. [Google Scholar] [CrossRef]
  54. Song, H.Q.; Wang, K.; Zhang, Y.; Hong, C.B.; Zhou, S.H. Simulation and evaluation of dust emissions with WRF-Chem (v3. 7.1) and its relationship to the changing climate over East Asia from 1980 to 2015. Atmos. Environ. 2017, 167, 511–522. [Google Scholar] [CrossRef]
  55. Thompson, D.W.; Wallace, J.M. Annular modes in the extratropical circulation. Part I: Month-to-month variability. J. Clim. 2000, 13, 1000–1016. [Google Scholar] [CrossRef]
  56. Chen, S.; Huang, J.P.; Zhao, C.; Qian, Y.; Leung, L.R.; Yang, B. Modeling the transport and radiative forcing of Taklimakan dust over the Tibetan Plateau: A case study in the summer of 2006. J. Geophys. Res.-Atmos. 2013, 118, 797–812. [Google Scholar] [CrossRef]
  57. Park, T.W.; Ho, C.H.; Yang, S.; Jeong, J.H. Influences of Arctic Oscillation and Madden-Julian Oscillation on cold surges and heavy snowfalls over Korea: A case study for the winter of 2009–2010. J. Geophys. Res.-Atmos. 2010, 115, 122. [Google Scholar] [CrossRef]
  58. Watanabe, M. Asian jet waveguide and a downstream extension of the North Atlantic Oscillation. J. Clim. 2004, 17, 4674–4691. [Google Scholar] [CrossRef]
  59. Huang, R.H.; Chen, J.L.; Wang, L.; Lin, Z.D. Characteristics, processes, and causes of the spatio-temporal variabilities of the East Asian monsoon system. Adv. Atmos. Sci. 2012, 29, 910–942. [Google Scholar] [CrossRef]
  60. Feng, G.L.; Zou, M.; Qiao, S.B.; Zhi, R.; Gong, Z.Q. The changing relationship between the December North Atlantic Oscillation and the following February East Asian trough before and after the late 1980s. Clim. Dynam. 2018, 51, 4229–4242. [Google Scholar] [CrossRef]
  61. Kaskaoutis, D.G.; Rashki, A.; Dumka, U.C.; Mofidi, A.; Kambezidis, H.D.; Psiloglou, B.E.; Karagiannis, D.; Petrinoli, K.; Gavriil, A. Atmospheric dynamics associated with exceptionally dusty conditions over the eastern Mediterranean and Greece in March 2018. Atmos. Res. 2019, 218, 269–284. [Google Scholar] [CrossRef]
  62. Chen, Y.; Tang, H. Desertification in north China: Background, anthropogenic impacts and failures in combating it. Land. Degrad Dev. 2005, 16, 367–376. [Google Scholar] [CrossRef]
  63. An, L.C.; Che, H.Z.; Xue, M.; Zhang, T.H.; Wang, H.; Wang, Y.Q.; Zhou, C.H.; Zhao, H.J.; Gui, K.; Sun, T.Z.; et al. Temporal and spatial variations in sand and dust storm events in East Asia from 2007 to 2016: Relationships with surface conditions and climate change. Sci. Total Environ. 2018, 633, 452–462. [Google Scholar] [CrossRef]
  64. Peng, S.S.; Piao, S.L.; Zeng, Z.Z.; Ciais, P.; Zhou, L.M.; Li, L.Z.; Li, L.Z.; Myneni, R.B.; Yin, Y.; Zeng, H. Afforestation in China cools local land surface temperature. Proc. Natl. Acad. Sci. USA 2014, 111, 2915–2919. [Google Scholar] [CrossRef] [Green Version]
  65. Ravi, S.; Zobeck, T.M.; Over, T.M.; Okin, G.S.; D’odorico, P. On the effect of moisture bonding forces in air-dry soils on threshold friction velocity of wind erosion. Sedimentology 2006, 53, 597–609. [Google Scholar] [CrossRef]
Figure 1. Surface cover types in East Asia. I: Gurbantunggut Desert; II: Taklimakan Desert (TKD); III: Kumtag Desert; IV: Qaidam sandy land; V: Badain Jaran Desert; VI: Tengger Desert; VII: Ulan Buh Desert; VIII: Mu Us sandy land; IX: Kubuqi Desert; X: Otindag sandy land; XI: Horqin sandy land.
Remotesensing 15 00410 g001
Figure 2. Annual variation in dust emissions over East Asia averaged from 2000 to 2021.
Remotesensing 15 00410 g002
Figure 3. Distribution of the seasonal average dust extinction coefficient in East Asia from 2006 to 2021.
Remotesensing 15 00410 g003
Figure 4. Variation (a) and spatial distribution of correlation (b) between MERRA-2 dust emissions and CALIPSO-observed dust extinction coefficient (0–4 km) in East Asia from 2006 to 2021 (·indicates over 90% confidence).
Remotesensing 15 00410 g004
Figure 5. Interannual variation in monthly dust emissions (a) and interannual variation in dust emissions in April and May (b) in East Asia from 2000 to 2021.
Remotesensing 15 00410 g005
Figure 6. Interannual variation trend in East Asian dust emissions from 2000 to 2021.
Remotesensing 15 00410 g006
Figure 7. Spatial distribution of (a) average dust emissions and (b) interannual trends in East Asia in spring from 2000 to 2021.
Remotesensing 15 00410 g007
Figure 8. Correlations between East Asian dust emissions in spring and the (a) ENSO, (b) SO, (c) AAO, (d) PNA pattern, (e) AO, and (f) NAO indices in winter from 2000 to 2021. Black dots indicate a confidence level above 90%.
Remotesensing 15 00410 g008
Figure 9. Abnormal distribution of dust emissions in spring of the following year with the couplings of (a) AO−/NAO−, (b) AO−/NAO+, (c) AO+/NAO−, and (d) AO+/NAO+ in winter.
Remotesensing 15 00410 g009
Figure 10. Spatial distribution of (ad) mean spring 500 hPa geopotential height and (eh) anomalies in (a,e) AO−/NAO−, (b,f) AO−/NAO+, (c,g) AO+/NAO−, and (d,h) AO+/NAO+ years.
Remotesensing 15 00410 g010
Figure 11. Spatial distribution of (ad) mean spring 800 hPa wind speed and (eh) anomalies in (a,e) AO−/NAO−, (b,f) AO−/NAO+, (c,g) AO+/NAO−, and (d,h) AO+/NAO+ years.
Remotesensing 15 00410 g011
Figure 12. Spatial distribution of (ad) mean spring sea level pressure and (eh) anomalies in (a,e) AO−/NAO−, (b,f) AO−/NAO+, (c,g) AO+/NAO−, and (d,h) AO+/NAO+ years.
Remotesensing 15 00410 g012
Figure 13. The average spring vegetation cover (a), land surface temperature (b), precipitation (c), soil moisture (d), and soil evaporation flux (e) in East Asia from 2000 to 2021.
Remotesensing 15 00410 g013
Table 1. Categories of interannual variation trends in dust emissions in East Asia from 2000 to 2021.
β|Z|Trend Features
β > 02.576 ≤ |Z|Extremely significant increase
1.96 ≤ |Z|< 2.576Significant increase
1.645 ≤ |Z| < 1.96Slightly significant increase
|Z| < 1.645No significant increase
β = 0|Z|No change
β < 0|Z| > 1.645No significant decrease
1.645 ≤ |Z| < 1.96Slightly significant decrease
1.96 ≤ |Z| < 2.576Significant decrease
2.576 ≤ |Z|Extremely significant decrease
Table 2. Years of positive and negative phases for the AO and NAO in winter from 2000 to 2021.
AONAOTypical Years
AO−NAO+2001, 2004, 2006, 2013, 2016, 2018
NAO−2003, 2010, 2011, 2021
AO+NAO+2000, 2002, 2005, 2007, 2008, 2012, 2014, 2015, 2017, 2019, 2020
NAO−2009
Disclaimer/Publisher’s Note: The statements, opinions and data contained in all publications are solely those of the individual author(s) and contributor(s) and not of MDPI and/or the editor(s). MDPI and/or the editor(s) disclaim responsibility for any injury to people or property resulting from any ideas, methods, instructions or products referred to in the content.

