Article

Interferometric Synthetic Aperture Radar Applicability Analysis for Potential Landslide Identification in Steep Mountainous Areas with C/L Band Data

1
College of Earth Sciences, Chengdu University of Technology, Chengdu 610059, China
2
State Key Laboratory of Geohazard Prevention and Geoenvironment Protection, Chengdu University of Technology, Chengdu 610059, China
3
Chongqing Institute of Geology and Mineral Resources (CIGMR), Chongqing 400014, China
*
Author to whom correspondence should be addressed.
Remote Sens. 2023, 15(18), 4538; https://doi.org/10.3390/rs15184538
Submission received: 1 August 2023 / Revised: 1 September 2023 / Accepted: 7 September 2023 / Published: 15 September 2023

Abstract

:
Landslides frequently occur in the mountainous area of southwest China, resulting in infrastructure damage, as well as a loss of life and property. The use of interferometric synthetic aperture radar (InSAR) technology has become increasingly popular due to its wide coverage, high precision, and efficiency in identifying potential landslides in steep mountainous regions to mitigate risks. This study focused on the Mao County region in China and utilized a small baseline subset of InSAR (SBAS−InSAR) technology with Sentinel-1 and ALOS-2 data to identify the potential landslides and analyze their applicability. To ensure accuracy, the findings were verified using optical image and field surveys. Additionally, a comparative analysis was performed on C-band and L-band SAR data to examine differences in the coherence, geometric distortion, and displacement results, revealing that the L-band has clear advantages in the coherence, suitable observation coverage, and displacement results, while C-band can detect relatively slight displacements. This study aimed to determine the applicability of different SAR satellites for early landslide identification in steep mountainous areas, which can serve as a technical reference for selecting appropriate SAR data and enhancing InSAR identification abilities for potential landslides in the future.

Graphical Abstract

1. Introduction

The western Sichuan region is situated at the boundary between the first and second steps of Chinese topographic levels, making it a stress-concentrated area [1,2]. Moreover, this region is characterized by intense geological activities, including the Longmenshan Fault and the Xianshuihe Fault, which have resulted in frequent landslides. Moreover, these landslides have caused significant economic losses and substantial human casualties [3,4,5,6,7]. Therefore, early identification of potential landslides is crucial for reducing risks and preventing disasters.
Time series interferometric synthetic aperture radar (InSAR) technology [8,9], such as small baseline subset InSAR (SBAS-InSAR), has significant advantages over optical remote sensing, including all-weather, all-day, cloud-free, and high-measurement-accuracy sensing, and so on [10]. As a result, it has become one of the most effective tools for identifying and monitoring potential landslides [11,12,13,14]. And SBAS−InSAR technology has found successful applications in landslide prevention and control [15,16,17,18]. Multi-platform SAR data, including Sentinel-1 in the C-band, TerraSAR-X in the X-band, and ALOS-1/2 in the L-band, are extensively used in potential landslide monitoring [19,20,21,22,23,24]. Dong et al. [25] conducted a spatiotemporal analysis of the Xinmo landslide using a combination of TerraSAR-X, ALOS-2, and Sentinel-1 data. Similarly, Lu et al. [26] employed ALOS PALSAR-1 and Sentinel-1 data to identify potential landslides in the Jinsha River basin. As a result, several potential landslides were identified by multi-platform SAR data, which serves as complementary information for the identification of landslides using optical images. Herrera et al. [27] used multi-platform and multi-temporal SAR data and successfully detected 294 active landslides, indicating that different pieces of SAR data have varying abilities in landslide detection. Zhang et al. [28] combined ALOS PALSAR and ENVISAT ASAR data, and identified 17 potential landslides in the Dadu River region, highlighting the impact of radar wavelength and geometric distortion on the effectiveness of InSAR identification. However, previous research on InSAR has primarily focused on using displacement monitoring results to validate landslide identification. Efforts centered around exploring the interferometric coherence, displacement monitoring abilities, and geometric distortion of SAR data with different wavelengths in steep mountainous areas are still limited. Consequently, the applicability of different SAR satellites in landslide identification remains unclear and requires further investigation and clarification.
This study used the Mao County region in China as the study area. We utilized 28 Sentinel-1 and 10 ALOS-2 data, along with SBAS−InSAR technology, to identify potential landslides along the riverbanks. Additionally, optical images from Google Earth were used for verification purposes. Then, we compared and analyzed the differences between the different pieces of SAR data in the time series results, and also fully explained and analyzed the distribution of coherence, displacement results, and geometric distortion. Finally, we applied different pieces of SAR data for the early identification of potential landslides in steep mountainous areas, providing theoretical support for selecting appropriate data sources and allowing us to gain a deeper understanding of the abilities of different SAR satellites.

2. Study Area and Datasets

2.1. Study Area

This study uses the northwest region of Mao County, Sichuan Province, Southwest China (Figure 1a), specifically the segment from Feihong Township to Huilong Township and Shidaguan Township (31°43′~31°55′N, 103°31′~103°47′E), as the study area. This area is situated at the convergence of the Heishui River and the Min River and is known for being one of the areas with the highest frequency of geological activity. The study area is approximately 3.5 × 10⁸ m2 and is characterized by steep mountains, with elevations ranging from 1600 to 4050 m (a vertical difference of about 2500 m). The terrain features a pattern of high peaks in the northwest and low areas in the southeast. Meanwhile, located in the transitional zone from the Qinghai–Tibet Plateau to the western Sichuan Plain, Mao County is associated with frequent seismic activity. This is due to the complex geological structure, which is primarily influenced by the Longmenshan fault zone. Additionally, the Xianshuihe fault, Songpingshan fault, and Minjiang fault zones also contribute to seismic activity in the area (Figure 1b). In terms of climate, Mao County is influenced by the westerlies and the southwestern monsoon from the Indian Ocean, resulting in a plateau monsoon climate. Moreover, due to the significant variations in altitude, there are distinct vertical climate zones and regional climate variations, resulting in a complex local climate pattern [10]. The combined influences of climate and geological conditions mentioned above result in frequent natural disasters, such as floods, as well as geological hazards like landslides and debris flows [29]. These hazards pose significant threats to the lives and safety of local residents. They often result in the blockages of rivers and roads (Figure 1c), as well as damage to infrastructure. For instance, on 24 June 2017, a high-level landslide occurred in Xinmo Village, Mao County, Sichuan, resulting in 83 individuals being declared missing or dead, the destruction of 64 households, and the obstruction of a tributary of the Min River for almost 2 km [30,31].

2.2. Datasets

The two different data sources used in this study are ascending Sentinel-1 TOPS (terrain observation by progressive scans) data in the C-band and ascending ALOS-2 strip data in the L-band. With a revisit period of 12 days, Sentinel-1 [32] is capable of providing continuous images under all weather conditions. The ALOS-2 satellite [20,21,22] is equipped with the PALSAR-2 sensor, which has a revisit period of 14 days and can operate in all weather conditions, including complex atmospheric conditions. Table 1 lists the main parameters of the two data sources used in this experiment.
This study used Sentinel-1 data covering the period from 27 November 2017 to 17 October 2018 and includes 28 images. The ALOS-2 data spans from 26 November 2017 to 14 October 2018 and includes a total of 10 images. Among them, the temporal threshold for Sentinel-1 was set at 36 days and the spatial threshold at 200 m, resulting in 78 interferometric pairs in the time series process, as shown in Figure 2a, the numbers in the figure represent the serial numbers of the SAR images. Due to the relatively smaller dataset but higher coherence of ALOS-2 data, we set a temporal baseline of 180 days and a spatial baseline of 300 m. This resulted in 32 interferometric pairs being generated, as shown in Figure 2b. In this experiment, the NASA shuttle radar topography mission digital elevation model (SRTM−DEM) [33] was used as a reference to mitigate or minimize the effects of flat terrain and geocoding.

3. Methodology

The time series InSAR technique used for both ALOS-2 and Sentinel-1 in this study is the SBAS–InSAR technology [34,35]. This technique, initially proposed by Berardino in 2002 [36], is based on multi-master images and utilizes singular value decomposition (SVD) to obtain time series displacement results for the entire study area. It effectively mitigates the temporal and spatial decorrelation issues encountered in traditional differential InSAR (D−InSAR) techniques, mitigating the effects of temporal and spatial decorrelation on data processing [37]. The specific data processing workflow is as follows.
Assuming there are N + 1 images obtained from the time series ( t 0 t i t N ), and M interferometric pairs are generated by setting a temporal−spatial baseline threshold. The relationship can be expressed as,
N + 1 2 M N N + 1 2
Furthermore, the differential interferograms are generated by using the DEM, followed by Goldstein filtering. After filtering, the interferograms are unwrapped using the minimum cost flow (MCF) method. Ground control points (GCPs) are then used to refine and flatten the unwrapped interferograms for enhanced accuracy. Then, assuming t0 as the reference time with zero displacement, the relative phase of pixels in the interferogram j with respect to the reference time can be represented as follows,
δ φ j = φ t 1 φ t 2 = δ φ j d e f + δ φ j t o p o + δ φ j a t m + δ φ j n o i s e
In the equation, 1 j M , where δ φ j d e f represents the displacement phase, δ φ j t o p o represents the topographic phase, δ φ j a t m represents the atmospheric phase, δ φ j n o i s e represents the noise phase.
Where δ ϕ i i = 1 , , M represents the phase value in relation to the unwrapping reference point. The time series corresponding to the master I M and secondary I S images are as follows,
I M = I M 1 , , I M m     I S = I S 1 , , I S m
If the master and secondary images are arranged in chronological order, i.e., I M j > I S j   j = 1 , , M , then the phase representation in the differential interferogram is as follows,
δ ϕ j = ϕ t I M j ϕ t I S j j = 1 , , M
The system of equations shown above, which consists of M equations with N unknowns, can be simplified to,
δ ϕ = A ϕ
The matrix A M × N , where each row corresponds to an interferometric pair and has zero values for all other elements. Furthermore, this representation allows for the transformation of the system of equations,
i = I S j + 1 I M j t i t i 1 ν i = δ ϕ j j = 1 , , M
In the equation, ν is the velocity, that is,
B ν = δ ϕ
Matrix B is an M × N matrix, where the elements B i , j = t j + 1 t j I S i + 1 j I M i , i = 1 , , M , and all other elements are zero. By performing a singular value decomposition (SVD) on B, we can obtain the average velocity for each period. Integrating the velocity in the time domain yields the time series displacement of the pixels. Finally, performing geocoding allows us to obtain time series displacement results in a geographic coordinate system.
In this experiment, we take the C-band as representative of the Sentinel-1 satellite and the L-band as representative of the ALOS-2 satellite and discuss and analyze the applicability of different bands in steep mountainous areas. To ensure the results are comparable, the experiment utilized ascending data and the SBAS–InSAR technology. The processing workflow employed identical filtering parameters and unwrapping thresholds, as indicated in Table 2.
By comparing the interferometric coherence, displacement monitoring results, and geometric distortion distribution of ALOS-2 and Sentinel-1, a comprehensive analysis (Figure 3) was conducted to evaluate the monitoring ability and applicability of these two different data sources for early identification of landslides in steep mountainous areas.
The formula for calculating coherence is as follows:
γ = n = 1 N m = 1 M μ 1 n , m μ 2 n , m n = 1 N m = 1 M μ 1 n , m 2 n = 1 N m = 1 M μ 2 n , m 2
In the equation, M and N represent the size of the data block used for computing coherence, while m and n represent the row and column indices within the data block. μ 1 n , m and μ 2 n , m represent the complex values of the master and secondary images at the (n, m) location, respectively. Based on this formula, coherence can be calculated for any pixel by performing the calculation within a window of size n × m; this enables the determination of the coherence coefficient γ for each pixel.
In addition, three types of geometric distortions (foreshortening, layover, and shadow) were induced by the radar side-looking imaging, which will occur based on the incidence angle and various topographic features. In mountainous areas with significant variations in terrain, the orientation and slope characteristics of land features are determining factors in the occurrence of geometric distortions [38]. Therefore, it is crucial to take the topographic features into full account. In this study, the SARScape module in ENVI software was used to evaluate the geometric distortions in the study area using the SRTM DEM.

4. Results

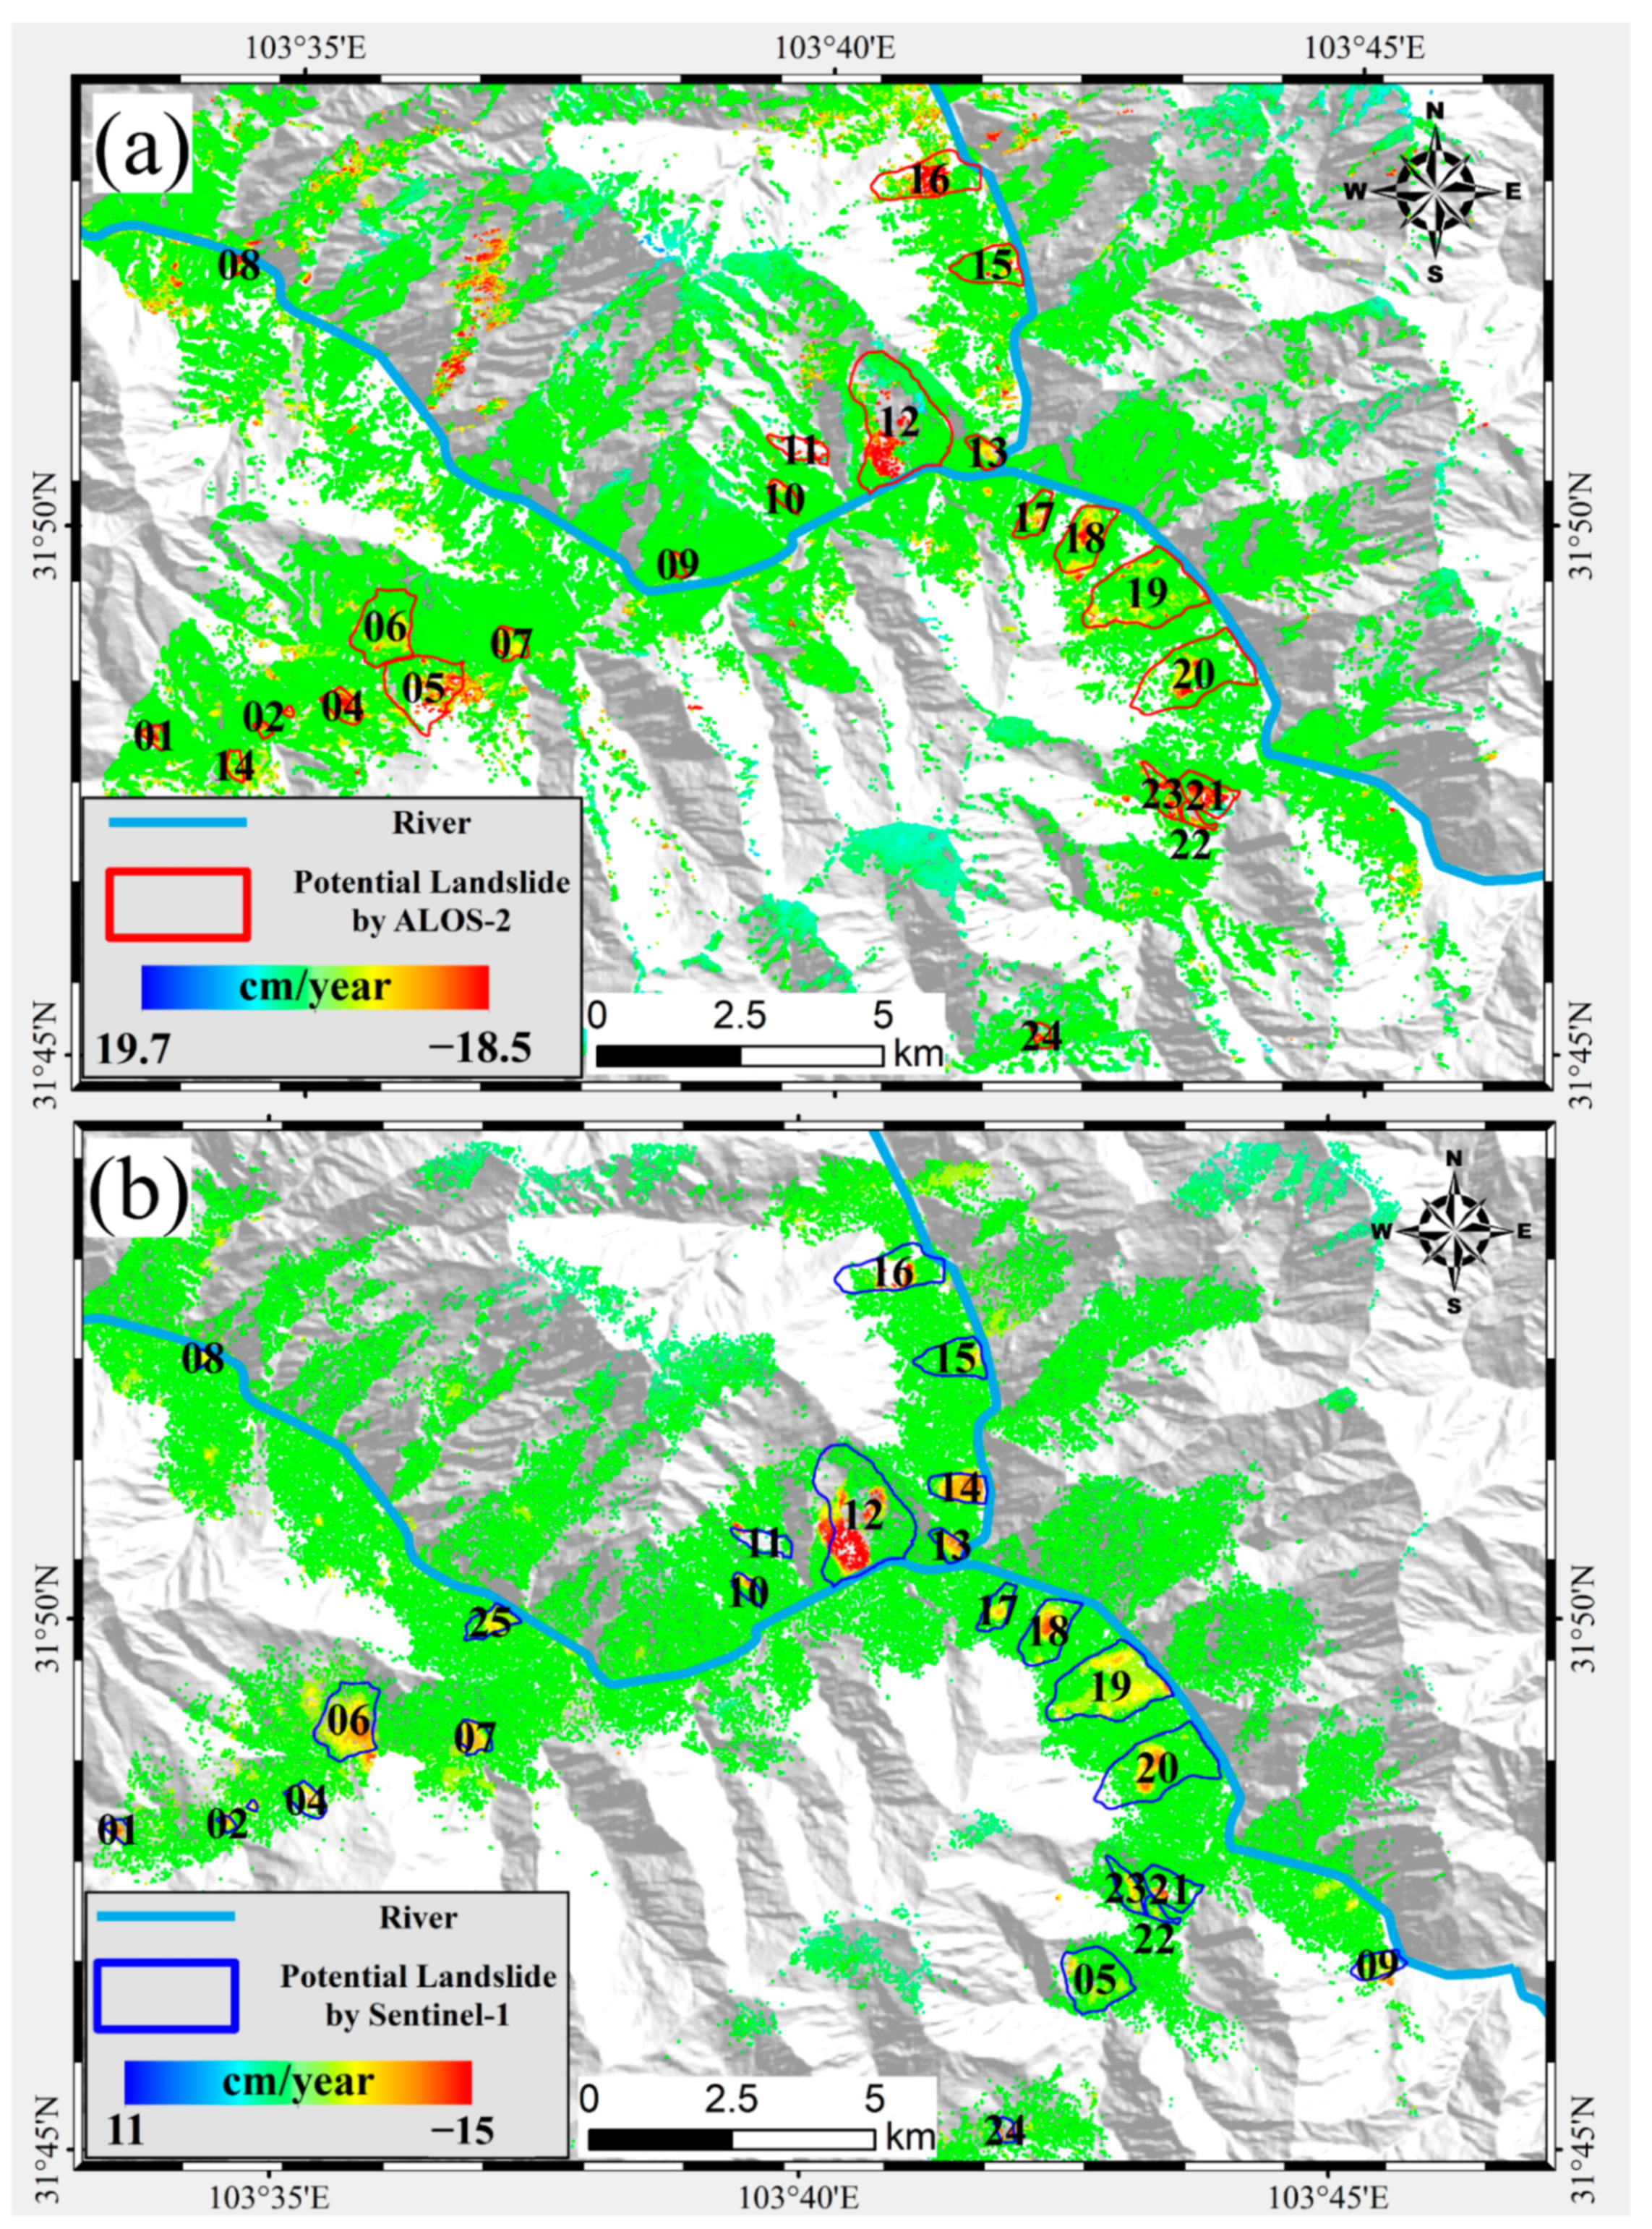
4.1. Time Series Results by SBAS–InSAR

Time series InSAR processing and monitoring of the study area were conducted based on 10 ascending ALOS-2 images and 28 ascending Sentinel-1 images by utilizing the SBAS−InSAR technology. As a result, we obtained the displacement velocity along the line of sight (LOS) of the radar. Furthermore, this study identified the deformed areas with significant displacement. Figure 4 illustrates the distribution of the annual average displacement velocity and the potential landslide identification results in these areas from ALOS-2 and Sentinel-1. The number of measurement points (MPs) obtained from ALOS-2 is 8,185,222, while the number of MPs from Sentinel-1 is 486,452. It shows that the MP density of ALOS-2 is 16 times higher than that of Sentinel-1. The first reason is that even after multi-look processing, ALOS-2 still maintains a higher resolution compared to Sentinel-1, resulting in a greater density of obtained MP results. The second reason is that C-band data (Sentinel-1) has relatively weaker penetration capability, making it more susceptible to the influence of vegetation coverage.
Figure 4 shows the annual velocity results from both datasets. Combining these results with high-resolution optical images and utilizing the morphology of landslides along with displacement velocity, a total of 28 potential landslides undergoing creep displacement were identified. Among them, 24 potential landslides were identified by ALOS-2, while 25 were identified by Sentinel-1. Additionally, 21 potential landslides were identified by both datasets. Based on the ALOS-2 annual velocity map (Figure 4a), it can be observed that the unstable slope with the smallest magnitude of displacement among the potential landslides (A09) has an annual displacement velocity of −65 mm/year. The unstable slope with the most significant displacement (A11) has a velocity exceeding −180 mm/year, indicating high levels of displacement. Simultaneously, the Sentinel-1 annual velocity map (Figure 4b) shows that the unstable slope with a small magnitude of displacement (S08) has a velocity of −45 mm/year, while the largest one (S12) reaches −150 mm/year. These slopes exhibit noticeable displacement characteristics, indicating a high possibility of instability and posing significant threats to local residents and the nearby rivers, namely the Min River and Heishui River.

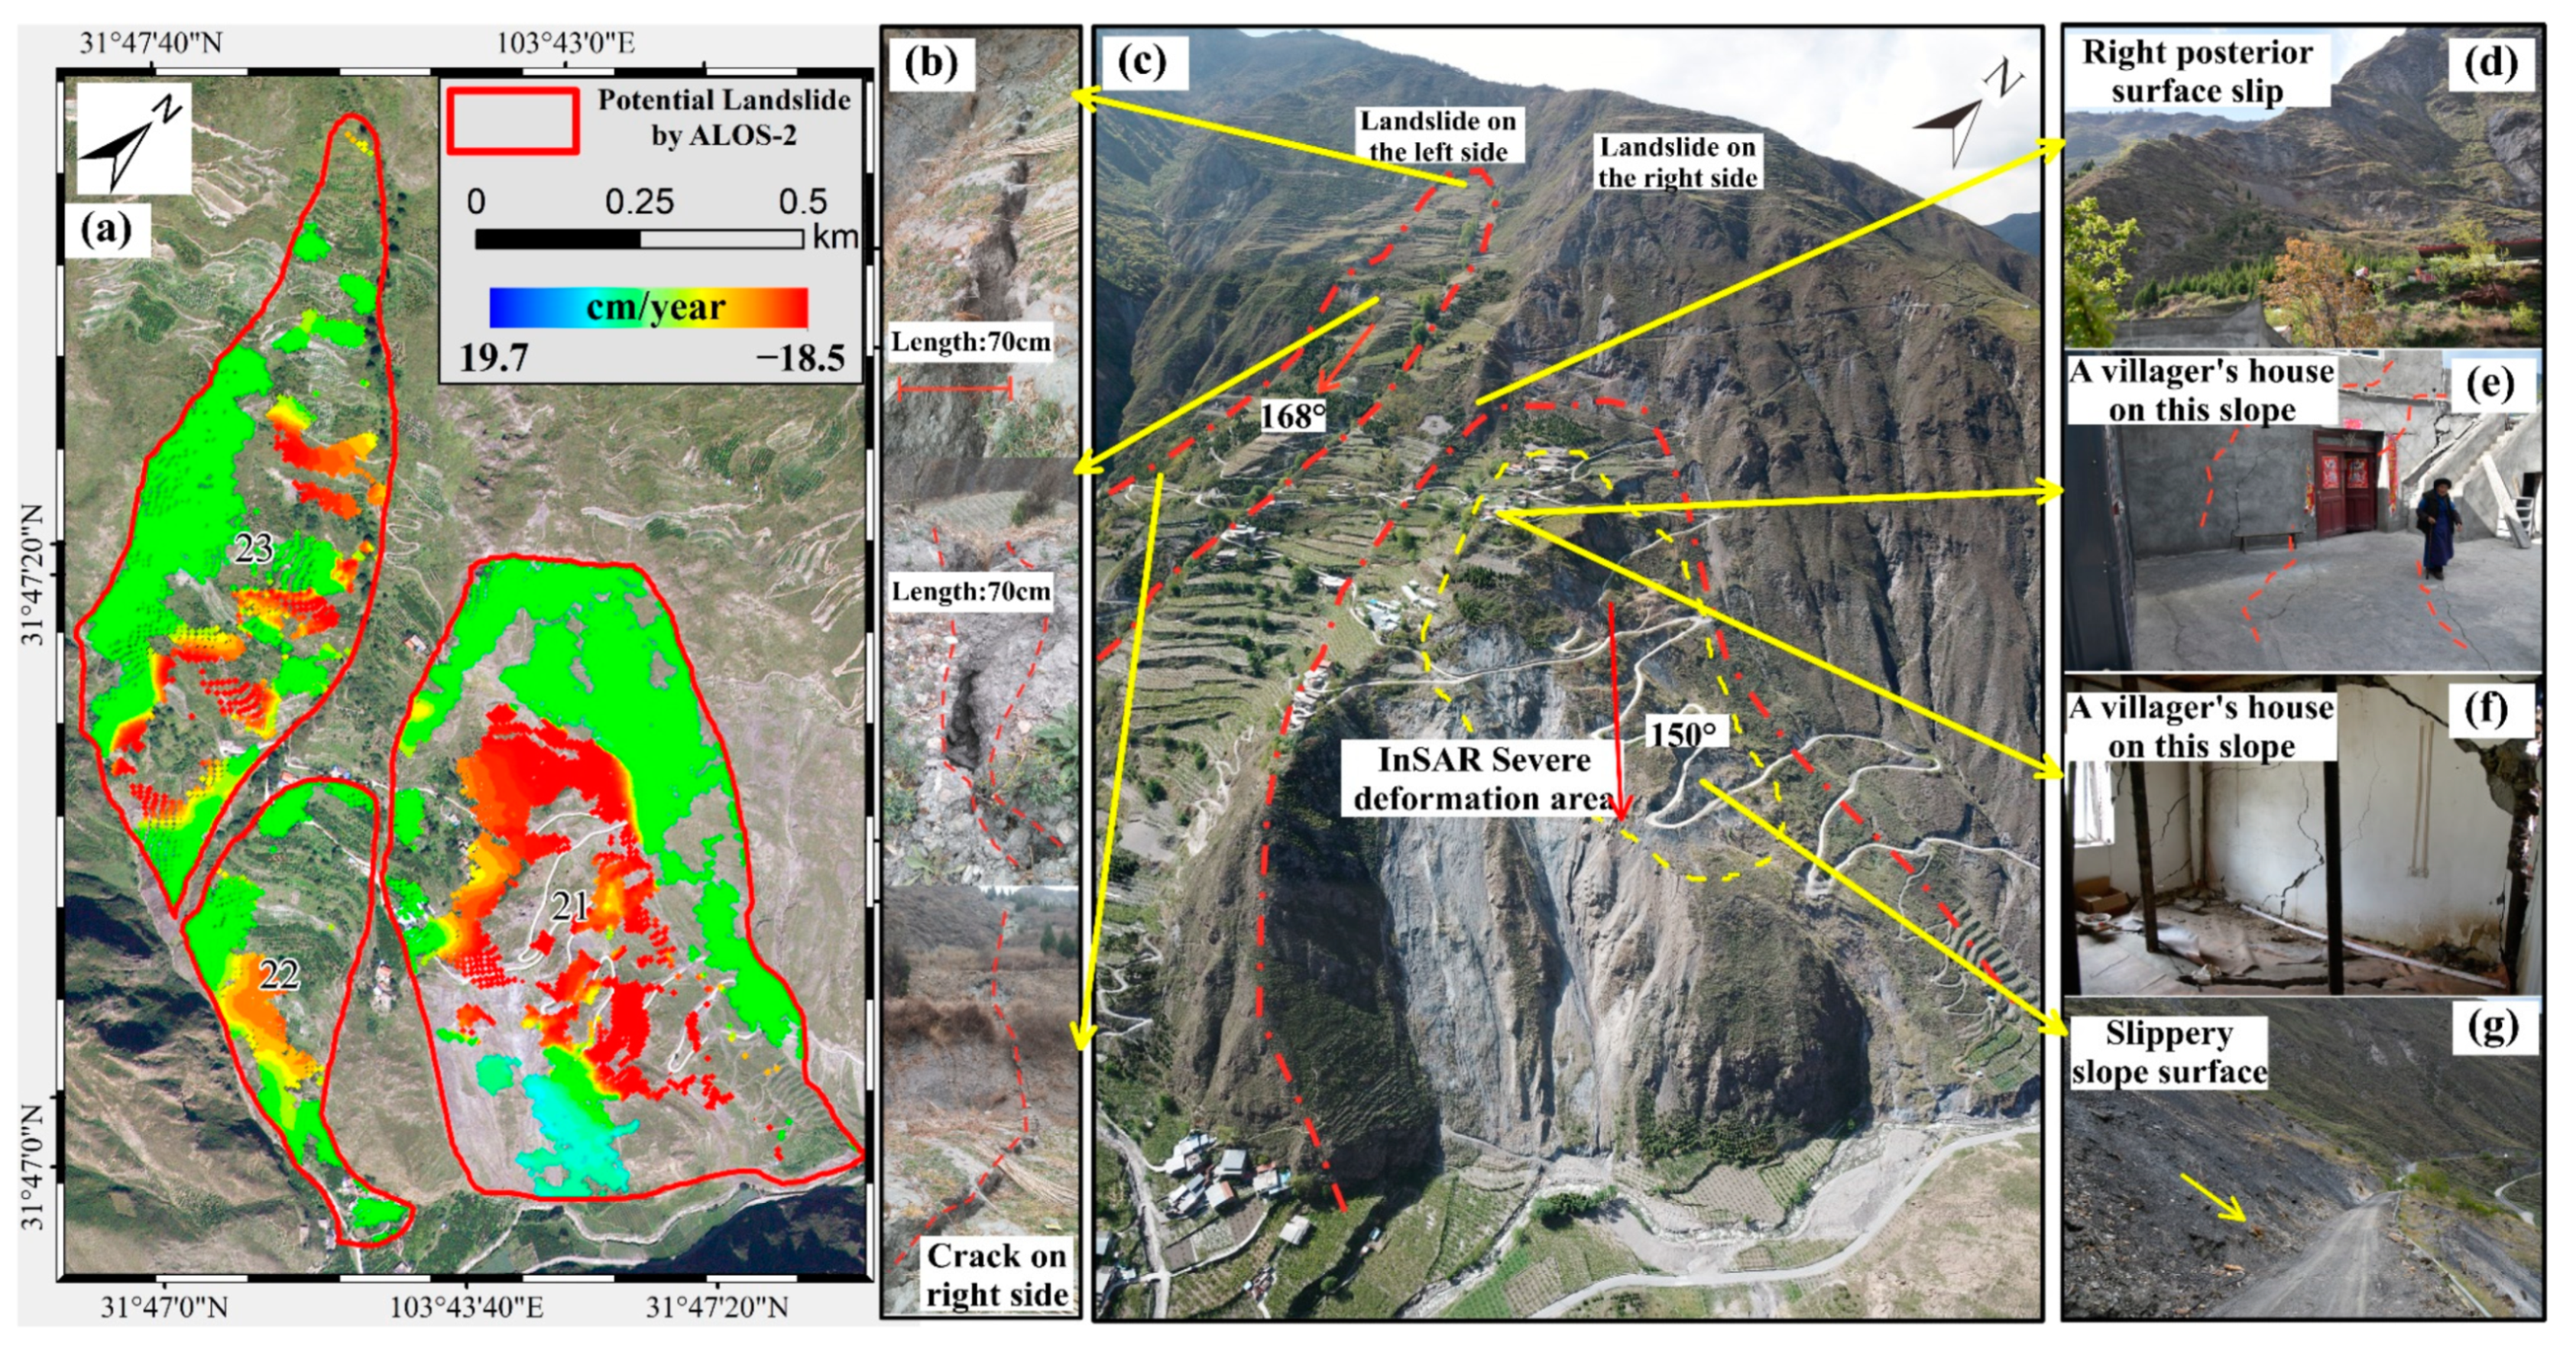
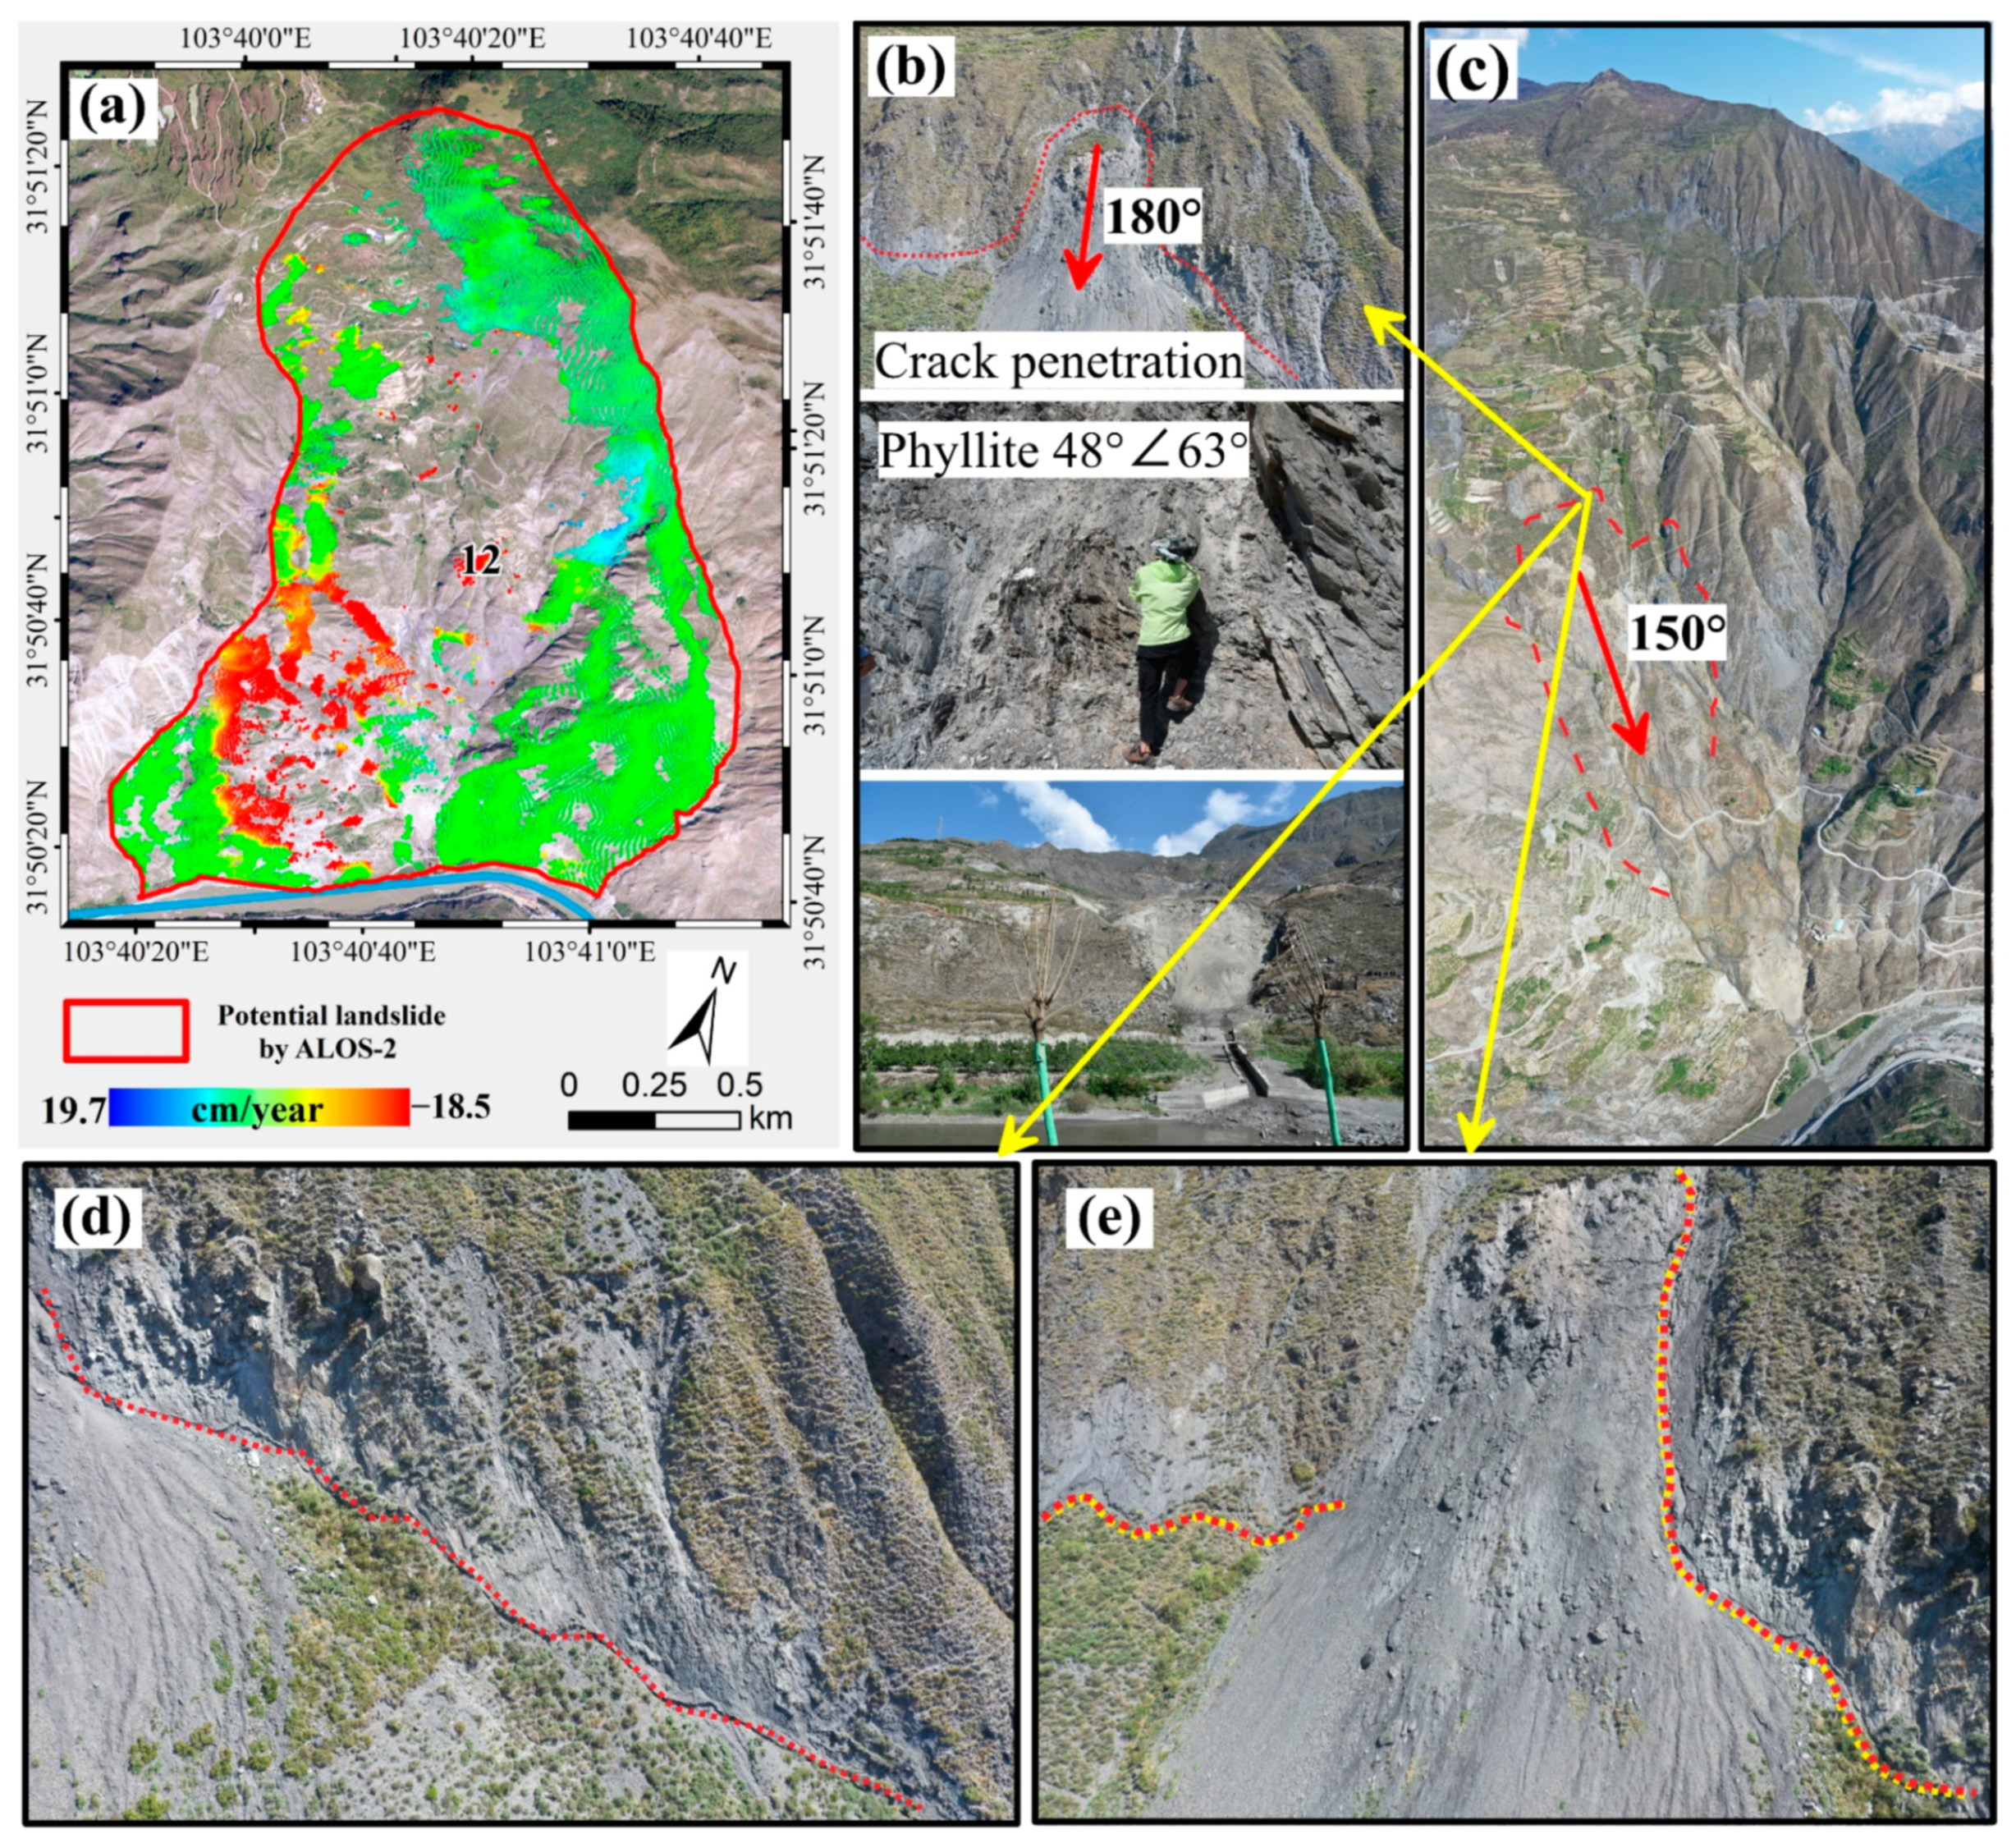
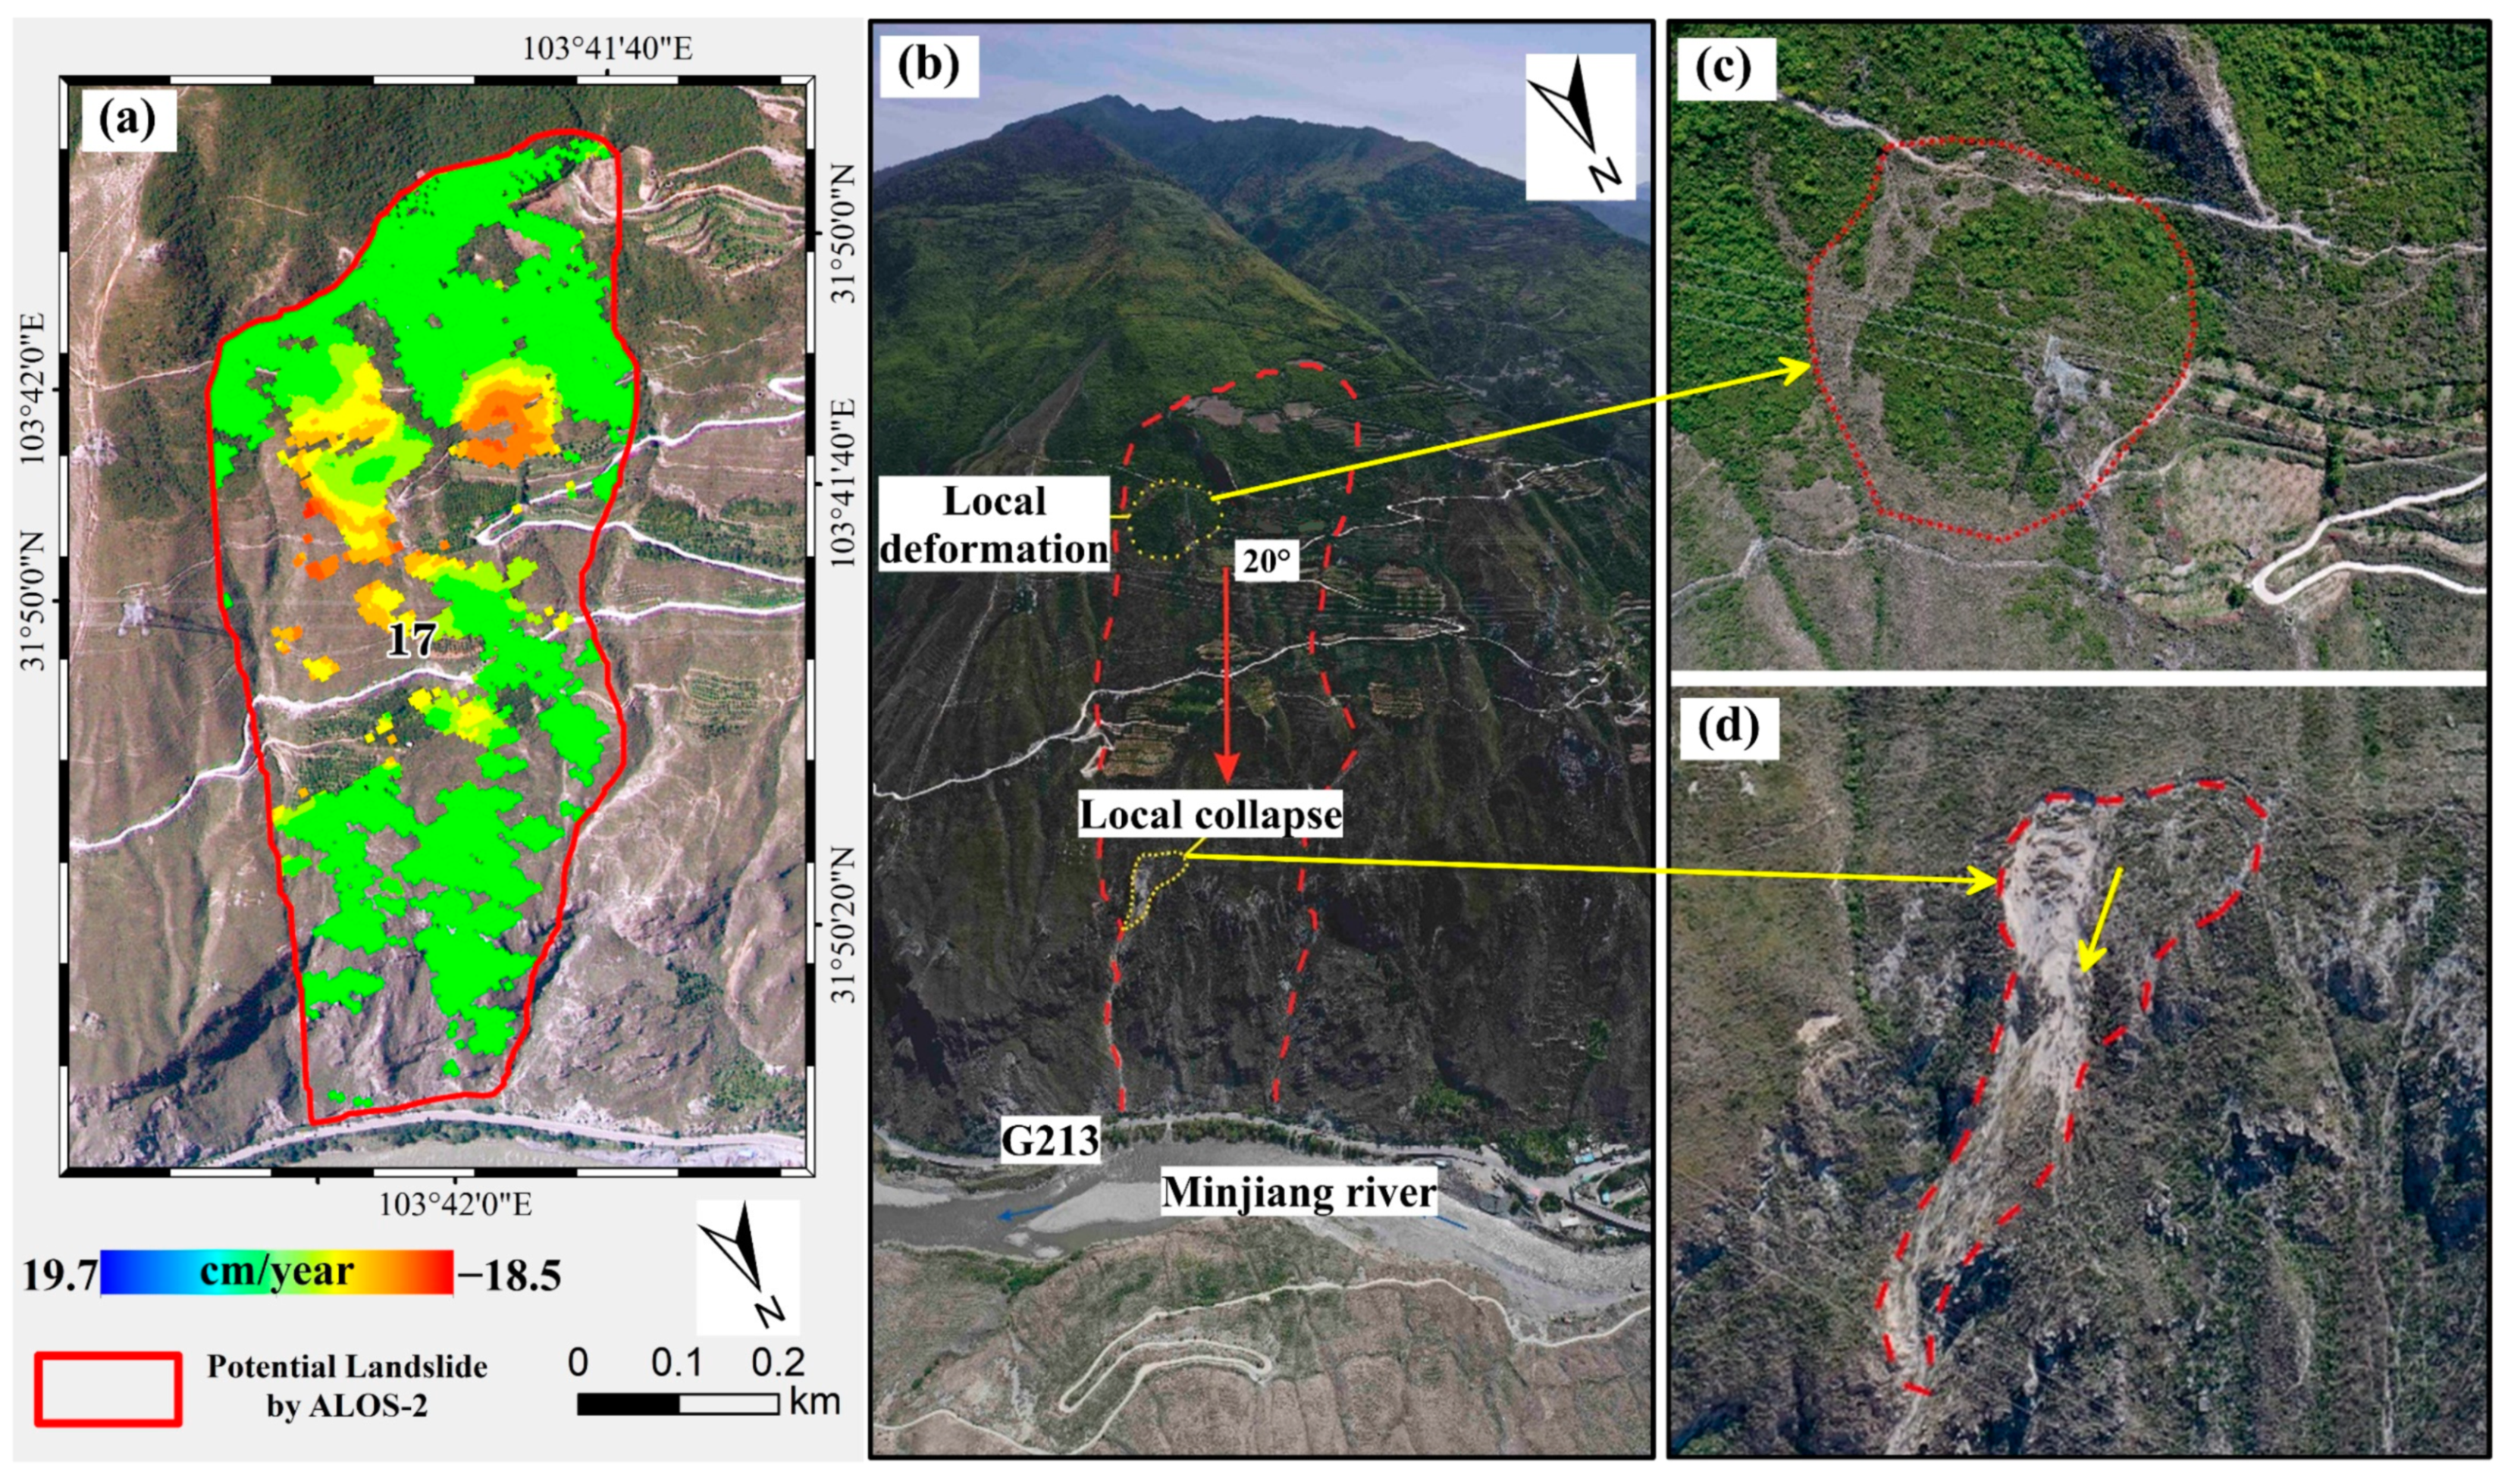
4.2. Field Verification

The potential landslides (A21~A23) are located in Sujiaping village, Heihu town, northwest of Mao County, Sichuan province, specifically 31°47′30″N, 103°43′20″E. According to the ALOS-2 annual velocity map, the displacement rate reaches −185.3 mm/year (Figure 5a). Similarly, the Sentinel-1 data shows a displacement rate of −97.9 mm/year. These measurements indicate that these potential landslides are currently undergoing rapid displacement. It can be observed through field verification that the slope on the right is composed of rocks, while the slope on the left is accretionary (Figure 5b–g). A21 has a sliding direction of approximately 150°, a length of about 1071 m, a width of about 400 m in the middle, and a distinct circular topography. The perimeter of the shape is approximately 2700 m, with an area of about 4 × 10⁵ m2. The average thickness is about 8 m, resulting in a total volume of approximately 3.2 million m3.
The potential landslide on the left has a sliding direction of approximately 168°, a length of about 800 m, a width of about 175 m in the middle, and an area of about 1.1 × 10⁵ m2. It has a thickness of about 10 m, resulting in a volume of approximately 1.11 million m3. At the same time, the displacement of its right edge gully is obvious (Figure 5b–g). According to the local monitors during the field investigation, the right and rear edges of the left landslide had several new cracks in January and February 2021, and many houses had cracks and collapses. At the same time, the degree of crack development was high, with a tendency to penetrate through the entirety, which made it a higher threat.
A12 is located in Shaba Village, Huilong Township, Mao County, Sichuan Province, at coordinates 31°50′38.36″N, 103°40′24.61″E. The lower part of the slope is adjacent to a tributary of the Min River, and provincial road S302 is situated on the opposite side of the river, facing the hazard. The ALOS-2 annual velocity map shows significant displacement, primarily concentrated in the lower left and middle sections of the slope (Figure 6a). This unstable slope is a deposit of an ancient landslide, and field verification photos show distinct gullies on both sides, with a depth of approximately 20 m (Figure 6b–e). The slope is composed of inclined rock formations with a sliding direction of approximately 180°. The planar area of the landslide is approximately 7 × 10⁵ m2, with a thickness of about 20 m and a total volume of approximately 14 million m3. The primary displacement zone within the landslide measures approximately 153 m in length and 267 m in width and has a thickness of about 10 m. The volume of this zone is estimated to be approximately 4.1 × 10⁵ m3. This potential landslide exhibits a tongue-shaped (funnel-shaped) morphology, with distinct circular features and several well-developed landslide terraces (Figure 6b–e). The slope surface appears fragmented and exhibits a yellow–green coloration, with numerous occurrences of slumping. There are two parallel gullies formed on the slope (Figure 6). The lower part of the slope shows local downslope displacement, while the leading edge is heavily eroded by the river, resulting in localized collapses. The river has narrowed in this area, indicating potential instability, and poses a direct threat to the residents and houses on the opposite bank.
The potential landslide A17 is located in the Maifei group, Shaba Village, Huilong Township, Mao County. The geographical coordinates are approximately 103°41′51.12″E and 31°50′08.35″N, with an elevation of around 2000 m. The lower part of this landslide is located at the junction of National Highway G213 and Provincial Road S302 on the right side of the Min River (Figure 7b). According to the ALOS-2 annual velocity map, this potential landslide shows significant displacement in its central region, with a velocity exceeding 80 mm/year. A17 is characterized as a rocky slope located in a high-mountain gorge terrain, with an overall slope gradient of approximately 50°~60°. The upper and lower sections of the slope consist of bedrock, while the middle and upper sections consist of accumulated material. The elevation boundary between the bedrock and accumulated material is approximately 1950 m and 2140 m, respectively, with the elevation of the Min River tributary at around 1660 m.
There are two prominent displacement zones within this region. One is located near the boundary between the bedrock and accumulated material in the lower part of the slope (Figure 7c), covering an area of approximately 3500 m2, with a thickness of about 8m and a volume of approximately 2.8 × 10⁴ m3. The other displacement area is located in the upper part of the accumulated material (Figure 7d), spanning an area of approximately 1.5 × 10⁴ m2, with a thickness of about 6m and a volume of approximately 9 × 10⁴ m3. The sliding direction of this area is approximately 20°, posing a significant threat to the lower Min River and National Highway G213.

5. Discussion

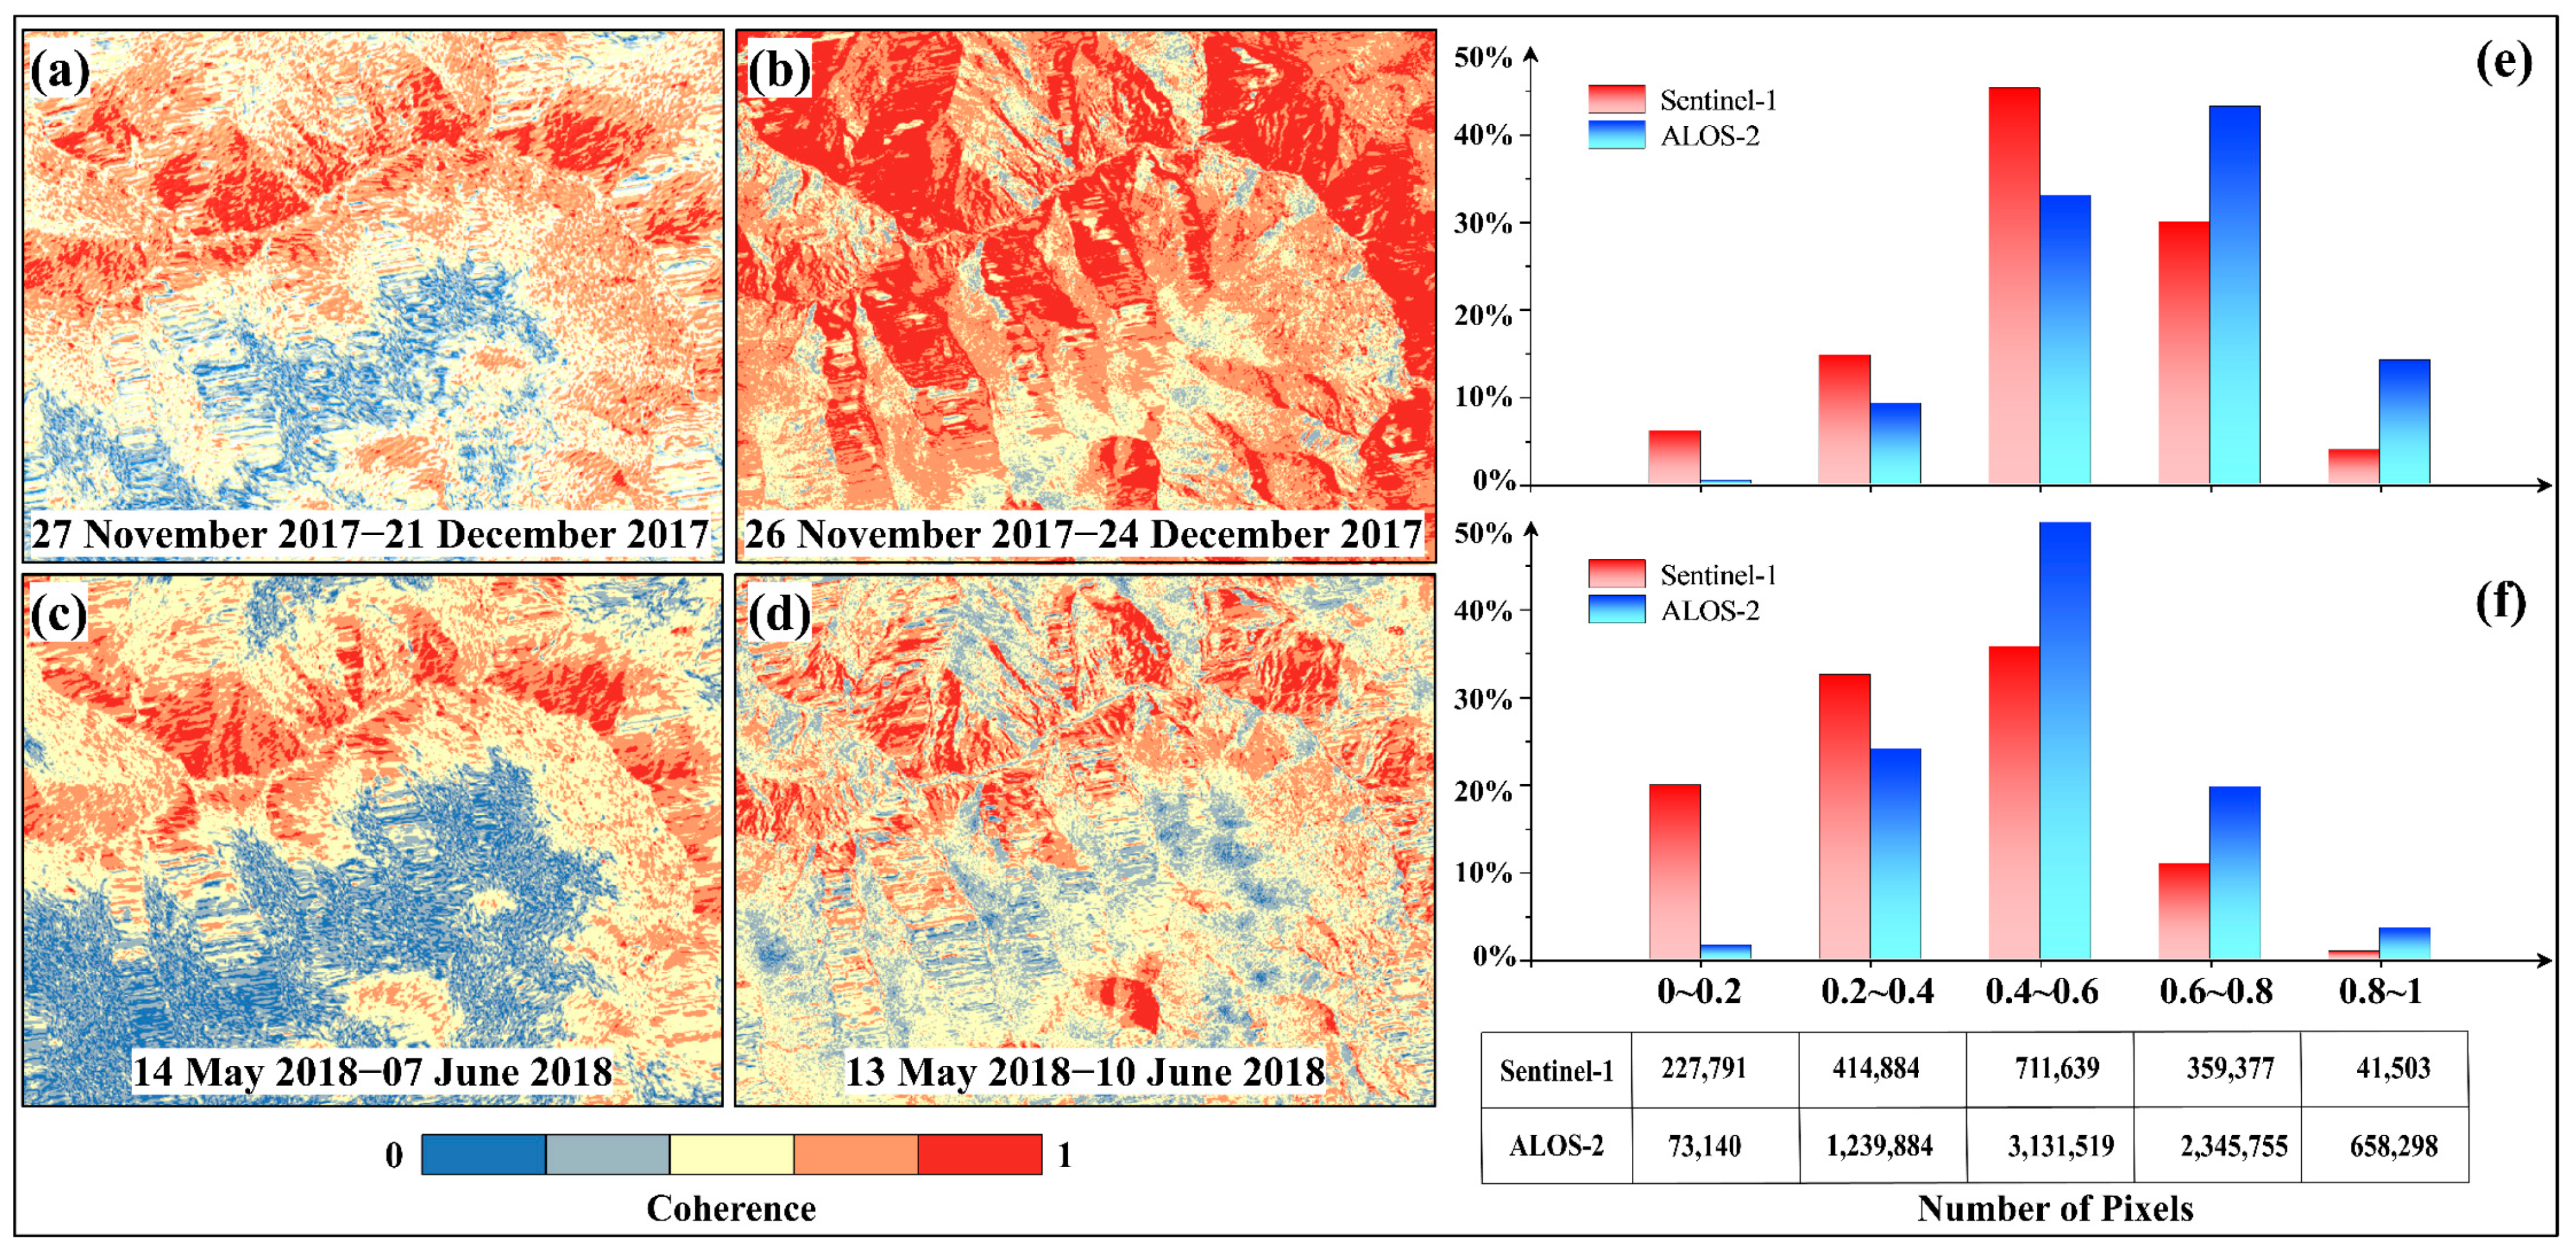
5.1. Comparative Analysis of Coherence

Due to the inconsistent revisit periods of ALOS-2 and Sentinel-1, as well as the limited availability of ALOS-2 images in this study, two interferograms with similar temporal baselines (24 days and 28 days) were selected to represent the coherence characteristics of the winter and summer seasons in this experiment (interferogram 1 and interferogram 2 in Table 3).
The four interferograms were classified into five coherence levels based on coherence intervals of 0.2, resulting in the following classification: poor (0~0.2), fair (0.2~0.4), medium (0.4~0.6), good (0.6~0.8), and high (0.8~1). This classification is illustrated in Figure 8. Figure 8a,b,e show the coherence distribution of interferogram 1 (winter season). Figure 8e shows that the coherence proportion of Sentinel-1 in the study area is 66.1%, higher than 42.6% of ALOS-2 when the coherence distribution is classified as poor, fair, and medium. However, when the coherence distribution is classified as good and high, the coherence proportion of ALOS-2 is 58.4%, surpassing that of Sentinel-1. As shown in Figure 8f, for interferogram 2 (summer season), when the coherence is categorized as medium, good, and high, the overall coherence proportion of ALOS-2 in the study area is 84.3%, which is significantly higher than the 48.6% of Sentinel-1. Moreover, according to Table 3, it can be observed that the spatial baseline of interferogram 2 from the ALOS-2 satellite is much larger than that of Sentinel-1, indicating that ALOS-2 maintains good coherence even with long spatial baselines.
Meanwhile, Figure 8 shows that the number of coherent pixels for ALOS-2 is more than four times greater than that of Sentinel-1. Specifically, in the medium, good, and high coherence categories, the pixel count for ALOS-2 is 4.8 times higher than that of Sentinel-1. These findings highlight the advantages of ALOS-2 in terms of significantly larger pixel count and better preservation of coherence; this enables early identification of potential landslides in steep mountainous regions.

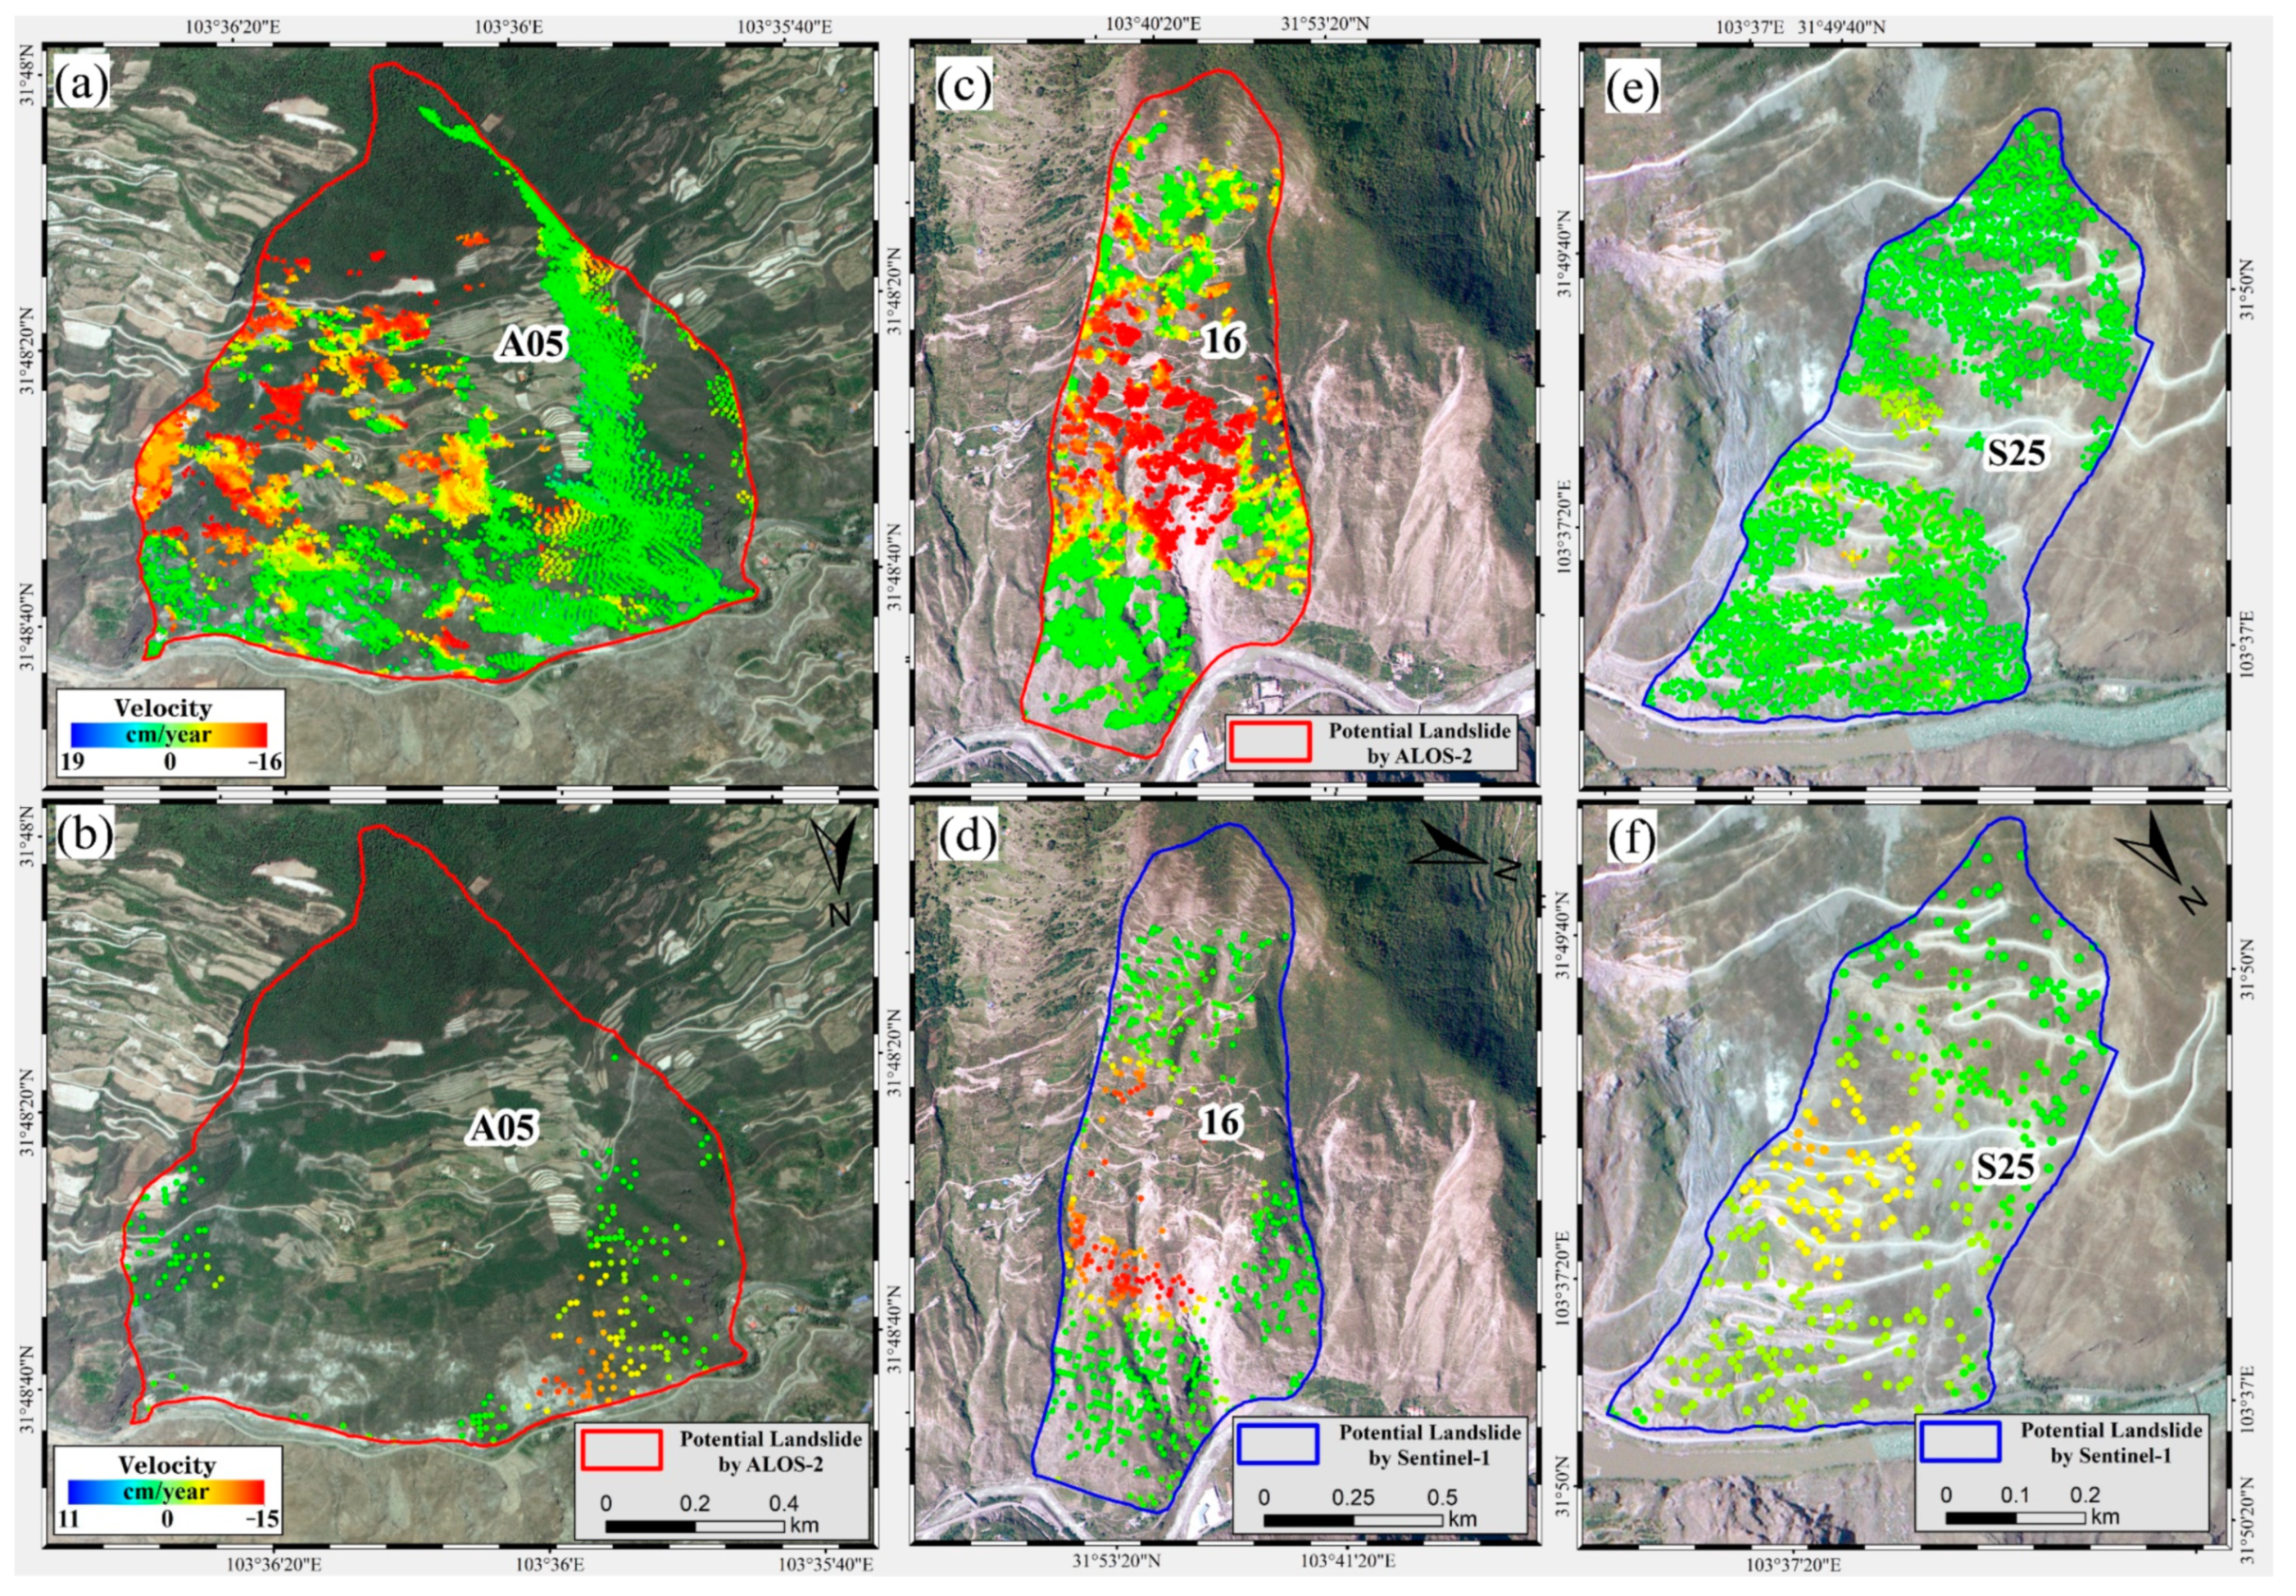
5.2. Comparative Analysis of Time Series Result

Figure 9 displays the displacement results of three representative potential landslides using various satellite data. The variations in the identification results primarily stem from the inconsistent penetration of vegetation, which is caused by differences in wavelength. These differences also lead to varying magnitudes of detectable displacement. Comparing Figure 9a with Figure 9b (red boundary shows that this potential landslide is identified only by ALOS-2), as well as Figure 9c with Figure 9d, it can be observed that when the displacement magnitudes of landslides are large, the Sentinel-1 exhibits coherence loss in the time series results, while the ALOS-2 maintains good coherence; this is because the L-band sensor carried by ALOS-2 has a longer wavelength, which enables it to penetrate vegetation and maintain better coherence. Additionally, the ALOS-2 has a higher maximum detectable displacement gradient, enabling the detection of larger magnitudes of displacement.
With the comparison of Figure 9e,f (blue boundary shows that this potential landslide is identified only by Sentinel-1), it can be observed that both Sentinel-1 and ALOS-2 cover the displacement results of potential landslide S25, suggesting a lack of vegetation in this area. In this case, the central part of the landslide shows a more noticeable displacement signal in the Sentinel-1 data, whereas it is not as prominent in the result from ALOS-2; this is primarily attributed to the small magnitudes of displacement and the longer wavelength of ALOS-2, which enables the detection of subtle displacement signals. On the other hand, the Sentinel-1, equipped with a shorter wavelength in the C-band, has a stronger ability to detect smaller displacements; this demonstrates its advantage in identifying finer details when detecting subtle displacements.

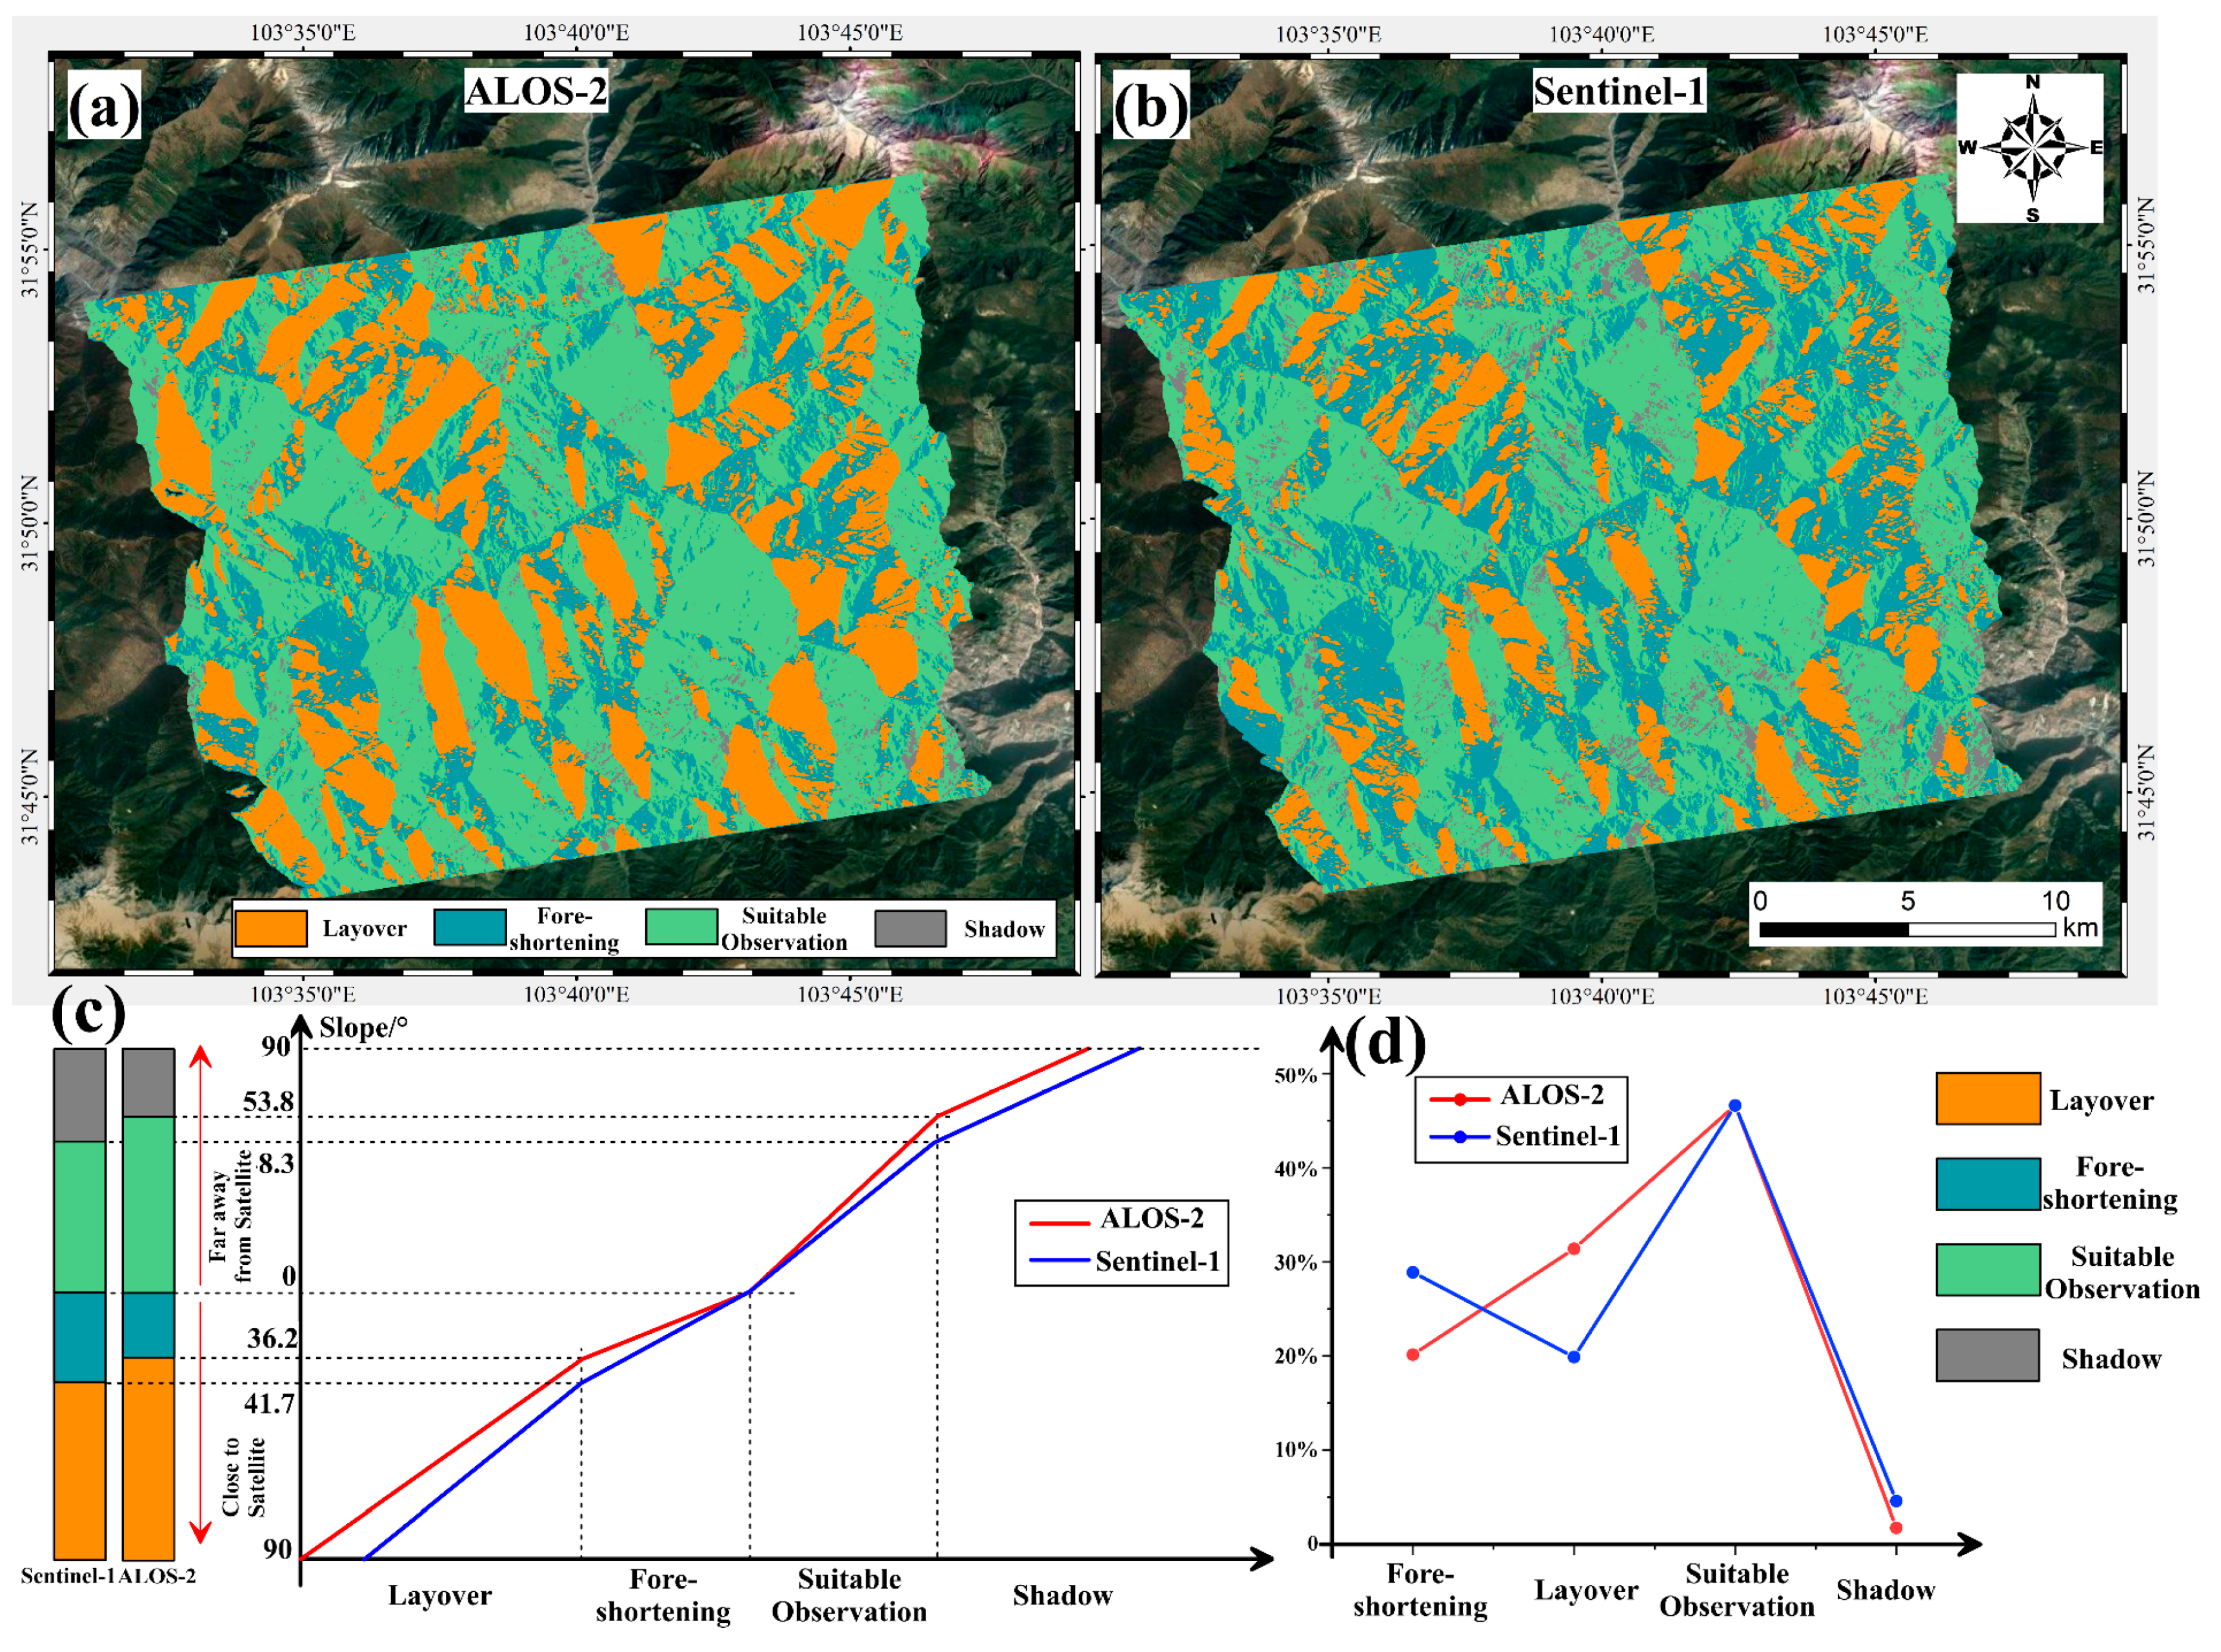
5.3. Comparative Analysis of Geometric Distortion

InSAR technology, due to its side-looking imaging characteristics, can produce geometric distortions when applied in steep mountainous areas. These distortions can be classified into four categories: foreshortening, layover, suitable observation, and shadow [30,39,40]. By retrieving satellite parameter files, we can obtain the incidence angles of both satellites. The incidence angle of the ALOS-2 is 36.2°, and the satellite azimuth angle is 344°. The incidence angle of the Sentinel-1 satellite is 41.7°, and the satellite azimuth angle is 347.23°. Based on these parameters, the geometric distortions that occur with these two satellites can be determined for any slope gradient (Figure 10c). For the Sentinel-1, foreshortening occurs when the slope faces the satellite within a gradient range of 0° to 41.7°, while layover occurs within a gradient range of 41.7° to 90°. When the slope is facing away from the satellite, suitable observation is observed for slope gradients below 48.3° (90° minus 41.7°), while shadowing occurs for slope gradients above 48.3°. For ALOS-2, foreshortening occurs when the slope faces the satellite within a gradient range of 0° to 36.2°. When the slope is facing away from the satellite, shadowing occurs for slope gradients above 53.8° (90° minus 36.2°). Comparing the geometric distortions of the two satellites, it can be observed that ALOS-2, with a smaller incidence angle, slightly outperforms Sentinel-1 in terms of applicability.
In this study, only the areas with suitable observation are classified as detectable, because the results of foreshortening can cause distortion. Therefore, foreshortening, layover, and shadowing are classified as areas that are difficult to detect. Based on the SARScape module in ENVI, the actual geometric distortions of the two datasets in the study area were obtained (Figure 10a,b). Pixel-based statistics were then performed to generate a geometric distortion statistical map of the study area (Figure 10d). The results indicate that the detectable area for Sentinel-1 covers 46.62% of the total, while the non-detectable area accounts for 53.38%. The detectable area for the ALOS-2 satellite is 46.64%. In terms of the percentage of detectable areas, the advantage of ALOS-2 is not very significant for the study area.

6. Conclusions

This study utilized SBAS−InSAR technology to conduct early identification at the intersection of the Heishui River and Min River using Sentinel-1 and ALOS-2 images and identified 28 potential landslides. To ensure accuracy, the findings were verified using optical imagery and field surveys. Furthermore, we compared the coherence of C-band and L-band SAR data in the study area, analyzed the results of displacement monitoring, and examined the distribution of geometric distortion. This study also evaluated the applicability of the multi-platform SAR data in the study area, considering the geometric distortion and wavelength differences. The main conclusions are as follows:
  • In terms of coherence distribution, ALOS-2 has a higher proportion of 57.4% in winter when coherence is above 0.6, which is much higher than that of Sentinel-1. In summer, the proportion of ALOS-2 satellites with coherence greater than 0.4 is 74.3%, which is significantly higher than the proportion of Sentinel-1. The pixel numbers with medium or higher coherence (>0.4) in ALOS-2 are 4.8 times higher than in Sentinel-1. The coherence distribution demonstrates the superiority of the ALOS-2 image in terms of the number of coherent points and the high coherence when applied to steep mountainous areas;
  • Sentinel-1 tends to lose coherence when detecting large-scale displacement, whereas ALOS-2 maintains good coherence; this demonstrates that ALOS-2 is highly effective in identifying significant displacements. However, due to its relatively shorter wavelength, Sentinel-1 performs better than ALOS-2 in identifying potential landslides with subtle displacements;
  • In the study area, the suitable observation coverage using ALOS-2 is slightly greater than that using Sentinel-1. When classifying the suitable observation areas into detectable areas and areas affected by others as non-detectable areas, the percentage of detectable areas using ALOS-2 is 46.64%, where no significant difference was observed between the two satellites.

Author Contributions

All the authors participated in editing and reviewing the manuscript. Conceptualization, K.D., L.C. and H.X.; methodology, J.D., N.W. and K.D.; software, J.D., R.L. and N.W.; data analysis, J.D., K.D., R.L., G.Z. and N.W. Validation, J.D., N.W., R.L. and K.D. All authors have read and agreed to the published version of the manuscript.

Funding

This research is funded by the National Key Research and Development Program of China (Grant No. 2021YFB3901403), the National Natural Science Foundation of China (Grant No. 42371462), Sichuan Province Science Fund for Distinguished Young Scholars (2023NSFSC1909), the Fellowship of China Postdoctoral Science Foundation (Grant No. 2020M673322), the State Key Laboratory of Geohazard Prevention and Geoenvironment Protection Independent Research Project (Grant No. SKLGP2020Z012), and the Open Research Fund Program of MNR Key Laboratory for Geo-Environmental Monitoring of Great Bay Area: 20220006.

Data Availability Statement

The Sentinel-1 data used in this study are downloaded from the European Space Agency (ESA) through the ASF Data Hub website (https://vertex.daac.asf.alaska.edu) (accessed on 3 June 2023). The DEM data used in this study is available at https://earthexplorer.usgs.gov/ (accessed on 3 June 2023). The optical remote sensing imagery used in this study is available at https://earth.google.com/web/ (accessed on 3 June 2023).

Conflicts of Interest

The authors declare no conflict of interest.

References

  1. Ma, H.; Wu, Y.; Feng, J.; Xu, R.; Wu, S.; Wang, Q. Research on Recent GPS Crustal Deformation Characteristics in the Northeastern Edge of Qinghai-Tibet Plateau. J. Phys. Conf. Ser. 2017, 910, 012028. [Google Scholar] [CrossRef]
  2. Zhang, P. A review on active tectonics and deep crustal processes of the Western Sichuan region, eastern margin of the Tibetan Plateau. Tectonophysics 2013, 584, 7–22. [Google Scholar] [CrossRef]
  3. Del Soldato, M.; Bianchini, S.; Calcaterra, D.; De Vita, P.; Martire, D.D.; Tomás, R.; Casagli, N. A new approach for landslide-induced damage assessment. Geomat. Nat. Hazards Risk 2017, 8, 1524–1537. [Google Scholar] [CrossRef]
  4. Kang, Y.; Lu, Z.; Zhao, C.; Zhang, Q.; Kim, J.-W.; Niu, Y. Diagnosis of Xinmo (China) landslide based on interferometric synthetic aperture radar observation and modeling. Remote Sens. 2019, 11, 1846. [Google Scholar] [CrossRef]
  5. Li, X.; Kong, J.; Wang, Z. Landslide displacement prediction based on combining method with optimal weight. Nat. Hazards 2011, 61, 635–646. [Google Scholar] [CrossRef]
  6. Liu, X.; Zhao, C.; Zhang, Q.; Yang, C.; Zhu, W. Heifangtai loess landslide type and failure mode analysis with ascending and descending Spot-mode TerraSAR-X datasets. Landslides 2019, 17, 205–215. [Google Scholar] [CrossRef]
  7. Schuster, R.L.; Highland, L.M. The Third Hans Cloos Lecture. Urban landslides: Socioeconomic impacts and overview of mitigative strategies. Bull. Eng. Geol. Environ. 2007, 66, 1–27. [Google Scholar] [CrossRef]
  8. Edelstein, W.N.; Madsen, S.N.; Moussessian, A.; Chen, C. Concepts and technologies for synthetic aperture radar from MEO and geosynchronous orbits. In Proceedings of the Fourth International Asia-Pacific Environmental Remote Sensing Symposium 2004: Remote Sensing of the Atmosphere, Ocean, Environment, and Space, Honolulu, HI, USA, 11 January 2005; Volume 5659, pp. 195–203. [Google Scholar]
  9. Liao, M.; Lin, H. Synthetic Aperture Radar Interferometry-Principle and Signal Processing; Surveying and Mapping Press: Beijing, China, 2003; p. 167. [Google Scholar]
  10. Zhang, L.; Dai, K.; Deng, J.; Ge, D.; Liang, R.; Li, W.; Xu, Q. Identifying potential landslides by Stacking-InSAR in southwestern China and its performance comparison with SBAS-InSAR. Remote Sens. 2021, 13, 3662. [Google Scholar] [CrossRef]
  11. Rosi, A.; Tofani, V.; Tanteri, L.; Tacconi Stefanelli, C.; Agostini, A.; Catani, F.; Casagli, N. The new landslide inventory of Tuscany (Italy) updated with PS-InSAR: Geomorphological features and landslide distribution. Landslides 2018, 15, 5–19. [Google Scholar] [CrossRef]
  12. Wasowski, J.; Bovenga, F. Investigating landslides and unstable slopes with satellite Multi temporal interferometry: Current issues and future perspectives. Eng. Geol. 2014, 174, 103–138. [Google Scholar] [CrossRef]
  13. Zhao, C.; Lu, Z.; Zhang, Q.; Fuente, J.d.l. Large-area landslide detection and monitoring with ALOS/PALSAR imagery data over Northern California and Southern Oregon, USA. Remote Sens. Environ. 2012, 124, 348–359. [Google Scholar] [CrossRef]
  14. Zhao, C.; Zhang, Q.; Yin, Y.; Lu, Z.; Yang, C.; Zhu, W.; Li, B. Pre-, co-, and post- rockslide analysis with ALOS/PALSAR imagery: A case study of the Jiweishan rockslide, China. Nat. Hazards Earth Syst. Sci. 2013, 13, 2851–2861. [Google Scholar] [CrossRef]
  15. Canuti, P.; Casagli, N.; Catani, F.; Falorni, G.; Farina, P. Integration of remote sensing techniques in different stages of landslide response. In Progress in Landslide Science; Sassa, K., Fukuoka, H., Wang, F., Wang, G., Eds.; Springer: Berlin/Heidelberg, Germany, 2007; pp. 251–260. [Google Scholar] [CrossRef]
  16. Schlögel, R.; Doubre, C.; Malet, J.-P.; Masson, F. Landslide deformation monitoring with ALOS/PALSAR imagery: A D-InSAR geomorphological interpretation method. Geomorphology 2015, 231, 314–330. [Google Scholar] [CrossRef]
  17. Wicks Jr, C.; Thatcher, W.; Dzurisin, D. Migration of fluids beneath Yellowstone caldera inferred from satellite radar interferometry. Science 1998, 282, 458–462. [Google Scholar] [CrossRef] [PubMed]
  18. Zhao, F.; Mallorqui, J.J.; Iglesias, R.; Gili, J.A.; Corominas, J. Landslide monitoring using multi-temporal SAR interferometry with advanced persistent scatterers identification methods and super high-spatial resolution TerraSAR-X images. Remote Sens. 2018, 10, 921. [Google Scholar] [CrossRef]
  19. Esch, T.; Heldens, W.; Hirner, A.; Keil, M.; Marconcini, M.; Roth, A.; Zeidler, J.; Dech, S.; Strano, E. Breaking new ground in mapping human settlements from space–The Global Urban Footprint. ISPRS J. Photogramm. Remote Sens. 2017, 134, 30–42. [Google Scholar] [CrossRef]
  20. Kankaku, Y.; Suzuki, S.; Osawa, Y. ALOS-2 mission and development status. In Proceedings of the 2013 IEEE International Geoscience and Remote Sensing Symposium–IGARSS, Melbourne, Australia, 21–26 July 2013; pp. 2396–2399. [Google Scholar] [CrossRef]
  21. Lindsey, E.O.; Natsuaki, R.; Xu, X.; Shimada, M.; Hashimoto, M.; Melgar, D.; Sandwell, D.T. Line-of-sight displacement from ALOS-2 interferometry: Mw 7.8 Gorkha Earthquake and Mw 7.3 aftershock. Geophys. Res. Lett. 2015, 42, 6655–6661. [Google Scholar] [CrossRef]
  22. Ng, A.H.-M.; Ge, L.; Li, X.; Zhang, K. Monitoring ground deformation in Beijing, China with persistent scatterer SAR interferometry. J. Geod. 2012, 86, 375–392. [Google Scholar] [CrossRef]
  23. Wempen, J.M.; McCarter, M.K. Comparison of L-band and X-band differential interferometric synthetic aperture radar for mine subsidence monitoring in central Utah. Int. J. Min. Sci. Technol. 2017, 27, 159–163. [Google Scholar] [CrossRef]
  24. Werninghaus, R.; Buckreuss, S. The TerraSAR-X mission and system design. IEEE Trans. Geosci. Remote Sens. 2010, 48, 606–614. [Google Scholar] [CrossRef]
  25. Dong, J.; Zhang, L.; Li, M.; Yu, Y.; Liao, M.; Gong, J.; Luo, H. Measuring precursory movements of the recent Xinmo landslide in Mao County, China with Sentinel-1 and ALOS-2 PALSAR-2 datasets. Landslides 2017, 15, 135–144. [Google Scholar] [CrossRef]
  26. Lu, H.; Li, W.; Xu, Q.; Dong, X.; Dai, C.; Wang, D. Early detection of landslides in the upstream and downstream areas of the Baige Landslide, the Jinsha River based on optical remote sensing and InSAR technologies. Geomat. Inf. Sci. Wuhan Univ. 2019, 44, 1342–1354. [Google Scholar] [CrossRef]
  27. Herrera, G.; Gutiérrez, F.; García-Davalillo, J.; Guerrero, J.; Notti, D.; Galve, J.; Fernández-Merodo, J.; Cooksley, G. Multi-sensor advanced DInSAR monitoring of very slow landslides: The Tena Valley case study (Central Spanish Pyrenees). Remote Sens. Environ. 2013, 128, 31–43. [Google Scholar] [CrossRef]
  28. Zhang, L.; Liao, M.; Dong, J.; Xu, Q.; Gong, J. Early detection of landslide hazards in mountainous areas of west China using time series SAR interferometry: A case study of Danba, Sichuan. Geomat. Inf. Sci. Wuhan Univ. 2018, 43, 2039–2049. [Google Scholar] [CrossRef]
  29. Dai, K.; Deng, J.; Xu, Q.; Li, Z.; Shi, X.; Hancock, C.; Wen, N.; Zhang, L.; Zhuo, G. Interpretation and sensitivity analysis of the InSAR line of sight displacements in landslide measurements. GIScience Remote Sens. 2022, 59, 1226–1242. [Google Scholar] [CrossRef]
  30. Dai, K.; Li, Z.; Xu, Q.; Bürgmann, R.; Milledge, D.G.; Tomas, R.; Fan, X.; Zhao, C.; Liu, X.; Peng, J. Entering the era of earth observation-based landslide warning systems: A novel and exciting framework. IEEE Geosci. Remote Sens. Mag. 2020, 8, 136–153. [Google Scholar] [CrossRef]
  31. Dai, K.; Xu, Q.; Li, Z.; Tomás, R.; Fan, X.; Dong, X.; Li, W.; Zhou, Z.; Gou, J.; Ran, P. Post-disaster assessment of 2017 catastrophic Xinmo landslide (China) by spaceborne SAR interferometry. Landslides 2019, 16, 1189–1199. [Google Scholar] [CrossRef]
  32. Poursanidis, D.; Chrysoulakis, N. Remote Sensing, natural hazards and the contribution of ESA Sentinels missions. Remote Sens. Appl. Soc. Environ. 2017, 6, 25–38. [Google Scholar] [CrossRef]
  33. Farr, T.G.; Rosen, P.A.; Caro, E.; Crippen, R.; Duren, R.; Hensley, S.; Kobrick, M.; Paller, M.; Rodriguez, E.; Roth, L.; et al. The shuttle radar topography mission. Rev. Geophys. 2007, 45, RG2004. [Google Scholar] [CrossRef]
  34. Lanari, R.; Mora, O.; Manunta, M.; Mallorquí, J.J.; Berardino, P.; Sansosti, E. A small-baseline approach for investigating deformations on full-resolution differential SAR interferograms. IEEE Trans. Geosci. Remote Sens. 2004, 42, 1377–1386. [Google Scholar] [CrossRef]
  35. Mora, O.; Mallorqui, J.J.; Broquetas, A. Linear and nonlinear terrain deformation maps from a reduced set of interferometric SAR images. IEEE Trans. Geosci. Remote Sens. 2003, 41, 2243–2253. [Google Scholar] [CrossRef]
  36. Berardino, P.; Fornaro, G.; Lanari, R.; Sansosti, E. A new algorithm for surface deformation monitoring based on small baseline differential SAR interferograms. IEEE Trans. Geosci. Remote Sens. 2002, 40, 2375–2383. [Google Scholar] [CrossRef]
  37. Dai, K.; Feng, Y.; Zhuo, G.; Tie, Y.; Deng, J.; Balz, T.; Li, Z. Applicability analysis of potential landslide identification by InSAR in alpine-canyon terrain—Case study on Yalong River. IEEE J. Sel. Top. Appl. Earth Obs. Remote Sens. 2022, 15, 2110–2118. [Google Scholar] [CrossRef]
  38. Dai, K.; Zhang, L.; Song, C.; Li, Z.; Zhuo, G.; Xu, Q. Quantitative analysis of sentinel-1 imagery geometric distortion and their suitability along Sichuan-Tibet Railway. Geomat. Inf. Sci. Wuhan Univ. 2021, 46, 1450–1460. (In Chinese) [Google Scholar]
  39. Notti, D.; Herrera, G.; Bianchini, S.; Meisina, C.; García-Davalillo, J.C.; Zucca, F. A methodology for improving landslide PSI data analysis. Int. J. Remote Sens. 2014, 35, 2186–2214. [Google Scholar] [CrossRef]
  40. Notti, D.; Meisina, C.; Zucca, F.; Colombo, A. Models to predict Persistent Scatterers data distribution and their capacity to register movement along the slope. In Proceedings of the Fringe 2011 Workshop, Frascati, Italy, 19–23 September 2011; pp. 19–23. Available online: https://earth.esa.int/eogateway/documents/20142/37627/Models_predict_persistent_scatterers_data_distribution.pdf (accessed on 5 July 2023).
Figure 1. Overview of the study area; (a) geographic location of the study area; (b) fault distribution; and (c) topography of the study area.
Remotesensing 15 04538 g001
Figure 2. (a) Temporal–spatial baseline of Sentinel-1; (b) temporal–spatial baseline of ALOS-2.
Remotesensing 15 04538 g002
Figure 3. Flowchart of the study.
Remotesensing 15 04538 g003
Figure 4. (a) Annual velocity map from ALOS-2; (b) annual velocity map from Sentinel-1.
Remotesensing 15 04538 g004
Figure 5. (a) Annual velocity map of potential landslides A21 to A23; (bg) field verification images of potential landslides A21 to A23.
Remotesensing 15 04538 g005
Figure 6. (a) Annual velocity map of potential landslides A12; (be) field verification images of potential landslides A12.
Remotesensing 15 04538 g006
Figure 7. (a) Annual velocity map of potential landslides A17; (bd) field verification images of potential landslides A17.
Remotesensing 15 04538 g007
Figure 8. Coherence distribution and comparison plot of ALOS-2 and Sentinel-1; (a,b) coherence map of interferogram 1; (c,d) coherence map of interferogram 2; (a,c) is from Sentinel-1, (b,d) are from ALOS-2; (e) coherence distribution of interferogram 1; and (f) coherence distribution of interferogram 2.
Remotesensing 15 04538 g008
Figure 9. Comparative analysis of time series result; (a,c,e) annual velocity map from ALOS-2; (b,d,f) annual velocity map from Sentinel-1.
Remotesensing 15 04538 g009
Figure 10. Geometric distortion comparison maps: (a) ALOS-2 geometric distortion distribution; (b) Sentinel-1 geometric distortion distribution; (c) geometric distortion classification; and (d) geometric distortion comparison.
Remotesensing 15 04538 g010
Table 1. Main parameters of the two experimental data.
ParametersSentinel-1ALOS-2
OrbitAscendingAscending
BandCL
PolarizationVVHH
Wavelength (cm)5.623.6
Resolution (m)13.9/3.52.03/2.42
Revisit (day)1214
Incident angle (°)41.69636.18
Azimuth angle (°)−12.77−16
Time span27 November 2017−17 October 201826 November 2017−14 October 2018
Number of images2810
Table 2. Parameters in the data processing workflow.
ParameterSentinel-1ALOS-2
MethodSBAS–InSARSBAS–InSAR
Multi-look4:13:3
Unwrapping0.20.2
Filtering Method and ParametersGoldstein, 3−5Goldstein, 3−5
Unwrapping MethodMinimum Cost FlowMinimum Cost Flow
Table 3. Typical interference pairs of Sentinel-1 and ALOS-2.
SatelliteInterferogram 1 (Winter)Temporal
Baseline
(Day)
Normal
Baseline
(m)
Interferogram 2 (Summer)Temporal
Baseline
(Day)
Normal
Baseline
(m)
Sentinel-127 November 2017–21 December 201724102.65414 May 2018–7 June 20182425.317
ALOS-226 November 2017–24 December 2017286.45813 May 2018–10 June 201828211.359
Disclaimer/Publisher’s Note: The statements, opinions and data contained in all publications are solely those of the individual author(s) and contributor(s) and not of MDPI and/or the editor(s). MDPI and/or the editor(s) disclaim responsibility for any injury to people or property resulting from any ideas, methods, instructions or products referred to in the content.

