


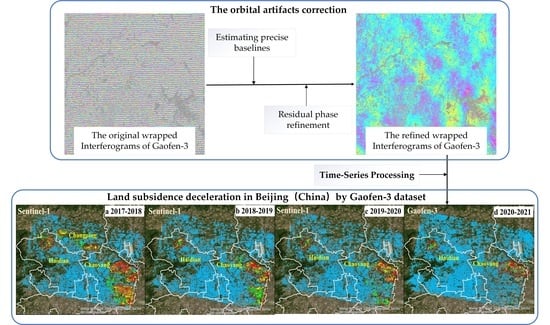
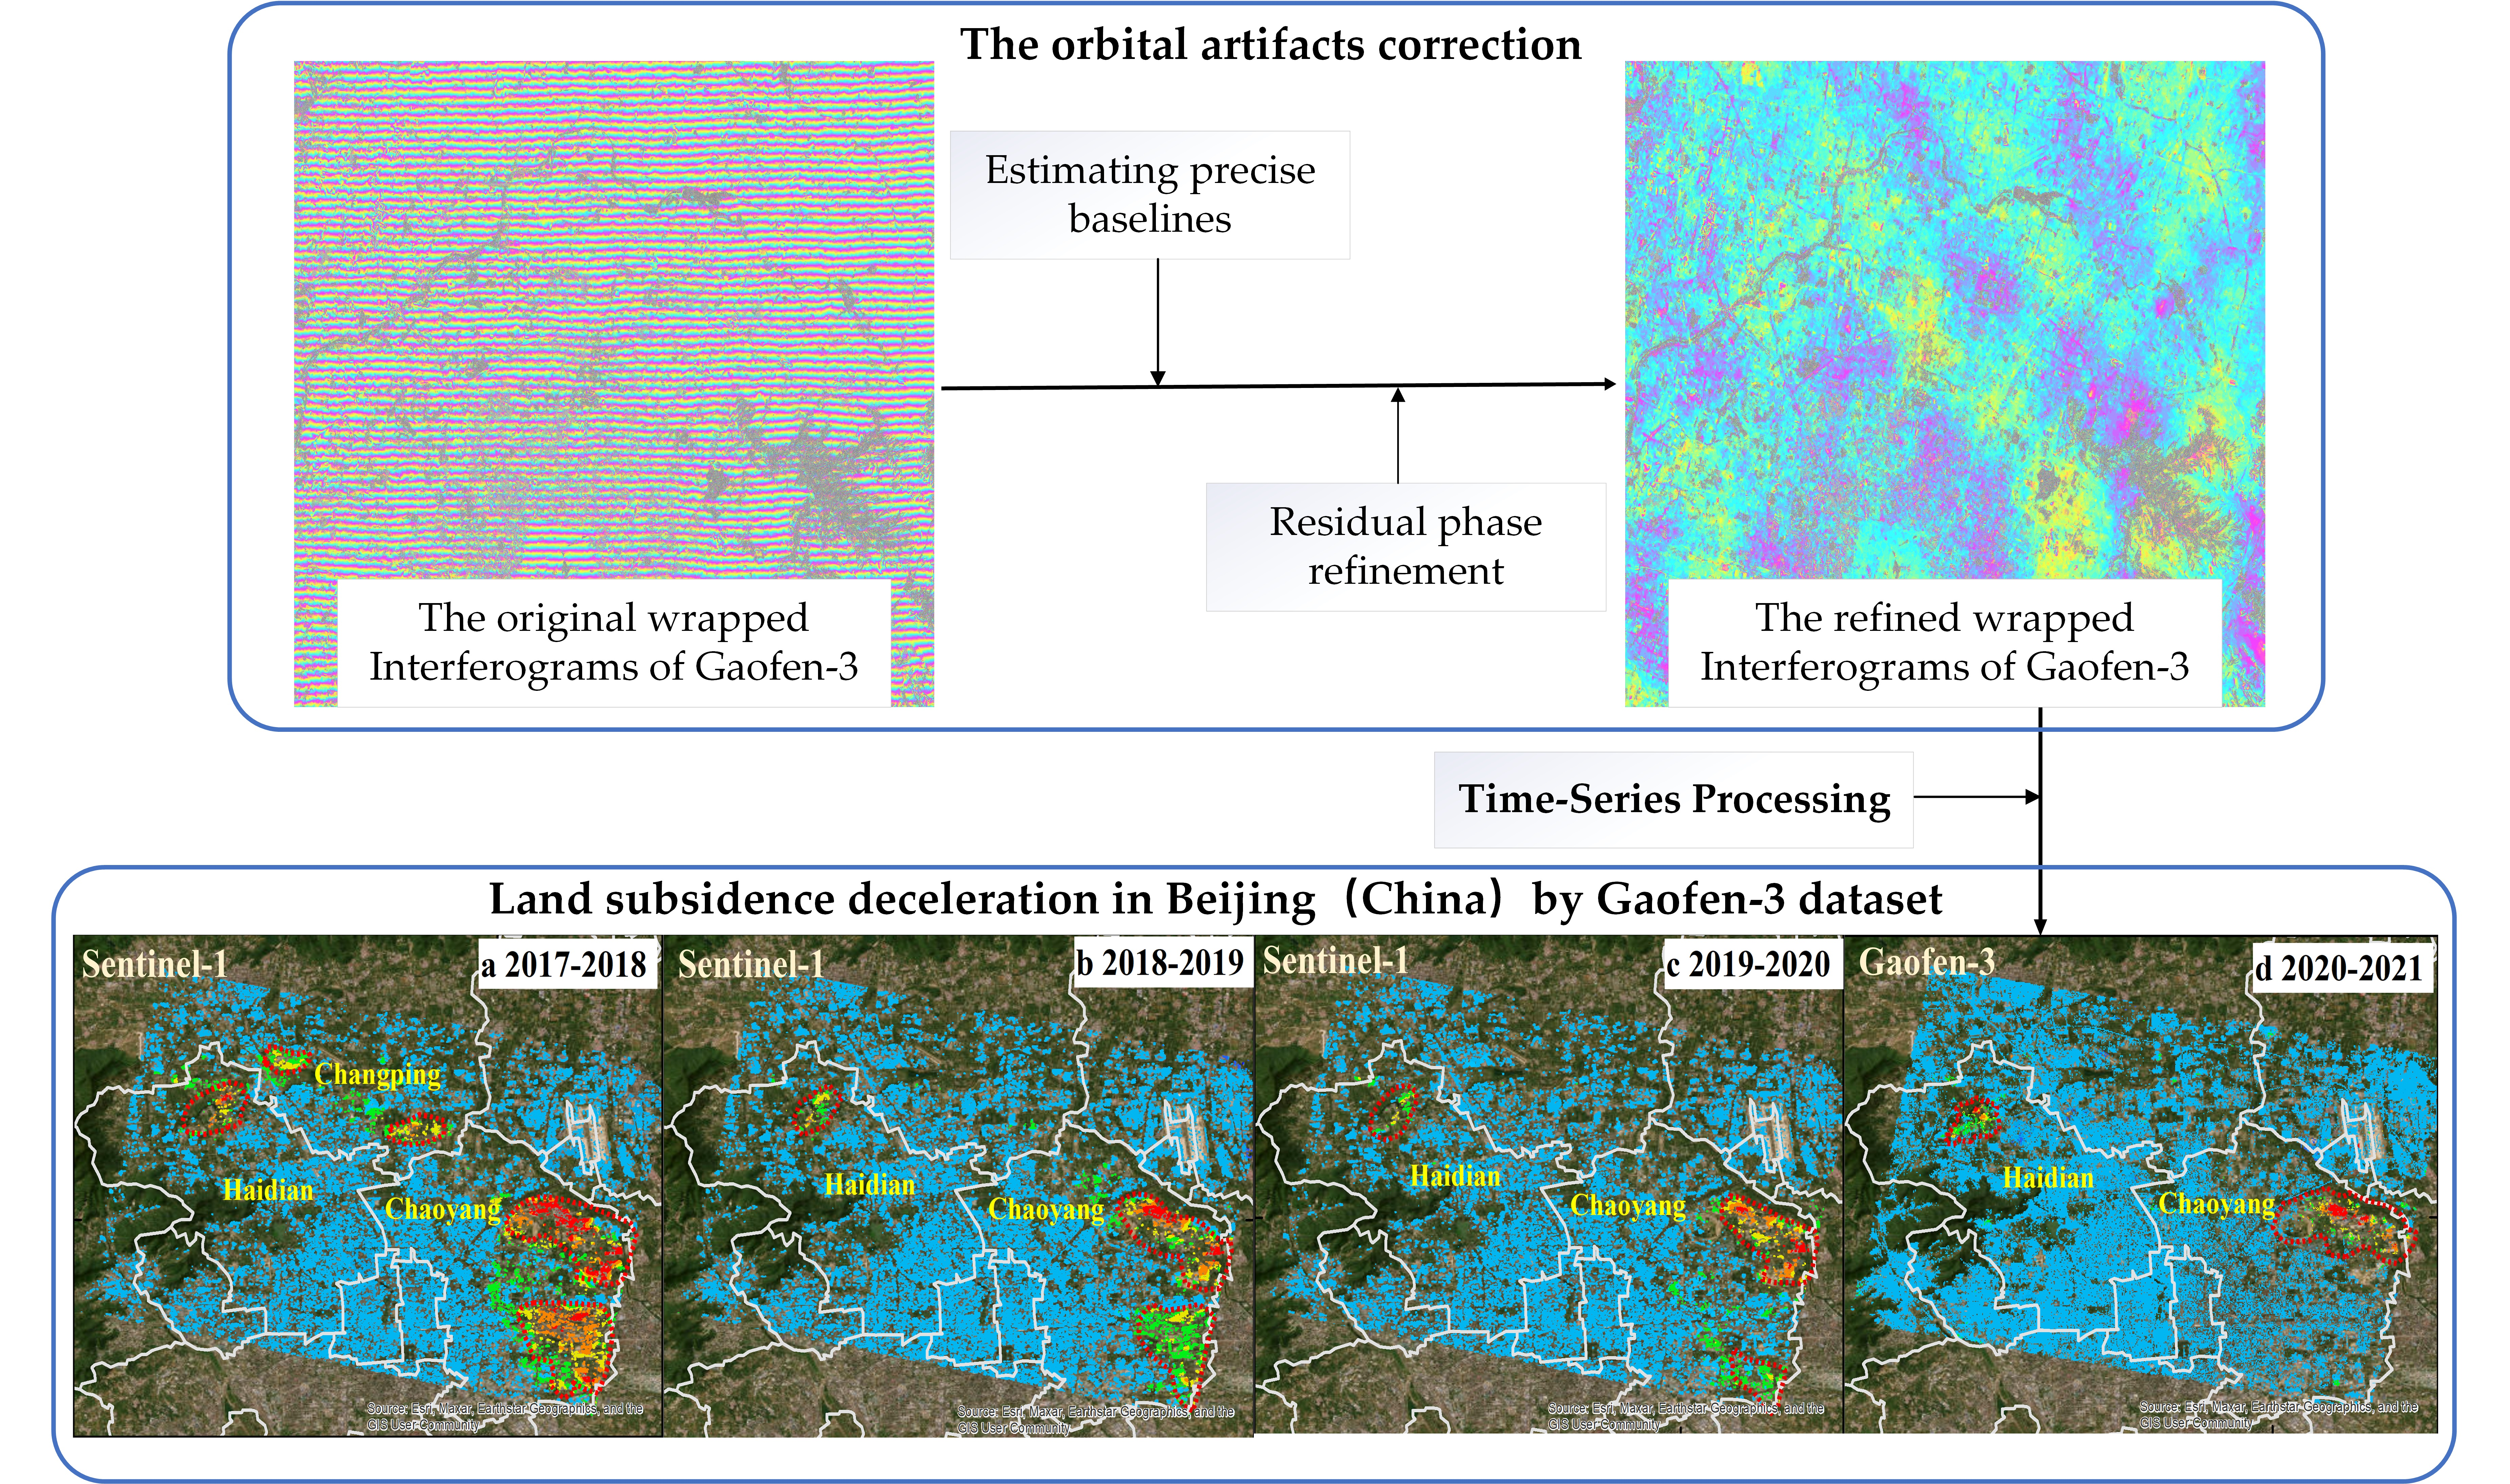
Revealing the Land Subsidence Deceleration in Beijing (China) by Gaofen-3 Time Series Interferometry
 ,
,  , ,
, ,
Abstract
:
1. Introduction

| SAR Datasets | Time Range | Resolution | Maximum Subsidence Velocity | Studies |
|---|---|---|---|---|
| ERS-1/2 | 1992–2000 | 25 m | −48 mm/a | Zhang et al., 2016 [19] |
| Envisat | 2003–2010 | 30 m | −143 mm/a | Chen et al., 2017; Guo et al., 2020; Zhu et al., 2020 [20,21,22] |
| ALOS-1 | 2007–2011 | 10 m | −120 mm/a | Du et al., 2021; Liang et al., 2013; Ng et al., 2012 [23,24,25] |
| Radarsat-2 | 2010–2016 | 30 m | −141 mm/a | Chen et al., 2020; Zhang et al., 2022; Zhou et al., 2019 [26,27,28] |
| TerraSAR-X | 2010–2019 | 3 m | −117 mm/a | Bai et al., 2022; Chen et al., 2017; Zhou et al., 2022 [20,29,30] |
| ALOS-2 | 2014–2017 | 10 m/60 m | −150 mm/a | Du et al., 2018; Liu et al., 2021; Ning et al., 2019 [31,32,33] |
| Sentinel-1 | 2014–2020 | 20 m | −135 mm/a | Hu et al., 2019; Zhang et al., 2022; Zhu et al. 2020. [22,27,34] |
| Gaofen-3 | 2020–2021 | 3 m | −80 mm/a | This study |
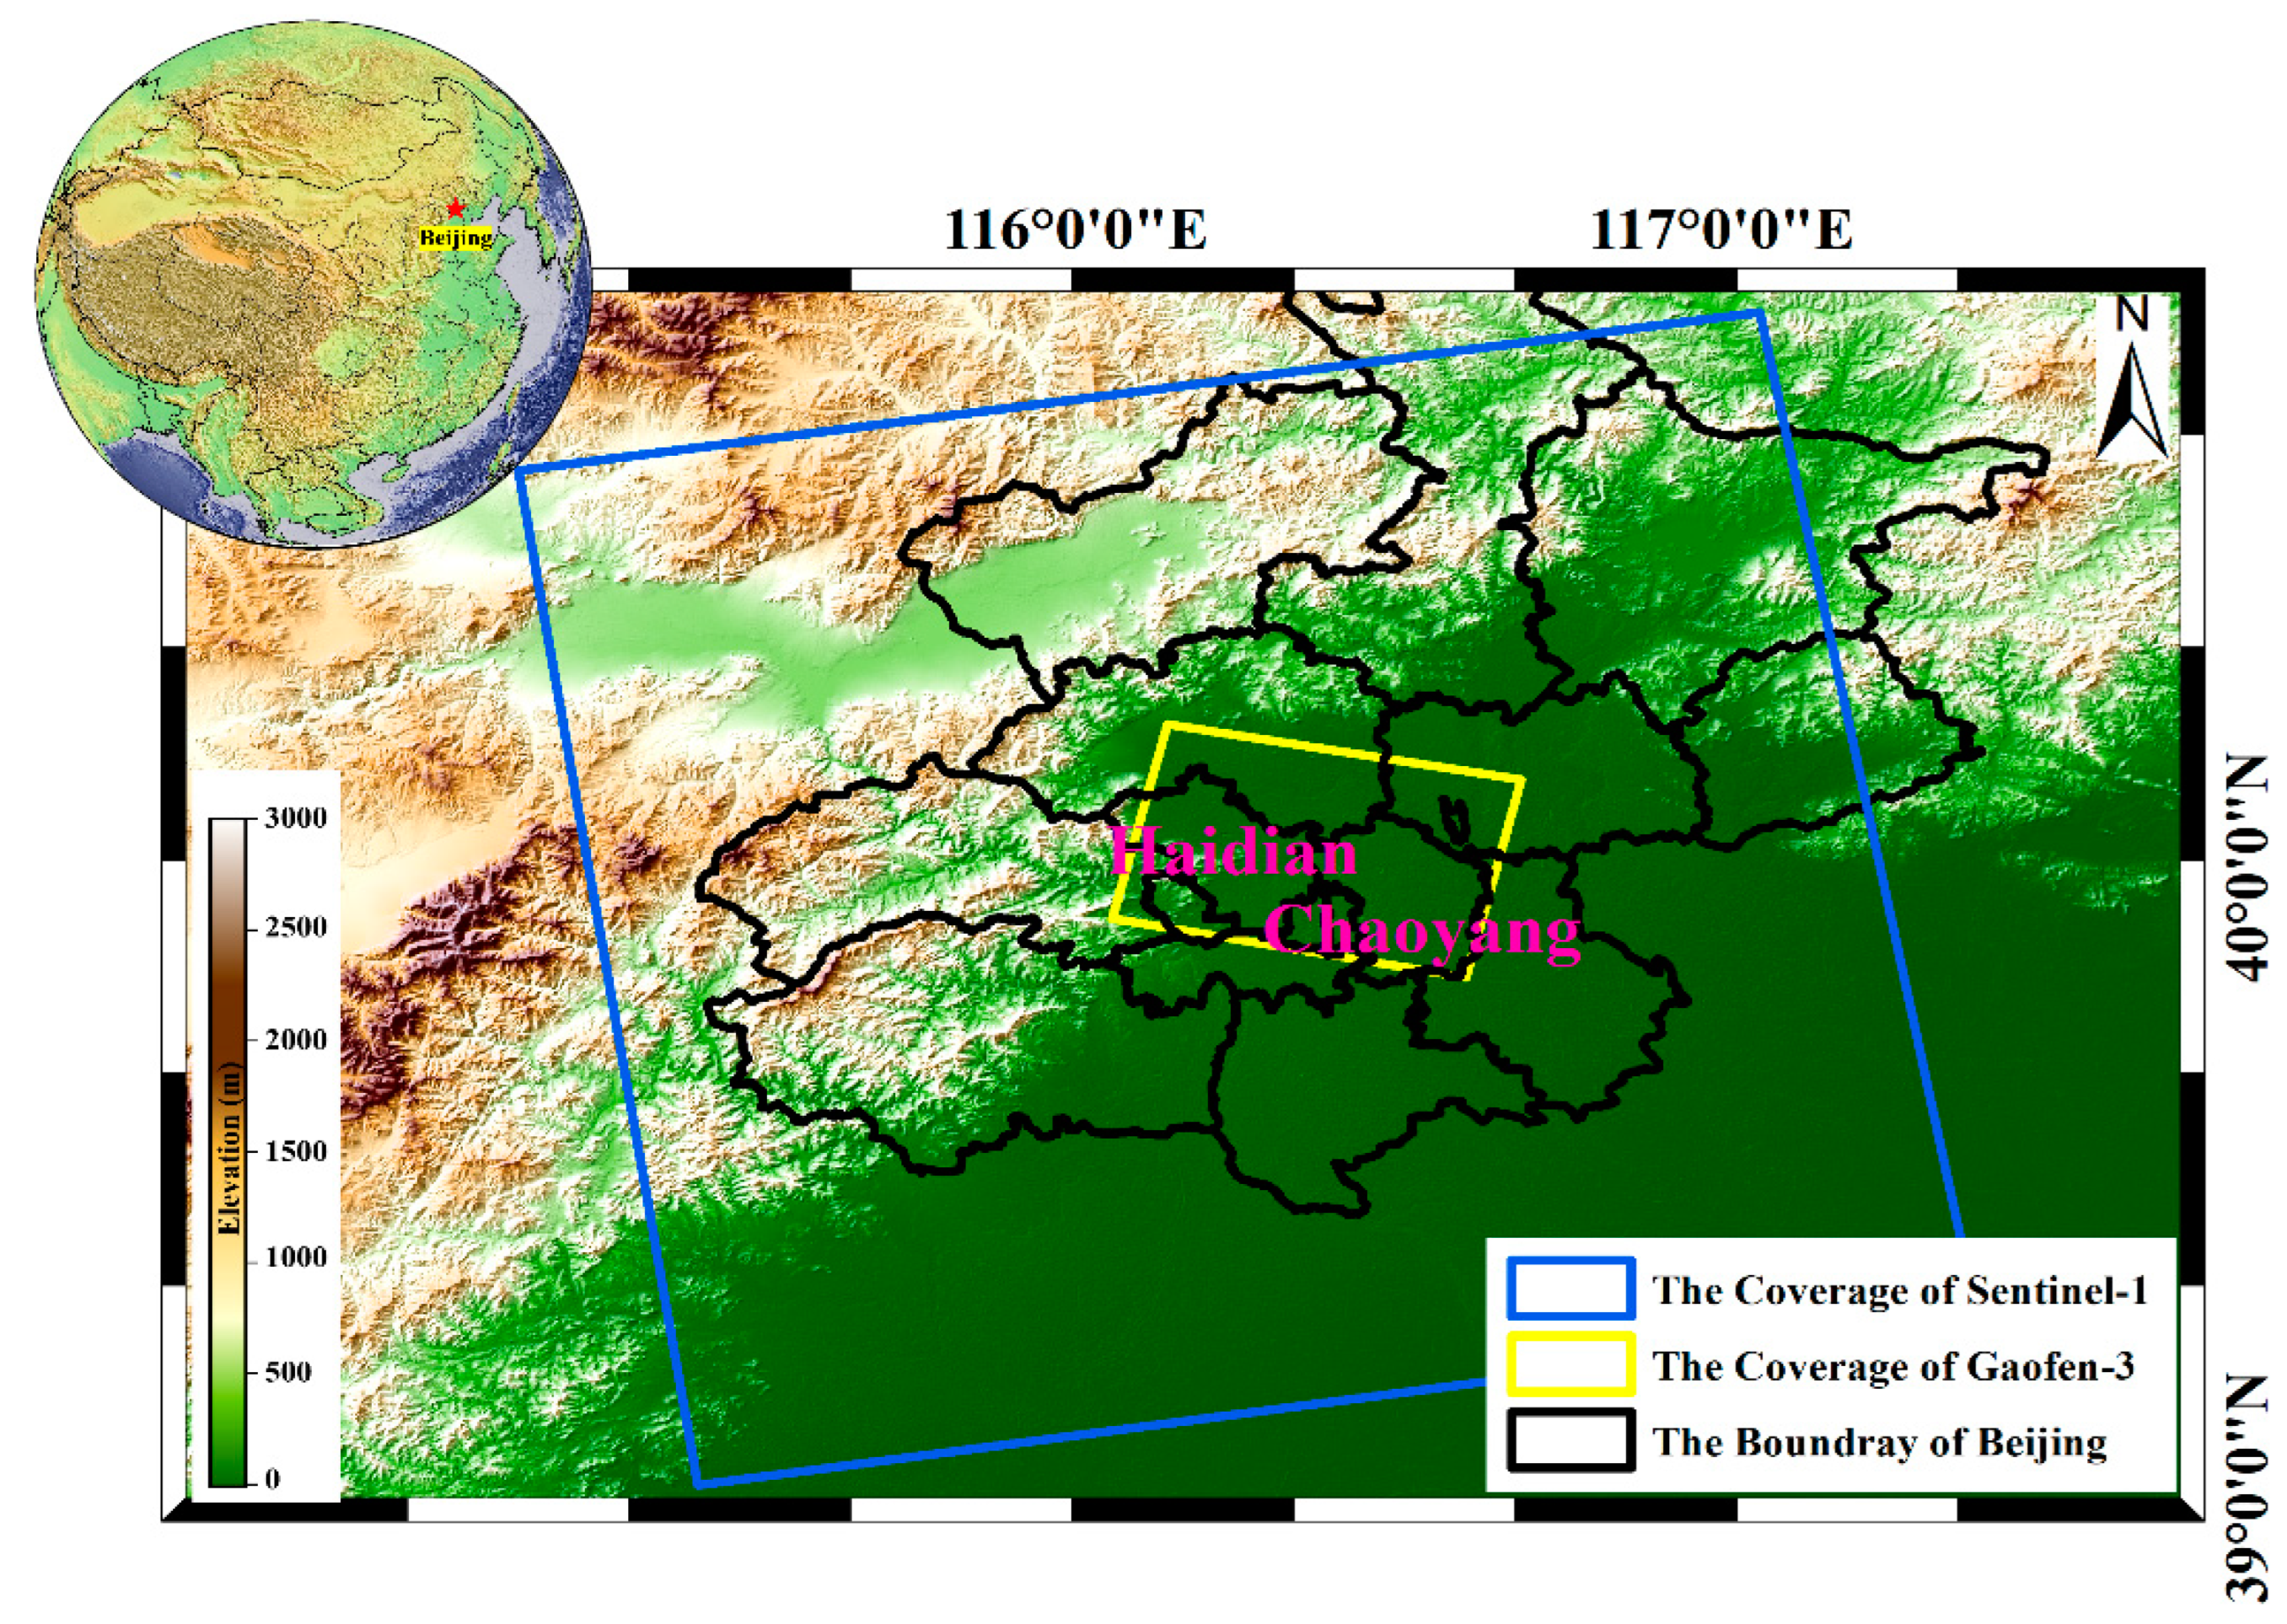
2. Study Area and Datasets
2.1. Study Area
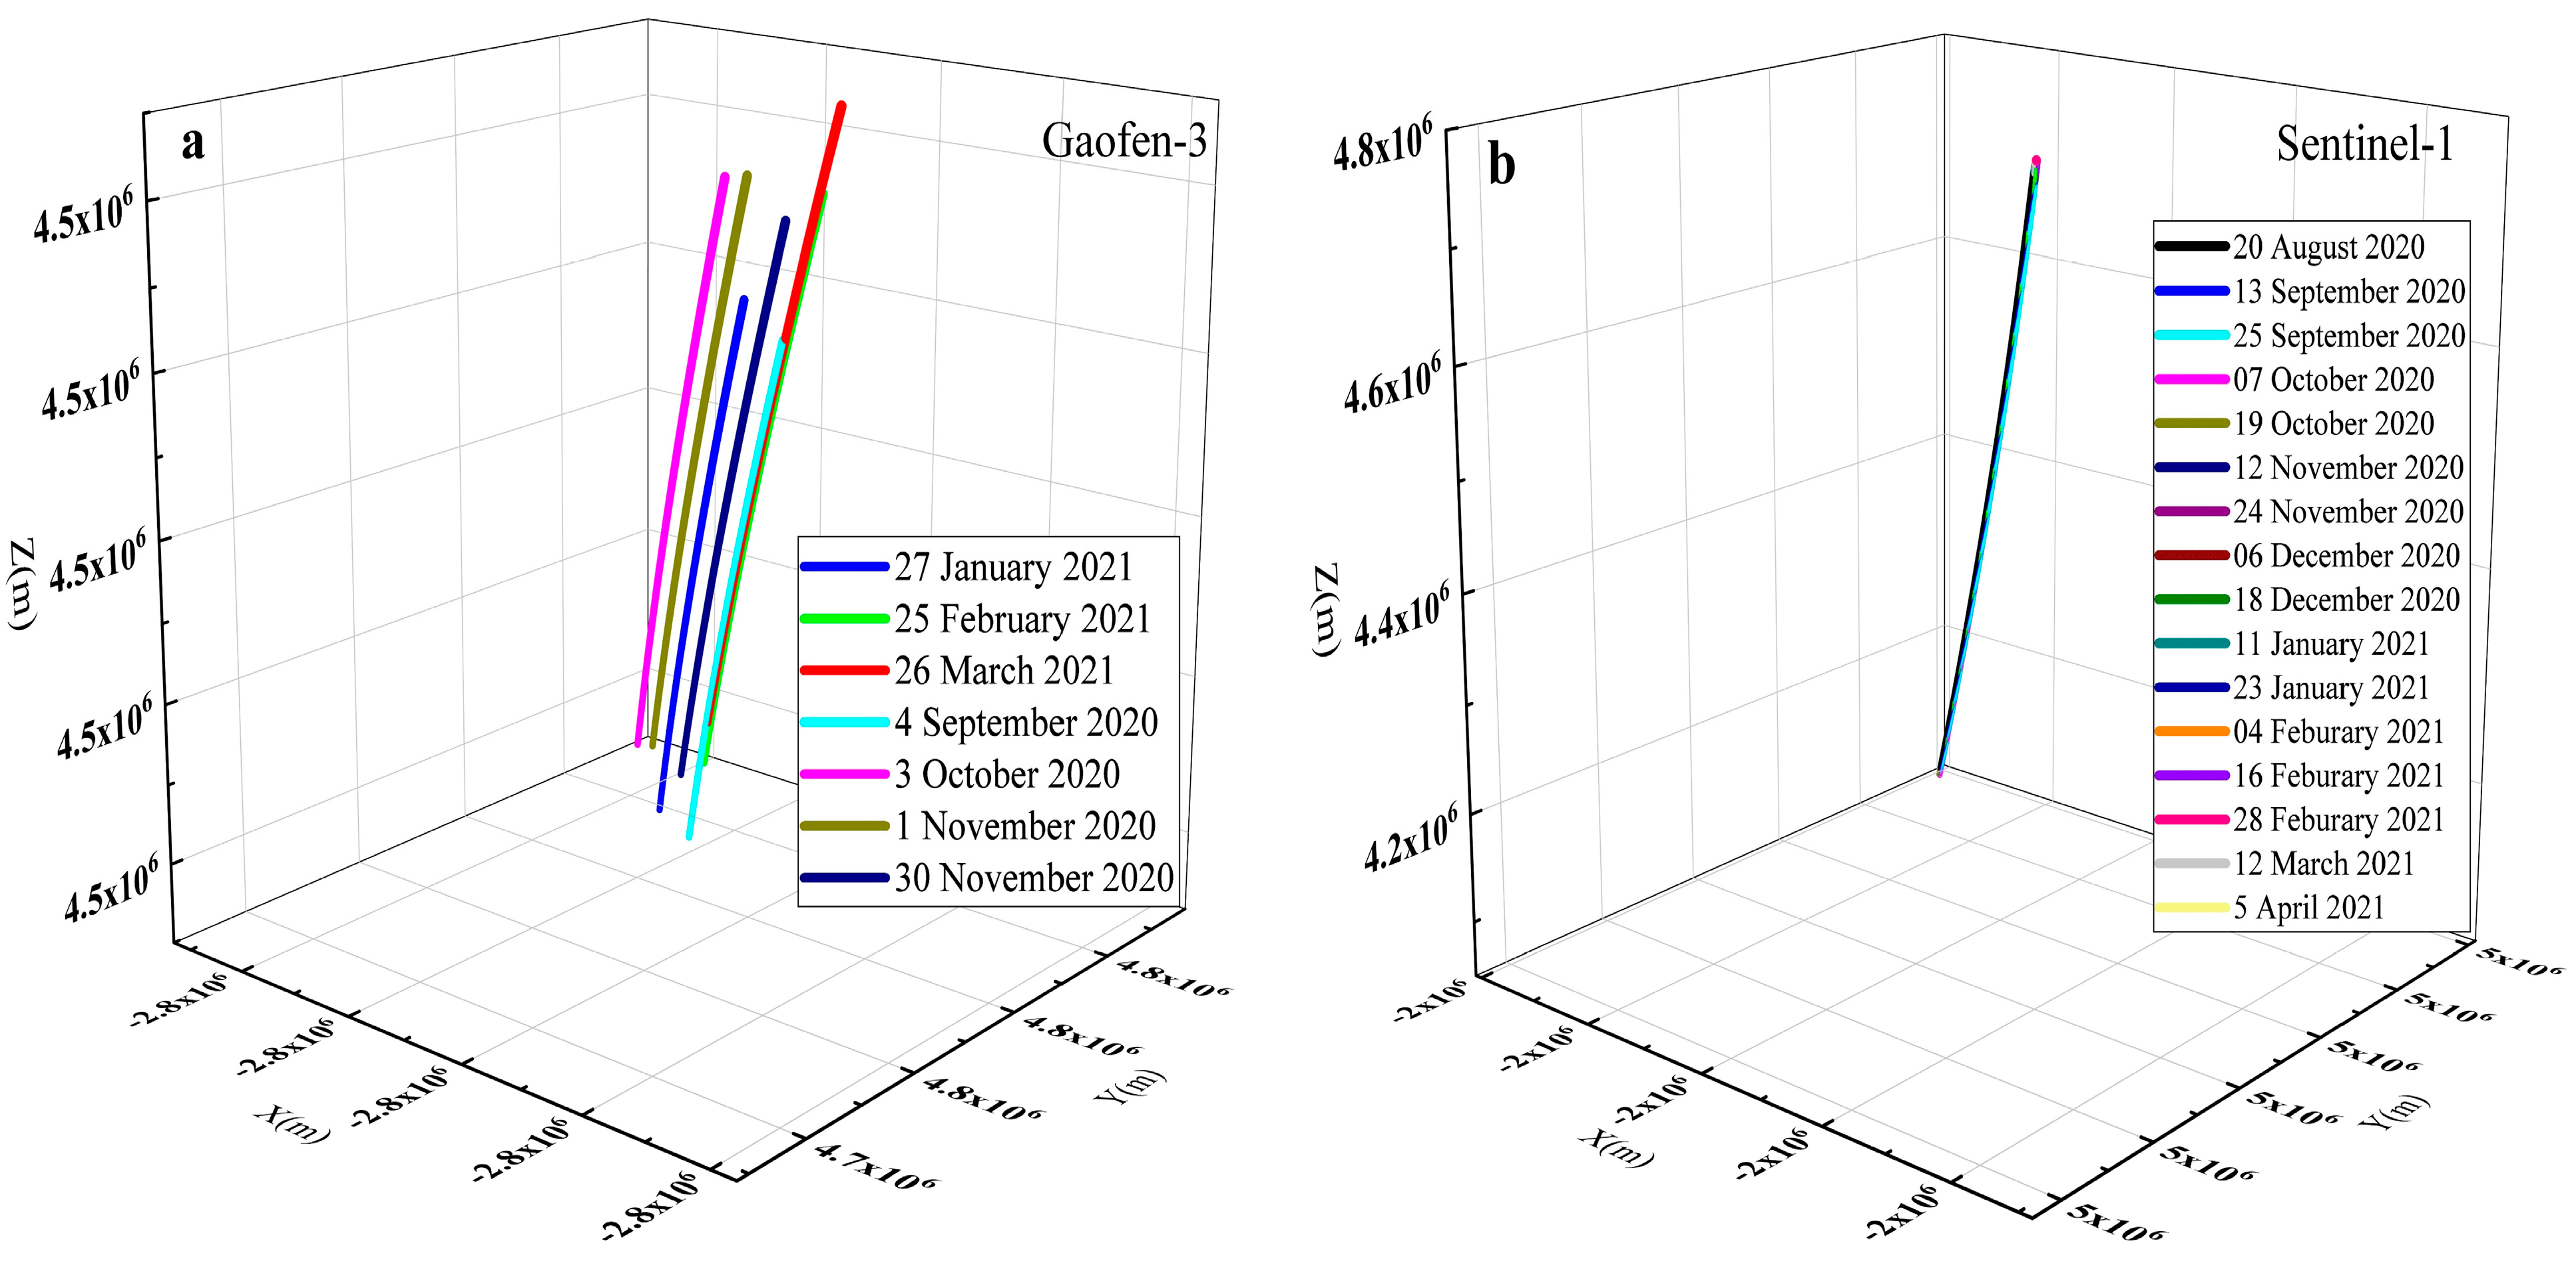
2.2. Datasets
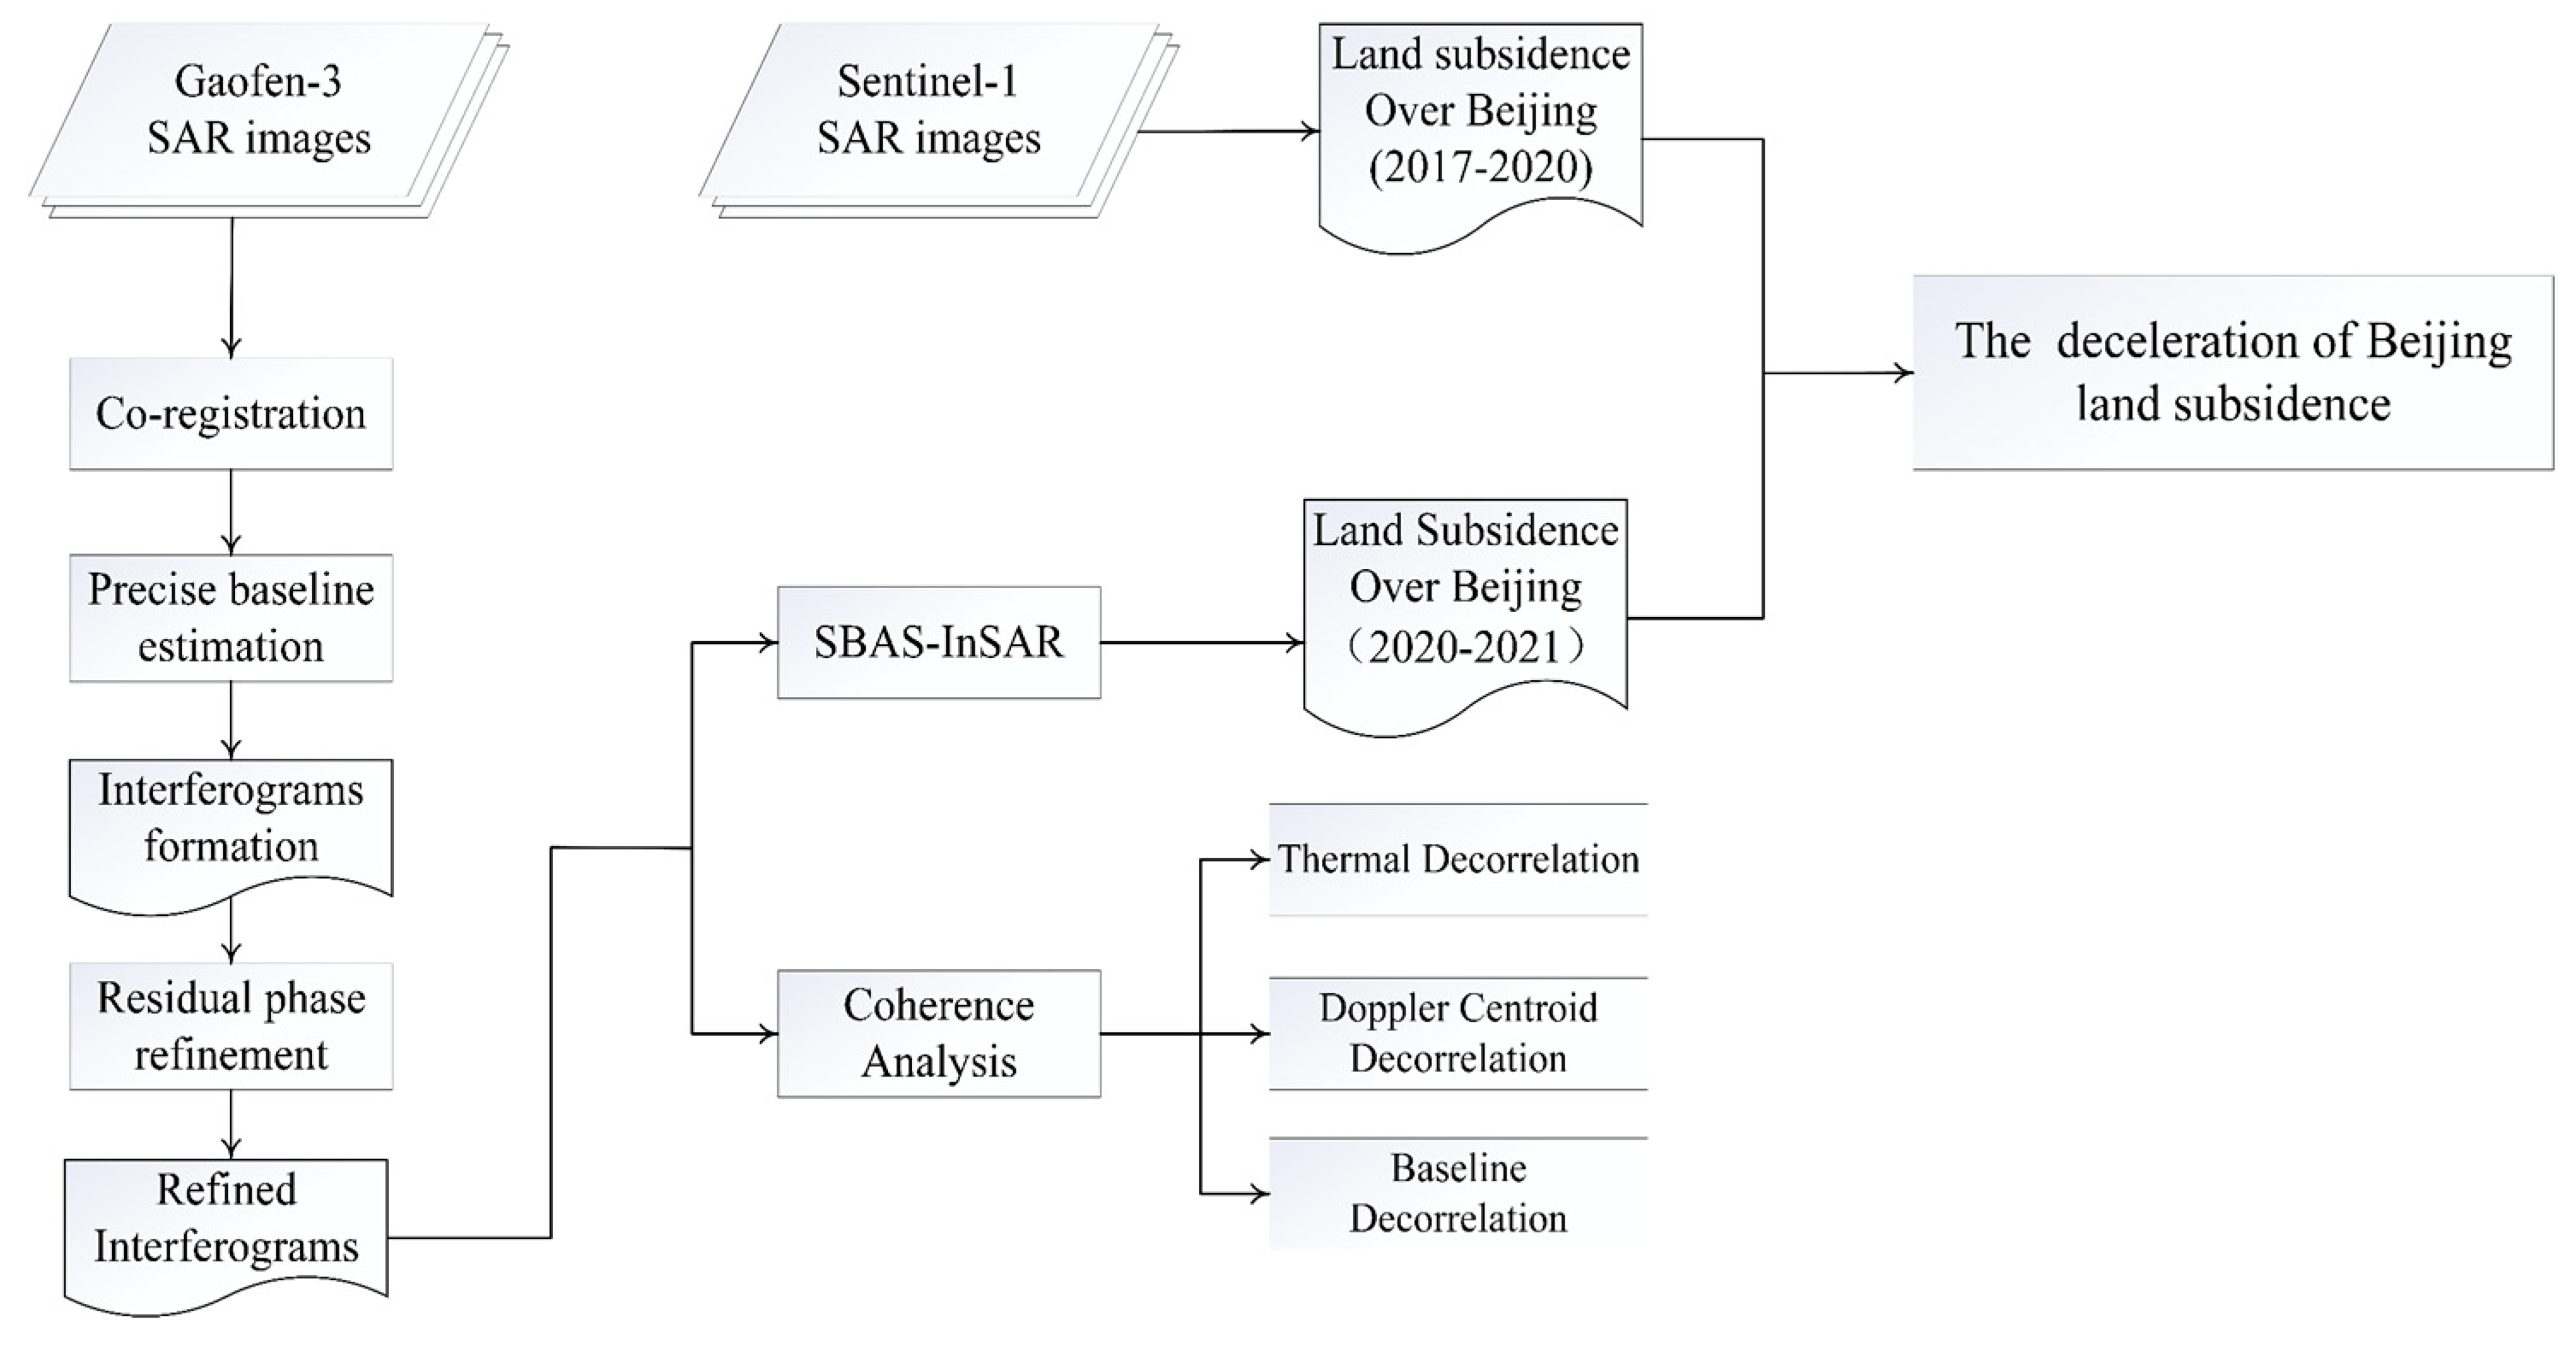
3. Methodology
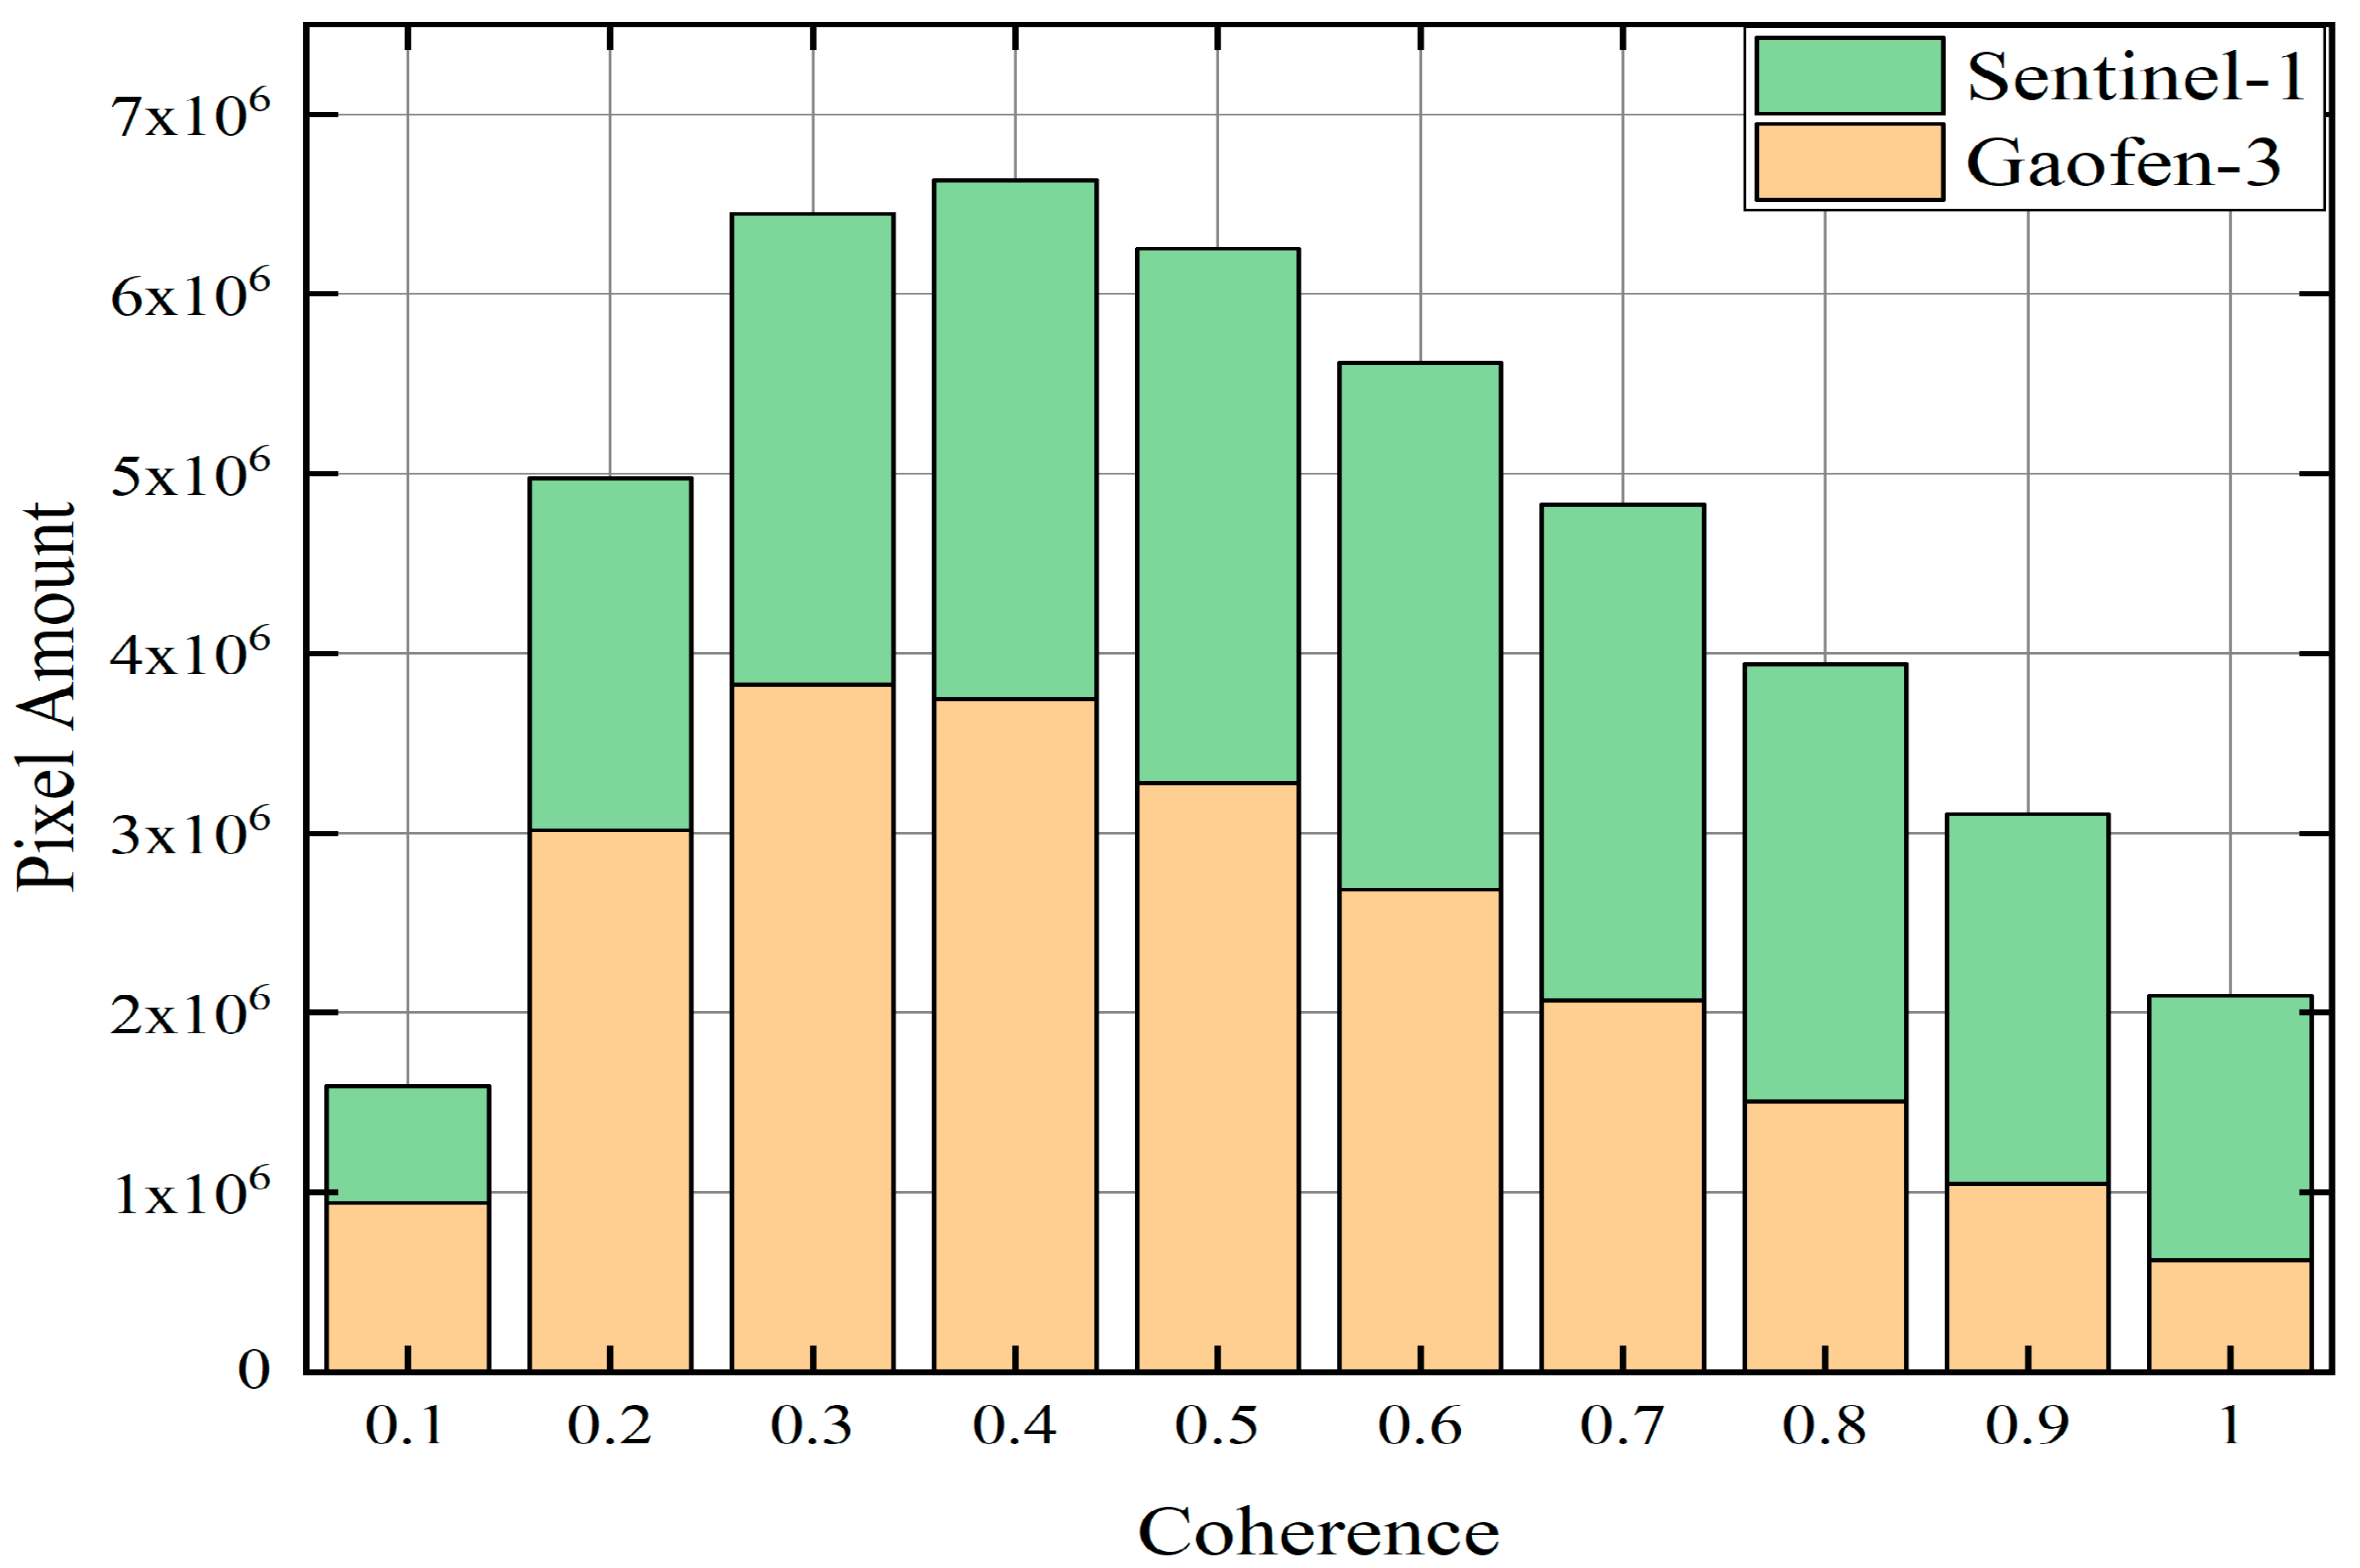
3.1. Index for Interferometric Performance Evaluation
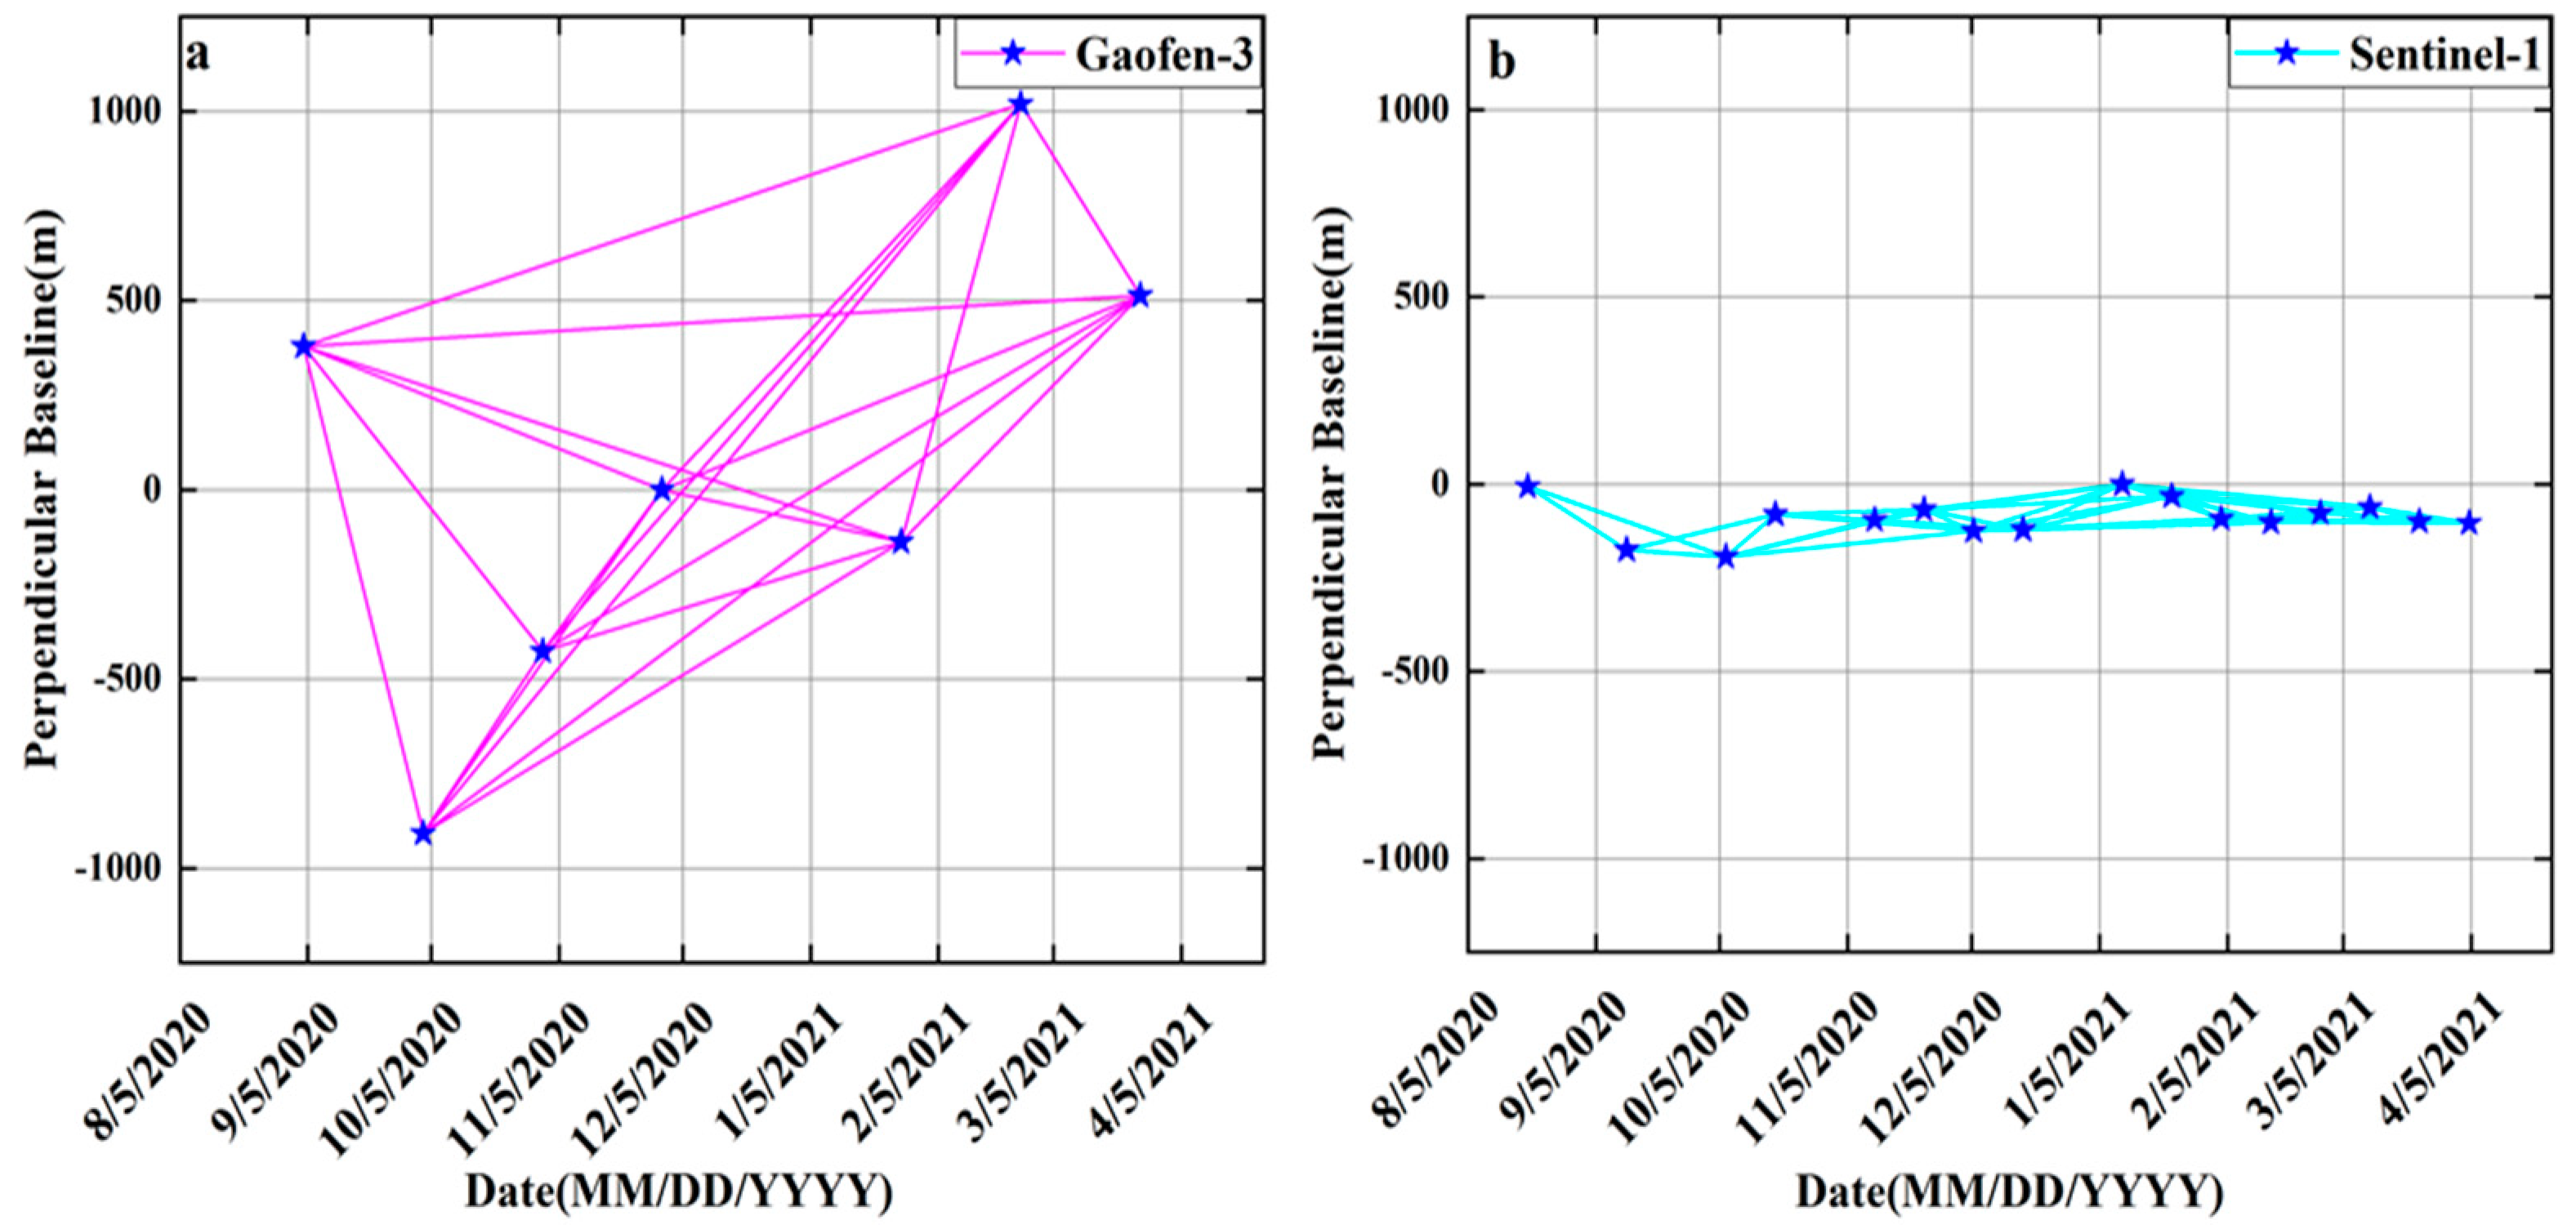
3.2. SBAS-InSAR Method
4. Gaofen-3 Interferometry Analysis and Refinement
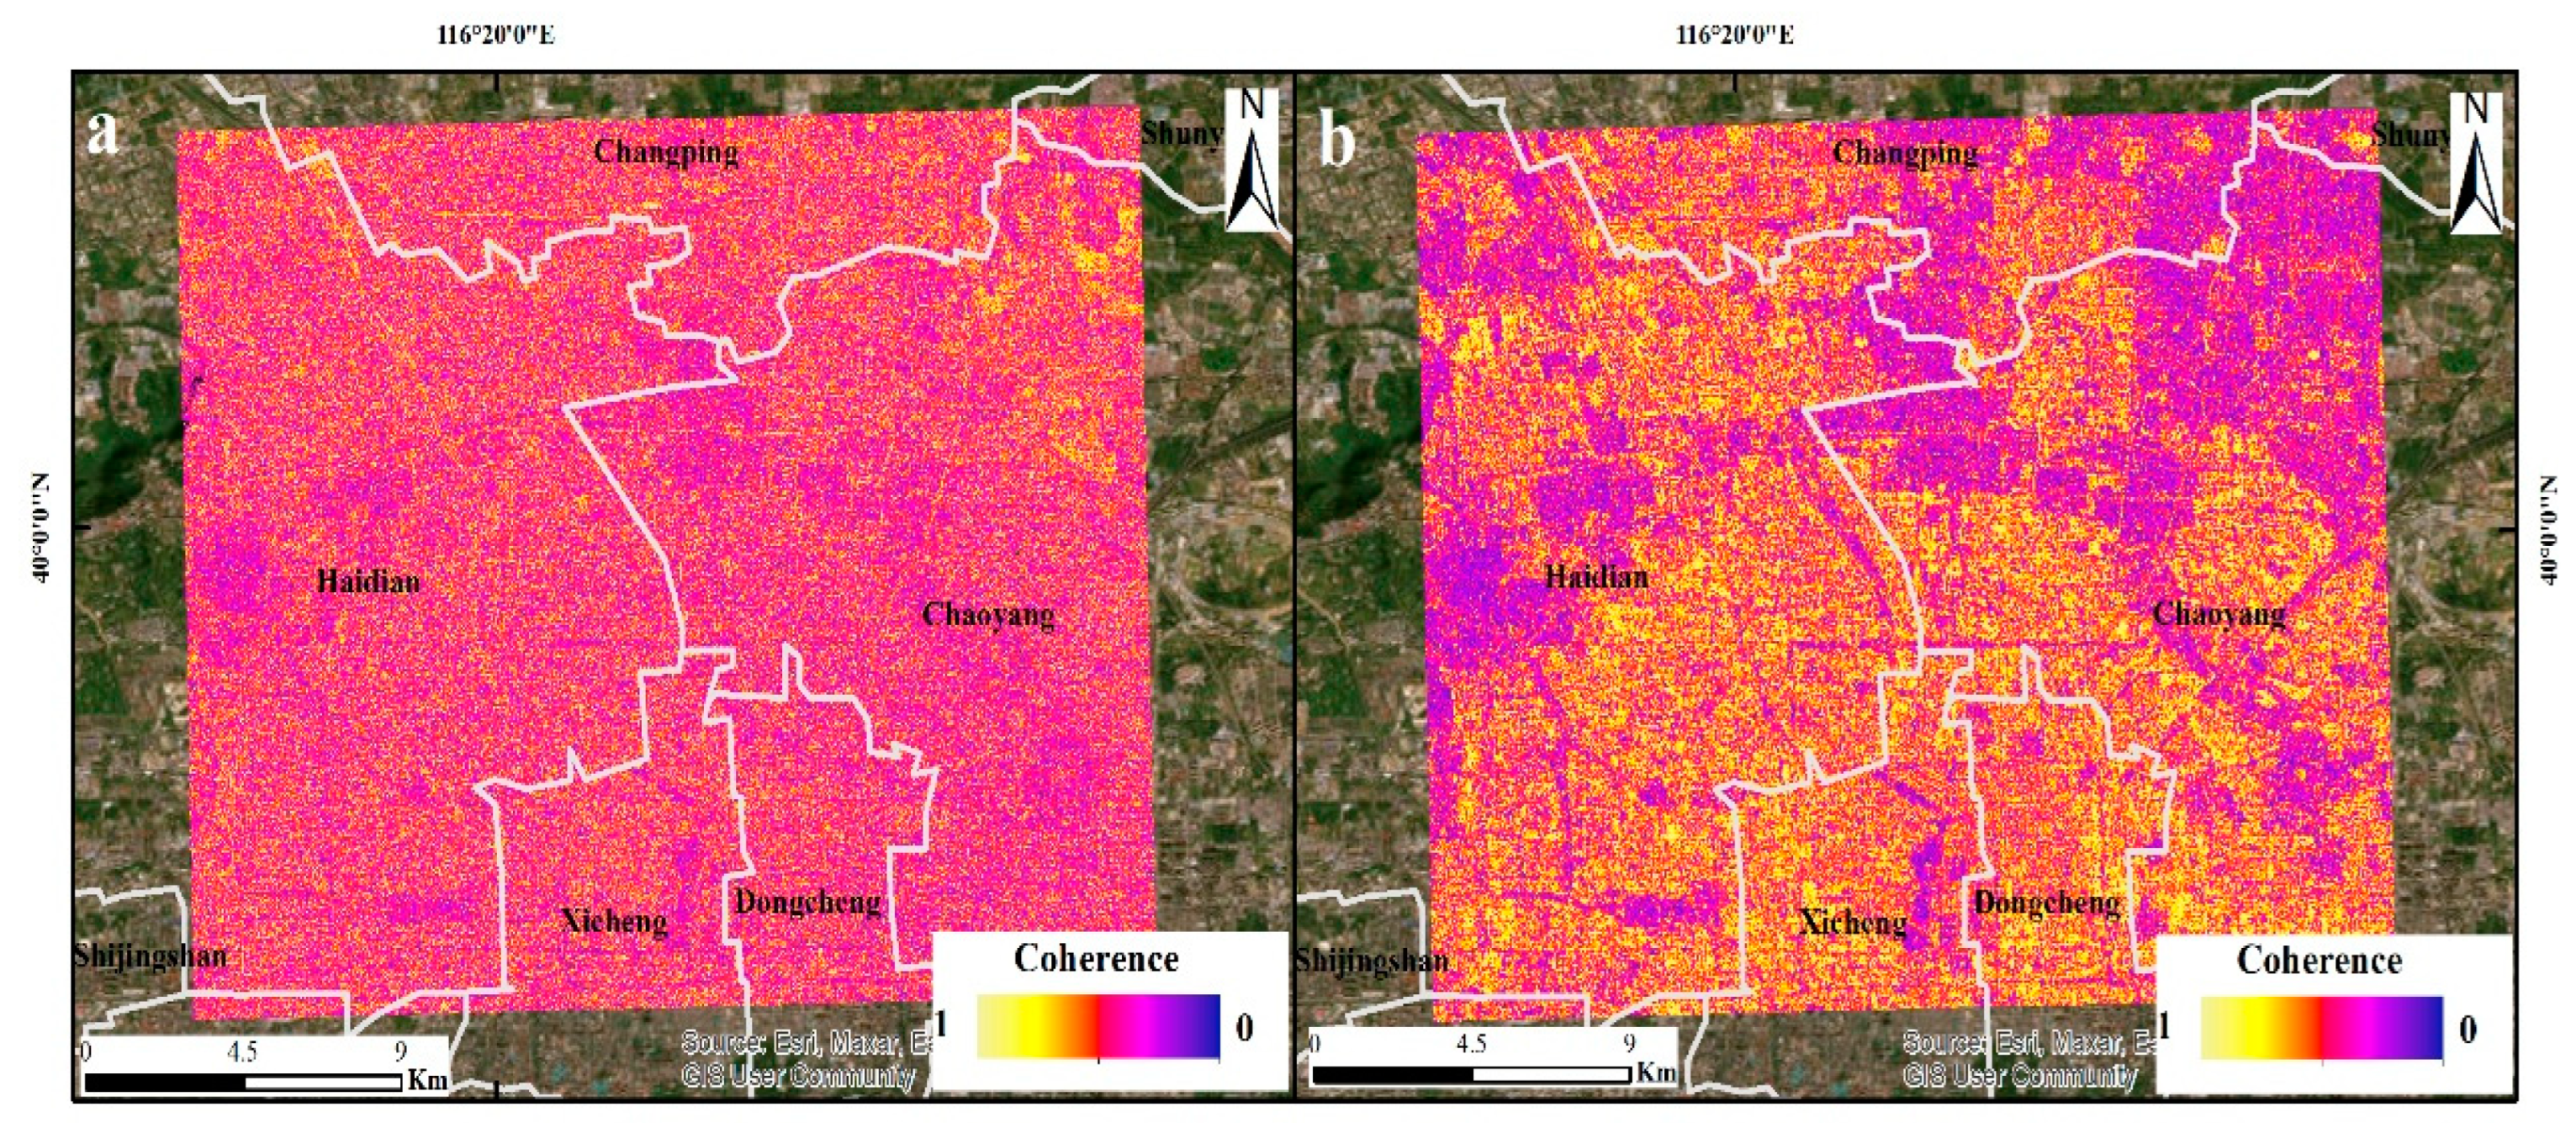
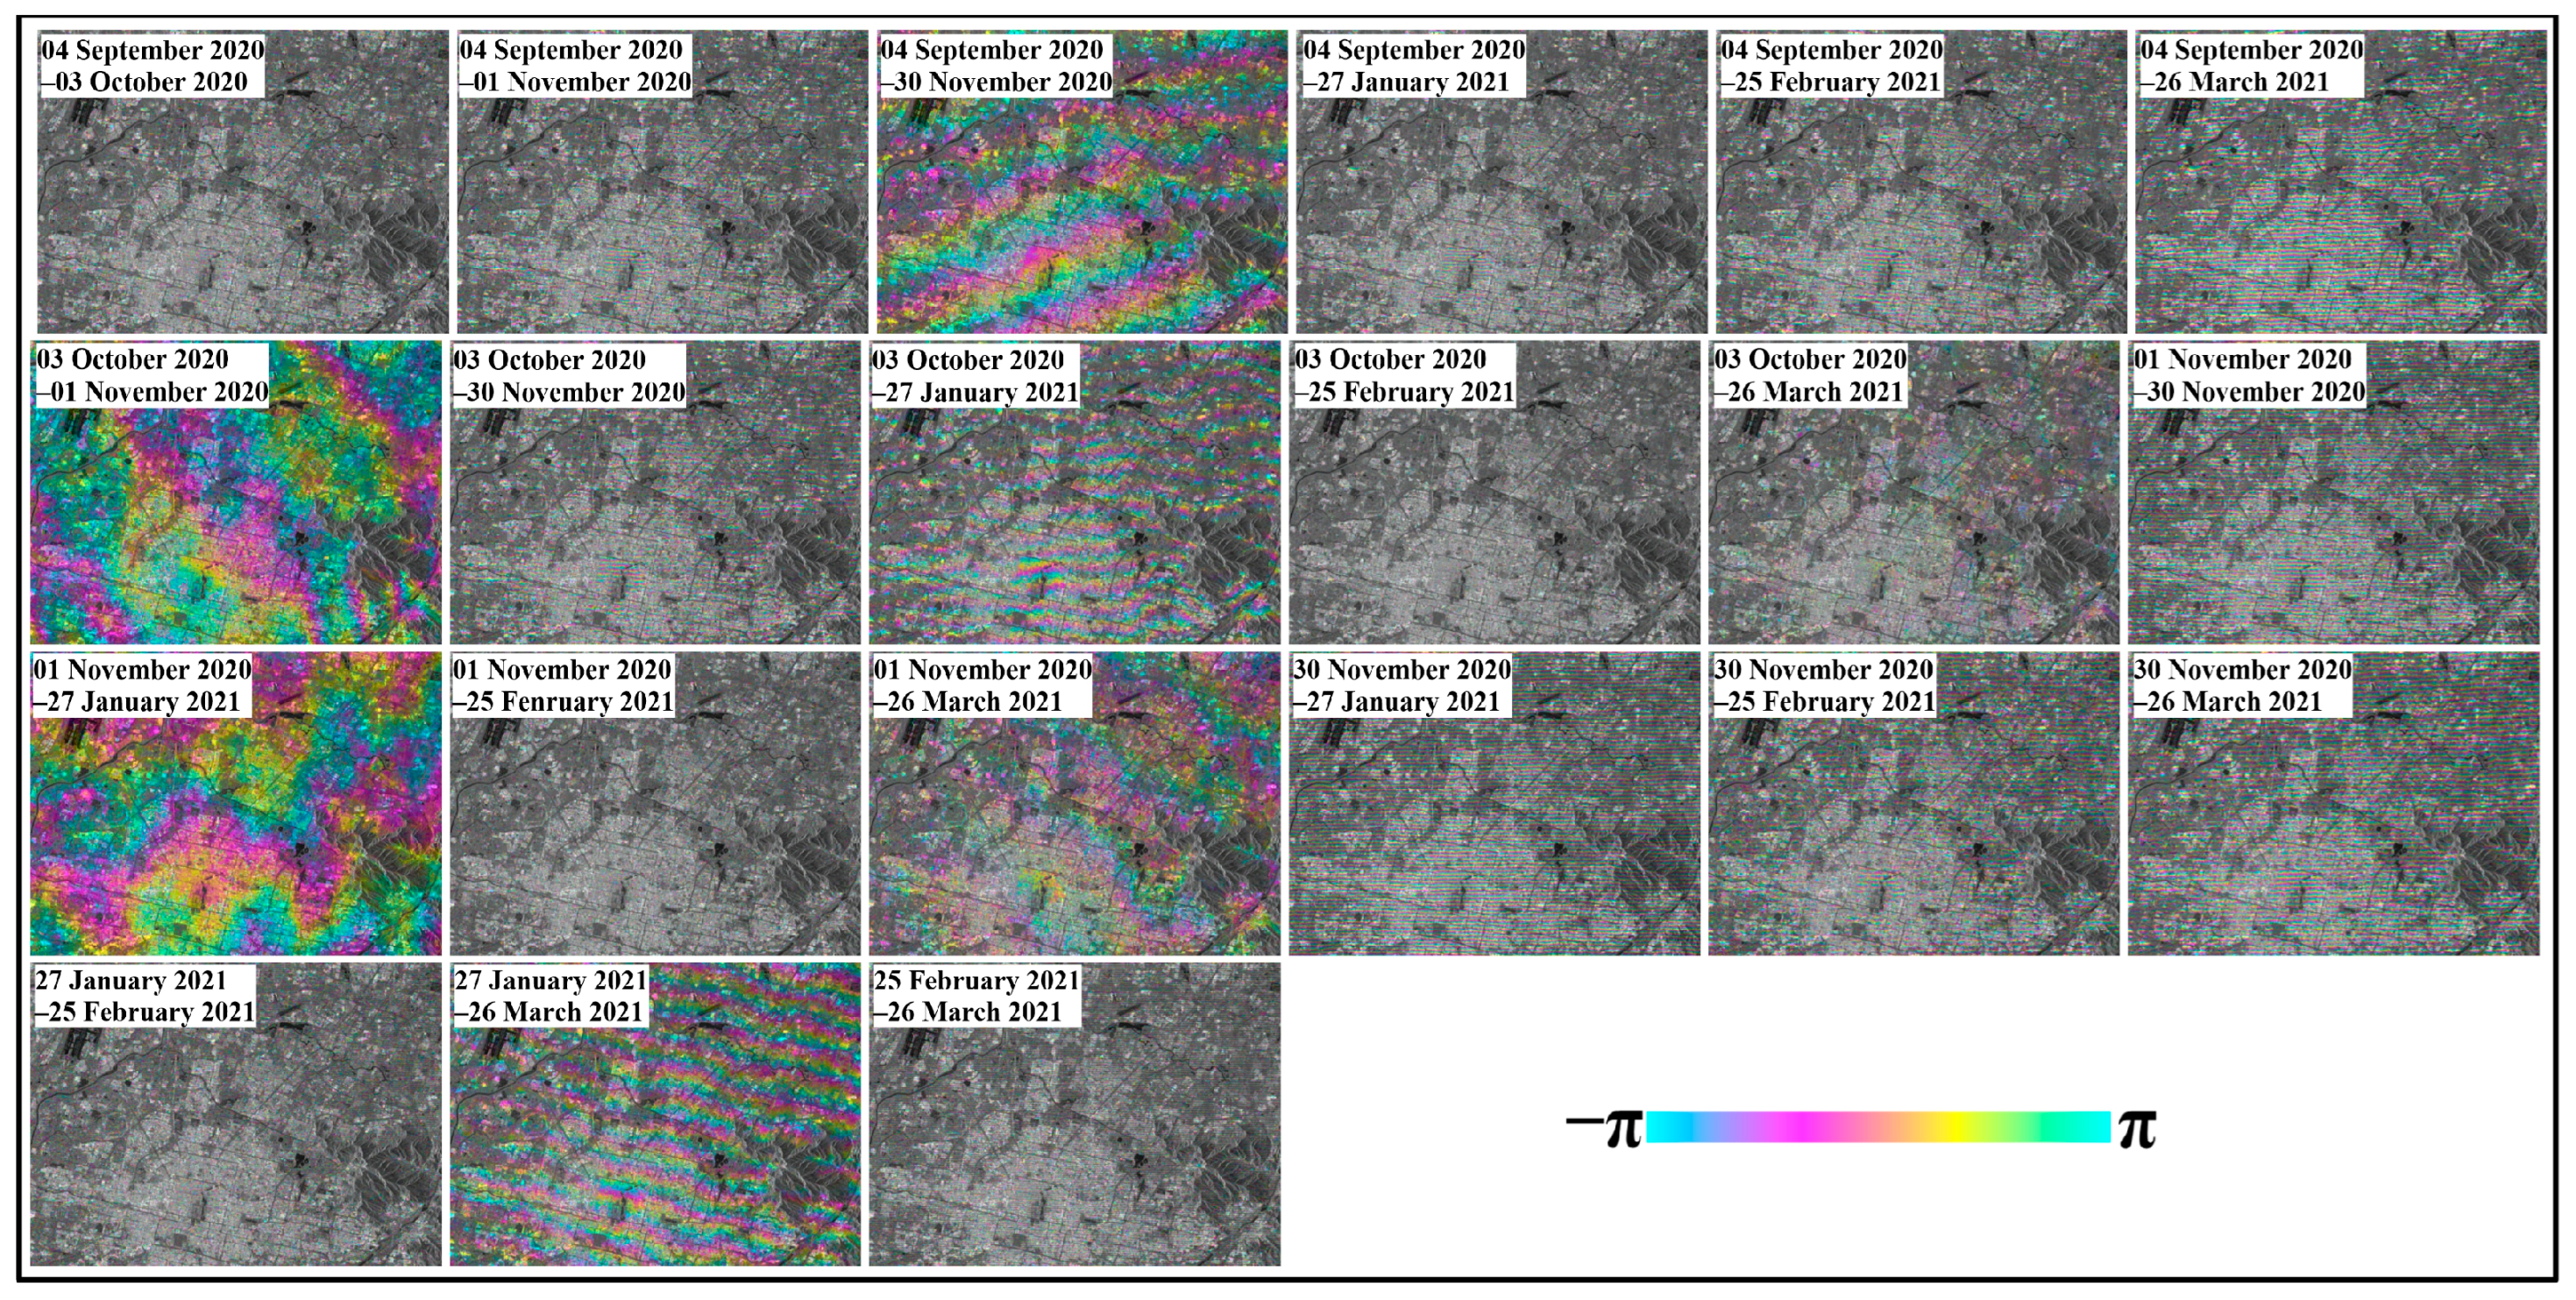
4.1. Gaofen-3 Interferometric Analysis
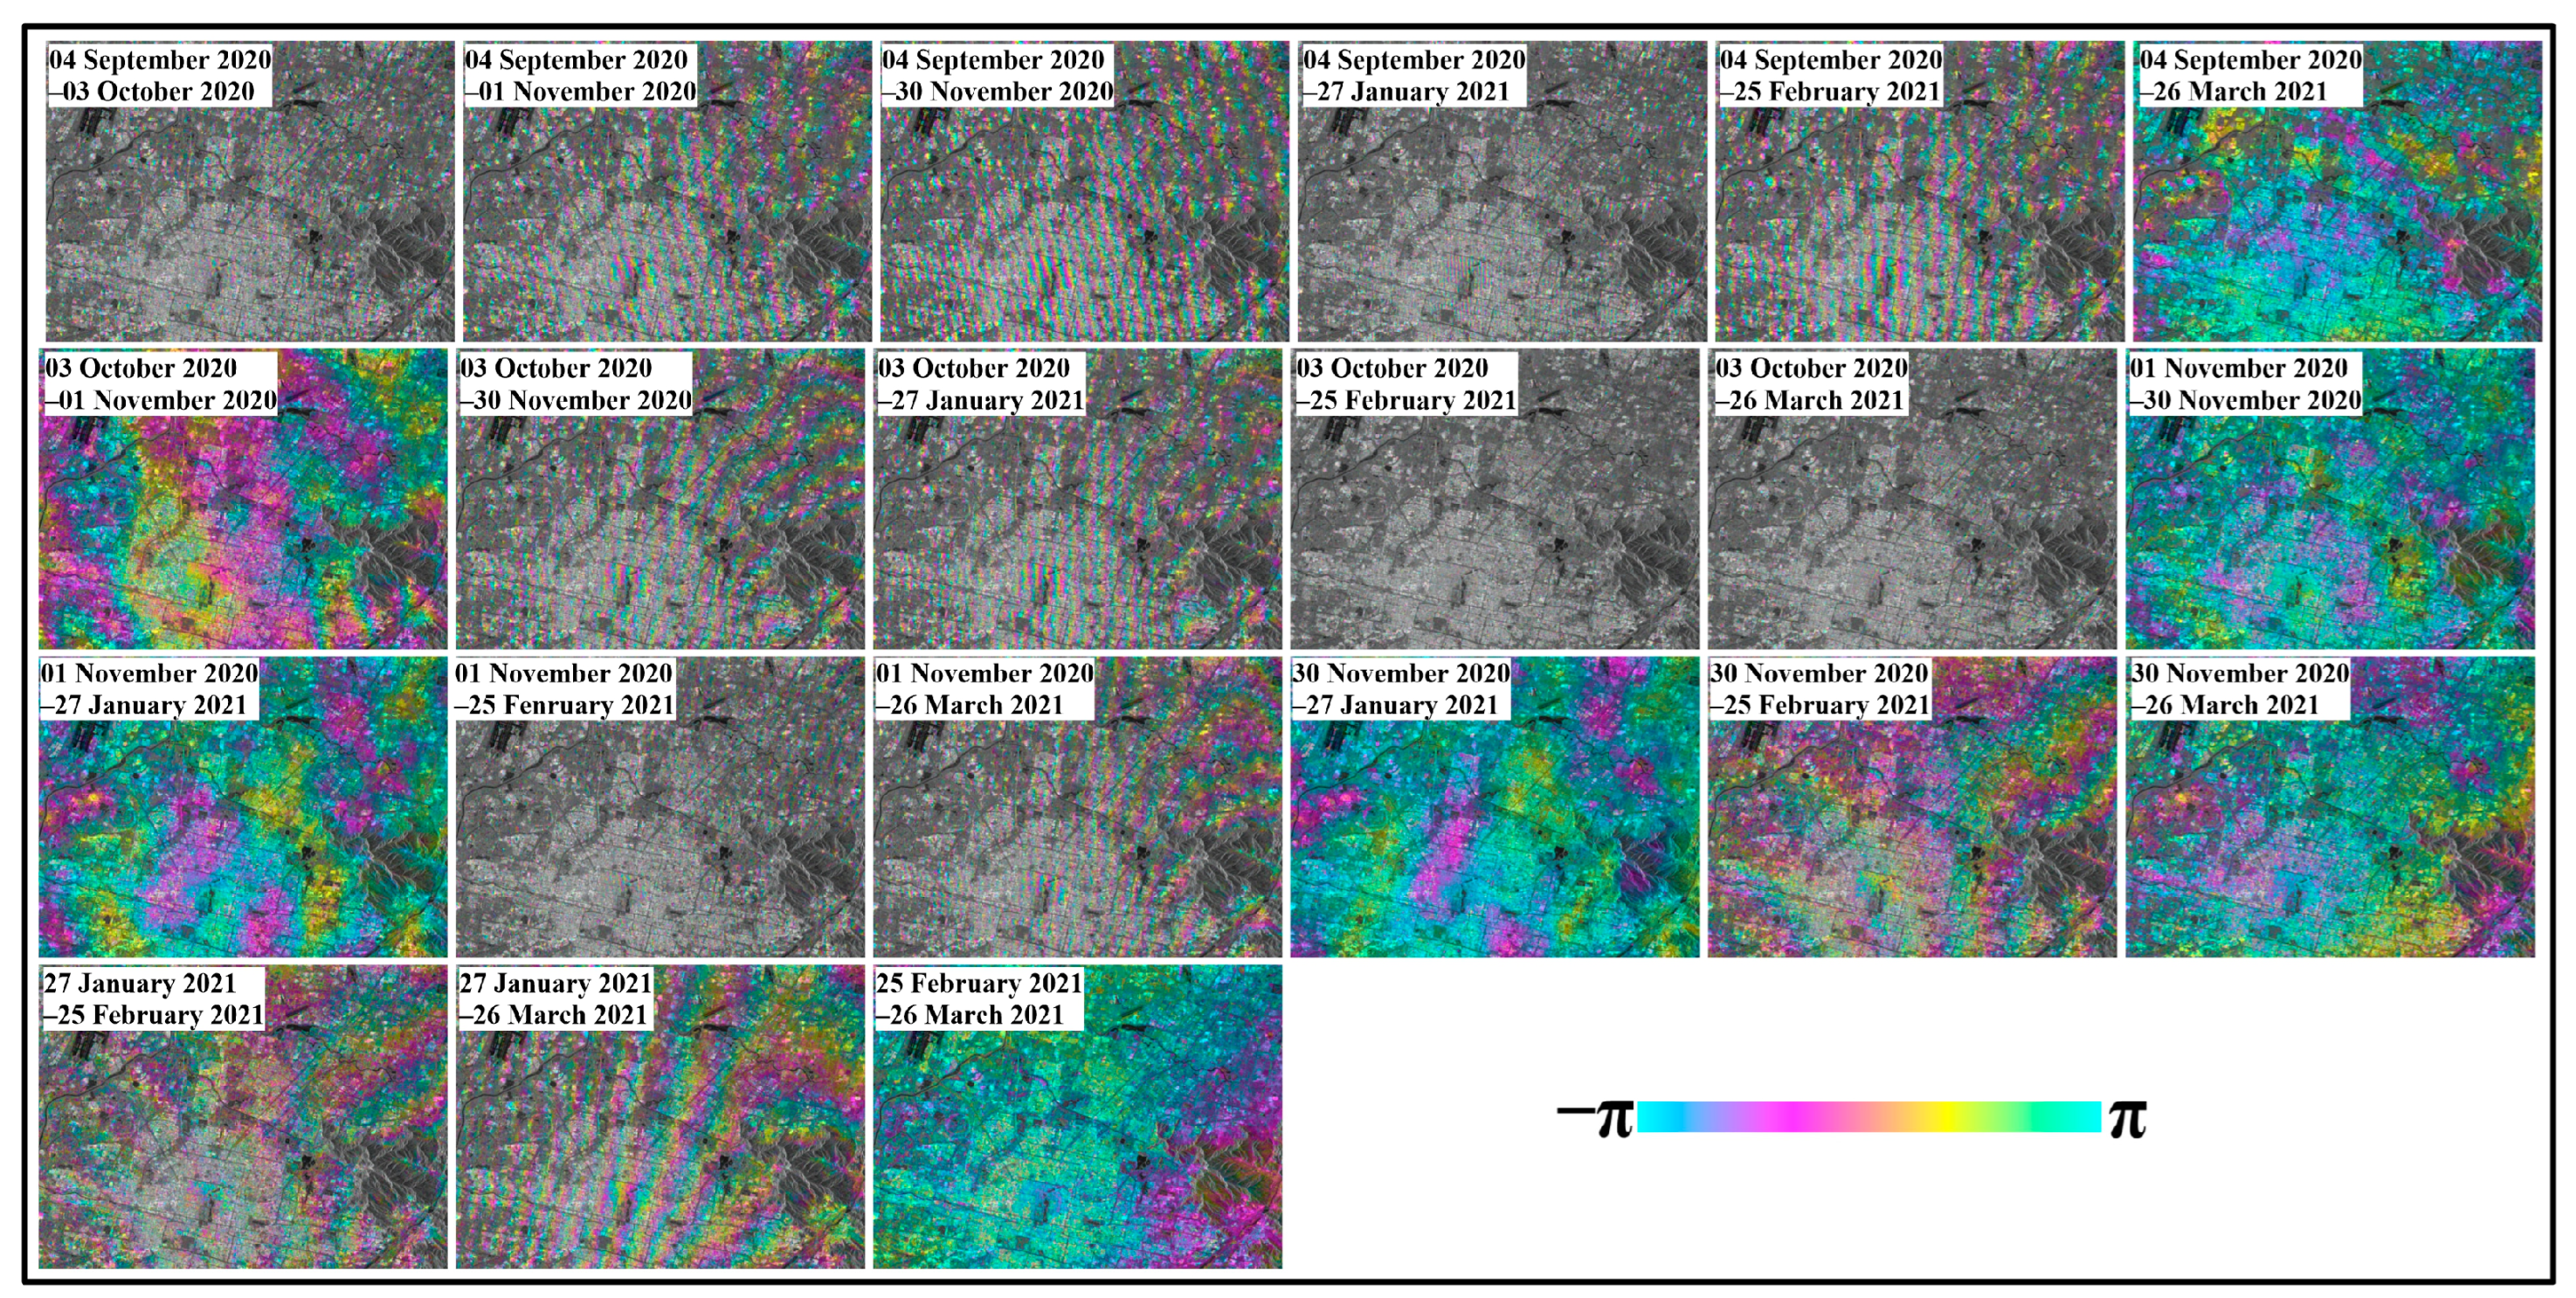
4.2. The Refinement of the Orbit-Related Artifacts
5. Gaofen-3 Time Series Results Analysis and Comparison
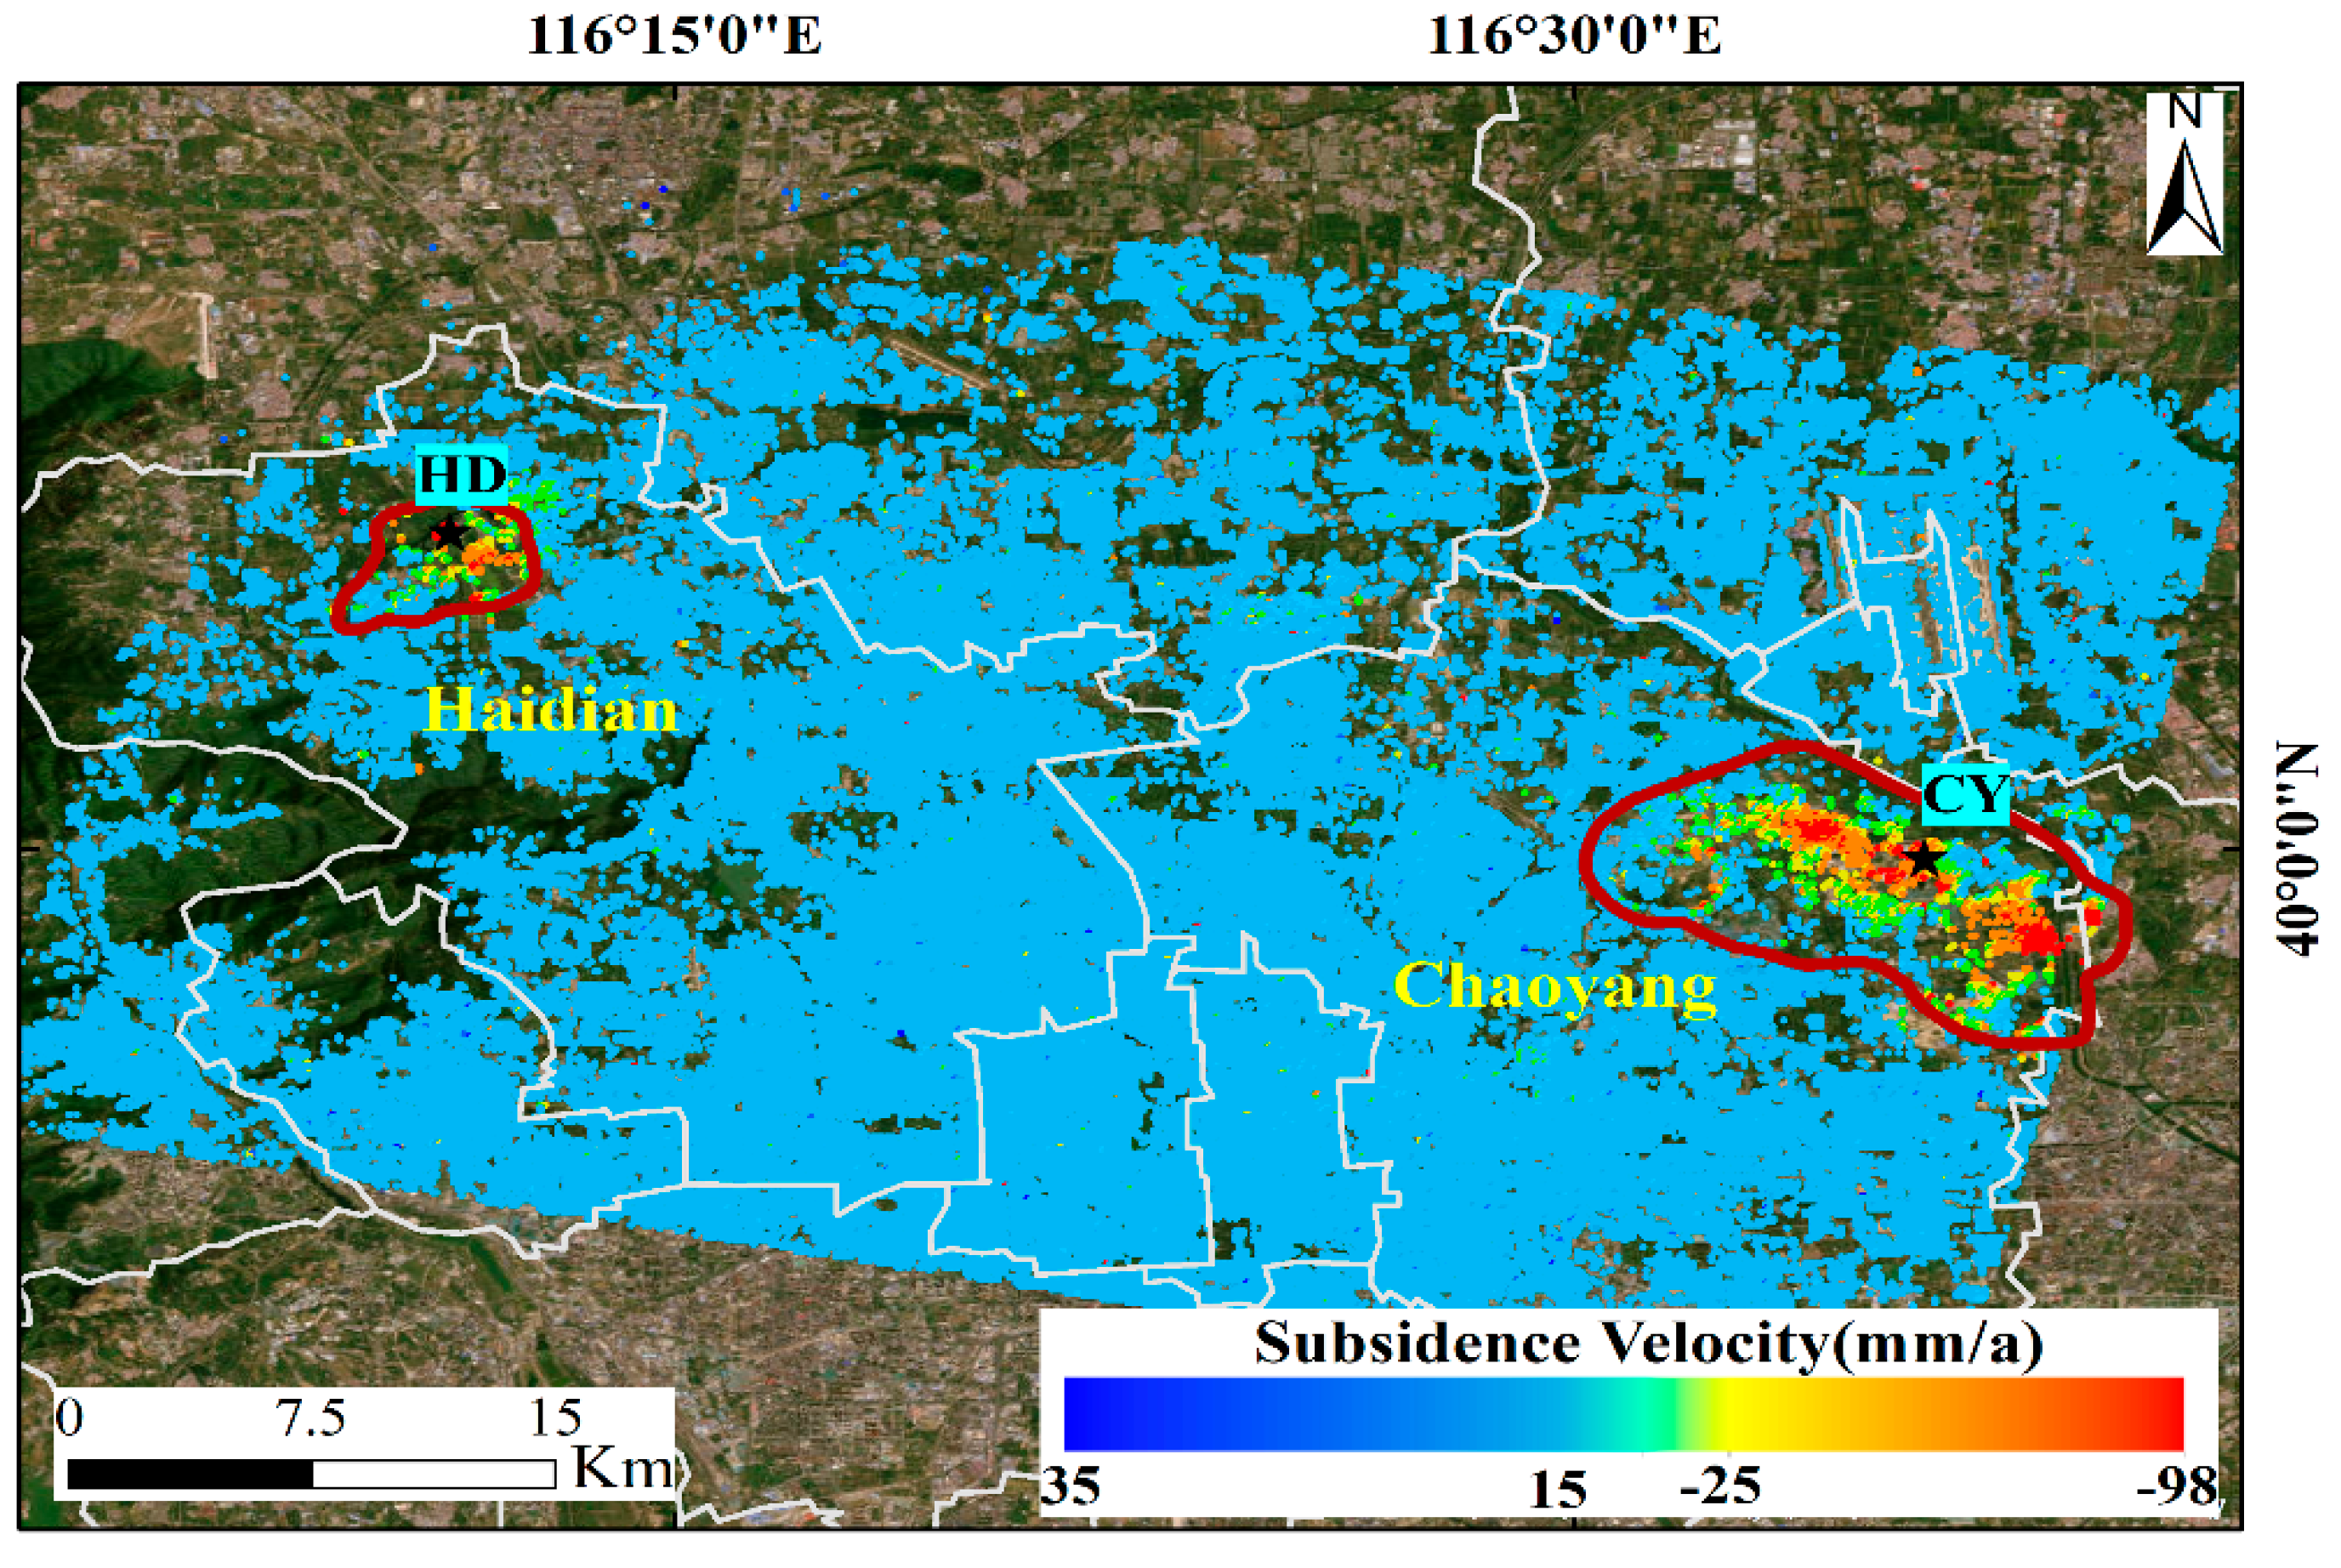
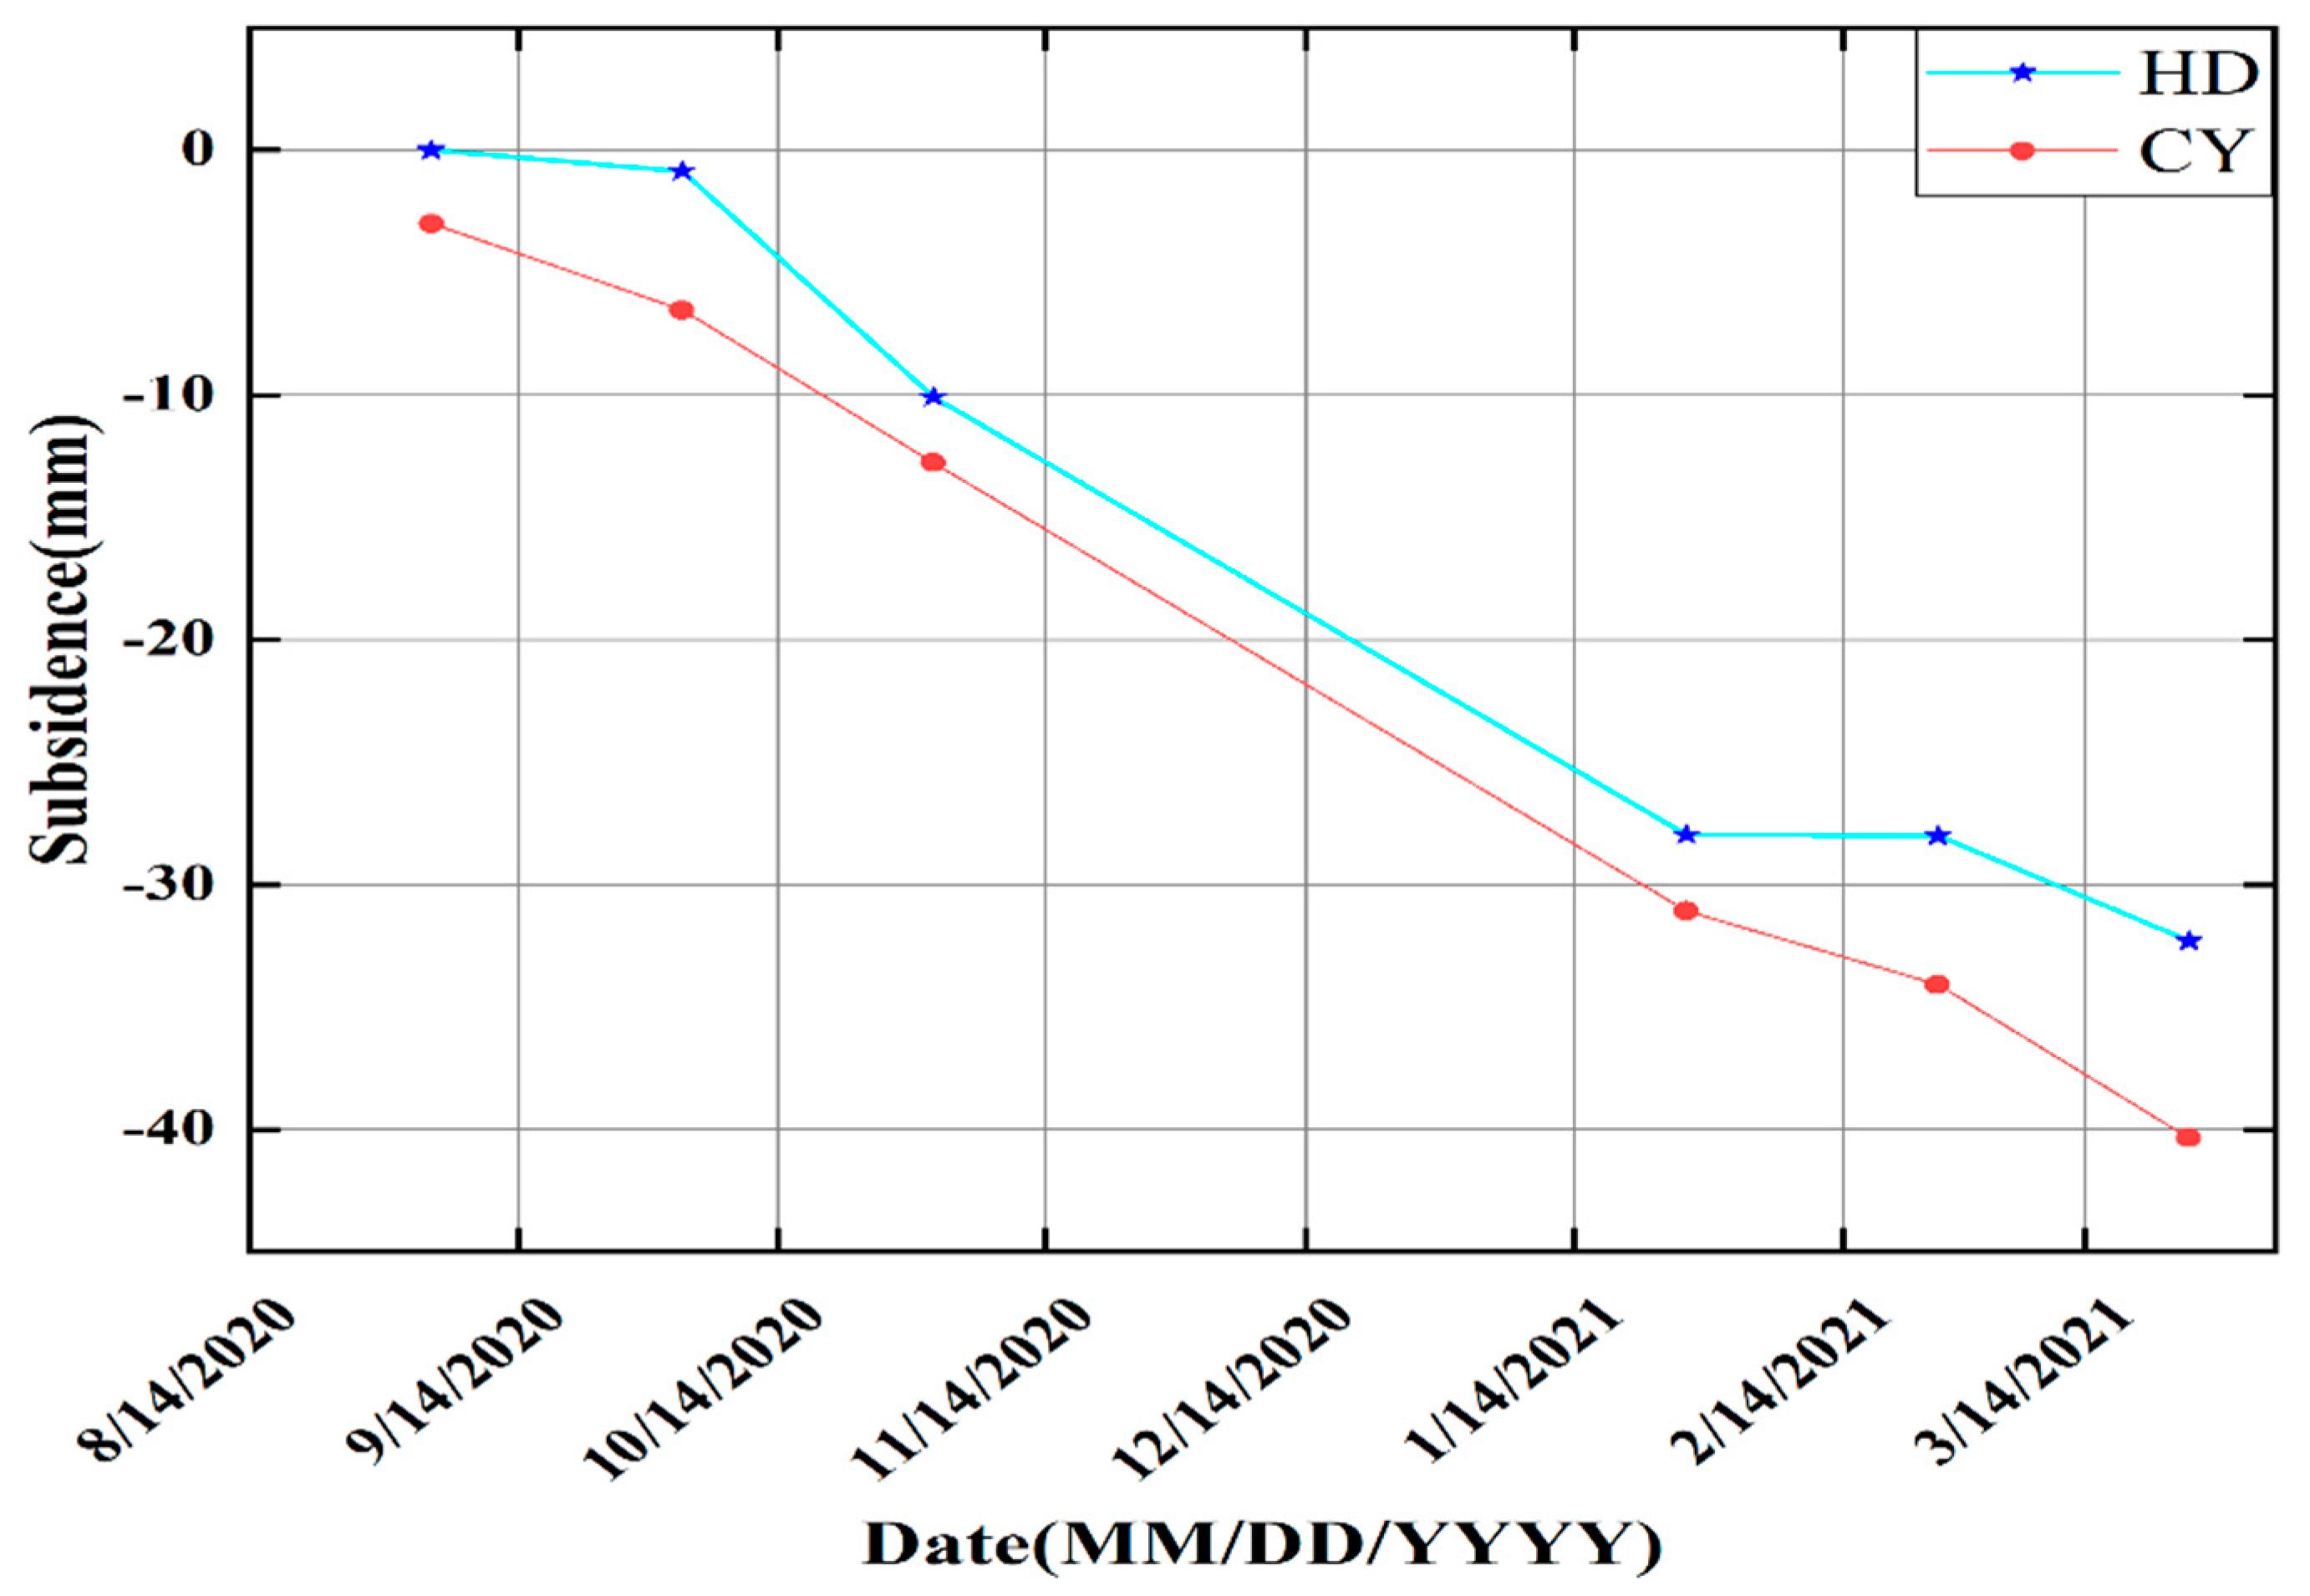
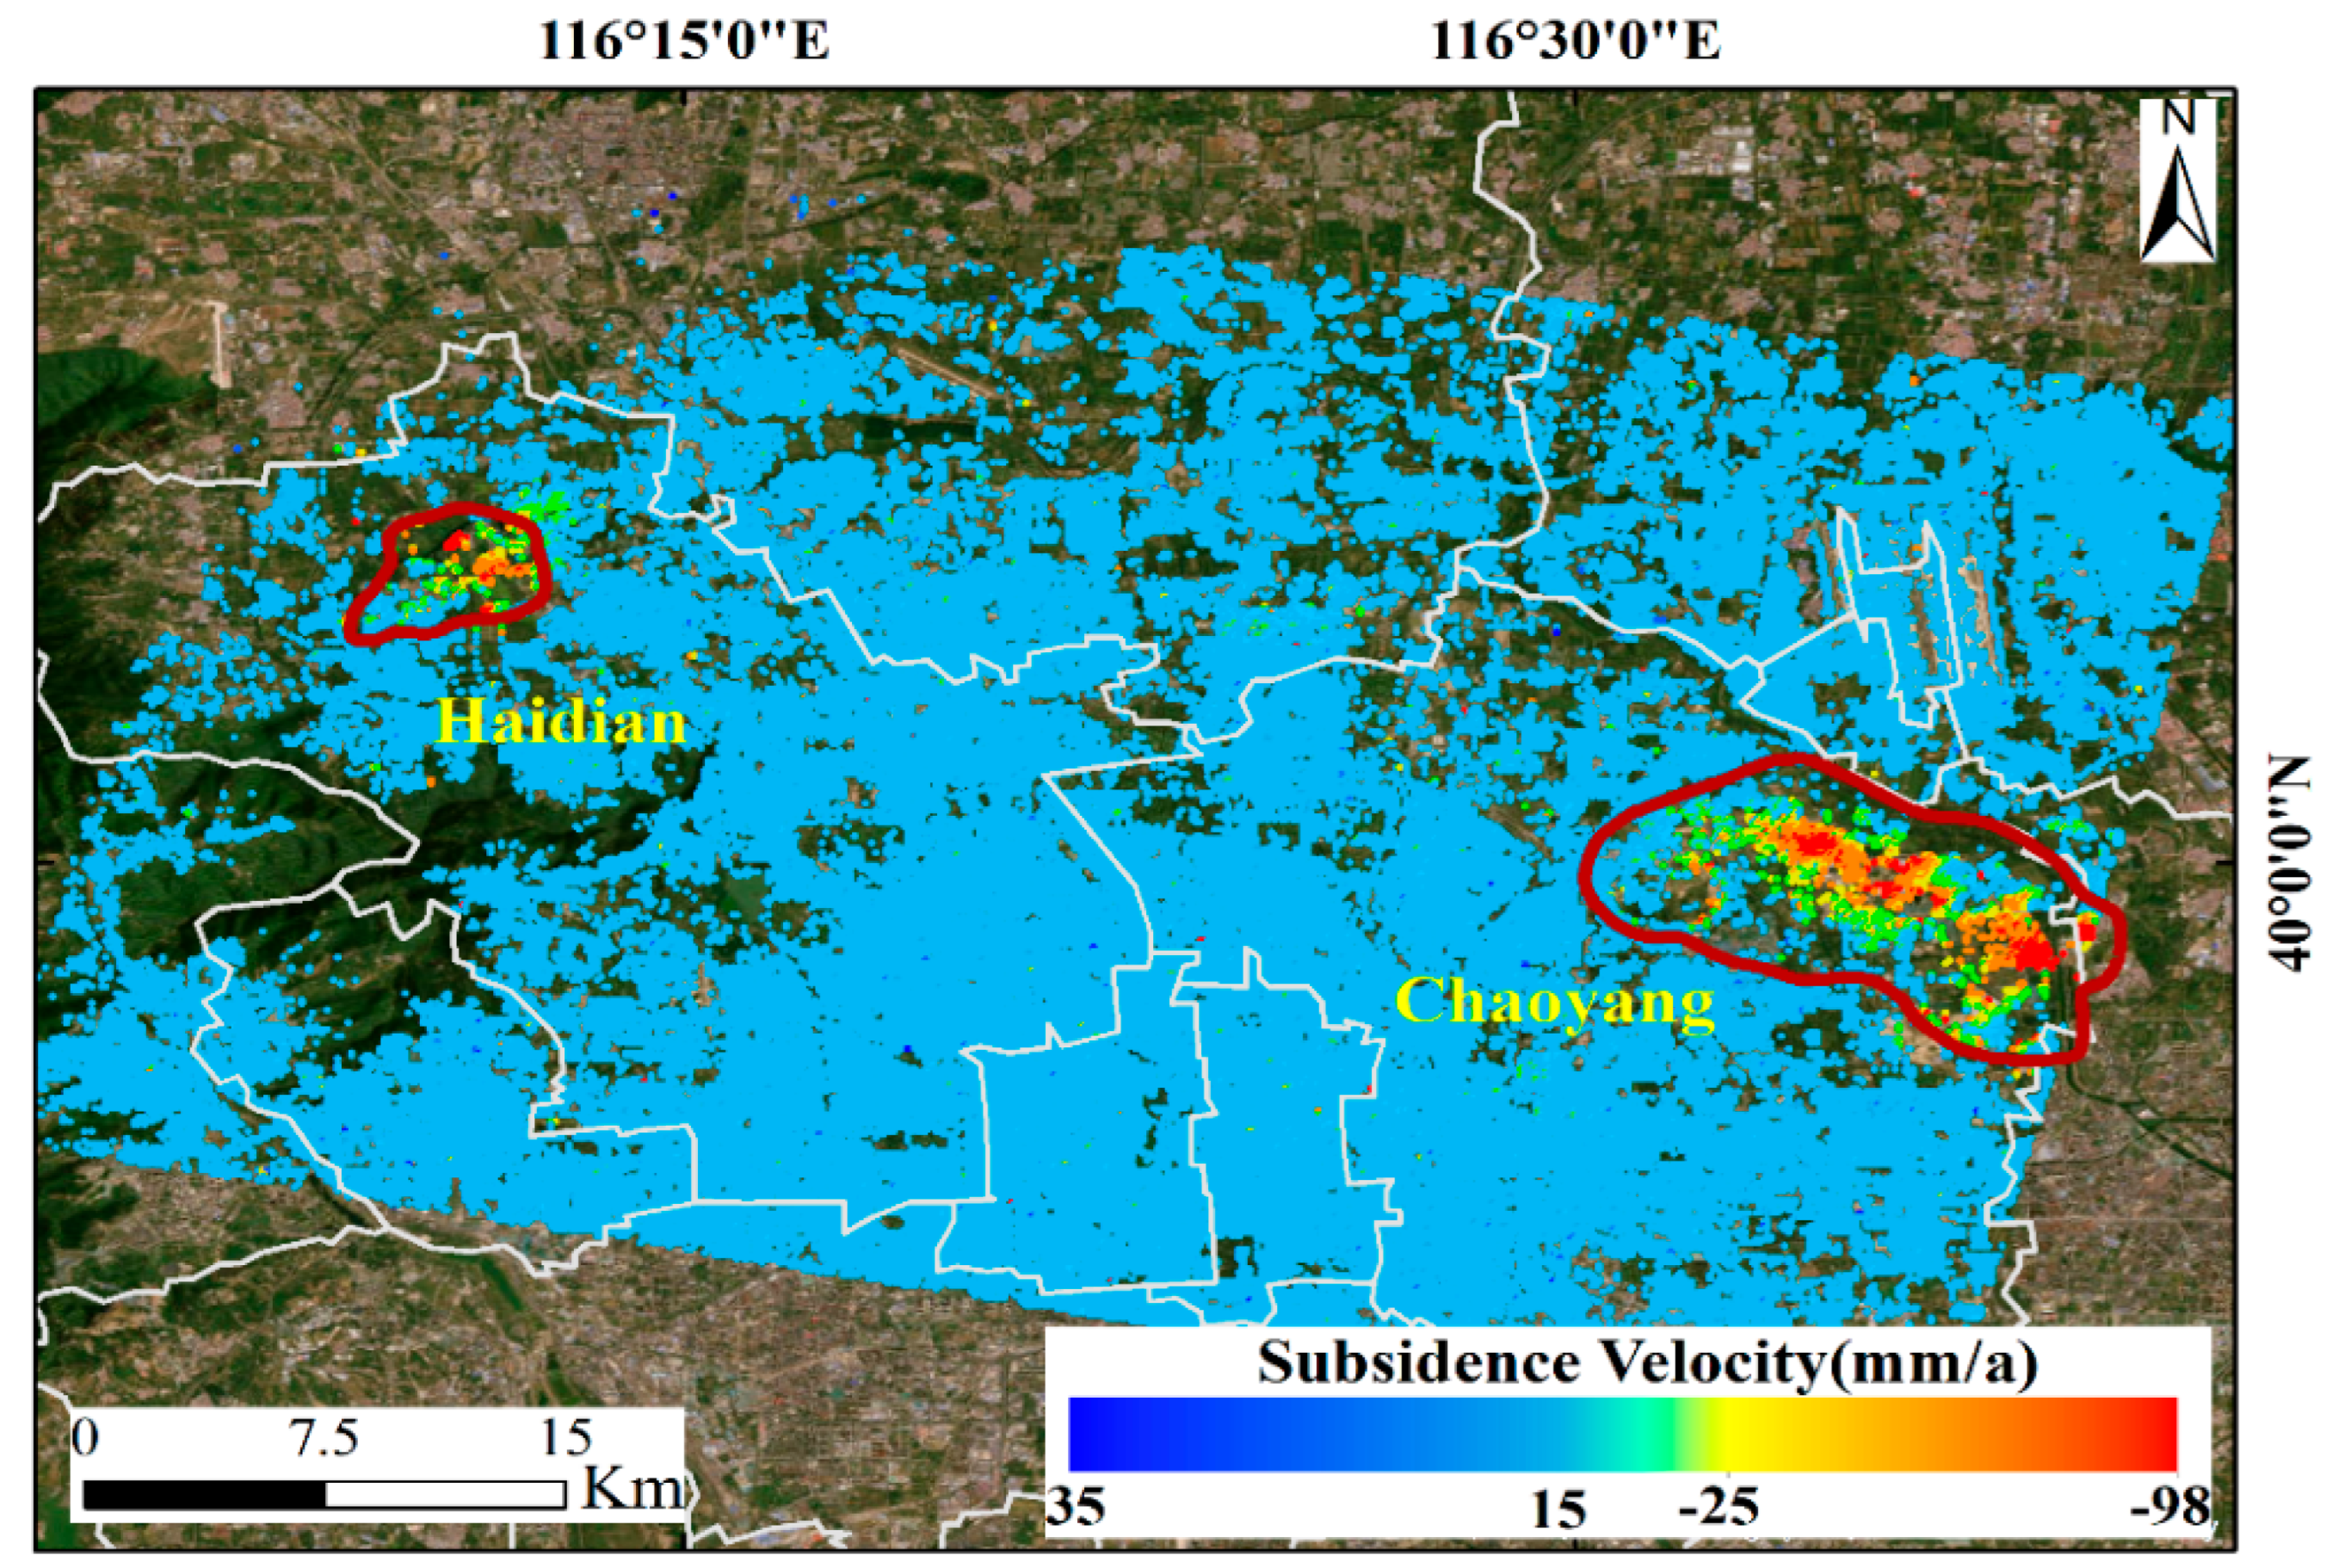
5.1. The Subsidence Results Acquired from Gaofen-3 Images
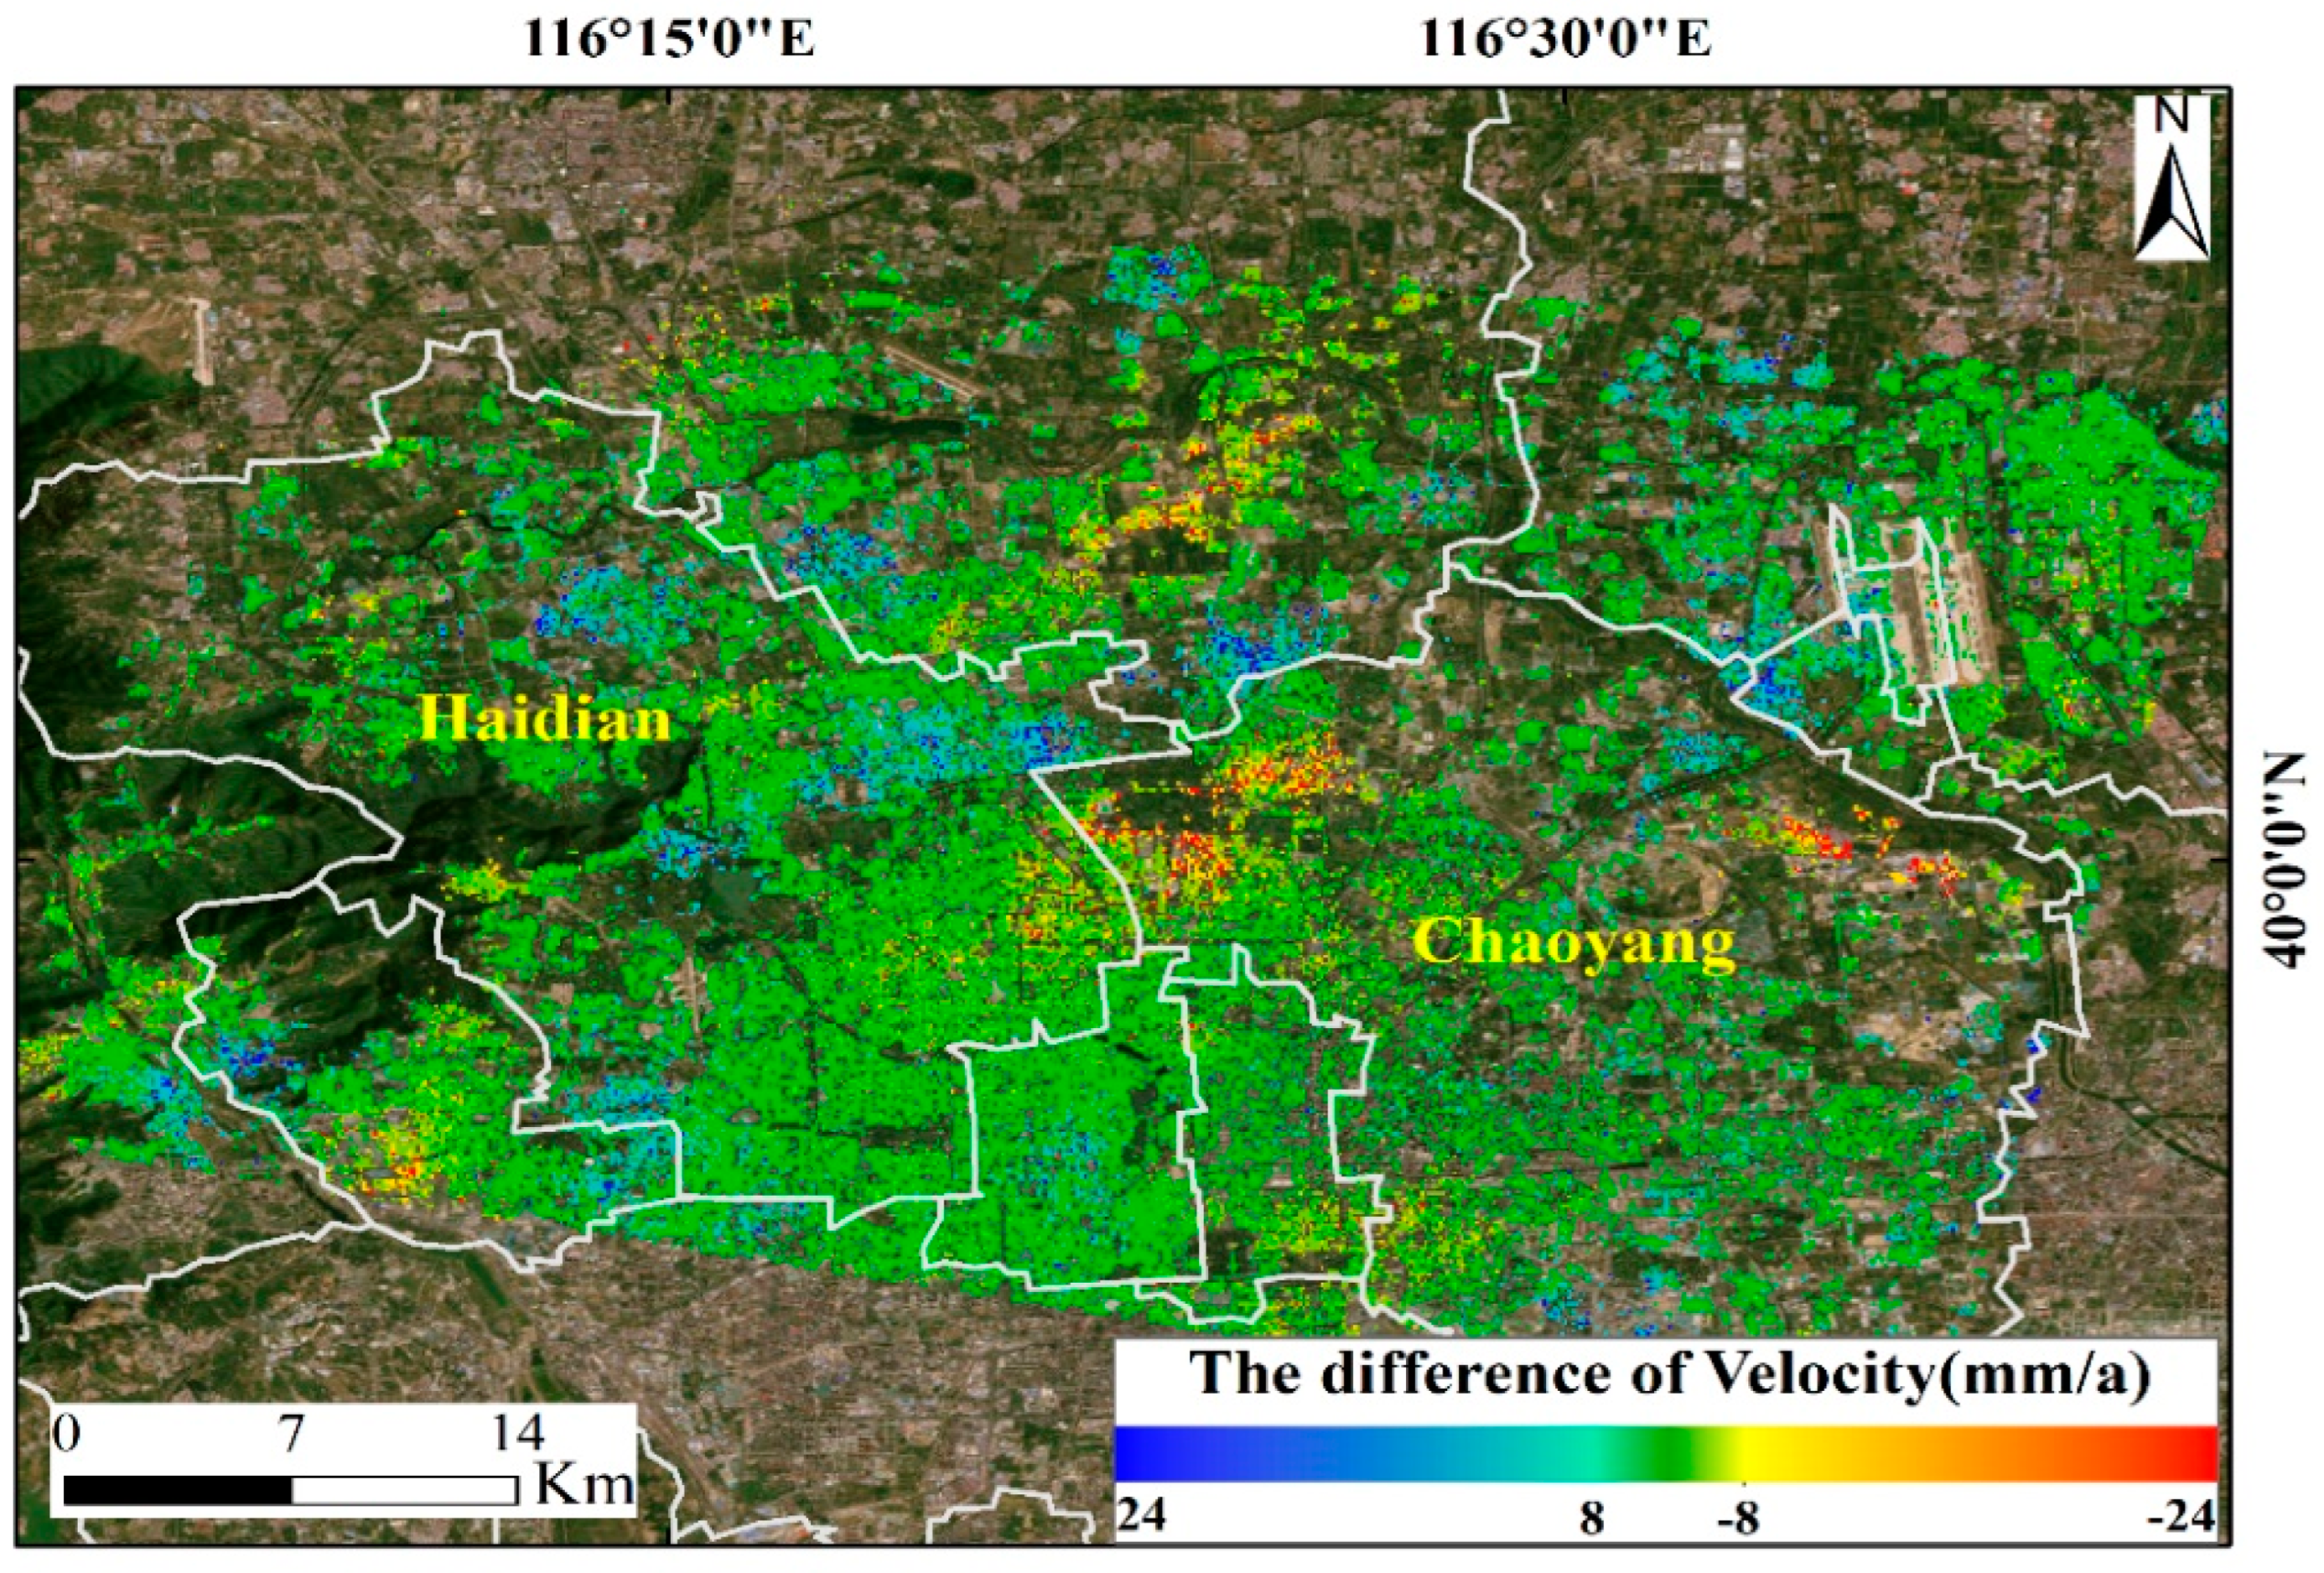
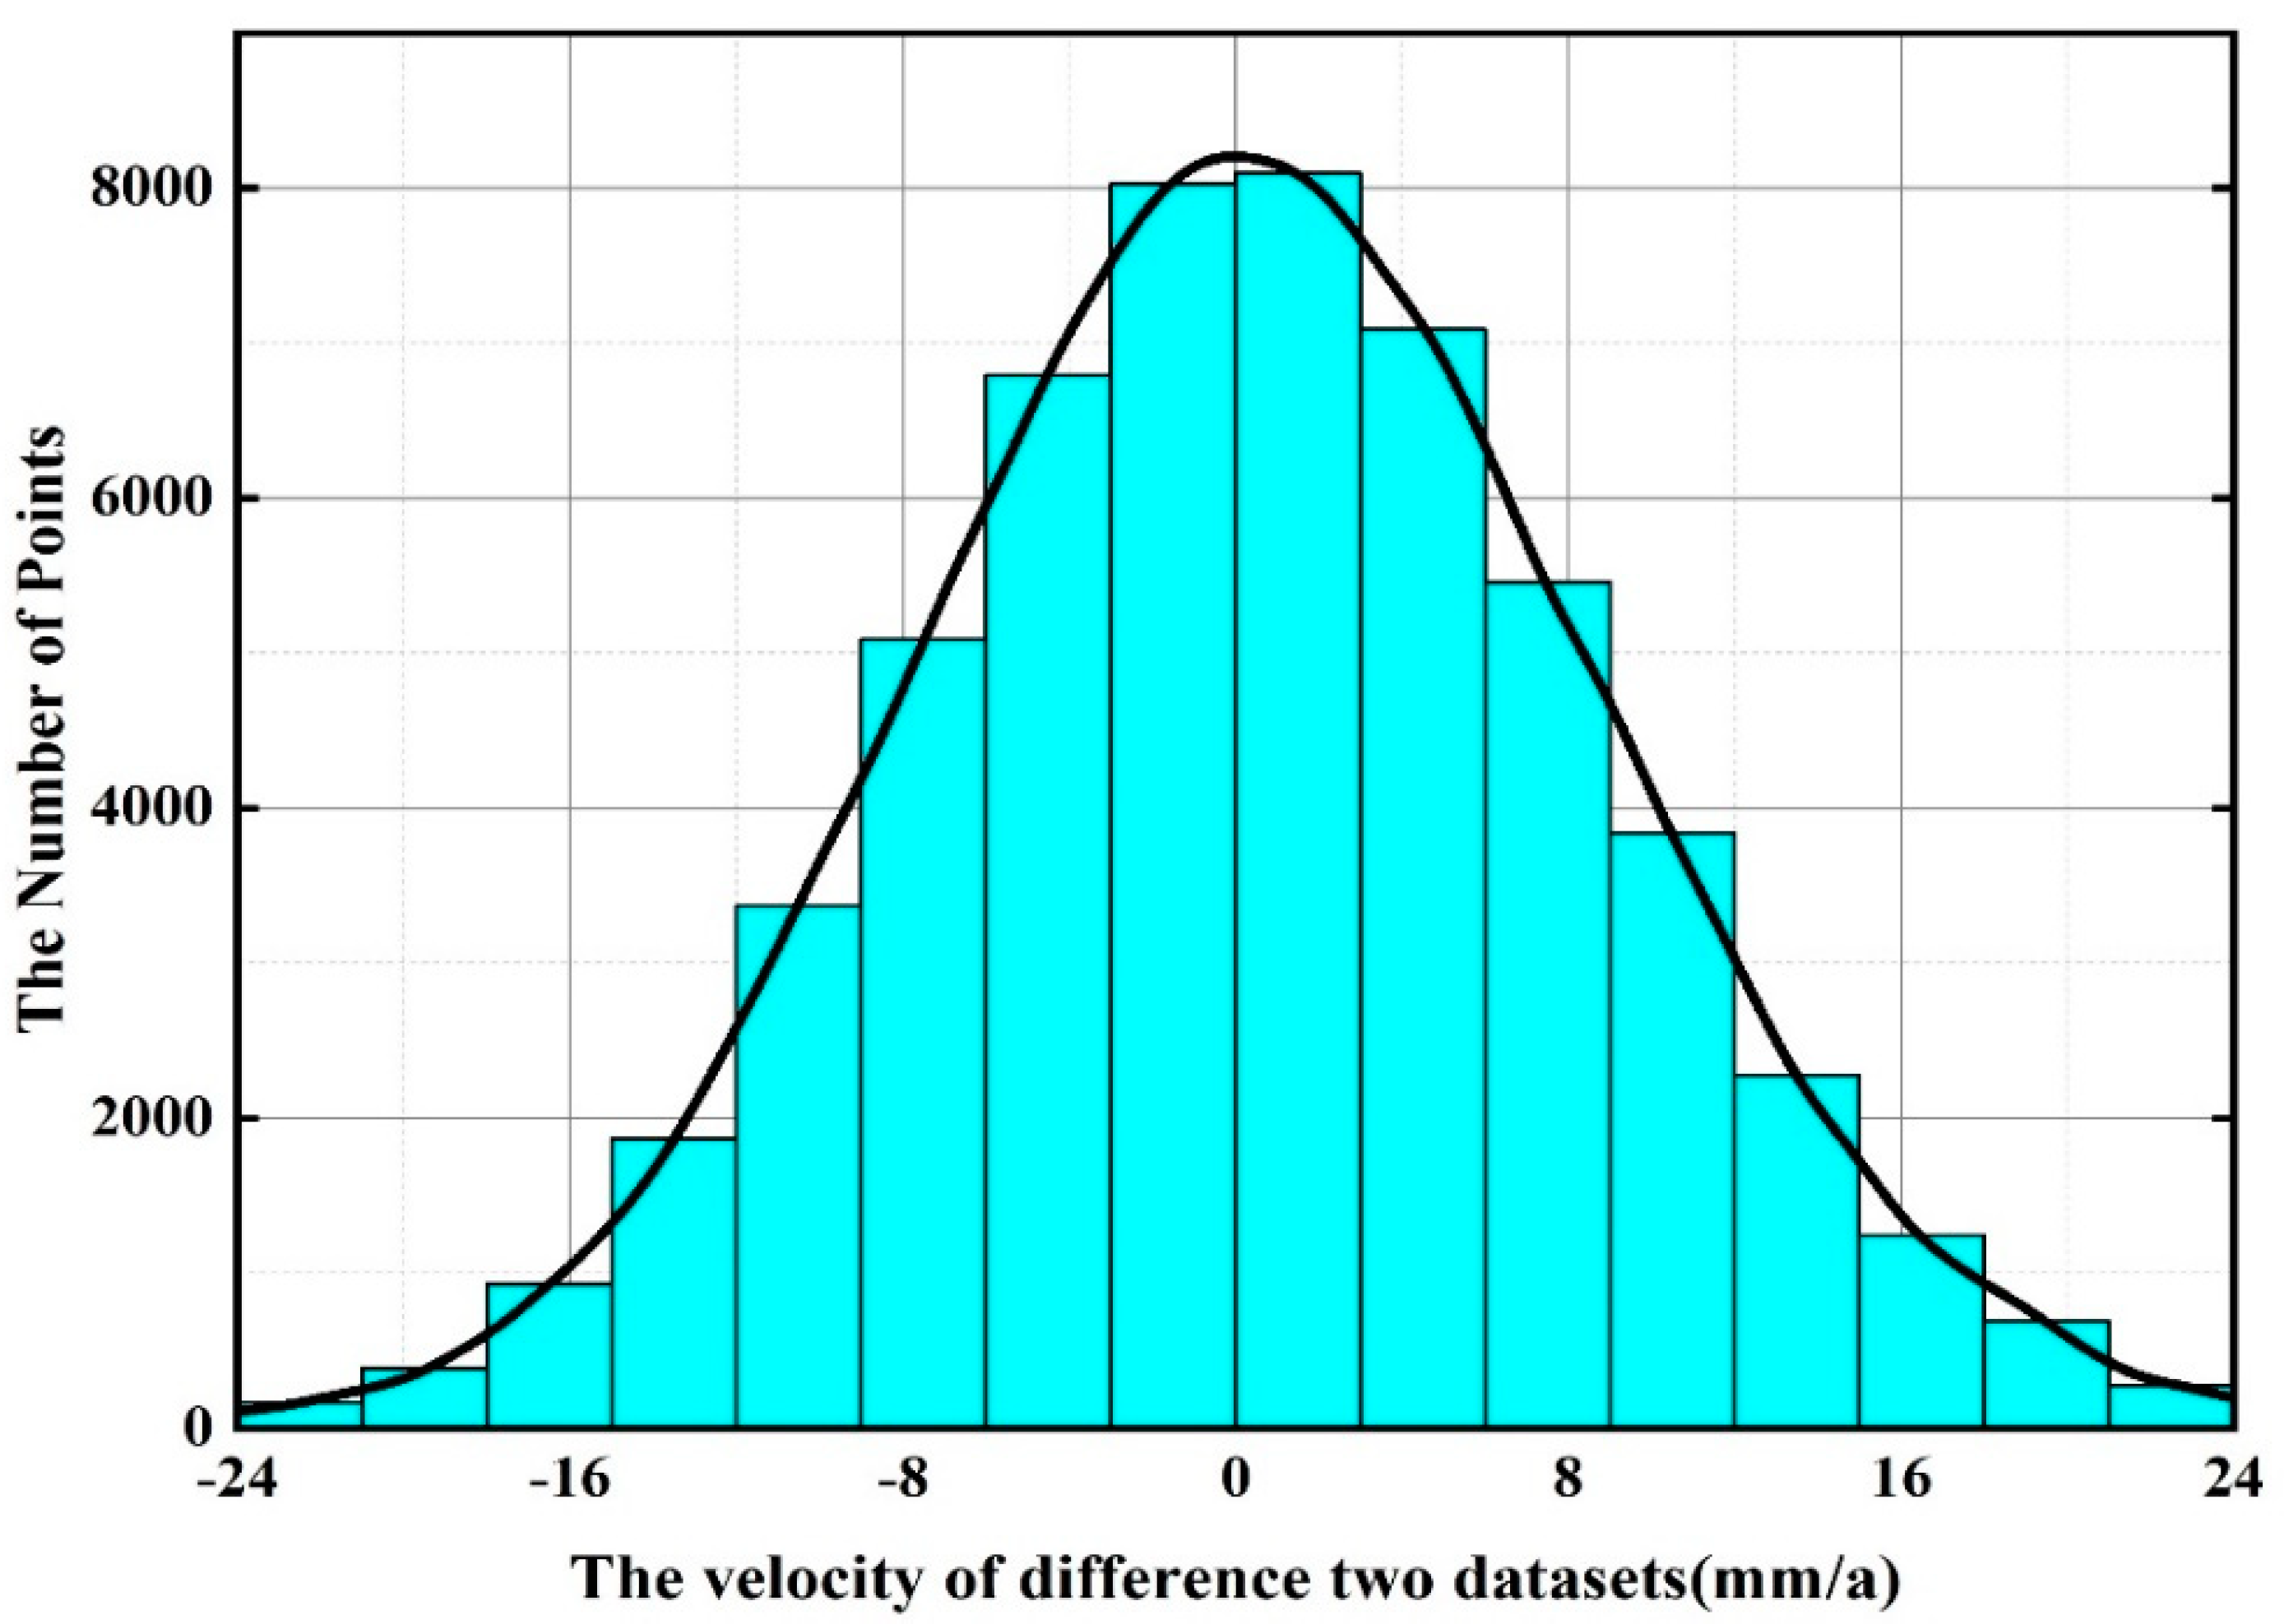
5.2. The Comparison with the Results from Sentinel-1 Images
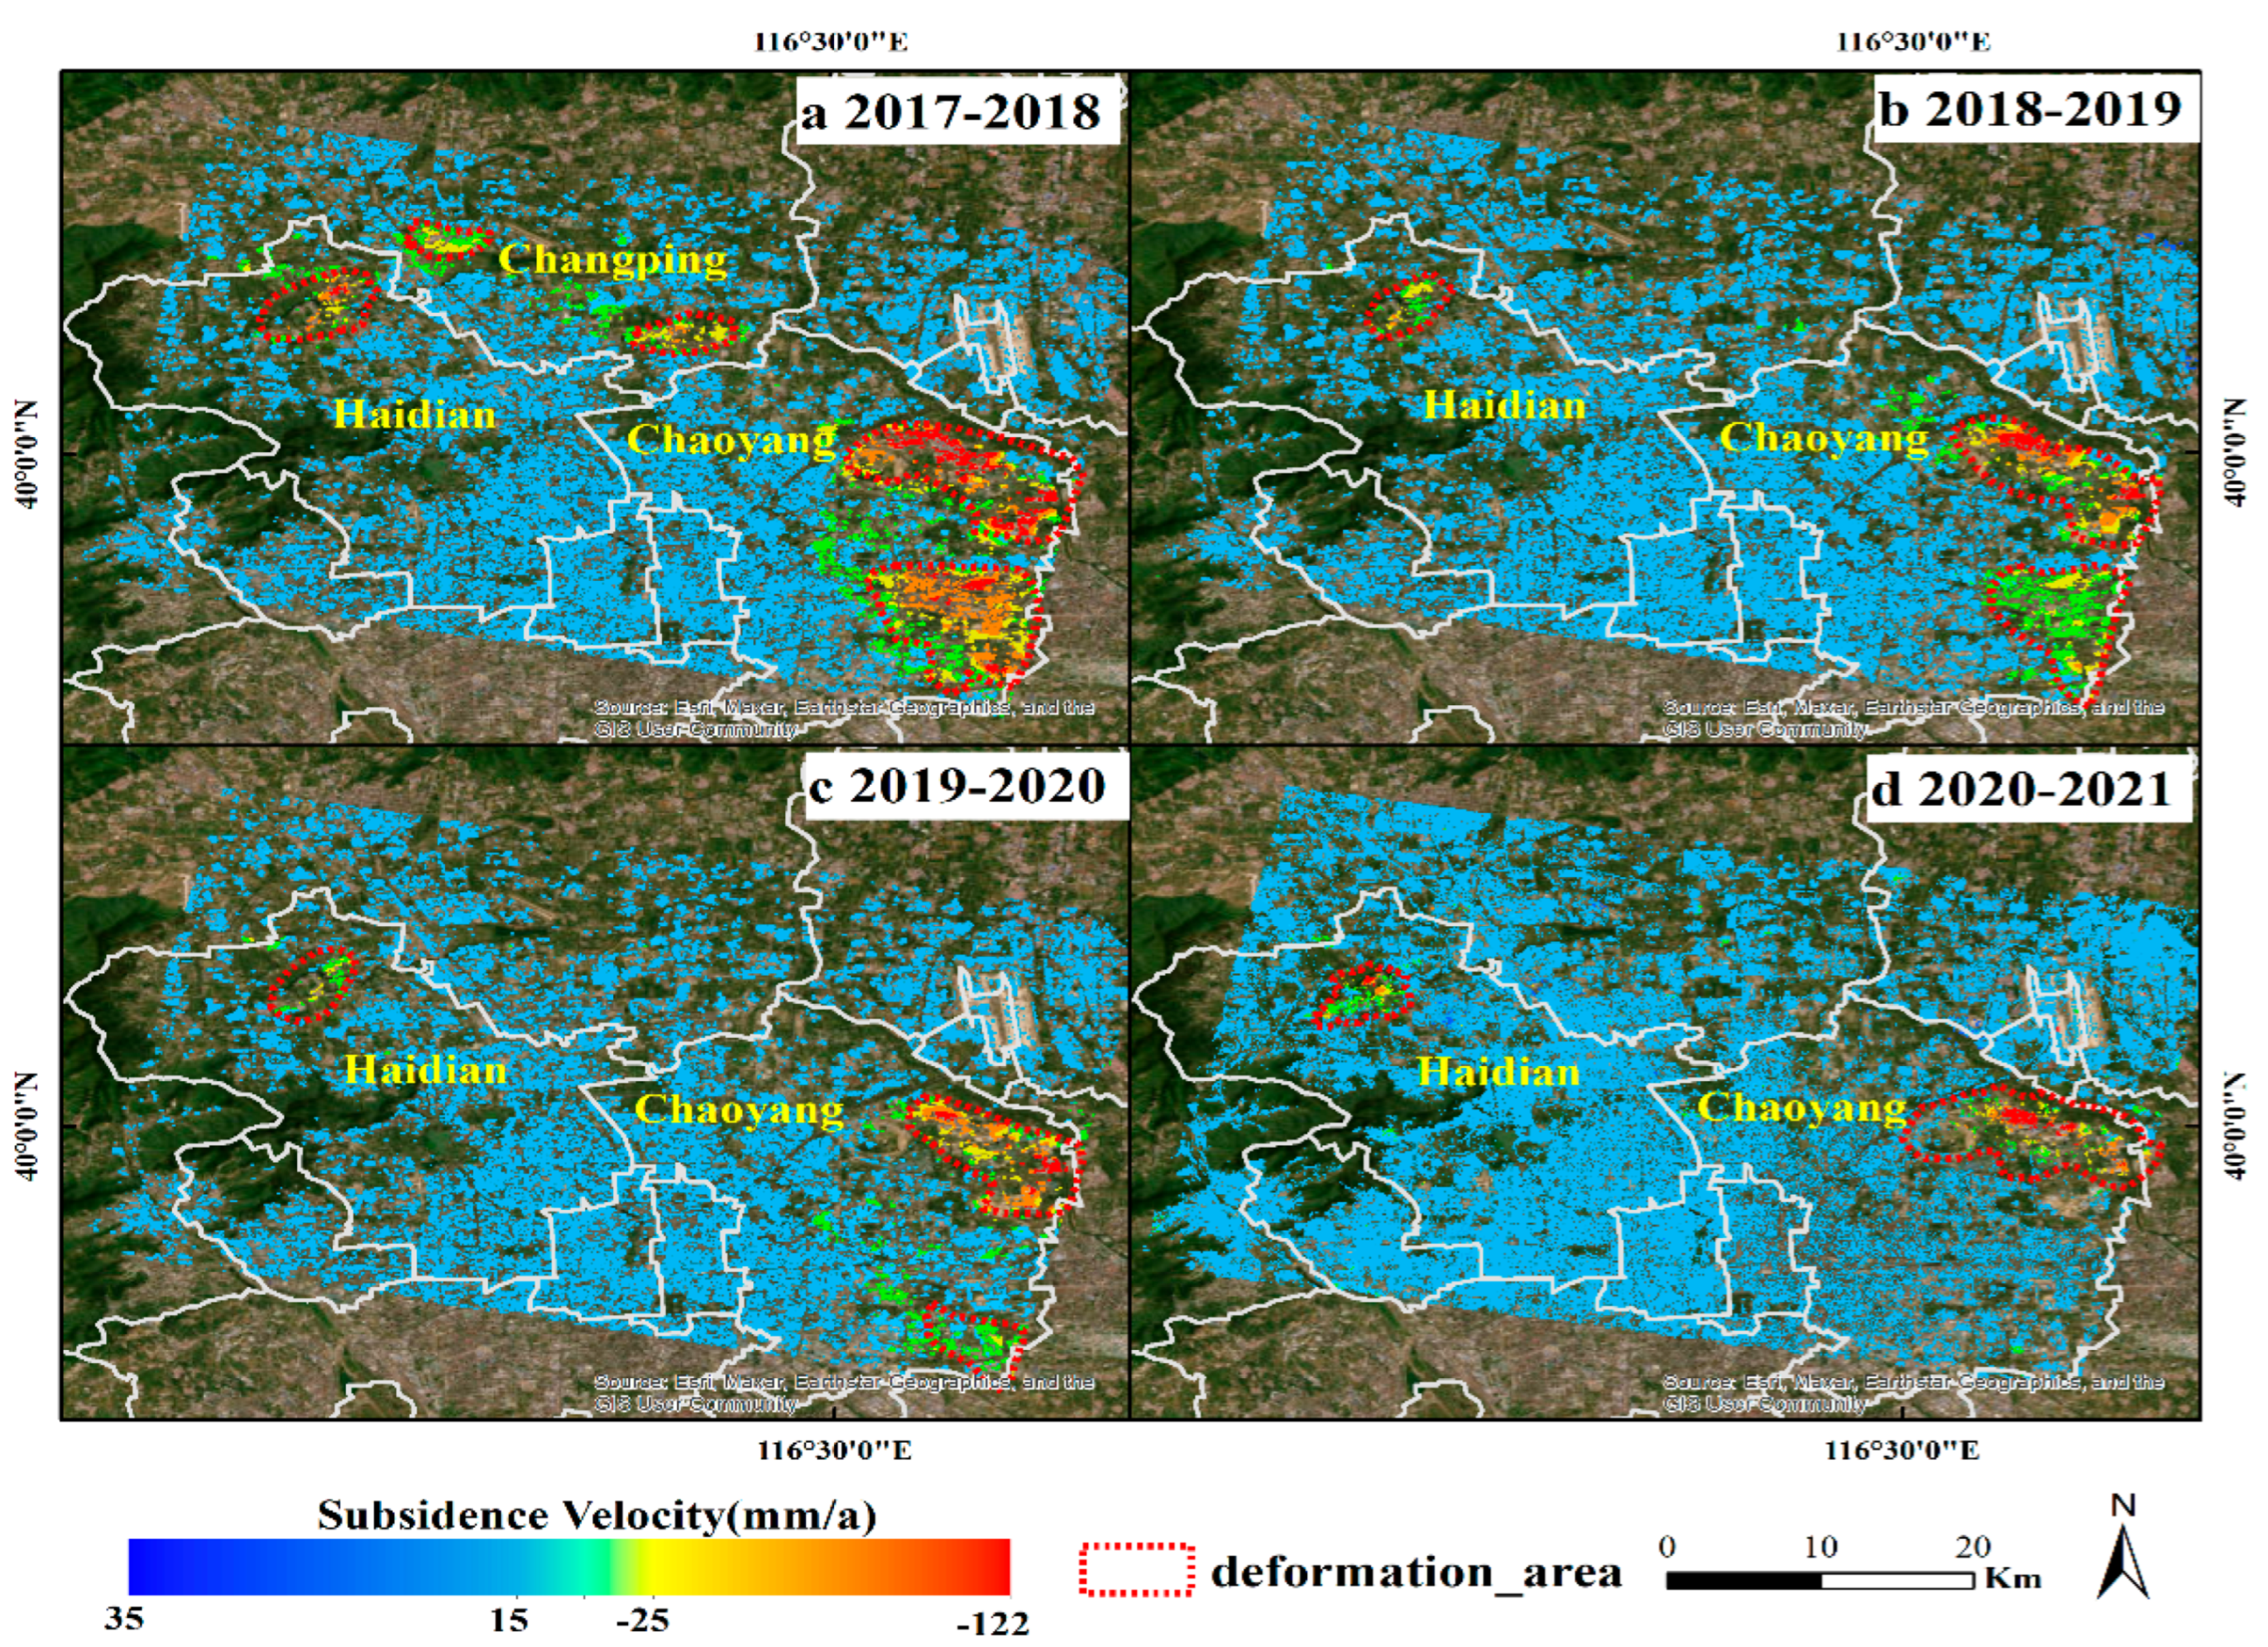
5.3. The Spatial and Temporal Evolution of Land Subsidence during 2017–2021
6. Conclusions
Author Contributions
Funding
Acknowledgments
Conflicts of Interest
References
- Herrera-García, G.; Ezquerro, P.; Tomás, R.; Béjar-Pizarro, M.; López-Vinielles, J.; Rossi, M.; Mateos, R.M.; Carreón-Freyre, D.; Lambert, J.; Teatini, P.; et al. Mapping the Global Threat of Land Subsidence. Science 2021, 371, 34–36. [Google Scholar] [CrossRef] [PubMed]
- Hu, J.; Motagh, M.; Guo, J.; Haghighi, M.H.; Li, T.; Qin, F.; Wu, W. Inferring Subsidence Characteristics in Wuhan (China) through Multitemporal InSAR and Hydrogeological Analysis. Eng. Geol. 2022, 297, 106530. [Google Scholar] [CrossRef]
- Ye, S.; Xue, Y.; Wu, J.; Yan, X.; Yu, J. Progression and Mitigation of Land Subsidence in China. Hydrogeol. J. 2016, 24, 685–693. [Google Scholar] [CrossRef]
- Dai, K.; Li, Z.; Xu, Q.; Bürgmann, R.; Milledge, D.G.; Tomas, R.; Fan, X.; Zhao, C.; Liu, X.; Peng, J.; et al. Entering the Era of Earth Observation-Based Landslide Warning Systems: A Novel and Exciting Framework. IEEE Geosci. Remote Sens. Mag. 2020, 8, 136–153. [Google Scholar] [CrossRef] [Green Version]
- Wright, T.J.; Parsons, B.E.; Lu, Z. Toward Mapping Surface Deformation in Three Dimensions Using InSAR. Geophys. Res. Lett. 2004, 31. [Google Scholar] [CrossRef] [Green Version]
- Ferretti, A.; Colombo, D.; Fumagalli, A.; Novali, F.; Rucci, A. InSAR Data for Monitoring Land Subsidence: Time to Think Big. Proc. Int. Assoc. Hydrol. Sci. 2015, 372, 331–334. [Google Scholar] [CrossRef] [Green Version]
- Hu, X.; Lu, Z.; Wang, T. Characterization of Hydrogeological Properties in Salt Lake Valley, Utah, Using InSAR. J. Geophys. Res. Earth Surf. 2018, 123, 1257–1271. [Google Scholar] [CrossRef] [Green Version]
- Zhao, C.; Liu, C.; Zhang, Q.; Lu, Z.; Yang, C. Deformation of Linfen-Yuncheng Basin (China) and Its Mechanisms Revealed by Π-RATE InSAR Technique. Remote Sens. Environ. 2018, 218, 221–230. [Google Scholar] [CrossRef]
- Bekaert, D.P.; Handwerger, A.L.; Agram, P.; Kirschbaum, D.B. InSAR-Based Detection Method for Mapping and Monitoring Slow-Moving Landslides in Remote Regions with Steep and Mountainous Terrain: An Application to Nepal. Remote Sens. Environ. 2020, 249, 111983. [Google Scholar] [CrossRef]
- Dai, K.; Deng, J.; Xu, Q.; Li, Z.; Shi, X.; Hancock, C.; Wen, N.; Zhang, L.; Zhuo, G. Interpretation and Sensitivity Analysis of the InSAR Line of Sight Displacements in Landslide Measurements. GIScience Remote Sens. 2022, 59, 1226–1242. [Google Scholar] [CrossRef]
- Lu, Z.; Dzurisin, D. InSAR Imaging of Aleutian Volcanoes. In InSAR Imaging of Aleutian Volcanoes; Springer: Berlin/Heidelberg, Germany, 2014; pp. 87–345. [Google Scholar]
- Yang, Z.; Li, Z.; Zhu, J.; Wang, Y.; Wu, L. Use of SAR/InSAR in Mining Deformation Monitoring, Parameter Inversion, and Forward Predictions: A Review. IEEE Geosci. Remote Sens. Mag. 2020, 8, 71–90. [Google Scholar] [CrossRef]
- Gourmelen, N.; Kim, S.; Shepherd, A.; Park, J.; Sundal, A.; Björnsson, H.; Pálsson, F. Ice Velocity Determined Using Conventional and Multiple-Aperture InSAR. Earth Planet. Sci. Lett. 2011, 307, 156–160. [Google Scholar] [CrossRef] [Green Version]
- Qiu, X. A Novel Proposal of Gaofen-3 Satellite Constellation for Multi-Applications. Int. Arch. Photogramm. Remote Sens. Spatial Inf. Sci. 2017, XLII-2/W7, 635–639. [Google Scholar] [CrossRef] [Green Version]
- Ren, L.; Yang, J.; Mouche, A.; Wang, H.; Wang, J.; Zheng, G.; Zhang, H. Preliminary Analysis of Chinese GF-3 SAR Quad-Polarization Measurements to Extract Winds in Each Polarization. Remote Sens. 2017, 9, 1215. [Google Scholar] [CrossRef] [Green Version]
- Yang, J.; Yuan, X.; Han, B.; Zhao, L.; Sun, J.; Shang, M.; Wang, X.; Ding, C. Phase Imbalance Analysis of GF-3 Along-Track InSAR Data for Ocean Current Measurement. Remote Sens. 2021, 13, 269. [Google Scholar] [CrossRef]
- Zheng, Y.; Chen, Z.; Zhang, G. Application and Evaluation of the Gaofen-3 Satellite on a Terrain Survey with InSAR Technology. Appl. Sci. 2020, 10, 806. [Google Scholar] [CrossRef] [Green Version]
- Wang, J.; Yu, W.; Deng, Y.; Wang, R.; Wang, Y.; Zhang, H.; Zheng, M. Demonstration of Time-Series InSAR Processing in Beijing Using a Small Stack of Gaofen-3 Differential Interferograms. J. Sens. 2019, 2019, 4204580. [Google Scholar] [CrossRef]
- Zhang, Y.; Wu, H.; Kang, Y. Ground Subsidence over Beijing-Tianjin-Hebei Region during Three Periods of 1992 to 2014 Monitored by Interferometric SAR. Acta Geod. Cartogr. Sin. 2016, 45, 1050. [Google Scholar]
- Chen, B.; Gong, H.; Li, X.; Lei, K.; Zhu, L.; Gao, M.; Zhou, C. Characterization and Causes of Land Subsidence in Beijing, China. Int. J. Remote Sens. 2017, 38, 808–826. [Google Scholar] [CrossRef]
- Guo, L.; Gong, H.; Li, J.; Zhu, L.; Xue, A.; Liao, L.; Sun, Y.; Li, Y.; Zhang, Z.; Hu, L.; et al. Understanding Uneven Land Subsidence in Beijing, China, Using a Novel Combination of Geophysical Prospecting and InSAR. Geophys. Res. Lett. 2020, 47, e2020GL088676. [Google Scholar] [CrossRef]
- Zhu, L.; Gong, H.; Chen, Y.; Wang, S.; Ke, Y.; Guo, G.; Li, X.; Chen, B.; Wang, H.; Teatini, P. Effects of Water Diversion Project on Groundwater System and Land Subsidence in Beijing, China. Eng. Geol. 2020, 276, 105763. [Google Scholar] [CrossRef]
- Du, Z.; Ge, L.; Ng, A.H.-M.; Lian, X.; Zhu, Q.; Horgan, F.G.; Zhang, Q. Analysis of the Impact of the South-to-North Water Diversion Project on Water Balance and Land Subsidence in Beijing, China between 2007 and 2020. J. Hydrol. 2021, 603, 126990. [Google Scholar] [CrossRef]
- Liang, F.; Sun, J.; Shen, Z.; Xu, X. Accumulated Crustal Deformation and Its Characteristics in Beijing and Surrounding Regions in 2007–2010 from L-Band InSAR. Earthquake 2013, 33, 43–54. [Google Scholar]
- Ng, A.H.-M.; Ge, L.; Li, X.; Zhang, K. Monitoring Ground Deformation in Beijing, China with Persistent Scatterer SAR Interferometry. J. Geod. 2012, 86, 375–392. [Google Scholar] [CrossRef]
- Chen, B.; Gong, H.; Chen, Y.; Li, X.; Zhou, C.; Lei, K.; Zhu, L.; Duan, L.; Zhao, X. Land Subsidence and Its Relation with Groundwater Aquifers in Beijing Plain of China. Sci. Total Environ. 2020, 735, 139111. [Google Scholar] [CrossRef]
- Zhang, S.; Zhang, Y.; Yu, J.; Fan, Q.; Si, J.; Zhu, W.; Song, M. Interpretation of the Spatiotemporal Evolution Characteristics of Land Deformation in Beijing during 2003–2020 Using Sentinel, ENVISAT, and Landsat Data. Remote Sens. 2022, 14, 2242. [Google Scholar] [CrossRef]
- Zhou, C.; Gong, H.; Chen, B.; Li, X.; Li, J.; Wang, X.; Gao, M.; Si, Y.; Guo, L.; Shi, M.; et al. Quantifying the Contribution of Multiple Factors to Land Subsidence in the Beijing Plain, China with Machine Learning Technology. Geomorphology 2019, 335, 48–61. [Google Scholar] [CrossRef]
- Bai, Z.; Wang, Y.; Balz, T. Beijing Land Subsidence Revealed Using PS-InSAR with Long Time Series TerraSAR-X SAR Data. Remote Sens. 2022, 14, 2529. [Google Scholar] [CrossRef]
- Zhou, Z.; Yao, X.; Ren, K.; Liu, H. Formation Mechanism of Ground Fissure at Beijing Capital International Airport Revealed by High-Resolution InSAR and Numerical Modelling. Eng. Geol. 2022, 306, 106775. [Google Scholar] [CrossRef]
- Du, Z.; Ge, L.; Ng, A.H.-M.; Xiaojing, L.; Li, L. Mapping Land Subsidence over the Eastern Beijing City Using Satellite Radar Interferometry. Int. J. Digit. Earth 2018, 11, 504–519. [Google Scholar] [CrossRef]
- Liu, B.; Li, M.; Zhang, L.; Ge, D. Monitoring Beijing-Tianjin Region Land Subsidence Using ALOS-2 Scansar Images. In Proceedings of the 2021 IEEE International Geoscience and Remote Sensing Symposium IGARSS, Brussels, Belgium, 11–16 July 2021; IEEE: Piscataway, NJ, USA, 2021; pp. 5338–5341. [Google Scholar]
- Ning, J.; Wang, R.; Wang, J.; Zhang, B.; Zhao, S. Ionospheric Correction of ALOS-2 Full-Aperture ScanSAR Interferometric Data for Surface Deformation Measurement in Beijing. J. Eng. 2019, 2019, 5685–5688. [Google Scholar] [CrossRef]
- Hu, L.; Dai, K.; Xing, C.; Li, Z.; Tomás, R.; Clark, B.; Shi, X.; Chen, M.; Zhang, R.; Qiu, Q.; et al. Land Subsidence in Beijing and Its Relationship with Geological Faults Revealed by Sentinel-1 InSAR Observations. Int. J. Appl. Earth Obs. Geoinf. 2019, 82, 101886. [Google Scholar] [CrossRef]
- Chen, B.; Gong, H.; Lei, K.; Li, J.; Zhou, C.; Gao, M.; Guan, H.; Lv, W. Land Subsidence Lagging Quantification in the Main Exploration Aquifer Layers in Beijing Plain, China. Int. J. Appl. Earth Obs. Geoinf. 2019, 75, 54–67. [Google Scholar] [CrossRef]
- Zhang, Y.; Gong, H.; Gu, Z.; Wang, R.; Li, X.; Zhao, W. Characterization of Land Subsidence Induced by Groundwater Withdrawals in the Plain of Beijing City, China. Hydrogeol. J. 2014, 22, 397–409. [Google Scholar] [CrossRef]
- Hassen, R. Radar Interferometry; Kluwer Academic Publishers: Alphen am Rhine, The Netherlands, 2001. [Google Scholar]
- Ferretti, A. Satellite InSAR Data: Reservoir Monitoring from Space; EAGE Publications: Bunnik, The Netherlands, 2014. [Google Scholar]
- Foroughnia, F.; Nemati, S.; Maghsoudi, Y.; Perissin, D. An Iterative PS-InSAR Method for the Analysis of Large Spatio-Temporal Baseline Data Stacks for Land Subsidence Estimation. Int. J. Appl. Earth Obs. Geoinf. 2019, 74, 248–258. [Google Scholar] [CrossRef]
- Li, J.; Xin, J. Research on Flat Earth Removal Techniques of INSAR. Adv. Mater. Res. 2012, 433, 7487–7492. [Google Scholar] [CrossRef]
- Berardino, P.; Fornaro, G.; Lanari, R.; Sansosti, E. A New Algorithm for Surface Deformation Monitoring Based on Small Baseline Differential SAR Interferograms. IEEE Trans. Geosci. Remote Sens. 2002, 40, 2375–2383. [Google Scholar] [CrossRef] [Green Version]
- Qu, F.; Lu, Z.; Zhang, Q.; Bawden, G.W.; Kim, J.-W.; Zhao, C.; Qu, W. Mapping Ground Deformation over Houston–Galveston, Texas Using Multi-Temporal InSAR. Remote Sens. Environ. 2015, 169, 290–306. [Google Scholar] [CrossRef]
- Hooper, A.; Zebker, H.; Segall, P.; Kampes, B. A New Method for Measuring Deformation on Volcanoes and Other Natural Terrains Using InSAR Persistent Scatterers. Geophys. Res. Lett. 2004, 31. [Google Scholar] [CrossRef]
- Galve, J.P.; Pérez-Peña, J.V.; Azañón, J.M.; Closson, D.; Caló, F.; Reyes-Carmona, C.; Jabaloy, A.; Ruano, P.; Mateos, R.M.; Notti, D.; et al. Evaluation of the SBAS InSAR Service of the European Space Agency’s Geohazard Exploitation Platform (GEP). Remote Sens. 2017, 9, 1291. [Google Scholar] [CrossRef] [Green Version]
- Ferretti, A.; Prati, C.; Rocca, F. Permanent Scatterers in SAR Interferometry. IEEE Trans. Geosci. Remote Sens. 2001, 39, 8–20. [Google Scholar] [CrossRef]
- Hooper, A.; Segall, P.; Zebker, H. Persistent Scatterer InSAR for Crustal Deformation Analysis, with Application to Volcán Alcedo, Galápagos. J. Geophys. Res. 2007, 112, 19. [Google Scholar]
- Qu, F.; Zhang, Q.; Niu, Y.; Lu, Z.; Wang, S.; Zhao, C.; Zhu, W.; Qu, W.; Yang, C. Mapping the Recent Vertical Crustal Deformation of the Weihe Basin (China) Using Sentinel-1 and ALOS-2 ScanSAR Imagery. Remote Sens. 2022, 14, 3182. [Google Scholar] [CrossRef]
- Qu, F.; Zhang, Q.; Lu, Z.; Zhao, C.; Yang, C.; Zhang, J. Land Subsidence and Ground Fissures in Xi’an, China 2005–2012 Revealed by Multi-Band InSAR Time-Series Analysis. Remote Sens. Environ. 2014, 155, 366–376. [Google Scholar] [CrossRef]
- Hooper, A. A Multi-Temporal InSAR Method Incorporating Both Persistent Scatterer and Small Baseline Approaches. Geophys. Res. Lett. 2008, 35. [Google Scholar] [CrossRef] [Green Version]
- Hooper, A.; Zebker, H.A. Phase Unwrapping in Three Dimensions with Application to InSAR Time Series. JOSA A 2007, 24, 2737–2747. [Google Scholar] [CrossRef] [Green Version]
- Bueso-Bello, J.-L.; Martone, M.; Prats-Iraola, P.; Bräutigam, B. First Characterization and Performance Evaluation of Bistatic TanDEM-X Experimental Products. IEEE J. Sel. Top. Appl. Earth Obs. Remote Sens. 2015, 9, 1058–1071. [Google Scholar] [CrossRef]


| Sensor | Gaofen-3 | Sentinel-1 |
|---|---|---|
| Wavelength(cm) | 5.55 | 5.54 |
| Central frequency (GHz) | 5.400 | 5.405 |
| Incidence angle (°) | 27.8145 | 39.1040 |
| Resolution (Azimuth by range m) | 1.12 × 2.61 | 2.32 × 13.93 |
| Number of SAR images | 8 | 111 |
| Acquisition period | 9 June 2020–26 March 2021 | 13 June 2017–4 May 2021 |
| Band | C | C |
| Orbit direction | Descending | Ascending |
| Acquisition mode | FSI | SM |
| Sensor | Gaofen-3 | Sentinel-1 |
|---|---|---|
| Date of interferogram | 27 January 2021–25 Febuary 2021 | 23 January 2021–28 Febuary 2021 |
| Coherence | 0.4153 | 0.5138 |
| NESZ (SNR−1) | −22.0 dB | −21.3 dB |
| Baseline of interferograms | 1156 m | 45 m |
| ) | 10 km | 6.6 km |
Disclaimer/Publisher’s Note: The statements, opinions and data contained in all publications are solely those of the individual author(s) and contributor(s) and not of MDPI and/or the editor(s). MDPI and/or the editor(s) disclaim responsibility for any injury to people or property resulting from any ideas, methods, instructions or products referred to in the content. |
© 2023 by the authors. Licensee MDPI, Basel, Switzerland. This article is an open access article distributed under the terms and conditions of the Creative Commons Attribution (CC BY) license (https://creativecommons.org/licenses/by/4.0/).
Share and Cite
Han, Y.; Li, T.; Dai, K.; Lu, Z.; Yuan, X.; Shi, X.; Liu, C.; Wen, N.; Zhang, X. Revealing the Land Subsidence Deceleration in Beijing (China) by Gaofen-3 Time Series Interferometry. Remote Sens. 2023, 15, 3665. https://doi.org/10.3390/rs15143665
Han Y, Li T, Dai K, Lu Z, Yuan X, Shi X, Liu C, Wen N, Zhang X. Revealing the Land Subsidence Deceleration in Beijing (China) by Gaofen-3 Time Series Interferometry. Remote Sensing. 2023; 15(14):3665. https://doi.org/10.3390/rs15143665
Chicago/Turabian StyleHan, Yakun, Tao Li, Keren Dai, Zhong Lu, Xinzhe Yuan, Xianlin Shi, Chen Liu, Ningling Wen, and Xi Zhang. 2023. "Revealing the Land Subsidence Deceleration in Beijing (China) by Gaofen-3 Time Series Interferometry" Remote Sensing 15, no. 14: 3665. https://doi.org/10.3390/rs15143665