Article

Object-Oriented Remote Sensing Approaches for the Detection of Terrestrial Impact Craters as a Reconnaissance Survey

by
Habimana Emmanuel
1,2,
Jaehyung Yu
1,3,*,
Lei Wang
4,
Sung Hi Choi
1,3 and
Digne Edmond Rwabuhungu Rwatangabo
2
1
Department of Astronomy, Space Science and Geology, Chungnam National University, Daejeon 34134, Republic of Korea
2
School of Mining and Geology, University of Rwanda, Kigali 3900, Rwanda
3
Department of Geological Sciences, Chungnam National University, Daejeon 31134, Republic of Korea
4
Department of Geography & Anthropology, Louisiana State University, Baton Rouge, LA 70803, USA
*
Author to whom correspondence should be addressed.
Remote Sens. 2023, 15(15), 3807; https://doi.org/10.3390/rs15153807
Submission received: 11 June 2023 / Revised: 21 July 2023 / Accepted: 27 July 2023 / Published: 31 July 2023

Abstract

:
The purpose of this study is to employ a remote sensing reconnaissance survey based on optimal segmentation parameters and an object-oriented random forest approach to the identification of possible terrestrial impact craters from the global 30-m resolution SRTM DEM. A dataset consisting of 94 confirmed and well-preserved terrestrial impact craters, 104 volcanic calderas, and 124 valleys were extracted from real-world surface features. For craters with different sizes, eight optimal scale parameters from 80 to 3000 have been identified using multi-resolution segmentation, where the scale parameters have a positive correlation (R2 = 0.78) with the diameters of craters. The object-oriented random forest approach classified the tested impact craters, volcanic calderas, and valleys with an overall accuracy of 88.4% and a Kappa coefficient of 0.8. The investigated terrestrial impact craters, in general, have relatively lower rim circularity, higher length-to-width ratio, and lower relief, slope, and elevation than volcanic calderas. The topographic characteristics can be explained by geological processes associated with the formation and post-deformation of impact craters. The excavation and ejection by initial impact and rebound of excavated materials contribute to low elevation. The post-impact deformation, including inward collapse and slump of unstable rims, weathering, erosion, and sediment deposition, further reduces elevation and relief and modifies shapes resulting in lower circularity and higher length-to-width ratio. Due to the resolution limitation of the source DEM data and the number of real-world samples, the model has only been validated for craters of 0.88 to 100 km in diameter, which can be generalized to explore undiscovered terrestrial impact craters using cloud computing with global datasets provided by platforms such as Google Earth Engine and Microsoft Planetary Computer.

Graphical Abstract

1. Introduction

Impact craters are important geological features in planetary sciences formed by comets or asteroids colliding with the planetary surface [1]. The circular or sub-circular topographic feature represents the energy level of the meteorite impact, which can be observed by satellites [2]. Impact craters have been one of the major scientific focuses in the science community because they provide evidence for inference of planet of evolution and understanding of space materials [3]. Moreover, they are a critical indicator related to space hazards inducing secondary earthquakes and tsunamis [4]. Estimating impact crater ages assist in quantifying impact flux in the geological time scale and relates to other geological events in Earth’s history [5]. Therefore, geoscientists have made substantial endeavors to detect and describe impact crater landscapes based on various sources such as remote sensing, geophysics, and geological data.
The number of confirmed craters is biased by the disparity in survey technology because most confirmed craters are located in developed countries [6]. Kenkmann et al. [7] reported 198 confirmed and 10 suspected impact craters unevenly distributed worldwide, with 65 in North America, 54 in Europe, 31 in Australia, 23 in Asia, 21 in Africa, and 14 in South America [7]. The regional differences indicate that the number of impact craters in developing countries should be higher than the current reports, and more cases could be identified in those low-finding areas.
Identification of terrestrial impact craters usually requires two major steps. The first step is the preliminary identification of crater candidates through remote sensing, including topographic, optical, gravity, or magnetic surveys, and the second step is a conclusive investigation by intensive geological surveys, including well-logging, lab analysis, geochemical analysis, and shock metamorphic experiments. These confirm the impact craters with ultimate evidence (shatter cones and planar deformation features, etc.) [8,9,10]. Remote sensing can provide worldwide coverage of preliminary assessment of possible crater locations to narrow down candidates using satellite data [11,12]. In addition, geophysical surveys play a major role in the identification of deeply eroded or buried suspected impact structures [13,14].
The topographic features from Digital Elevation Models (DEMs) can be used to identify possible candidates based on geomorphological characteristics such as crater rims and ring structures [9,15]. DEMs also can be used to define geomorphological parameters of confirmed caters from sophisticated geological surveys [16,17,18]. Additionally, the drainage networks associated with impact structures are also analyzed to trace the extent of the drainage basin [15]. The drainage network within a preserved impact crater shows drainage patterns such as centripetal or centrifugal radial drainage and sometimes concentric drainage where crater rims act as catchment [7,15].
Multispectral satellite data have been used to derive structure features and lithological discontinuities that might be related to impact cratering [11,15]. Linear features extracted from Landsat satellite data revealed the orientation of linear geological structures and distribution of lithological units, such as ejecta of brecciated materials and shock-induced alterations [15,19]. Radial and annular lineament patterns have been observed in several exposed impact structures as a result of concentric depressions and rim escarpments [9].
Furthermore, automatic computer algorithms have been used to detect impact craters based on the circular morphometric resemblance of impact structures displayed in remote sensing data [20]. Various Crater Detection Algorithms (CDAs) have been used on extraterrestrial impact craters such as lunar and Mars craters [21,22]. However, limited attempts have been made for the automatic detection of terrestrial craters [23]. Masaitis et al. [24] and Kenkmann et al. [7] highlighted that complex geological processes and size variations of terrestrial impact craters would hinder the automatic detection of terrestrial impact craters. Li et al. [25] also reported a challenge in distinguishing impact craters, volcanos, and valleys in deep learning for automatic crater detection because they share similar characteristics to the natural image.
The three types of impact crater, simple crater, complex crater, and impact crater basin, have distinctive topographic characteristics [2]. Typical fresh, simple impact craters have bowl-shaped depressions with a diameter of around 2 km for those formed in sedimentary rocks and about 4 km for crystalline rocks [8,26]. Fresh, complex impact craters also occur as circular or sub-circular topographic features with fresh central uplift peaks or concentric peak rings and a diameter greater than about 4 km. In addition, complex craters have a smaller depth-to-diameter ratio than simple craters [27,28]. Fresh impact crater basins have a relatively flat floor with one or more discrete terraces and the absence of sharp bowl-shaped topography and central uplift [28]. The impact basins have a diameter ranging from 3 km to 10 km [7].
Previous studies on the detection of impact craters using remote sensing have been focused on extraterrestrial impact craters, with few studies on terrestrial impact craters. This study aims to provide a reconnaissance survey method for the identification of possible terrestrial impact craters from global datasets. In view of the geometric characteristics of impact craters, DEMs can provide quantification of the geometric variables and, therefore, are the ideal data sources for reconnaissance surveys. For model development, this study collected 94 confirmed and well-preserved impact craters worldwide. Then, based on object attributes, a machine learning algorithm was tested for the classification of terrestrial impact craters from similarly shaped topography and commonly found land features such as volcanic calderas and valleys. The most important variables for differentiating impact craters from other terrestrial topographic features were identified using the machine learning algorithm. We expect this approach could contribute to the discovery of new impact craters with well-preserved topography.

2. Materials and Methods

To determine the optimal segmentation parameters for the detection of the exposed impact craters, the study investigated 94 confirmed exposed impact craters, including 24 simple, 66 complex, and 4 impact crater basins (~45% worldwide craters). The exposed impact craters can be defined as impact craters with a clear and easy-to-recognize circular morphology [7]. After the derivation of optimal segmentation parameters to define impact crater objects, object-based classification was carried out to test the detection of impact craters. In general, the morphology of impact craters can be defined as a circular depression bordered by an upraised rim formed by concentric normal faults and rebound of ejected materials [29]. We selected volcanic calderas to test classification efficiency with regard to features with similar topography. Volcanic calderas have circular depressions bordered by concentric or ring faults formed by the subsidence of the roof of the magma chamber due to the withdrawal of magma [30]. The ring faults of calderas exhibit geometrical properties similar to impact craters, such as diameter, topographic depression, and circular shape [31]. Therefore, this study included 104 volcanic calderas (44 single-pit and 60 coalesced-pit calderas) distributed over the world to test the detection efficiency of impact craters from similar topographic features (Figure 1, Appendix A, Table A2). Single-pit calderas are generally recognized by a single large depression, while coalesced-pit calderas are recognized by multiple interconnected depressions within a broader area [32,33,34]. This study also included valleys as an additional class for the classification model, which are common features associated with mountainous areas. We included 124 valleys to test the common features that can interfere with the detection of impact craters. The valleys have relatively shallow and wide depressions with gentle slope landforms, where the composite of valleys can form watersheds with various forms, such as fan or half-circle shapes [35,36].

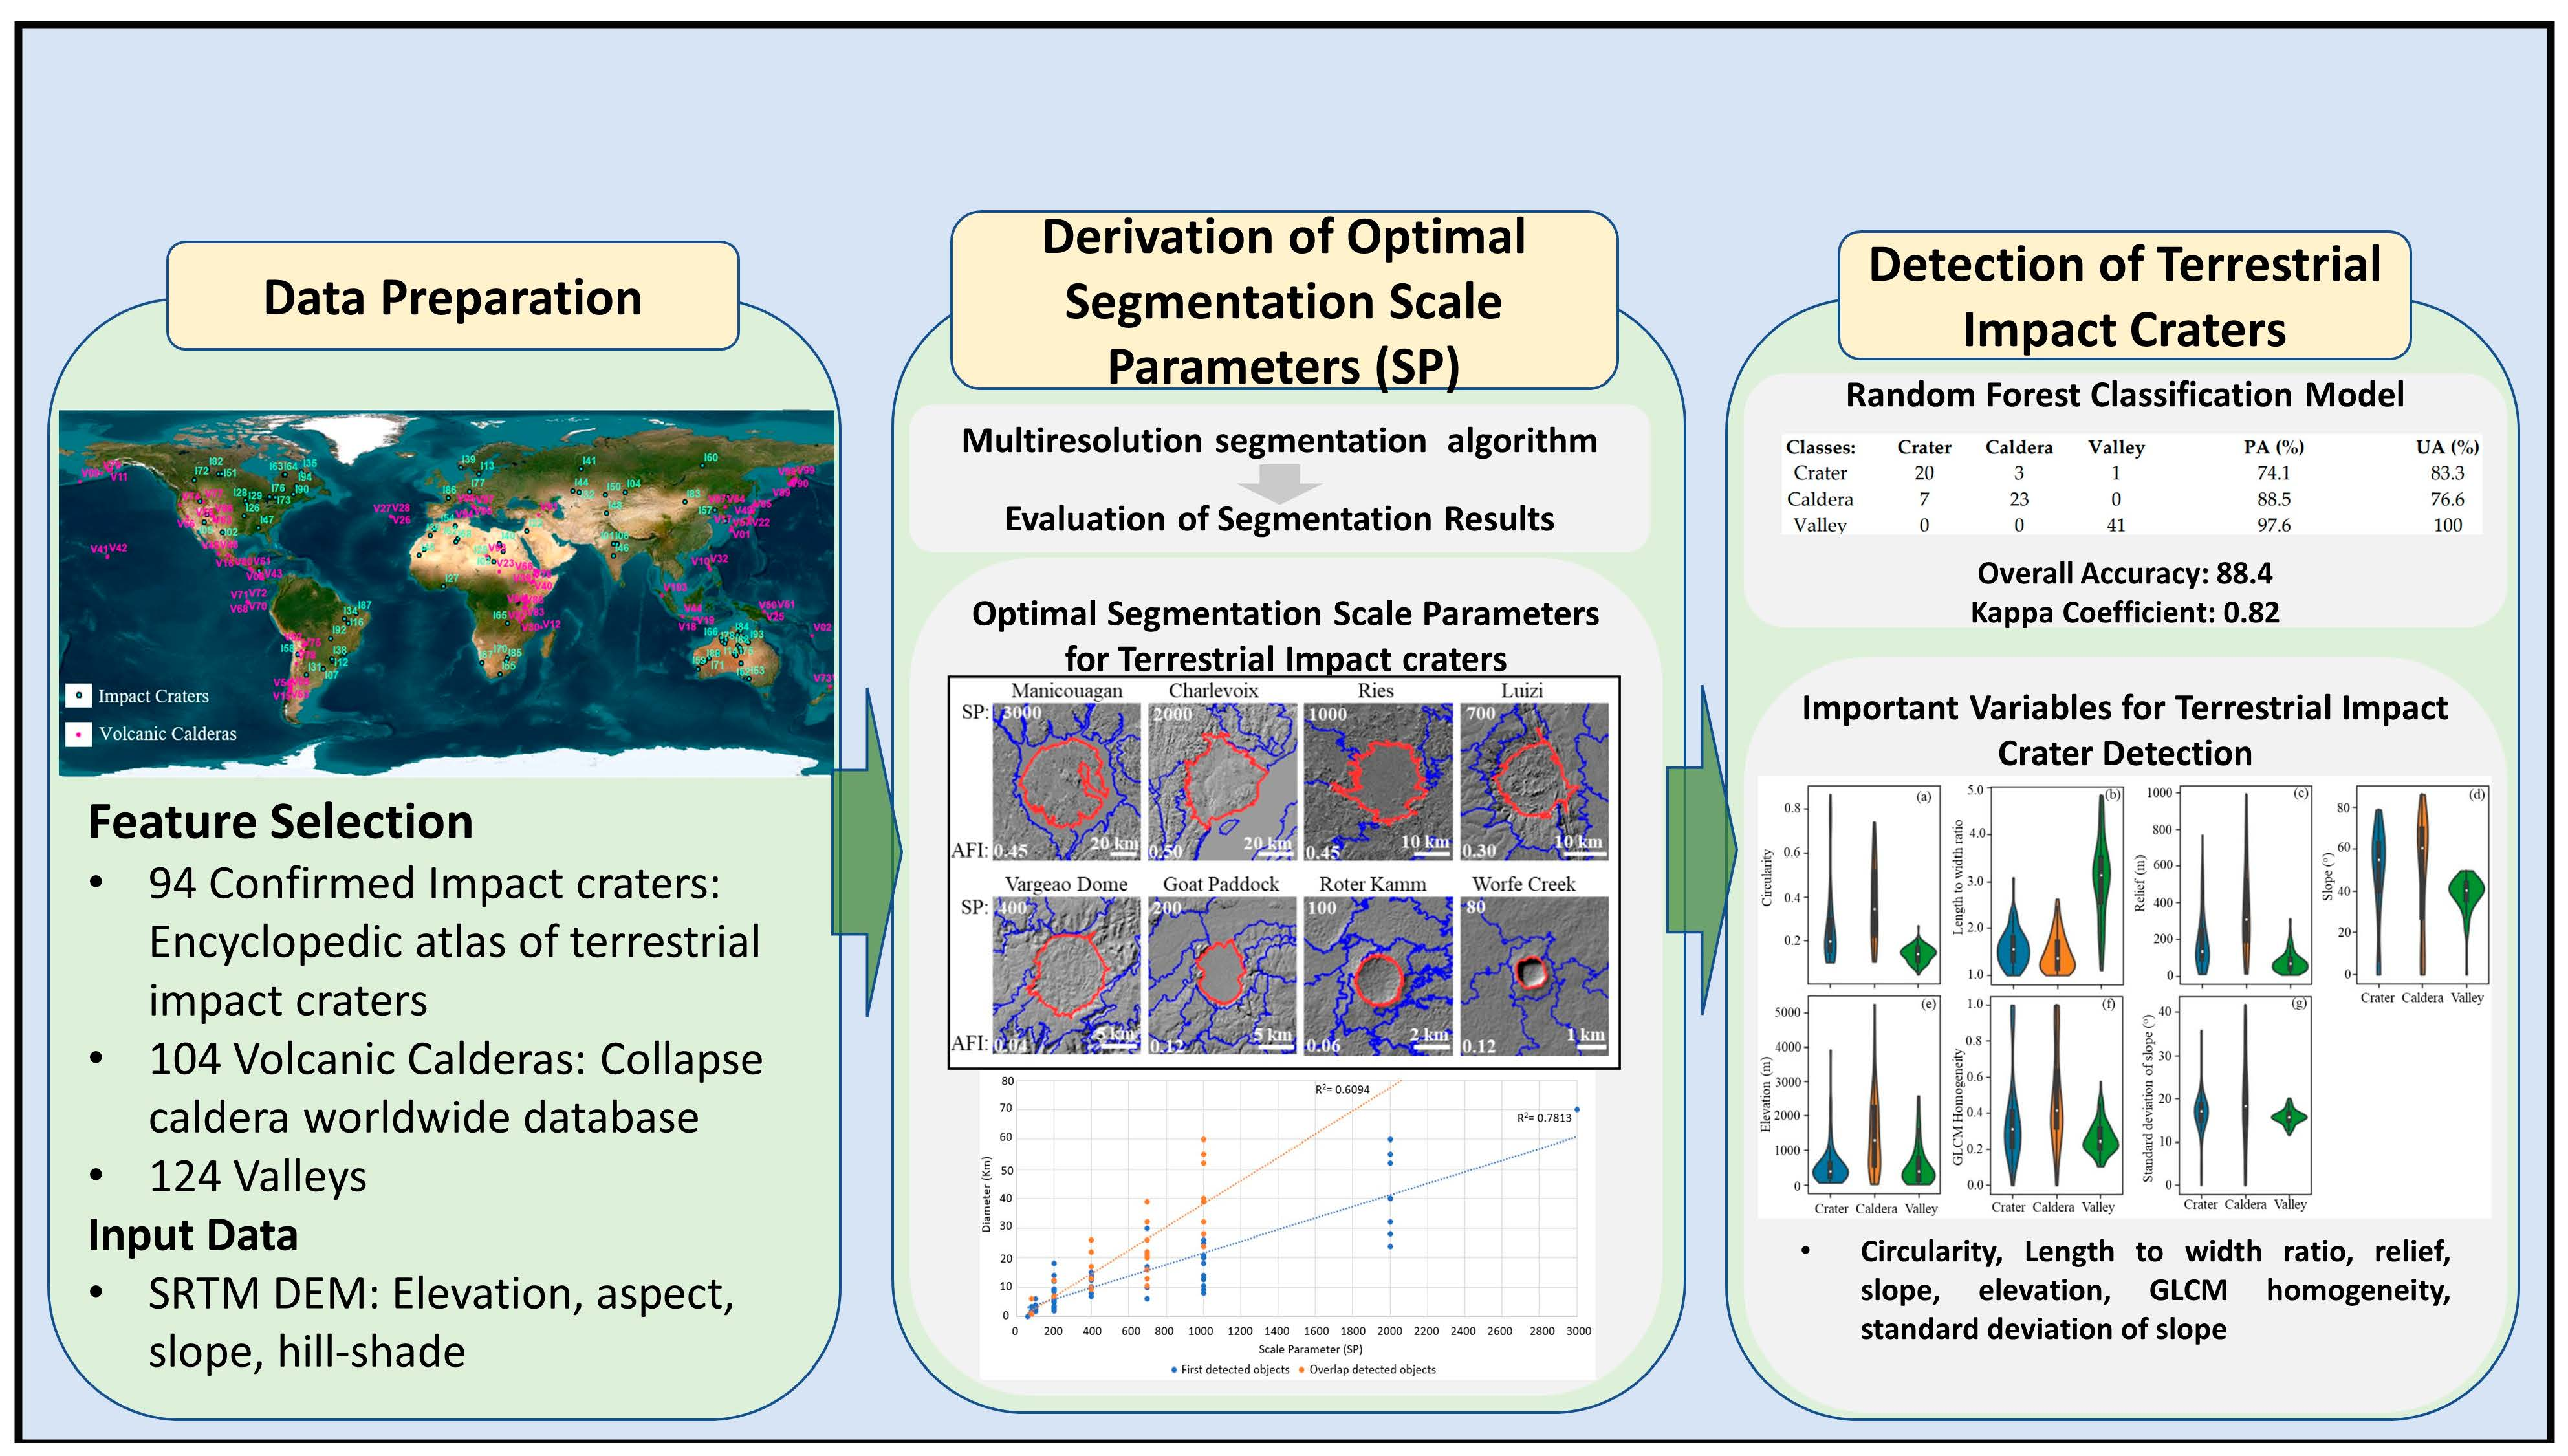
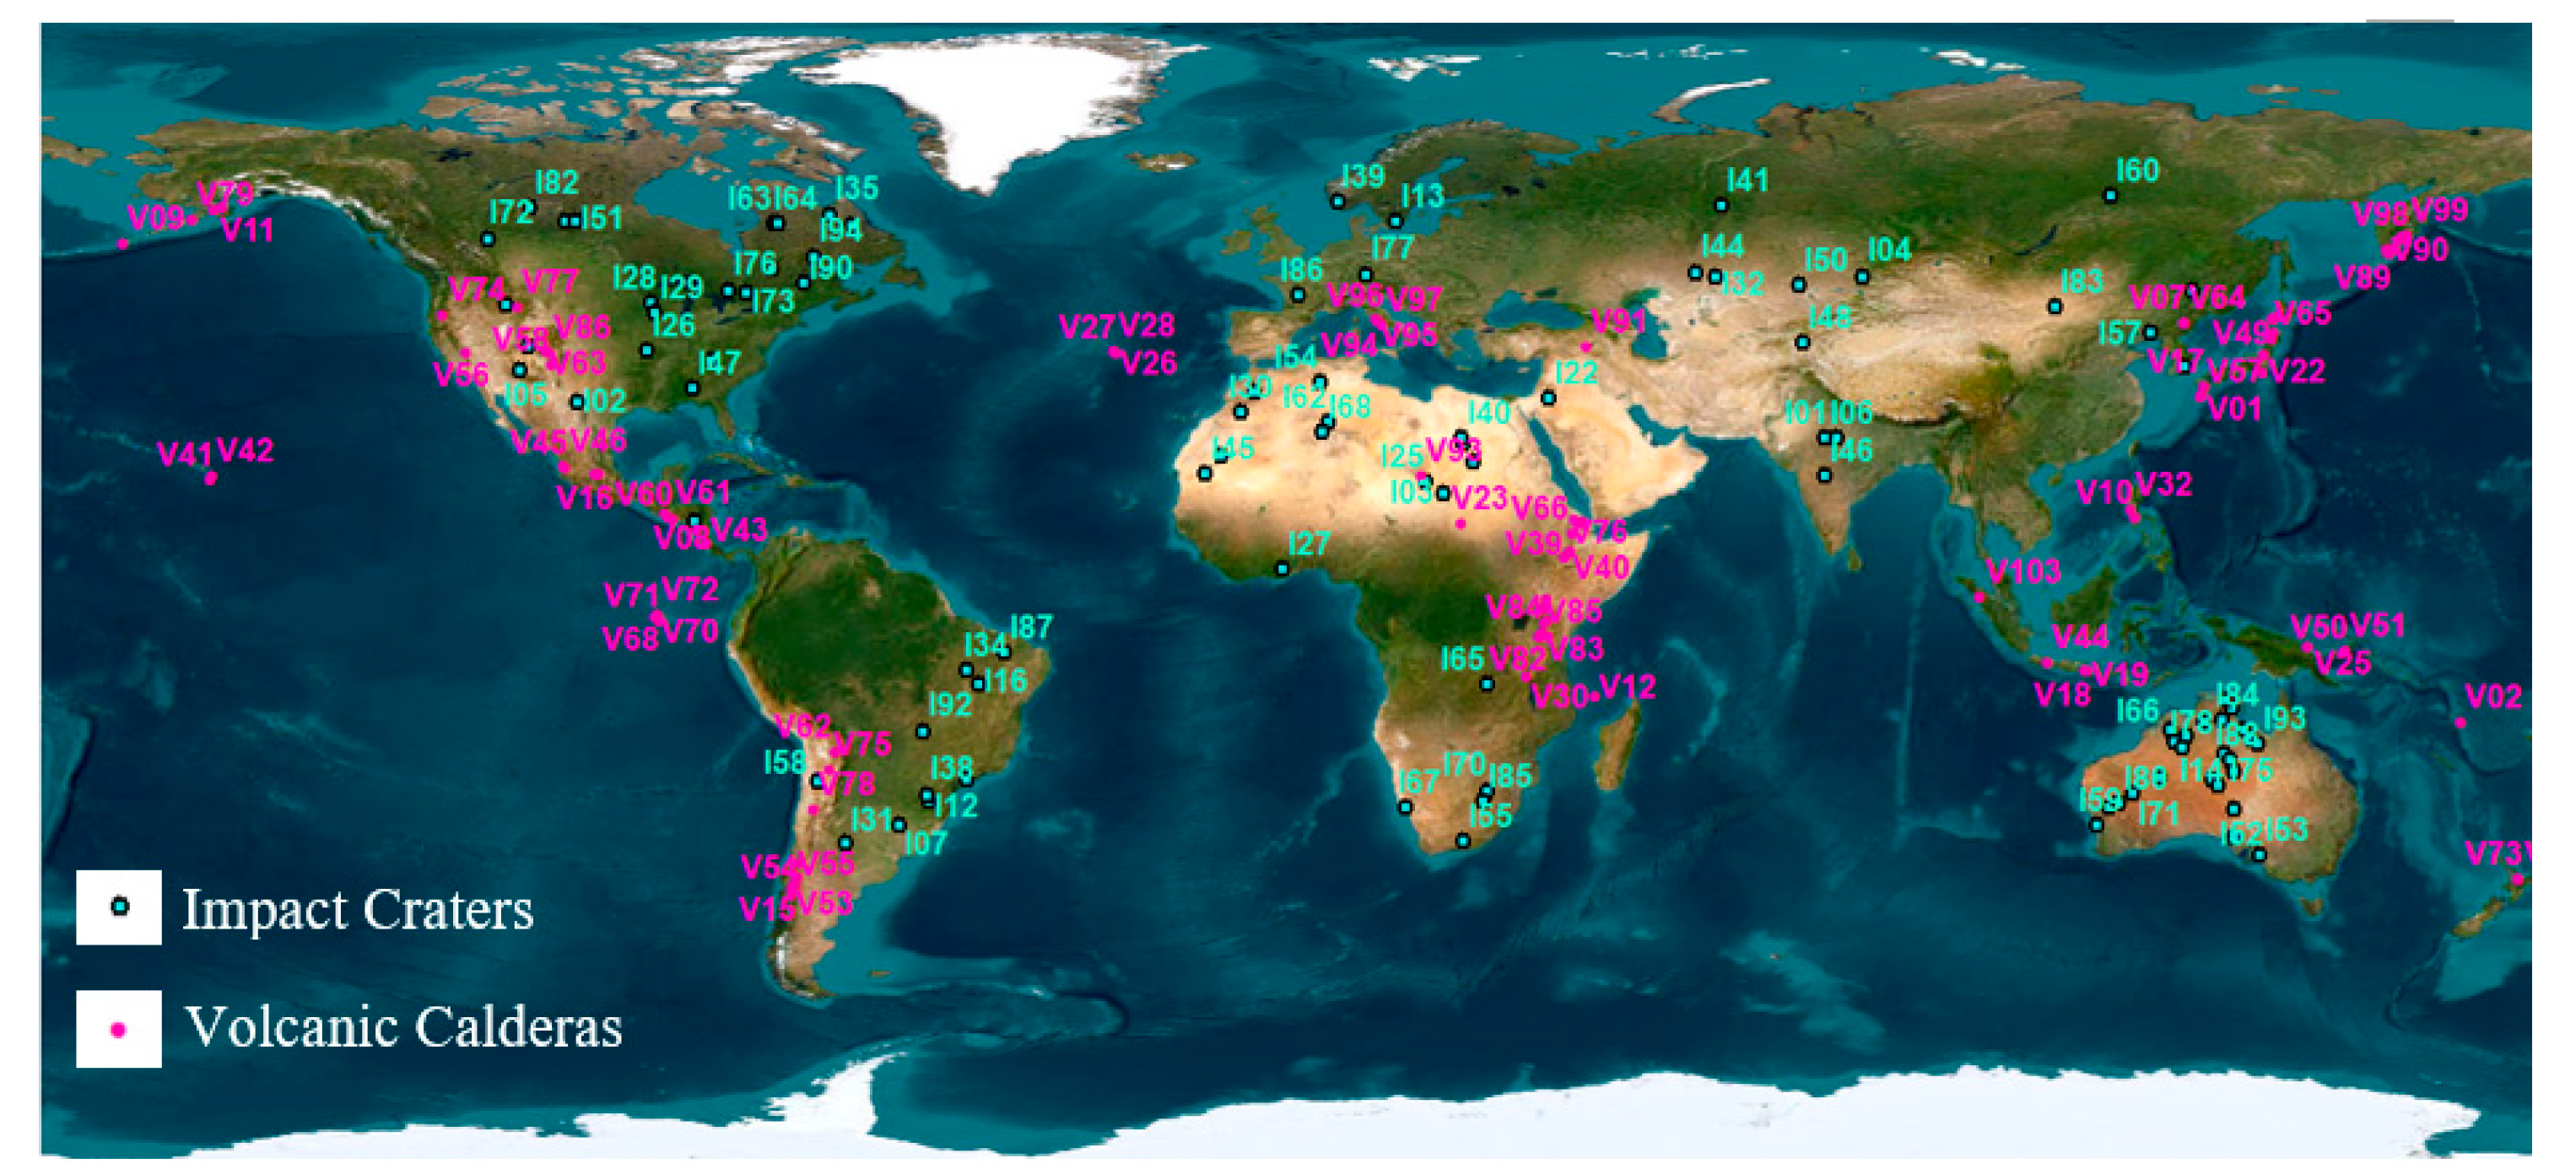
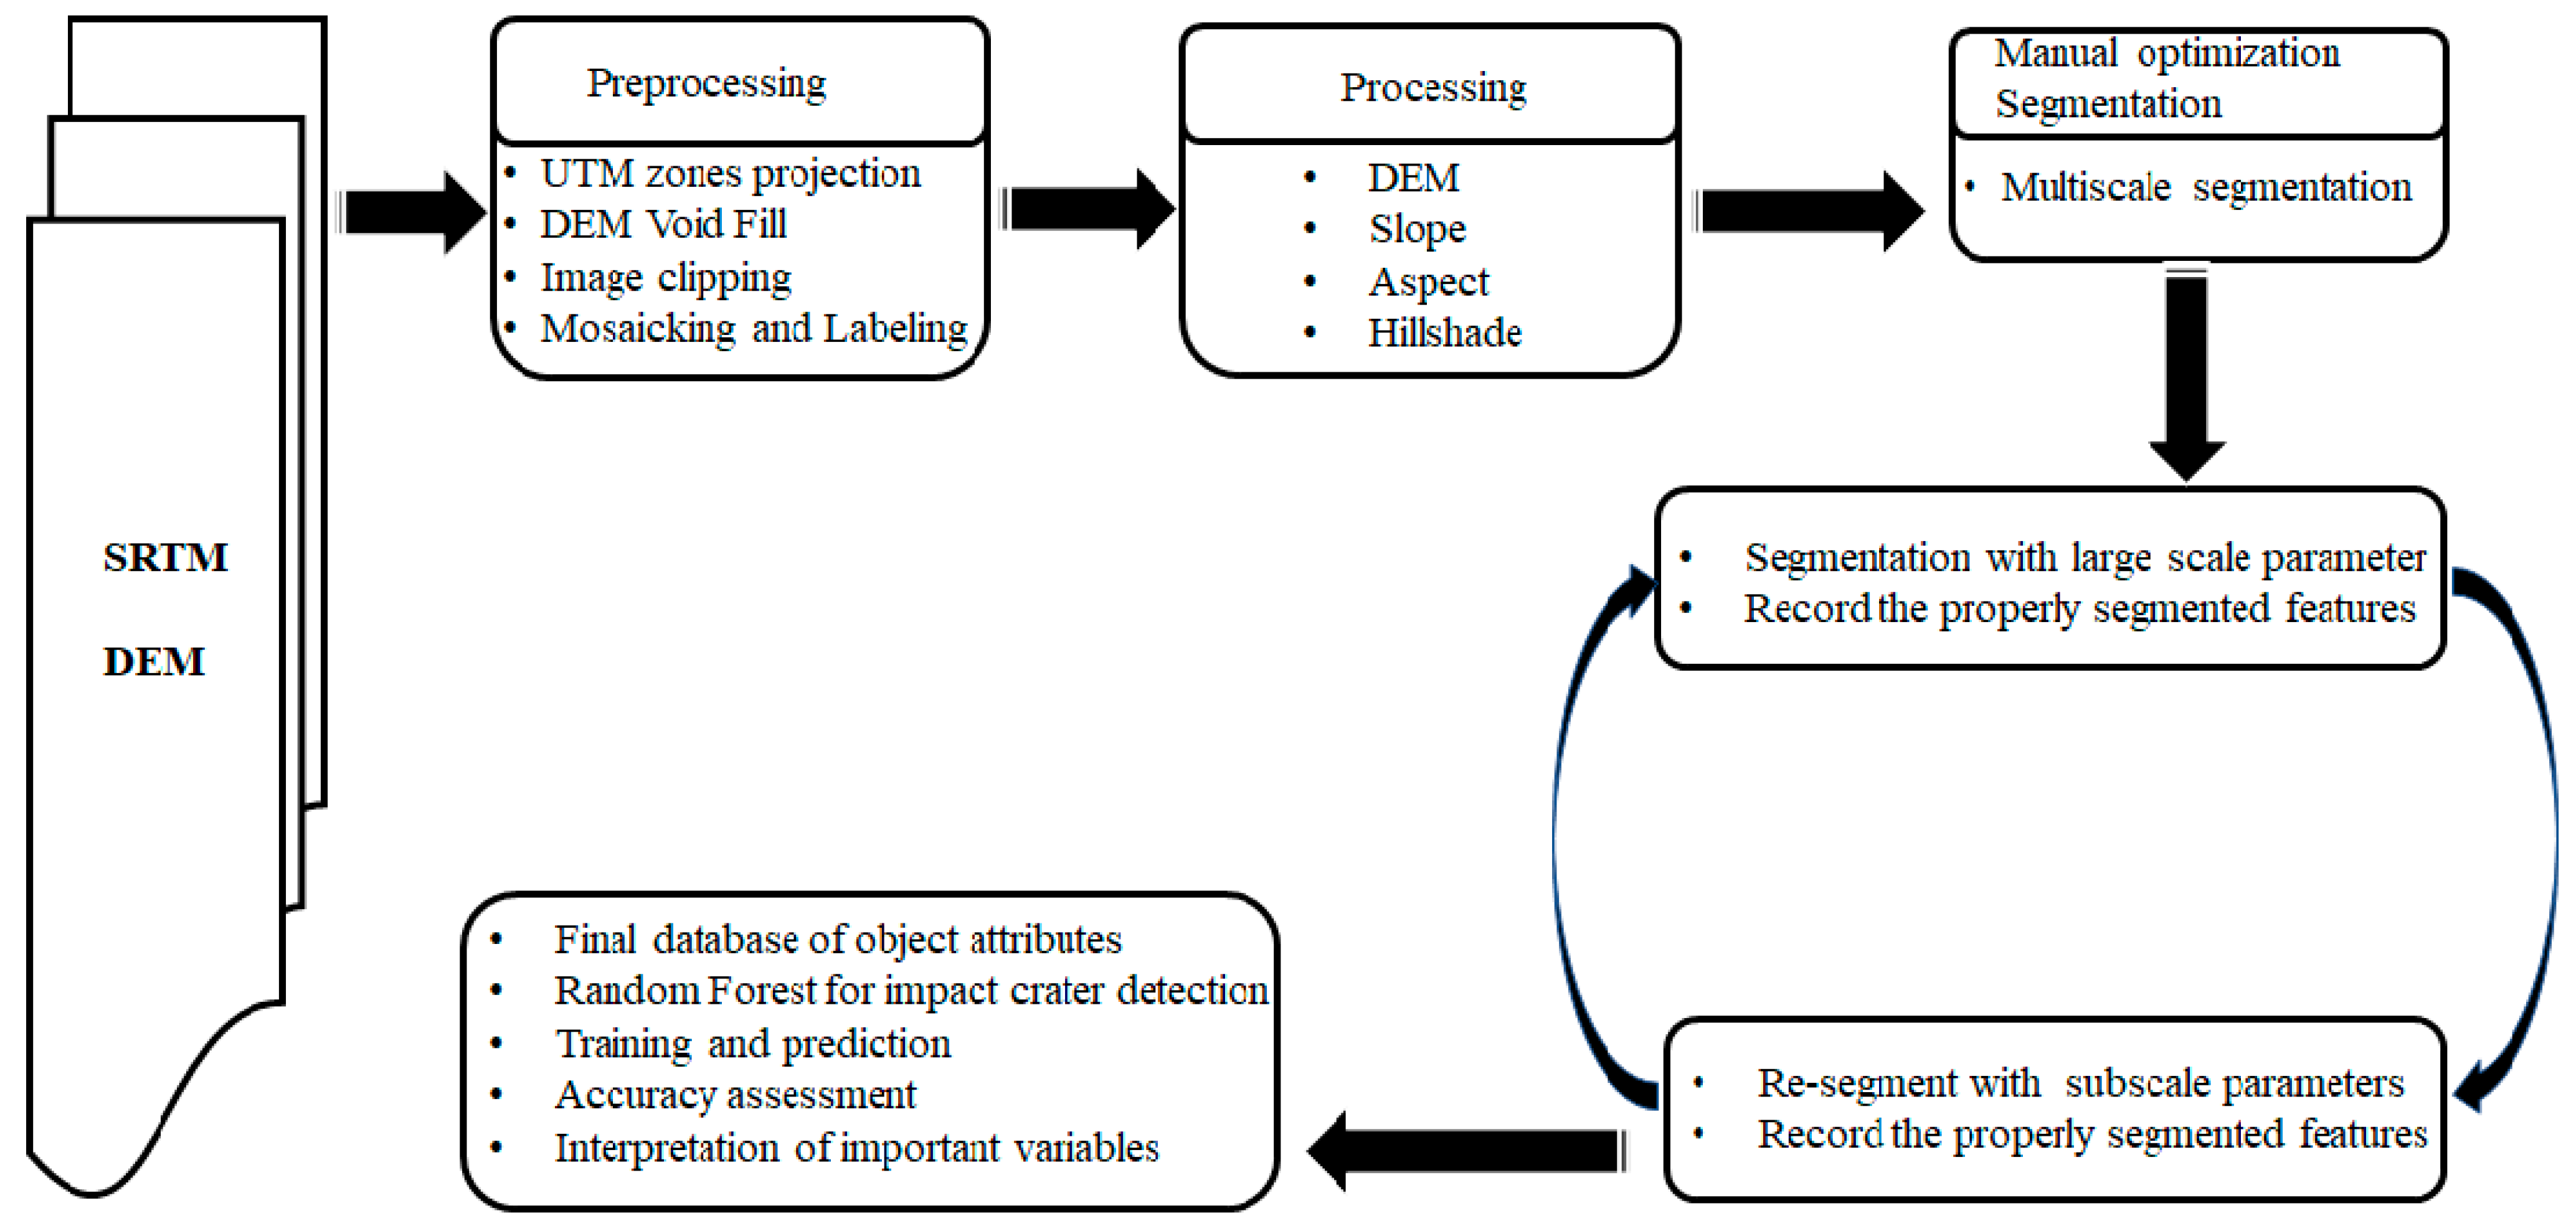
2.1. Data Acquisition and Preparation

This study used the global Digital Elevation Model of Shuttle Radar Topography Mission data (SRTM DEM). DEM data with a resolution of 1 arcsec (~30 m/pixel) were downloaded from the USA Geological Survey (USGS) [37]. We used 94 confirmed impact craters because of the limited exposure of buried craters and the limited data coverage of the SRTM data [7] (Appendix A, Table A1). The buried impact craters are characterized by a lack of circular morphological expression on Earth’s surface due to post-impact geological activities such as weathering and erosion [2]. Additionally, 104 volcanic calderas with diameter sizes analogous to those of impact craters were selected from the Collapse Caldera Worldwide Database to test the detection models [38] (Figure 1, Appendix A, Figure A1). Moreover, 124 valley objects that are commonly found in mountainous areas were randomly selected during the segmentation and used for object-oriented classification to assess the detection efficiency of impact craters.
The original SRTM DEMs were filled to remove void pixels, and then the impact craters and volcanic calderas were clipped to generate a mosaic image including all target impact craters and other types of topographic features (Figure 2). The extent of the clipped area was approximately 3 times the apparent diameter size of target impact craters or calderas. Then, additional morphometric datasets, including slope, aspect, and hillshade layers, were derived from the DEM mosaic for object-oriented segmentation, following the findings from previous studies. These derivatives could enhance the circular topographic imprint of the rims that create a topographic contrast compared to the surrounding areas [20].

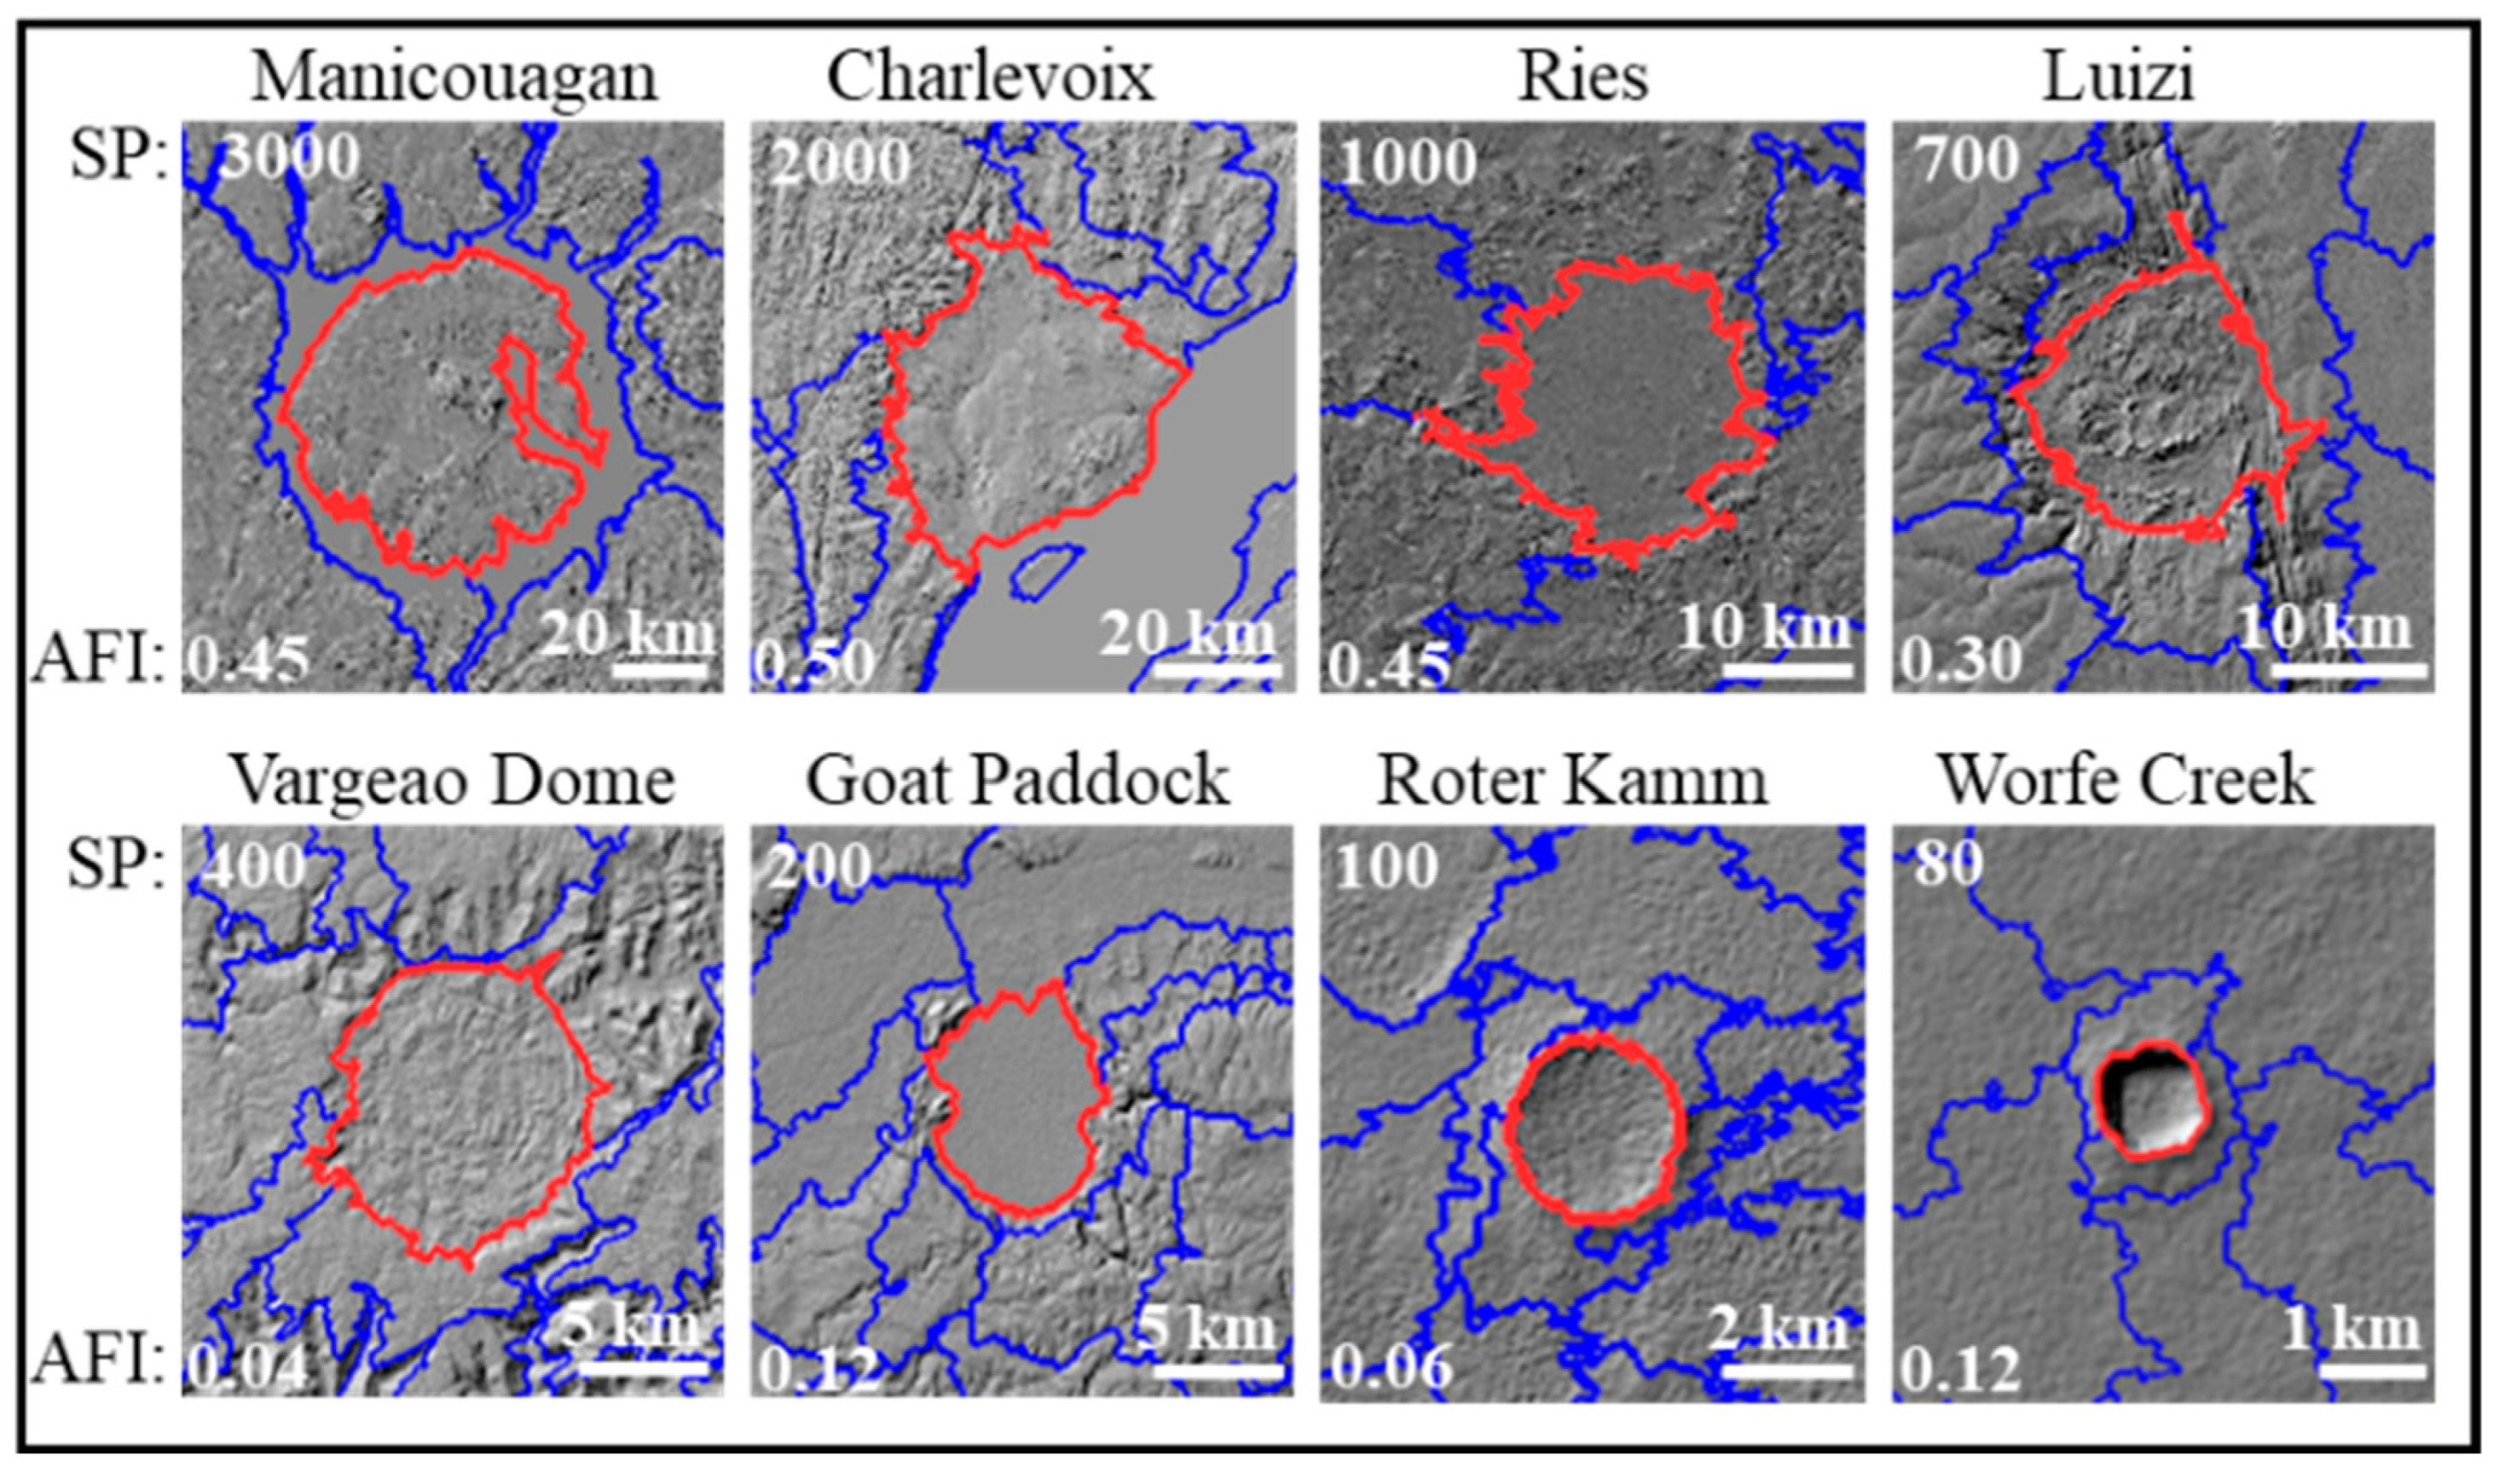
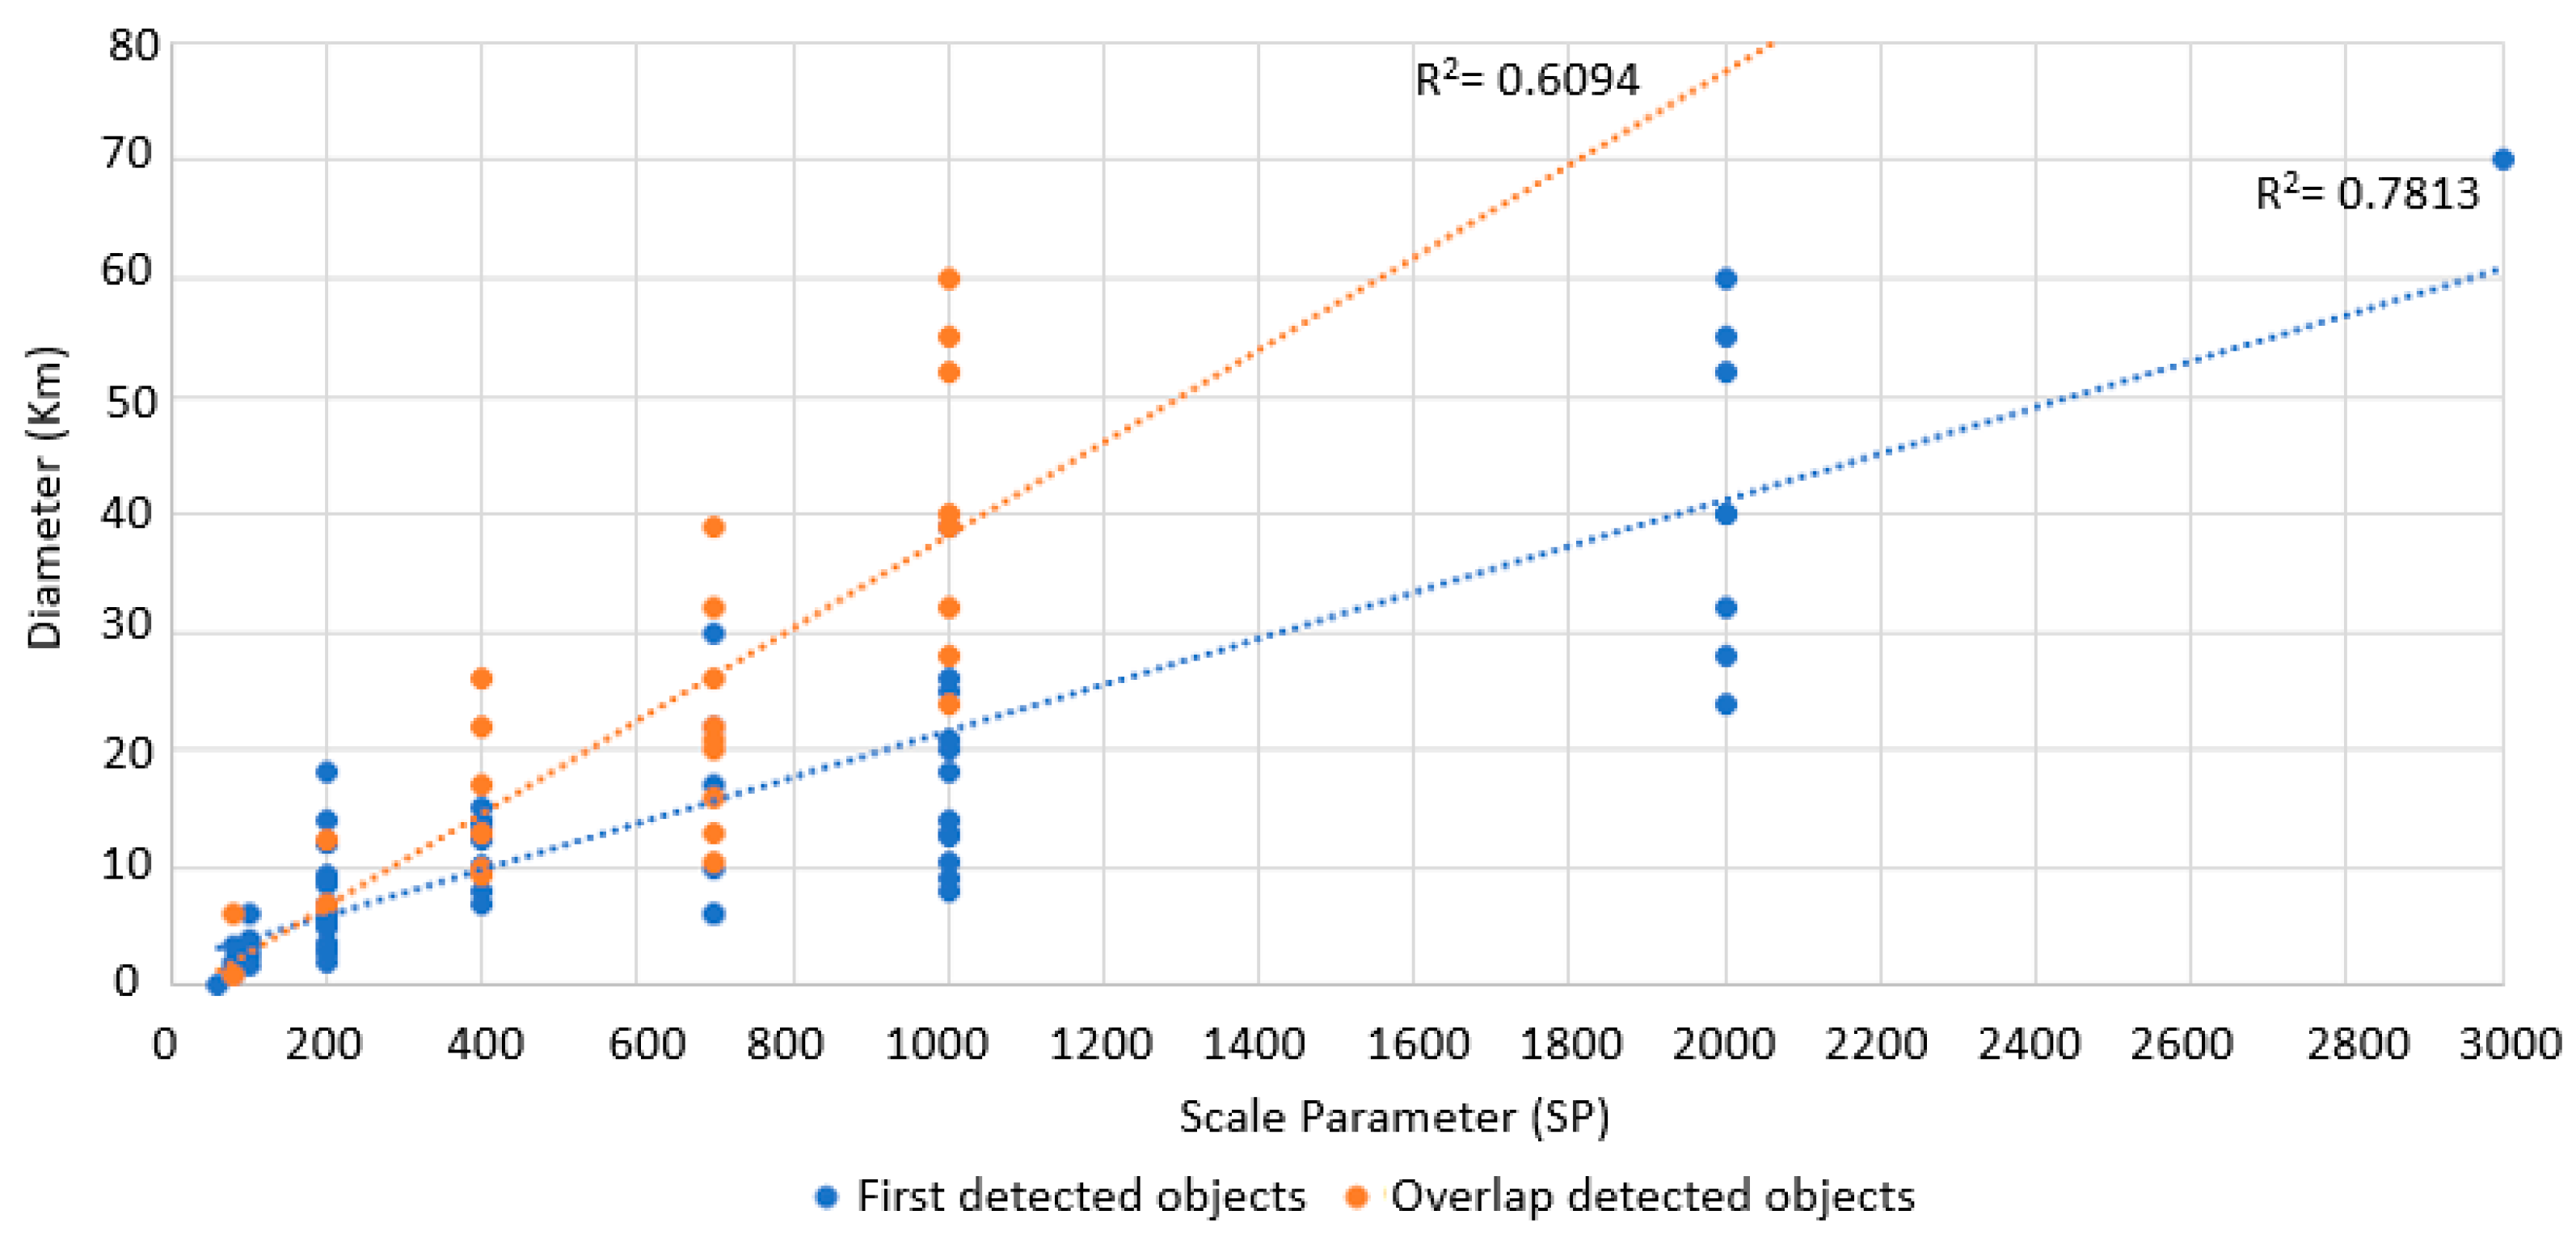
2.2. Optimum Scale Parameter Selection for Impact Crater Detection

In SRTM data, each crater consists of many 30-m pixels that define its geometries and topography. First, each crater should be extracted as an object with a clearly defined boundary. This study used a multi-resolution segmentation algorithm (MRS) implemented in eCognition developer 10.1 for the segmentation of the objects [39]. MRS employs a bottom-up region merging process of pixels. The segmentation starts by considering every pixel as a single object and accumulatively merging homogeneous pixels into distinct objects based on the scale parameter, shape and compactness, texture, and color. The merging process is stopped when the increase in homogeneity pixels exceeds the predefined scale in the eCognition software [20,40,41].
The segmentation results are mainly controlled by the Scale Parameter (SP) and associated shape and compactness [42], and, thus, different scale parameters would result in different sizes of segments. To determine the best scale parameters for optimal segmentation, the segmentation was iteratively conducted with changes in scale parameters from 5000 to 60 because of the size variability of impact craters and calderas (Figure 2). In this study, the shape of 0.4 and compactness of 0.6 were used for segmentation because they detected the circular rims effectively based on trial and error.
The topographical identification of the circumference of an impact crater is determined by the raised edge of the crater rim [7]. Based on this observation, we hypothesized that the circular topographic imprint of the rim on the DEM raster would induce the formation of homogeneous circular objects. Consequently, we employed a two-step assessment method to evaluate segmentation results. First, the segmentation results at each SP were subject to visual inspection to determine whether the segmentation was adequate to outline the impact crater rims. Then, the segmentation results that passed the inspection were used to calculate Area Fit Index (AFI). Area Fit Index (AFI) (Equation (1)) quantifies the fitness area between the reference area of impact craters (R) calculated from the Earth Impact Crater Database [2] and the area of impact crater object (S) derived from the segmentation.
A F I = a r e a R a r e a ( S ) a r e a ( R )
An AFI equal to 0 is an ideal segmentation, and AFI values ≤ 0.5 are considered a good agreement [43,44,45,46]. The number of properly segmented impact craters and AFI have been summarized for each SP, and the SPs with the most impact crater segmentation and the minimum AFI were selected as optimum scale parameters. The morphometric characteristics of impact craters segmented at each SP were analyzed to determine the relationship between SPs and morphometric parameters.

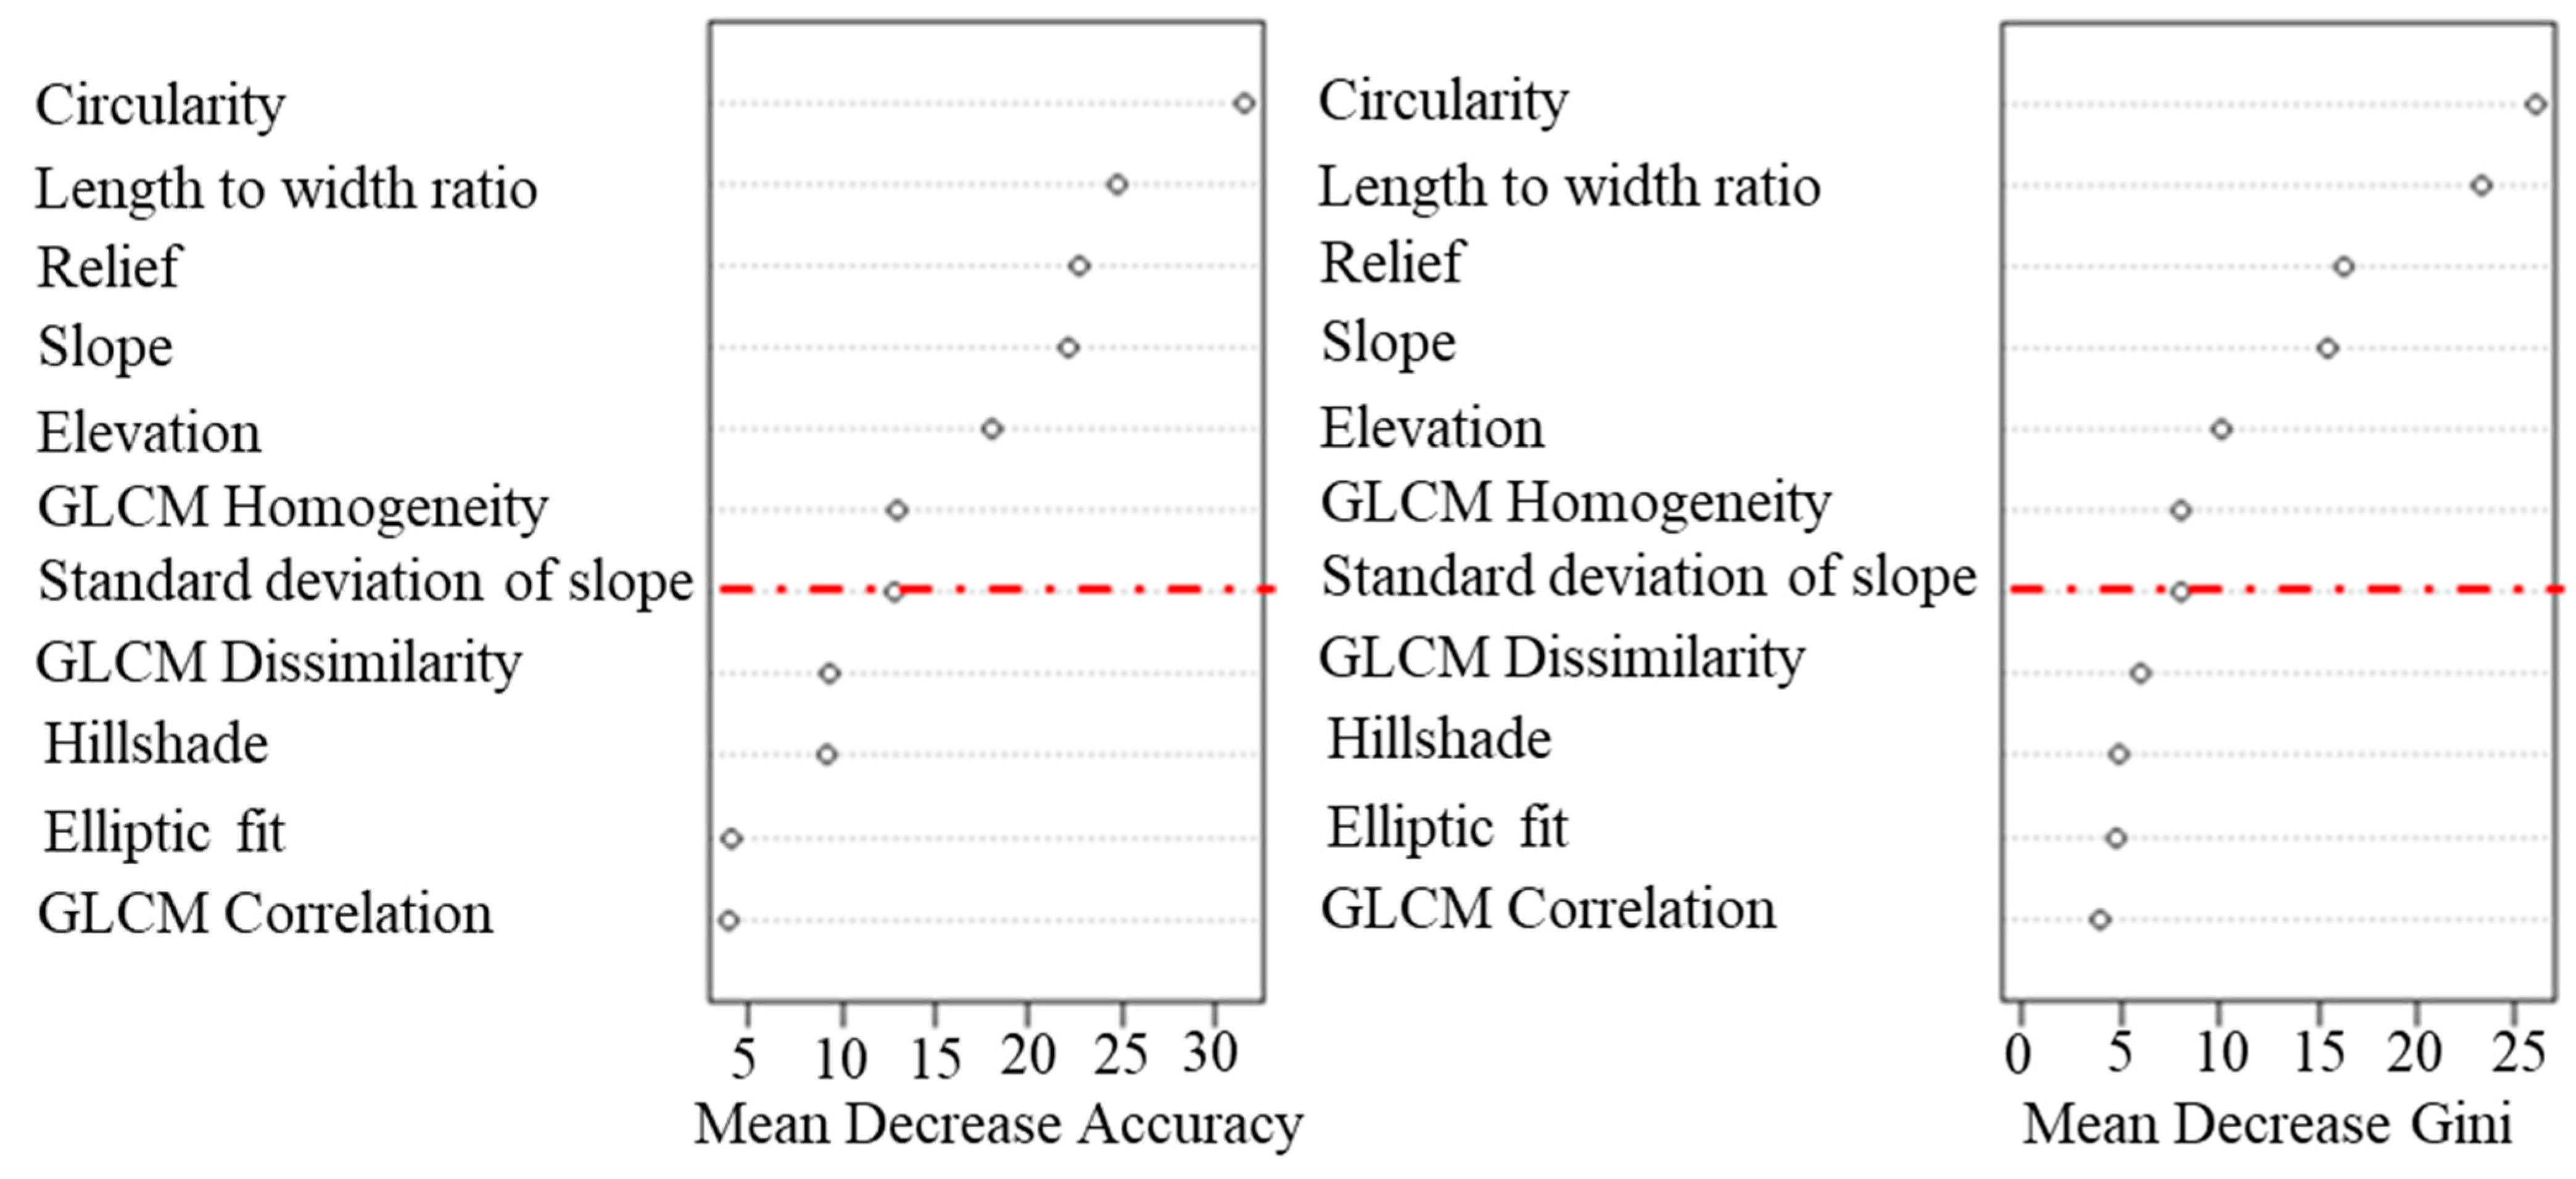
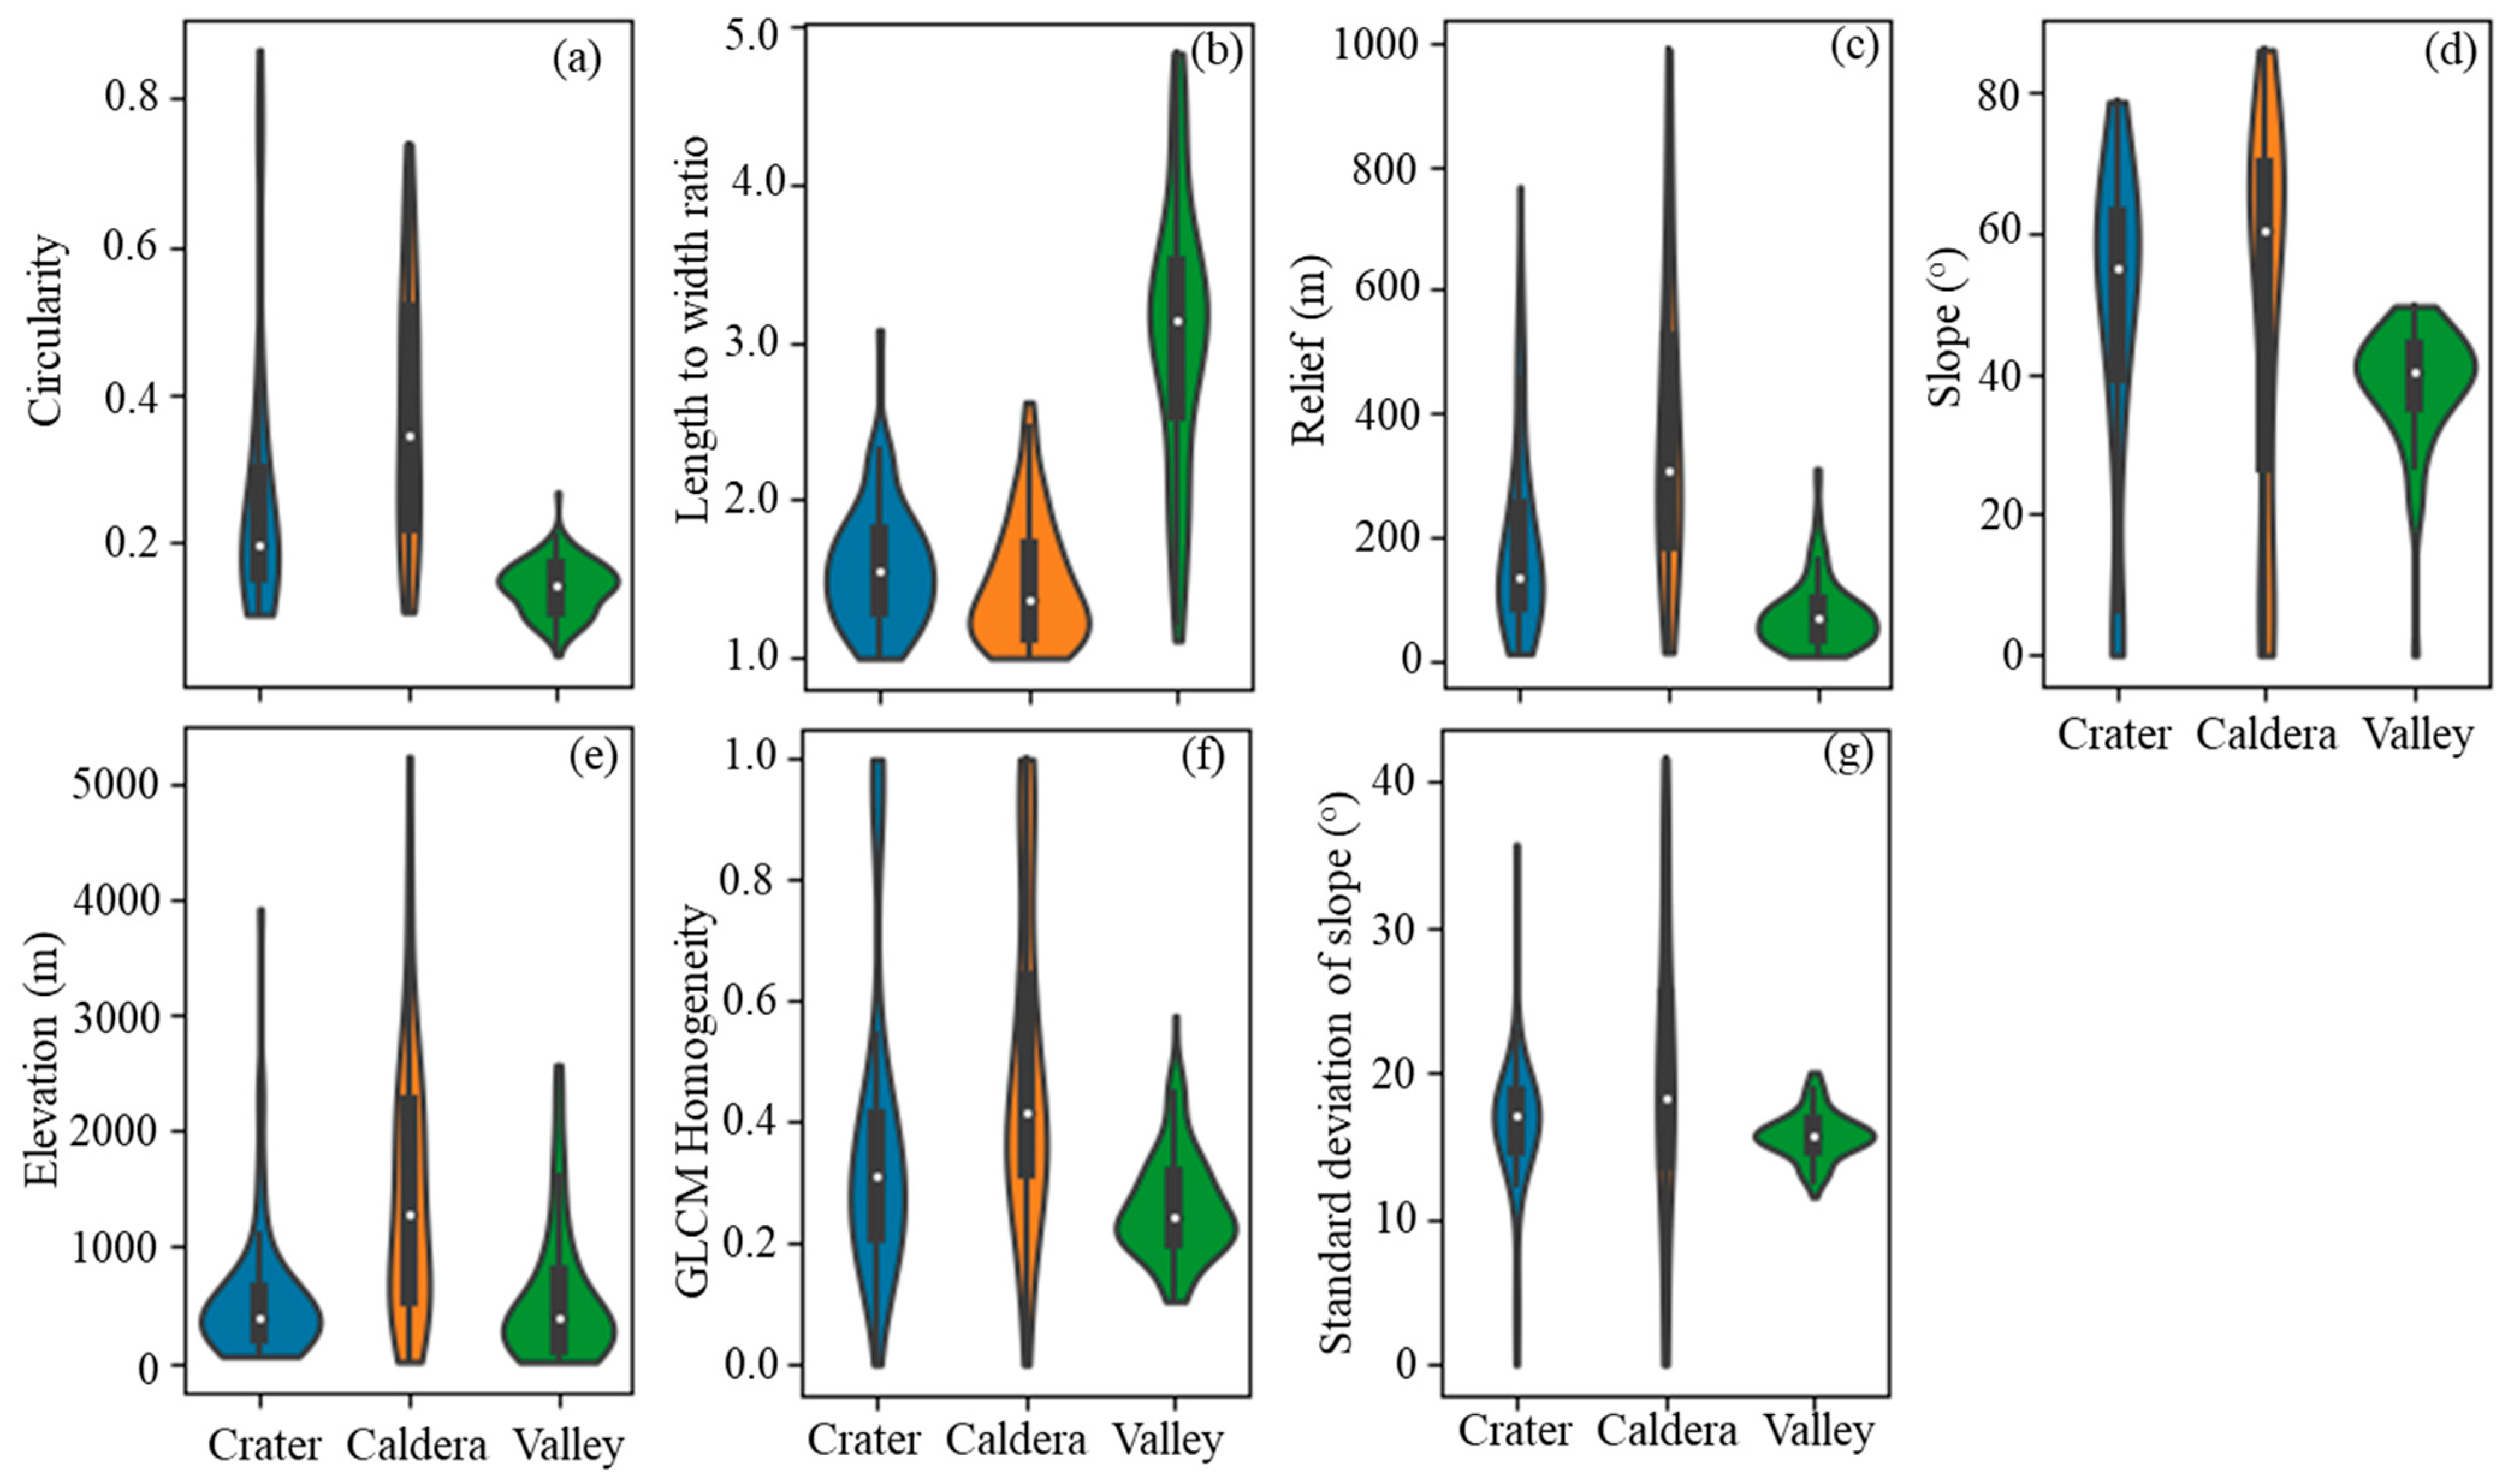
2.3. Random Forest Model for Terrestrial Impact Crater Detection

The objects segmented at optimal SPs for terrestrial impact craters were further used for the object-oriented classification model. As a result of segmentation, 70 objects of impact craters, 85 objects of volcanic calderas, and 124 objects of valleys were used to develop a random forest-based detection model (RF hereafter). A total of 16 attributes were extracted from segmented objects and used for the RF model (Table 1). Among the 16 attributes, 7 topographic attributes described the morphological variation of the landform, 3 geometric attributes quantified the shape, and 6 texture attributes described the surface structure or pattern based on Gray–Level Co-occurrence Matrix (GLCM) (Table 1). To avoid overfitting, multicollinearity analysis between the 16 variables was performed. Based on the analysis, 5 variables with high intercorrelation were removed, including Angular Second Moment (ASM), contrast, entropy, aspect, and standard deviation of elevation, and 11 variables with low intercorrelation coefficient (<0.6) were used for the RF classification model.
RF is a nonparametric machine learning algorithm based on randomly generated tree classifiers, and the classification is through the ensemble majority votes. In addition, important variables that effectively define the relationship between predictors and target features can be quantitatively derived by Mean Decrease Accuracy (MDA) and Mean Decrease Gini (MDG) scores [47]. The RF algorithm was implemented in the R software. A total of 30% of samples were randomly selected for validation, and Ntrees and Mtry are 500 and 3, respectively. The variable importance of impact crater detection was rated based on Mean Decrease Accuracy (MDA) and Mean Decrease Gini (MDG) scores to determine the major contributor of morphometric parameters for impact crater detection. The roles of major contributors were discussed on how those variables could be used for terrestrial impact crater detection.
Table 1. The attributes derived from detected objects.
TypeParametersBrief DescriptionReferences
TopographicElevationExpress the height of an object below or above sea level [48]
Slope Express the steepness of the surface of an object[49]
AspectExpress the orientation of slope of an object[50]
HillshadeIllustrate the impression of the 3D surface of an object from the point of view of the sun[50]
Standard deviation of elevation Express the variability of elevation within the object[51]
Standard deviation of slope Express the variability of slope within the object[51]
Terrain ReliefRepresent the difference between maximum and minimum elevation within the object[52]
GeometricLength/Width ratioRepresent the relative comparison between the length and width of an object[48]
Elliptical fitShape descriptor quantifies how much an area of an object fits the shape of an ellipse with a similar area[48]
Circularity Shape descriptor that quantifies the roundness of an object: (Perimeter2)/(4π × Area)[53]
Texture (GLCM)Homogeneity Estimate the similarity between the pairs of pixels in the image object[54]
DissimilarityEstimate the difference between the pairs of pixels in the image object
Angular Second Moment (ASM)Estimate the amount of homogeneity or uniformity within the image object
ContrastMeasure the local intensity variation in the image object
CorrelationMeasure the linear dependency between the pairs of pixel values in the image object
EntropyMeasure the unpredictability or randomness of the relationship between the pixels in the image object

3. Results and Discussion

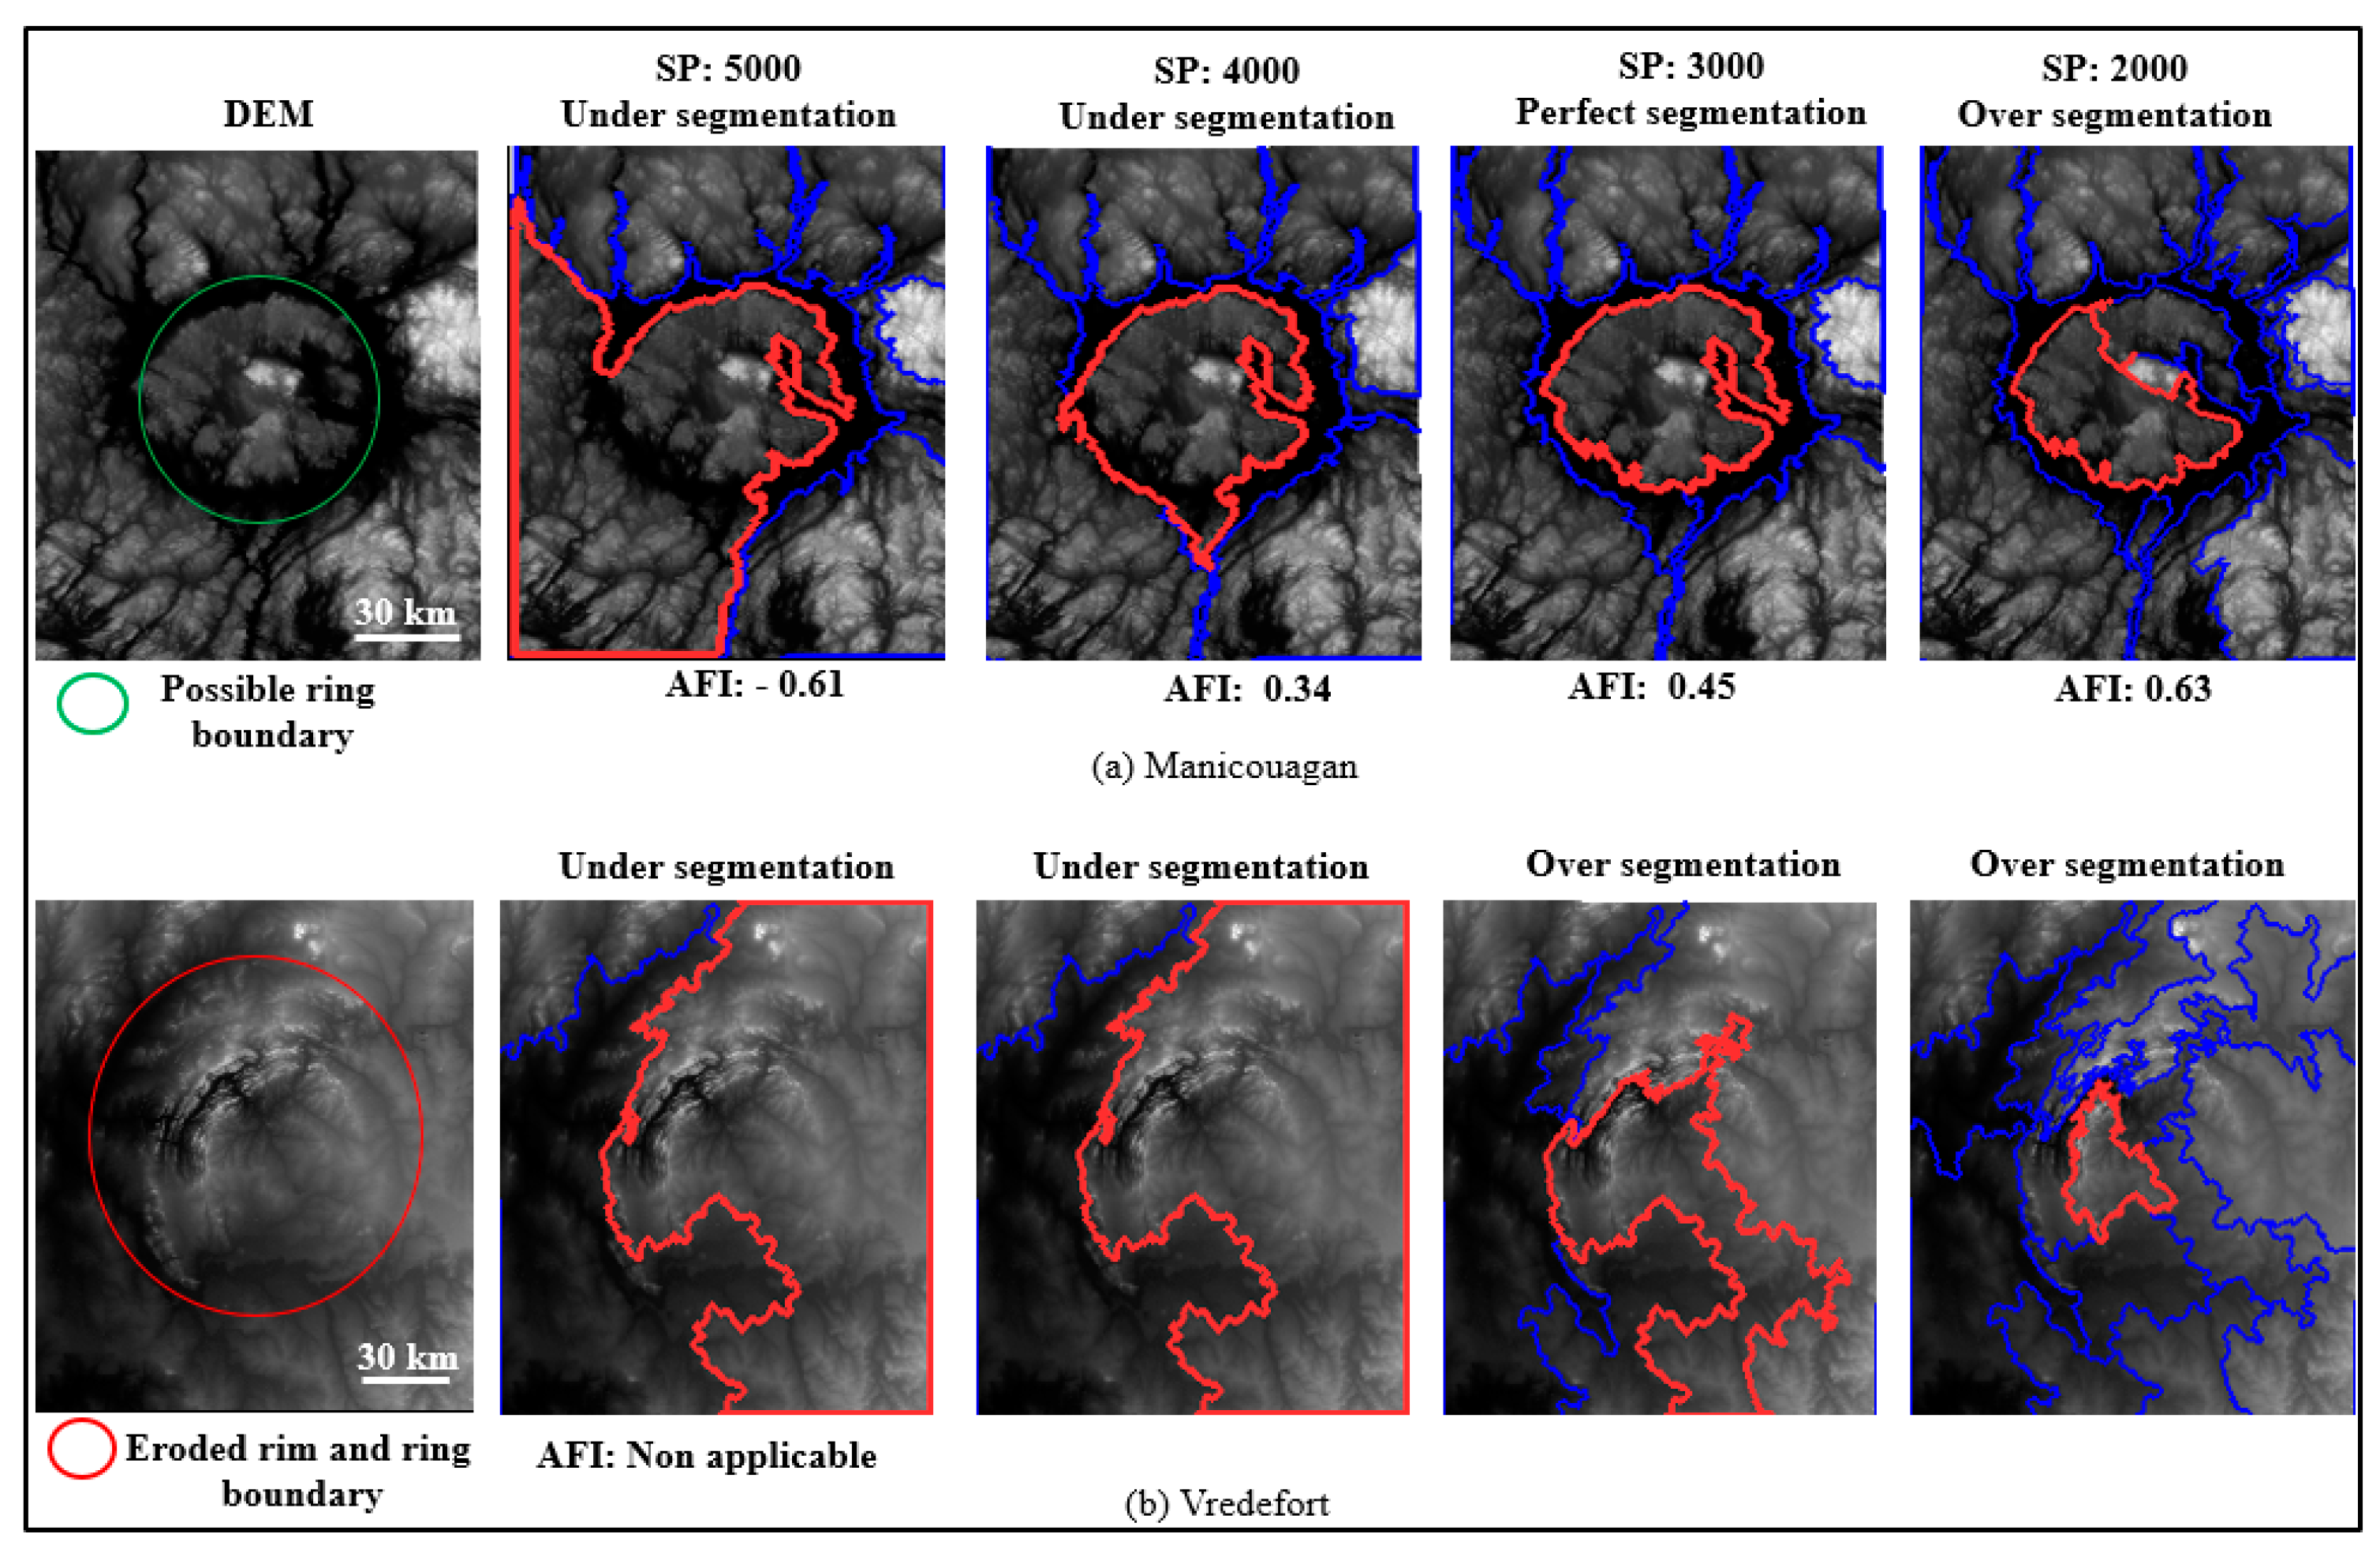
3.1. Selection of Optimal Scale Parameter for Impact Crater Segmentation

The visual inspection for segmentation results at each SP from 5000 to 60 revealed that the SP and diameter of segmented impact craters have positive relationships where the larger SPs would segment larger impact craters. Moreover, we found that SPs larger than 2000 would segment impact craters with an approximate diameter ≥70 km, and SPs lower or equal to 2000 would segment impact craters with a diameter < 70 km.
The SPs from 2000 to 5000 segmented only one impact crater from 5 impact craters in the 70–180 km diameter range (Table 2). The properly segmented impact crater was the Manicouagan impact crater (Canada), with a visible ring of ~70 km diameter. The SP 3000 best-segmented the possible rim or ring, whereas SP 5000 and 4000 under-segmented and 2000 over-segmented the outer rims (Figure 3a). In addition, an AFI value of 0.45 for the SP 3000 confirmed the good performance of segmentation. The rim of some craters, such as the Vredefort crater in South Africa, have experienced erosion, causing the rim boundaries to become less distinct. Consequently, the segmentation process was unable to detect the evident rim boundary in such cases (Figure 3b). Large craters with diameters greater than 70 km are rare on Earth’s surface and account for only about 5% of the samples. It might be attributed to Earth’s atmosphere, geological activities, erosion, and plate tectonics compared to the other planets and the Moon [2,55]. Therefore, we recommend SP 3000 as the optimal segmentation parameter for craters larger than 70 km.
Similarly, the segmentation results of the other SPs (2000, 1000, 700, 400, 200, 100, 80, 60) were evaluated, and the impact craters segmented from each SP varied because they vary in diameter and exposure level (Table 2, Figure 4). As a result, all SPs lower than 2000 except 60 have been selected as optimal scale parameters for impact crater segmentation. The diameter of segmented impact craters and 8 SPs showed a high correlation (R2) of 0.78 (Figure 4 and Figure 5).
The SP 200 properly segmented 21 out of 27 exposed impact craters with apparent diameters ranging from 1.8 to 12 km. The representative impact crater segmented by SP 200 is the Goat Paddock crater (Australia), 5 km in diameter (Figure 4). The highest detection in this scale was simply due to the large population of impact craters in the size range of terrestrial impact craters. Indeed, a previous study reported that almost half of terrestrial impact craters have a diameter range from 1 km to 10 km [7]. The smallest SP for impact crater segmentation was SP 80, which properly segmented 7 small-sized impact craters out of 8 with diameters in the range of 0.88–3.4 km. The scale mostly covered the smallest and most well-preserved simple impact craters, such as Tenoumer (Mauritania), Tswaing (South Africa), and Roter Kamm craters (Namibia). On the other hand, SP 60 over-segmented all 10 small impact craters of 0.024–0.64 km diameter. These small impact craters provided indiscernible topographic imprints from neighboring features on satellite data of 30 m resolution (Appendix A, Figure A2). Hence, SP 60 was not included as an optimal SP because it gave unreliable segmentation results for impact crater detection.
In general, there was a large overlap in segmented impact craters between the neighboring SPs (Figure 5). As a result of visual inspection, 8/11 SPs (3000, 2000, 1000, 700, 400, 200, 100, 80) provided the optimum homogeneous circular objects around the rim of 70/94 (74.5%) impact craters. The circular segments formed for well-preserved craters like Rotter Kamm (Namibia) and Vargeão Dome (Brazil) showed nearly zero AFI, about 0.06 and 0.04 (Figure 4). However, the goodness of fit for moderately eroded impact craters such as Charlevoix (Canada) and Ries (Germany) was relatively high, about 0.5 and 0.45, respectively (Figure 4). On the other side, 24/94 (25.5%) impact craters were not segmented properly due to the complete destruction of circular topographic imprints regardless of diameter. The impact craters Rochechouart (23 km, France) and Kelly West (6.6 km, Australia) belong to this group.

3.2. RF Classification of Terrestrial Impact Craters and Other Topographic Features

The terrestrial impact craters segmented from optimal SPs were compared with similar topographic features such as volcanic calderas and commonly found topographic features like valleys based on the RF model. Similarly, segmentation was conducted for those topographic features, and as a result, a total of 85 properly segmented volcanic calderas and 124 valleys were used for RF classification. The object attributes of terrestrial impact craters and other topographic features were extracted and used for input values in RF classification (Table 1). A total of 70% of objects (70 impact craters, 85 volcanic calderas, and 124 valleys) were used for the calibration model, and the remaining 30% were used for validation. The accuracy assessment showed that the classification model showed very good performance, with an overall accuracy of 88.4% and a kappa coefficient of 0.82. Notably, the model separated impact craters and calderas from valleys very effectively with an accuracy close to 100% (Table 3).
However, the accuracy for the detection of impact craters and volcanic calderas was relatively lower, with an accuracy of 74.1% and 88.5% due to the similarity in their topographic characteristics. Although the accuracy was the lowest for terrestrial impact craters, the accuracy of 78.7% is still considered good prediction accuracy, and thus, it infers that the remote sensing approaches to preliminary detection of undiscovered terrestrial impact craters can be effectively used.
The important variables for the detection of terrestrial impact craters were further derived from Mean Decrease Accuracy (MDA) and Mean Decrease Gini (MDG) indices (Figure 6). Based on the slope change shown by a sharp decrease in MDA and MDG, seven important variables were found: circularity, length-width ratio, relief, slope, elevation, homogeneity texture, and standard deviation of slope (Figure 6). Furthermore, violin plots visualized the distribution of the seven important variables of the three feature types based on kernel density estimation (Figure 7).
The plots presented a significant difference in median locations and the shape of the violin plots between the classes. The white dot points mark the median of the data along with the interquartile range, and the bulge in shape indicates higher probability density. Among the three attribute groups, it was concluded that geometric attributes play the most important role in the detection of terrestrial impact craters, followed by topographic and surface texture attributes (Figure 6 and Figure 7).
Circularity, a geometric attribute, was ranked as the most effective attribute for impact crater detection. Although both impact craters and volcanic calderas have circular shapes, they have differences in statistical distribution. For example, 75% of impact craters have circularity lower than 0.29, while 75% of volcanic calderas showed circularity higher than 0.22. A slight overlap was found in the range of 0.22–0.29 (Figure 7a). Meanwhile, valleys have distinctively lower circularity (Figure 7a). The circular shape of objects was further quantified by the length-to-width ratio. Half of the impact crater objects had a ratio higher than 1.5, and the majority of volcanic calderas (75%) were lower than 1.6. More than 75% of valleys showed a high ratio (>2.5) (Figure 7b).
In general, impact craters have jagged object boundaries, relatively lower circularity, and a higher length-to-width ratio compared to calderas. Indeed, prior studies reported that 34 impact craters have elliptical forms with a long-diameter axis to short-diameter axis ratio above 1.05 [7]. Moreover, oblique impactors, target heterogeneity, uneven erosion, and post-impact deformation have been presented as the main cause of elliptical form and modifications of the circular form of terrestrial impact crater rims [7]. The post-deformation processes include inward collapse and slump of rims, weathering, and erosion. Post-deformation modifies the shape of impact craters resulting in lower circularity and a high width-to-length ratio. The crater rims are composed of ejecta, melted, and brecciated materials, and thus, they are relatively vulnerable to erosion compared to crystalline igneous rocks. This phenomenon can also be confirmed by the ages of impact craters, which is related to exposed time for erosion and post-impact sedimentation in the central depression [56]. Indeed, impact crater objects with higher circularity (>0.72) were observed for 5 preserved simple impact craters, including Rotter Kamm, Worfe Creek, Meteor, Tenoumer, and Tswaing craters, which have ages of less than 5 Myrs [5]. In contrast, caldera rims have relatively higher circularity regardless of age because they are mainly formed by crystalline igneous rocks, which have higher resistance to erosion [57]. However, the circularity of caldera rims can be affected by characteristics of eruption, vents arrangement, and subsequent collapse. This study only used 104 volcanic calderas out of over 400 calderas worldwide [55,58]. Fully understanding the factors related to modification of the rim circularity needs more worldwide cases. Conversely, the valley objects were mostly characterized by elongated and asymmetrical shapes that could be associated with low circularity and a high length-to-width ratio.
Topographic attributes such as relief, slope, and elevation were also effective variables for differentiating terrestrial impact craters. The 75% of impact craters have relief less than 245 m, whereas 75% of volcanic calderas are higher than 192 m. The relief of valleys has a large overlap with impact craters, where 95% were lower than 192 m because they have similar depression (Figure 7c). The relatively lower relief of impact craters can be linked with shallow depression structures caused by ejecta and post-impact sediment deposition [10]. Indeed, Tsikals et al. [56] reported a decrease in relief of the central uplift ring and crater rims of 5 impact craters caused by sediment loading as a post-impact deformation. The shallower depression of impact craters was also found for lunar craters, which have a lower depth-to-diameter ratio [59]. On the other side, the relatively high internal relief found for volcanic calderas could be associated with a deep central depression formed by the collapse of the emptied magma chamber [60].
The slope attribute indicates that 75% of impact crater objects were mostly indicated by relatively gentle slopes less than 62°, while 50% of the volcanic caldera were mainly characterized by very steep rims with slopes greater than 60.2°. Valleys have distinctively low slopes of less than 49.6° (Figure 7d). Furthermore, a significant proportion of impact craters (88.5%) were found in elevations lower than 1000 m, while the majority (60%) of volcanic calderas are distributed in higher elevation ranges (1000–5233 m) (Figure 7e). The relatively lower elevation of impact craters can be explained by geological processes associated with the formation and post-deformation of impact craters. Impact craters are formed with circular rims formed by excavation and ejection, where the magnitude is controlled by the size and speed of the impacting object, the composition of the target material, and the angle of impact. This process induces relatively lower elevation than volcanoes, which create mountains. Moreover, the post-deformation of impact craters, such as collapse, slump of rims, and erosion, further reduces the elevation over time. The higher elevation of volcanic caldera can be explained by their topographic positioning, where most calderas are found in volcanic mountain summits that are relatively higher than most mountains. Volcanic calderas are mainly associated with magma eruption along tectonic boundaries, where most high mountain chains are distributed [61].
The GLCM homogeneity and standard deviation of slope showed a significant overlap for all three features compared to the other variables (Figure 7f,g). A substantial proportion (75%) of impact craters and volcanic calderas showed a homogeneity of less than 0.4 and 0.63, respectively. A relatively low homogeneity found for many impact craters could be the result of surface roughness caused by fractured, brecciated materials and central multi-structure rings [62]. Moreover, 75% of valleys were also characterized by homogeneity lower than 0.31 (Figure 7f). Similar patterns were also observed for the standard deviation of the slope variable, while volcanic calderas may have relatively higher variations in slope (Figure 7g).

4. Conclusions

This study is the first attempt to establish an optimal segmentation and object-oriented classification method based on confirmed and exposed terrestrial impact craters and DEM data. It confirmed that using remote sensing data, such as global digital elevation models, can effectively determine preliminary locations of undiscovered terrestrial impact craters around the world as a reconnaissance survey. Furthermore, this study not only tried to detect terrestrial impact craters but also detected volcanic calderas and tested the separability of other morphological features, such as valleys, from the impact craters. One limitation of our study is that the methods are only applicable to craters larger than 0.8 km in diameter. If smaller craters are to be detected, high-resolution DEMs are required, such as the TanDEM-X DEM by the German Aerospace Center. Moreover, this approach can only narrow down possible terrestrial impact crater candidates where topographic features are well-preserved. A more systematic geological analysis must follow up to validate the existence of terrestrial impact craters.
We introduced optimal scale parameters for the segmentation of terrestrial impact craters and detection of craters based on object-based attributes along with other terrestrial topographic features. The multi-resolution segmentation algorithm depicted the circular topographic imprints of impact craters and volcanic caldera rims from four morphometric layers derived from SRTM DEM data, including elevation, slope, aspect, and hillshade. Eight scale parameters ranging from 80 to 3000 were selected as the optimum scale parameters for terrestrial impact craters, which showed the goodness of fit area (0.01–0.5) and high correlation (R2 = 0.78) with diameters in the range of 0.88–100 km. Given the fact that terrestrial impact craters with wide diameters (>100 km) are rarely found (<5%) because of high atmospheric pressure [2], SP of 3000 could be the optimal segmentation parameter for large terrestrial impact craters. The smallest impact craters (0.024–0.64 km) are vulnerable to surface erosion [11] and have indiscernible topographic imprints with 30 m resolution data. Hence, the segmentation threshold for terrestrial impact craters with SRTM DEM is a diameter of 0.88 km which could be segmented by SP of 80, which is the minimum scale parameter suggested by our analysis.
The object-oriented classification using Random Forest successfully detected terrestrial impact craters as well as volcanic calderas and valleys, showing an overall accuracy of 88.4% and a Kappa coefficient of 0.8. The detection accuracy of impact craters was the lowest, with 78.7% among the three topographic features. The relatively lower accuracy was associated with misclassification with volcanic caldera due to morphological similarity. The detection accuracy was highest for valleys (98.8%), followed by volcanic calderas (82.6%). Although the accuracy was lowest for terrestrial impact craters, the accuracy of 78.7% is still considered good prediction accuracy. This infers that this remote sensing approach to the preliminary detection of undiscovered terrestrial impact craters can be effectively used.
The important variables for the detection of terrestrial impact craters were identified as circularity, length-to-width ratio, relief, slope, and elevation. Terrestrial impact craters, in general, have relatively lower circularity and higher length-to-width ratios compared to volcanic calderas and significantly higher circularity and lower length-to-width ratios compared to valleys. Moreover, terrestrial impact craters have relatively lower relief, slope, and elevation than volcanic calderas and significantly higher relief, slope, and elevation than valleys. These geometric and topographic characteristics can be explained by geological processes associated with the formation and post-deformation of impact craters and volcanic calderas. The topography of impact craters surrounded by rims is formed by excavation and ejection and rebound and relaxation, and those processes induce relatively lower elevation. The post-deformation of impact craters, including inward collapse and slump of rims, post-impact erosion, and post-sediment deposition, lower the elevation, relief, and circularity with time. On the other hand, volcanic calderas are mostly associated with volcanic eruptions along tectonic boundaries where high mountain chains are distributed. Moreover, the deep central depression caused by the collapse of the emptied magma chamber results in relatively higher relief and slope. Compared to the impact crater rims, which are relatively unstable due to rapid excavation and the effects of the shock wave, the crystalline walls of volcanic calderas are more resistant to erosional processes, showing higher circularity and a lower width-to-length ratio. Moreover, the GLCM homogeneity of elevation could be included as a useful variable.
This study used 94 exposed and confirmed terrestrial impact craters (45% of worldwide impact craters) and incorporated similar topographic features, such as volcanic calderas, and the most common features, such as valleys. Given the fact that we have introduced a wide range of terrestrial impact craters from a diameter size of 0.88 to 100 km, the method can be generalized to the detection of unidentified craters worldwide using the global DEM models as a reconnaissance survey method. The segmentation parameters and detection variables introduced in this study could significantly contribute to the discovery of hidden terrestrial impact crater candidates in developing countries and remote areas.

Author Contributions

Methodology, H.E. and J.Y.; Software, H.E.; Validation, H.E.; Formal analysis, H.E. and J.Y.; Investigation, H.E. and J.Y.; Resources, J.Y.; Writing—original draft, H.E. and J.Y.; Writing—review & editing, J.Y. and L.W.; Visualization, H.E.; Supervision, J.Y. and D.E.R.R.; Project administration, J.Y. and S.H.C.; Funding acquisition, S.H.C. All authors have read and agreed to the published version of the manuscript.

Funding

This research was funded by [National Research Foundation of Korea] grant number [RS-2023-00208476] and [NRF-2021R1A4A5026233].

Conflicts of Interest

The authors declare no conflict of interest.

Appendix A

Table A1. The confirmed and exposed terrestrial impact craters used in this study were collected from an encyclopedic atlas of terrestrial impact craters [2,7].
Impact CraterCountryLatitudeLongitudeIDDiameter (km)Exposure Target LithologyTypeAges (ma)
DhalaIndia25.29878.142I0112ex, pcCrystallineC1700–2500
Sierra MaderaUSA30.596−102.912I0212ex, pcSandstoneC100
Gweni-FadaChad17.42121.755I0314–22ex, pcSandstoneC355
BigachKazakhstan48.56882.036I048ex, pcMixedC3–5
Meteor Crater USA35.027−111.023I051.2ex, pcSandstoneS0.05
Ramgarh India25.33576.624I0610.2ex, pcSandstoneC165
Cerro do JaraoBrazil−30.211−56.539I0713ex, smorSandstoneC137
Connolly BasinAustralia−23.538124.761I089ex, pcSandstoneC55–75
TenoumerMauritania22.918−10.405I091.9ex, pcMixedS1.52
PiccaninnyAustralia−17.420128.438I107ex, smorSandstoneC360
ChogyeSouthKorea35.537128.269I117ex, pcSandstoneC0.03–0.06
Vargeao DomeBrazil−26.805−52.164I1212.4exSandstoneC137
MienSweden56.43114.856I139ex, subCrystallineC118.7
GowCanada56.453−104.482I155ex, subCrystallineC250
Santa MartaBrazil−10.167−45.233I1610ex, pcSandstoneC93
AcramanAustralia−32.017135.450I1740–85ex, subCrystallineC580
Gosses BluffAustralia−23.817132.308I1822ex, pcSandstoneC142
Upheaval DomeUSA38.433−109.928I206exSandstoneC66–100
FoelscheAustralia−16.676136.784I216ex, pcSandstoneC541–981
Jebel Waqf as SuwwanJordan31.03936.807I226.1ex, pcSandstoneC37
AgoudalMorocco31.996−5.516I242.8exSandstoneC0.3
AoroungaChad19.08419.244I2512.6–16exSandstoneC355
DecaturvilleUSA37.890−92.720I266ex, pcSandstoneC300
BosumtwiGhana6.500−1.408I2710.5ex, subMixedC1.07
DecorahUSA43.300−91.772I295.6pcSandstoneT460–483
OuarkzizAlgeria29.004−7.551I303.5ex, pcSandstoneT66
ZhamanshinKazakhstan48.35060.937I3214ex, pcmixed C0.75–1.1
OasisLibya24.57224.412I335.2–18ex, pcSandstoneC120
Serra da CangalhaBrazil−8.082−46.857I3413.7exCrystallineC300
La MoinerieCanada57.440−66.586I358ex, subCrystallineC400
MiddlesboroUSA36.631−83.728I366exSandstoneC290–300
ColoniaBrazil−23.880−46.706I373.6ex, pcCrystallineT5–36
Vista-AlegreBrazil−25.961−52.690I389.5exMixedC111–134
B.P. structureLibya25.31824.310I403.4exSandstoneC120
RagozinkaRussia58.70661.797I419ex, pcmixedC50
GoyderAustralia−13.477135.040I433ex, pcSandstoneC150–1400
ChiyliKazakhstan49.17757.834I445.5ex, pcSandstoneC5.5
LonarIndia19.97476.509I461.88ex, subCrystallineS0.57
WetumpkaUSA32.525−86.176I477exCrystallineC84
KarakulTajikistan39.06773.433I4852ex, smorMixedC50–5
PantasmaNicaragua13.365−85.954I4914exCrystallineC0.8
ShunakKazakhstan47.20772.761I502.8ex, pcCrystallineS34
Deep BayCanada56.415−102.983I5113ex, subCrystallineC95–102
CrawfordAustralia−34.728139.033I538.5exCrystallineC32–38
TalemzaneAlgeria33.3154.034I541.75ex, pcSandstoneS0.5–3
XiuyanChina40.364123.460I571.8ex, pcCrystallineS0.05
Goat PaddockAustralia−18.348126.677I615ex, pcSandstoneT56–64
Tin BiderAlgeria27.6005.112I626ex, pcSandstoneC50
Clearwater WestCanada56.211−74.500I6332ex, subMixedC290–300
Clearwater EastCanada56.064−74.083I6424ex, subMixedC460–470
SpiderAustralia−16.742126.089I6613ex, smorSandstoneC573
Roter KammNamibia−27.76216.289I672.5ex, pcSandstoneS5
YilanChina46.391129.311I691.85ex, pcCrystallineS0.05
TswaingSouthAfrica−25.41128.083I701.13ex, subMixedS0.22
ShoemakerAustralia−25.881120.883I7130ex, pcSandstoneC1630
BrentCanada46.078−78.482I733.8ex, pcCrystallineS396–453
RiesGermany48.87310.695I7726ex, pcCrystallineC15
Wolfe creekAustralia−19.170127.795I780.88ex, pcSandstoneS0.12
CleanskinAustralia−18.170137.942I7915ex, pcSandstoneC540–1400
LuiziD.R. Congo−10.17528.006I6517exSandstoneC575
CarswellCanada58.418−109.517I8239ex, smorMixedC481
StrangwaysAustralia−15.200133.567I8425–40ex, pcMixedC646
Sao Miguel do TapuioBrazil−5.617−41.388I8721exSandstoneC120
Amelia CreekAustralia−20.858134.883I8820exMixedC600–1600
MistastinCanada55.891−63.311I8928ex, subCrystallineC36.6
CharlevoixCanada47.533−70.350I9055ex, subMixedC450
BeaverheadUSA44.600−112.967I9160–75ex, pcMixedC600
AraguainhaBrazil−16.785−52.983I9240exCrystallineC252–259
Lawn HillAustralia−18.693138.652I9320ex, pcSandstoneC472
ManicouaganCanada51.399−68.683I9470–100ex, subCrystallineC214
LiverpoolAustralia−12.393134.047I812ex, pcSandstoneS150
Tabun-Khara oboMongolia44.131109.654I831.3ex, pcSandstoneS145–163
RitlandNorway59.2496.422I392.7ex, pcmixedS500–540
AouelloulMauritania20.241−12.675I450.39ex, pcSandstoneS3.1
DalgarangaAustralia−27.633117.289I560.024ex, pcCrystallineS0.27
MonturaquiChile−23.928−68.262I580.36exCrystallineS0.663
KalkkopSouthAfrica−32.70924.432I550.64ex, pcSandstoneS0.25
AmguidAlgeria26.0884.395I680.45ex, pcSandstoneS0.1
KamilEgypt22.01826.088I190.045exSandstoneS0.003
BoxholeAustralia−22.613135.196I140.17exCrystallineS0.017
WhitecourtCanada53.999−115.596I720.036exSandstoneS0.001
HenburyAustralia−24.571133.148I230.18ex, pcSandstoneS0.0042
Rio CuartoArgentina−32.871−64.183I314.5exSandstoneS0.11
YallalieAustralia−30.443115.771I5912pcSandstoneC83.6–89.8
PresquileCanada49.726−74.833I7422ex, subCrystallineC500
MachaRussia60.085117.652I60 0.3ex, pc,SandstoneC0.0073
Rock ElmUSA44.717−92.228I286.5ex, pcSandstoneC410–460
Mount ToondinaAustralia−27.945135.359I524ex, pcSandstoneC66–144
Kelly westAustralia−19.933133.950I7514ex, pcSandstoneC541
Matt WilsonAustralia−15.506131.181I427.5exSandstoneC1400–1500
SudburyCanada46.600−81.183I76180–200ex, pcCrystallineC1849
VredefortSouthAfrica−27.00927.500I85180–275ex, pcCrystalline C2023
RochechouartFrance45.8310.782I8623exCrystallineC201
YarrabubbaAustralia−27.183118.833I8030ex, pcSandstoneC2246
C: Complex, S: Simple, T: Transitional, ex: exposed, pc: partial covered, smor: subdued morphology, sub: submerged.
Table A2. Volcanic calderas used in this study were selected from collapse caldera worldwide database (CCDB) [38].
Volcanic CalderasCountryLatitudeLongitudeD_maxD_minTypeID
TobaIndonesia2.58098.83010030CV103
TaalPhilippines14.010120.9983025SV10
Kawah IjenIndonesia−8.119114.0562020SV18
Ijen_IIIndonesia−8.058114.2441817SV19
ShikotsuJapan42.751141.3171513SV49
Long Valley USA37.717−118.8843218CV56
SolitarioUSA29.451−103.8091616CV62
RotoruaNewZeland−38.080176.2502016SV73
Crater LakeUSA42.930−122.113108SV74
Henry’s Fork CalderaUSA44.330−111.3303729CV77
NgorongoroTanzania−3.17735.5801916SV80
KapengaNewZeland−38.089176.273??CV92
Colli Albani Italy41.75412.7001210CV97
CopahueChile & Argentine−37.858−71.1771010SV03
Paektu MountainChina & N. Korea42.005128.0561412SV07
KarymshinaRussia54.118159.6572515CV101
AsoJapan32.885131.0842518CV17
Mount LongonotKenya−1.15536.354128CV37
VallesUSA35.870−106.5702216CV58
BracianoItaly42.31612.1742015SV96
Akademia NaukRussia53.981159.4621111SV98
UzonRussia54.500159.970129CV99
AyarzaGuatemala14.420−90.12075SV08
Mount OkmokUSA53.468−168.1759.39.3CV09
DeribaSudan12.95024.27055CV23
ToyaJapan42.598140.856109CV48
Mount SilaliKenya1.15236.23185CV59
IlopangoEl Salvador13.670−89.050118CV60
AlcedoEcuador−0.430−91.1207.46.1SV67
Mount AniakchakUSA56.864−158.1511010CV79
Emi KoussiChad19.85118.5381612CV93
HuichapanMexico20.340−99.5501010CV104
Sollipulli Chile−38.970−71.52044SV15
GadamsaEthiopia8.35639.18179CV24
KarkarNew Guinea−4.650145.9675.53.2CV25
Agua de PauPortugal37.770−25.47074SV26
The BarrierKenya2.32036.58765CV29
MallahleEthiopia13.27041.65066CV34
AsavyoEthiopia13.09841.5991212CV35
SuswaKenya−0.91536.457128CV36
KoneEthiopia8.84039.68865CV40
San PedroMexico21.263−104.69888CV46
GallosueloNewZeland−5.200151.240??SV51
DarwinEcuador−0.180−91.28055SV68
Cerro AzulEcuador−0.170−91.24055SV69
Sierra NegraEcuador−0.830−91.170107SV71
WorfEcuador−0.020−91.35075SV72
Cerro PanizosArgentina−22.187−66.6811515CV75
GadamsaEthiopia8.35039.180108CV76
IncapilloArgentina−27.902−68.82465CV78
OlmotiTanzania−3.01635.6526.56.5CV82
NemurtTurkey38.62142.2358.57SV91
VicoItaly42.12012.230--CV94
MontefiasconeItaly42.57911.93133SV95
LaslajasNicaragua12.300−85.73077CV04
Krasheninnikov Russia54.593160.273119CV102
KarthalaComores Island−11.76043.35343SV12
Ale BaguEthiopia13.50840.63232.1CV13
AmealcoMexico20.126−100.1691111CV16
NumazawaJapan37.450139.57932CV22
Sete CidadesPortugal37.870−25.78055SV28
FantaleEthiopia8.98439.90743SV39
Mauna LoaUSA19.479−155.6036.22.5CV41
FernandinaEcuador−0.370−91.5506.56.5SV70
EmbagaiTanzania−2.91135.82744SV81
Gorely KhrebetRussia52.558158.0271310CV87
ChangbaishanChina & N. Korea42.005128.05855SV05
Mount KatmaiUSA58.260−154.9751010SV11
Towada IVJapan40.500140.9003.53SV21
FurnasPortugal37.770−25.32066CV27
KaguyakUSA58.613−154.05332.5SV31
MazamaUSA58.613−154.053108CV38
VillarricaChile &Argentine−39.420−71.95096CV53
Aoba (Ambae)Vanuatu−15.389167.8352.12.1SV02
Izu-OshimaJapan34.724139.3944.53.5CV06
NgoziTanzania−9.01033.55433SV30
PinatuboPhilippines15.142120.3502.52.5SV32
Cerro AzulChile−35.653−70.76145SV33
Geger HalangIndonesia−6.896108.40844CV44
CeborucoMexico21.125−104.5083.73.7CV45
Mount MeruTanzania−3.24736.7483.53.5CV52
IkedaJapan31.237130.56154CV57
Coate pequeEl Salvador13.859−89.55355CV61
TianChiChina42.007128.05455SV64
TazawaJapan39.721140.66366SV65
SakurajimaJapan31.578130.6612317CV01
ConguillioChile−38.901−71.72843SV14
PakaKenya0.91836.1911.51.5SV20
Mauna KeaUSA19.813−155.4724.22.5CV42
PoasCosta Rica10.200−84.2332.52.5SV43
KuttaraJapan42.500141.18033SV47
GallosueloNewZeland−5.342151.1171310.5CV50
Logo TromenChile-Argentine−39.931−72.02856CV54
Mocho chosheuncoChile-Argentine−39.500−71.71554CV55
Lake CityUSA37.955−107.3911815CV63
GroppoEthiopia11.71540.2323.83.8CV66
MonduliTanzania−2.86835.9492.92.9SV83
GelaTanzania−2.76335.9163.13.1SV84
OldeaniTanzania−3.29735.44933SV85
CreedeUSA37.748−106.9222520CV86
MutnovskyRussia52.451158.16699CV88
KsudachRussia51.800157.53077CV89
OpalaRussia52.543157.3391412CV90
Mary SemyachikRussia54.058159.4421010CV100
C: Coalesced pit, S: Single pit, D_min: Minimum diameter, D_max: Maximum diameter.
Figure A1. Size frequency distribution plot of impact craters and volcanic calderas used in this study.
Remotesensing 15 03807 g0a1
Figure A2. Representative segmentation of impact craters smaller than 0.88 km diameter showing unreliable segmentation results.
Remotesensing 15 03807 g0a2

References

  1. Bruzzone, L.; Lizzi, L.; Marchetti, P.G.; Earl, J.; Milnes, M. Recognition and detection of impact craters from EO products. Eur. Sp. Agency Spec. Publ. ESA SP 2004, 553E.13B, 85–92. [Google Scholar]
  2. Ishak, B. Encyclopedic Atlas of Terrestrial Impact Craters; Contemporary Physics; Springer: Berlin/Heidelberg, Germany, 2019; Volume 60, p. 330. ISBN 9783030054496. [Google Scholar]
  3. Grieve, R.A.F.; Therriault, A.M. Observations at terrestrial impact structures: Their utility in constraining crater formation. Meteorit. Planet. Sci. 2004, 39, 199–216. [Google Scholar] [CrossRef]
  4. Kennedy, J.; Alanís, R.M. Book Review. Carbohydr. Polym. 2005, 62, 87. [Google Scholar] [CrossRef]
  5. Schmieder, M.; Kring, D.A. Earth’s Impact Events through Geologic Time: A List of Recommended Ages for Terrestrial Impact Structures and Deposits. Astrobiology 2020, 20, 91–141. [Google Scholar] [CrossRef]
  6. Le Feuvre, M.; Wieczorek, M.A. Nonuniform cratering of the terrestrial planets. Icarus 2008, 197, 291–306. [Google Scholar] [CrossRef]
  7. Kenkmann, T. The terrestrial impact crater record: A statistical analysis of morphologies, structures, ages, lithologies, and more. Meteorit. Planet. Sci. 2021, 56, 1024–1070. [Google Scholar] [CrossRef]
  8. Crósta, A.P.; Reimold, W.U.; Vasconcelos, M.A.R.; Hauser, N.; Oliveira, G.J.G.; Maziviero, M.V.; Góes, A.M. Impact cratering: The South American record—Part 1. Chem. Der Erde 2019, 79, 1–61. [Google Scholar] [CrossRef]
  9. Lobpries, T.A.; Lapen, T.J. Remote sensing evidence for a possible 10 kilometer in diameter impact structure in north-central Niger. J. Afr. Earth Sci. 2019, 150, 673–684. [Google Scholar] [CrossRef]
  10. Reimold, W.U.; Koeberl, C. Impact structures in Africa: A review. J. Afr. Earth Sci. 2014, 93, 57–175. [Google Scholar] [CrossRef] [Green Version]
  11. Wright, S.P.; Tornabene, L.L.; Ramsey, M.S. Remote Sensing of Impact Craters. Impact Cratering Process. Prod. 2012, 194–210. [Google Scholar] [CrossRef]
  12. Mansouri Daneshvar, M.R. Remote sensing analysis for the possible impact structure of Lakhčak Crater in southern Afghanistan. Appl. Geomat. 2015, 7, 275–282. [Google Scholar] [CrossRef]
  13. Scholz, C.A.; Karp, T.; Lyons, R.P. Structure and morphology of the Bosumtwi impact structure from seismic reflection data. Meteorit. Planet. Sci. 2007, 42, 549–560. [Google Scholar] [CrossRef]
  14. Vasconcelos, M.A.R.; Crósta, A.P.; Molina, E.C. Geophysical characteristics of four possible impact structures in the Parnaíba Basin, Brazil: Comparison and implications. Spec. Pap. Geol. Soc. Am. 2010, 465, 201–217. [Google Scholar] [CrossRef]
  15. Theilen-Willige, B. Morphometric and Structural Evaluations of Satellite Data from the Bosumtwi Impact Structure and Adjacent Areas in Ashanti, Ghana. Eur. J. Environ. Earth Sci. 2021, 2, 7–14. [Google Scholar] [CrossRef]
  16. Wang, X.Y.; Luo, L.; Guo, H.D.; Mu, L.L.; Li, C.; Ji, W.; Cai, H. Cratering process and morphological features of the Xiuyan impact crater in Northeast China. Sci. China Earth Sci. 2013, 56, 1629–1638. [Google Scholar] [CrossRef]
  17. Crósta, A.P.; Kazzuo-Vieira, C.; Pitarello, L.; Koeberl, C.; Kenkmann, T. Geology and impact features of Vargeão Dome, southern Brazil. Meteorit. Planet. Sci. 2012, 47, 51–71. [Google Scholar] [CrossRef] [Green Version]
  18. Maziviero, M.V.; Vasconcelos, M.A.R.; Crósta, A.P.; Góes, A.M.; Reimold, W.U.; De Carneiro, C. Geology and impact features of Riachão structure, northern Brazil. Meteorit. Planet. Sci. 2013, 48, 2044–2058. [Google Scholar] [CrossRef] [Green Version]
  19. Williams, G.E.; Gostin, V.A. Geomorphology of the Acraman impact structure, Gawler Ranges, South Australia. Cad. Do Lab. Xeol. Laxe 2010, 35, 209–219. [Google Scholar]
  20. Vamshi, G.T.; Martha, T.R.; Vinod Kumar, K. An object-based classification method for automatic detection of lunar impact craters from topographic data. Adv. Sp. Res. 2016, 57, 1978–1988. [Google Scholar] [CrossRef]
  21. Sawabe, Y.; Matsunaga, T.; Rokugawa, S. Automated detection and classification of lunar craters using multiple approaches. Adv. Sp. Res. 2006, 37, 21–27. [Google Scholar] [CrossRef]
  22. Urbach, E.R.; Stepinski, T.F. Automatic detection of sub-km craters in high resolution planetary images. Planet. Space Sci. 2009, 57, 880–887. [Google Scholar] [CrossRef]
  23. Salamunićcar, G.; Lonarić, S.; Pina, P.; Bandeira, L.; Saraiva, J. MA130301GT catalogue of Martian impact craters and advanced evaluation of crater detection algorithms using diverse topography and image datasets. Planet. Space Sci. 2011, 59, 111–131. [Google Scholar] [CrossRef]
  24. Masaitis, V.L. Morphological, structural and lithological records of terrestrial impacts: An overview. Aust. J. Earth Sci. 2005, 52, 509–528. [Google Scholar] [CrossRef] [Green Version]
  25. Li, W.; Zhou, B.; Hsu, C.Y.; Li, Y.; Ren, F. Recognizing terrain features on terrestrial surface using a deep learning model—An example with crater detection. Proc. 1st Work. GeoAI AI Deep Learn. Geogr. Knowl. Discov. GeoAI 2017, 33–36. [Google Scholar] [CrossRef]
  26. Grieve, R.A.F. Economic natural resource deposits at terrestrial impact structures. Geol. Soc. Spec. Publ. 2005, 248, 1–29. [Google Scholar] [CrossRef]
  27. Turtle, E.P.; Pierazzo, E.; Collins, G.S.; Osinski, G.R.; Melosh, H.J.; Morgan, J.V.; Reimold, W.U. Impact structures: What does crater diameter mean? Spec. Pap. Geol. Soc. Am. 2005, 384, 1–24. [Google Scholar] [CrossRef]
  28. Osinski, G.R.; Silber, E.A.; Clayton, J.; Grieve, R.A.F.; Hansen, K.; Johnson, C.L.; Kalynn, J.; Tornabene, L.L. Transitional impact craters on the Moon: Insight into the effect of target lithology on the impact cratering process. Meteorit. Planet. Sci. 2019, 54, 573–591. [Google Scholar] [CrossRef]
  29. Kenkmann, T.; Poelchau, M.H.; Wulf, G. Structural geology of impact craters. J. Struct. Geol. 2014, 62, 156–182. [Google Scholar] [CrossRef]
  30. Holohan, E.P.; Schöpfer, M.P.J.; Walsh, J.J. Mechanical and geometric controls on the structural evolution of pit crater and caldera subsidence. J. Geophys. Res. Solid Earth 2011, 116, B07202. [Google Scholar] [CrossRef]
  31. Geyer, A.; Martí, J. A short review of our current understanding of the development of ring faults during collapse caldera formation. Front. Earth Sci. 2014, 2, 22. [Google Scholar] [CrossRef] [Green Version]
  32. Acocella, V. Regional and local tectonics at Erta Ale caldera, Afar (Ethiopia). J. Struct. Geol. 2006, 28, 1808–1820. [Google Scholar] [CrossRef]
  33. Thouret, J.C. Volcanic geomorphology-an overview. Earth Sci. Rev. 1999, 47, 95–131. [Google Scholar] [CrossRef]
  34. Carrión-Mero, P.; Montalván-Burbano, N.; Paz-Salas, N.; Morante-Carballo, F. Volcanic geomorphology: A review of worldwide research. Geoscience 2020, 10, 347. [Google Scholar] [CrossRef]
  35. Straumann, R.K.; Purves, R.S. Delineation of valleys and valley floors. Lect. Notes Comput. Sci. Incl. Subser. Lect. Notes Artif. Intell. Lect. Notes Bioinform. 2008, 5266, 320–336. [Google Scholar] [CrossRef] [Green Version]
  36. Bamber, E.R.; Goudge, T.A.; Fassett, C.I.; Osinski, G.R. Constraining the formation of paleolake inlet valleys across crater rims. Icarus 2022, 378, 114945. [Google Scholar] [CrossRef]
  37. Survey USG. USGS [Internet]. Available online: https://earthexplorer.usgs.gov (accessed on 14 December 2021).
  38. GVB-CSIC. CCDB [Internet]. Available online: https://gvb-csic.es/CCDB/ (accessed on 10 December 2021).
  39. Trimble. Trimble Documentation: eCognition® Developer User Guide; Trimble Germany GmbH: Munich, Germany, 2018; pp. 1–272. [Google Scholar]
  40. Drǎguţ, L.; Eisank, C. Automated object-based classification of topography from SRTM data. Geomorphology 2012, 141–142, 21–33. [Google Scholar] [CrossRef] [Green Version]
  41. Ma, L.; Li, M.; Ma, X.; Cheng, L.; Du, P.; Liu, Y. A review of supervised object-based land-cover image classification. ISPRS J. Photogramm. Remote Sens. 2017, 130, 277–293. [Google Scholar] [CrossRef]
  42. Martha, T.R.; Kerle, N.; Jetten, V.; van Westen, C.J.; Kumar, K.V. Characterising spectral, spatial and morphometric properties of landslides for semi-automatic detection using object-oriented methods. Geomorphology 2010, 116, 24–36. [Google Scholar] [CrossRef]
  43. Lucieer, A.; Stein, A. Existential uncertainty of spatial objects segmented from satellite sensor imagery. IEEE Trans. Geosci. Remote Sens. 2002, 40, 2518–2521. [Google Scholar] [CrossRef] [Green Version]
  44. El-naggar, A.M. Determination of optimum segmentation parameter values for extracting building from remote sensing images. Alex. Eng. J. 2018, 57, 3089–3097. [Google Scholar] [CrossRef]
  45. Yang, J.; He, Y.; Caspersen, J.; Jones, T. A discrepancy measure for segmentation evaluation from the perspective of object recognition. ISPRS J. Photogramm. Remote Sens. 2015, 101, 186–192. [Google Scholar] [CrossRef]
  46. Li, P.; Song, B.; Guo, J.; Xiao, X. A Multilevel Hierarchical Image Segmentation Method for Urban Impervious Surface Mapping Using Very High Resolution Imagery. IEEE J. Sel. Top. Appl. Earth Obs. Remote Sens. 2011, 4, 103–116. [Google Scholar] [CrossRef]
  47. DeFries, R.S.; Chan, J.C.W. Multiple criteria for evaluating machine learning algorithms for land cover classification from satellite data. Remote Sens. Environ. 2000, 74, 503–515. [Google Scholar] [CrossRef]
  48. Castillejo-González, I.L.; Angueira, C.; García-Ferrer, A.; Orden, M.S. de la Combining object-based image analysis with topographic data for landform mapping: A case study in the semi-arid Chaco ecosystem, Argentina. ISPRS Int. J. Geo.-Inf. 2019, 8, 132. [Google Scholar] [CrossRef] [Green Version]
  49. Olaya, V.; Conrad, O. Geomorphometry in SAGA; Elsevier: Amsterdam, The Netherlands, 2009; Volume 33, pp. 293–308. ISBN 9780123743459. [Google Scholar]
  50. Van Den Eeckhaut, M.; Poesen, J.; Verstraeten, G.; Vanacker, V.; Moeyersons, J.; Nyssen, J.; van Beek, L.P.H. The effectiveness of hillshade maps and expert knowledge in mapping old deep-seated landslides. Geomorphology 2005, 67, 351–363. [Google Scholar] [CrossRef]
  51. Wilson, J.P.; Gallant, J.C. (Eds.) Terrain Analysis: Principles and Applications; John Wiley & Sons: Hoboken, NJ, USA, 2000; p. 520. Available online: https://www.wiley.com/en-ie/Terrain+Analysis:+Principles+and+Applications-p-9780471321880 (accessed on 25 February 2022).
  52. Na, J.; Ding, H.; Zhao, W.; Liu, K.; Tang, G.; Pfeifer, N. Object-based large-scale terrain classification combined with segmentation optimization and terrain features: A case study in China. Trans. GIS 2021, 25, 2939–2962. [Google Scholar] [CrossRef]
  53. Takashimizu, Y.; Iiyoshi, M. New parameter of roundness R: Circularity corrected by aspect ratio. Prog. Earth Planet. Sci. 2016, 3, 2. [Google Scholar] [CrossRef] [Green Version]
  54. Laliberte, A.S.; Rango, A. Texture and scale in object-based analysis of subdecimeter resolution unmanned aerial vehicle (UAV) imagery. IEEE Trans. Geosci. Remote Sens. 2009, 47, 761–770. [Google Scholar] [CrossRef] [Green Version]
  55. Mason, B.G.; Pyle, D.M.; Oppenheimer, C. The size and frequency of the largest explosive eruptions on Earth. Bull. Volcanol. 2004, 66, 735–748. [Google Scholar] [CrossRef]
  56. Tsikalas, F.; Faleide, J.I. Post-impact structural crater modification due to sediment loading: An overlooked process. Meteorit. Planet. Sci. 2007, 42, 2013–2029. [Google Scholar] [CrossRef]
  57. Cole, J.W.; Milner, D.M.; Spinks, K.D. Calderas and caldera structures: A review. Earth-Sci. Rev. 2005, 69, 1–26. [Google Scholar] [CrossRef]
  58. Mouginis-Mark, P.J.; Rowland, S.K. The geomorphology of planetary calderas. Geomorphology 2001, 37, 201–223. [Google Scholar] [CrossRef]
  59. Krüger, T.; Hergarten, S.; Kenkmann, T. Deriving morphometric parameters and the simple-to-complex transition diameter from a high-resolution, global database of fresh lunar impact craters (D ≥ ~ 3 km). J. Geophys.Res. Planets 2018, 123, 2667–2690. [Google Scholar] [CrossRef]
  60. Schmincke, H. Cyclic caldera collapse: Piston or piecemeal subsidence? Field and experimental evidence. Geology 2002, 30, 135–138. [Google Scholar]
  61. Lavallée, Y.; Stix, J.; Kennedy, B.; Richer, M.; Longpré, M.A. Caldera subsidence in areas of variable topographic relief: Results from analogue modeling. J. Volcanol. Geotherm. Res. 2004, 129, 219–236. [Google Scholar] [CrossRef]
  62. McCall, G.J.H. Half a century of progress in research on terrestrial impact structures: A review. Earth-Sci. Rev. 2009, 92, 99–116. [Google Scholar] [CrossRef]
Figure 1. World map with the exposed impact craters and a sample of volcanic calderas locations.
Remotesensing 15 03807 g001
Figure 2. The graphical workflow for object-oriented terrestrial impact detection.
Remotesensing 15 03807 g002
Figure 3. DEM layers of (a) Manicouagan impact crater (Canada); and (b) Vredefort crater (South Africa) with their respective multi scales segmentation results. Red segments represent the objects intended to suitably outline the possible crater rim at different SPs, and blue segments represent the various objects formed around other features.
Remotesensing 15 03807 g003
Figure 4. Multiple scale segmentation results of representative impact craters.
Remotesensing 15 03807 g004
Figure 5. The overlapping situation for each scale impact craters; the blue dot points represent the impact craters that were firstly detected at larger SPs, and orange dot points represent the impact craters that were re-detected at other subscale scales.
Remotesensing 15 03807 g005
Figure 6. Variable importance of object attributes, the 7 variables above the red dotted line showed the major influence for detecting impact craters.
Remotesensing 15 03807 g006
Figure 7. The violin plots for crater, caldera, and valley showing the density distribution of seven important variables: (a) Circularity index, (b) Lenth to width ratio index, (c) relief, (d) slope, (e) elevation, (f) GLCM Homogeneity and (g) standard deviation of slope.
Remotesensing 15 03807 g007
Table 2. Attempted optimum scale parameters and number of detected features.
Segmentation SettingsImpact Craters
SPShapeCompactnessDiameter Range (km)Count Segmented (%)AFICount Not Segmented (%)
5000–30000.40.670–1801 (1.0)0.482 (2.1)
20000.40.624–608 (8.5)0.07–0.500
10000.40.68–3912 (12.7)0.01–0.410
7000.40.66–306 (6.3)0.08–0.432 (2.1)
4000.40.66–179 (9.5)0.04–0.433 (3.1)
2000.40.61.8–1221 (22.3)0.08–0.496 (6.3)
1000.40.61.8–66 (6.3)0.12–0.440
800.40.60.88–3.47 (7.4)0.12–0.351
600.40.60.024–0.640010 (11.7)
Overall:70/94 (74.5%) 24 (25.5%)
Table 3. Confusion matrix of training, validation data from RF algorithm, where Production’s Accuracy (PA) and User’s Accuracy (UA) for each class are also presented.
Training data
Classes:CraterCalderaValley
Crater4300Accuracy100%
Caldera0590Kappa Coefficient1
Valley0082
Validation data
Classes:CraterCalderaValleyPA (%)UA (%)
Crater203174.183.3
Caldera723088.576.6
Valley004197.6100
Overall accuracy
Accuracy 88.4
Kappa coefficient 0.82
Disclaimer/Publisher’s Note: The statements, opinions and data contained in all publications are solely those of the individual author(s) and contributor(s) and not of MDPI and/or the editor(s). MDPI and/or the editor(s) disclaim responsibility for any injury to people or property resulting from any ideas, methods, instructions or products referred to in the content.

