Article

Research on an Intra-Pulse Orthogonal Waveform and Methods Resisting Interrupted-Sampling Repeater Jamming within the Same Frequency Band

1
The College of Electronic Science and Technology, National University of Defense Technology, Changsha 410073, China
2
Information Research Center of Military Science, Academy of Military Sciences, Beijing 100142, China
*
Author to whom correspondence should be addressed.
These authors contributed equally to this work.
Remote Sens. 2023, 15(14), 3673; https://doi.org/10.3390/rs15143673
Submission received: 28 June 2023 / Revised: 18 July 2023 / Accepted: 19 July 2023 / Published: 23 July 2023
(This article belongs to the Topic Radar Signal and Data Processing with Applications)

Abstract

:
Interrupted-sampling repeater jamming (ISRJ) is a kind of intra-pulse coherent deception jamming that can generate false target peaks in the range profile and interfere with the detection and tracking of real targets. In this paper, an anti-ISRJ method based on the intra-pulse orthogonal waveform is proposed, which can recognize common interference signals by comparing sub-signal matched filtering results. For some special scenes where real targets cannot be directly differentiated from false targets, a new recognition method based on the energy discontinuity of the interference signal in the time domain is proposed in this paper. The method proposed in this paper can recognize real and false targets in all ISRJ modes without any prior information, such as jammer parameters, with a small amount of calculation, which is suitable for actual radar systems. Simulation experiments using different interference parameters show that although this method has a 3 dB loss of pulse compression gain, it can completely suppress different kinds of ISRJ interference when the SNR before pulse compression is higher than −20 dB, with 100% target detection probability.

1. Introduction

With the development of digital radio-frequency memory devices, interrupted-sampling repeater jamming (ISRJ) [1,2,3,4,5,6,7,8] is widely used in electronic countermeasures. ISRJ is a kind of intra-pulse interference that contains a process in which a jammer samples the radar waveform and then transmits it back immediately. Because the interference signal is highly coherent with the real target echo, the true and false target peaks simultaneously appear in the range profile after pulse compression. Due to the flexible interference parameters, the jammer can generate false targets with variable number, amplitude, and position. In addition, due to the unidirectional wave path and pulse compression gain between the jammer and the radar, the jammer can generate a false target peak with larger amplitude at a lower transmission power, which brings great challenges to the detection and tracking of real targets.
To solve the anti-ISRJ problem, a basic work is to study the inherent characteristics of interference signals. In scenarios such as self-defense jamming, since the transmitting and receiving antennas of the jammer share a common signal channel, the ISRJ signal appears as a discontinuous segment of the transmitted radar waveform. The short duration and discontinuous characteristics of the jamming signal lead to its frequency spectrum characteristics being different from the real target echo. Based on the frequency spectrum, the features such as the fractal box dimension [9], resemblance coefficient [10], and fractal correlation dimension [11] can be extracted from the frequency spectrum for the detection of interference signals.
For echoes mixed with ISRJ signals, interference suppression methods and classification methods have been studied in the current literature. The suppression methods generally use band-pass filtering methods to suppress the interference signal while retaining the real target echo [12,13,14,15]. The band-pass filter design depends on the extraction of the echo signal segment without interference, a common method of which is to use the discontinuity characteristic of the ISRJ signal in the domain of short-time Fourier transform (STFT) [12]. However, the correspondence between the width of the smooth window in STFT and the width of the extracted non-interference signal requires a lot of additional prior information. In addition, some scholars use adaptive deep neural networks to extract the non-interference signal to generate band-pass filters [16]. However, the training of neural networks requires a lot of data, and the performance of neural networks trained with simulated data needs to be further verified by practically measured data in the real case of radar. The classification methods generally take measures to extract the identifiable features of interference signals. The pulse width of ISRJ signal slices is always shorter than that of transmitting radar waveforms. Therefore, the ISRJ signal can be distinguished by extracting the signal pulse width parameters or related features. The authors of [17] used short-time fractional Fourier transform (STFRFT) to identify ISRJ signals. They used the peak amplitude difference of the target output by STFRFT with different window lengths to identify the false target. However, this method requires a large amount of calculation and is difficult to apply in engineering. The interference classification method based on the sliding truncated matched filter [18] obtains the two-dimensional amplitude distribution of the interference signal with a two-dimensional search of the time delay and the window width of the matched filter. However, in the absence of prior information such as the pulse width of the interference signal, the global two-dimensional search requires a large amount of calculation and is not suitable for real-time applications of actual radar systems.
In recent years, the anti-ISRJ method, based on transmitter waveform design, has attracted the attention of researchers. Some scholars have designed a sparse Doppler waveform to destroy the Doppler continuity of the interference signal, and proposed an interference detection and suppression method through sliding window extraction based on the waveform with characteristics of the time-domain interval sidelobe [19]. Ref. [20] used different widths and frequencies to design an intra-pulse frequency-coded frequency-modulated continuous waveform (IPFC-FMCW), which has a low sidelobe level. Optimizing the waveform can achieve a better range of recovery performance. In order to better restore the echo signal, Ref. [21] proposed a sparsity-based technique for mitigating the incoherent interference between FMCW radars. This technique can detect the envelope of the interference, and restore the radar echoes. Ref. [22] proposed an intra-pulse orthogonal Linear Frequency Modulation-Phase Coded (LFM-PC) waveform, in which the interference is identified and suppressed by the segmented matched filter of the receiver. However, when the jammer continuously samples and forwards the waveform, it will not effectively distinguish between true and false targets, because the waveform relies on the signal fragment not transmitted by the jammer to complete target detection. Through optimized algorithms such as mismatched filtering [23], complementary waveforms [24,25], and others, it is possible to jointly design the transmit waveform and the mismatched filter. However, designing the mismatched filter with prior information of the relevant fragments of the identified interference signal is crucial in order to effectively resist the jammer’s parameter agility.
To solve the anti-ISRJ problem in variable conditions, this paper proposes an intra-pulse orthogonal waveform based on a segmented chirp signal and an interference recognition algorithm based on instantaneous energy integration without any prior information such as jammer parameters. Theoretically, the proposed method can identify the false target caused by the ISRJ generated by the jammer in all working modes. The innovations of this paper are as follows.
  • An intra-pulse orthogonal waveform based on a segmented chirp signal is proposed. The proposed orthogonal waveform makes full use of the quasi-orthogonal characteristics of the Up Chirp and Down Chirp signals. By comparing the target peak positions after the matched filtering of the Up Chirp and Down Chirp signals, most of the false target peak generated by ISRJ can be identified.
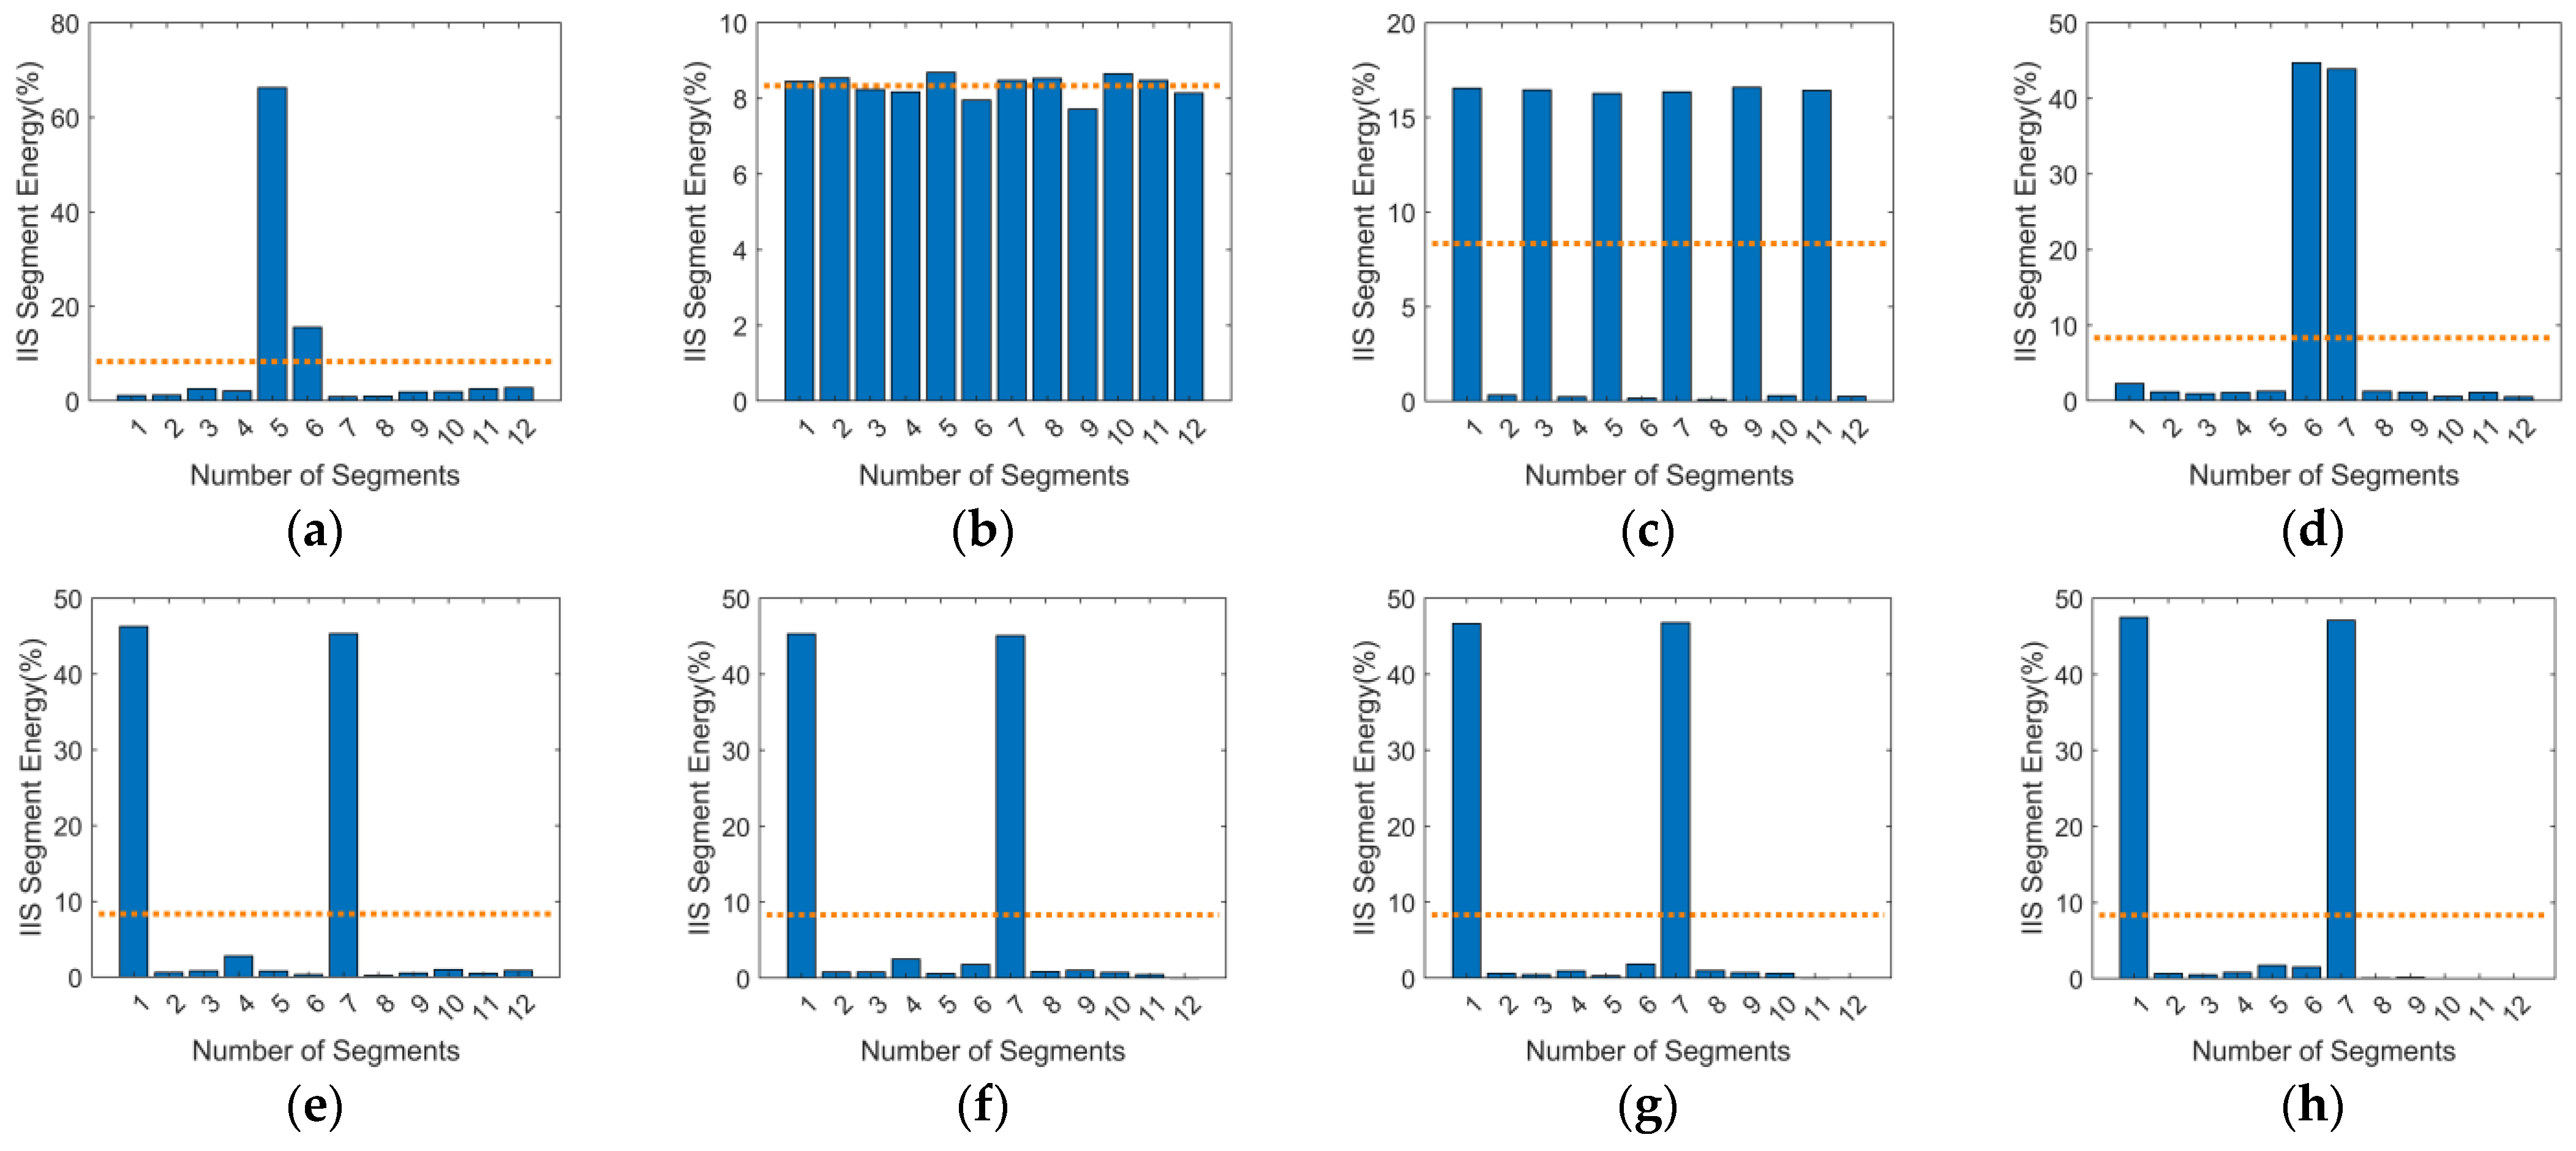
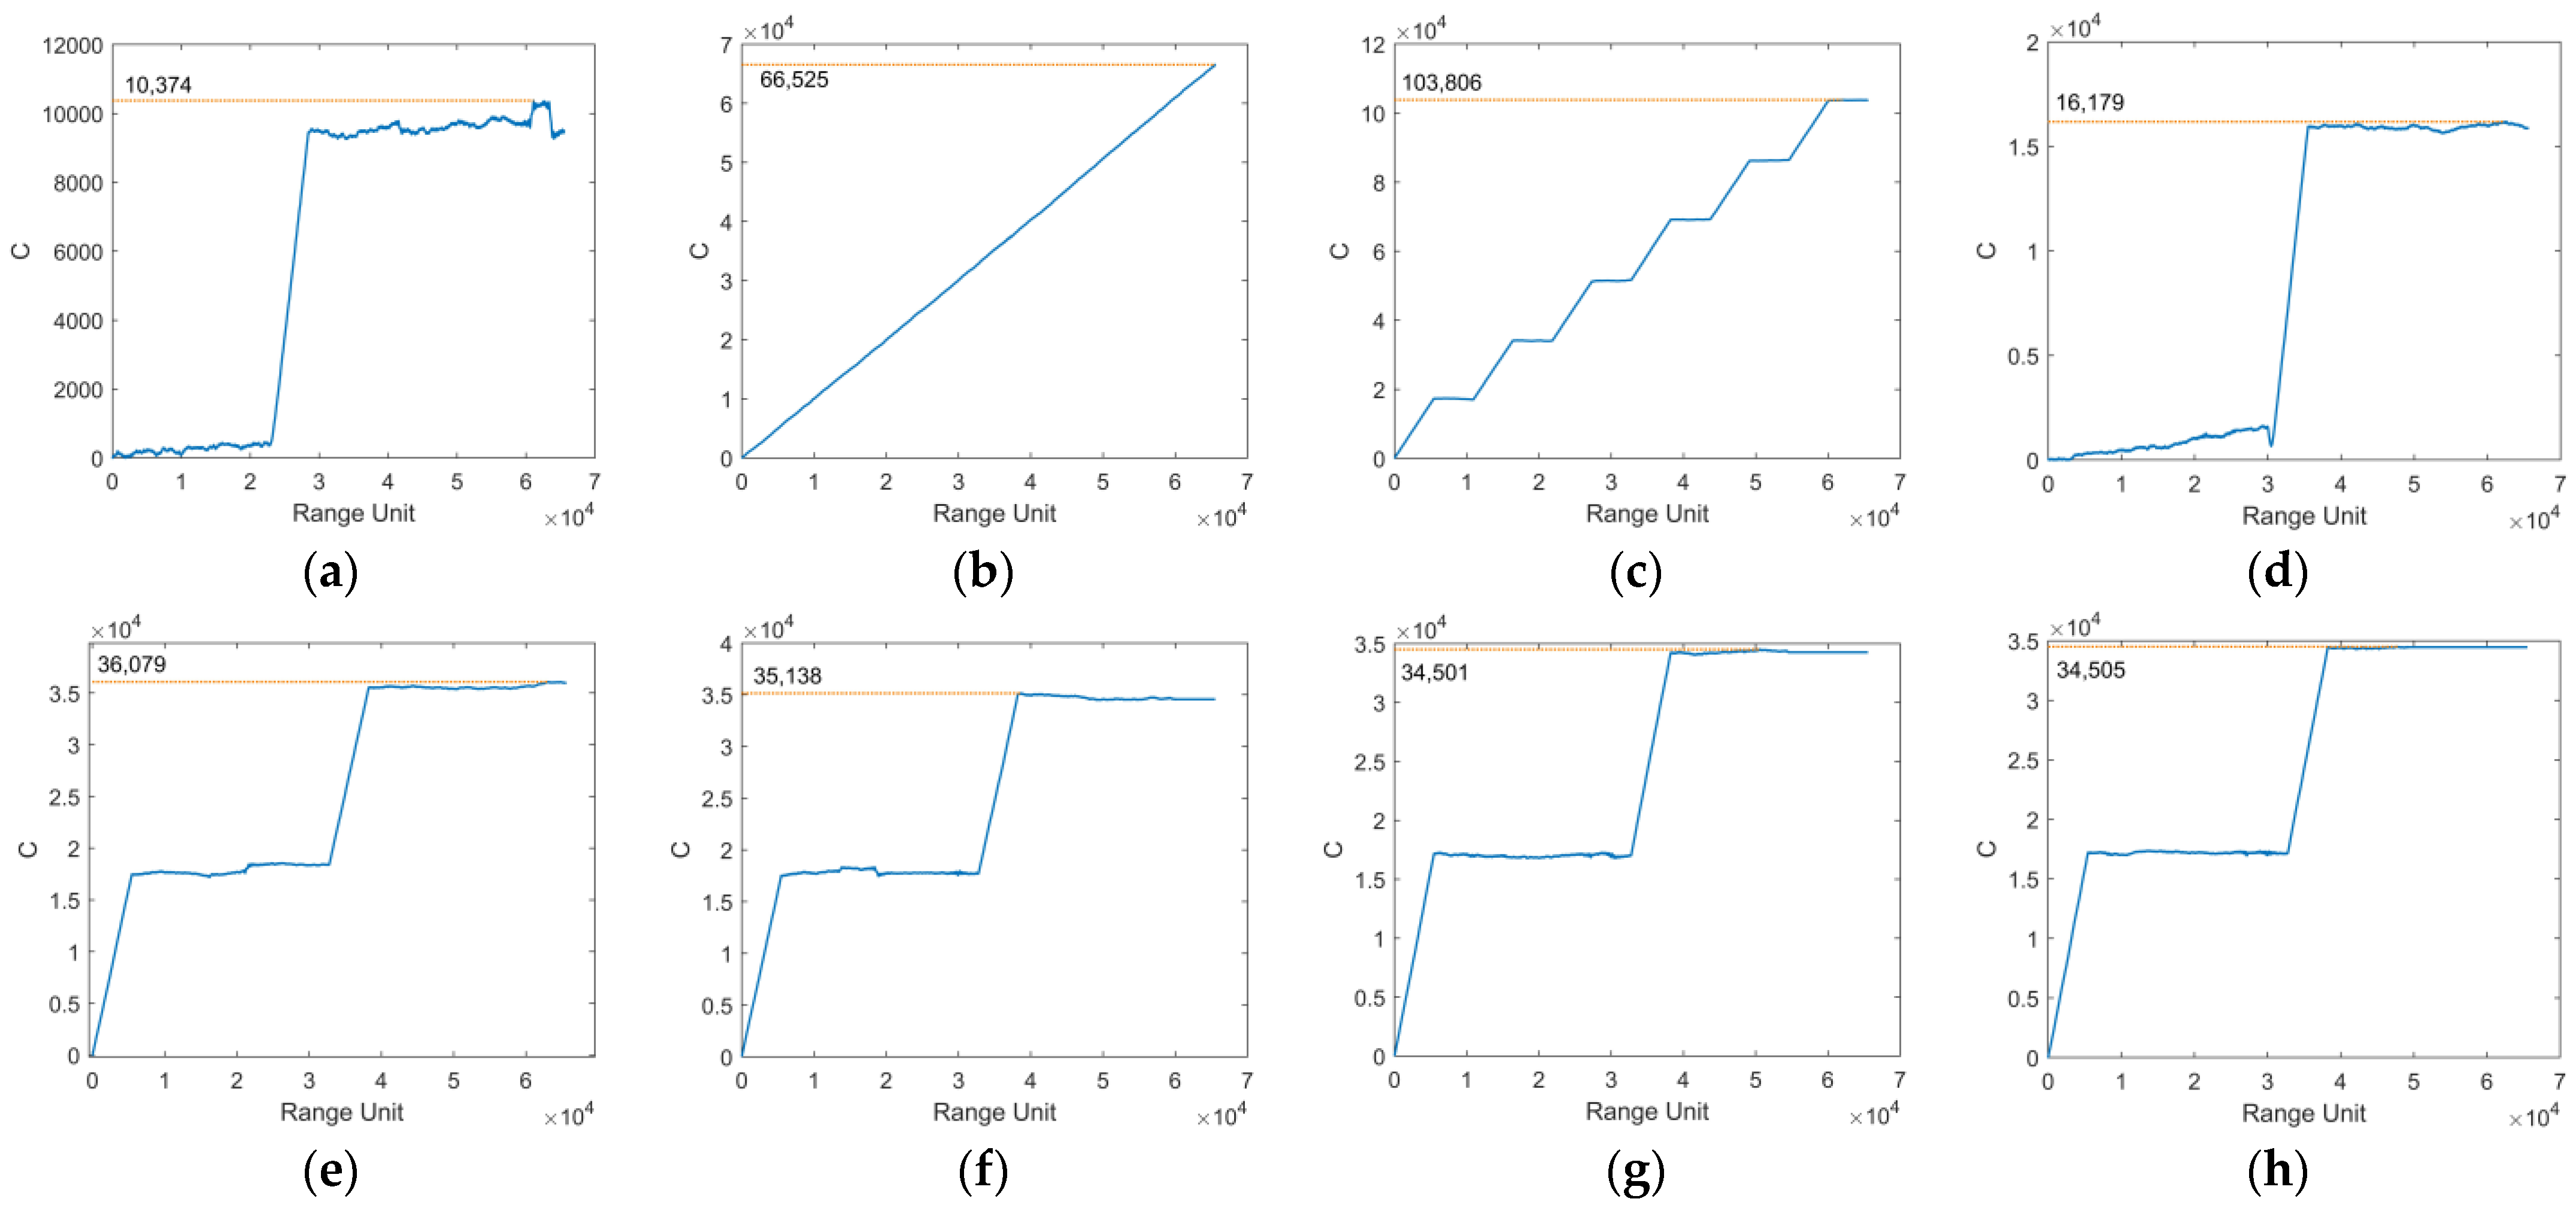
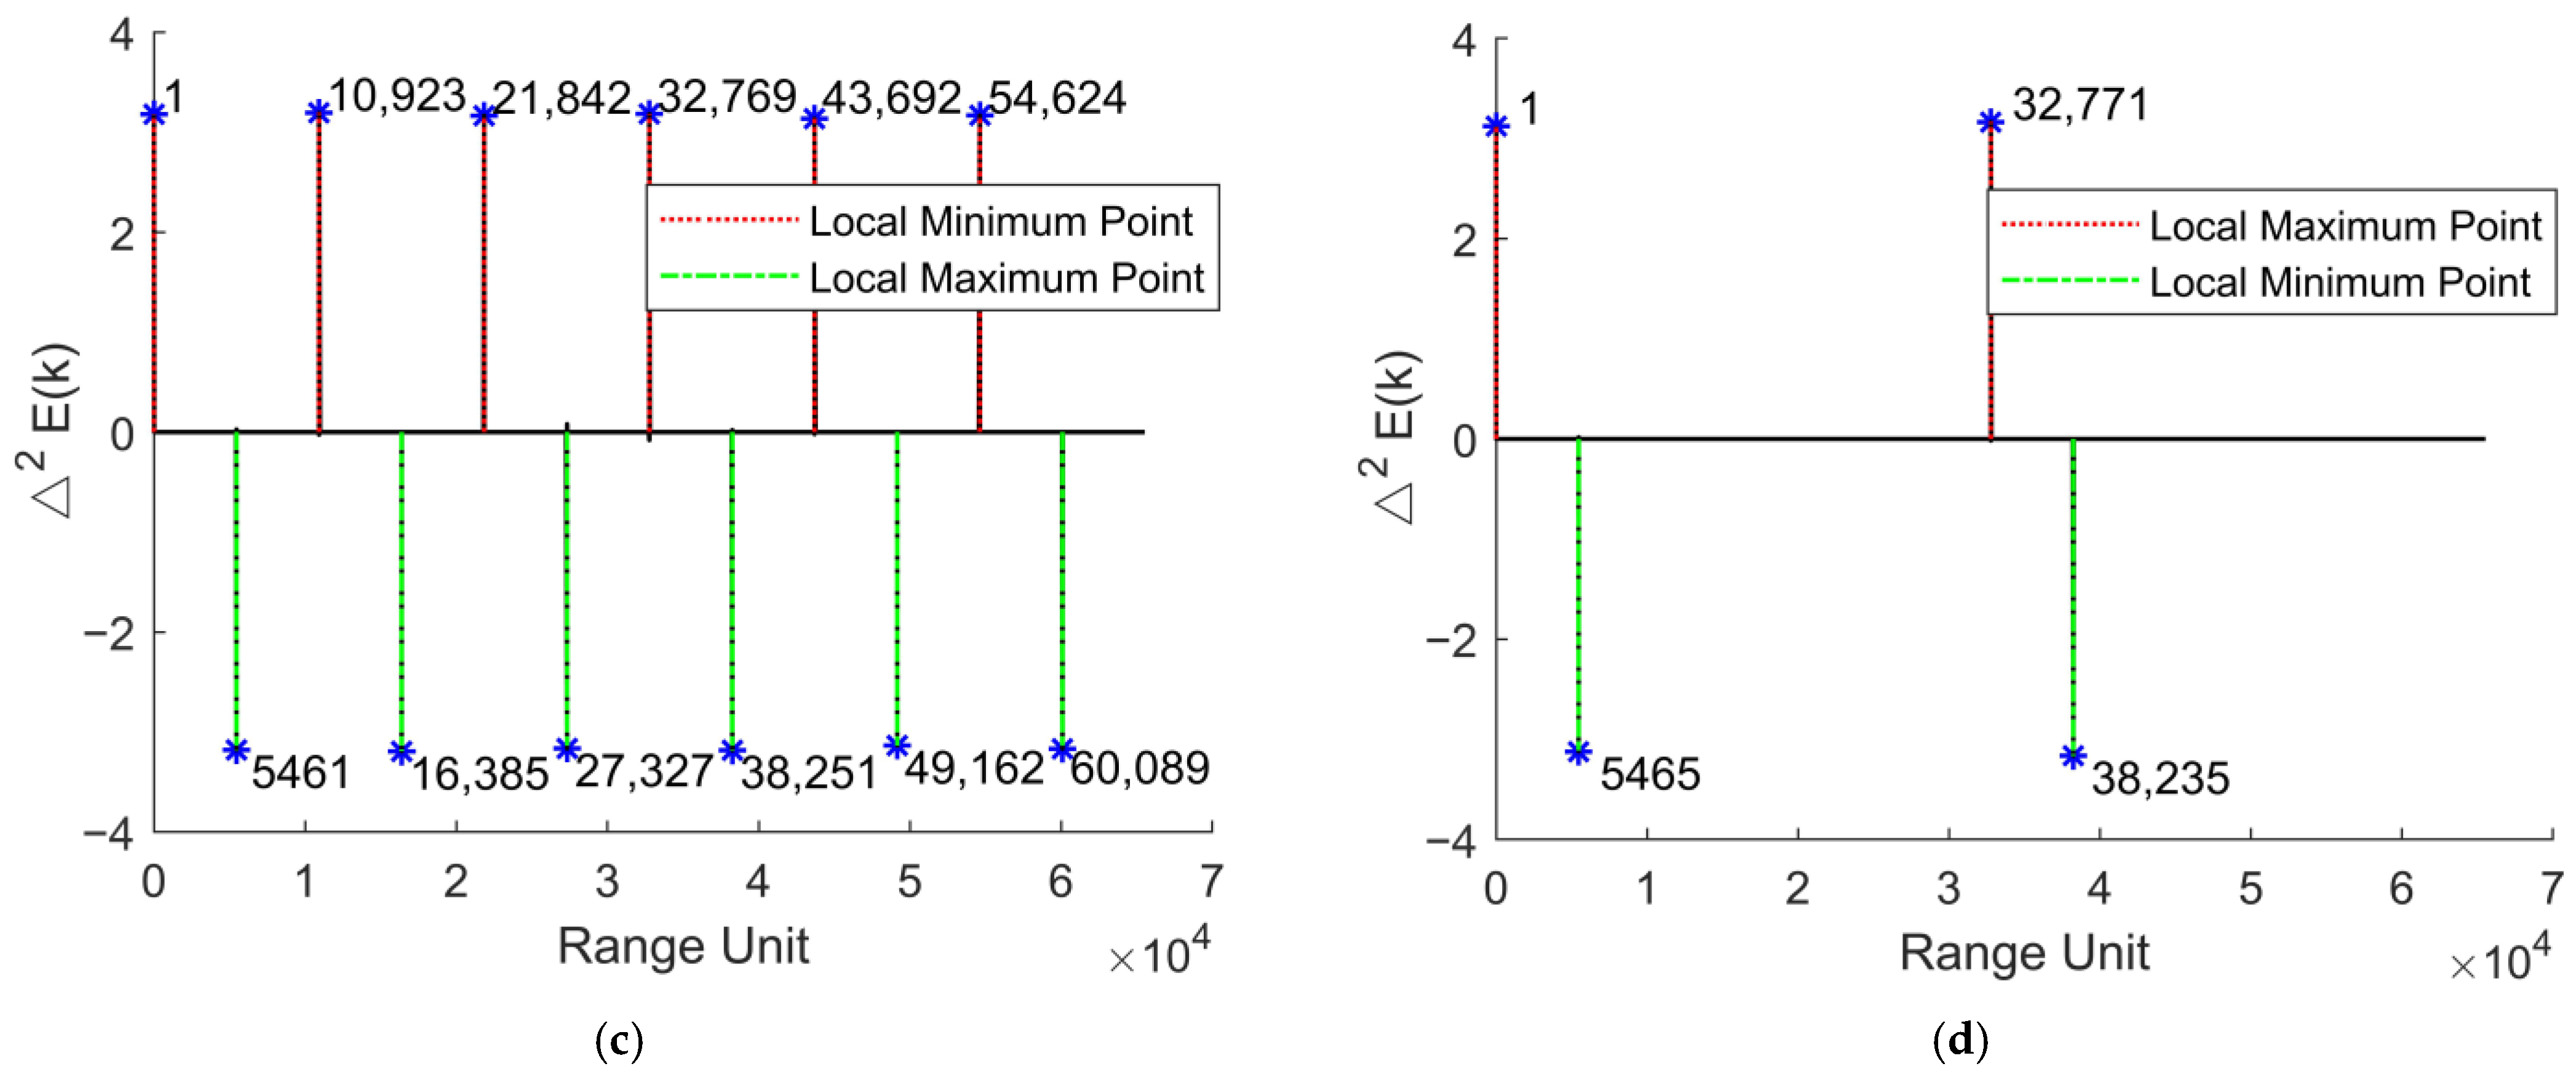
  • An interference-identification algorithm based on an instantaneous energy integral is proposed. The proposed interference identification algorithm is applied to special scenarios such as ‘sample 1 turn 1′ and ‘sample 1 turn N’, which belong to direct forwarding interference mode. Based on the energy discontinuity of the interference signal in the time domain, the discrete sequence of the target peak in the time domain is transformed into the intrinsic integration sequence (IIS). To quantify the discontinuous information of the interference signal contained in IIS, a new piecewise cumulative method is proposed. This method divides the IIS into several segments and measures the fluctuation of energy distribution between segments by generating a variance. For the IIS of the real target, the energy distribution is uniform; while for the IIS of the ISRJ signal, the energy is only contained in some segments, and the others only contain noise. Therefore, the variance of the true target peak is small, while the variance of the false target peak caused by the interference signal is large, and the true and false target peaks can be identified clearly according to the variance.
The remaining sections of this article are organized as follows. The second section introduces the mechanism of different intermittent-sampling repeater jamming mode, the third section introduces the intra-pulse orthogonal waveform proposed in this paper, the fourth section introduces the interference-recognition algorithm based on instantaneous energy integral, the fifth section uses simulation to verify the orthogonal waveform and interference recognition method proposed in this paper, and the sixth section draws a conclusion.
Notations: Throughout this article, scalar quantities are denoted with the italic typeface. Lowercase italic boldface quantities denote vectors and uppercase italic boldface quantities denote matrices. ⊗ denotes the convolution operator. |·| is the modulus operation of a vector. denotes complex conjugate. · and · denotes the rounded-down and rounded-up operator, respectively. mean · denotes the function of obtaining the mean value. sin c · denotes the function sin · / · .   rect · is the unit rectangular function.

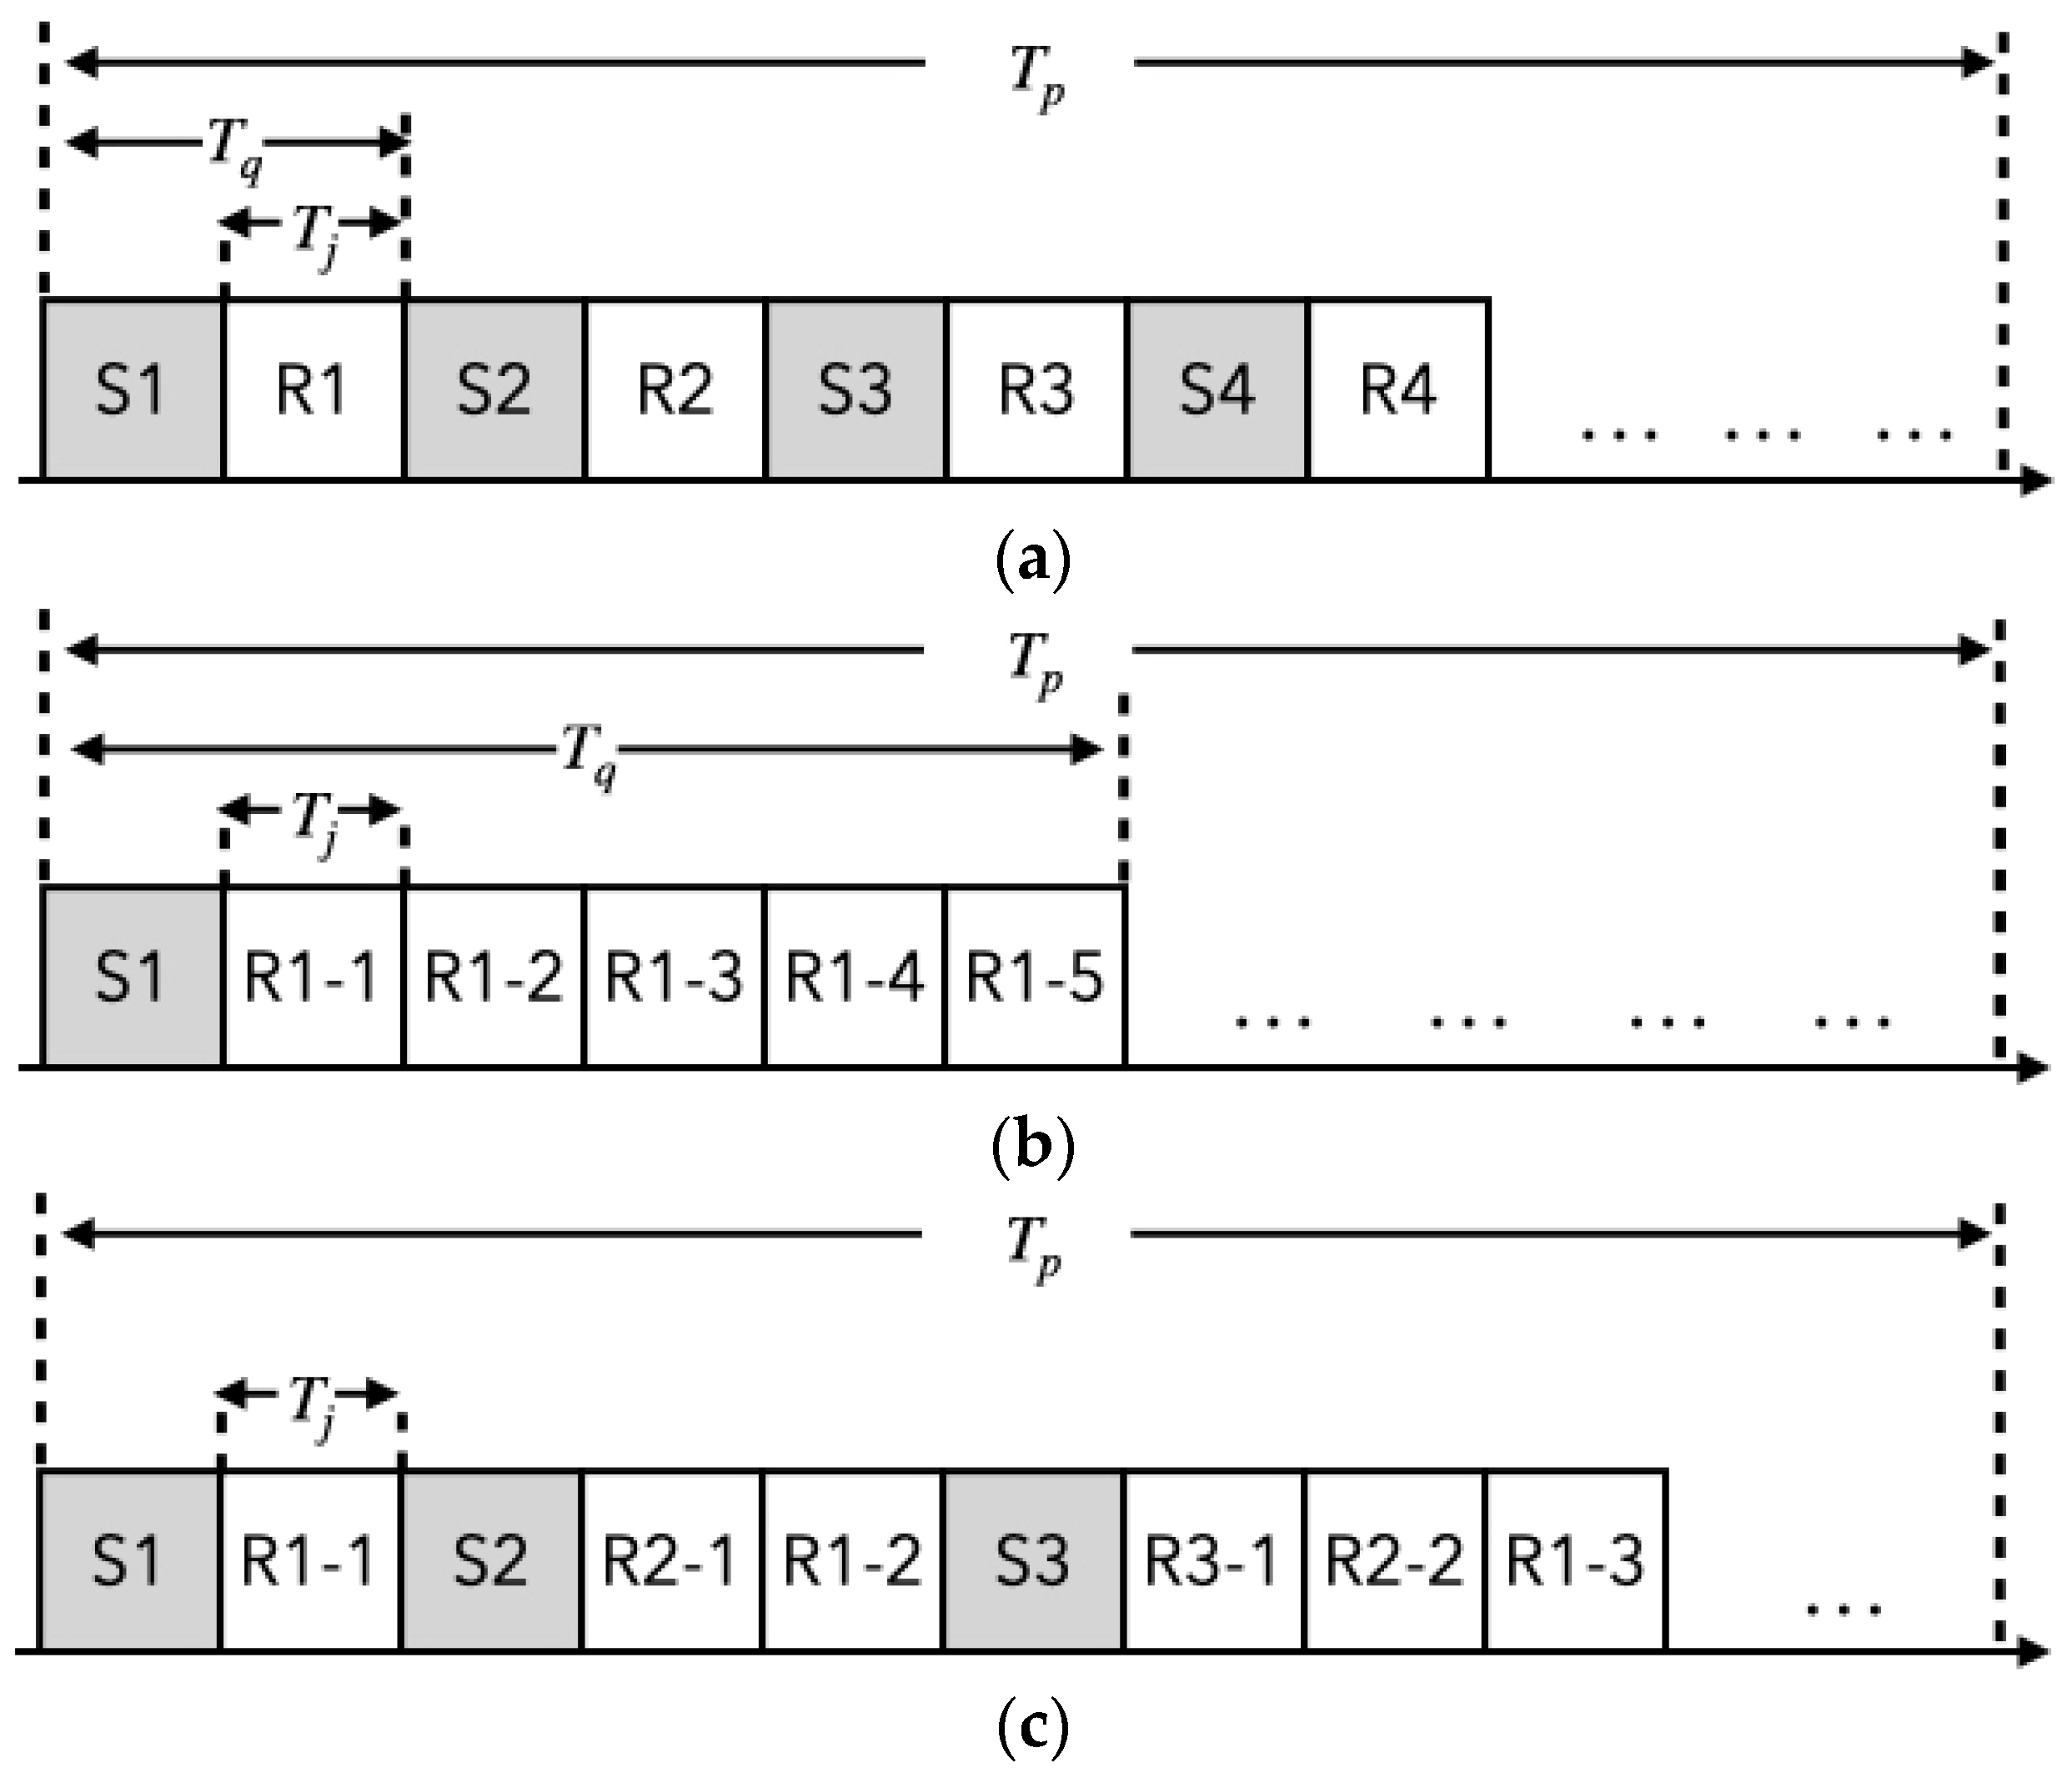
2. Mechanism of Different Interrupted-Sampling Repeater Jamming Modes

In general, there are three kinds of repeater jamming modes of jammers, which are the direct repeater jamming mode, the repeated repeater jamming mode, and the periodic repeater jamming mode, as shown in Figure 1. The first two of these jamming modes are especially common.
In Figure 1, S i represents the jammer’s sampling the radar signal, R i represents forwarding the collected and stored signal which is used to jam the radar receiver, and R i n represents the forwarding of R i for the n-th time. Assuming that the transmitting pulse signal intercepted by the jammer is s(t) and the sampling window is r(t), the direct repeater jamming signal of ISRJ can be expressed as
J d t = A j s t τ r t τ = A j s t τ q = 1 Q rect t τ q 1 T q T j
where A j represents the amplitude of the jamming signal, T j represents the pulse width of the interrupted-sampling signal, T q represents the pulse repetition period of the interrupted-sampling signal, T p represents the pulse width of the radar-transmitting signal, Q = T p T q represents the number of ISRJ forwarding times in the current pulse, and τ represents the sampling-repeating delay of the jammer, which is approximate to T j .
When the jammer works in the repeated repeater jamming mode, assuming K is the number of forwarding interference slices, the repeated repeater jamming signal of ISRJ can be expressed as:
J c t = k = 1 K J d t k 1 T j     = q = 1 Q k = 1 K A j s t τ k 1 T j ·       rect t τ k 1 T j q 1 T q T j
where K = T q T j 1 . When K = 1   (the signal piece is forwarded only once), the repeated repeater jamming mode is equivalent to the direct repeater jamming mode.
When the jammer works in periodic repeater jamming mode, the periodic repeater jamming signal of ISRJ can be expressed as:
J p t = q = 1 A k = 1 q A j s t τ k 1 T j · rect t τ k 1 T j q 1 T q T j
where A τ + A A + 1 T j / 2 < T p and A + 1 τ + A + 1 A + 2 T j / 2 > T p .
The ISRJ signal can be considered as some slices of the radar-transmitted signal, so it has partial coherence with the original signal, and the matched filtering result will also obtain the pulse compression gain, forming some false target peaks in the distance dimension. Taking the ISRJ direct repeater jamming mode as an example, the echo signal x t can be expressed as
x t = s t τ 0 + J d t τ 0 + n t
where n t is Gaussian white noise and τ 0 is the echo delay. The pulse compression results of x t can be expressed as [1]
x o u t t = χ t τ 0 , 0 + n = f q T j sin c π n f q T j χ t τ 0 , n f q + n t
where χ τ , ξ = u t u * t + τ e j 2 π ξ t dt is the ambiguity function of the signal u t ; and f q = 1 / T q is the sampling frequency of the jammer. Equation (5) shows that the pulse compression result of the ISRJ direct repeater jamming mode appears as a false target group. The amplitude of the false target group obeys the s i n c · function modulation.
It is not difficult to deduce that when the jammer works in the repeated repeater jamming mode, the pulse compression result of ISRJ is equivalent to the multiple time domain migration of the interference term in Equation (5), appearing as multiple false target groups in the distance dimension, and the interference characteristics in each group are the same as those in the direct-repeater jamming mode. When the jammer works in the periodic forwarding interference mode, since different slices have the same forwarding delay only when they are forwarded firstly (R1-1, R2-1, R3-1…), the delay is different when the second and later transferred slices are performed. Therefore, there is a false target group and multiple false targets in the pulse compression results. The interference characteristics of the false target group are similar to Equation (5), and multiple false targets are equivalent to the pulse compression results of the chirp signal with a pulse width T j .
In practical applications, although the ISRJ signal has a shorter duration than the real target echo, the jammer usually applies an amplitude modulation A j to the sampled signal, which sets the Jamming-To-Signal Ratio (JSR) to a value of tens of dB or higher to achieve the effect that the amplitude of false target peak in the distance dimension is similar to the real target peak. In addition, in scenarios such as self-defense jamming, the starting point of the jamming signal always lags behind the starting point of the real target echo. However, the jammer can still make a false target peak ahead of the real target peak by multiplying a linear phase sequence by the jamming signal. In this case, Equation (5) can be rewritten as follows:
x o u t t = χ t τ 0 , 0 + n = f q T j sin c π n f q T j χ t τ 0 , f j n f q
where f j is the jammer modulation frequency.
When radar-transmitting waveform is the chirp signal, the distance forward movement of the target group is [26]:
Δ R = c · f j 2 μ
where μ is the chirp signal frequency modulation slope and c is the speed of light.
Based on the above analysis, neither the amplitude nor the distance of the peak cannot be directly applied for reliable ISRJ interference identification.

3. Intra-Pulse Orthogonal Waveform

Resisting ISRJ with an intra-pulse orthogonal waveform is an effective method. Since the transmitted waveform is composed of several incoherent orthogonal waveforms, when the jammer only forwards a slice of a signal, the remaining incoherent signals are not affected by the interference, so the purpose of anti-interference is achieved.
The LFM-PC waveform proposed by [20] also has good orthogonal characteristics. However, because of the Doppler frequency sensitivity of the phased-coded waveform [27], the performance of the LFM-PC matched filtering will decrease rapidly when the target’s Doppler frequency beyond the range of B / P < ξ < B / P (where B is the bandwidth and P is the code length), losing the ability to detect high-speed moving targets. In addition, the computational complexity of the orthogonal phase optimization algorithm is proportional to the length of the encoding. So, in the signal system at a high sampling rate, the computation cost of the orthogonal phase optimization algorithm is high due to the large amount of sampling data.
The ambiguity function of the chirp signal is an oblique blade and is not sensitive to the change in Doppler frequency, and Up Chirp and Down Chirp [28] also have good quasi-orthogonality [29]. This paper therefore combines two consecutive Up Chirp and Down Chirp signals to form a new intra-pulse orthogonal waveform to resist ISRJ interference. In addition, in order to deal with the fact that the jammer simultaneously transmits multiple orthogonal sub-signals in a pulse repetition period such as “picks 1 turns 1” and “picks 1 turns N” (in this case, the intra-pulse orthogonal waveform cannot identify the false target formed by ISRJ), the corresponding interference identification method is proposed in Section 4 based on the energy characteristics of the intra-pulse orthogonal waveform.

3.1. Waveform Design

The chirp signal is a common radar waveform, and its time domain expression is [30]
s t = rect t T p e 2 π j f 0 t + π j μ t 2
Here, f 0 represents the central frequency of the signal, T p represents the pulse width of the signal, and μ represents the frequency modulation slope of the signal. When μ > 0 , it is Up Chirp; when μ < 0 , it is Down Chirp.
According to the optimal receiving principle, the impulse response of the matched filter is a chirp signal, and the slopes of instantaneous frequency are opposite to μ . For the chirp signal s t , its matched filter impulse response h t is
h t = s * t
So the impulse response of the matched filter corresponding to Down Chirp is Up Chirp, and vice versa.
In the transmitter, let Up Chirp be expressed as s 1 t and Down Chirp signal expressed as s 2 t :
s 1 t = rect t T p e 2 π j f 0 t + π j μ t 2
s 2 t = rect t T p e 2 π j f 0 t π j μ t 2
In the receiver, two matched filter channels are set in this paper, corresponding to h 1 t = s 2 t and h 2 t = s 1 t . When s 1 t passes through the filter h 1 t , the filter output after the center frequency removed is [31]
S match   t = s 1 t s 2 t   = T p sin π B 1 t T p t π B t rect t 2 T p   = χ t , 0
Equation (12) is consistent with the pulse compression results of general chirp signals, so the filter is a matched filter.
When s 1 t passes through h 2 t , the filter output is
S mismatch   t = s 1 t s 1 t = 1 T p B e j π μ t 2 C π 2 T p B t μ 2 + j S π 2 T p B t μ 2
C z = 0 z cos π v 2 2 d v
S z = 0 z sin π v 2 2 d v
C z and S z are Fresnel functions. According to the Fresnel integral formula C z + j S z 1 , the maximum amplitude of S m i s m a t c h   t is the complex-valued envelope of 1 / T p B e j π μ t 2 . So the filter is unmatched.
From the above analysis, it can be seen that when s 1 t and h 1 t convolute, the signal matches, and the pulse compression result has a sin c ( · ) envelope with energy concentration; when s 1 t and h 2 t convolute, the signal is mismatched, and the pulse compression result has a complex-valued envelope 1 / T p B e j π μ t 2 with energy dispersion. The degree of mismatching can be intuitively represented by the cross-correlation coefficient of s 1 t and s 2 t :
ρ = 1 T p B C π 2 T p B 2 + S π 2 T p B 2
Figure 2 shows the relationship between T p B and the cross-correlation coefficient of ρ . It can be seen from the figure that when T p B reaches 51, the cross-correlation coefficient is close to 0.1. As T p B increases, the cross-correlation coefficient becomes smaller and smaller; that is, the orthogonality becomes better. Therefore, the Up Chirp signal and the Down Chirp signal show quasi-orthogonality in the matched filter.
This paper therefore proposes an intra-pulse orthogonal waveform based on a segmented chirp signal to resist interrupted-sampling repeater interference. The expression is
s ow t =   rect 2 t T p e 2 π j f 0 t + π j μ t 2 δ t + T p 4 ,         T p 2 t 0 r e c t 2 t T p e 2 π j f 0 t π j μ t 2 δ t T p 4 ,         0 t T p 2
It can be seen from the expression that the orthogonal waveform consists of a set of continuous sub-signals, s 1 t (Up Chirp signal) and s 2 t (Down Chirp signal), and its time-frequency diagram and ambiguity function are shown in Figure 3.
It can be seen from Figure 3 that the ambiguity function of the proposed orthogonal waveform has two oblique blades, which are approximate to the ambiguity function accumulation of s 1 t and s 2 t . This means that the mismatch gain of the orthogonal signal is well suppressed.

3.2. Anti-Interference Principle of the Intra-Pulse Orthogonal Waveform

For the convenience of analysis, just one interference slice is taken as an example. Assuming that the transmitting waveform of transmitter is s o w t , the interference signal J t is a partial slice of s 1 t ,
J t = rect t τ w T j s 1 t
where τ w is the center offset to s 1 t .
When s 1 t passes through the filters h 1 t and h 2 ,   respectively , the output after the center frequency removed is
J match t = J t h 1 t = rect t τ w T j s 1 t s 1 * t T j T p S match t
J mismatch t = J t h 2 t = rect t τ w T j s 1 t s 1 * t S mismatch t
Denoting the target echo delay as τ 0 and the interference echo delay as τ j , the convolution results of the received signal and h 1 t + T p / 4 can be obtained as follows:
X 1 t = S match t τ 0 + S mismatch   t τ 0 T p 2 + J match t τ j S match t τ 0 + S mismatch   t τ 0 T p 2 + T j T p S match t τ j
It can be seen from Equation (21) that the first term is the matching part s 1 t and h 1 t , whose energy is concentrated at the distance unit τ 0 · F s ; the second term is the unmatching part s 2 t and h 1 t , whose energy is dispersed at the distance unit τ 0 + T p / 2 · F s ; the third term is the matching parts J t and h 1 t whose energy is concentrated at the distance unit τ j · F s .
Similarly, the convolution results of the received signal and h 2 t T p / 4 can be obtained as follows:
X 2 t = S mismatch   t τ 0 + T p 2 + S match   t τ 0 + J mismatch t τ j + T p 2 S mismatch   t τ 0 + T p 2 + S match   t τ 0 + S mismatch t τ j + T p 2
It can be seen from Equation (22) that the first term is the mismatching parts s 1 t and h 2 t , whose energy is dispersed at the distance unit τ 0 T p / 2 · F s ; the second term is the matched parts s 2 t and h 2 t , whose energy is concentrated at the distance unit τ 0 · F s ; and the third term is the mismatched parts J t and h 2 t , whose energy is dispersed at the distance unit τ j T p / 2 · F s .
The above analysis shows that when the ISRJ forwards a sub-signal slice of s 1 t or s 2 t , the target echo signal is compressed into sharp narrow pulses in both sub-signals’ matched filters, h 1 t and h 2 t . The ISRJ containing a sub-signal fragment will only be compressed in the corresponding sub-signal matched filter, and the energy will be dispersed after passing through the other filter due to mismatch. Therefore, the purpose of identifying ISRJ interference can be achieved by comparison.

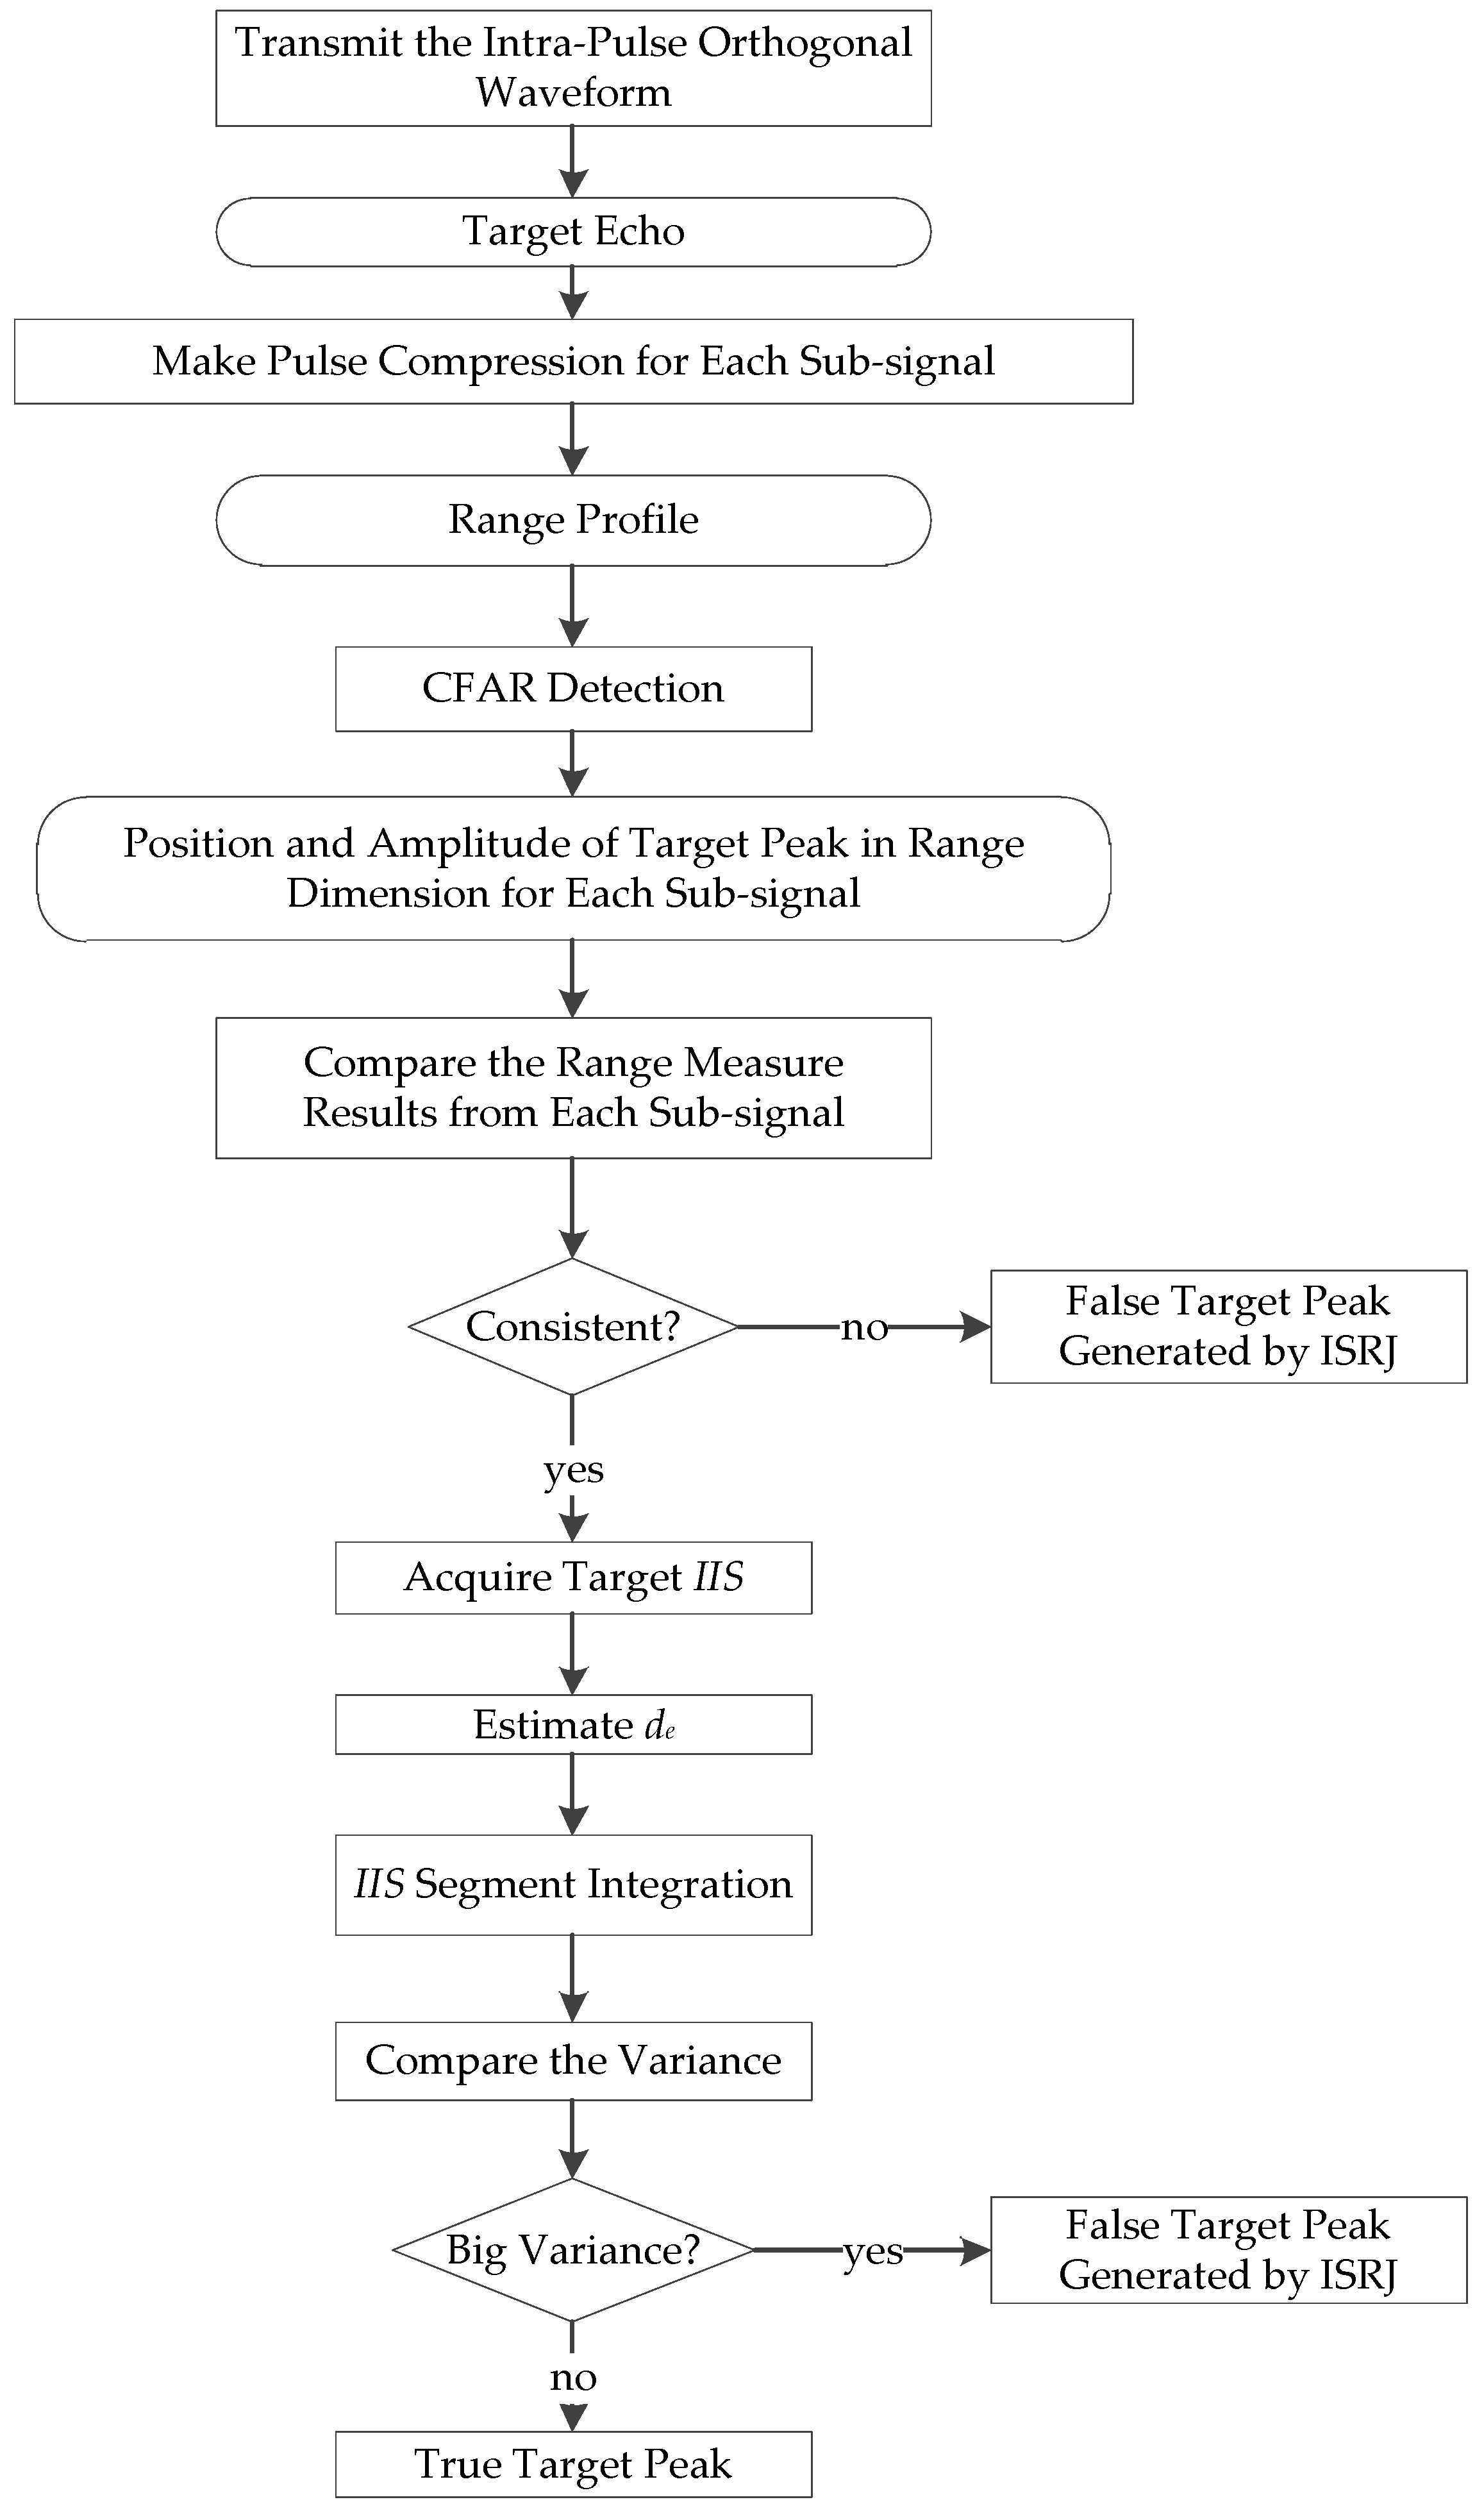
4. Interference Identification Algorithm based on Instantaneous Energy Integral

In Section 3, the case where the jammer only forwards one sub-signal’s partial slice is discussed. Although this interference is the most common in practical applications, there is still a case where the jammer forwards two sub-signal fragments at the same time. In this case, the convolution of the received signal and h 1 t + T p / 4 o r   h 2 t T p / 4 can be written in the similar form
X 1 t S match   t τ 0 + S mismatch   t τ 0 T p 2 + T j T p S match t τ j   + S mismatch t τ j T p 2
X 2 t S match   t τ 0 + S mismatch   t τ 0 + T p 2 + T j T p S match t τ j   + S mismatch t τ j + T p 2
It can be seen from Equations (23) and (24) that the true target peak and the false target peak both appear in the output results of the two filters h 1 and h 2 at distance unit τ 0 · F s and τ j · F s . This is inevitable in the direct repeater jamming mode “take 1 turn 1” and the repeated repeater jamming mode “take 1 turn N”. Additionally, when the jammer repeatedly forwards a fragment containing both the sub-signals s 1 t and s 2 t , a true target peak and a false target peak under the same distance unit are generated in the matched filter of h 1 t and h 2 t . Consequently, true and false targets cannot be directly distinguished by simply comparing the results of the sub-signal pulse compression. Therefore, further processing algorithms are still needed to identify the true target peak and false target peak.

4.1. Interference Feature Extraction

Based on the energy continuity of the signal, this paper proposes an interference-recognition algorithm based on the instantaneous energy integral.
Matched filtering can be regarded as a sliding correlation process between the received echo and the radar waveform. Each value of the distance dimension is obtained using the sum of a set of complex-valued sequences. This sequence is the conjugate multiplication of the filter template and the received echo. The mathematical expression of matched filtering can be written in the form of a sliding correlation:
R n = m = 1 M x n M / 2 + m s r e f * m
where x n represents the discrete received echo, s r e f n represents filter template,   R n represents the range profile of the echo signal, and M is the total sampling point of the filter template. It can be seen from Equation (25) that when the echo signal coincides with the sliding filter, the matching result can be regarded as an integral of the signal energy. To precisely depict the energy structure of the target peak, the intrinsic integral sequence (IIS) proposed by [32] is adopted here, which can be expressed as
I I S m = x n p M / 2 + m s r e f * m , m = 1 , 2 , , M
where n p is the peak position of the echo signal by conventional constant false alarm rate (CFAR) detection.
According to Equation (26), the absolute value of the sum of the IIS is equal to the amplitude of the corresponding target peak after pulse compression in the distance profile; that is, the energy component of the corresponding signal is contained in the IIS. At the same time, the IIS of the false target peak also contains the discontinuity of the interference signal energy. To illustrate the energy distribution of the signal in IIS, the IIS is converted into a peak amplitude accumulation curve expressed as
C k = i = 1 k I I S i , k = 1 , 2 , , M
For the real target peak, C k rises continuously throughout the pulse width duration; for false target peaks, it rises intermittently because the duration of signal matching is short or discontinuous.

4.2. Interference Feature Identification

The above proves that the IIS of the target peak contains the energy distribution information of the corresponding signal component. However, it is not easy to distinguish I I S m or C k directly. On this basis, a feature parameter is extracted from the IIS for further interference identification. Due to the difference of I I S m between the interference signal and the real target echo, this paper designs a segmented accumulation method. The proposed segmented accumulation method divides I I S m into H segments on average and calculates the sum of each segment separately. The sum of each segment contains part of the signal energy. Then, it is converted into the percentage in H segments which represents the energy distribution of the corresponding signal segment. For the real target echo peak, the average energy distribution in each segment is uniform, with a value of 1 H × 100 % . On the contrary, for the false target peak generated by the interference signal, its energy is distributed in some segments, and the energy percentage in each segment fluctuates greatly. The variance of each peak percentage is calculated as the eigenvalue of the interference signal classification.
In general, H can be set to an integer below 10. Under conditions with larger Tp, it can also be a larger integer. In the process of segmentation, on the one hand, the energy difference between the interference signal and the noise signal is retained; on the other hand, the intra-segment energy fluctuation caused by noise is suppressed.
This method provides valuable eigenvalues for the identification of interference signals. However, it may fail because the inappropriate segmentation width will lead to a smaller variance of the false target peak.
For interference signals in interference modes such as “pick 1 turn 1” and “pick 1 turn N”, the width of each interference signal slice is usually the same. When using the piecewise accumulation method, if the segment width is equal to the pulse width of the interrupted-sampling signal, only several segments contain the interference signal energy, and the remaining segments contain only noise. At this time, the percentage in each segment fluctuates greatly, and a large variance will be obtained. If the segment width is equal to the pulse-repetition period of the jammer, the I I S m fluctuation within each segment is similar, and the energy of all segments is approximately equal. Therefore, the variance of percentage is small, which may lead to misjudgment of the false target peak.
To ensure that the proposed method is still effective in the above scenarios, it is necessary to estimate the width of the interference signal. Since I I S m and C k contains the energy distribution information of signal components, the width parameter of the interference signal can be estimated from IIS. In C k , the energy of the interference signal part continues to increase, and the energy of the non-interference part remains flat. Therefore, the width of the interference slice can be estimated by estimating the inflection point coordinates of the curve. Considering the influence of noise and other signals, the actual curve of C k is jittery. The coordinates of the inflection point cannot be estimated by directly using the second-order difference of the pair. Therefore, we can obtain the fitted piecewise straight line by finite linear fitting and then obtain the coordinates of the minimum and maximum points using second-order difference. The distance between a set of adjacent minimum and maximum points is the estimated width of the interference slice.
Let the function f p , s , e k represent the linear fitting of a set of ordered number pairs k , C k , s k e by the least-square method with p lines, e r r p , s , e = k = s e C k f p , s , e k 2 represent the sum of squared errors of the fitted line.
Suppose the expected number of fitted lines is P . The value of f P , 1 , M k can be acquired by recursion. The process is as follows:
1.
Initialization. Obtain the values of f 1 , s , e k , e r r 1 , s , e with conventional linear fitting methods. ( 1 s < e M )
2.
Recursion. Obtain the values of f p , s , e k , e r r p , s , e with the values of f 1 , s , e k , e r r 1 , s , e and f p 1 , s , e k , e r r p 1 , s , e . ( 1 s < e M , 1 < p M )
2.1
Divide C k into two groups, s , C k , s + 1 , C k + 1 , , l , C l and l + 1 , C l + 1 , , e , C e , where s < l < e ;
2.2
Obtain the values of e r r 1 , s , l and e r r p 1 , l + 1 , e , and calculate the total error E l = e r r 1 , s , l + e r r p 1 , l + 1 , M ;
2.3
Calculate the optimal fitting error e r r p , s , e = min E l , and aquire the optimal segment point l o = arg min E l ;
2.4
Calculate the values of f p , s , e k . When s k l o ,   f p , s , e k = f 1 , s , l o k and when l o k e ,   f p , s , e k = f p 1 , l o , e k .
3.
Termination. Output the values of f p , 1 , M k and e r r p , 1 , M when p = P .
In the absence of prior information, such as the number of interference slice forwarding, it is impossible to set the number of fitting lines P in advance. Then, a feasible method is to give a threshold value β . If the decrease in the square sum of two consecutive errors is lower than this threshold, the fitting calculation is stopped. For example, if e r r P 3 , 1 , M e r r P 2 , 1 , M / e r r P 3 , 1 , M > β , e P 2 , 1 , M e P 1 , 1 , M / e r r P 2 , 1 , M < β and e r r P 1 , 1 , M e r r P , 1 , M / e r r P 1 , 1 , M < β the number of fitted lines is P .
Through the above method, C k ’s fitted piecewise straight line E k = f P , 1 , M k can be obtained. Through the second-order difference, the coordinates k i of the singular points can be obtained:
Δ 2 E k i 0
Among all k i , denote the m-th minimum point coordinates as k min , m , and the n-th maximum point coordinates as k max , n , then the estimated interference slice width is
d e = mean k min m k max n + 1 ,   k max n < k min m < k max n + 1
The above segment width estimation method is proposed to ensure large variance of the ISRJ interference signal. It may be noted that for false target peaks that contain only one interference signal slice, the segment width estimation method based on IIS is not required. Considering the tradeoff between the interference signal estimation effect and the low computational cost, the overall scheme of anti-ISRJ interference method based on waveform design is shown in Figure 4. The whole process is divided into two parts. The first round of interference signal recognition is just through orthogonal waveforms and the segmented width estimation method is only implemented in the second round. For most false target peaks containing only one sub-signal slice, the first round of classification is sufficient. For the false target peaks caused by ISRJ in special cases such as direct forwarding interference mode, the second round of interference recognition may be required.

5. Experiments

In this section, the designed orthogonal waveform and interference identification method are verified using numerical experiments because when the jammer works in the periodic repeater jamming mode, the characteristics of the false target peak formed in the distance dimension are the same as the false target peak in the direct repeater jamming mode and the repeated repeater jamming mode, so the experiment designed in this paper only includes the direct repeater jamming and the repeated repeater jamming. The parameters of the radar and of the jammers are shown in Table 1. The experiments adopt typical transmitted waveform parameters for narrowband target detection radar and the SNR and JNR is set to ensure nearly 100% detection probability for both real target echoes and interference signals. To better simulate the real scenes, frequency shift parameters are set for some jammers.

5.1. Anti-Interference Experiments of the Proposed Waveforms

In this section, 4 sets of interference signal ( I S R J 1 4 ) were added to the echo waves as shown in Figure 5a,b. Gaussian white noise with a signal-to-noise ratio of −15 dB was added to the received echo. The width of all interference slices was set to P w / 12 273 μs. The JSR of I S R J 2 was set to 10 dB, and the JSR of the others was set to 5 dB. Additionally, a frequency shift modulation of 3.5 MHz was applied to I S R J 1 . The matched filters of two orthogonal signals, h 1 and h 2 , were used to perform matched filtering, and the results are shown in Figure 5c,d.
For a more intuitive representation, the abscissa of the target peak is marked in Figure 5c,d, respectively. It can be found from Figure 5c,d that the target peak is generated on the same range unit (65,537) through the matched filters h 1 and h 2 . From the above analysis, it can be concluded that the signal corresponding to the target peak coordinate is the echo signal of the real target. In Figure 5c, the false target peaks caused by I S R J 1 , I S R J 2 , and I S R J 3 appear in the matched filter h 1 , but no peaks are found at the same coordinates in the matched filter h 2 ; in Figure 5d, the false target peak caused by I S R J 4 appears in the matched filter h 2 , but no peaks are found at the same coordinates in the matched filter h 1 , which proves the effectiveness of the orthogonal signal proposed in Section 2. Then, by comparing the peak coordinates in Figure 5c,d, the interference signal I S R J 1 4 can be directly recognized.

5.2. Anti-Interference Experiments of the Interference-Identification Algorithm

As described in Section 4, when the ISRJ interference slice has the same time delay relative to the sub-signal, the false peaks after pulse compression of different matched filters will appear at the same distance unit so that the true target peak and the false target peak cannot be directly distinguished.
In this section, 4 sets of interference signals ( I S R J 1 , I S R J 5 , I S R J 6 , I S R J 7 ) were added to the echo waves as shown in Figure 6a,b. A frequency shift modulation of 3.5 MHz was applied to I S R J 1 . I S R J 5 is a series of interference slices in the direct repeater jamming mode; I S R J 6 is an interference slice containing both sub-signals s 1 and s 2 ; and I S R J 7.1 7.4 is a series of interference slices generated by “pick 1 turn 4” repeated repeater mode. In these three cases, false target peaks cannot be directly distinguished by the orthogonal matched filtering. Figure 6c,d show the range profiles of the echo signal in the matched filters h 1 and h 2 . The results indicate that the designed orthogonal waveform can effectively identify the I S R J 1 generated false target (peak 1), but the real echo signals, I S R J 5 , I S R J 6 , and I S R J 7 , have the same range profile through matched filters h 1 and h 2 . The target peaks (peak 2, peak 3, peak 4, peak 5, peak 6, peak 7, and peak 8) result in the inability to directly obtain the exact position of the real target, which also verifies the viewpoint described in Section 4.
In this case, the piecewise cumulative method described in Section 4 was used to analyze the energy characteristics of the remaining target peaks. In addition, to verify the universality of the proposed algorithm, peak 1 is selected as an example to analyze the energy characteristics of the false target peaks only forwards only one sub-signal piece. In Figure 6c, eight peaks (including real targets and false interference targets) are generated after matched filtering. Then, we use the method designed in Section 4 to analyze the energy characteristics of the peaks. The IIS of each target peak is divided into H = 12 segments, calculate the percentage histogram corresponding to the 8 peaks, as shown in Figure 7, and obtain the corresponding IIS amplitude variation curve as shown in Figure 8. It can be seen in Figure 7 and Figure 8 that the position of the high percentage segment is consistent with the position of the section with rapidly increasing energy. The percentage histogram of peak 2 is significantly different from that of the other peaks, and the percentage of 12 segments is about 8.33%. This means that the energy of peak 2 is evenly distributed across the 12 segments. On the contrary, the energy of the other target peaks is concentrated in some segments. The energy fluctuation is analyzed by calculating the standard deviation of the peak percentage histogram. The standard deviations of the segmented energy integrals of the eight peaks are 17.68, 0.21, 8.46, 17.15,17.92, 17.68, 17.96, and 18.04. Simple analysis shows that the standard deviation of peak 2 is less than 0.3, while the standard deviations of peak 1, peak 3, peak 4, peak 5, peak 6, peak 7, and peak 8 are all greater than 8. Therefore, according to the difference in the standard deviation, peak 2 represents the real target echo, and the other target peaks are false targets caused by ISRJ.
The above experiments were carried out with the prior information that H = 12 , which means that the length of the IIS segment is exactly equal to the length of the interference slice. But in practice, it is difficult to directly obtain the length of the interference slice, which will cause the failure of the interference signal recognition in some interference modes. For example, in the direct repeater jamming mode, when the segment length H = 6 , meaning that each segment contains exactly one interference slice and one blank segment, and the energy accumulation of the IIS in each segment is the same, as shown in Figure 9a,b. The histogram of the false target is similar to the real target, and the standard deviations of peak 2 and peak 3 are 0.37 and 0.31, respectively. Therefore, the true and false targets cannot be directly distinguished. Additionally, in the repeated repeater jamming mode, when the segment length is long ( H = 2 ), the energy accumulation of IIS in each segment is the same, as shown in Figure 9c,d. The histogram of the false target is similar to the real target, and the standard deviations of peak 2 and peak 5 are 0.1 and 0.06, respectively. Therefore, in the absence of prior interference slice length information, it is necessary to make an estimation in advance.
To solve this problem, the fitted piecewise straight line of the IIS amplitude variation curve is obtained using the method described in Section 4, as shown in Figure 10a,b. The second-order difference curve can be obtained with second-order difference, as shown in Figure 10c,d. According to the position of the adjacent local minimum and maximum coordinates in the difference curve, the width of the interference slice can be estimated (237.5 μs), which is almost the same as the simulation setting condition, and the segment length is H = M / d e = 12 , which is consistent with the parameters set in the previous simulation conditions. Therefore, the method proposed in Section 4 is effective.

5.3. Robustness Analysis of the Proposed Orthogonal Waveform to Noise Interference

The core of the intra-pulse orthogonal waveform proposed in this paper is to distinguish the real target from the ISRJ interference target using the orthogonal sub-signal pulse compression results. Consequently, a certain SNR gain of pulse compression will inevitably be lost. To study and analyze the robustness of the proposed orthogonal waveform against noise interference, 1000-time Monte Carlo simulation was performed on the pulse compression results of the orthogonal waveform under each SNR in Gaussian white noise from −43 dB to −14 dB. Under the condition of a false alarm rate of 1 × 10 6 , the CFAR detection results are shown in Figure 11.
The red curve is the pulse compression detection result of the complete signal and the blue curve is the pulse compression detection result of the sub-signal s 1 . From the detection probability dotted line at 0.5, it can be seen that the SNR loss of the sub-signal detection is approximately 2.8 dB. Considering the SNR gain of the chirp signal pulse compression is 10 lg T p B dB; when the pulse width of the chirp signal is reduced to half of the original signal, the gain loss is 3 dB, which is similar to the simulation results. It can be further deduced that if the number of orthogonal sub-signals in the pulse is further increased to m , any different m 1 sub-signals can be used as a group of signals, and the remaining signals can be matched as another group of signals. It is easy to deduce that the detection SNR loss of sub-signals is 10 lg 1 + 1 m 1 dB. It can be seen that increasing the number of orthogonal sub-signals is an effective method to reduce the detection of SNR loss without considering other factors.
In addition, with the method proposed in this paper, after the first round of filtering realized by the intra-pulse orthogonal waveform, the second round of filtering is also needed by the energy continuity identification algorithm proposed in this paper to distinguish the ISRJ’s false targets, which are difficult to distinguish directly in the first round, such as direct repeater jamming. Here, the IIS variance feature of the target peak is the only feature that distinguishes between true and false targets, and the result is also affected by noise. Therefore, the influence of noise should be studied on the proposed recognition algorithm. We observe the change in the IIS standard deviation of the eight target peaks in Figure 6b and calculate their standard deviations using Monte Carlo simulation under different SNRs. Through the numerical analysis of these standard deviations, the IIS variance threshold boundary that distinguishes real targets from false targets can be obtained.
To ensure the accuracy and effectiveness of the experiment, the experiment needed to be carried out under the condition of 100% detection probability. The SNR of the simulation experiment was set to 1000 Monte Carlo simulations under each SNR from −20 dB to 0 dB, and the variation of the IIS standard deviation for each target is shown in Figure 12.
It can be found from the graphic results that with the increase in SNR, the average standard deviation of the real target IIS gradually decreases, while the average standard deviation of the false target gradually increases. The maximum standard deviation of the true target is always less than 2, while the minimum standard deviation of the false target is always greater than 8. Therefore, the threshold boundary can be reasonably set to distinguish the true and false targets. For example, the threshold can be set to 4 as shown in Figure 12. Therefore, the ISRJ detection problem can be established by the following binary hypothesis testing problem:
{ H 0 : y = R e a l _ T a r g e t H 1 : y = I S R J  
ISRJ can be detected by threshold, which is formulated as:
C k H 1 H 0 T h r e s h o l d

6. Conclusions

The work studied the problem of false target recognition in intermittent-sampling repeater jamming scenarios. An intra-pulse orthogonal waveform based on a segmented chirp signal and an interference recognition method based on energy continuity are proposed. The orthogonal waveform is composed of a continuous Up Chirp signal and a Down Chirp signal. Based on their orthogonal characteristics, the interference identification is carried out by comparing the echo of the sub-signal in the distance dimension after matched filtering. For some interference that cannot be directly identified, such as direct forwarding interference, the identification method based on energy continuity proposed in this paper completes subsequent identification by analyzing the energy distribution of the signal. Numerical experiments under typical interference parameters and different SNR conditions verify that the proposed waveform and the recognition method have fine recognition performance.
It is worth noting that the interference identification method described in this paper is based on the partial coherence characteristics of the echo signal and the reference signal. Therefore, the proposed method is not only applicable to LFM waveforms but also to other waveforms with good auto-correlation characteristics such as phase-coded signals for targets with zero Doppler velocity. Therefore, the proposed method has a certain universality. In addition, the intra-pulse orthogonal waveform and interference recognition method designed in this paper can realize true and false target recognition in all repeater jamming modes without any prior information such as jammer parameters. The process is simple, and the effect is remarkable. It has high application value in practical engineering applications. The algorithm proposed in this paper is mainly aimed at ISRJ interference. In this interference mode, the interference signal is a partial slice of the pulse signal transmitted by radar. When a complete pulse is sampled and transmitted by a broadband repeater, this method will not distinguish between a real target and a false jamming target.

Author Contributions

Conceptualization, H.D. and Y.Z.; methodology, H.D., Y.Z. and Z.W.; software, H.S. and Q.B.; data curation, H.S. and J.P.; writing—original draft preparation, H.D. and Y.Z.; writing—review and editing, H.S., Z.W., Q.B. and J.P.; resources, Q.B., H.D. and Y.Z. are the co-first authors with equal contributions in this research. All authors have read and agreed to the published version of the manuscript.

Funding

This research was funded by the National Natural Science Foundation of China (No. 62201594).

Data Availability Statement

All data in this paper is generated by simulation and the parameters have been described clearly in Section 5.

Acknowledgments

Thanks for the engineers Zejia Tang, Shui Li of NUDT-ATR laboratory for helping finishing the tests.

Conflicts of Interest

The authors declare no conflict of interest.

References

  1. Wang, X.; Liu, J.; Zhang, W.; Fu, Q.; Liu, Z.; Xie, X. Mathematic principles of interrupted-sampling repeater jamming (ISRJ). Sci. China Ser. F Inf. Sci. 2007, 50, 113–123. [Google Scholar] [CrossRef]
  2. Xiao, J.; Wei, X.; Sun, J. Research on Interrupted Sampling Repeater Jamming Performance Based on Joint Frequency Shift/Phase Modulation. Sensors 2023, 23, 2812. [Google Scholar] [CrossRef] [PubMed]
  3. Li, J.; Duan, X.; Li, J.; Bai, P. Interrupted-Sampling and Non-Uniform Periodic Repeater Jamming against m DT-STAP System. Electronics 2022, 12, 152. [Google Scholar] [CrossRef]
  4. Gong, S.; Wei, X.; Li, X.; Ling, Y. Mathematic principle of active jamming against wideband LFM radar. J. Syst. Eng. Electron. 2015, 26, 50–60. [Google Scholar] [CrossRef]
  5. Yang, Y.; Wang, B.; Zou, P. Jamming Performance Analysis of Interrupted Sampling Repeater Jamming to Phase Coded Radar. Shipboard Electron. Countermeas. 2021, 44, 45–49. [Google Scholar]
  6. Zhang, J.; Dai, D.; Xing, S.; Wang, X.; Xiao, S. Analysis of jamming effect on intermittent sampling repeater jamming to CRPJ-SAR. Syst. Eng. Electron. 2015, 37, 1030–1034. [Google Scholar]
  7. Yang, Y.; Wang, B.; Zeng, R. Analysis of the Performance of Intermittent Sampling Repeater Jamming to LFM Radar. Shipboard Electron. Countermeas. 2021, 44, 28–34. [Google Scholar]
  8. Hua, X.; Peng, L.; Liu, W.; Cheng, Y.; Wang, H.; Sun, H.; Wang, Z. LDA-MIG detectors for maritime targets in nonhomogeneous sea clutter. IEEE Trans. Geosci. Remote Sens. 2023, 61, 1–15. [Google Scholar] [CrossRef]
  9. Jiang, Y.; He, M.; Yu, C. Method of interrupted-sampling repeater jamming recognition based on box dimension. Mod. Def. Technol. 2016, 44, 157–164. [Google Scholar]
  10. Jiang, Y.; He, M.H.; Liu, H.B.; Yu, C.L. Recognition of interrupted-sampling repeater jamming based on resemblance coefficient. Mod. Radar 2016, 38, 72–76. [Google Scholar]
  11. Jiang, Y.; He, M.H.; Yu, C.; Wang, B.Q. A novel method of interrupted-sampling repeater jamming recognition based on correlation dimension. Fire Control. Command. Control. 2016, 41, 152–156. [Google Scholar]
  12. Gong, S.; Wei, X.; Li, X. ECCM scheme against interrupted sampling repeater jammer based on time-frequency analysis. J. Syst. Eng. Electron. 2014, 25, 996–1003. [Google Scholar] [CrossRef]
  13. Xiong, W.; Zhang, G.; Liu, W. Efficient filter design against interrupted sampling repeater jamming for wideband radar. EURASIP J. Adv. Signal Process. 2017, 2017, 9. [Google Scholar] [CrossRef] [Green Version]
  14. Yuan, H.; Wang, C.Y.; Li, X.; An, L. A method against interrupted-sampling repeater jamming based on energy function detection and band-pass filtering. Int. J. Antennas Propag. 2017, 2017, 6759169. [Google Scholar] [CrossRef] [Green Version]
  15. Chen, J.; Wu, W.; Xu, S.; Chen, Z.; Zou, J. Band pass filter design against interrupted-sampling repeater jamming based on time-frequency analysis. IET Radar Sonar Navig. 2019, 13, 1646–1654. [Google Scholar] [CrossRef]
  16. Chen, J.; Xu, S.; Zou, J.; Chen, Z. Interrupted-sampling repeater jamming suppression based on stacked bidirectional gated recurrent unit network and infinite training. IEEE Access 2019, 7, 107428–107437. [Google Scholar] [CrossRef]
  17. Li, F.; Li, G.; Nian, P. Radar signal deception jamming suppressing based on blind source separation. Journal of Naval Aeronautical and Astronautical University. J. Nav. Aeronaut. Astronaut. Univ. 2015, 30, 424–428. [Google Scholar]
  18. Zhou, C.; Liu, Q.H.; Zeng, T. Research on DRFM repeater jamming recognition. J. Signal Process. 2017, 33, 911–917. [Google Scholar]
  19. Zhou, C.; Tang, Z.; Zhu, Z.; Zhang, Y. Anti-interrupted sampling repeater jamming waveform design method. J. Electron. Inf. Technol. 2018, 40, 8. [Google Scholar]
  20. Xi, R.; Ma, D.; Liu, X.; Wang, L.; Liu, Y. Intra-Pulse Frequency Coding Design for a High-Resolution Radar against Smart Noise Jamming. Remote Sens. 2022, 14, 5149. [Google Scholar] [CrossRef]
  21. Xu, Z.; Xue, S.; Wang, Y. Incoherent interference detection and mitigation for millimeter-wave FMCW radars. Remote Sens. 2022, 14, 4817. [Google Scholar] [CrossRef]
  22. Zhou, C.; Tang, Z.; Dai, Y.; Li, X. Anti-intermittent sampling repeater jamming method based on intrapulse orthogonality. Syst. Eng. Electron. 2017, 39, 8. [Google Scholar]
  23. Wang, F.; Chen, P.; Yin, J.; Li, N.; Li, Y.; Wang, X. Joint design of doppler-tolerant complementary sequences and receiving filters against interrupted sampling repeater jamming. J. Radars 2022, 11, 11. [Google Scholar]
  24. Zhou, K.; Li, D.; Su, Y.; He, F.; Liu, T. Joint transmitted waveform and mismatched filter design against interrupted-sampling repeater jamming. J. Electron. Inf. Technol. 2021, 43, 8. [Google Scholar]
  25. Zhou, C.; Liu, Q.; Hu, C. Time-frequency analysis techniques for recognition and suppression of interrupted sampling repeater jamming. J. Radars 2019, 8, 100–106. [Google Scholar]
  26. Liu, J.; Liu, Z.; Wang, X.; Xiao, S.; Wang, G. Research on forward interference based on group delay. Prog. Nat. Sci. 2007, 17, 7. [Google Scholar]
  27. Jiang, Y. Study of Orthogonal Wave form Based on Phase-Coding Method. Master’s Thesis, University of Electronics Science and Technology of China, Chengdu, China, 2015. [Google Scholar]
  28. Gabor, D. Theory of communications. J. Inst. Electr. Eng. 1946, 93, 429–457. [Google Scholar] [CrossRef]
  29. Huang, S.; Lin, Z.; Yang, X.; Jiang, X.; Huang, Z. A binary orthogonal chirp signal modulation method with delay offset. Comput. Eng. 2017, 34, 6. [Google Scholar]
  30. Zhao, Y.; Chen, Z.; Zhang, Y.; Chen, J.; Yang, J.; Xiong, Y. Hybrid integration method for highly maneuvering radar target detection based on a Markov motion model. Chin. J. Aeronaut. 2020, 33, 1717. [Google Scholar] [CrossRef]
  31. Luong, D.; Young, A.; Balaji, B.; Rajan, S. Classifying Linear Frequency Modulated Radar Signals Using Matched Filters. In Proceedings of the 2022 IEEE Canadian Conference on Electrical and Computer Engineering (CCECE), Halifax, NS, Canada, 18–20 September 2022. [Google Scholar]
  32. Wu, W.; Zou, J.; Chen, J.; Xu, S.; Chen, Z. False-target recognition against interrupted-sampling repeater jamming based on integration decomposition. IEEE Trans. Aerosp. Electron. Syst. 2021, 57, 2979–2991. [Google Scholar] [CrossRef]
Figure 1. Three kinds of repeater jamming modes of jammers. (a) The direct repeater jamming mode, (b) the repeated repeater jamming mode, and (c) the periodic repeater jamming mode.
Remotesensing 15 03673 g001
Figure 2. The curve of the cross-correlation coefficient versus T p B .
Remotesensing 15 03673 g002
Figure 3. The intra-pulse orthogonal waveform. (a) The time–frequency diagram and (b) the ambiguity function.
Remotesensing 15 03673 g003
Figure 4. The overall scheme of an anti-ISRJ interference method based on waveform design.
Remotesensing 15 03673 g004
Figure 5. The processing results of echo waveforms with interference under direct repeater jamming mode. (a) The time–frequency diagram (noise free); (b) the time–frequency diagram (SNR = −15 dB); (c) the echo of the sub-signal 1 after matched filtering; (d) the echo of the sub-signal 2 after matched filtering.
Remotesensing 15 03673 g005aRemotesensing 15 03673 g005b
Figure 6. The processing results of echo waveforms with interference under direct repeater jamming mode and repeated repeater jamming mode. (a) The time–frequency diagram (noise-free); (b) the time–frequency diagram (SNR = −15 dB); (c) the echo of the sub-signal 1 after matched filtering; (d) the echo of the sub-signal 2 after matched filtering.
Remotesensing 15 03673 g006
Figure 7. The proportion of the energy accumulation of IIS in each segment when H = 12 (the yellow dotted line denotes the average proportion). (a) Peak 1, (b) Peak 2, (c) Peak 3, (d) Peak 4, (e) Peak 5, (f) Peak 6, (g) Peak 7, and (h) Peak 8.
Remotesensing 15 03673 g007
Figure 8. The IIS amplitude accumulation curve C k for each target peak. (a) Peak 1, (b) Peak 2, (c) Peak 3, (d) Peak 4, (e) Peak 5, (f) Peak 6, (g) Peak 7, and (h) Peak 8.
Remotesensing 15 03673 g008
Figure 9. The proportion of the energy accumulation of IIS in each segment (the yellow dotted line denotes the average proportion). (a) H = 6 , peak 2, (b) H = 6 , peak 3, (c) H = 2 , peak 2, (d) H = 2 , peak 5.
Remotesensing 15 03673 g009
Figure 10. The fitted piecewise straight line E k and the second-order difference curve Δ 2 E k . (a) The fitted piecewise straight line E k for peak 3; (b) the fitted piecewise straight line E k for peak 5; (c) the second-order difference curve Δ 2 E k for peak 3; (d) the second-order difference curve Δ 2 E k for peak 5.
Remotesensing 15 03673 g010aRemotesensing 15 03673 g010b
Figure 11. The curves of detection probability versus SNR.
Remotesensing 15 03673 g011
Figure 12. The IIS standard deviation of the segmented energy integrals in 1000 Monte Carlo simulations when H = 12. (a) Maximum value; (b) minimum value; (c) average value.
Remotesensing 15 03673 g012
Table 1. The parameters of the radar and the jammers.
ParameterValue
Pulse width of the transmitted waveform
(twice the sub-signal pulse width)
3.28 ms
Bandwidth of the transmitted waveform5 MHz
Center frequency of the transmitted waveform1.2 GHz
SNR−15 dB
Time duration of signal receiving6.56 ms
Complex sampling rate20 MHz
Pulse width of the interference signal273 μs
JSR5 dB, 10 dB
Frequency shift of the interference slices
(partial interference signal)
3.5 MHz
Disclaimer/Publisher’s Note: The statements, opinions and data contained in all publications are solely those of the individual author(s) and contributor(s) and not of MDPI and/or the editor(s). MDPI and/or the editor(s) disclaim responsibility for any injury to people or property resulting from any ideas, methods, instructions or products referred to in the content.

