Article

Assimilating AMSU-A Radiance Observations with an Ensemble Four-Dimensional Variational (En4DVar) Hybrid Data Assimilation System

1
State Key Laboratory of Numerical Modelling for Atmospheric Sciences and Geophysical Fluid Dynamics, Institute of Atmospheric Physics, Chinese Academy of Sciences, Beijing 100029, China
2
Department of Earth System Science, Tsinghua University, Beijing 100084, China
3
Southern Marine Science and Engineering Guangdong Laboratory, Zhuhai 519082, China
4
College of Ocean, University of Chinese Academy of Sciences, Qingdao 266400, China
5
CMA Earth System Modeling and Prediction Centre, China Meteorological Administration, Beijing 100081, China
6
State Key Laboratory of Severe Weather, China Meteorological Administration, Beijing 100081, China
*
Author to whom correspondence should be addressed.
Remote Sens. 2023, 15(14), 3476; https://doi.org/10.3390/rs15143476
Submission received: 30 May 2023 / Revised: 2 July 2023 / Accepted: 3 July 2023 / Published: 10 July 2023

Abstract

:
Many ensemble-based data assimilation (DA) methods use observation space localization to mitigate the sampling errors due to the insufficient ensemble members. Observation space localization is simpler and more timesaving than model space localization in implementation, but more difficult to directly assimilate satellite radiance observations, a kind of non-local observations. The vertical locations of radiance observations are undetermined and the transmission of observational information is thereby obstructed. To determine the vertical coordinates of radiance observations, a weighted average hypsometry is proposed. Using this hypsometry, AMSU-A radiance observations are directly assimilated with an ensemble four-dimensional variational (En4DVar) DA system. It consists of a four-dimensional ensemble-variational (4DEnVar) system providing ensemble covariance and a 4DVar system. Observing system simulation experiments show that the hypsometry alleviates the degradations in the late period of medium-range forecast in the Northern Extratropics that occur in the traditional peak-based hypsometry. It obviously improves the analysis qualities and forecast skills of the En4DVar system and its two components, especially in the Southern Extratropics, when incorporating AMSU-A radiance observations. The improvement in the En4DVar-initialized forecast is comparable to that in the 4DVar-initialized forecast in the Southern Extratropics and Tropics. It indicates that a proper hypsometry enables efficient extraction of useful information from AMSU-A radiance observations by 4DEnVar with observation space localization. Therefore, the 4DEnVar provides high-quality ensemble covariances for En4DVar.

1. Introduction

The ensemble four-dimensional variational (En4DVar) hybrid data assimilation (DA) approach incorporates the advantage of flow-dependent characteristic of ensemble Kalman filter (EnKF) into the 4DVar DA approach. It has become popular in major operational centers of the world and shown great potential for further improving numerical weather prediction (NWP) skills [1,2,3,4,5]. The En4DVar approach typically uses flow-dependent information extracted from the ensemble forecasts to help estimate the background error covariance (BEC) for 4DVar. When applying this approach to global NWPs, the ensemble size is much smaller than the dimensionality of the state variables of the prediction model due to the limitations of computational resource. The limited ensemble size may easily result in spurious correlations between two grids that are far apart in the BEC matrix (B-matrix). Localization techniques [6,7,8,9,10] can effectively mitigate such spurious correlations and thus improve the analysis quality and forecast skill.
The main idea of localization is to restrict the analysis at a specific grid point to be influenced only by observations within its surrounding local region. Houtekamer and Mitchell [6] performed observation selection by setting a cutoff radius, thus excluding the influence of observations outside the cutoff radius on the analysis at the specific grid point. Houtekamer et al. [11] further proposed a localization scheme using a compactly supported GC function [12] that decreases monotonically with distance, which is realized as a Schür product between the ensemble B-matrix and the localization correlation matrix. Localization can be achieved by assimilating observations one by one to update the analyses within the local region, or implicitly by simultaneously assimilating all observations within the local region around the analysis at a specific grid point [13]. However, for ensemble-based non-sequential DA approaches, using the localized covariance directly in model space can easily lead to large computational costs if one wants to solve directly in the global space. Implementing localization in observation space may be a more economical choice. Approaches that use orthogonal functions (e.g., empirical orthogonal function and sine function) to decompose the localization correlation matrix can also further reduce the localization cost in observation space [8,10,14,15,16,17].
The elements of the localization correlation matrix in observation space are dependent on the observation coordinates, which are easy to be calculated for conventional observations with well-defined positions. Following the development of satellite technology, the rapidly increasing radiance observations have significantly improved the medium-range forecasts and have greatly reduced the gap of forecast skills between the northern and southern hemispheres [18]. It is noted that radiance observations are non-local due to the sampling of multiple atmospheric layers, and different satellite channels are sensitive to different atmospheric layers. Therefore, defining the vertical coordinates of radiance observations is an unavoidable challenge in the use of observation space localization. Houtekamer et al. [11] used the pressure at the peak of the weighting function to define the vertical coordinates of radiance observations from the Advanced Microwave Sounding Unit-A (AMSU-A) instruments in the EnKF system. Fertig et al. [19] selected radiance observations within the local region to be assimilated into the LETKF system if a weight above the cutoff value is signed to any model state in the local region. This cutoff-based selection method is significantly different from the abovementioned peak-based selection method of Houtekamer et al. [11] when the cutoff value is small and the weighting function is broad. In addition, it allows a wider range of influence for non-local observations than for local observations. Miyoshi et al. [20] used the normalized weighting functions of satellite channels to provide weights for error covariance localization in the LETKF system.
Based on these studies, the EnKF class approaches have significantly benefited from assimilating radiance observations. In particular, the effective assimilation of AMSU-A radiance observations in the DA system plays important role in improving forecast skills. The 4DVar and En4DVar approaches usually use model space localization method for radiance observations and their DA schemes are globally solved. In contrast, the EnKF class approaches generally adopt the observation space localization method that uses vertical coordinates defined by the pressure at peak weight to achieve the effective assimilation of radiance observations and is solved in local regions. Moreover, Campbell et al. [21] pointed out that when the number of satellite channels is large enough and the observation error is very small, the observation space localization is difficult to recover the true state. Thus, investigating the differences between the effects of model space and observation space localization techniques on the assimilation and forecast performances when incorporating radiance observations is beneficial for efficiently using radiance observations in ensemble-based data assimilations.
The purpose of this study is to use the weighted average pressure to define the vertical coordinates of AMSU-A radiance observations in the En4DVar system so as to investigate the contributions of these observations to the improvements of analysis quality and forecast skill. In Section 2, a brief description of the DA methods used in this study, including En4DVar and its 4DVar and 4DEnVar components, the observation space localization scheme and the vertical positioning method for radiance observations, are presented. Section 2 also displays the DA configurations, experimental details and observations, followed by the analysis and forecast results in Section 3. Finally, the conclusions and discussions are provided in the last section.

2. Materials and Methods

2.1. A Brief Description of DA Methods

The 4DVar system used here is based on the incremental 4DVar scheme [22], which obtains the optimal analysis of atmospheric state on a low-resolution grid by combining forecast and observation information. It adopts a highly parameterized climatological B-matrix: B c = U U T [4,23], and relies on the adjoint model (ADM) in the minimization process of solving the optimal analysis.
The ensemble covariance for the En4DVar system is provided by the 4DEnVar system [24]. The 4DEnVar system is established using the dimension-reduced projection four-dimensional variational (DRP-4DVar) method [25]. This method uses the ensemble samples to project the minimization problem of 4DVar in the original model space onto the reduced-dimensional subspace, and to avoid using the ADM in the minimization process.
The En4DVar system used in this study consists of two components including the abovementioned 4DVar and 4DEnVar systems [26]. It uses a hybrid BEC ( B = γ c B c + γ e B e ) achieved through the extended control variable approach [27]. Here, B e is the ensemble covariance produced by the 4DEnVar component and B c is the climatological covariance in the 4DVar component. The variables γ c and γ e represent the scalar weights of the climatological and ensemble covariances, respectively. Unlike other variants of 4DEnVar, the hybrid BEC used here consists of a three-dimensional (3D) climatological covariance from 4DVar and a 4D ensemble covariance from 4DEnVar. In addition, calculating the gradient of cost function in the ensemble component does not contain the ADM but uses the same statistical relationship as in the 4DEnVar system. More details about the En4DVar system can be found in Zhu et al. [26].

2.2. Localization

2.2.1. Observation Space Localization

In the En4DVar system, the localization for the climatological covariance is contained in its square root U , while the localization for the ensemble covariance is the same as in the 4DEnVar system. The traditional localization scheme based on the Schür product between the high-dimensionality ensemble B-matrix B e = p x p x T and the high-dimensionality correlation matrix C may lead to large computational costs. Approximately decomposing the correlation matrix [8,10] and ignoring the time-variation of localization, the localization can be economically achieved in observation space by the Schür products between a finite number of observational perturbation samples and localization leading eigenvectors:
E p x = p x , 1 ρ x , 1 , , p x , 1 ρ x , L , , p x , N ρ x , 1 , , p x , N ρ x , L E p y = p y , 1 ρ y , 1 , , p y , 1 ρ y , L , , p y , N ρ y , 1 , , p y , N ρ y , L .
Here, p x i = 1,2 , , N and ρ x , j j = 1,2 , , L denote the initial perturbation samples and the leading eigenvectors in model space, and p y i = 1,2 , , N and ρ y , j j = 1,2 , , L denote the corresponding observational perturbation samples and leading eigenvectors. To further reduce the cost, the leading eigenvectors are selected based on the cumulative contribution of variance, and each leading eigenvector has three components in zonal, meridional and vertical directions, respectively. The empirical orthogonal function [8] and the sine function [10] are used for the zonal and vertical components, and the meridional component, respectively. Thus, the ensemble component of the En4DVar system is solved in the subspace consisting of the extended perturbation samples that are generated by the abovementioned Schür products. For more details refer to Zhu et al. [24].
For local observations, the approximation in the extended perturbation samples introduces little error. In contrast, it is more complicated for non-local observations, such as radiance observations, which does not have explicit vertical coordinates. In order to implement the vertical localization, we need to properly define the vertical coordinates of radiance observations.

2.2.2. Vertical Positioning of AMSU-A Radiance Observation

As mentioned earlier, each radiance observation depends on the atmospheric states at multiple vertical layers. Therefore, its vertical coordinate cannot be given explicitly as conventional observations. The weighting function of the radiance observation at a specific horizontal position reflects the contribution of the observation to the atmospheric state at different vertical layer [20]. The weighting function is typically calculated by the vertical difference of the transmittance of the satellite channel, which is dependent not only on the satellite channel but also on the atmospheric profile. In this study, we proposed the weighted average hypsometry to define the vertical coordinates of AMSU-A radiance observations:
P j p r , l c h = k = 1 K w j p r , l c h , k × p j p r , k k = 1 K w j p r , l c h , k .
Here, the subscripts j p r , l c h and k denote the atmospheric profile, the satellite channel and the atmospheric vertical layer; K is the number of atmospheric vertical layers; P denotes the vertical coordinate of radiance; w and p represent the weight of the satellite channel and the pressure of the atmospheric profile.
In practice, when the radiance observations are assimilated, the Radiative Transfer for TOVS (RTTOV) model calculates the transmittance for each satellite channel. Therefore, the transmittance can be obtained directly from the RTTOV model for the calculation of weighting functions.

2.3. DA Configurations, Experimental Details and Observations

2.3.1. DA Configurations

The model used here is the operational global forecast system of China Meteorological Administration (CMA-GFS), whose original name was the Global/Regional Assimilation and Prediction System (GRAPES-GFS) [28]. The DA systems used in this study include the 4DVar system [23], and the recently developed 4DEnVar system and En4DVar system [24,26].
A dual-resolution framework with 1.0° for the inner loop and 0.5° for the outer loop, and 87 vertical layers are adopted by all DA systems. In the first assimilation window, the 4DEnVar system utilizes random perturbation samples with balanced constraints generated using the “randomcv” method [29]. This method can generate reasonable initial condition (IC) samples with balanced constraints by using the variational variable transform. Then, the 4DEnVar system updates the flow-dependent perturbation samples every 6 h in subsequent assimilation windows by assimilating perturbed observations. An extended-ensemble-sample-based localization method mentioned in Section 2.2.1 is applied in the 4DEnVar system. To alleviate the filter divergence problem, inflation, observation perturbation and SST perturbation approaches are applied [24].
The En4DVar system constructs the hybrid BEC by incorporating the ensemble covariance estimated by 60 ensemble members from the 4DEnVar system into the climatological BEC of the 4DVar system. The scalar weights of the climatological and ensemble covariances for the hybrid BEC in the En4DVar system are 0.25 and 0.8. Moreover, the ensemble covariance of the En4DVar system utilizes the same localization scheme as in the 4DEnVar system.

2.3.2. Experimental Details
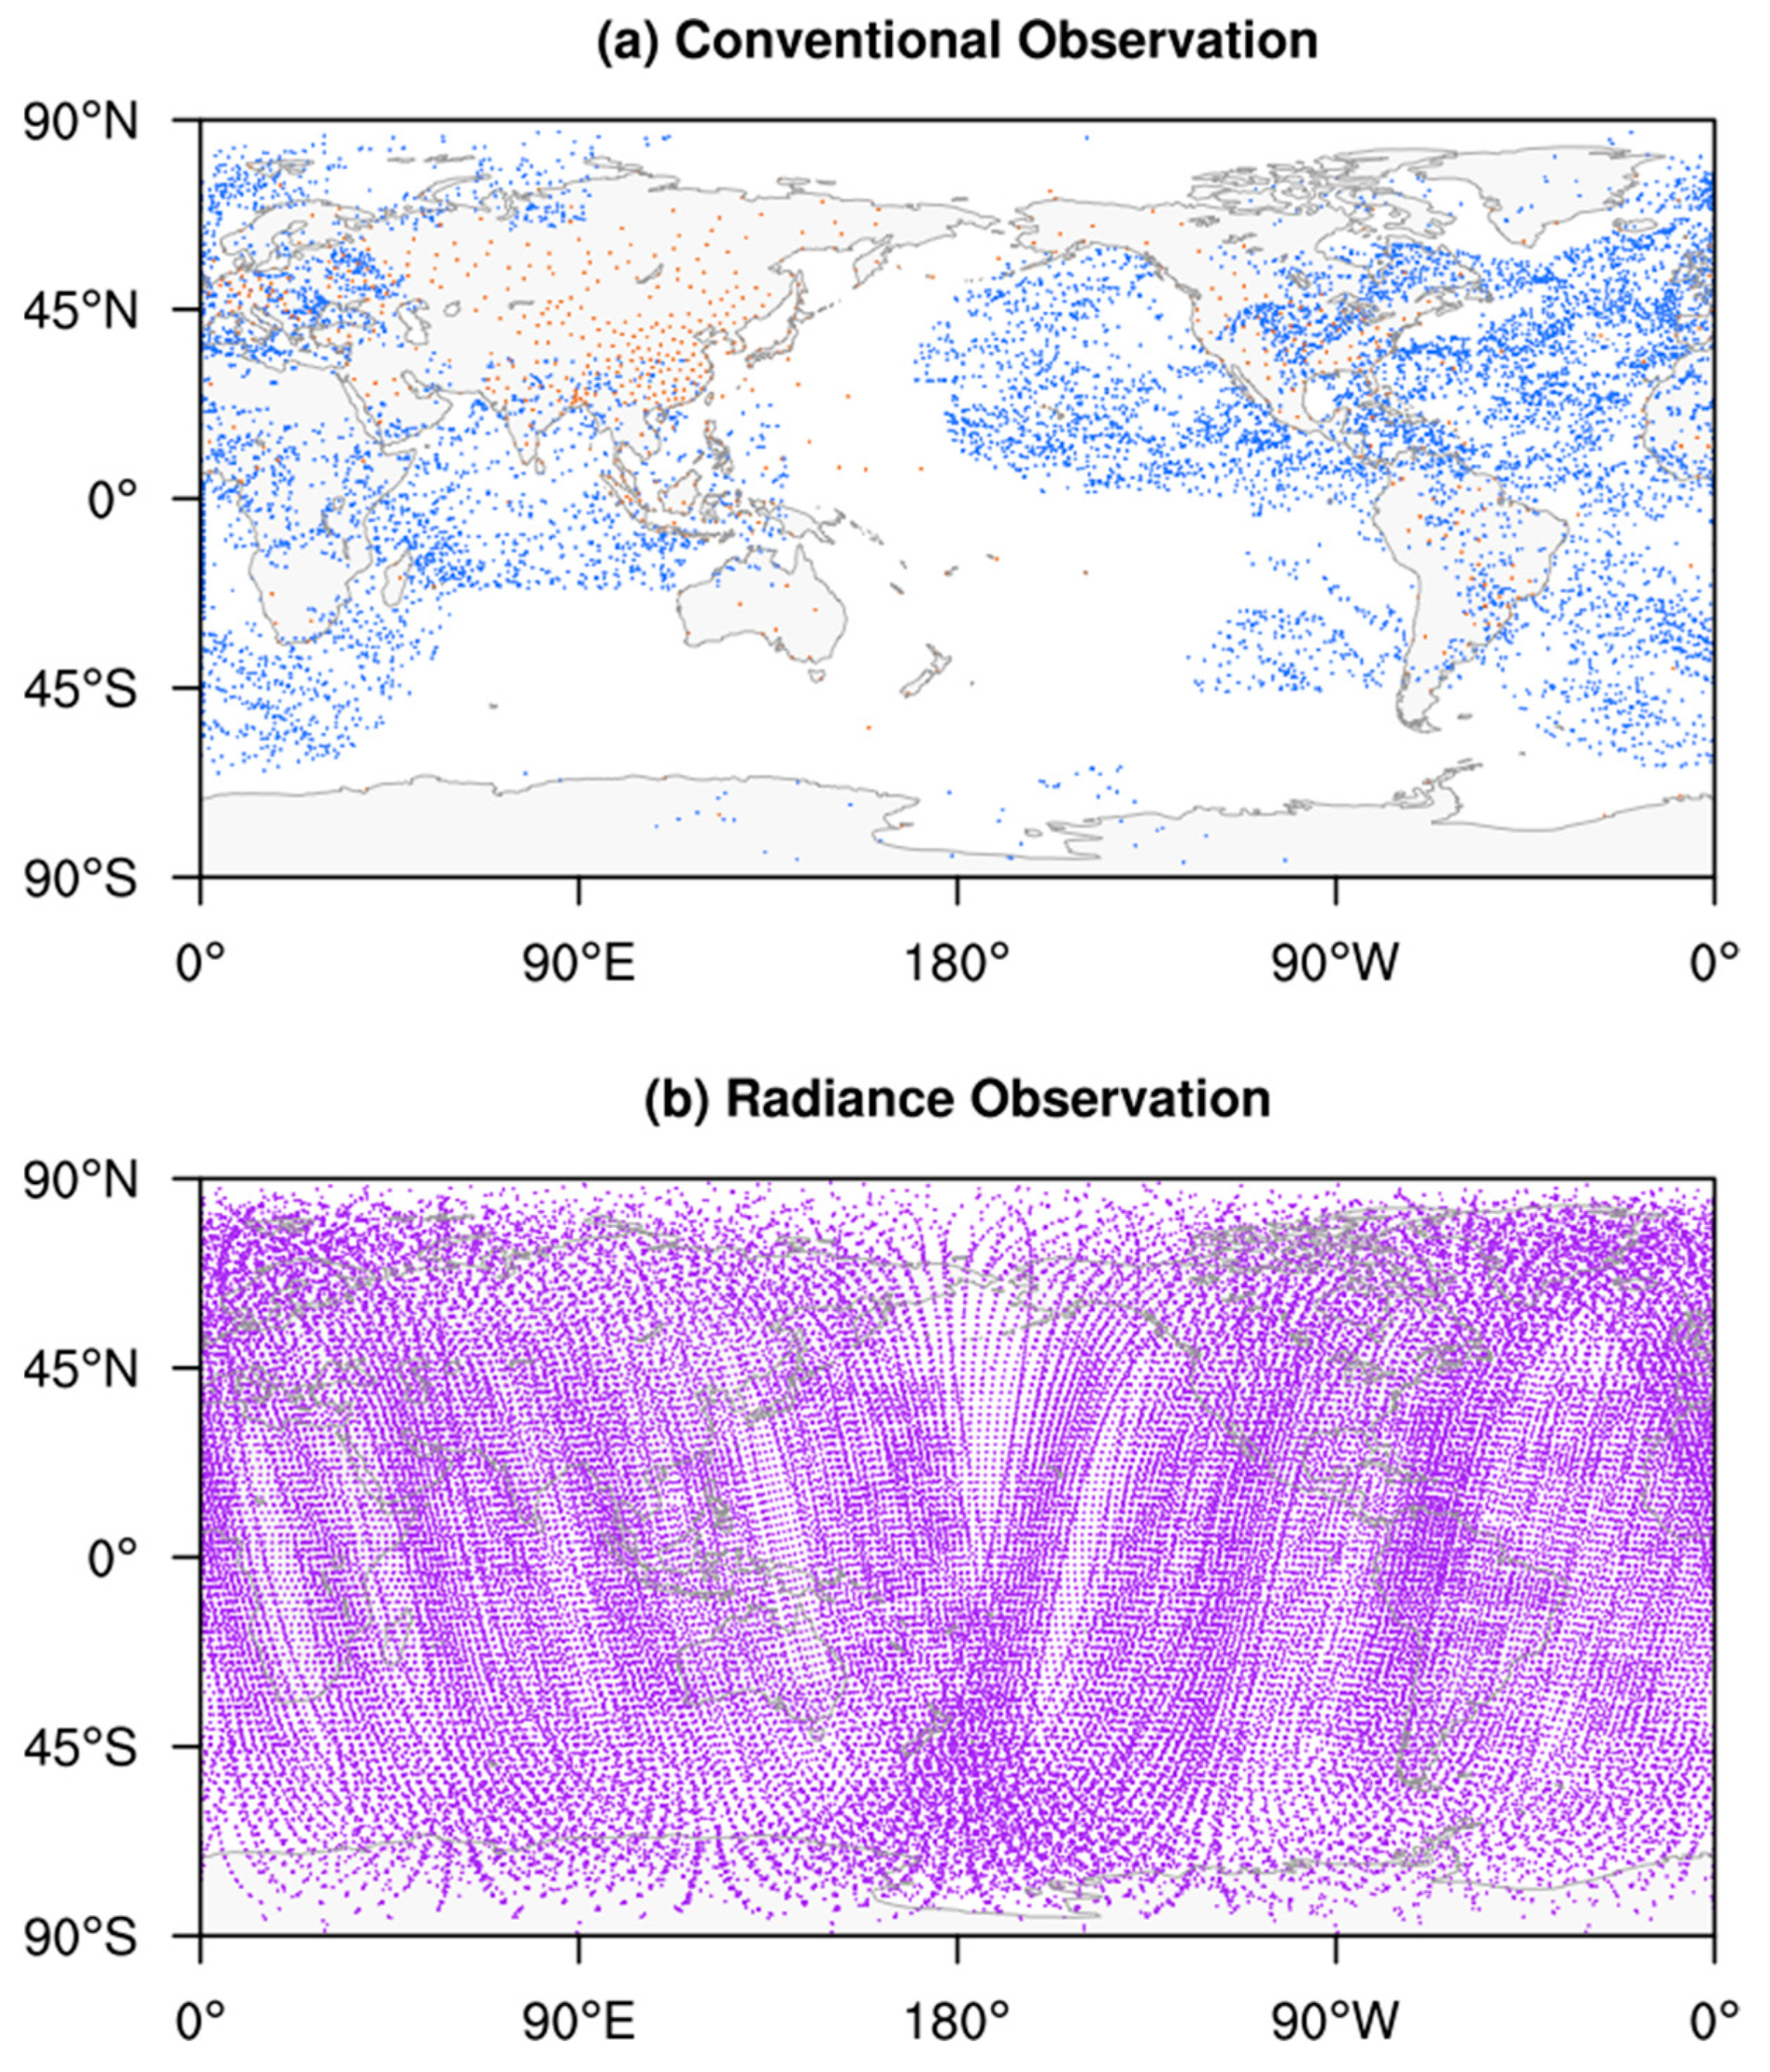
Observing system simulation experiment (OSSE) allows an objective assessment of the assimilation and forecast performances of a DA system when the “truth” state is known [25,30,31,32]. In this study, cycled assimilation experiments and corresponding initialized forecast experiments were performed based on the OSSE.
The design of OSSE is similar to Zhu et al. [24,26]. The background field in the first assimilation window and the “truth” state (or “truth”) were generated by the low-resolution and high-resolution versions of the CMA-GFS model, which were initialized from the ERA-Interim 6 h forecast field and the ERA-5 reanalysis field, respectively. For a fair comparison, all assimilation experiments used the same background field in the first assimilation window.
Based on previous experiments assimilating conventional observations [24,26], further experiments adding AMSU-A radiance observations were carried out. The 1-week sensitivity experiments on the basis of the pressure at peak weight and the weighted average pressure were initially conducted to determine the vertical positioning method for the observation space localization. The most favorable vertical positioning method for the forecast performance was adopted. Then, three classes of experiments were designed, which covers a period of about 1 month starting from 0900 UTC 11 September 2016 and taking the first 2 days for spin-up. The first class includes the ensemble DA experiments using the 4DEnVar system and their initialized forecast experiments, and the second one contains the hybrid DA and forecast experiments with the En4DVar system that require the flow-dependent data produced by the first one. Additionally, the third class of experiments, i.e., the standard 4DVar DA and forecast experiments, were conducted for comparisons.
Each class includes two sets of DA experiments, respectively, incorporating only conventional observations [24,26] and both conventional and AMSU-A radiance observations (simply all types of observations, hereinafter), and two sets of corresponding initialized forecast experiments. Totally twelve sets of experiments were conducted to investigate the effects of adding AMSU-A radiance observations on the assimilation and forecast performances of the En4DVar system and its 4DVar and 4DEnVar component systems. The analyses of assimilating only conventional observations and assimilating all types of observations and their initialized forecasts were compared to assess the contributions of AMSU-A radiance observations. The experiments upon the standard 4DVar and 4DEnVar systems were conducted to provide the references for evaluating the performance of the En4DVar system when adding AMSU-A radiance observations.

2.3.3. Observations

The “observations” were extracted from the “truth” state by using the transformations of observation operators and superimposing observation errors. The conventional observations used in this study were obtained from sounding and cloud-derived wind, and more details are presented in Zhu et al. [24]. Additionally, radiance from AMSU-A instruments of NOAA 15, 18, 19, NPP, and Metop A, B were also utilized. Sounding observations are sampled every 6 h, while both cloud-derived wind observations and AMSU-A radiance observations are sampled every 30 min. The radiance observations are assimilated using Version 12 of the RTTOV model [33] as the observation operator. To avoid the negative impacts of ground albedo and interpolation errors at upper layers, only channels 5–14 of the AMSU-A radiance observations were assimilated. Conventional observations cover most of the Northern Hemisphere, with a lower sampling density in the Southern Hemisphere. In contrast, radiance observations have a wider sampling range, which especially compensates for the low coverage of conventional observations in the Southern Hemisphere (Figure 1).

2.4. Evaluation Method

In this study, the anomaly root mean square error (ARMSE) [31,32,34] and anomaly correlation coefficient (ACC) metrics were used to assess the random error and correlation of the analyses and forecasts against the “truth”, respectively. The globe was divided into Northern Extratropics (20°N∼90°N), Southern Extratropics (20°S∼90°S) and Tropics (20°S∼20°N) for calculating the statistical results of these metrics. Moreover, a score card, which is marked with the significance of performance difference, was used to conveniently exhibit the performance difference between two forecasts initialized from different analyses in terms of ARMSE and ACC. Note that the analyses and forecasts from the 4DEnVar system are its ensemble mean analyses and deterministic 10-day forecasts initialized from these ensemble mean analyses. For more details about the evaluation methods refer to Zhu et al. [24,26].

3. Results

3.1. Vertical Positioning Method

In this subsection, the vertical positioning method was determined by a set of sensitivity experiments. The purpose of these experiments is to investigate the effects of two vertical coordinate definitions of AMSU-A radiance observations including the pressure at peak weight and the weighted average pressure on the forecast skill of the 4DEnVar system.
Figure 2a shows the scorecard of the 4DEnVar-initialized forecasts assimilating all types of observations with the pressure at peak weight as the vertical coordinates of AMSU-A radiance observations against those assimilating only conventional observations in terms of ACC and ARMSE. Encouragingly, the addition of AMSU-A radiance observations leads to significant improvements of the forecasts, especially in the Southern Extratropics and Tropics, except the degradation in the late period of the medium range over the Northern Extratropics (Figure 2a). Meanwhile, similar impacts of the AMSU-A radiance observations on the forecasts can be observed when the weighted average pressure is used as their vertical coordinates, but the degradation shown in Figure 2a is alleviated (Figure 2b). Therefore, the weighted average pressure was finally chosen to define the vertical coordinates of AMSU-A radiance observations in this study.

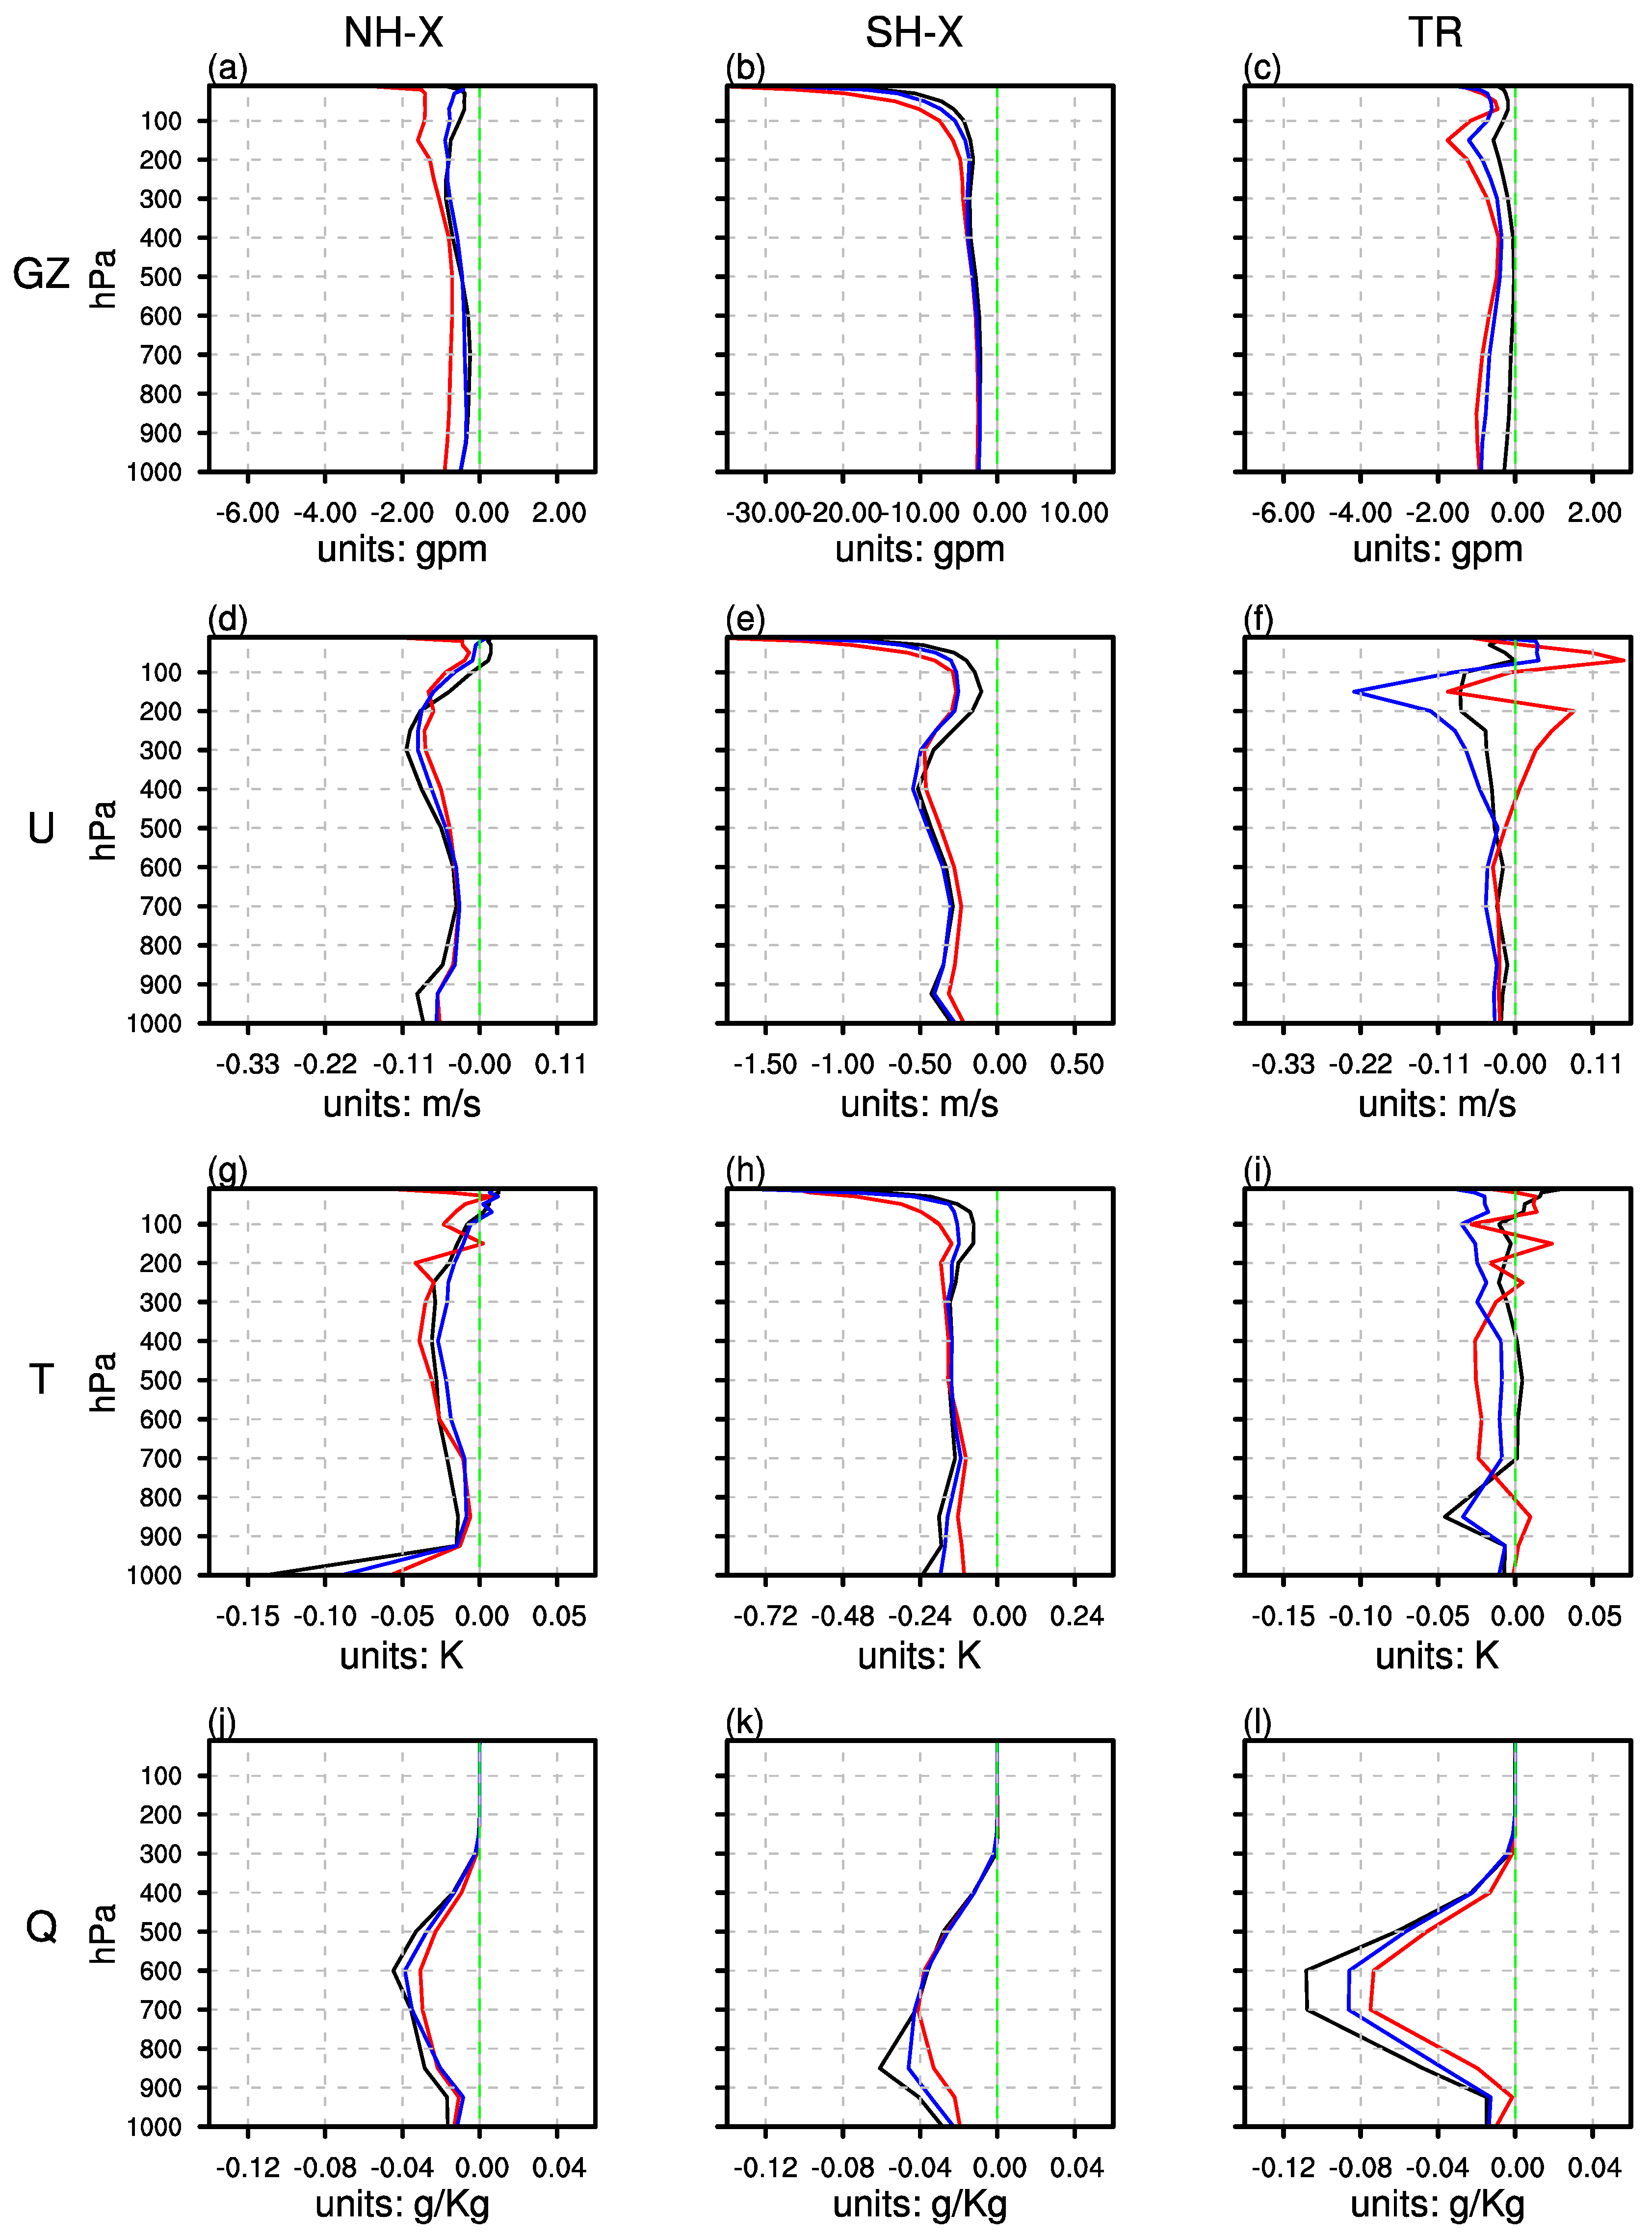
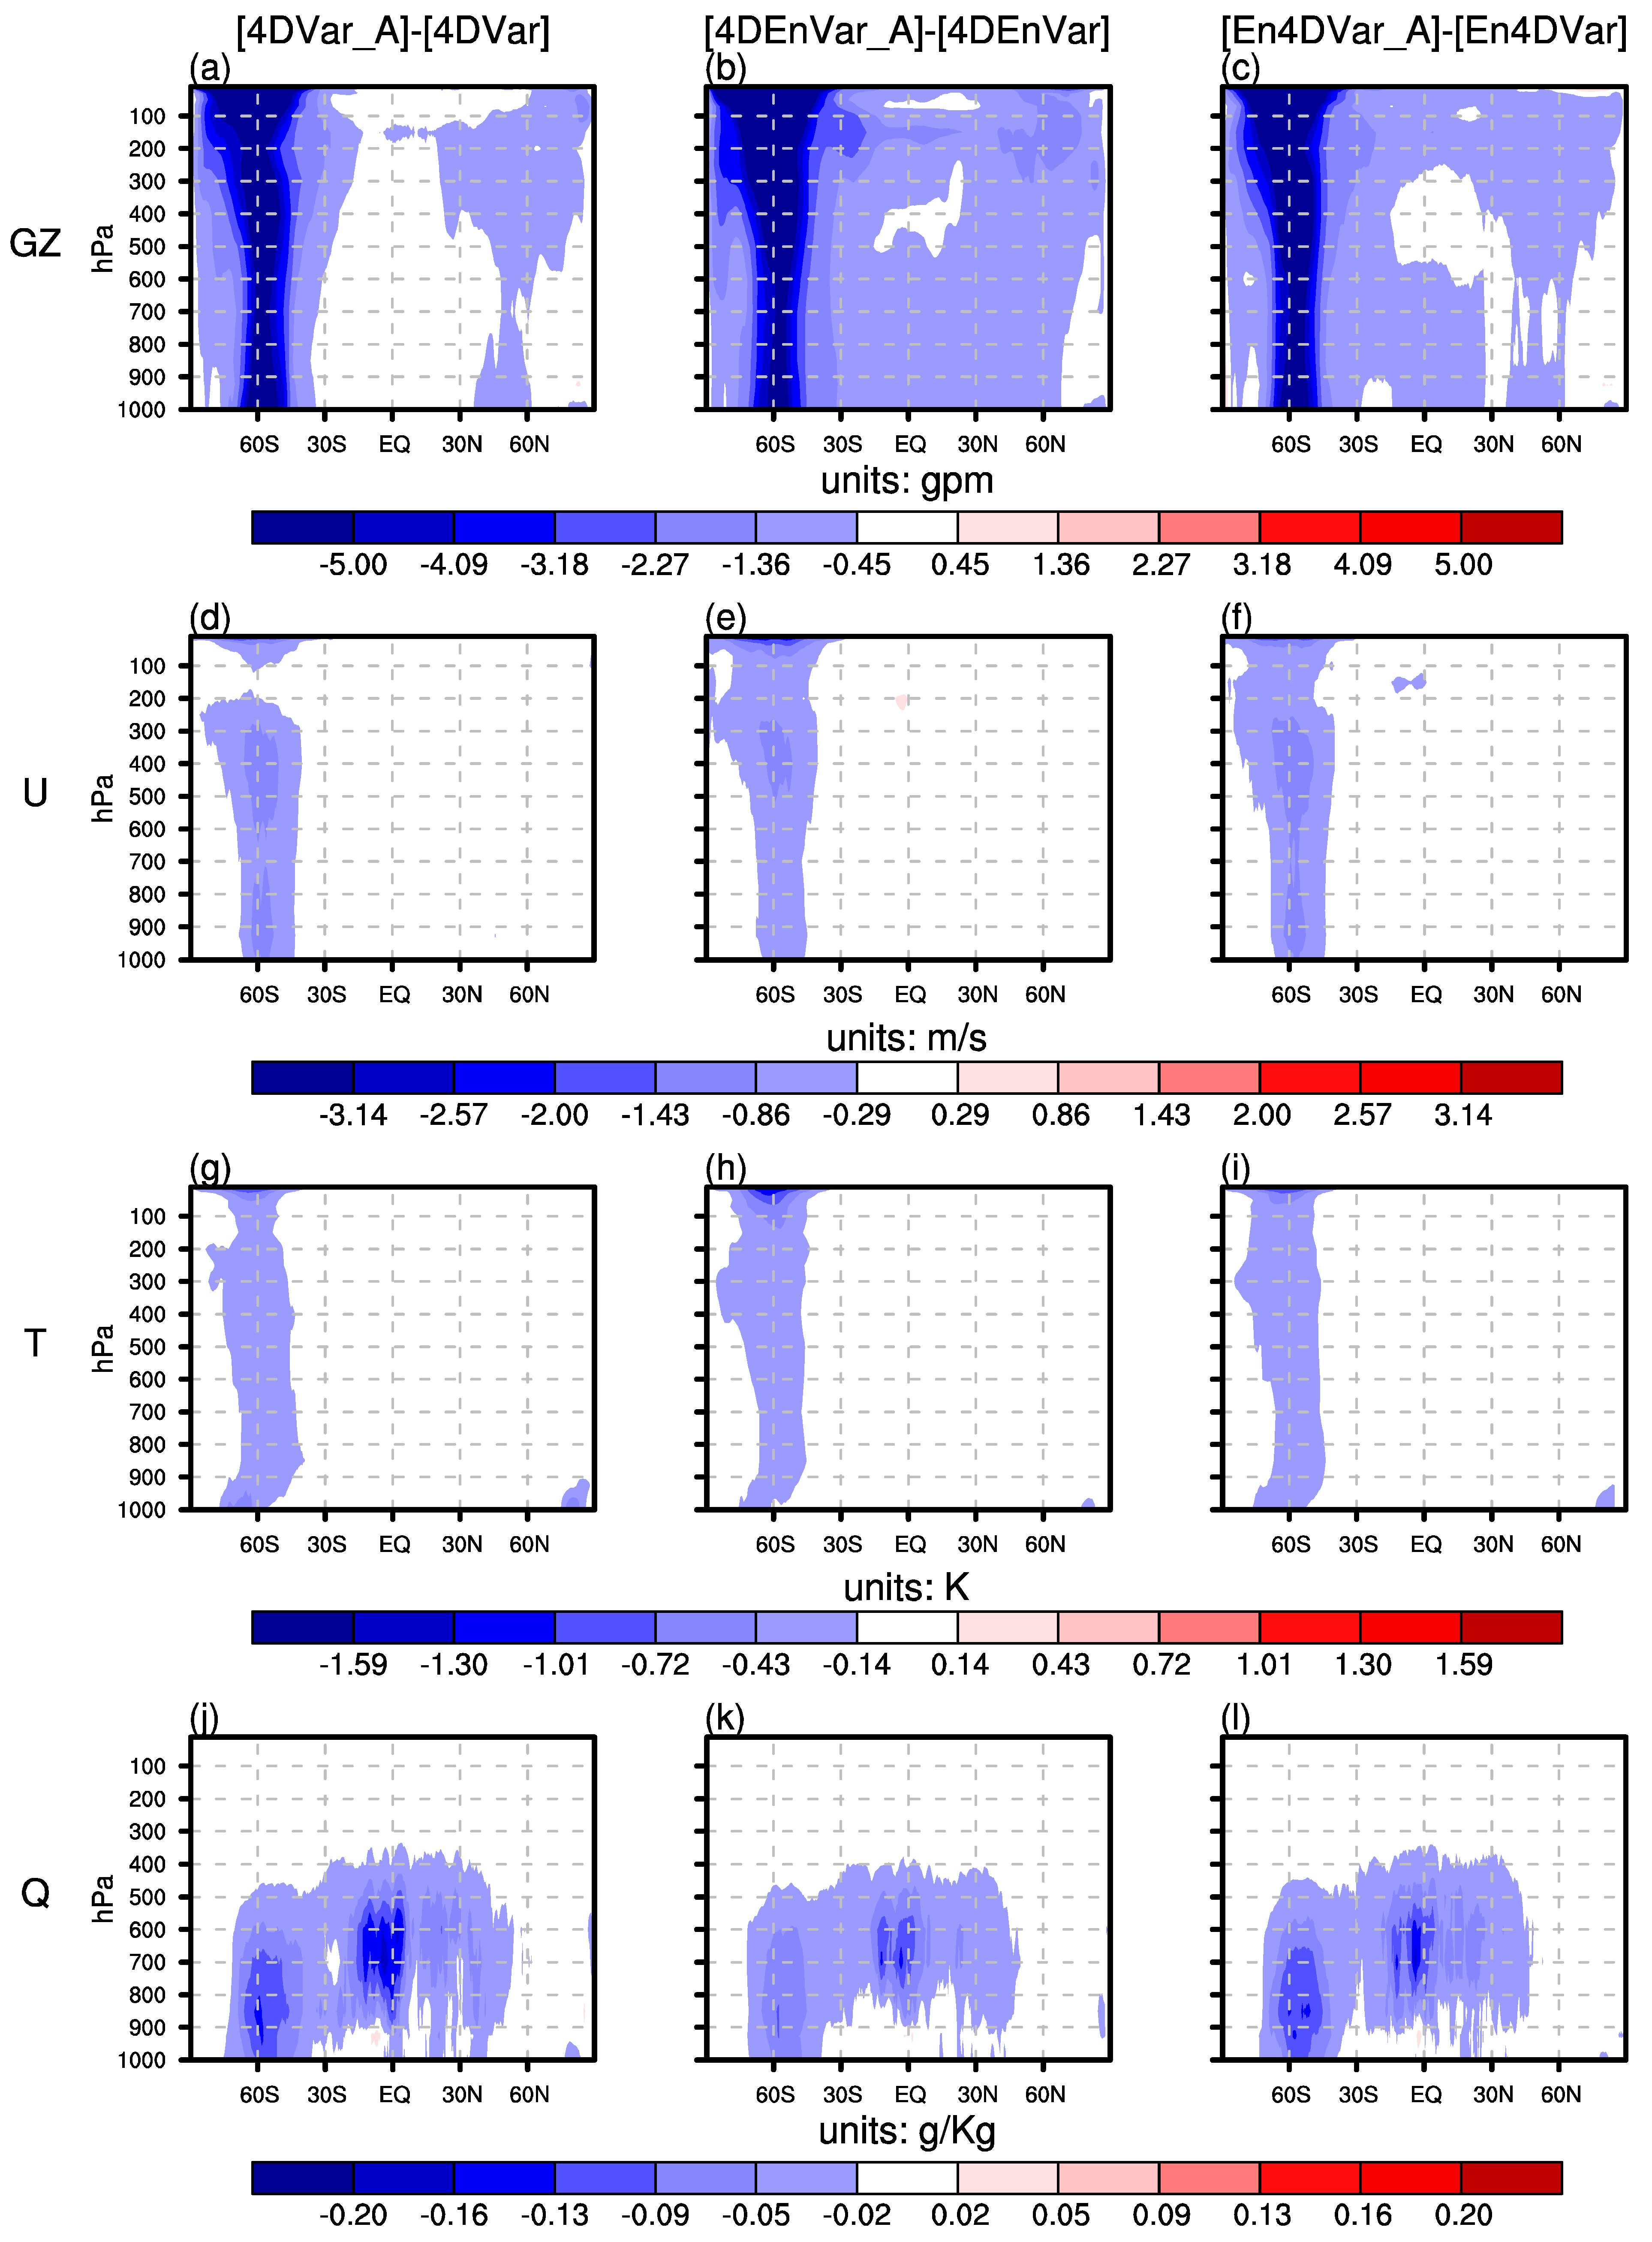
3.2. Effects of AMSU-A Radiance Observations on Analysis Quality

After the vertical positioning method was determined, the effects of AMSU-A radiance observations on the analysis qualities of the DA systems were evaluated. Based on the En4DVar system and its two components, the analysis errors of assimilating all types of observations were compared with those of assimilating only conventional observations so as to investigate whether the AMSU-A radiance observations benefit the analysis quality in different DA systems. The results of the 4DVar and 4DEnVar component systems were used as the references to assess the effectiveness of the En4DVar system on assimilating AMSU-A radiance observations.
Figure 3 shows the contributions of AMSU-A radiance observations to the decreases in analysis error in the En4DVar system and its two components. It is found that all three DA systems reduced the ARMSE on all vertical layers except very few layers over Northern Extratropics and Tropic when the AMSU-A radiance observations joined the analyses. In particular, the decreases in ARMSE in all basic variables except specific humidity are most significant in the Southern Extratropics, especially in the stratosphere where conventional observations are sparsely distributed (Figure 3, column 2). However, the most significant improvement in the specific humidity analysis is located in the Tropics (Figure 3, row 4) where the water vapor content is high. As for the comparisons among three DA systems, they have different performances on different variables in different regions. The improvement in the 4DEnVar ensemble mean analysis is more (less) significant than in the 4DVar analysis on geopotential height (specific humidity), and comparable on zonal wind and temperature. It is more obvious on temperature (zonal wind and temperature) at the middle (upper) layers in the Tropics (Northern and Southern Extratropics), but less obvious on temperature at the lower layers, and on zonal wind at the upper (middle and lower) layers in the Tropics (Northern and Southern Extratropics). The improvement in the En4DVar analysis is generally between those in the analyses from its two component systems. There is larger improvement in zonal wind (temperature) at the middle layers in the Southern Extratropics and on the layers below 100 hPa in the Tropics (at the upper layers in the Tropics). Smaller improvement in temperature is in the middle and upper troposphere in the Northern Extratropics (Figure 3, rows 2 and 3).
The effects of adding AMSU-A observations on the error structures of the En4DVar and 4DVar analyses and the 4DEnVar ensemble mean analyses were shown in Figure 4. First, the analysis errors of all three DA systems are significantly reduced in most regions, indicating that the AMSU-A radiance observations have an overall positive effect on the analysis quality. Second, it is found that AMSU-A radiance observations most significantly reduces the analysis errors of the geopotential height, zonal wind and temperature in the Southern Extratropics, especially near 60°S, where conventional observations are sparsely distributed. In addition, the analysis errors of the specific humidity are significantly reduced not only in the Southern Extratropics, but also in the Tropics (Figure 4, row 4). Finally, the improvement of analysis by the En4DVar is generally between those by the 4DVar and 4DEnVar. These results are consistent with the findings in Figure 3.

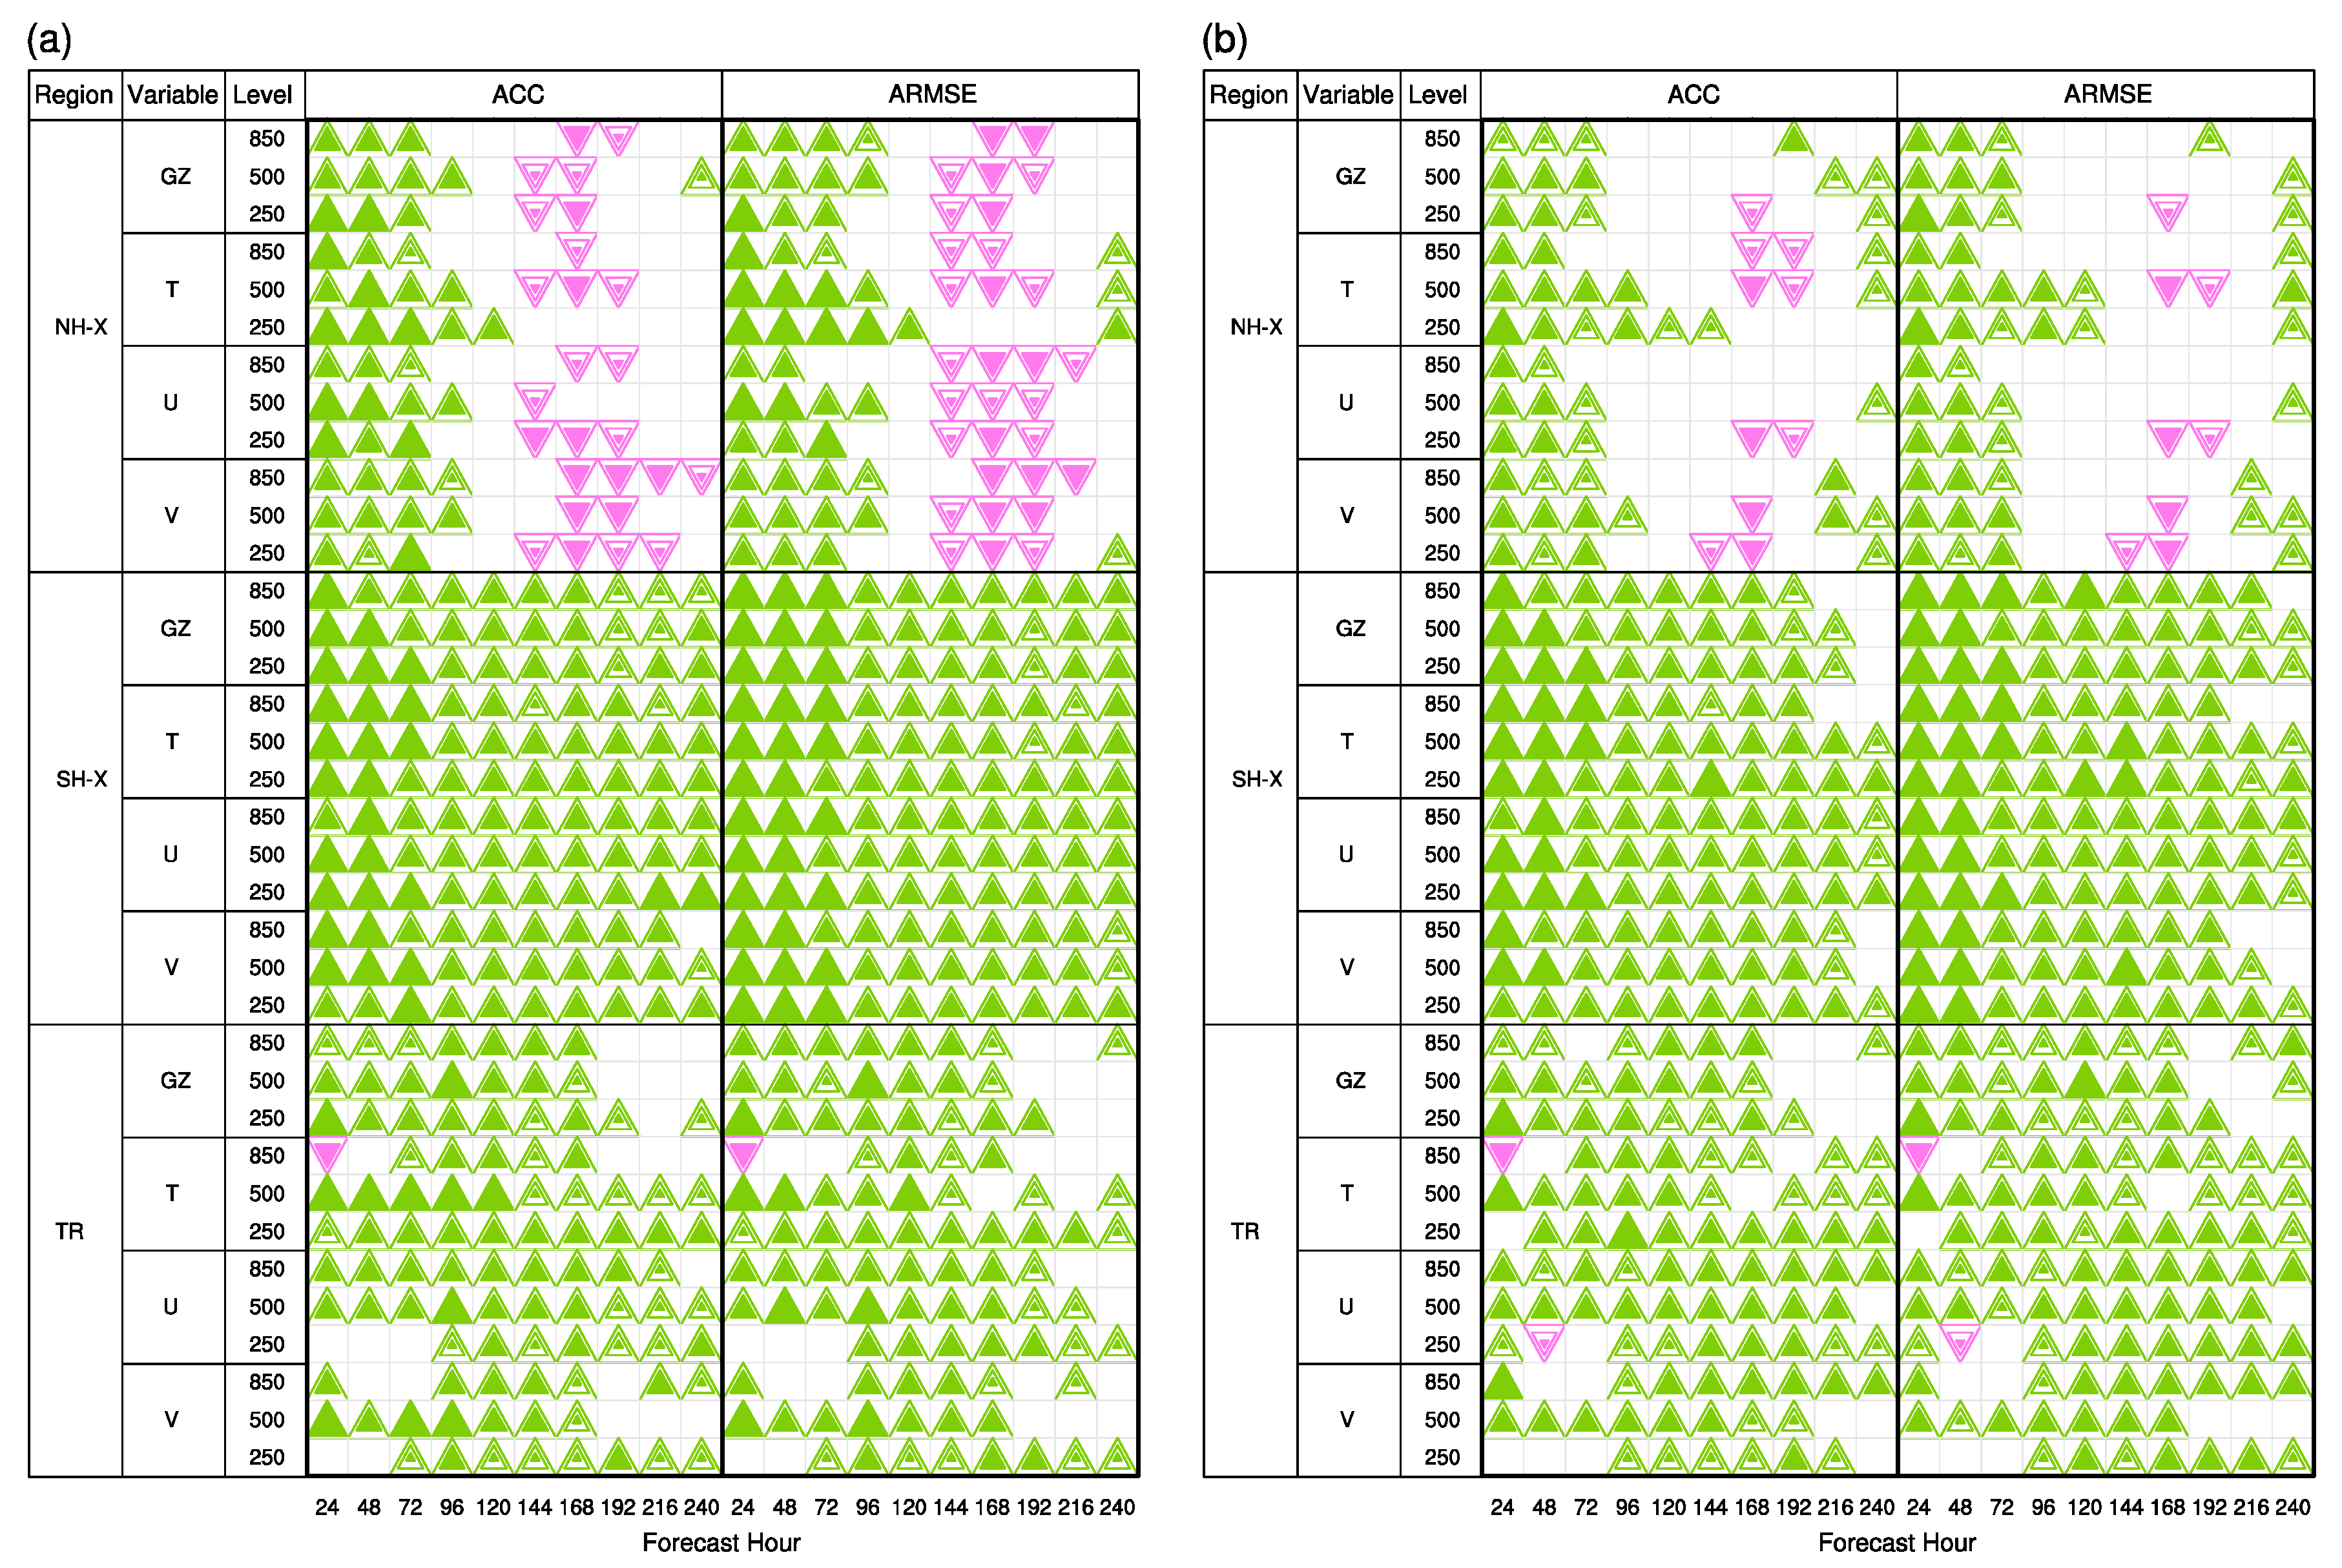
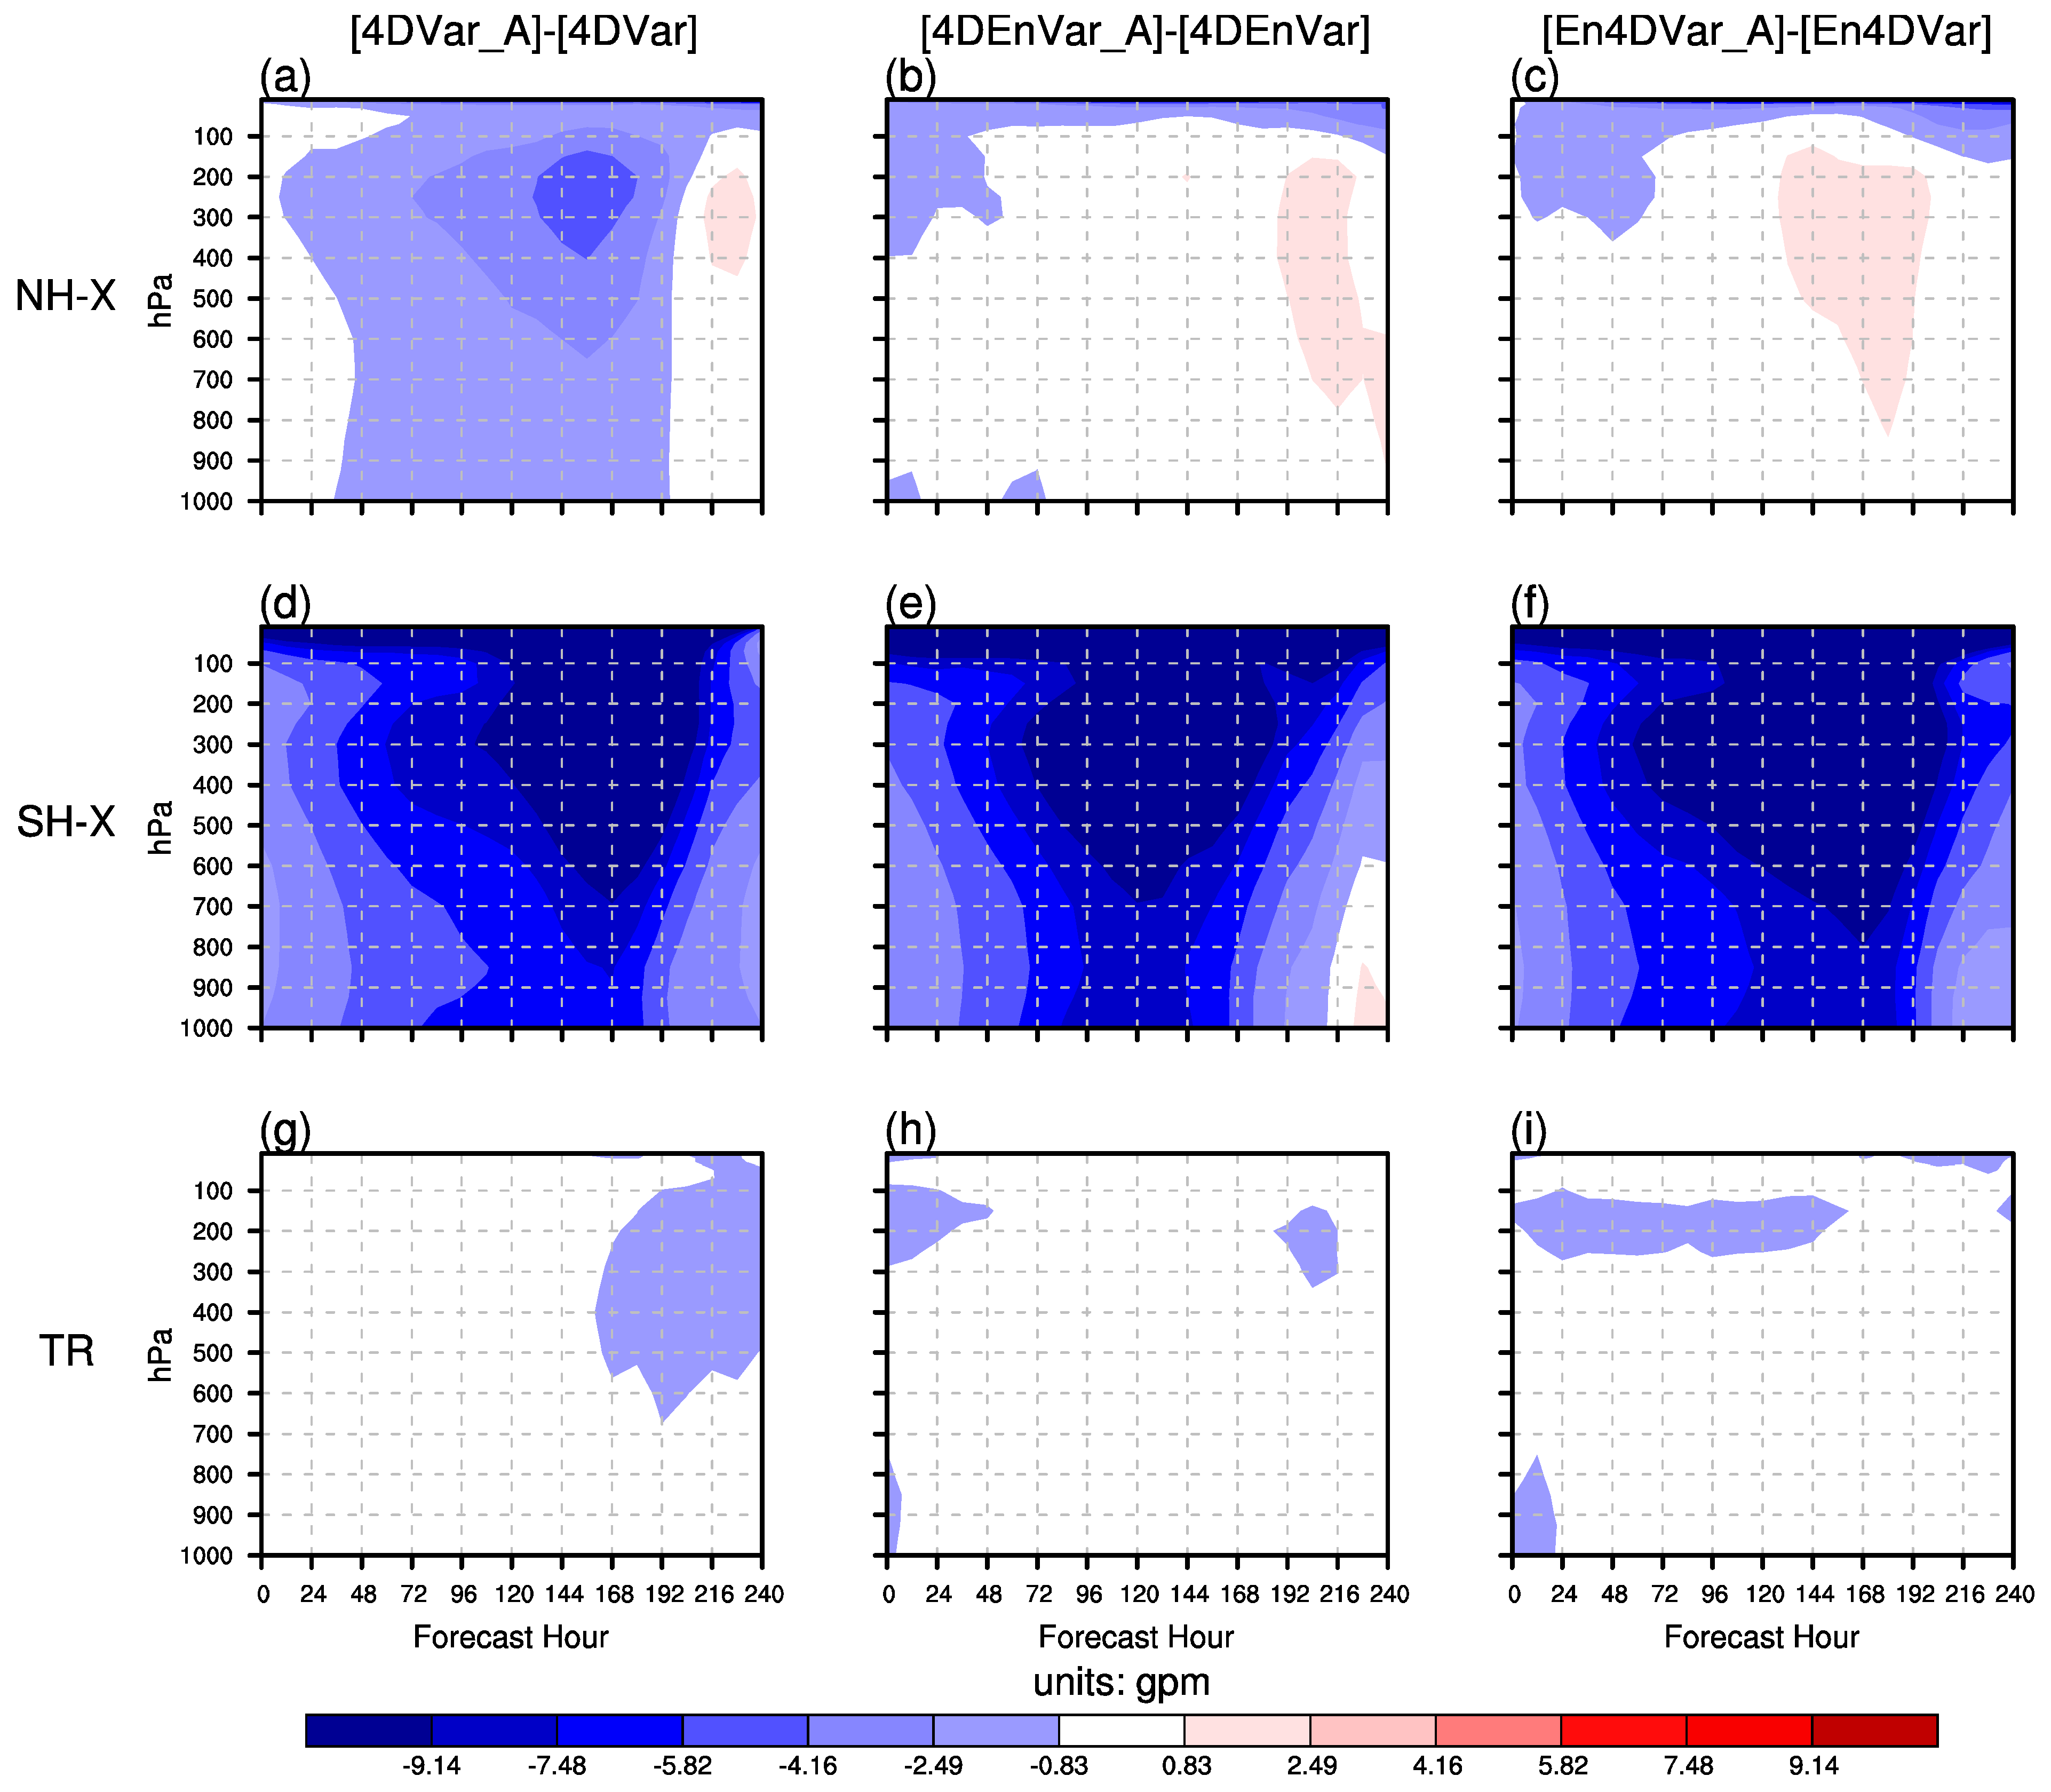
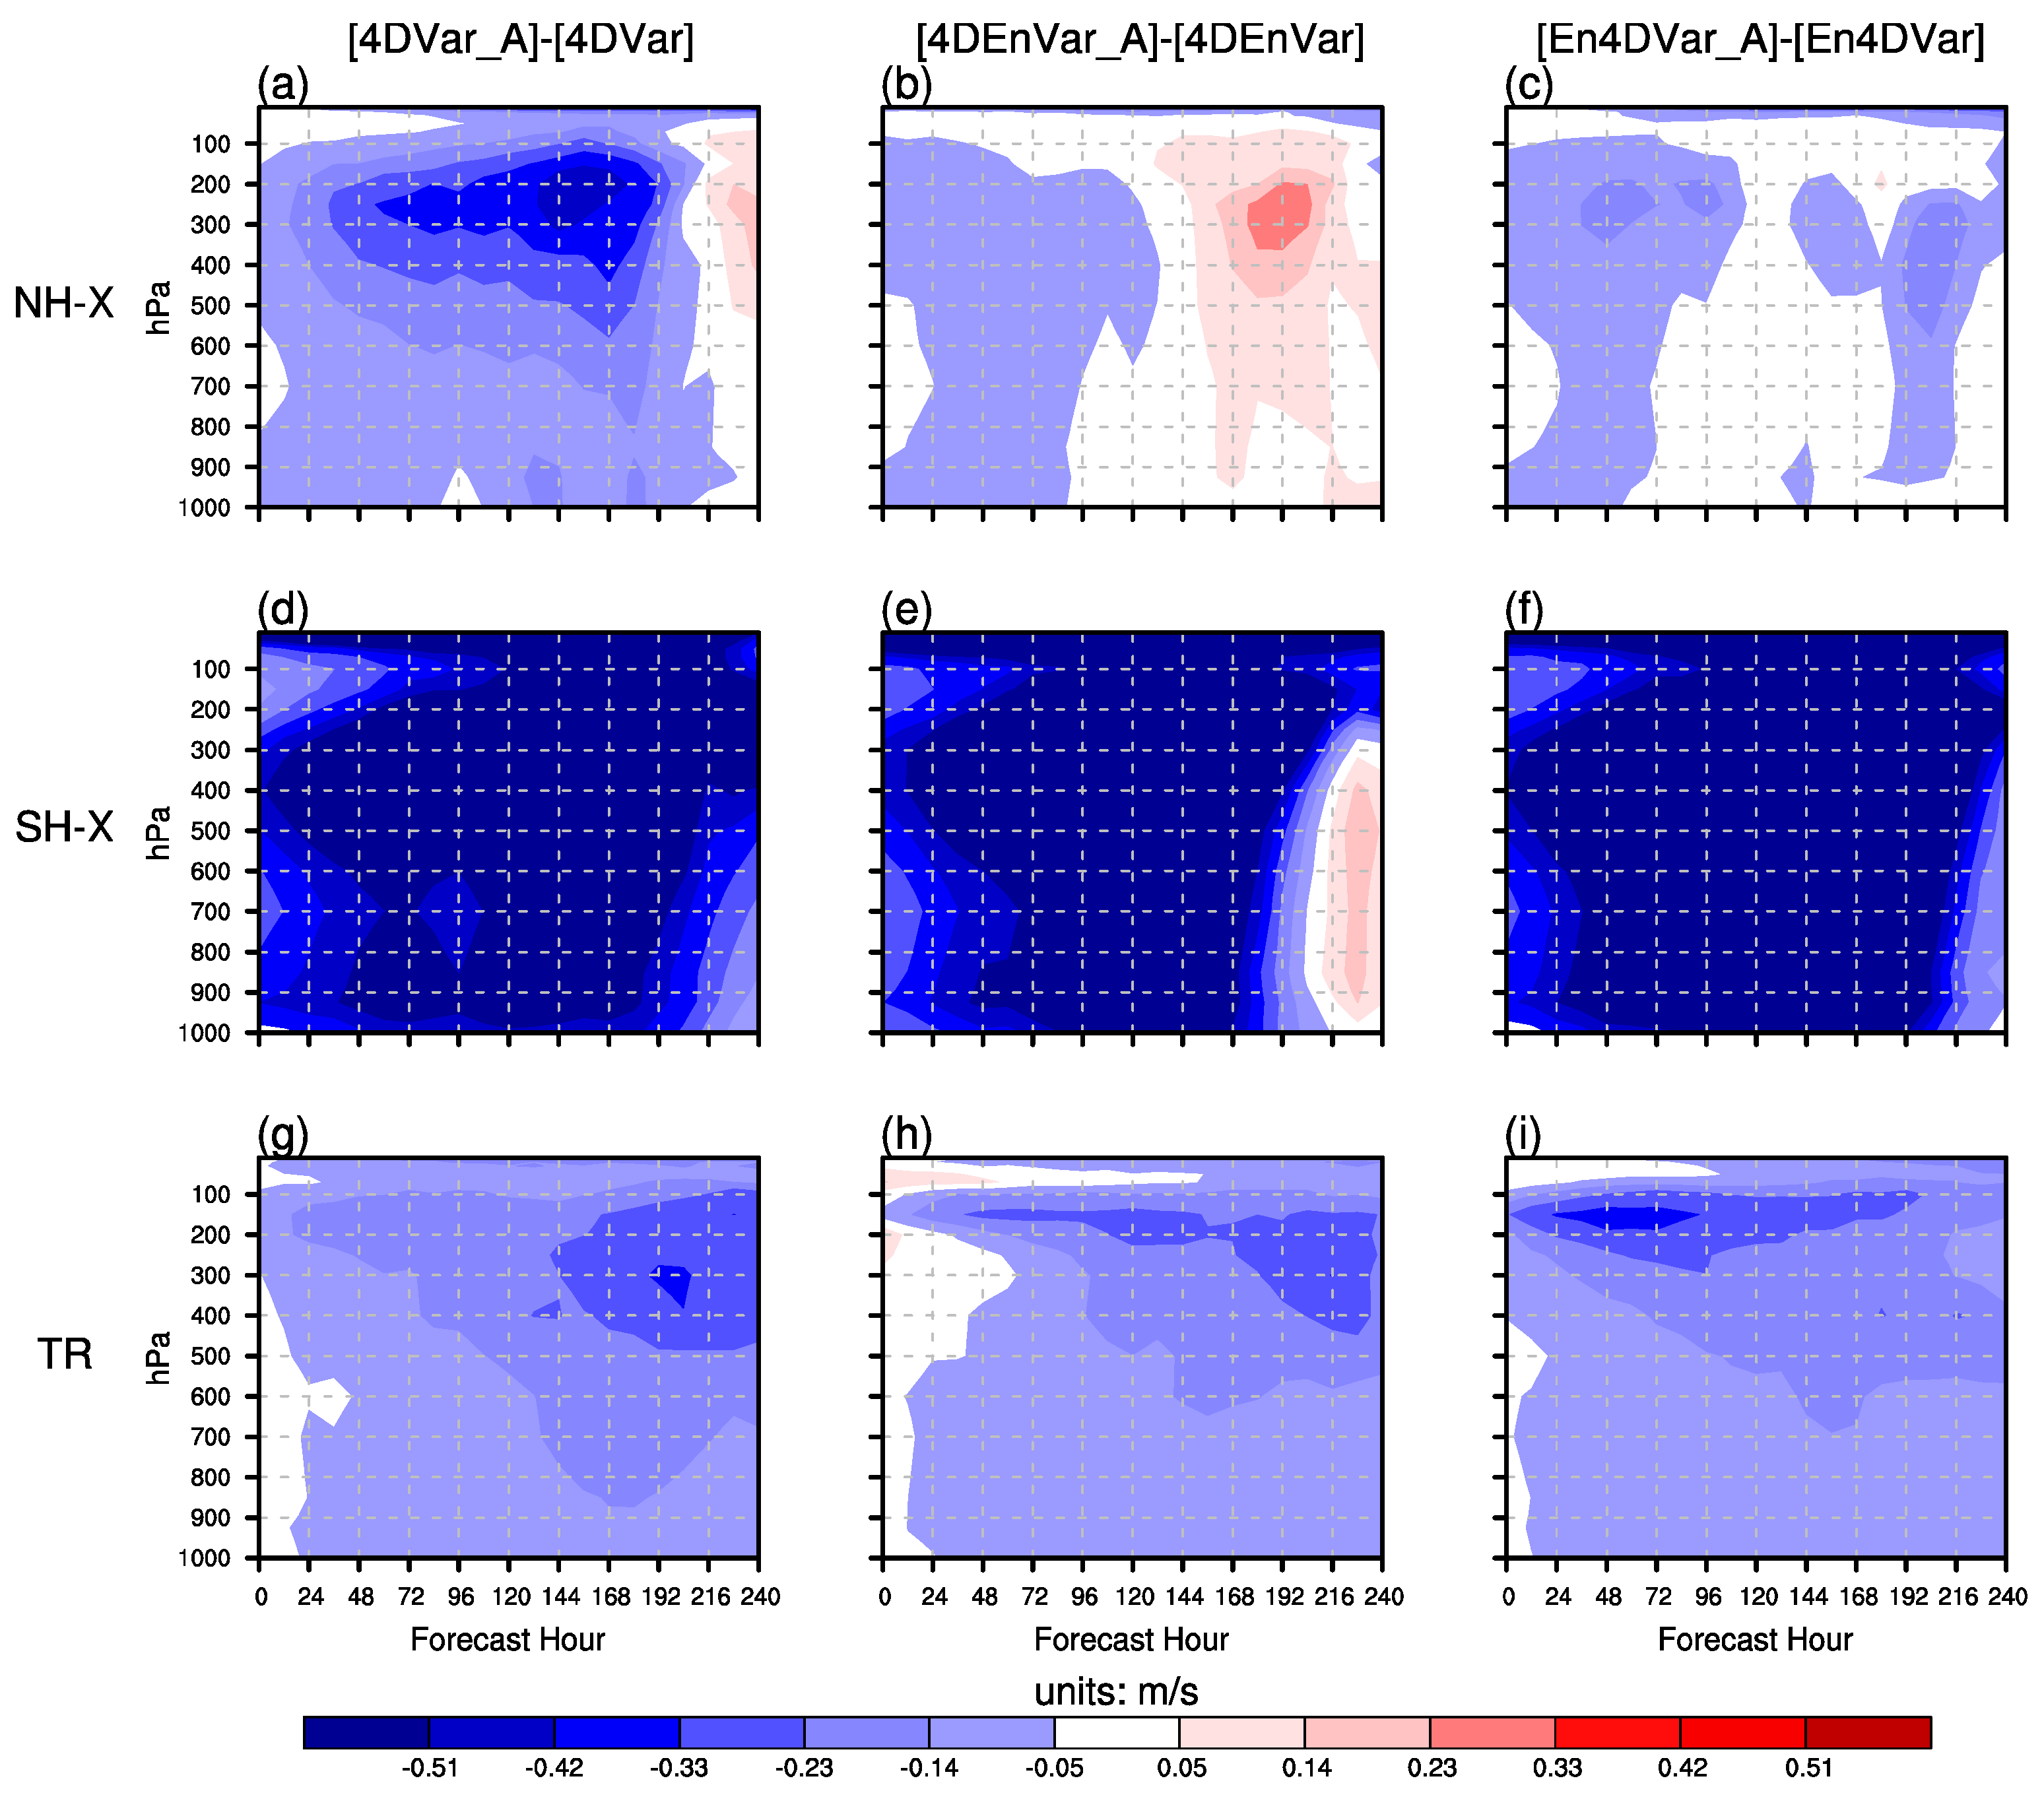
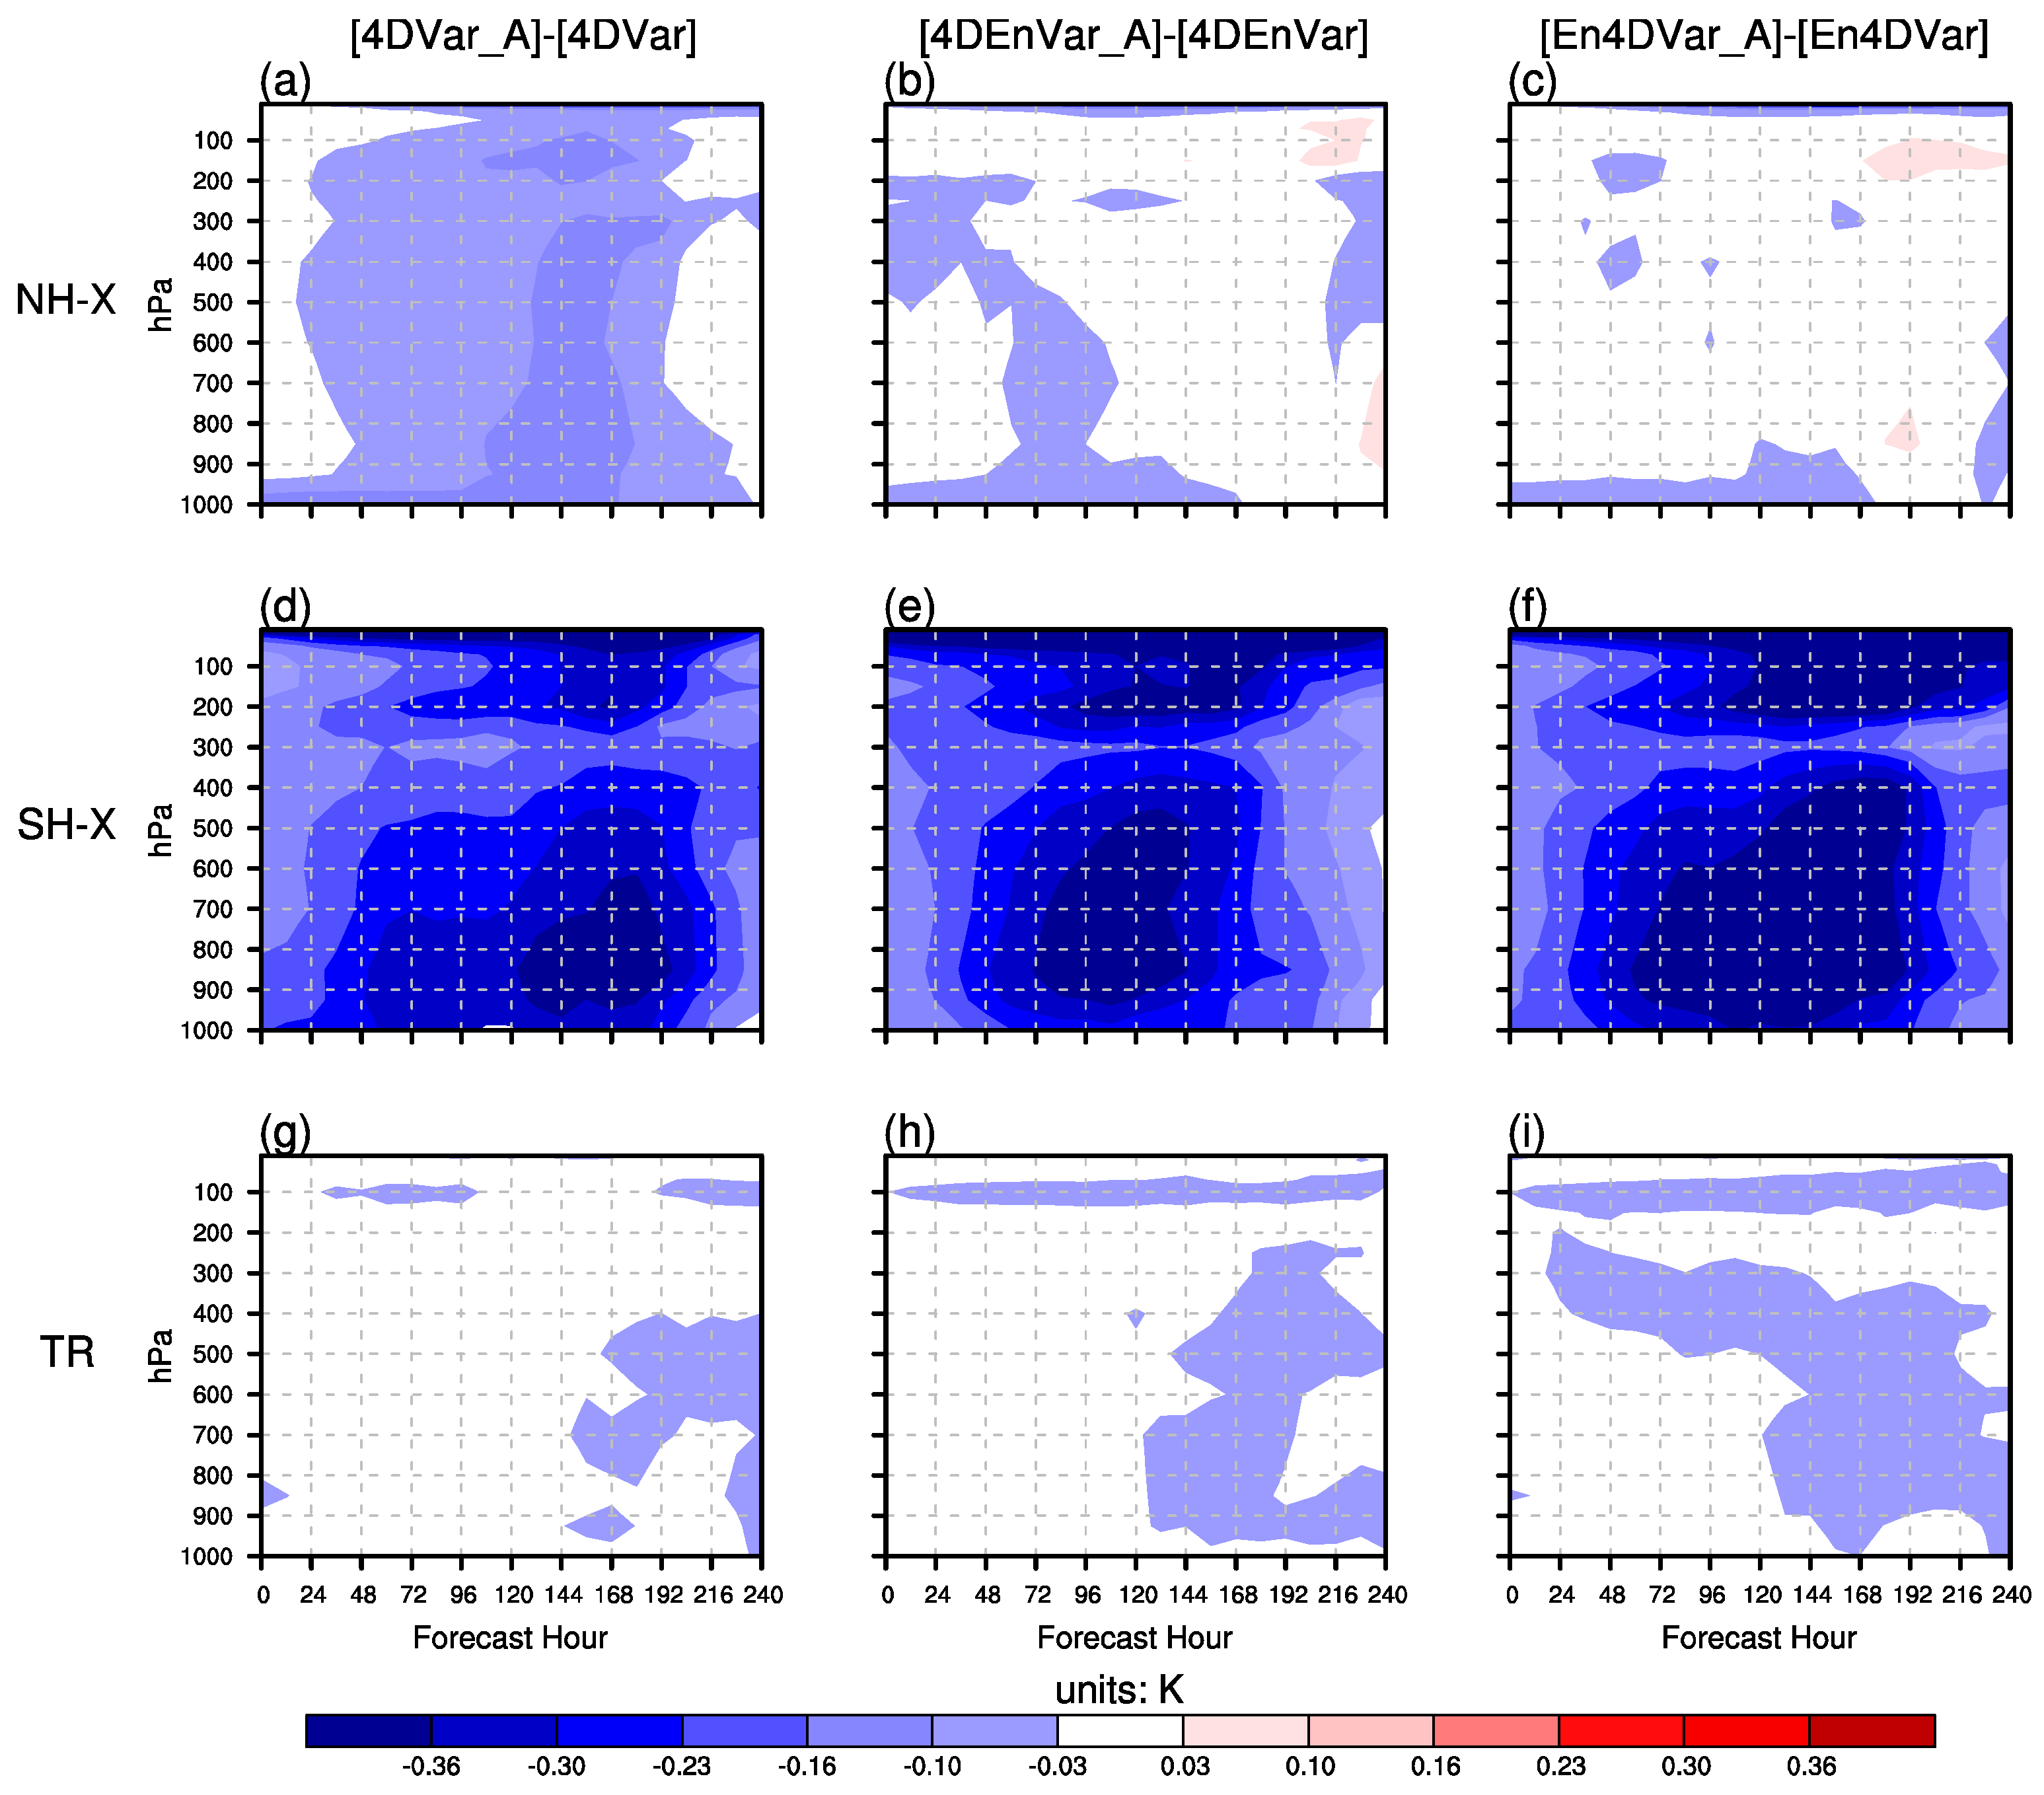
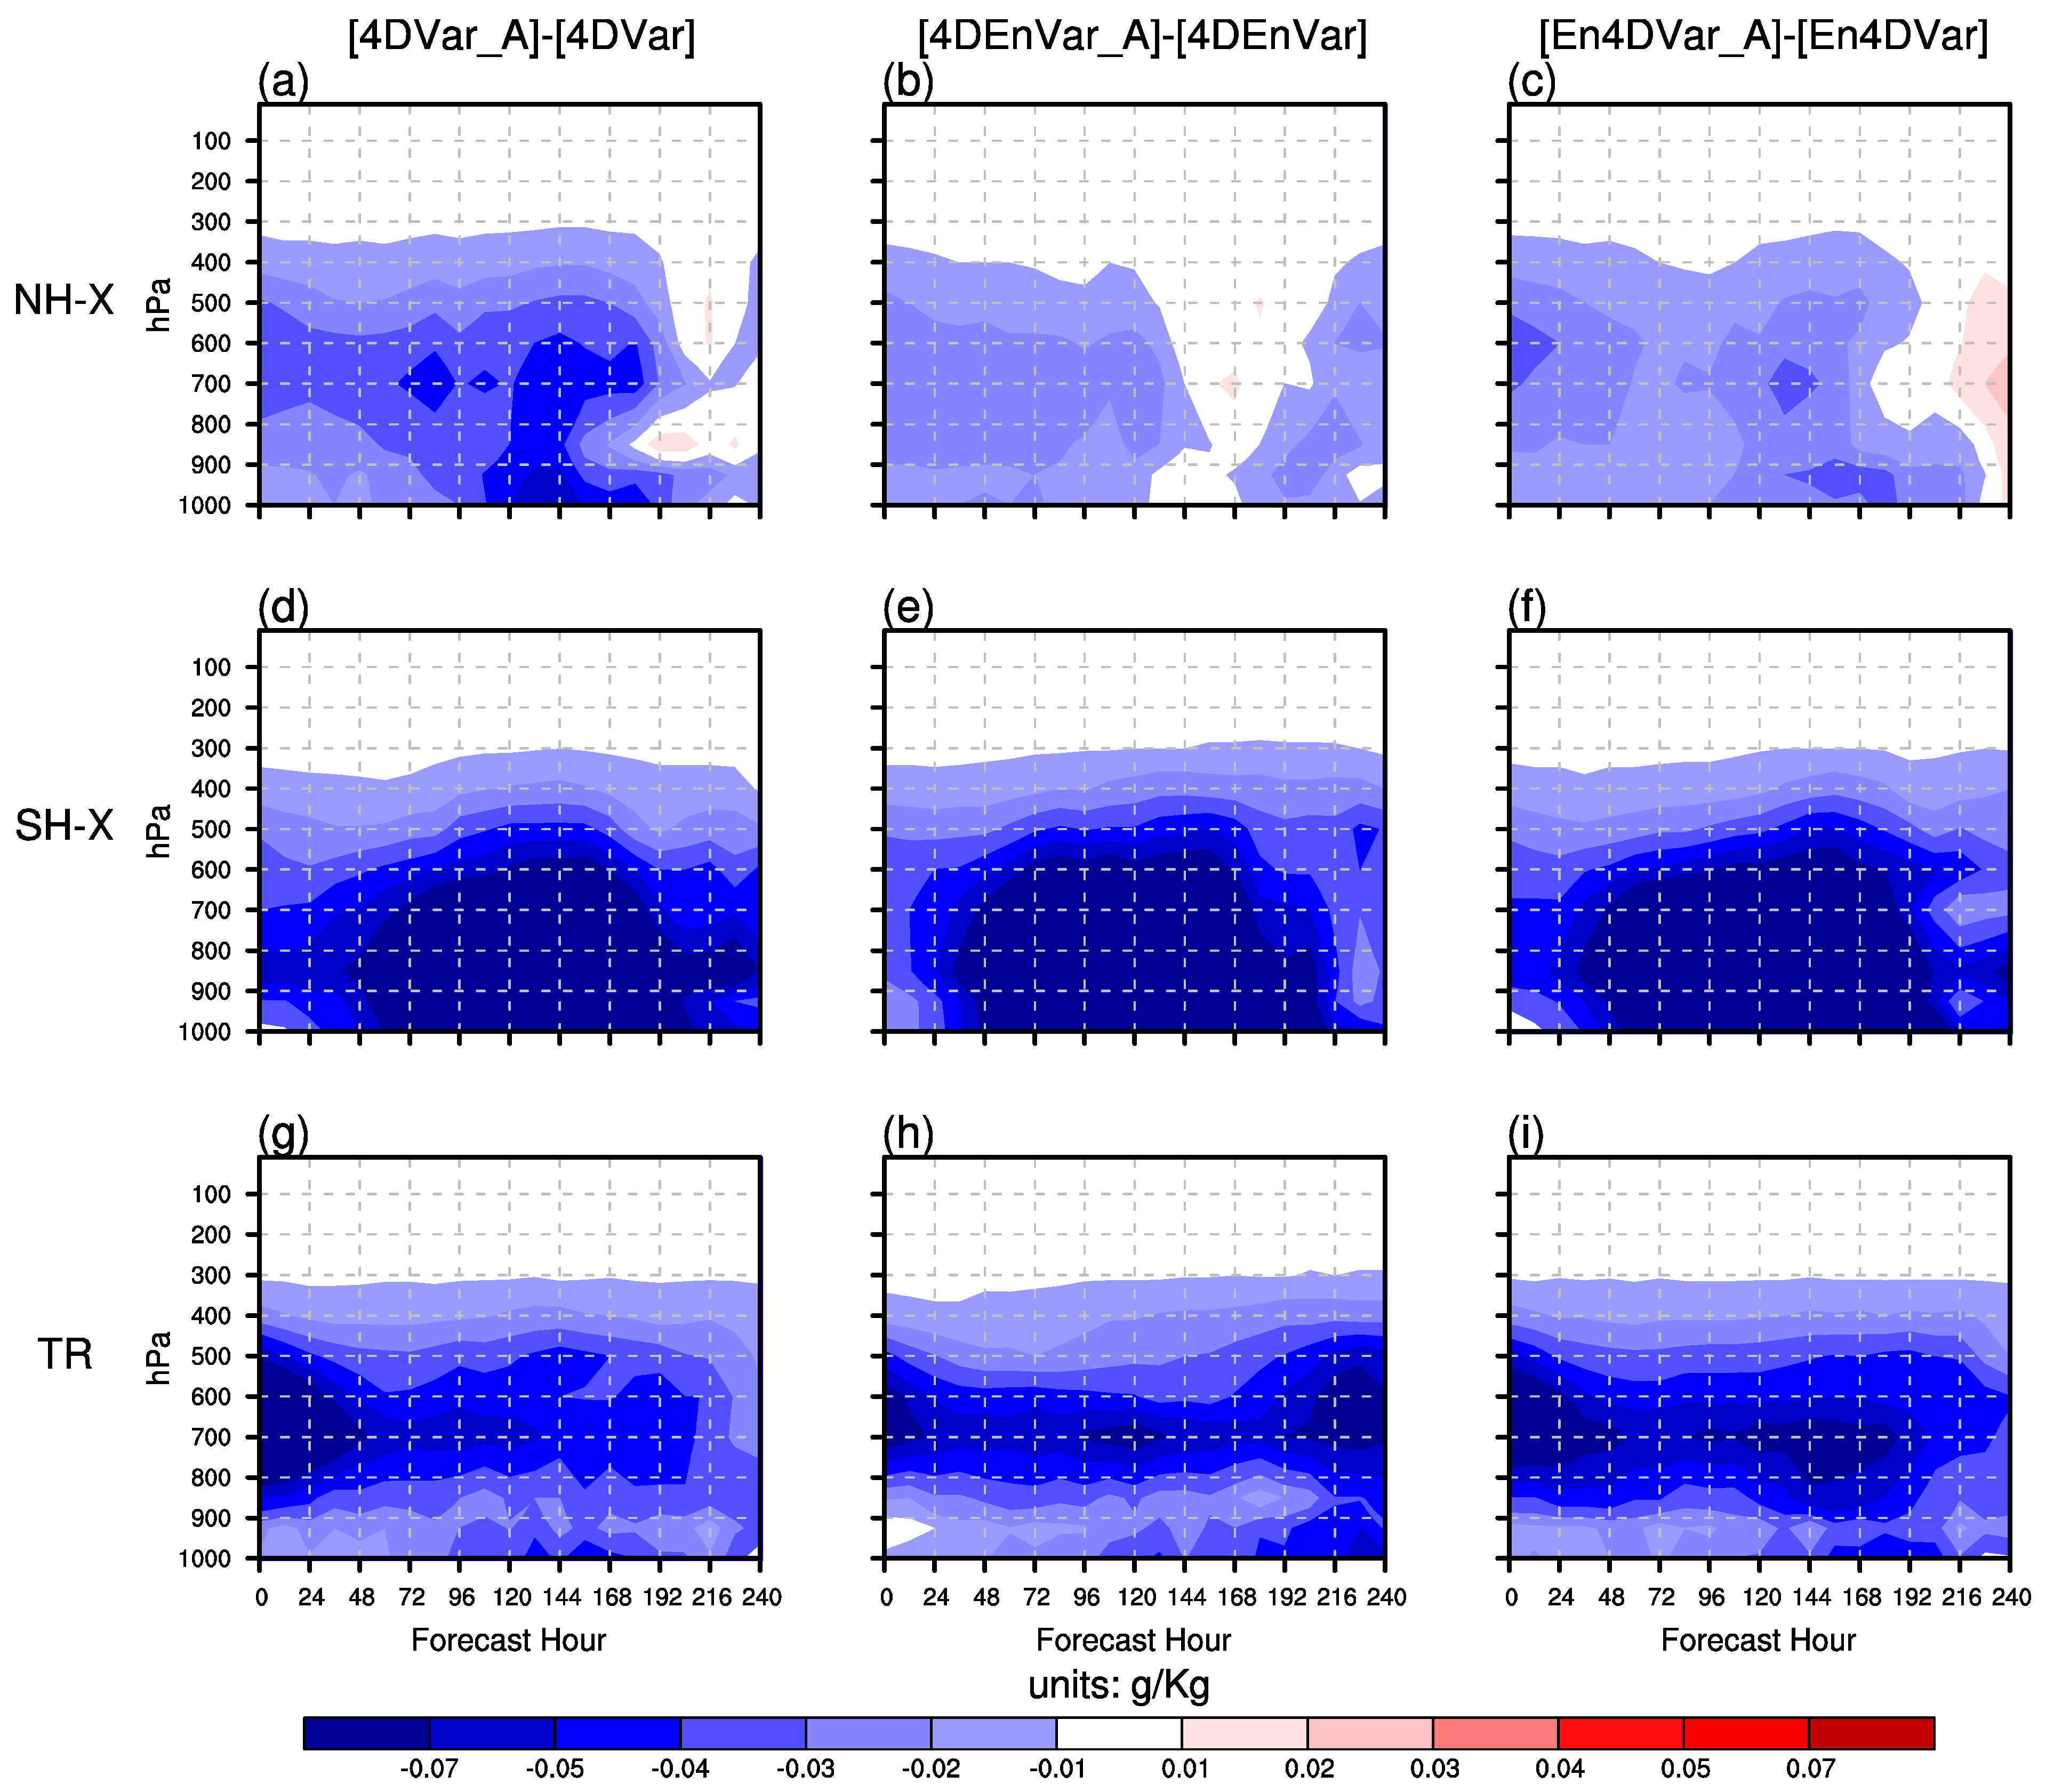
3.3. Effects of AMSU-A Radiance Observations on Forecast Skill

Given that the analysis errors of the DA systems are significantly reduced by adding AMSU-A radiance observations, we next focus on whether the improved analysis could benefit the forecast skill as well.
From the comparisons between the geopotential height forecasts initialized from the analyses with and without including AMSU-A radiance observations in all three DA systems, it can be found that AMSU-A radiance observations can generally reduce the geopotential height forecast errors (Figure 5). The largest improvements are mainly located at the middle and upper layers in the Southern Extratropics, followed by the Northern Extratropics and Tropics, which is consistent with the analysis error distributions (Figure 3). In addition, the improvement of the 4DVar-initialized forecast is more obvious than those of the 4DEnVar- and En4DVar-initialized forecasts in the Northern Extratropics, but comparable in the Southern Extratropics and Tropics.
Figure 6 shows the effects of AMSU-A radiance observations in the En4DVar, 4DVar, and 4DEnVar systems on the zonal wind forecast errors. AMSU-A radiance observations in all these DA systems generally reduces the zonal wind forecast errors. The locations where the 4DVar- and 4DEnVar-initialized zonal wind forecasts are improved or degraded are generally consistent with the geopotential height. However, inconsistently, the En4DVar-initialized zonal wind forecast shows an improvement at the late period in the Northern Extratropics.
Adding AMSU-A radiance observations to all three DA systems also reduces most of the temperature forecast errors, with the largest improvement in the Southern Extratropics (Figure 7). Quite different from the geopotential height and zonal wind, the largest improvements in the temperature forecasts are located in the stratosphere, and middle and lower troposphere in the Southern Extratropics (Figure 7, row 2), consistent with the reduced analysis errors (Figure 3h). In addition, while the 4DVar-initialized forecast shows a persistent improvement in the Northern Extratropics, the 4DEnVar- and En4DVar-initialized forecasts performs neutrally. In contrast, the 4DEnVar and En4DVar systems show larger improvements than 4DVar in the Southern Extratropics and the Tropics. In particular, the En4DVar system shows the largest improvement.
Figure 8 shows the effects of AMSU-A radiance observations in all DA systems on the specific humidity forecasts. Similar to other variables, adding AMSU-A radiance observations steadily improves the specific humidity forecasts of all DA systems except for very few lead days in the Northern Extratropics. The improvement of the 4DVar-initialized forecast is also more significant than those of the 4DEnVar- and En4DVar-initialized forecasts in the Northern Extratropics (Figure 8, row 1). However, different from other variables, the largest improvement in the specific humidity forecasts is mainly distributed in the lower troposphere of the Southern Extratropics (Figure 8, row 2). In addition, there are significant improvements on the first few lead days in the Tropics (Figure 8, row 3), consistent with the regions where analysis errors are significantly reduced (Figure 3l).
Overall, the differences of the 4DVar-initialized forecast performances between assimilating all types of observations and assimilating only conventional observations are statistically significant for almost all lead days in the Southern Extratropics and Tropics and the first few lead days in the Northern Extratropics (Figure 9a). It is encouraging to note that adding AMSU-A radiance observations to the 4DEnVar and En4DVar systems with the weighted average pressure as the vertical coordinates in the observation space localization also has significant positive effects on forecasts. While there are similar improvements in the Southern Extratropics and Tropics for the 4DEnVar- and En4DVar-initialized forecasts, the improvements are less statistically significant than those of the 4DVar-initialized forecast at the last few lead days. In addition, the impacts of AMSU-A observations in the 4DEnVar and En4DVar systems on the medium-range forecasts in the Northern Extratropics are neutral to slightly worse (Figure 9). It is reasonable considering that the 4DVar system uses model space localization, which can simulate close to the true atmospheric state [21,35]. In contrast, the observation space localization may hinder the transfer of some information from the radiance observations.

4. Discussion

This study investigated the effects of incorporating AMSU-A radiance observations on the En4DVar system. Unlike most En4DVar systems that utilize the ensemble covariance produced by the locally solved EnKF class or the ensemble of globally solved 4DVars, this system introduces the ensemble covariance provided by the globally solved 4DEnVar system using an economical observation space localization [26]. To take into account the information of AMSU-A radiance observations at other vertical layers, a weighted average hypsometry was proposed to define the vertical coordinates of radiance observations. The sensitivity experiments indicates that the new hypsometry approach has a wider range of positive effects on the 4DEnVar deterministic forecasts than the traditional peak-based approach.
The impacts of adding AMSU-A radiance observations on the assimilation and forecast performances of the En4DVar system were systematically assessed through 1-month OSSE-based assimilation experiments and its corresponding initialized forecast experiments. The results of the 4DVar and 4DEnVar components are also given as the references for more systematic evaluation of the En4DVar system in assimilating radiance observations. The analyses of all three DA systems benefit from AMSU-A observations, especially in the Southern Extratropics, where conventional observations are sparsely distributed. It is encouraging that the 4DEnVar system using observation space localization improved the analyses on the upper layers of the Northern and Southern Extratropics more significantly than the 4DVar system using model space localization. The improvement in the En4DVar analyses is generally between those of the standalone 4DVar and 4DEnVar components. In terms of ACC and ARMSE, three DA systems further improved the forecasts when adding AMSU-A radiance observations to the ICs. There is a steady improvement in the Southern Extratropics and Tropics, but the impact on the later lead days in the Northern Extratropics is neutral or even slightly negative. In the Northern Extratropics, the improvement of forecast by 4DVar is more significant than by 4DEnVar and En4DVar.
Future improvements in the assimilation of radiance observations based on the En4DVar system will focus on increasing the types of observations and adjusting the filtering radius of localization. In order to further improve the analysis quality, the En4DVar system needs to continue adding more radiance observations with complex multi-peak distribution weighting functions such as those from AMSU-B instruments. In addition, the broad satellite channel weighting function has a significant influence on the filtering radius of localization, and too larger or too small filtering radius will limit the assimilation performance. More flexible and adaptive localization techniques need to be developed for satellite DA with localization in observation space.
Moreover, although encouraging results were obtained using observation space localization method in assimilating AMSU-A observations with a single-peak distribution of weighting function, model space localization has proven to be more beneficial for assimilating radiance observations [21,35]. Therefore, future attempts will also be made to develop efficient model space localization method for the ensemble component of the En4DVar system, in order to obtain better results when assimilating radiance observations with complex multi-peak distribution weighting functions.

Author Contributions

Conceptualization, S.Z. and B.W.; writing—original draft preparation, S.Z.; writing—review and editing, S.Z., B.W., L.Z., J.L., Y.L., J.G., S.X., Y.W., W.H., L.L., Y.H., X.W., B.Z. and F.C. All authors have read and agreed to the published version of the manuscript.

Funding

This research was funded by the National Key Research and Development Program of China (2018YFC1506703) and the Innovation Group Project of Southern Marine Science and Engineering Guangdong Laboratory (Zhuhai) (No. 311022006).

Data Availability Statement

The observations were supported by the Global Telecommunications System (https://public.wmo.int/en/programmes/global-telecommunication-system accessed on 1 February 2021). The ERA-5 reanalysis and the ERA-Interim 6 h forecast are available at https://apps.ecmwf.int/data-catalogues/era5/?class=ea&stream=oper&expver=1&type=an accessed on 1 February 2021 and https://apps.ecmwf.int/datasets/data/interim-full-daily/levtype=sfc/ accessed on 1 February 2021. All data used in this study are available from the authors upon request.

Acknowledgments

The assimilation and forecast experiments were performed on the high-performance computer PI-SUGON of the China Meteorological Administration.

Conflicts of Interest

The authors declare no conflict of interest.

References

  1. Raynaud, L.; Berre, L.; Desroziers, G. An extended specification of flow-dependent background error variances in the Météo-France global 4D-Var system. Q. J. R. Meteorol. Soc. 2011, 137, 607–619. [Google Scholar] [CrossRef]
  2. Bonavita, M.; Isaksen, L.; Hólm, E. On the use of EDA background error variances in the ECMWF 4D-Var. Q. J. R. Meteorol. Soc. 2012, 138, 1540–1559. [Google Scholar] [CrossRef]
  3. Bonavita, M.; Hólm, E.; Isaksen, L.; Fisher, M. The evolution of the ECMWF hybrid data assimilation system. Q. J. R. Meteorol. Soc. 2016, 142, 287–303. [Google Scholar] [CrossRef]
  4. Clayton, A.M.; Lorenc, A.C.; Barker, D.M. Operational implementation of a hybrid ensemble/4D-Var global data assimilation system at the Met Office. Q. J. R. Meteorol. Soc. 2013, 139, 1445–1461. [Google Scholar] [CrossRef]
  5. Lorenc, A.C.; Bowler, N.E.; Clayton, A.M.; Pring, S.R.; Fairbairn, D. Comparison of hybrid-4DEnVar and hybrid-4DVar data assimilation methods for global NWP. Mon. Weather Rev. 2015, 143, 212–229. [Google Scholar] [CrossRef]
  6. Houtekamer, P.L.; Mitchell, H.L. Data assimilation using an ensemble Kalman filter technique. Mon. Weather Rev. 1998, 126, 796–811. [Google Scholar] [CrossRef]
  7. Anderson, J.L. Exploring the need for localization in ensemble data assimilation using a hierarchical ensemble filter. Phys. D Nonlinear Phenom. 2007, 230, 99–111. [Google Scholar] [CrossRef]
  8. Liu, C.; Xiao, Q.; Wang, B. An ensemble-based four-dimensional variational data assimilation scheme. Part II: Observing system simulation experiments with Advanced Research WRF (ARW). Mon. Weather Rev. 2009, 137, 1687–1704. [Google Scholar] [CrossRef]
  9. Hamill, T.M.; Whitaker, J.S.; Snyder, C. Distance-dependent filtering of background error covariance estimates in an ensemble Kalman filter. Mon. Weather Rev. 2001, 129, 2776–2790. [Google Scholar] [CrossRef]
  10. Wang, B.; Liu, J.; Liu, L.; Xu, S.; Huang, W. An approach to localization for ensemble-based data assimilation. PLoS ONE 2018, 13, e0191088. [Google Scholar] [CrossRef] [Green Version]
  11. Houtekamer, P.L.; Mitchell, H.L.; Pellerin, G.; Buehner, M.; Charron, M.; Spacek, L.; Hansen, B. Atmospheric data assimilation with an ensemble Kalman filter: Results with real observations. Mon. Weather Rev. 2005, 133, 604–620. [Google Scholar] [CrossRef] [Green Version]
  12. Gaspari, G.; Cohn, S.E. Construction of correlation functions in two and three dimensions. Q. J. R. Meteorol. Soc. 1999, 125, 723–757. [Google Scholar] [CrossRef]
  13. Ott, E.; Hunt, B.R.; Szunyogh, I.; Zimin, A.V.; Kostelich, E.J.; Corazza, M.; Kalnay, E.; Patil, D.J.; Yorke, J.A. A local ensemble Kalman filter for atmospheric data assimilation. Tellus A Dyn. Meteorol. Oceanogr. 2004, 56, 415–428. [Google Scholar] [CrossRef]
  14. Buehner, M.; Houtekamer, P.L.; Charette, C.; Mitchell, H.L.; He, B. Intercomparison of variational data assimilation and the ensemble Kalman filter for global deterministic NWP. Part I: Description and single-observation experiments. Mon. Weather Rev. 2010, 138, 1550–1566. [Google Scholar] [CrossRef]
  15. Buehner, M.; Houtekamer, P.L.; Charette, C.; Mitchell, H.L.; He, B. Intercomparison of variational data assimilation and the ensemble Kalman filter for global deterministic NWP. Part II: One-month experiments with real observations. Mon. Weather Rev. 2010, 138, 1567–1586. [Google Scholar] [CrossRef]
  16. Bishop, C.H.; Hodyss, D.; Steinle, P.; Sims, H.; Clayton, A.M.; Lorenc, A.C.; Barker, D.M.; Buehner, M. Efficient ensemble covariance localization in variational data assimilation. Mon. Weather Rev. 2011, 139, 573–580. [Google Scholar] [CrossRef]
  17. Kuhl, D.D.; Rosmond, T.E.; Bishop, C.H.; McLay, J.; Baker, N.L. Comparison of hybrid ensemble/4DVar and 4DVar within the NAVDAS-AR data assimilation framework. Mon. Weather Rev. 2013, 141, 2740–2758. [Google Scholar] [CrossRef]
  18. Simmons, A.J.; Hollingsworth, A. Some aspects of the improvement in skill of numerical weather prediction. Q. J. R. Meteorol. Soc. A J. Atmos. Sci. Appl. Meteorol. Phys. Oceanogr. 2002, 128, 647–677. [Google Scholar] [CrossRef]
  19. Fertig, E.J.; Hunt, B.R.; Ott, E.; Szunyogh, I. Assimilating non-local observations with a local ensemble Kalman filter. Tellus A Dyn. Meteorol. Oceanogr. 2007, 59, 719–730. [Google Scholar] [CrossRef]
  20. Miyoshi, T.; Sato, Y. Assimilating satellite radiances with a local ensemble transform Kalman filter (LETKF) applied to the JMA global model (GSM). Sola 2007, 3, 37–40. [Google Scholar] [CrossRef] [Green Version]
  21. Campbell, W.F.; Bishop, C.H.; Hodyss, D. Vertical covariance localization for satellite radiances in ensemble Kalman filters. Mon. Weather Rev. 2010, 138, 282–290. [Google Scholar] [CrossRef] [Green Version]
  22. Courtier, P.; Thépaut, J.N.; Hollingsworth, A. A strategy for operational implementation of 4D-Var, using an incremental approach. Q. J. R. Meteorol. Soc. 1994, 120, 1367–1387. [Google Scholar] [CrossRef]
  23. Zhang, L.; Liu, Y.; Liu, Y.; Gong, J.; Lu, H.; Jin, Z.; Tian, W.; Liu, G.; Zhou, B.; Zhao, B. The operational global four-dimensional variational data assimilation system at the China Meteorological Administration. Q. J. R. Meteorol. Soc. 2019, 145, 1882–1896. [Google Scholar] [CrossRef] [Green Version]
  24. Zhu, S.; Wang, B.; Zhang, L.; Liu, J.; Liu, Y.; Gong, J.; Xu, S.; Wang, Y.; Huang, W.; Liu, L.; et al. A Four-Dimensional Ensemble-Variational (4DEnVar) Data Assimilation System Based on GRAPES-GFS: System Description and Primary Tests. J. Adv. Model. Earth Syst. 2022, 14, e2021MS002737. [Google Scholar] [CrossRef]
  25. Wang, B.; Liu, J.; Wang, S.; Cheng, W.; Juan, L.; Liu, C.; Xiao, Q.; Kuo, Y.-H. An economical approach to four-dimensional variational data assimilation. Adv. Atmos. Sci. 2010, 27, 715–727. [Google Scholar] [CrossRef] [Green Version]
  26. Zhu, S.; Wang, B.; Zhang, L.; Liu, J.; Liu, Y.; Gong, J.; Xu, S.; Wang, Y.; Huang, W.; Liu, L.; et al. A 4DEnVar-Based Ensemble Four-Dimensional Variational (En4DVar) Hybrid Data Assimilation System for Global NWP: System Description and Primary Tests. J. Adv. Model. Earth Syst. 2022, 14, e2022MS003023. [Google Scholar] [CrossRef]
  27. Lorenc, A.C. The potential of the ensemble Kalman filter for NWP—A comparison with 4D-Var. Q. J. R. Meteorol. Soc. A J. Atmos. Sci. Appl. Meteorol. Phys. Oceanogr. 2003, 129, 3183–3203. [Google Scholar] [CrossRef]
  28. Su, Y.; Shen, X.S.; Zhang, H.L.; Liu, Y.Z. A study on the three-dimensional reference atmosphere in GRAPES_GFS: Constructive reference state and real forecast experiment. Acta Meteorol. Sin. 2020, 78, 962–971. [Google Scholar]
  29. Barker, D.M. Southern high-latitude ensemble data assimilation in the Antarctic Mesoscale Prediction System. Mon. Weather Rev. 2005, 133, 3431–3449. [Google Scholar] [CrossRef]
  30. Wang, X.; Barker, D.M.; Snyder, C.; Hamill, T.M. A hybrid ETKF–3DVAR data assimilation scheme for the WRF model. Part I: Observing system simulation experiment. Mon. Weather Rev. 2008, 136, 5116–5131. [Google Scholar] [CrossRef] [Green Version]
  31. Kleist, D.T.; Ide, K. An OSSE-based evaluation of hybrid variational–ensemble data assimilation for the NCEP GFS. Part I: System description and 3D-hybrid results. Mon. Weather Rev. 2015, 143, 433–451. [Google Scholar] [CrossRef]
  32. Kleist, D.T.; Ide, K. An OSSE-based evaluation of hybrid variational–ensemble data assimilation for the NCEP GFS. Part II: 4DEnVar and hybrid variants. Mon. Weather Rev. 2015, 143, 452–470. [Google Scholar] [CrossRef] [Green Version]
  33. Saunders, R.; Hocking, J.; Turner, E.; Rayer, P.; Rundle, D.; Brunel, P.; Vidot, J.; Roquet, P.; Matricardi, M.; Geer, A.; et al. An update on the RTTOV fast radiative transfer model (currently at version 12). Geosci. Model Dev. 2018, 11, 2717–2737. [Google Scholar] [CrossRef] [Green Version]
  34. He, Y.; Wang, B.; Liu, L.; Huang, W.; Xu, S.; Liu, J.; Wang, Y.; Li, L.; Huang, X.; Peng, Y.; et al. A DRP-4DVar-based coupled data assimilation system with a simplified off-line localization technique for decadal predictions. J. Adv. Model. Earth Syst. 2020, 12, e2019MS001768. [Google Scholar] [CrossRef]
  35. Lei, L.; Whitaker, J.S.; Bishop, C. Improving assimilation of radiance observations by implementing model space localization in an ensemble Kalman filter. J. Adv. Model. Earth Syst. 2018, 10, 3221–3232. [Google Scholar] [CrossRef] [Green Version]
Figure 1. Spatial distribution of (a) conventional and (b) AMSU-A radiance observations valid during 0900–1500 UTC on 13 September 2016. The brown dots represent sounding observations, the blue dots represent cloud-derived wind observations, and the purple dots represent AMSU-A radiance observations.
Remotesensing 15 03476 g001
Figure 2. The scorecards of the 4DEnVar-initialized geopotential height (GZ), temperature (T), zonal wind (U) and meridional wind (V) forecasts assimilating all types of observations with (a) the pressure at peak weight and (b) the weighted average pressure as the vertical coordinates of AMSU-A radiance observations against those assimilating only conventional observations. The filling size of the triangle shows the difference significance of anomaly correlation coefficient (ACC) or anomaly root mean square error (ARMSE) between the evaluated and reference forecasts. The largest filling size represents very significant difference, and the other two decreasing filling sizes represent significant and insignificant differences. The green upward-pointing (purple downward-pointing) triangles are plotted if the evaluated forecast is better (worse) than the reference forecast. No triangles indicate equivalent.
Remotesensing 15 03476 g002
Figure 3. The anomaly root mean square error (ARMSE) differences between the analyses of assimilating all types of observations and those of assimilating only conventional observations by the 4DVar (black), 4DEnVar (red) and En4DVar (blue) systems in the Northern Extratropics (left column), Southern Extratropics (middle column) and Tropics (right column). The results of geopotential height (GZ; units: gpm), zonal wind (U; units: m/s), temperature (T; units: K) and specific humidity (Q; units: g/Kg) are ploted in rows 1–4, respectively. The green line denotes zero.
Remotesensing 15 03476 g003
Figure 4. The zonally averaged anomaly root mean square error (ARMSE) differences between assimilating all types of observations and assimilating only conventional observations for the 4DVar (left column), 4DEnVar (middle column) and En4DVar (left column) analyses. The results of geopotential height (GZ; units: gpm), zonal wind (U; units: m/s), temperature (T; units: K) and specific humidity (Q; units: g/Kg) are ploted in rows 1–4, respectively.
Remotesensing 15 03476 g004
Figure 5. The time-variation of the anomaly root mean square error (ARMSE) differences between assimilating all types of observations and assimilating only conventional observations for the geopotential height forecasts (units: gpm) initialized by the 4DVar (left column), 4DEnVar (middle column), and En4DVar (right column) systems. The results in the Northern Extratropics, Southern Extratropics and Tropics are ploted in rows 1–3, respectively.
Remotesensing 15 03476 g005
Figure 6. Same as Figure 5, except the zonal wind forecasts (units: m/s).
Remotesensing 15 03476 g006
Figure 7. Same as Figure 5, except the temperature forecasts (units: K).
Remotesensing 15 03476 g007
Figure 8. Same as Figure 5, except the specific humidity forecasts (units: g/kg).
Remotesensing 15 03476 g008
Figure 9. Same as Figure 2, except the forecasts assimilating all types of observations against assimilating only conventional observations initialized by the (a) 4DVar, (b) 4DEnVar and (c) En4DVar systems, respectively.
Remotesensing 15 03476 g009
Disclaimer/Publisher’s Note: The statements, opinions and data contained in all publications are solely those of the individual author(s) and contributor(s) and not of MDPI and/or the editor(s). MDPI and/or the editor(s) disclaim responsibility for any injury to people or property resulting from any ideas, methods, instructions or products referred to in the content.

