
Applying Reconstructed Daily Water Storage and Modified Wetness Index to Flood Monitoring: A Case Study in the Yangtze River Basin

 , ,
, ,
Abstract
:1. Introduction
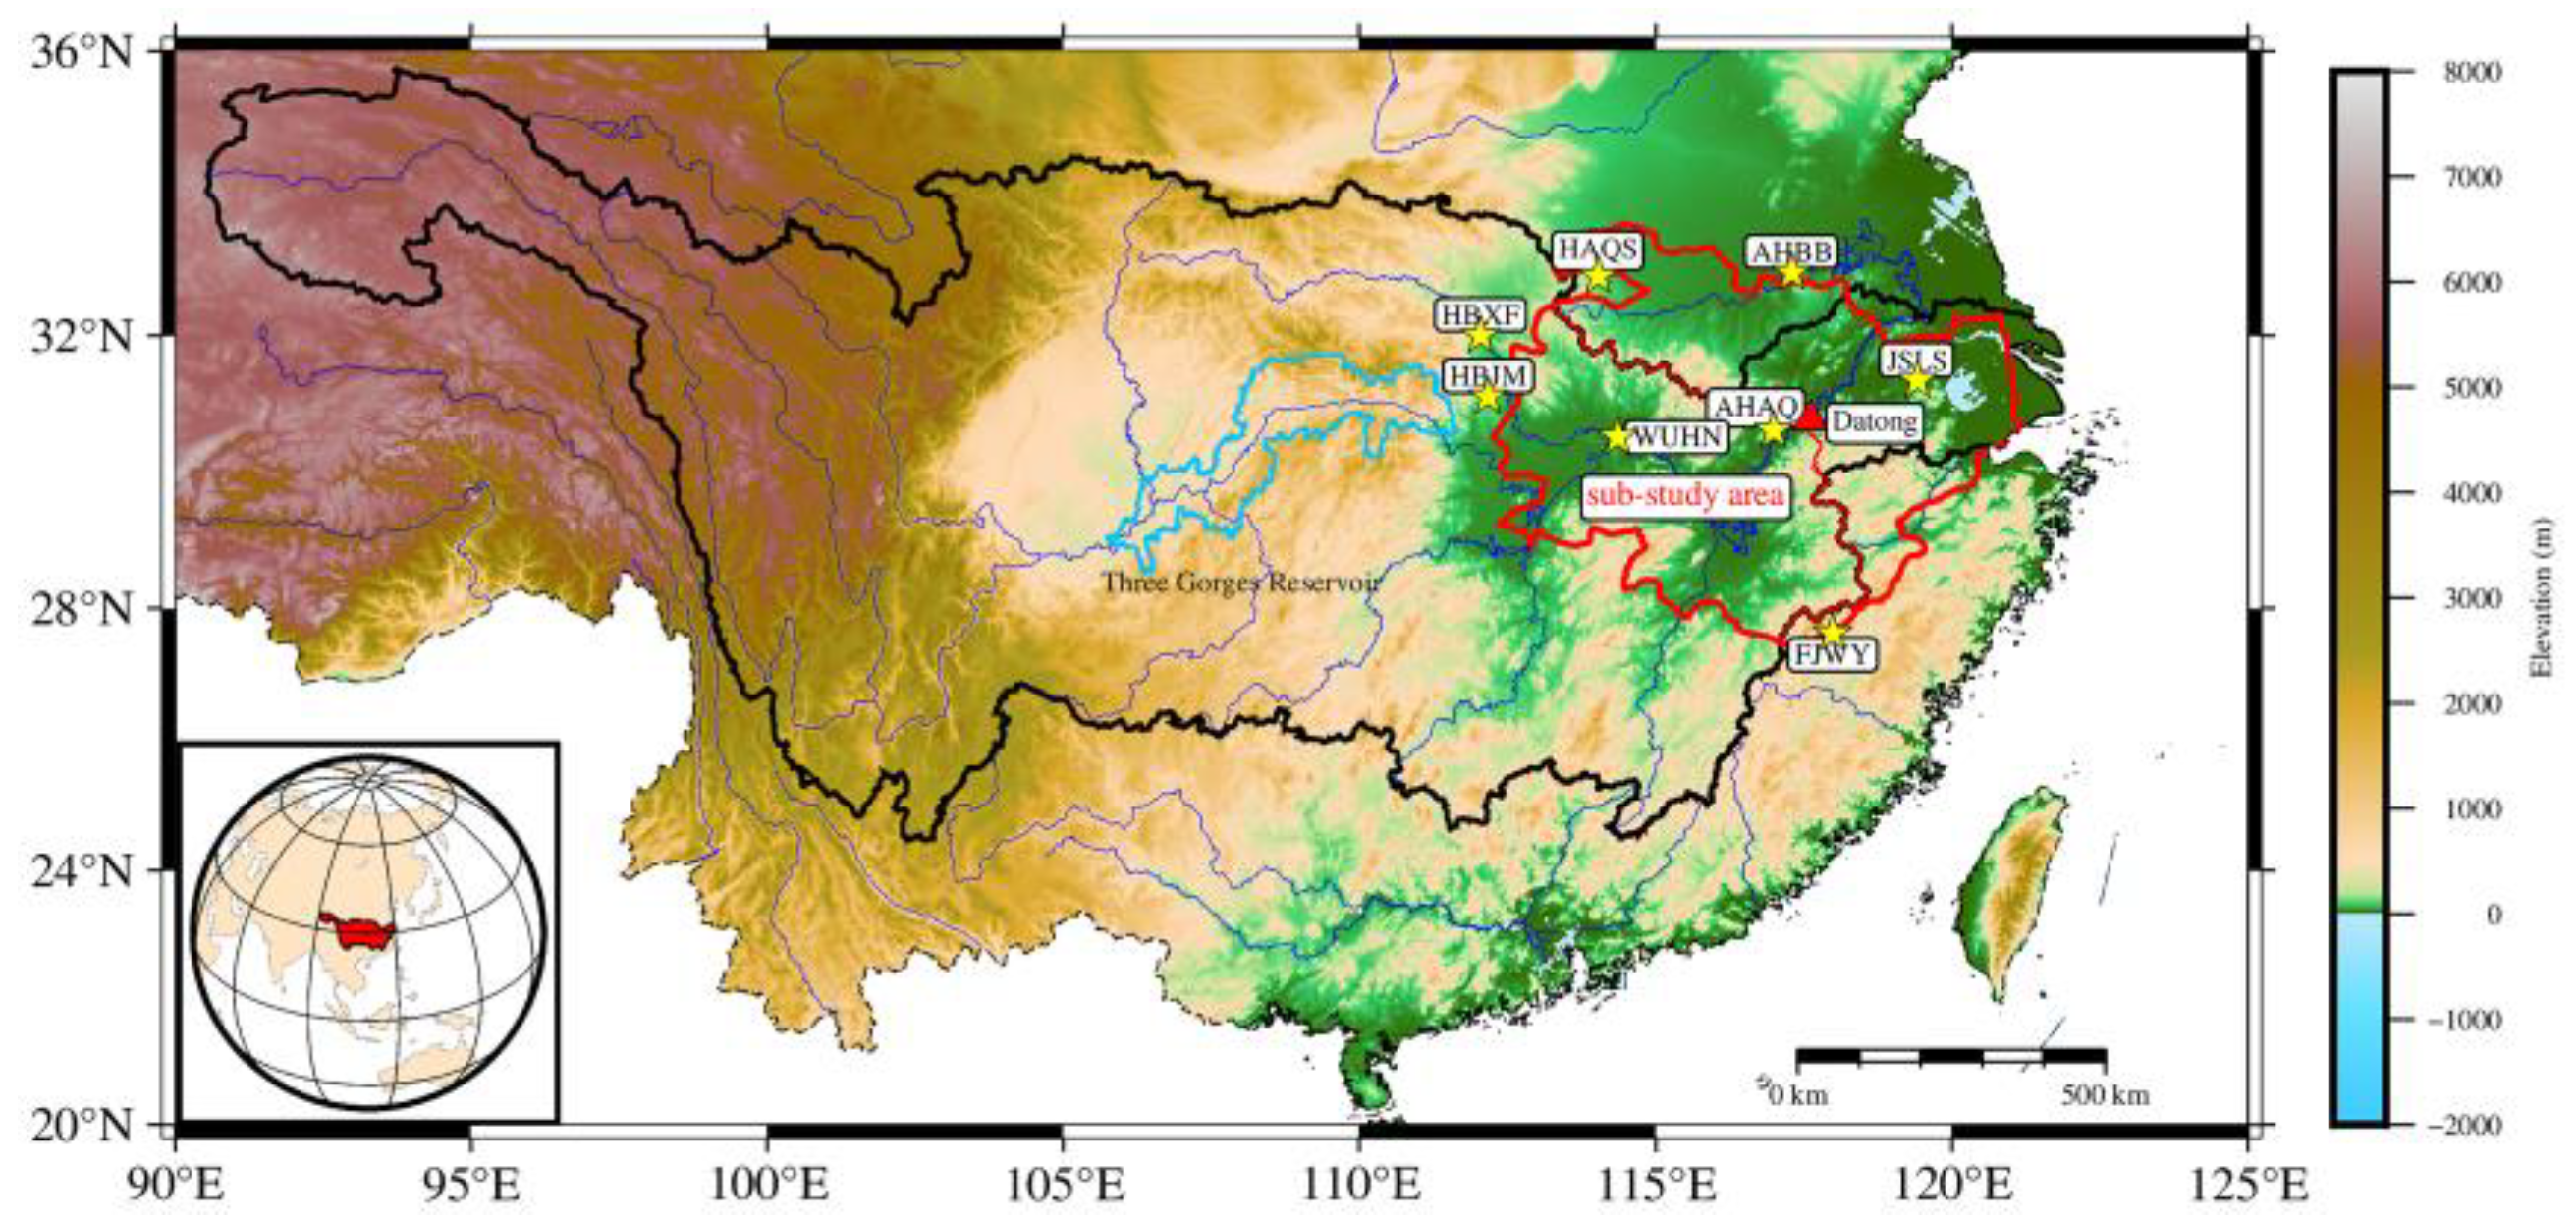
2. Study Region
3. Materials and Methods
3.1. GRACE Data
3.2. Precipitation, Temperature, and Soil Moisture Data
3.2.1. CLDAS-V2.0
3.2.2. CGDPA Data
3.2.3. CN05.1
3.3. GNSS Observations
3.4. Streamflow Data
3.5. Methods
3.5.1. Daily TWSA Reconstruction
3.5.2. Calculation of MWI
3.5.3. Calculation of NDFPI
4. Results
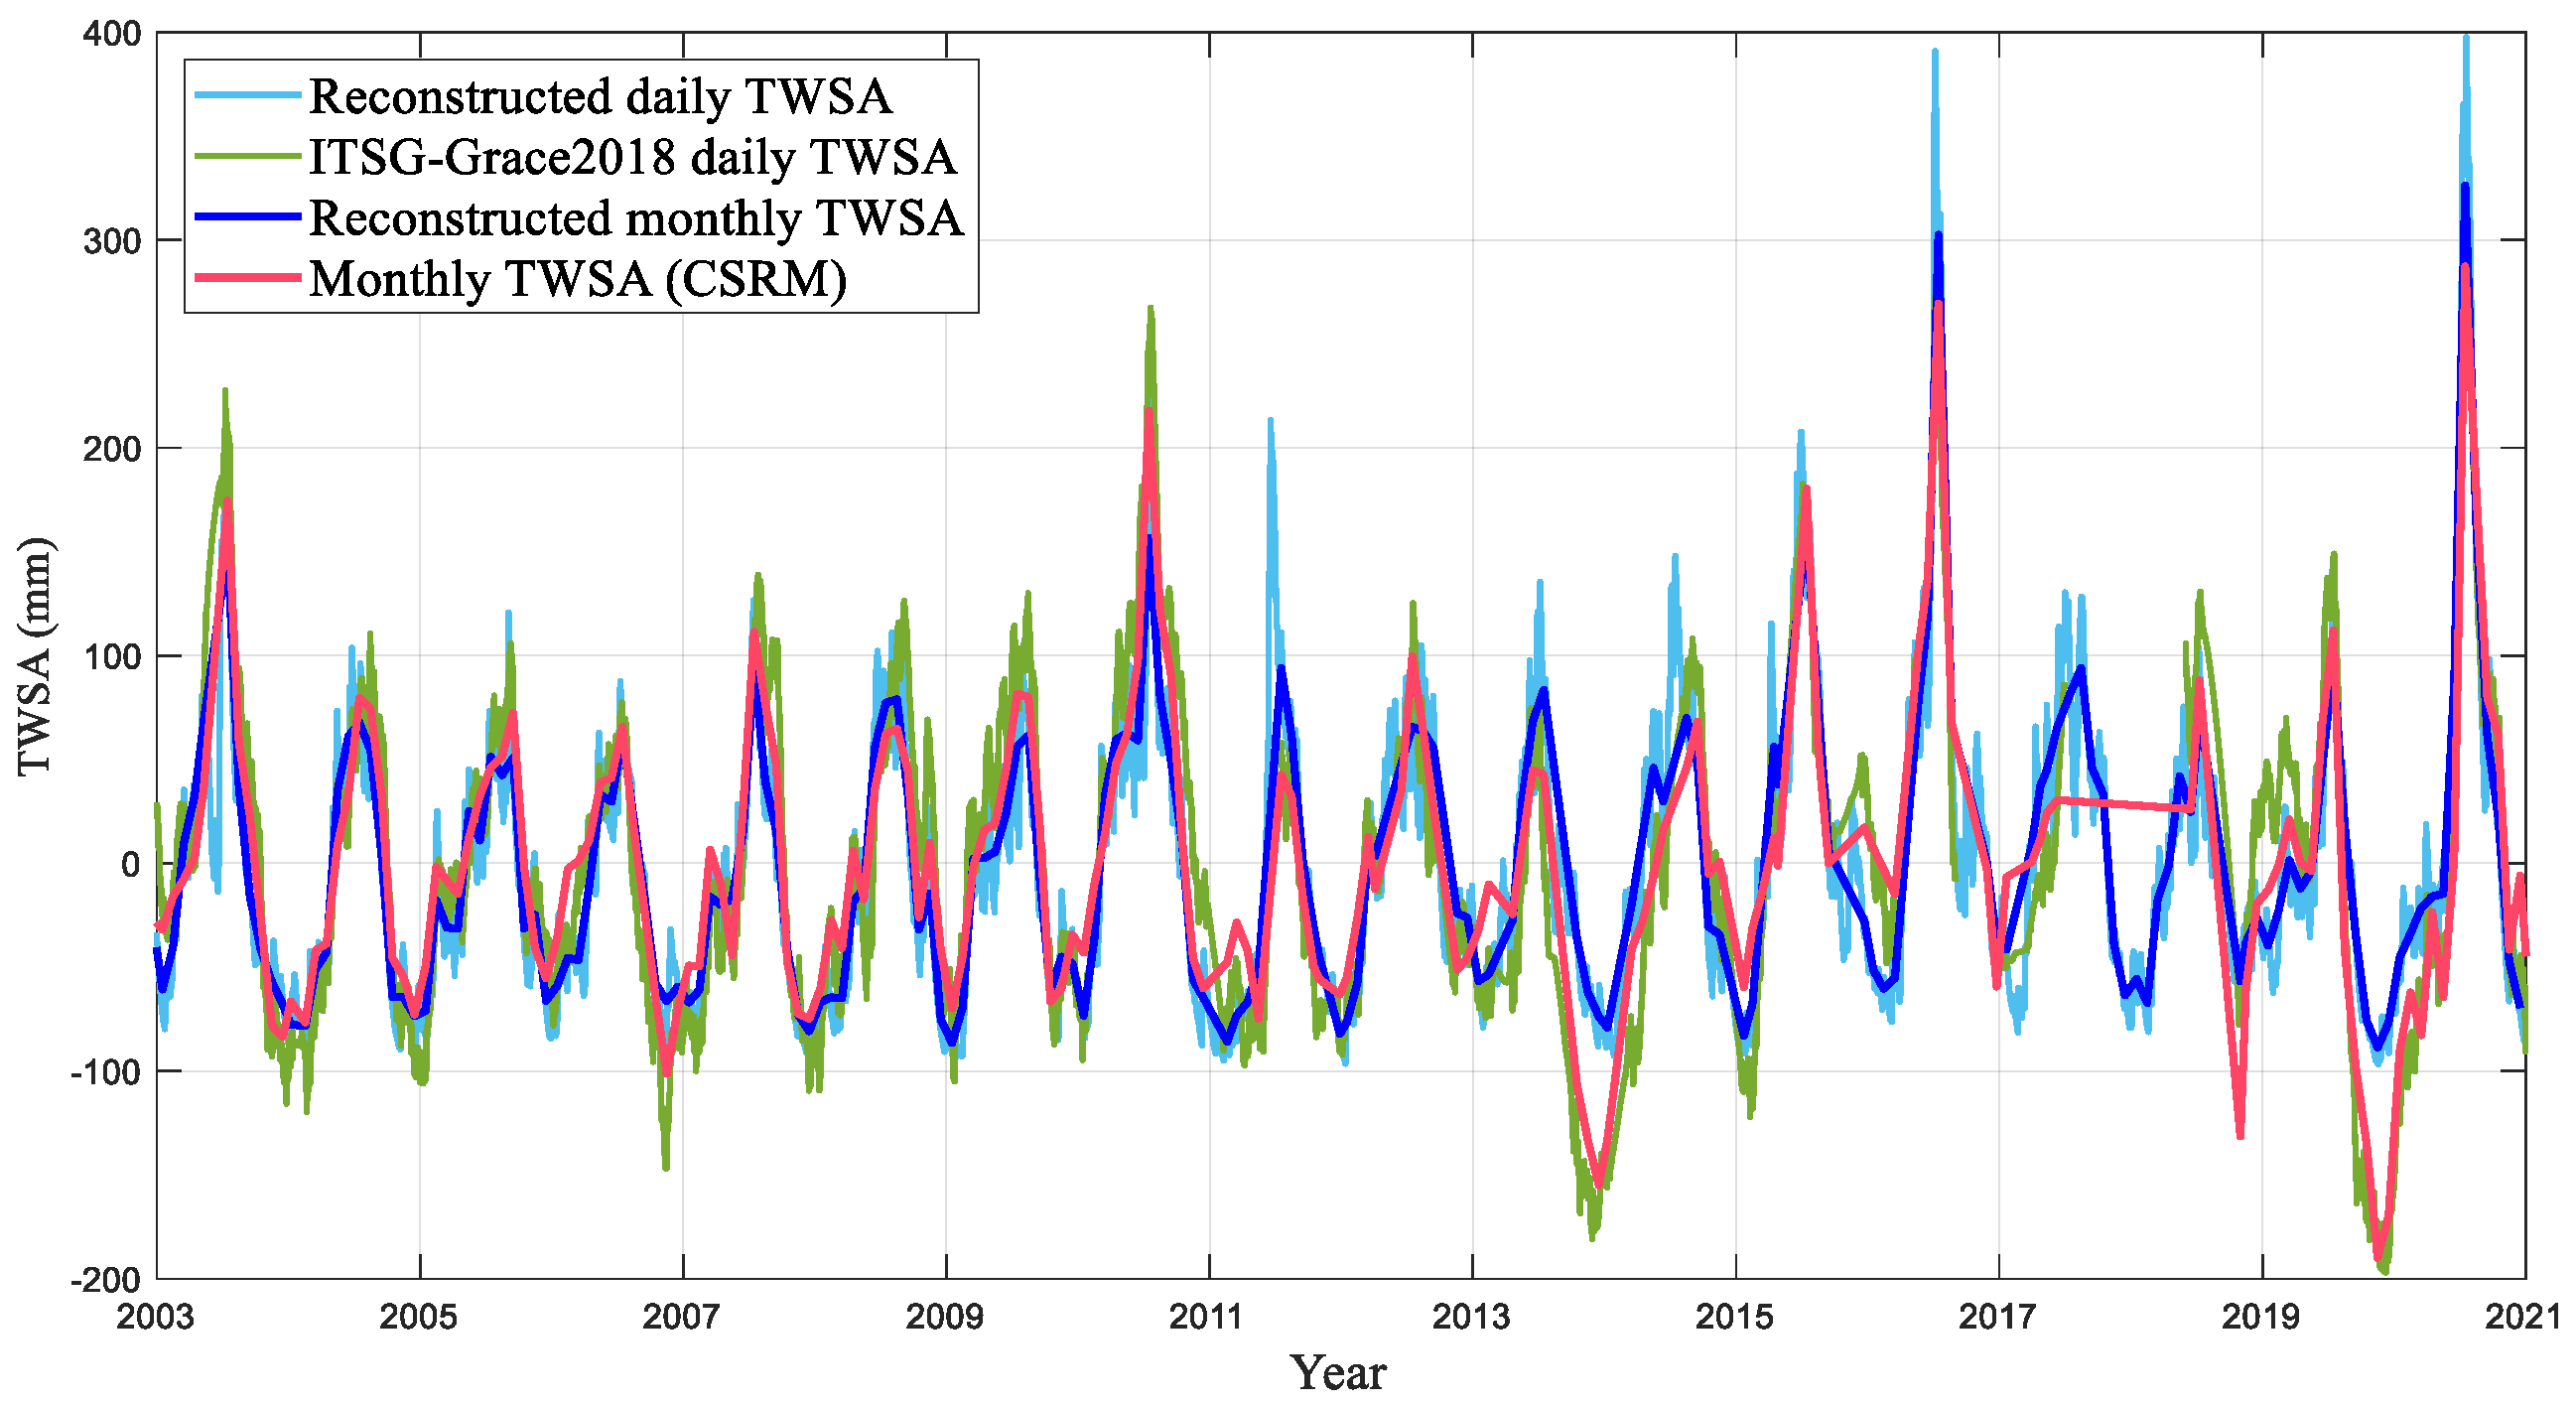
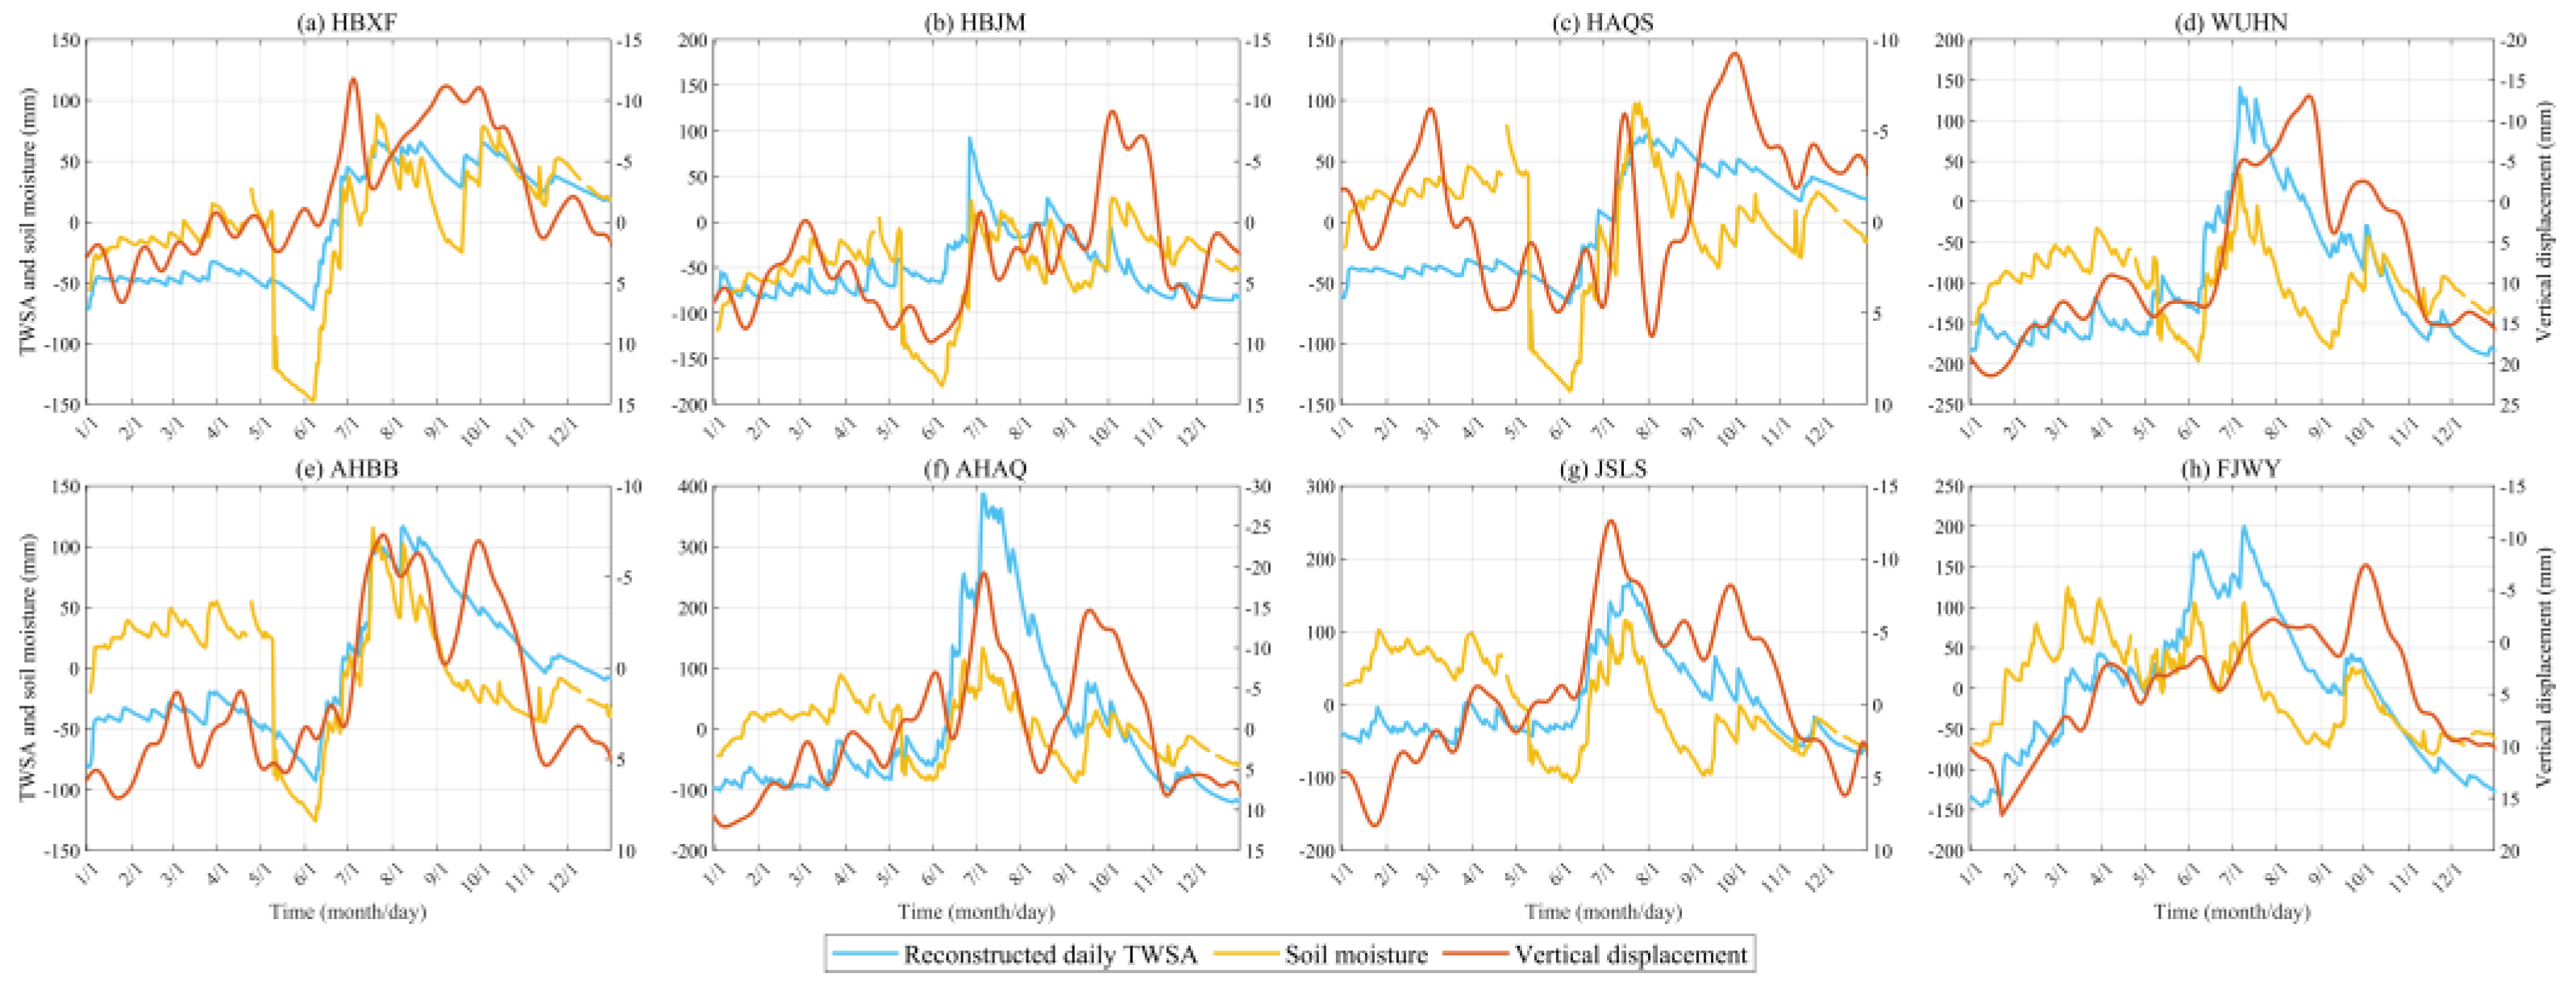
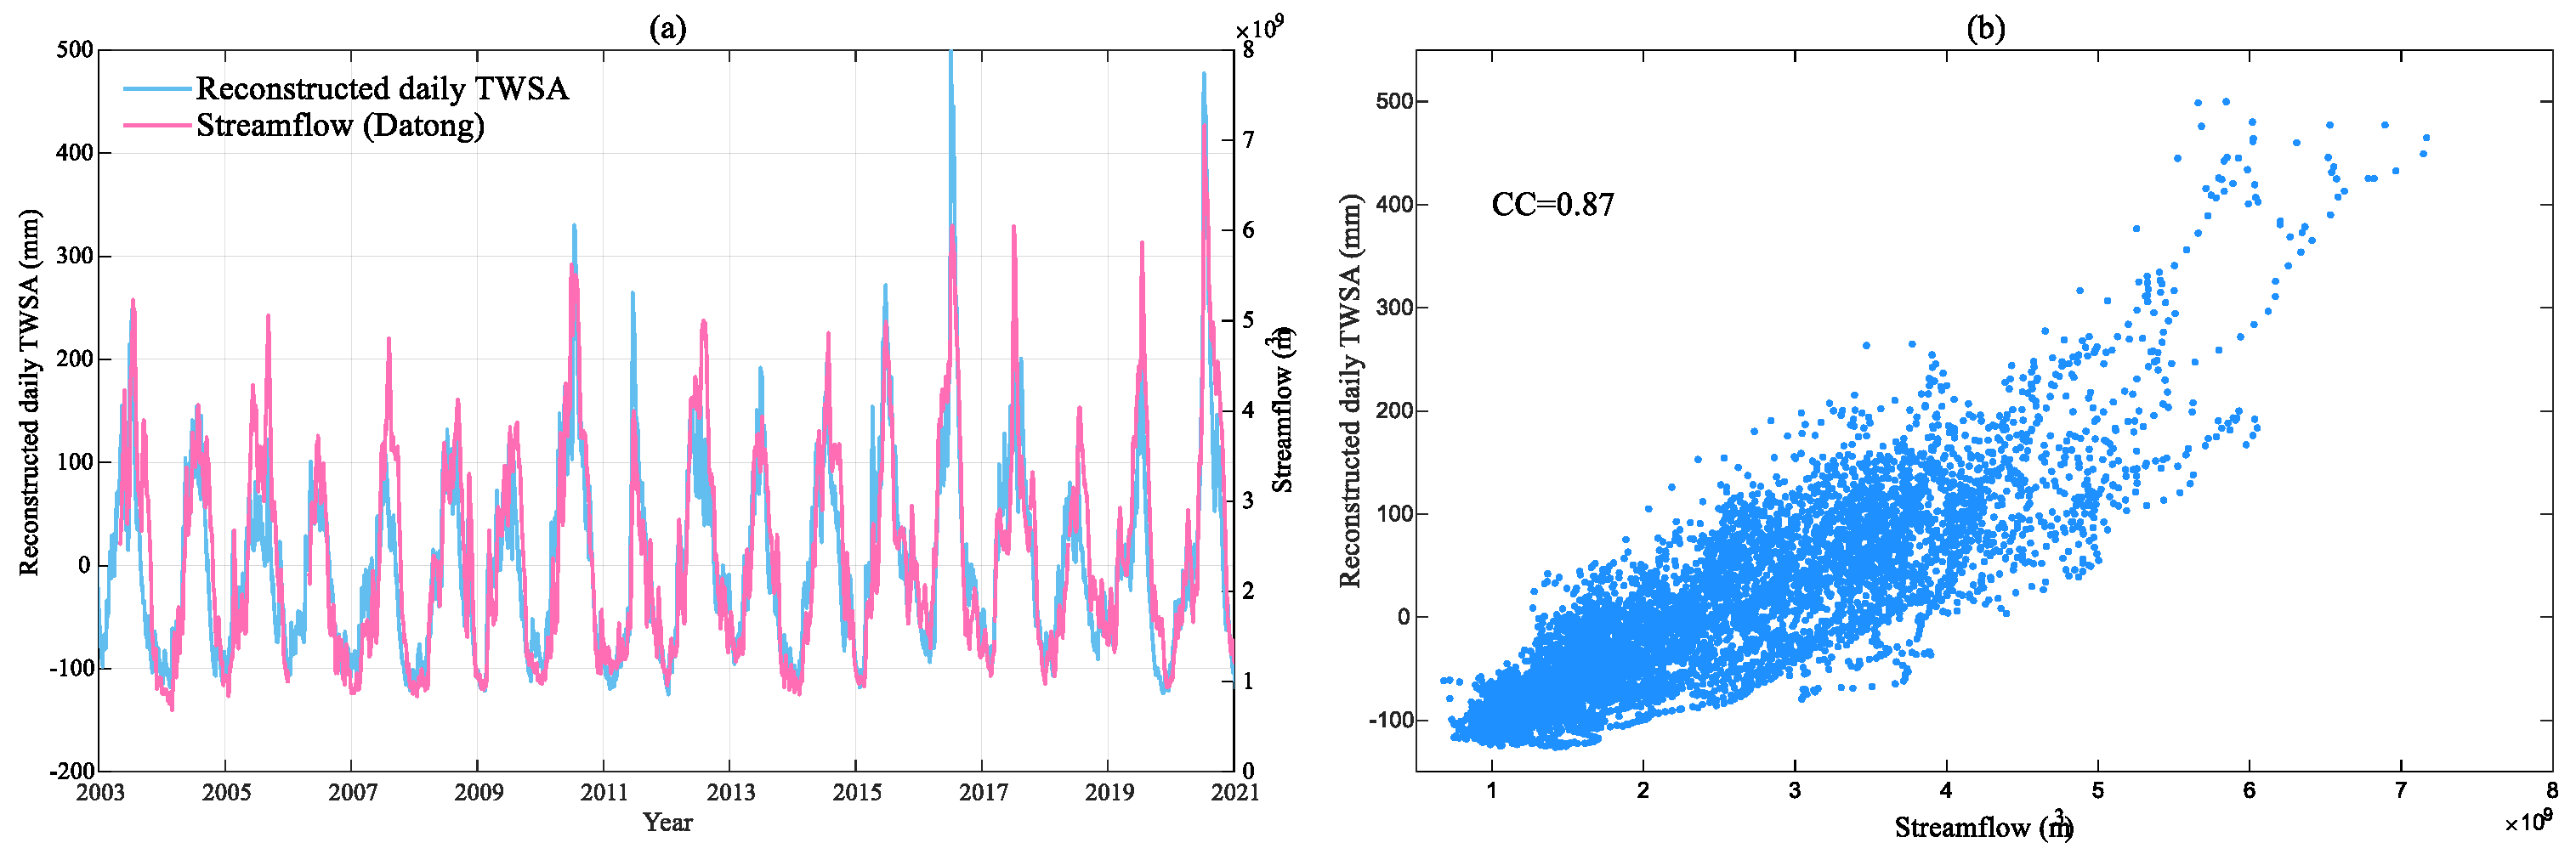
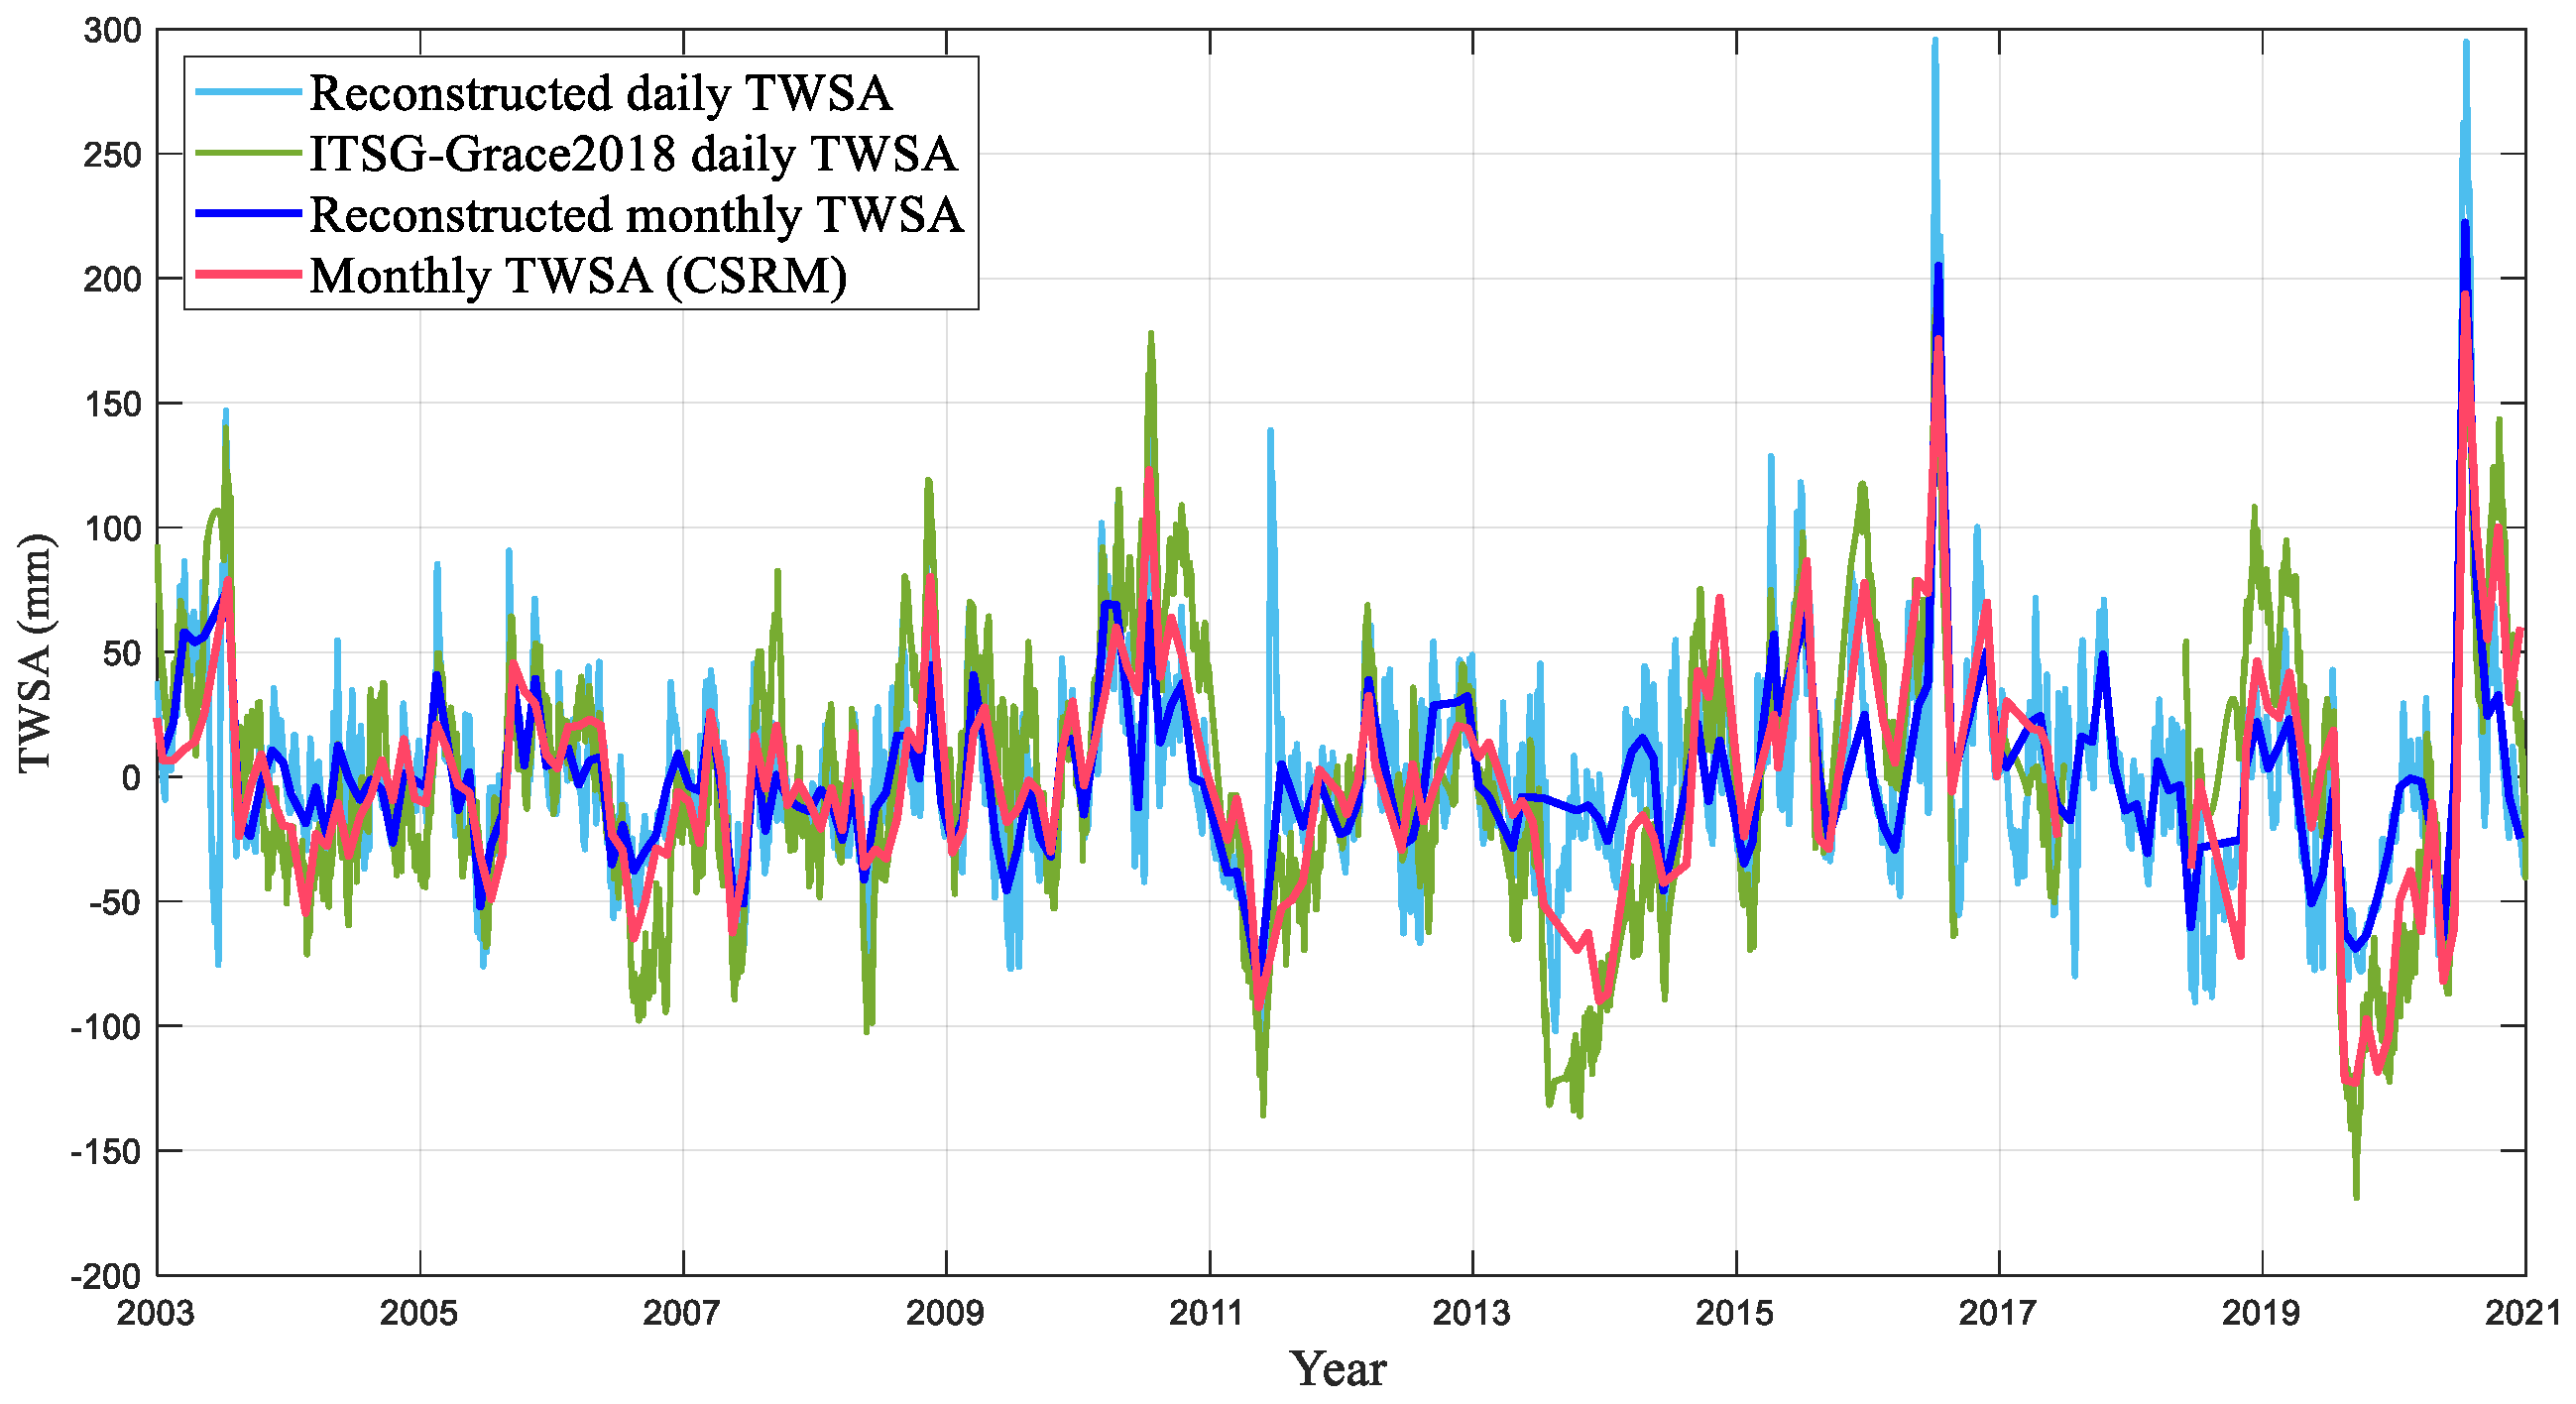
4.1. Evaluation of the Reconstructed TWSA
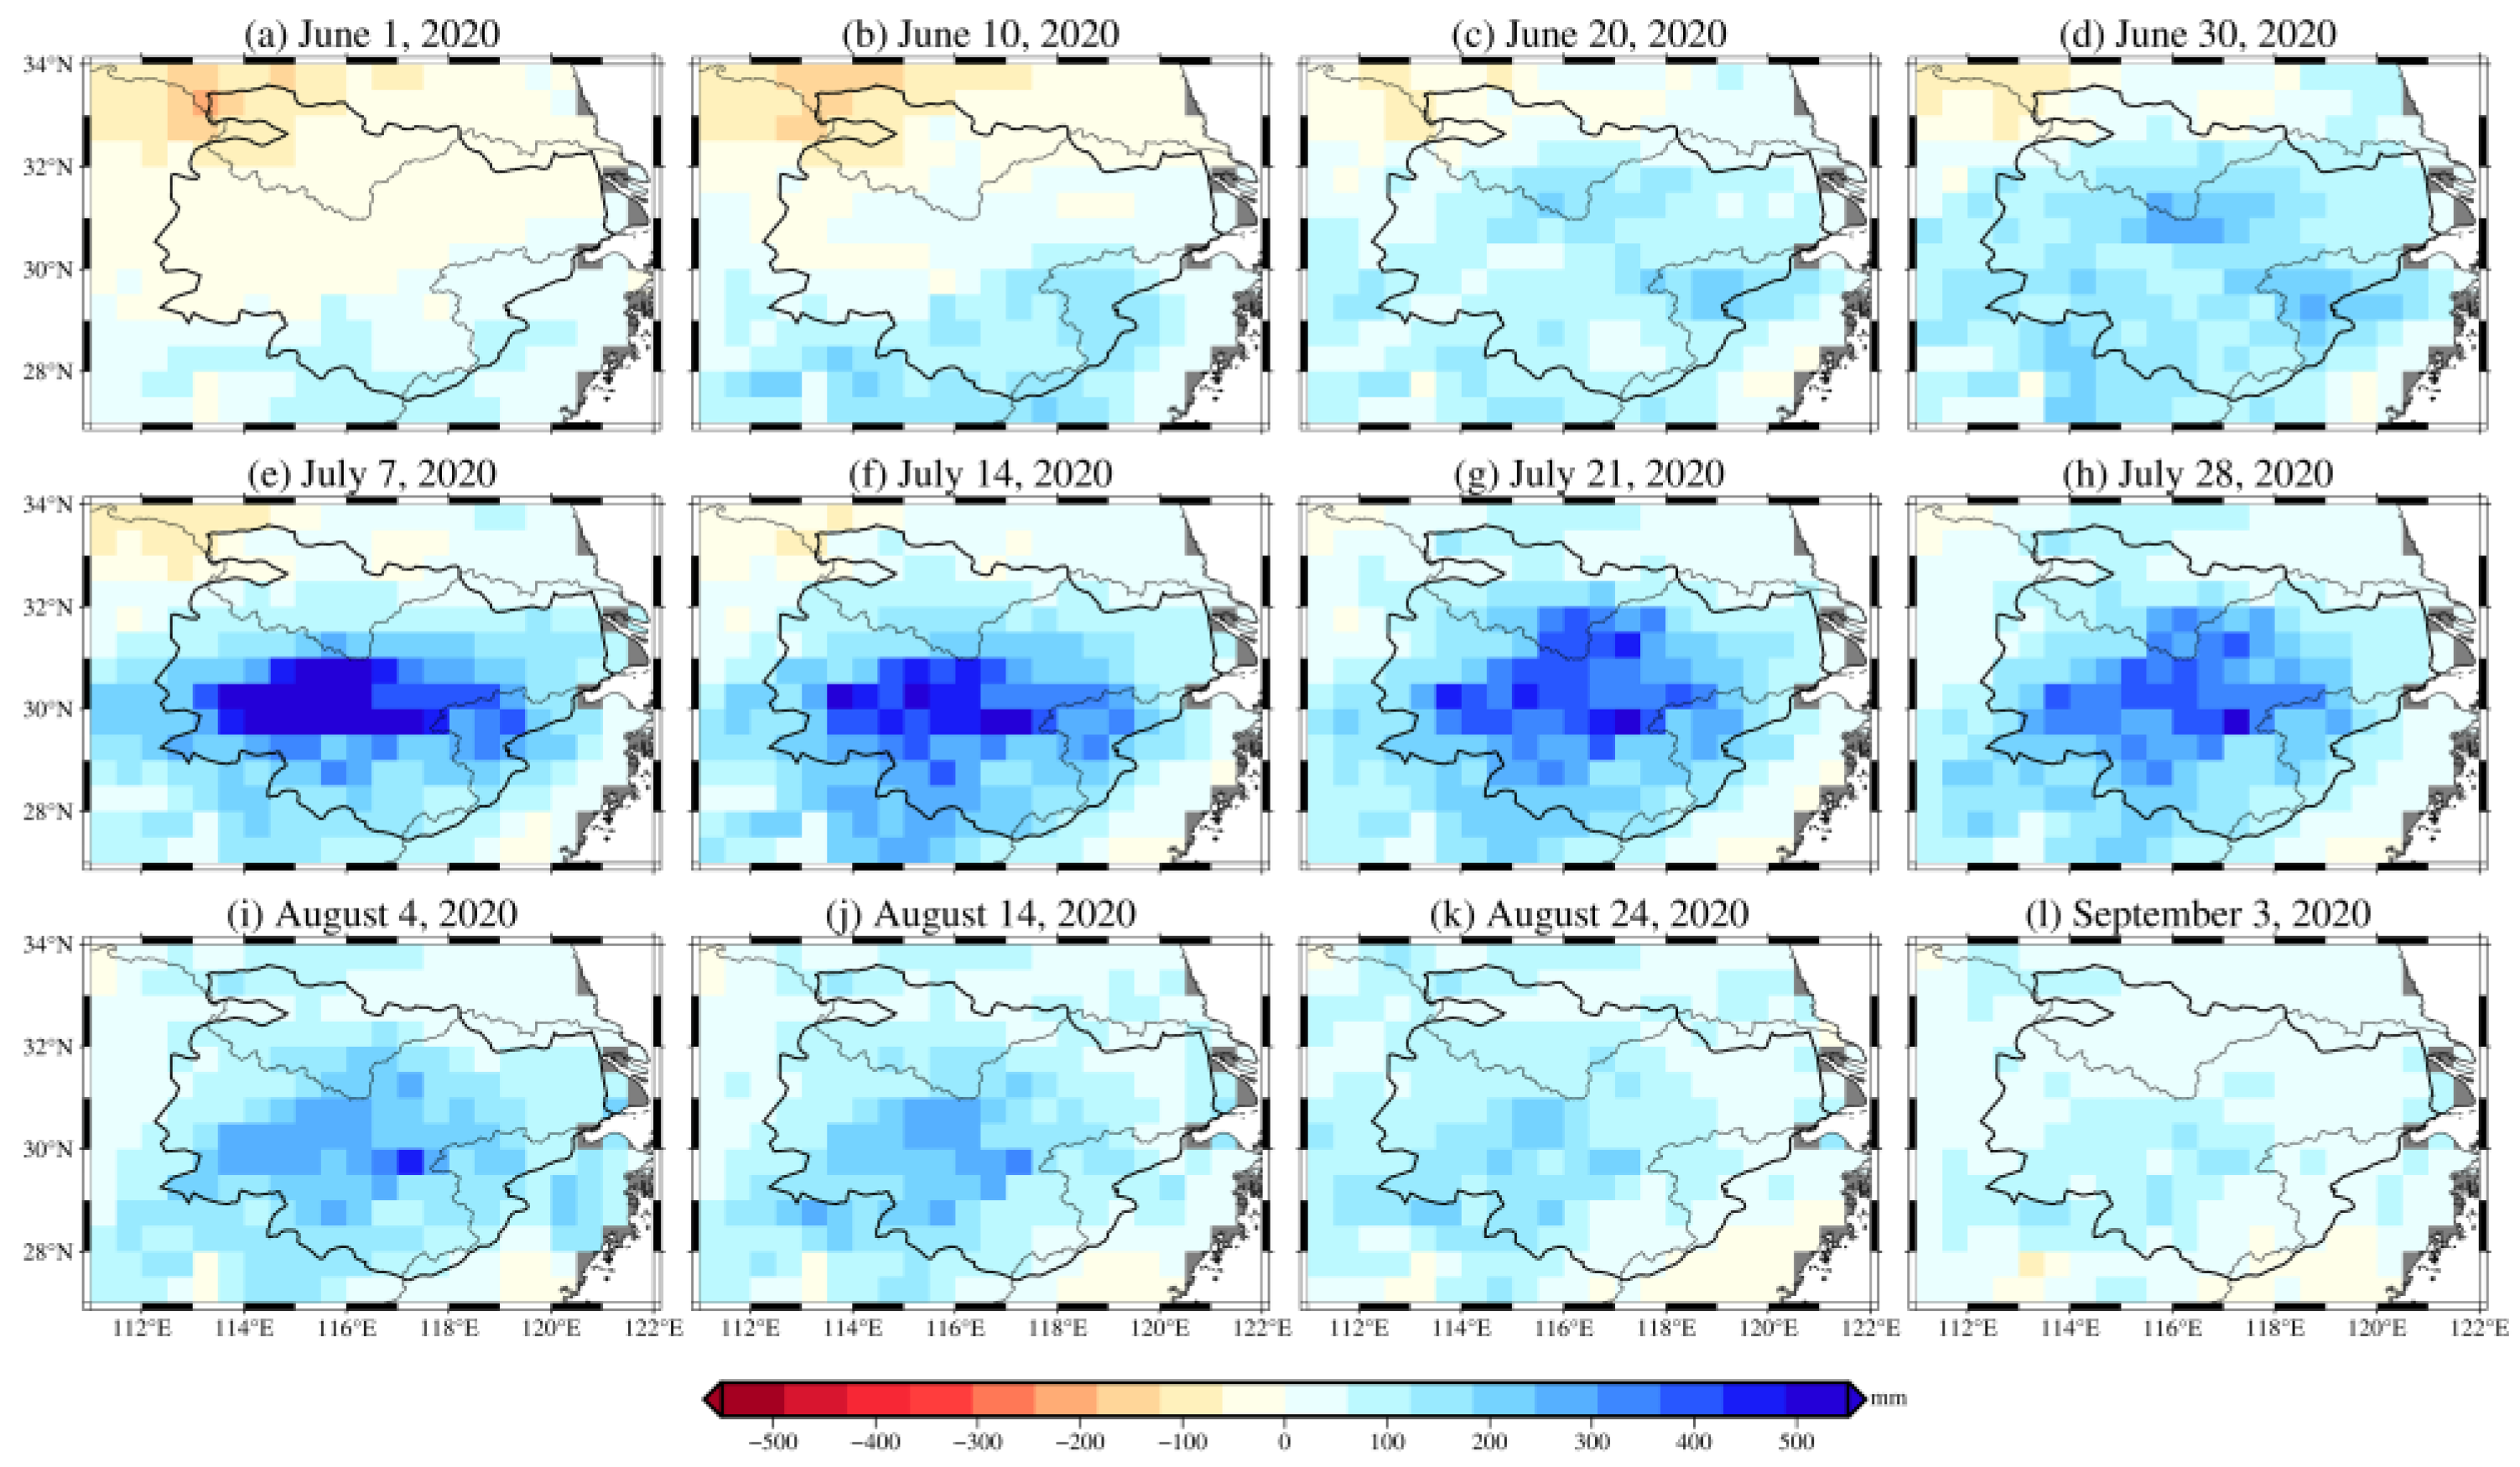
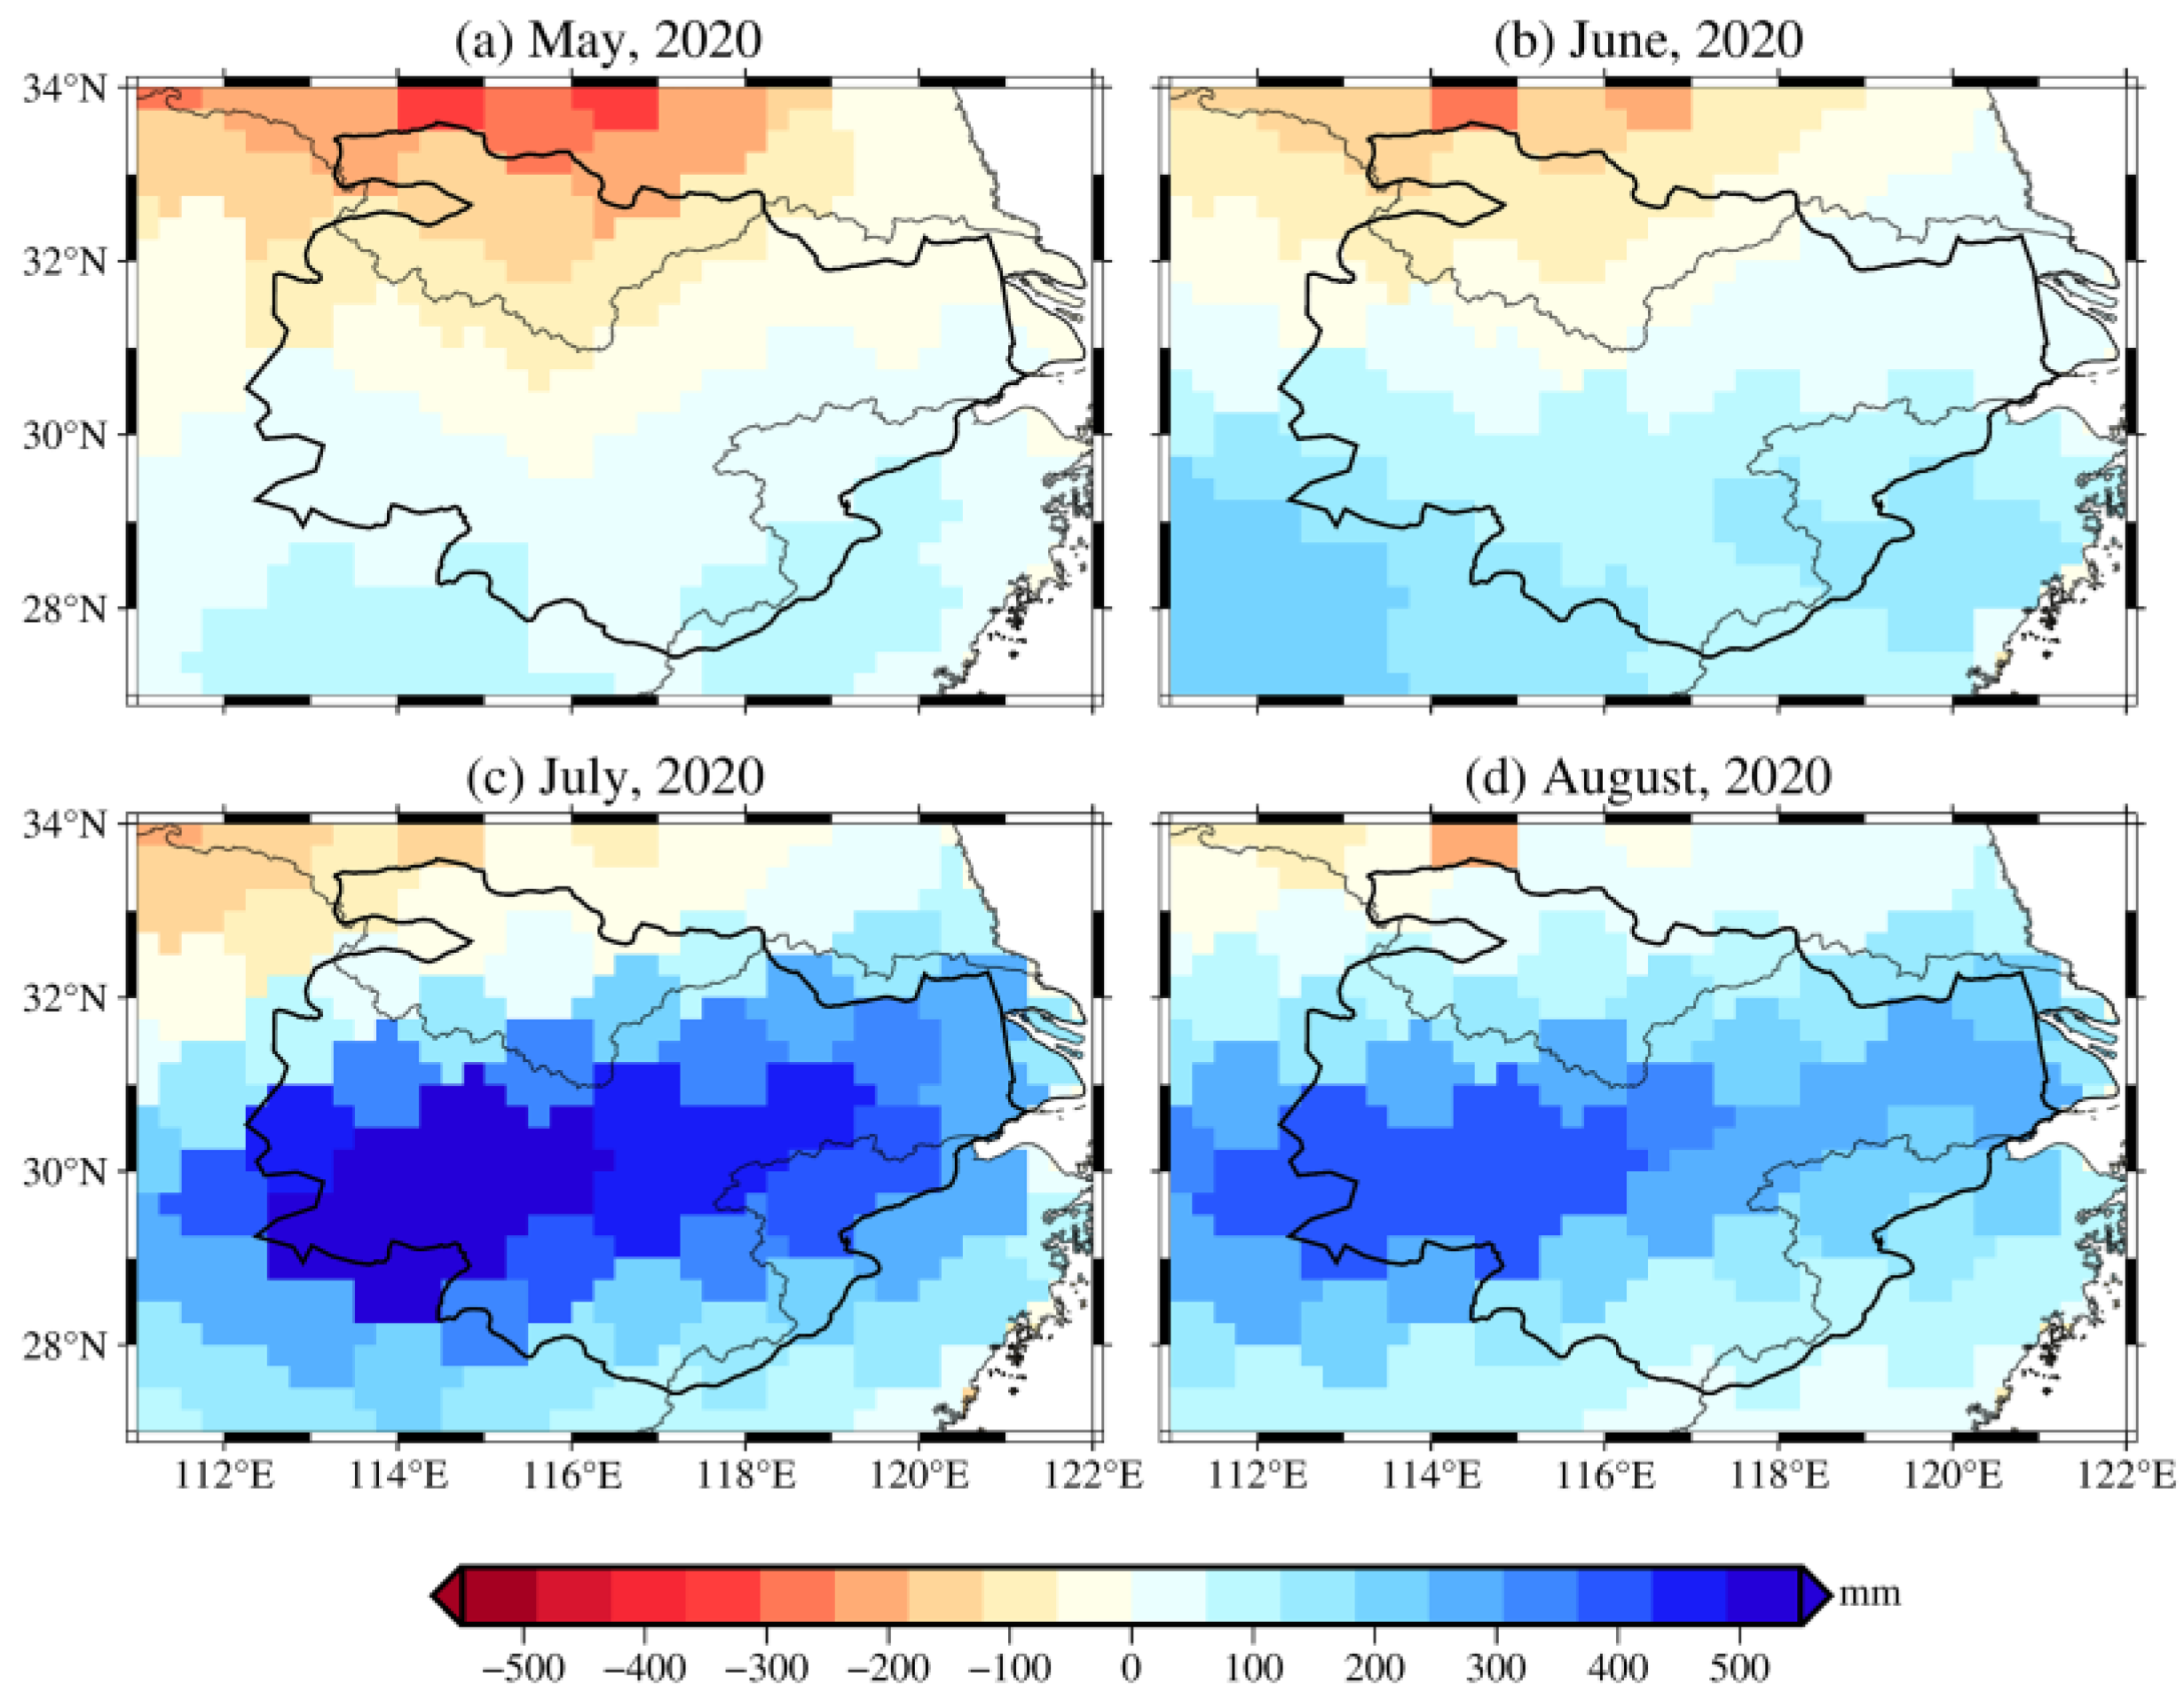
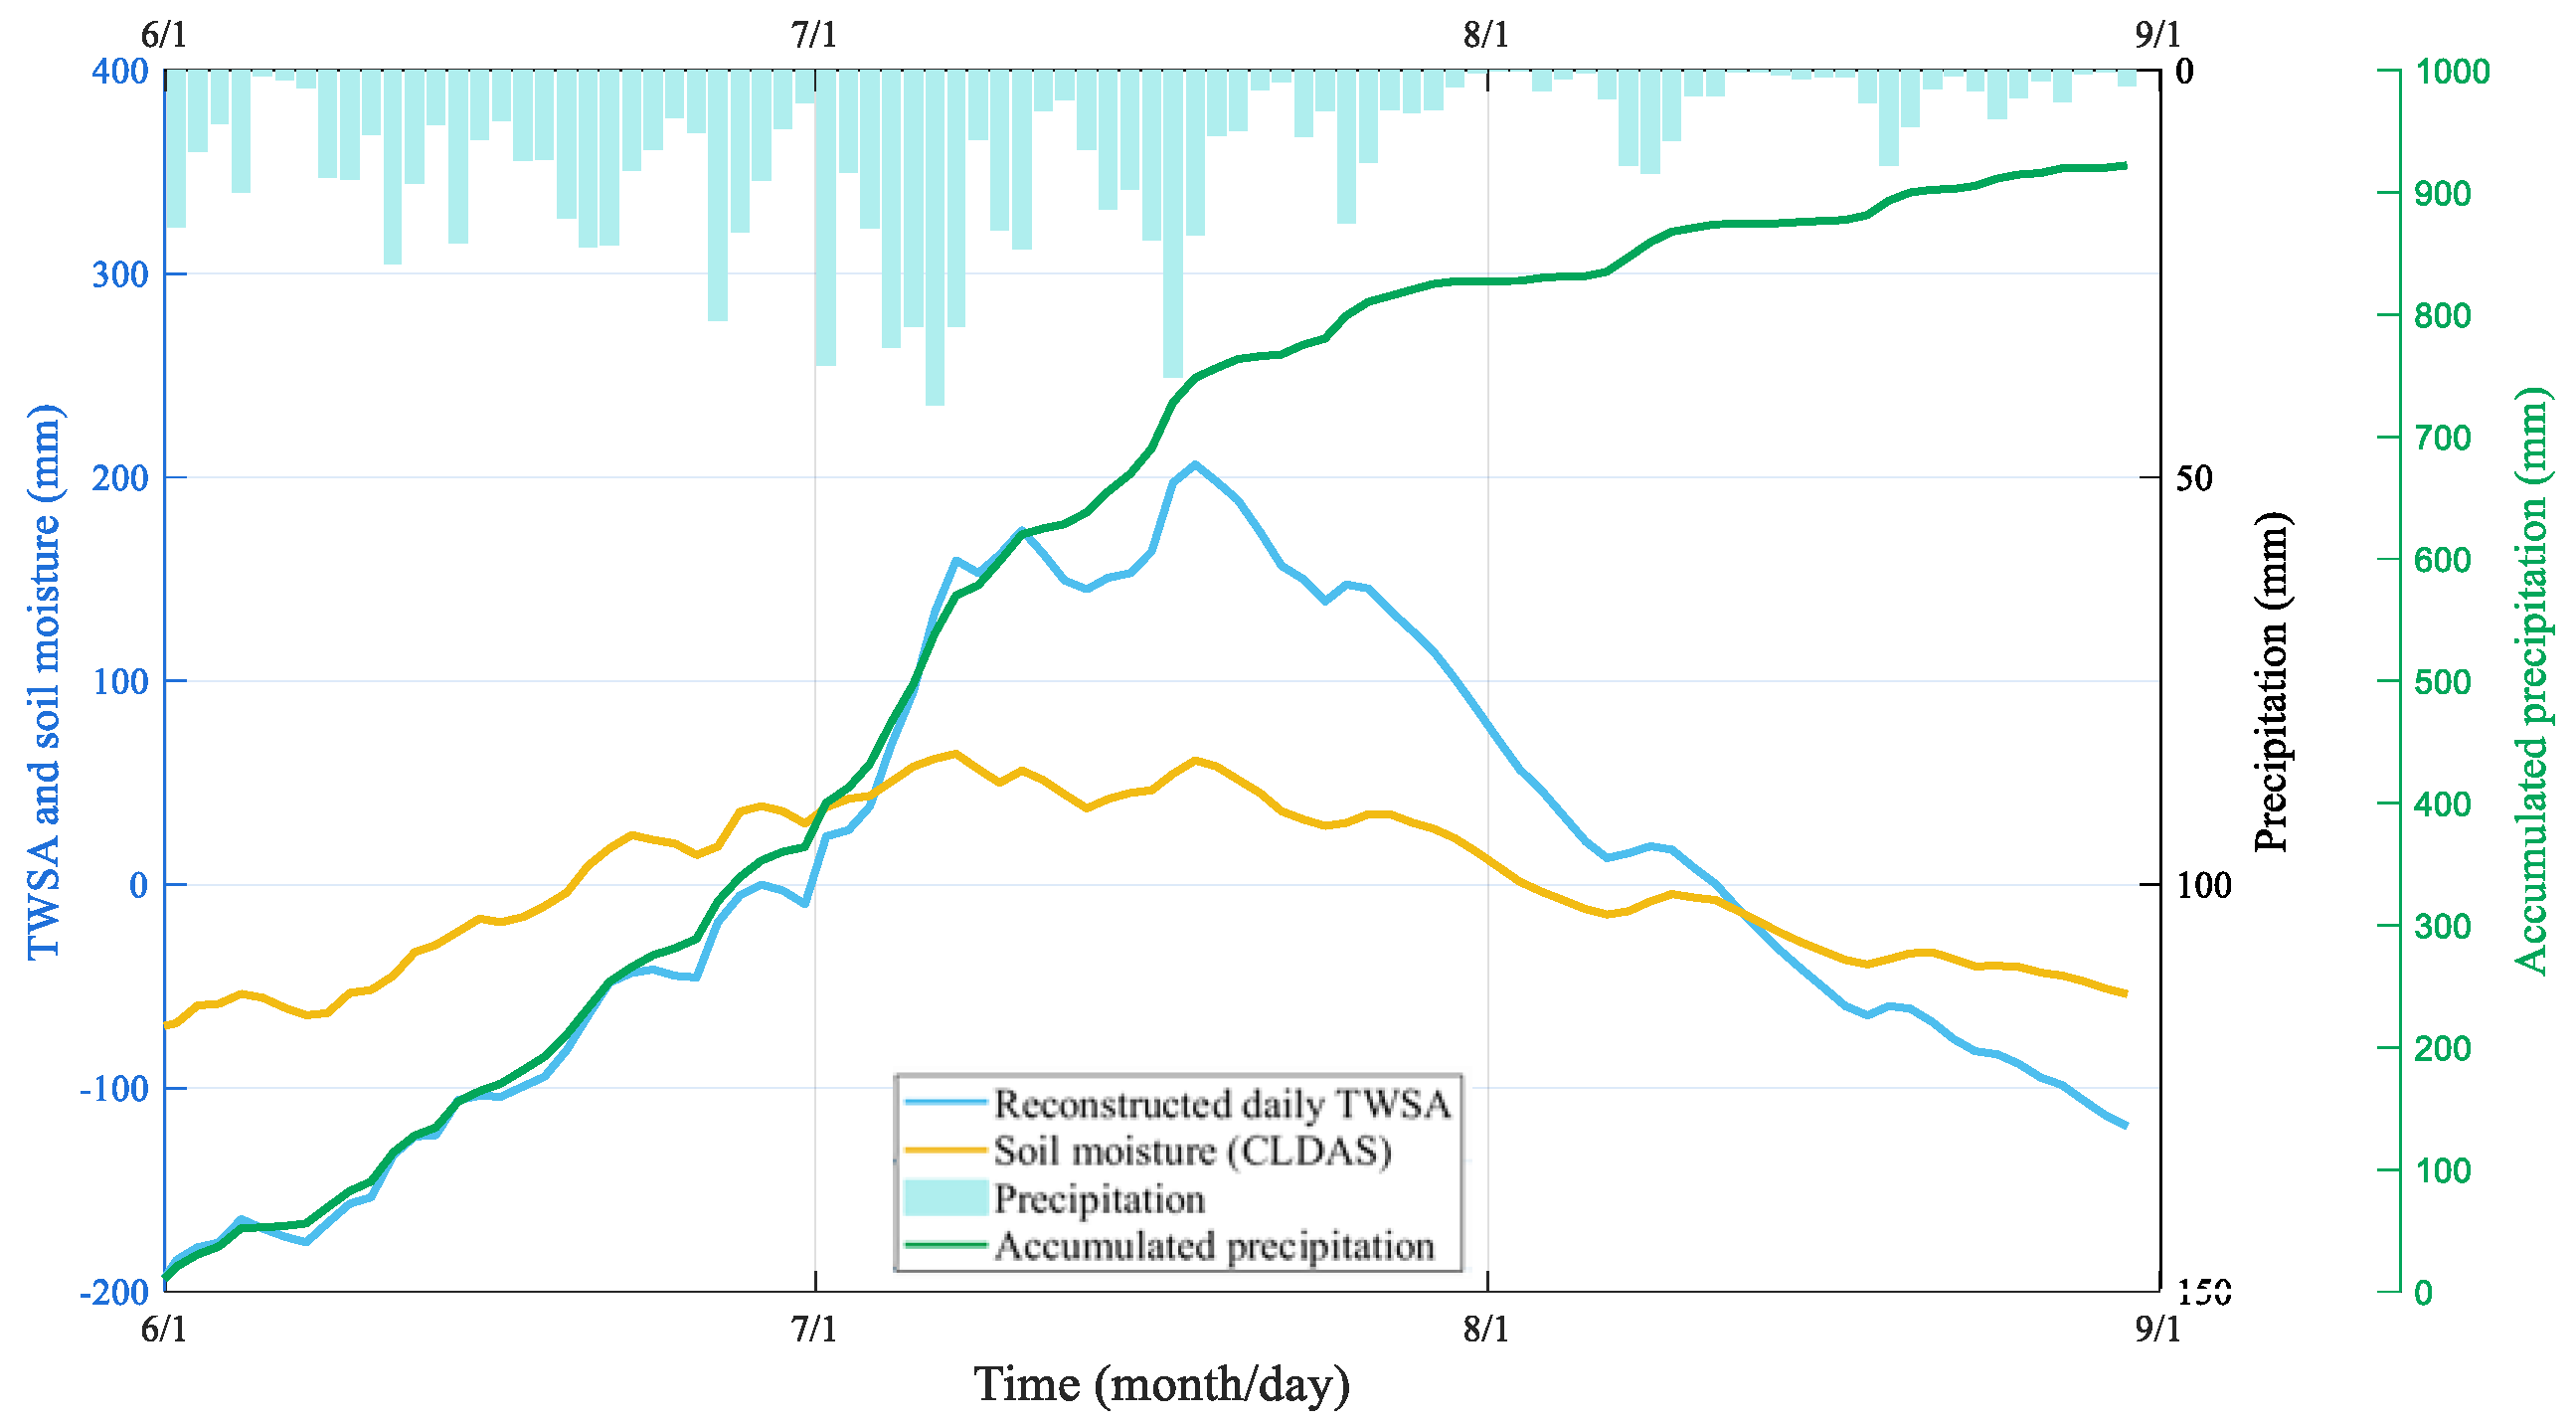
4.2. Spatial and Temporal Variation in TWSA during the Flood Event
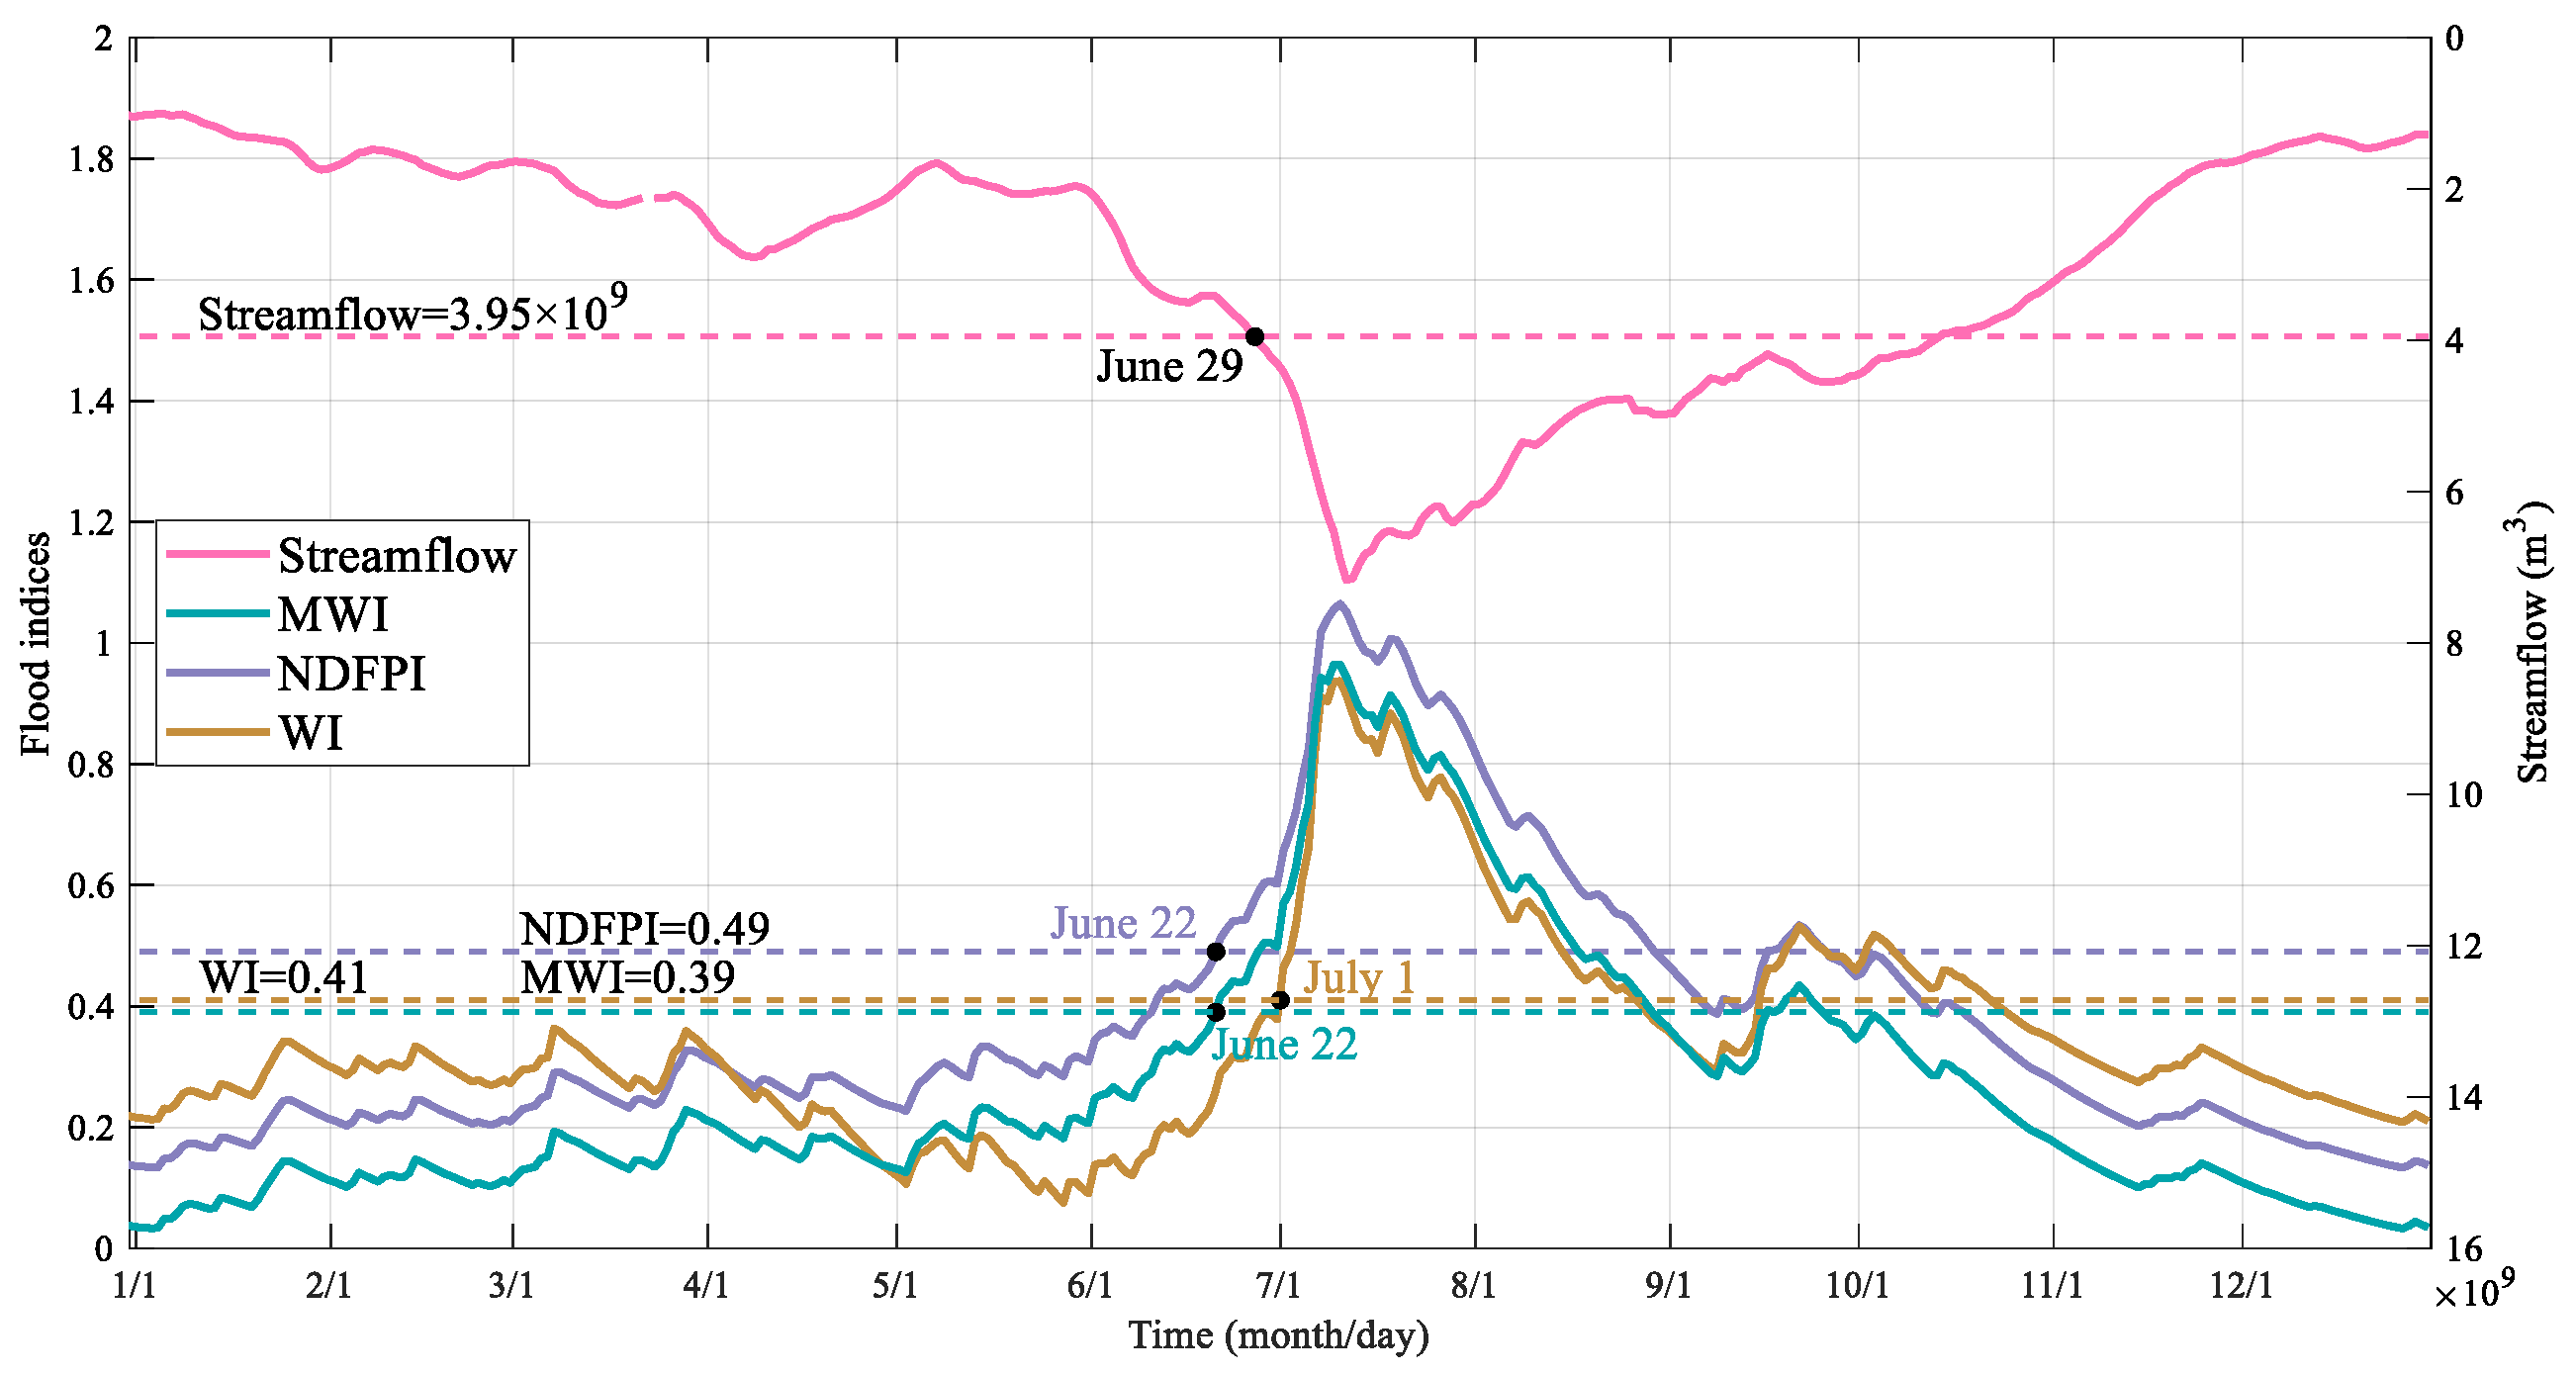
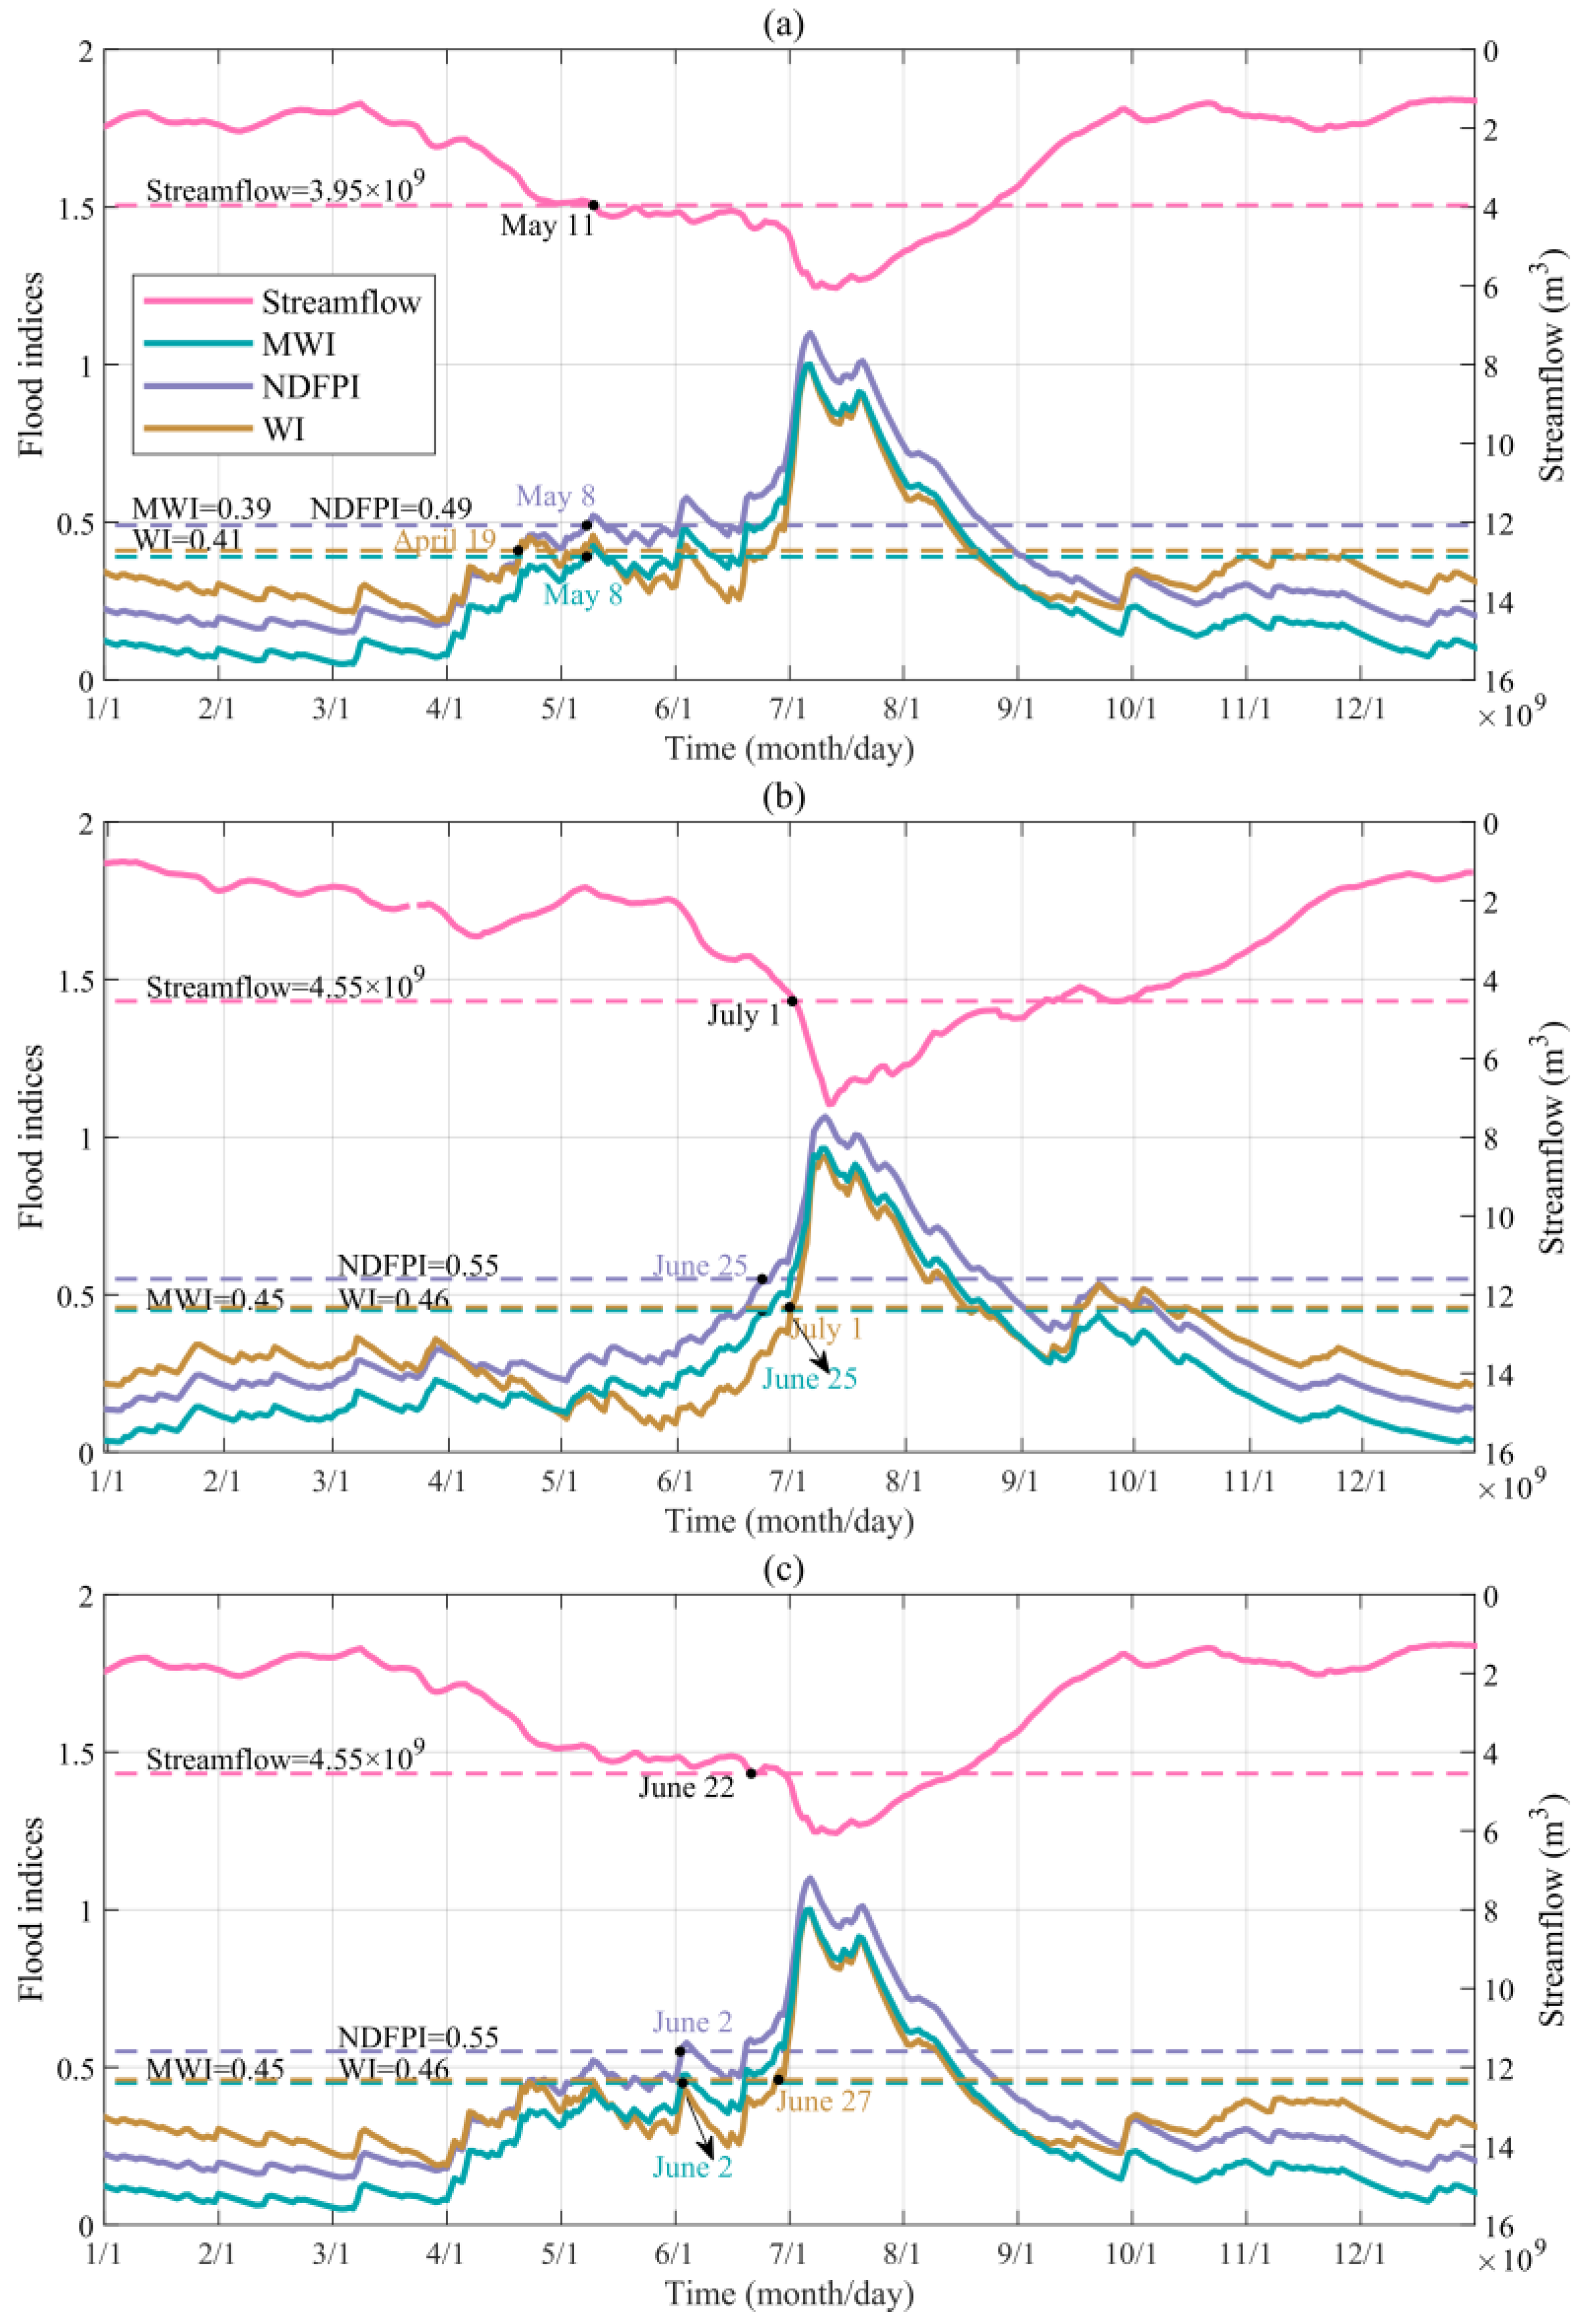
4.3. Monitoring the Flood Event Using MWI and NDFPI
5. Discussion
5.1. Comparison of MWI, NDFPI, and WI
5.2. Possible Limitations of This Method
5.3. Possible Future Applications
6. Conclusions
Supplementary Materials
Author Contributions
Funding
Data Availability Statement
Conflicts of Interest
Abbreviations
| Acronyms | |
| TWS | Terrestrial water storage |
| TWSA | Terrestrial water storage anomaly |
| GRACE | Gravity Recovery and Climate Experiment |
| GRACE-FO | GRACE Follow-On |
| GNSS | Global Navigation Satellite System |
| WI | Wetness index |
| MWI | Modified wetness index |
| FPI | Flood potential index |
| NDFPI | Normalized daily flood potential index |
| DFPA | Daily flood potential amount |
| YRB | Yangtze River Basin |
| LGD | Line-of-sight gravity difference |
| GLDAS | Global Land Data Assimilation System |
| CLDAS | China Land Data Assimilation System |
| CSRM | Center for Space Research mascon |
| CMA | China Meteorological Administration |
| CGDPA | China Gauge-Based Daily Precipitation Analysis |
| CC | Correlation coefficient |
| NSE | Nash–Sutcliffe efficiency coefficient |
| RMSE | Root-mean-square error |
| CRA | CMA Global Atmospheric Reanalysis |
References
- Rodell, M.; Li, B. Changing intensity of hydroclimatic extreme events revealed by GRACE and GRACE-FO. Nat. Water 2023, 1, 241–248. [Google Scholar] [CrossRef]
- Zhou, Z.Q.; Xie, S.P.; Zhang, R. Historic Yangtze flooding of 2020 tied to extreme Indian Ocean conditions. Proc. Natl. Acad. Sci. USA 2021, 118, e2022255118. [Google Scholar] [CrossRef]
- Jia, H.; Chen, F.; Pan, D.; Du, E.; Wang, L.; Wang, N.; Yang, A. Flood risk management in the Yangtze River basin—Comparison of 1998 and 2020 events. Int. J. Disaster Risk Reduct. 2022, 68, 102724. [Google Scholar] [CrossRef]
- Dong, Z.; Wang, G.; Amankwah, S.O.Y.; Wei, X.; Hu, Y.; Feng, A. Monitoring the summer flooding in the Poyang Lake area of China in 2020 based on Sentinel-1 data and multiple convolutional neural networks. Int. J. Appl. Earth Obs. Geoinf. 2021, 102, 102400. [Google Scholar] [CrossRef]
- Lopez, T.; Al Bitar, A.; Biancamaria, S.; Güntner, A.; Jäggi, A. On the Use of Satellite Remote Sensing to Detect Floods and Droughts at Large Scales. Surv. Geophys. 2020, 41, 1461–1487. [Google Scholar] [CrossRef]
- Yu, Q.; Wang, S.; He, H.; Yang, K.; Ma, L.; Li, J. Reconstructing GRACE-like TWS anomalies for the Canadian landmass using deep learning and land surface model. Int. J. Appl. Earth Obs. Geoinf. 2021, 102, 102404. [Google Scholar] [CrossRef]
- Tapley, B.D.; Bettadpur, S.; Watkins, M.; Reigber, C. The gravity recovery and climate experiment: Mission overview and early results. Geophys. Res. Lett. 2004, 31, L09607. [Google Scholar] [CrossRef] [Green Version]
- Landerer, F.W.; Flechtner, F.M.; Save, H.; Webb, F.H.; Bandikova, T.; Bertiger, W.I.; Bettadpur, S.V.; Byun, S.H.; Dahle, C.; Dobslaw, H.; et al. Extending the Global Mass Change Data Record: GRACE Follow-On Instrument and Science Data Performance. Geophys. Res. Lett. 2020, 47, e2020GL088306. [Google Scholar] [CrossRef]
- Chen, J.L.; Wilson, C.R.; Tapley, B.D. The 2009 exceptional Amazon flood and interannual terrestrial water storage change observed by GRACE. Water Resour. Res. 2010, 46. [Google Scholar] [CrossRef] [Green Version]
- Sun, Z.; Zhu, X.; Pan, Y.; Zhang, J. Assessing Terrestrial Water Storage and Flood Potential Using GRACE Data in the Yangtze River Basin, China. Remote Sens. 2017, 9, 1011. [Google Scholar] [CrossRef] [Green Version]
- Yang, P.; Xia, J.; Luo, X.; Meng, L.; Zhang, S.; Cai, W.; Wang, W. Impacts of climate change-related flood events in the Yangtze River Basin based on multi-source data. Atmos. Res. 2021, 263, 105819. [Google Scholar] [CrossRef]
- Huang, Z.; Jiao, J.J.; Luo, X.; Pan, Y.; Jin, T. Drought and Flood Characterization and Connection to Climate Variability in the Pearl River Basin in Southern China Using Long-Term GRACE and Reanalysis Data. J. Clim. 2021, 34, 2053–2078. [Google Scholar] [CrossRef]
- Tangdamrongsub, N.; Ditmar, P.G.; Steele-Dunne, S.C.; Gunter, B.C.; Sutanudjaja, E.H. Assessing total water storage and identifying flood events over Tonlé Sap basin in Cambodia using GRACE and MODIS satellite observations combined with hydrological models. Remote Sens. Environ. 2016, 181, 162–173. [Google Scholar] [CrossRef] [Green Version]
- Gouweleeuw, B.T.; Kvas, A.; Gruber, C.; Gain, A.K.; Mayer-Gürr, T.; Flechtner, F.; Güntner, A. Daily GRACE gravity field solutions track major flood events in the Ganges–Brahmaputra Delta. Hydrol. Earth Syst. Sci. 2018, 22, 2867–2880. [Google Scholar] [CrossRef] [Green Version]
- Jäggi, A.; Weigelt, M.; Flechtner, F.; Güntner, A.; Mayer-Gürr, T.; Martinis, S.; Bruinsma, S.; Flury, J.; Bourgogne, S.; Steffen, H.; et al. European Gravity Service for Improved Emergency Management (EGSIEM)—From concept to implementation. Geophys. J. Int. 2019, 218, 1572–1590. [Google Scholar] [CrossRef]
- Han, S.C.; Ghobadi-Far, K.; Yeo, I.Y.; McCullough, C.M.; Lee, E.; Sauber, J. GRACE Follow-On revealed Bangladesh was flooded early in the 2020 monsoon season due to premature soil saturation. Proc. Natl. Acad. Sci. USA 2021, 118, 47. [Google Scholar] [CrossRef] [PubMed]
- Xiong, J.; Guo, S.; Abhishek; Li, J.; Yin, J. A Novel Standardized Drought and Flood Potential Index Based on Reconstructed Daily GRACE Data. J. Hydrometeorol. 2022, 23, 1419–1438. [Google Scholar] [CrossRef]
- Wang, L.; Peng, Z.; Ma, X.; Zheng, Y.; Chen, C. Multiscale gravity measurements to characterize 2020 flood events and their spatio-temporal evolution in Yangtze river of China. J. Hydrol. 2021, 603, 127176. [Google Scholar] [CrossRef]
- Yan, X.; Zhang, B.; Yao, Y.; Yin, J.; Wang, H.; Ran, Q. Jointly using the GLDAS 2.2 model and GRACE to study the severe Yangtze flooding of 2020. J. Hydrol. 2022, 610, 127927. [Google Scholar] [CrossRef]
- Xie, J.; Xu, Y.-P.; Yu, H.; Huang, Y.; Guo, Y. Monitoring the extreme flood events in the Yangtze River basin based on GRACE and GRACE-FO satellite data. Hydrol. Earth Syst. Sci. 2022, 26, 5933–5954. [Google Scholar] [CrossRef]
- Humphrey, V.; Gudmundsson, L. GRACE-REC: A reconstruction of climate-driven water storage changes over the last century. Earth Syst. Sci. Data 2019, 11, 1153–1170. [Google Scholar] [CrossRef] [Green Version]
- Xiao, C.; Zhong, Y.; Feng, W.; Gao, W.; Wang, Z.; Zhong, M.; Ji, B. Monitoring the Catastrophic Flood with GRACE-FO and Near-Real-Time Precipitation Data in Northern Henan Province of China in July 2021. IEEE J. Sel. Top. Appl. Earth Obs. Remote Sens. 2022, 16, 89–101. [Google Scholar] [CrossRef]
- Liu, B.; Zou, X.; Yi, S.; Sneeuw, N.; Cai, J.; Li, J. Identifying and separating climate- and human-driven water storage anomalies using GRACE satellite data. Remote Sens. Environ. 2021, 263, 112559. [Google Scholar] [CrossRef]
- Jiang, W.; Ji, X.; Li, Y.; Luo, X.; Yang, L.; Ming, W.; Liu, C.; Yan, S.; Yang, C.; Sun, C. Modified flood potential index (MFPI) for flood monitoring in terrestrial water storage depletion basin using GRACE estimates. J. Hydrol. 2023, 616, 128765. [Google Scholar] [CrossRef]
- Li, X.; Long, D.; Scanlon, B.R.; Mann, M.E.; Li, X.; Tian, F.; Sun, Z.; Wang, G. Climate change threatens terrestrial water storage over the Tibetan Plateau. Nat. Clim. Chang. 2022, 12, 801–807. [Google Scholar] [CrossRef]
- Sun, Z.; Zhu, X.; Pan, Y.; Zhang, J.; Liu, X. Drought evaluation using the GRACE terrestrial water storage deficit over the Yangtze River Basin, China. Sci. Total Environ. 2018, 634, 727–738. [Google Scholar] [CrossRef]
- Xia, J.; Chen, J.; Wang, G.; Cheng, D. Flood Control Strategies for the River Basin Enlightened by the 2020 Upper Yangtze River Floods. Adv. Earth Sci. 2021, 36, 1. [Google Scholar]
- Save, H.; Bettadpur, S.; Tapley, B.D. High-resolution CSR GRACE RL05 mascons. J. Geophys. Res. Solid Earth 2016, 121, 7547–7569. [Google Scholar] [CrossRef]
- Wang, L.; Chen, C.; Ma, X.; Fu, Z.; Zheng, Y.; Peng, Z. Evaluation of GRACE mascon solutions using in-situ geodetic data: The case of hydrologic-induced crust displacement in the Yangtze River Basin. Sci. Total Environ. 2020, 707, 135606. [Google Scholar] [CrossRef]
- Kvas, A.; Behzadpour, S.; Ellmer, M.; Klinger, B.; Strasser, S.; Zehentner, N.; Mayer-Gürr, T. ITSG-Grace2018: Overview and Evaluation of a New GRACE-Only Gravity Field Time Series. J. Geophys. Res. Solid Earth 2019, 124, 9332–9344. [Google Scholar] [CrossRef] [Green Version]
- Sun, S.; Shi, C.; Pan, Y.; Bai, L.; Xu, B.; Zhang, T.; Han, S.; Jiang, L. Applicability Assessment of the 1998–2018 CLDAS Multi-Source Precipitation Fusion Dataset over China. J. Meteorol. Res. 2020, 34, 879–892. [Google Scholar] [CrossRef]
- Shen, Y.; Xiong, A. Validation and comparison of a new gauge-based precipitation analysis over mainland China. Int. J. Climatol. 2016, 36, 252–265. [Google Scholar] [CrossRef]
- Wu, J.; Gao, X. A gridded daily observation dataset over China region and comparison with the other datasets. Chin. J. Geophys. 2013, 56, 1102–1111. [Google Scholar]
- Xu, Y.; Gao, X.; Shen, Y.; Xu, C.; Shi, Y.; Giorgi, F. A daily temperature dataset over China and its application in validating a RCM simulation. Adv. Atmos. Sci. 2009, 26, 763–772. [Google Scholar] [CrossRef]
- Wu, J.; Gao, X.; Giorgi, F.; Chen, D. Changes of effective temperature and cold/hot days in late decades over China based on a high resolution gridded observation dataset. Int. J. Climatol. 2017, 37, 788–800. [Google Scholar] [CrossRef]
- Guo, D.; Wang, H. Comparison of a very-fine-resolution GCM with RCM dynamical downscaling in simulating climate in China. Adv. Atmos. Sci. 2016, 33, 559–570. [Google Scholar] [CrossRef] [Green Version]
- Hsu, Y.-J.; Fu, Y.; Bürgmann, R.; Hsu, S.-Y.; Lin, C.-C.; Tang, C.-H.; Wu, Y.-M. Assessing seasonal and interannual water storage variations in Taiwan using geodetic and hydrological data. Earth Planet. Sci. Lett. 2020, 550, 116532. [Google Scholar] [CrossRef]
- Li, X.; Zhong, B.; Li, J.; Liu, R. Joint inversion of GNSS and GRACE/GFO data for terrestrial water storage changes in the Yangtze River Basin. Geophys. J. Int. 2023, 233, 1596–1616. [Google Scholar] [CrossRef]
- Bevis, M. Seasonal fluctuations in the mass of the Amazon River system and Earth’s elastic response. Geophysical Research Letters 2005, 32. [Google Scholar] [CrossRef] [Green Version]
- He, S.; Gu, Y.; Fan, D.; Zhao, H.; Zheng, R. Seasonal Variation of Terrestrial Water Storage in Yunnan Province Inferred from GPS Vertical Observations. Acta Geod. Et Cartogr. Sin. 2018, 47, 332–340. [Google Scholar]
- Wu, Y.; Jiang, Z.; Yang, G.; Wei, W.; Liu, X. Comparison of GPS strain rate computing methods and their reliability. Geophys. J. Int. 2011, 185, 703–717. [Google Scholar] [CrossRef] [Green Version]
- Rodell, M.; Famiglietti, J.S.; Wiese, D.N.; Reager, J.T.; Beaudoing, H.K.; Landerer, F.W.; Lo, M.-H. Emerging trends in global freshwater availability. Nature 2018, 557, 651–659. [Google Scholar] [CrossRef]
- Reager, J.T.; Famiglietti, J.S. Global terrestrial water storage capacity and flood potential using GRACE. Geophys. Res. Lett. 2009, 36, 23. [Google Scholar] [CrossRef] [Green Version]
- Zhong, Y.; Bai, H.; Feng, W.; Lu, J.; Humphrey, V. Separating the Precipitation- and Non-Precipitation- Driven Water Storage Trends in China. Water Resour. Res. 2023, 59, e2022WR033261. [Google Scholar] [CrossRef]
- Xuan, J.; Chen, Z.; Zhang, X.; Liang, C.; Wu, B. Combining GRACE and GRACE-FO to Derive Terrestrial Water Storage Changes in the Yangtze River Basin from 2002 to 2020. J. Geod. Geodyn. 2021, 41, 961–966+972. [Google Scholar]
- Scanlon, B.R.; Zhang, Z.; Save, H.; Wiese, D.N.; Landerer, F.W.; Long, D.; Longuevergne, L.; Chen, J. Global evaluation of new GRACE mascon products for hydrologic applications. Water Resour. Res. 2016, 52, 9412–9429. [Google Scholar] [CrossRef] [Green Version]
- Bai, H.; Ming, Z.; Zhong, Y.; Zhong, M.; Kong, D.; Ji, B. Evaluation of evapotranspiration for exorheic basins in China using an improved estimate of terrestrial water storage change. J. Hydrol. 2022, 610, 127885. [Google Scholar] [CrossRef]
- Fu, Y.; Argus, D.F.; Landerer, F.W. GPS as an independent measurement to estimate terrestrial water storage variations in Washington and Oregon. J. Geophys. Res. Solid Earth 2015, 120, 552–566. [Google Scholar] [CrossRef]
- Li, Q.; Liu, X.; Zhong, Y.; Wang, M.; Shi, M. Precipitation Changes in the Three Gorges Reservoir Area and the Relationship with Water Level Change. Sensors 2021, 21, 6110. [Google Scholar] [CrossRef]
- Rodell, M.; Velicogna, I.; Famiglietti, J.S. Satellite-based estimates of groundwater depletion in India. Nature 2009, 460, 999–1002. [Google Scholar] [CrossRef] [Green Version]
- Zhong, Y.; Zhong, M.; Feng, W.; Zhang, Z.; Shen, Y.; Wu, D. Groundwater Depletion in the West Liaohe River Basin, China and Its Implications Revealed by GRACE and In Situ Measurements. Remote Sens. 2018, 10, 493. [Google Scholar] [CrossRef] [Green Version]
- Yan, X.; Zhang, B.; Yao, Y.; Yang, Y.; Li, J.; Ran, Q. GRACE and land surface models reveal severe drought in eastern China in 2019. J. Hydrol. 2021, 601, 126640. [Google Scholar] [CrossRef]
- Wang, J.; Song, C.; Reager, J.T.; Yao, F.; Famiglietti, J.S.; Sheng, Y.; Macdonald, G.M.; Brun, F.; Schmied, H.M.; Marston, R.A.; et al. Recent global decline in endorheic basin water storages. Nat. Geosci. 2018, 11, 926–932. [Google Scholar] [CrossRef] [PubMed] [Green Version]
- Xiong, J.; Yin, J.; Guo, S.; Gu, L.; Xiong, F.; Li, N. Integrated flood potential index for flood monitoring in the GRACE era. J. Hydrol. 2021, 603, 127115. [Google Scholar] [CrossRef]
- Long, D.; Yang, W.; Sun, Z.; Cui, Y.; Zhang, C.; Cui, Y. GRACE satellite-based estimation of groundwater storage changes and water balance analysis for the Haihe River Basin. J. Hydraul. Eng. 2023, 54, 255–267. [Google Scholar]
- Lu, J.; Jia, L.; Zhou, J.; Jiang, M.; Zhong, Y.; Menenti, M. Quantification and Assessment of Global Terrestrial Water Storage Deficit Caused by Drought Using GRACE Satellite Data. IEEE J. Sel. Top. Appl. Earth Obs. Remote Sens. 2022, 15, 5001–5012. [Google Scholar] [CrossRef]
- Liu, X.; Feng, X.; Ciais, P.; Fu, B.; Hu, B.; Sun, Z. GRACE satellite-based drought index indicating increased impact of drought over major basins in China during 2002–2017. Agric. For. Meteorol. 2020, 291, 108057. [Google Scholar] [CrossRef]
- Hosseini-Moghari, S.-M.; Araghinejad, S.; Ebrahimi, K.; Tourian, M.J. Introducing modified total storage deficit index (MTSDI) for drought monitoring using GRACE observations. Ecol. Indic. 2019, 101, 465–475. [Google Scholar] [CrossRef]
- Li, X.; Long, D.; Slater, L.J.; Moulds, S.; Shahid, M.; Han, P.; Zhao, F. Soil Moisture to Runoff (SM2R): A data-driven model for runoff estimation across poorly gauged Asian water towers based on soil moisture dynamics. Water Resour. Res. 2023, 59, e2022WR033597. [Google Scholar] [CrossRef]
- Becker, M.; Meyssignac, B.; Xavier, L.; Cazenave, A.; Alkama, R.; Decharme, B. Past terrestrial water storage (1980–2008) in the Amazon Basin reconstructed from GRACE and in situ river gauging data. Hydrol. Earth Syst. Sci. 2011, 15, 533–546. [Google Scholar] [CrossRef] [Green Version]
- Rodell, M.; Famiglietti, J.S.; Chen, J.; Seneviratne, S.; Viterbo, P.; Holl, S.L.; Wilson, , C.R. Basin scale estimates of evapotranspiration using GRACE and other observations. Hydrol. Earth Syst. Sci. 2004, 31. [Google Scholar] [CrossRef] [Green Version]


| Dataset | Time Span | Spatial Resolution | Temporal Resolution | Data Source |
|---|---|---|---|---|
| CSRM RL06 | 2002–2020 | 0.25 | Monthly | http://www2.csr.utexas.edu/grace/RL06_mascons.html, accessed on 2 June 2023 |
| ITSG−Grace2018 | 2003–2020 | 1 | Daily | http://ftp.tugraz.at/outgoing/ITSG/GRACE/ITSG-Grace_operational/daily_kalman/, accessed on 2 June 2023 |
| CLDAS-V2.0 | 2019–2020 | 0.0625° | Daily | https://data.cma.cn/, accessed on 2 June 2023 |
| CGDPA | 2000–2019 | 0.25 | Daily | https://data.cma.cn/, accessed on 2 June 2023 |
| CN05.1 | 2000–2019 | 0.25 | Daily | Contact with the authors |
| GNSS observations | 2020 | stations | Daily | https://www.eqdsc.com, accessed on 2 June 2023 |
| Streamflow | 2003–2020 | stations | Daily | http://xxfb.mwr.cn/sq_djdh.html, accessed on 2 June 2023 |
Disclaimer/Publisher’s Note: The statements, opinions and data contained in all publications are solely those of the individual author(s) and contributor(s) and not of MDPI and/or the editor(s). MDPI and/or the editor(s) disclaim responsibility for any injury to people or property resulting from any ideas, methods, instructions or products referred to in the content. |
© 2023 by the authors. Licensee MDPI, Basel, Switzerland. This article is an open access article distributed under the terms and conditions of the Creative Commons Attribution (CC BY) license (https://creativecommons.org/licenses/by/4.0/).
Share and Cite
Xiao, C.; Zhong, Y.; Wu, Y.; Bai, H.; Li, W.; Wu, D.; Wang, C.; Tian, B. Applying Reconstructed Daily Water Storage and Modified Wetness Index to Flood Monitoring: A Case Study in the Yangtze River Basin. Remote Sens. 2023, 15, 3192. https://doi.org/10.3390/rs15123192
Xiao C, Zhong Y, Wu Y, Bai H, Li W, Wu D, Wang C, Tian B. Applying Reconstructed Daily Water Storage and Modified Wetness Index to Flood Monitoring: A Case Study in the Yangtze River Basin. Remote Sensing. 2023; 15(12):3192. https://doi.org/10.3390/rs15123192
Chicago/Turabian StyleXiao, Cuiyu, Yulong Zhong, Yunlong Wu, Hongbing Bai, Wanqiu Li, Dingcheng Wu, Changqing Wang, and Baoming Tian. 2023. "Applying Reconstructed Daily Water Storage and Modified Wetness Index to Flood Monitoring: A Case Study in the Yangtze River Basin" Remote Sensing 15, no. 12: 3192. https://doi.org/10.3390/rs15123192