Article

Detection and Attribution of Changes in Terrestrial Water Storage across China: Climate Change versus Vegetation Greening

1
State Key Laboratory of Hydrology-Water Resources and Hydraulics Engineering, College of Hydrology and Water Resources, Hohai University, Nanjing 210098, China
2
Joint Innovation Center for Modern Forestry Studies, College of Forestry, Nanjing Forestry University, Nanjing 210037, China
3
State Key Laboratory of Desert and Oasis Ecology, Xinjiang Institute of Ecology and Geography, Chinese Academy of Sciences, Urumqi 830011, China
4
Institute of Surface-Earth System Science, School of Earth System Science, Tianjin University, Tianjin 300072, China
5
Department of Geosciences, University of Oslo, 0316 Oslo, Norway
*
Author to whom correspondence should be addressed.
Remote Sens. 2023, 15(12), 3104; https://doi.org/10.3390/rs15123104
Submission received: 29 April 2023 / Revised: 3 June 2023 / Accepted: 12 June 2023 / Published: 14 June 2023

Abstract

:
Whether or not large-scale vegetation restoration will lead to a decrease in regional terrestrial water storage is a controversial topic. This study employed the Geodetector model, in conjunction with observed and satellite hydro-meteorological data, to detect the changes in terrestrial water storage anomaly (TWSA) and to identify the contributions of climate change and vegetation greening across China during the years 1982–2019. The results revealed that: (1) during the period of 1982–2019, TWSA showed a downward trend in about two thirds of the country, with significant declines in North China, southeast Tibet, and northwest Xinjiang, and an upward trend in the remaining third of the country, with significant increases mainly in the Qaidam Basin, the Yangtze River, and the Songhua River; (2) the positive correlation between normalized vegetation index (NDVI) and TWSA accounts for 48.64% of the total vegetation area across China. In addition, the response of vegetation greenness lags behind the TWSA and precipitation, and the lag time was shorter in arid and semi-arid regions dominated by grasslands, and longer in relatively humid regions dominated by forests and savannas; (3) furthermore, TWSAs decreased with the increase in NDVI and evapotranspiration (ET) in arid and semi-arid areas, and increased with the rise in NDVI and ET in the humid regions. The Geodetector model was used to detect the effects of climate, vegetation, and human factors on TWSA. It is worth mentioning that NDVI, precipitation, and ET were some of the main factors affecting TWSA. Therefore, it is essential to implement rational ecological engineering to mitigate climate change’s negative effects and maintain water resources’ sustainability in arid and semi-arid regions.

1. Introduction

Terrestrial vegetation is vital in regulating global water balance and climate change [1]. Afforestation can affect the hydrological cycle by increasing evapotranspiration (ET) and precipitation interception [2]. Despite the positive effects of reforestation on carbon sequestration, the impact on the hydrological cycle remains controversial [3,4]. Research has shown that vegetation retains water through its root system and promotes regional water vapor transport to increase precipitation [5,6]. In contrast, other studies have shown that afforestation may promote ET and reduce soil moisture content [7]. Therefore, balancing terrestrial vegetation carbon and water resources is essential to promote the sustainable management of vegetation restoration programs [8].
Since 1998, China has implemented ecological projects to increase vegetation coverage and positively combat desertification [9]. Additionally, they also have a particular impact on the regional water balance. Afforestation sequesters carbon in vegetation, but soil moisture depletion presents new challenges to the water and carbon trade-off [3]. It is worth mentioning that the spatial and temporal distribution of water resources varies significantly across China, and the northern region has limited water resources [10]. For instance, Zhao et al. [11] showed that the average decline in the rate of terrestrial water storage (TWS) was 16.6 ± 5.0 mm/a in the Mu Us Sandy Land of northern China from 1982 to 2016 due to the large-scale ecological restoration. Feng et al. [8] suggested that ecological engineering promoted the increase in net primary productivity (NPP) and ET in China’s Loess Plateau. They also found that NPP was close to the 400 ± 5 g C m−2a−1 threshold according to the carbon–water balance. According to field observations, Jia et al. [12] indicated that soil moisture in the 0–4 m soil profile decreased significantly in China’s Loess Plateau during the years 2004–2014 due to afforestation. To effectively manage basins in the context of climate change, it is essential to understand the comprehensive impact of vegetation on water resources.
Recently, research mainly focuses on the effect of vegetation on a single component of TWS, including precipitation and ET [11]. For example, van Dijke et al. [13] reported that the large-scale expansion of tree cover could increase water availability by 6% in some regions. In comparison, it could reduce water availability by 38% in other areas. Papagiannopoulou et al. [14] pointed out that terrestrial water was essential in promoting vegetation growth, which dominates 61% of the global vegetation cover. However, precipitation only provides information on water availability indirectly [15]. Additionally, Meng et al. [2] indicated that the average growth rate of ET in the Three-North region of China was about 2.9 mm/a during the years 2000–2015, and its spatial variation was similar to that of the leaf area index (LAI). Zeng et al. [16] investigated that an 8% increase in the global LAI increased 12.0 ± 2.4 mm/a and 12.1 ± 2.7 mm/a in ET and precipitation, respectively. However, the hydrological impact of large-scale afforestation on ET may vary by scale [2]. In contrast, soil moisture can directly reflect the response of vegetation growth to water. However, obtaining soil moisture monitoring data is often labor-intensive and limited in spatial distribution [17].
Subsequently, TWS obtained by the Gravity Recovery and Climate Experiment (GRACE) satellite modulates ecosystem vegetation generation and strongly affects the carbon cycle [18]. For instance, Andrew et al. [19] showed that the interannual variations of the Normalized Difference Vegetation Index (NDVI) and TWS were consistent across Australia from 2003 to 2014, and the response of grassland to TWS was more rapid. Using the GRACE satellite, Zhao et al. [11] investigated the impact of ecological restoration on TWS in northern China from 1982 to 2016. Wang et al. [20] suggested that vegetation was more strongly affected by TWS than precipitation on both the annual and monthly scales in the Pearl River basin from 2002 to 2015. In addition to the effects of vegetation, climate change and human activities were altering the hydrological cycle with significant consequences for TWS. Climate change mainly manifested in the influence of temporal and spatial precipitation and temperature variations on TWS [21]. Human activities change the hydrological cycle by altering land cover, water conservation projects, and human usage [22]. Nevertheless, it was difficult to distinguish between the natural and human effects because of incomplete data and uncertainty in climate and hydrological models [23].
Many studies have researched ways of determining the attribution of natural and human effects to the hydrological cycle. For example, Xie et al. [24] used the variable infiltration capacity (VIC) model to detect the changes in the hydrological cycle and to identify the contributions of land cover and climate change over the Three-North region of China during the years 1989–2009. Gao et al. [25] determined the contributions of precipitation, ET, and land use/cover changes to streamflow and runoff coefficient changes in the Loess Plateau based on the Budyko hypothesis. Scanlon et al. [26] indicated that decreasing trends from GRACE were primarily related to human use (irrigation) and climate variations, whereas increasing trends reflected climate variations globally during the years 2002–2014. However, most previous studies considered natural and human factors independently while ignoring their interaction with the hydrological cycle. The Geodetector model is a new statistical method to detect spatial heterogeneity and explore its driving mechanism [27]. The core of its theory is to detect the consistency of the spatial distribution pattern between the dependent and independent variables through spatial heterogeneity [28]. One significant advantage of this method is that it can detect the interaction of two driving factors on dependent variables and does not have to follow the linear assumption of traditional statistical methods [29]. Although some investigations on contributions to the hydrological cycle have been conducted, there are relatively few studies on regional TWSA in China based on the Geodetector model.
China’s climate is complex and diverse, with pronounced differences in climate and vegetation among different basins. Based on the observed and satellite hydro-meteorological data, this study investigated the effects of the hydrological cycle on TWSA across China from 1982 to 2019. Furthermore, the Geodetector model was used to detect the climate and human factor responses to TWSA. The specific objectives were to: (1) analyze the spatiotemporal evolution trend of TWSA and explore the influence of hydrological cycle changes on TWSA across China; (2) determine the contributions of climate and human factors to TWSA across China; and (3) investigate the impact of vegetation greening on TWSA under different climate regions and vegetation types across China. This work is undoubtedly helpful in understanding the impact of climate and vegetation on TWSA and offers guidance for regional water resource management and ecological restoration.

2. Materials and Methods
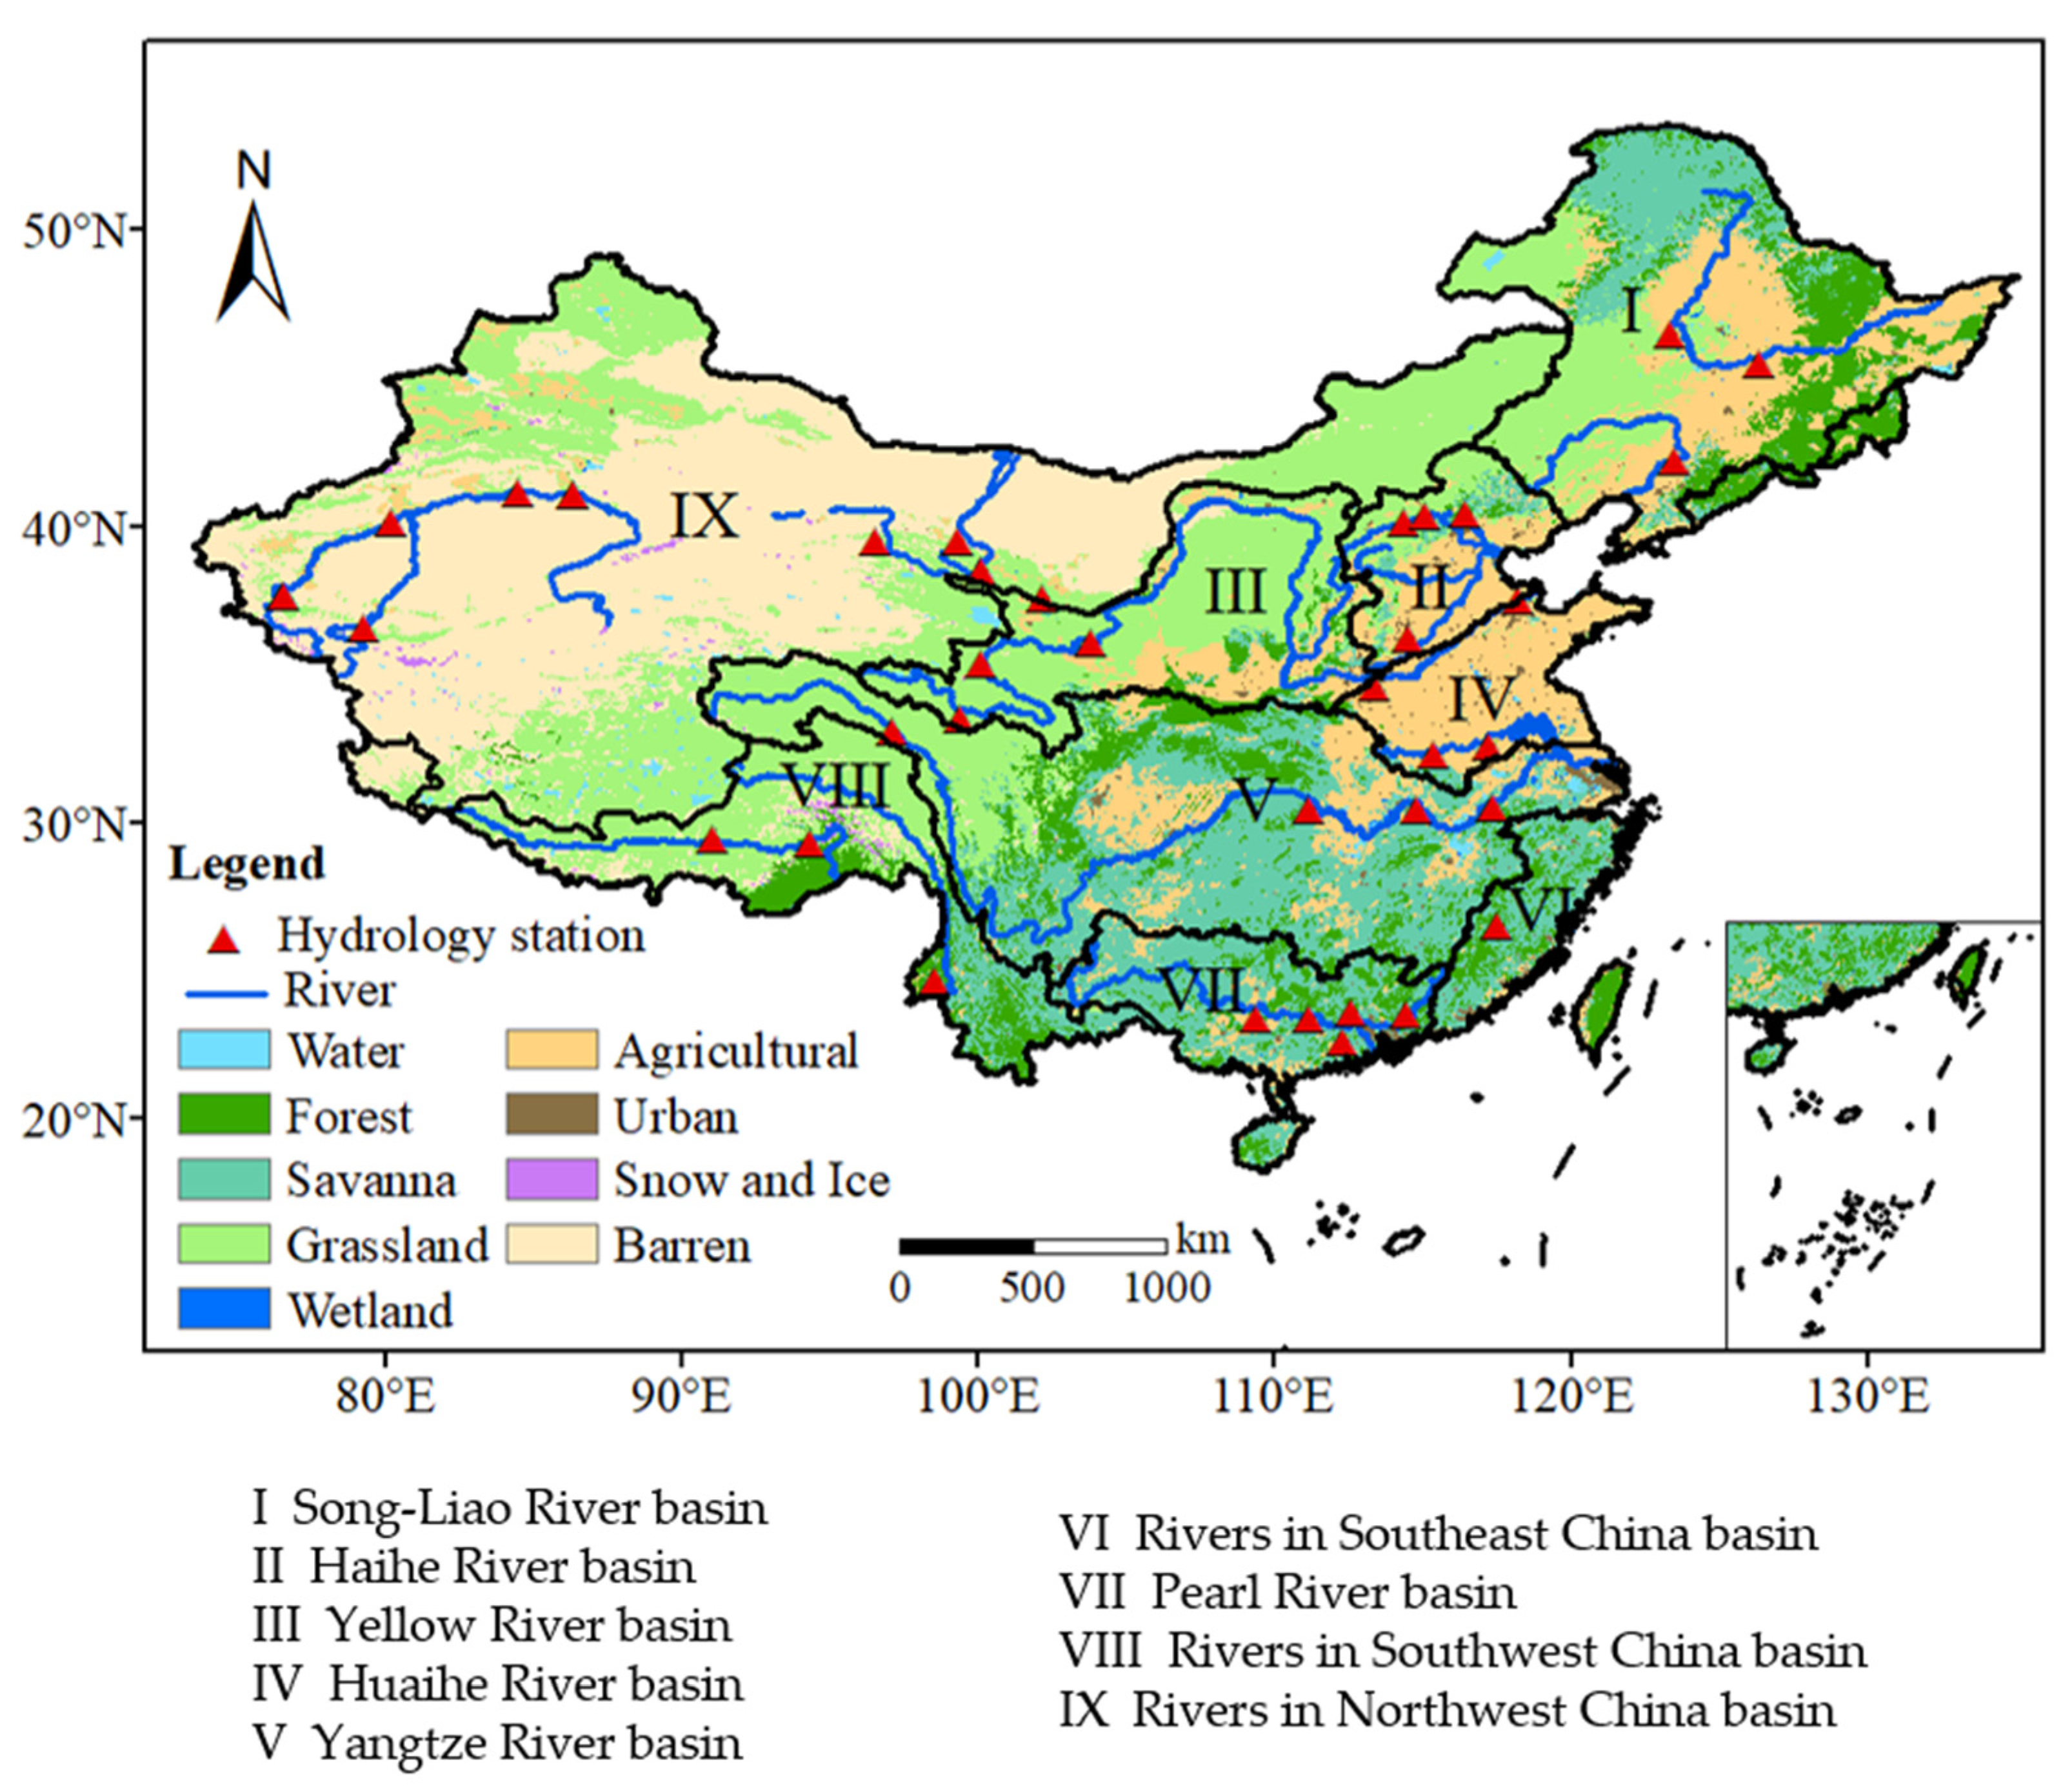
2.1. Study Area

China is located in the southeastern part of Eurasia, and its climate types include tropical, subtropical, temperate, frigid regions, and so on [30]. The distribution of precipitation in China is uneven, with more in the southeast and less in the northwest. A map of land cover types in China is shown in Figure 1. According to the river basin classification criteria, China is divided into nine major river basins. Table 1 shows precipitation and temperature characteristics and represents typical natural vegetation in the nine river basins of China. The annual average precipitation and temperature in the southern region were higher than in the northwest region. In particular, the annual average precipitation was above 1000 mm in the southern region. Due to topographic and climatic differences, the distribution of rivers in China is extremely uneven. Most rivers are located in the monsoon region of eastern China and directly enter the sea, mainly including the Liaohe River, Huaihe River, Haihe River, Yangtze River, Yellow River, and Pearl River [31]. Additionally, the northwest region is arid and has less precipitation; a number of rivers are primarily inland. Affected by terrain, climate and other factors, China’s vegetation is rich in variety and uneven in space. At the same time, the regional distribution of forest resources is hugely unbalanced. The allocation of forest resources in the southeast, southwest, and northeast was significantly higher than that in north, central, and northwest China [32].

2.2. Data Sources

The data used in this study are shown in Table 2. The reconstructed GRACE products, provided by the Center for Space Research (CSR) from 1982 to 2019, were employed at a resolution of 0.5° by 0.5° [33]. Combining machine learning with statistical decomposition techniques, Li et al. [33] reconstructed a GRACE-like TWSA on the global land from 1979 to 2020. They verified that it agreed with the observations of most grids of the GRACE-FO global land. The GRACE gravity satellite obtains the global monthly land water storage changes by measuring the Earth’s time-varying gravity field signal [34]. It has the advantages of high data acquisition efficiency, repeated observations, uniform scale, and uniform distribution [35]. Many applications exist in large-scale terrestrial water storage inversion and extreme climate monitoring [36].
The ET data were derived from the Global Land Evaporation Amsterdam Model (GLEAM) version 3.6a data set, at a resolution of 0.25° by 0.25°, from 1982 to 2019 [37,38]. The GLEAM product algorithm consists of four modules: the rainfall interception module, soil module, potential evaporation module, and stress module [37]. It considers four surface land types: tall vegetation, low vegetation, water body, and bare soil. The data used by GLEAM are mainly from satellite observations, including radiant flux, soil moisture, precipitation, and temperature data, vegetation optical thickness data, and snow water equivalent data. The product considers the process of snow sublimation, improves the algorithm for soil layer drainage simulation, and obtains the moisture of different soil layers according to the melting of snow water.
The CDR AVHRR NDVI data were obtained from the National Science Data Center from 1982 to 2019, with 0.05° × 0.05° degree resolution (http://www.geodata.cn/, accessed on 14 July 2022). This data set is based on NOAA CDR AVHRR NDVI V5 data. The rgee package of R language was used to call the Google Earth Engine service for processing, and the terra package of R language was further used for band fusion, clipping, and other processing [39,40]. In this study, the maximum value composition (MVC) method was used to obtain the maximum yearly NDVI data, which eliminated the influence of cloud haze and the uncertainty caused by the difference in crop phenology to a large extent [41].
The observed meteorological data (temperature and precipitation) were derived from 2472 meteorological stations across China from 1982 to 2019, with a spatial resolution of 0.5° × 0.5° (https://data.cma.cn/, accessed on 10 January 2021). The observed meteorological data are obtained from the National Meteorological Information Center of China’s Meteorological Administration. The dataset was obtained based on the data of 2472 meteorological stations, using thin plate spline (TPS) interpolation combined with 3D geospatial information. The streamflow data were recorded by 38 hydrological stations across China from 1982 to 2019.
Land cover products came from the land cover type (MCD12C1) data of MODIS, which have a spatial resolution of 0.05° (https://lpdaac.usgs.gov/products/mcd12c1v006/, accessed on 21 May 2023). The digital elevation model (DEM) data, with a spatial resolution of 90 m, was downloaded from the Geospatial Data Cloud (http://www.gscloud.cn/, accessed on 22 August 2022). The elevation and slope were derived from the DEM data using ArcGIS 10.2 (ESRI, Redlands, CA, USA). The soil type data, with a spatial resolution of 1 km, was obtained from (http://www.resdc.cn/, accessed on 18 June 2022). The population density data, with a spatial resolution of 1 km, was collected from (https://www.worldpop.org/, accessed on 10 May 2022).

2.3. Methodology

2.3.1. Time Lag Analysis

GRACE-derived TWSA during our study period (1982–2019) was calculated by removing the TWS mean in 2004–2009. Therefore, changes in NDVI, ET, precipitation, and streamflow were based on averages from 2004 to 2009. The response of NDVI to TWSA and precipitation had a specific time lag [15,42]. This study analyzed the relationship between TWSA (or precipitation) and NDVI at different time lags (0–6 months) to quantify these timescales. Therefore, this study analyzed the correlation coefficients between the average NDVI of each month, and the average TWSA and precipitation of the previous 0 to 6 months. The Pearson correlation coefficient was used to quantify the strength of the correlation across time delays. According to the correlation coefficient (the absolute value was taken when the value was negative), the time-response characteristics of NDVI to TWSA and precipitation were compared, and the lag period corresponding to the maximum correlation coefficient was analyzed.

2.3.2. Water Budget Analysis

Analyzing the total water budget, that is, the balance of precipitation, evapotranspiration, runoff, and the changes in water storage at the terrestrial surface, is critical to understanding the regional water cycle [23,43]. These components are related through the equation:
Δ T W S = P E T R
where ΔTWS (mm) represents TWS change, P (mm) is the precipitation, ET (mm) refers to evapotranspiration, and R (mm) denotes the runoff.

2.3.3. Trend Analysis

Mann–Kendall (MK) test is a commonly used non-parametric test method, often used in the trend testing of long-sequence hydrological and meteorological data. A modified Mann–Kendall (MMK) test was used to detect trends, which resulted in a reliable trend analysis compared to traditional MK [44]. Based on a confidence level of 0.05 in the MMK test, if |Z| ≥ 1.96, the trend is significant. Below are the calculation steps.
For a time series X = {x_1, x_2, …, x_n}, the period statistic S is:
S = i < j a i j = i < j sgn ( x j x i )
where sgn is the sign function, the time lag correlation coefficient r I of the original time series X corresponding to the rank is calculated, and, if r I passes the significance test at a given significance level α, the variance var ( S ) is calculated according to the following formula:
var ( S ) = η × n ( n 1 ) ( 2 n + 5 ) 18
η = 1 + 1 n ( n 1 ) ( n 2 ) × i = 1 n 1 ( n i ) ( n i 1 ) ( n i 2 ) r i , the statistic Z in the MMK trend test can be obtained, and the calculation formula is as follows:
Z = { S 1 var ( S ) S > 0 0 S = 0 S + 1 var ( S ) S < 0
The combination of the Theil–Sen slope and MMK trend test can improve the accuracy of climate trend change analysis to a certain extent [45]. The Theil–Sen slope method is a non-parametric test that is often used to estimate trends in time series [46]. For the time series x t = ( x 1 , x 2 , , x n ) , the Theil–Sen slope is calculated as:
β = m e d i a n ( x j x i j i ) ,     j > i
where β represents the average rate of change in this series and the trend of the time series. When β > 0, the series shows an upward trend; when β < 0, the series offers a downward trend. The median is the median function.

2.3.4. Correlation Analysis and Partial Correlation Analysis

The Pearson correlation coefficient estimates the degree of correlation between two variables, such as NDVI and TWSA. The significance of the correlation coefficient was evaluated at the 0.05 level. The calculation formula is as follows:
r x y = i = 1 n ( x i X ¯ ) ( y i Y ¯ ) i = 1 n ( x i X ¯ ) 2 i = 1 n ( y i Y ¯ ) 2
where i refers to year, n refers to length of time, X ¯ refers to the average x value, Y ¯ refers to the average y value, and r x y refers to the correlation coefficient between x and y .
When two factors are correlated with NDVI simultaneously, the influence of other factors can be eliminated using partial correlation analysis, and the degree of correlation between a single factor and NDVI can be analyzed separately. The calculation formula of partial correlation analysis is as follows:
R x y , z = R x y R x z R y z ( 1 R x z 2 ) ( 1 R y z 2 )
R x y , z is the partial correlation coefficient between the dependent variable x and the independent variable y after z is fixed. The significance test of the partial correlation analysis was performed by t-test.

2.3.5. Geodetector Model

The Geodetector model, which was proposed by Wang et al. [47], compares independent variables’ spatial distribution with the latent factors’ distribution. A spatial analysis method is suitable for measuring the degree of heterogeneity of spatial stratification. It should be analyzed comprehensively from both natural and human factors to explore the changing aspects of TWSA. This paper selects seven types of natural factors and two types of human factors, as shown in Table 3. The Geodetector software can only deal with discrete variables [27]. This study divided elevation, precipitation, temperature, ET, and NDVI into 6 categories based on the natural breakpoint method in ArcGIS 10.2. [48]. The slope was divided into 6 categories based on the Technical Regulations for Land Use Status Survey. The population density, soil type, and land cover were divided into 6, 9, and 9 categories based on existing specifications.
The Geodetector model consists of four parts, namely the factor detector, interaction detector, risk detector, and ecological detector. This paper applies the first two.
(1) Factor detector. This module can quantitatively detect the extent to which a driving factor X can explain the spatial differentiation of TWSA through the value of q statistic:
q = 1 h = 1 L N h δ h 2 N δ 2
where q represents the explanatory power of the impact factor on the temporal and spatial changes of TWSA, h is the stratification of the category number of a driving factor, L is the sample size of the impact factor, N h and N are numbers of units for layer h and the whole region, respectively, and δ h 2 and δ 2 are the variance of h and the whole area. The larger the q value, the greater the factor’s influence on TWSA.
(2) Interaction detector. This module can identify the interactive effect on the NDVI between two driving factors. Firstly, the q values of two driving factors for NDVI were calculated (q(X1) and q(X2)). Then, the q values of the interactive effect were calculated (q(X1∩X2)) and compared with q(X1) and q(X2) to determine the interaction type between the two driving factors (Table 4).

3. Results

3.1. Influence of the Hydrological Cycle on TWSA across China

The global climate and underlying surface changes affect water resources by affecting precipitation, ET, and runoff in the hydrological cycle. Precipitation, ET, and runoff are often regarded as the dominant factors of TWSA. Based on the Theil–Sen slope and MMK trend test, the distribution of the change in TWSA, precipitation, ET, and streamflow in space across China from 1982 to 2019 was obtained (Figure 2). As shown in Figure 2a, TWSA showed a noticeable decreasing trend in North China, southeast Tibet and northwest Xinjiang. In contrast, the trend increased in the Qaidam Basin, the Yangtze River, and the Songhua River. Furthermore, the number of pixels with an increasing trend in the TWSA was 38.84%, while 61.16% showed decreasing trends. Through the MMK test, 33.13% of pixels showed significantly increasing trends, while the number of pixels with significantly decreasing trends of TWSA was 55.33%.
According to the calculations, the percentage of precipitation pixels with an increasing trend was 71.39% (Figure 2b). Additionally, 16.46% of pixels showed significantly increasing trends in precipitation. Precipitation exhibited an increasing trend with the majority of China, and a significant increase was distributed in the northwest region. Subsequently, an increasing ET trend was observed for 96.33% of the pixels, and 58.30% showed a significant increase (Figure 2c). The increase in ET was primarily distributed in the Yangtze River basin and the Yellow River basin. As shown in Figure 2d, the streamflow decrease was mainly distributed in eastern China, while the increase was primarily distributed in the Inland areas.
Figure 3 shows the interannual variation of annual average TWSA and precipitation, ET, and streamflow anomalies from 1982 to 2019 across China. Table 5 shows the variation trend of TWSA and its components with R values. The TWSA showed an apparent upward trend in the Yangtze, Southeast, and Pearl River basins, while other basins showed a significant downward trend. In most of China’s rivers, except for the inland areas, the precipitation and streamflow anomalies had no statistical change. Moreover, the results showed that the change in annual streamflow in North China was more significant than that of annual precipitation. Furthermore, ET displayed a significant increase in most areas of China. Among the water cycle elements, precipitation and streamflow did not change significantly across China, but ET showed a significant increasing trend. The change in TWS calculated according to the water balance had not passed the significance test in the analysis of the interannual variation trend. Among them, most of the basins showed a slight fluctuation trend. It should be noted that there was particular uncertainty in the change in TWS when the data of the three influencing factors were included [23].

3.2. Analysis of Driving Factors of the TWSA across China

Human and natural factors combine to cause changes in TWSA. This study analyzed the driving mechanism of natural and human factors on TWSA based on the factor detector and interaction detector of geographic detectors. From the results of the factor detector, it could be seen that the determining force q value of different factors on TWSA in 2019 was in the order of NDVI > precipitation > ET > temperature > land cover > soil type > slope > elevation > population density (Figure 4). The q value of NDVI was the largest (0.213), which indicated that NDVI could explain about 20% of the change in TWSA. The q value of precipitation, ET, temperature, and land cover was 0.198, 0.162, 0.159, and 0.127, respectively. The results indicated that these three factors could explain more than 10% of the change in TWSA, affecting the change in vegetation TWSA. The q value of soil type, slope, elevation, and population were all less than 0.1, meaning these three factors have little influence on TWSA.
Different factor interaction detection results found that the interaction of any two factors was more significant than the influence of a single factor on TWSA (Figure 5). The q value of the interaction between NDVI and other factors was greater than that of most other interactions, implying that the NDVI was the dominant factor influencing TWSA. The q values of the interaction of precipitation, ET, temperature, and land cover with other factors were relatively high, which indicated that these three factors were essential factors influencing TWSA. Additionally, the interaction types of the interaction between factors were explored based on the definition in Table 4. The interaction types of interaction between soil type and precipitation and ET were bi-variable enhanced. Meanwhile, the interaction types between precipitation and ET, NDVI were enhanced bi-variable. In addition, the interaction types between ET, NDVI, and land cover were improved bi-variable. The interaction types between NDVI, land cover, and population density were bi-variable enhanced. The interaction types of interactions between other factors were nonlinear-enhanced.

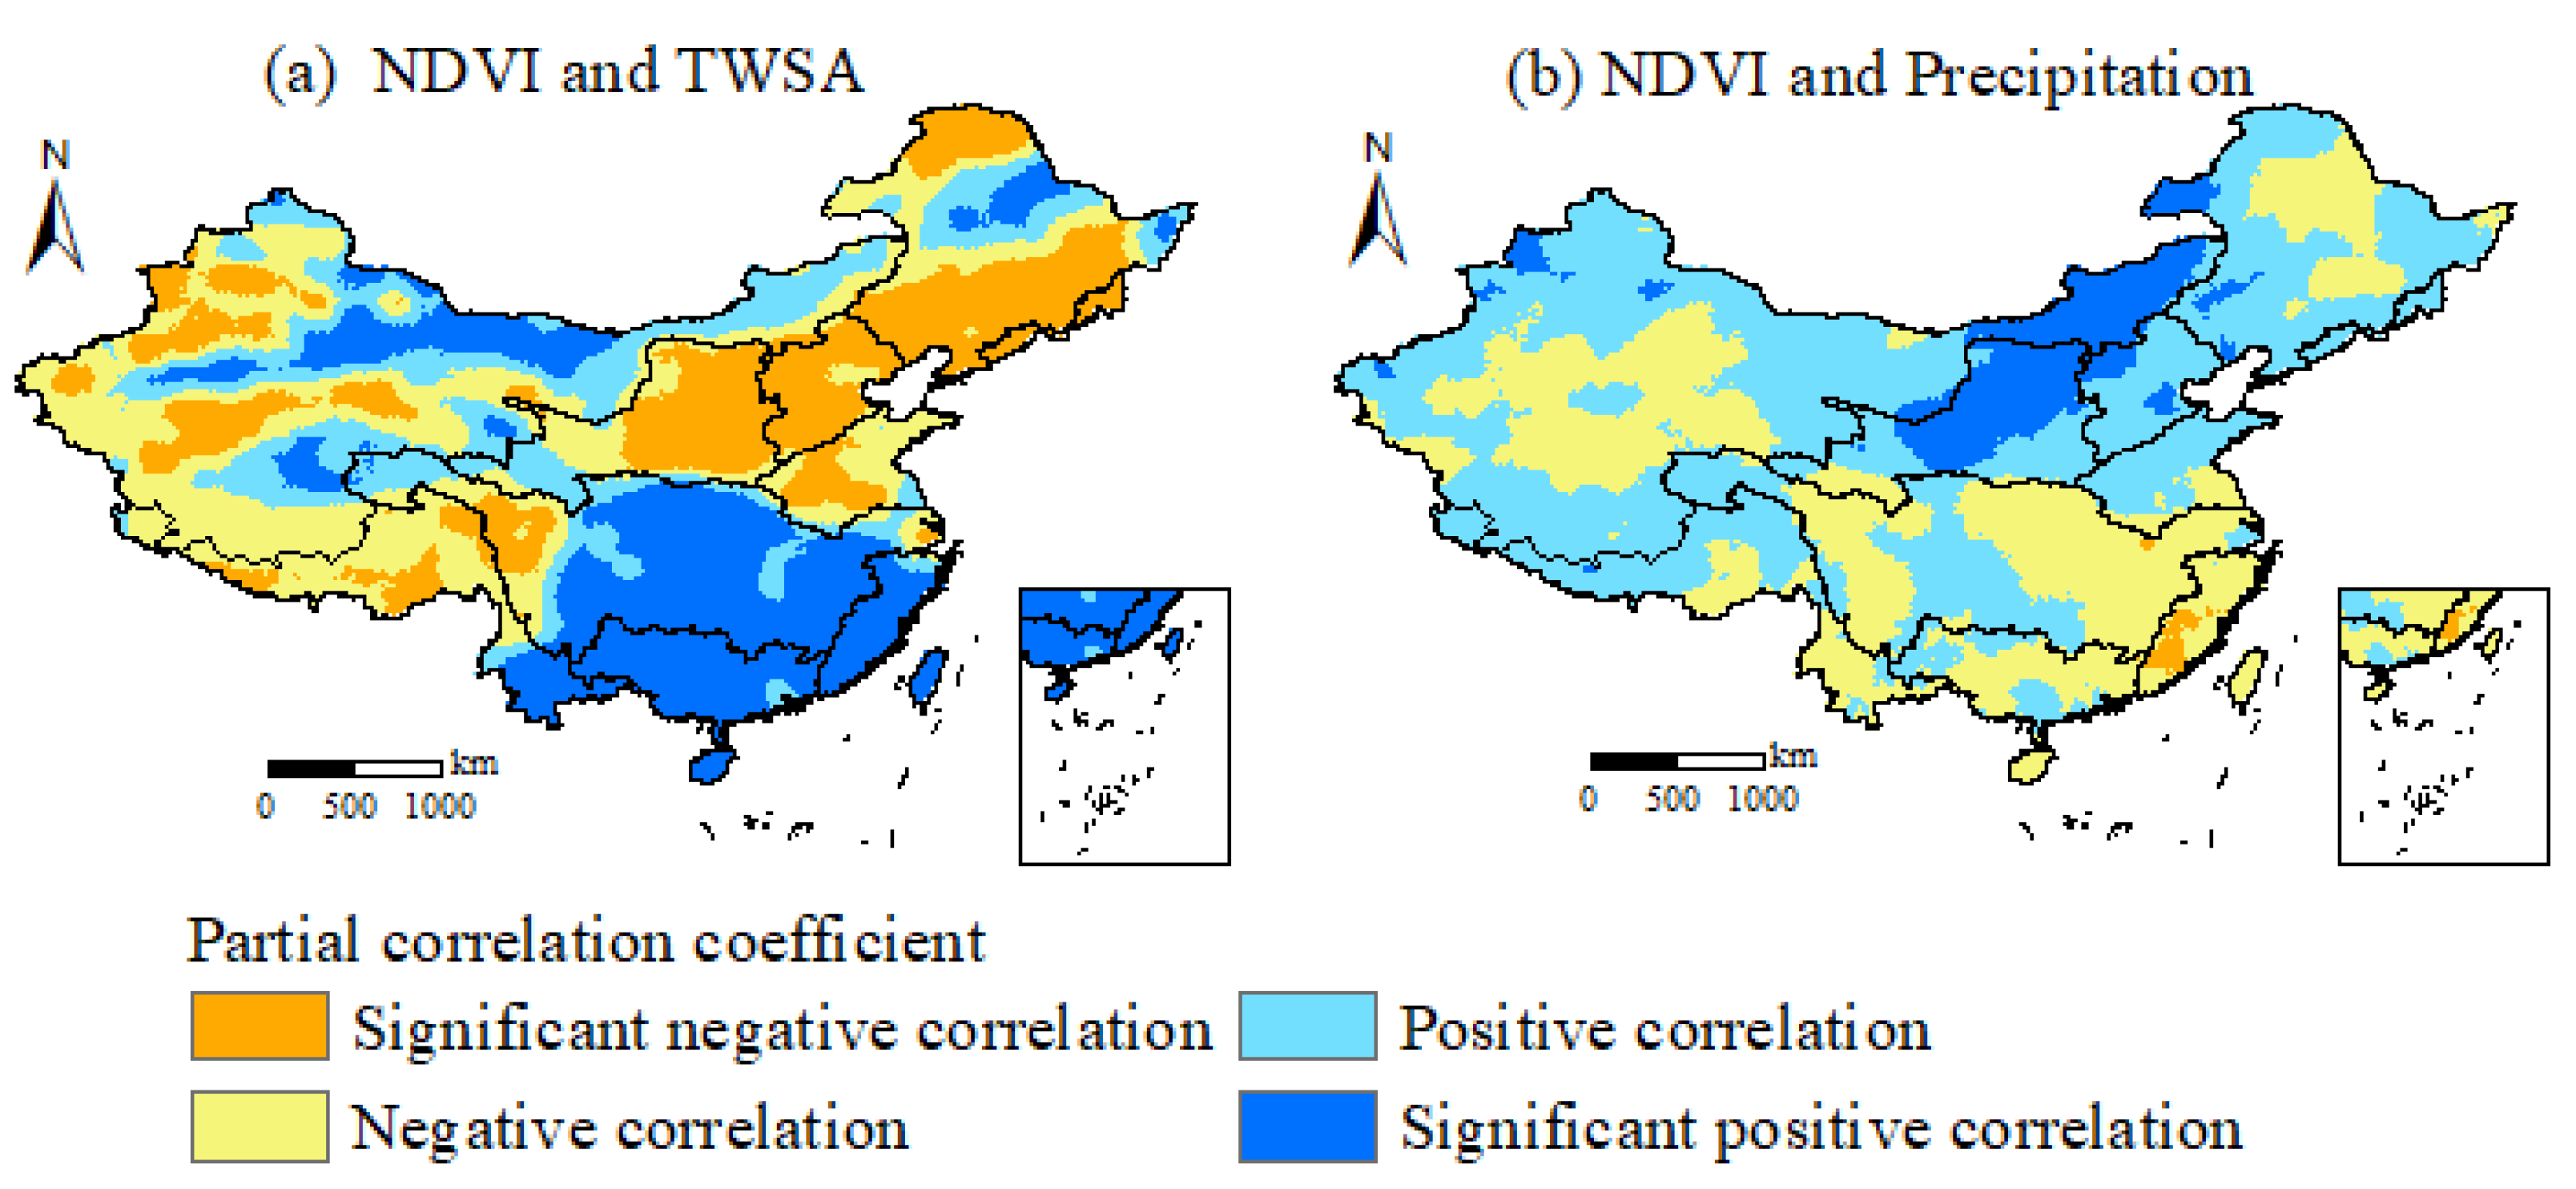
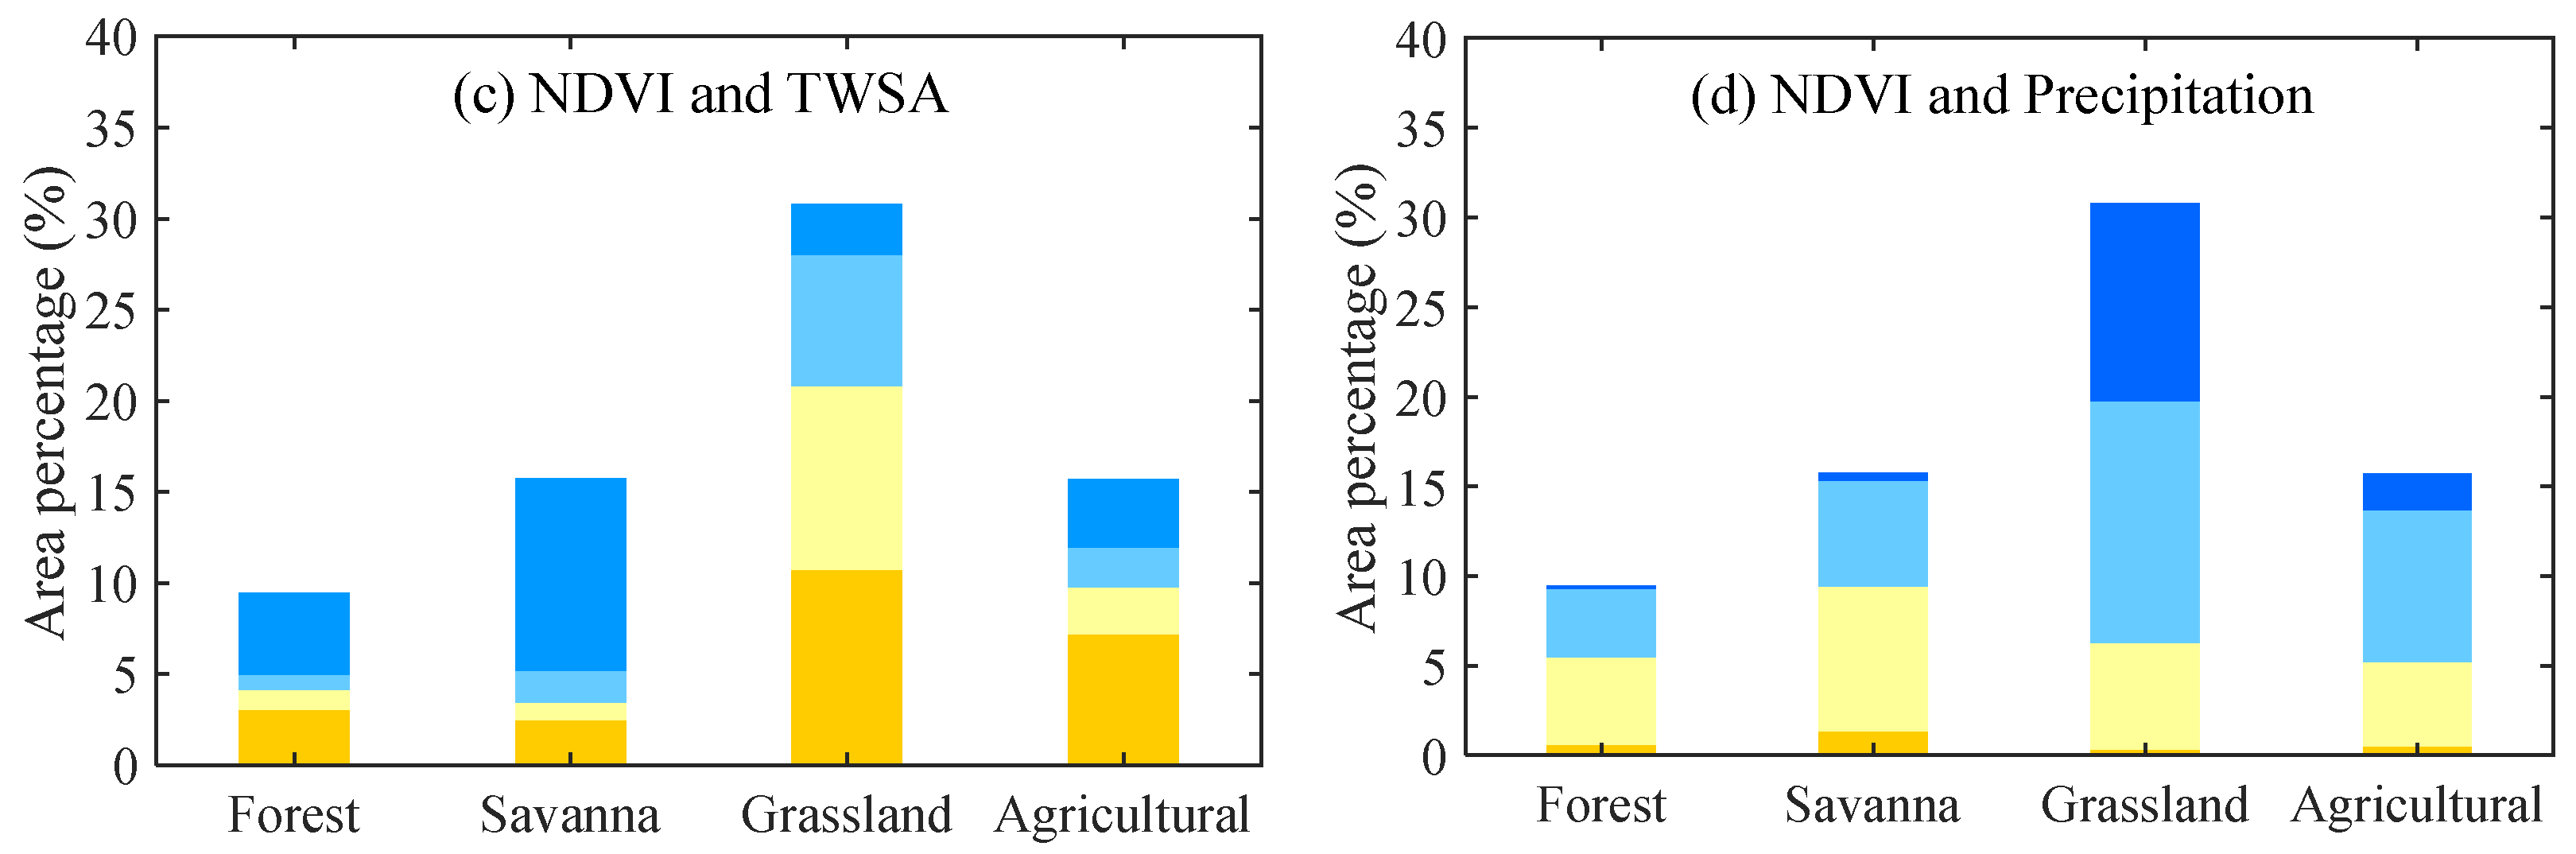
3.3. Response of Vegetation Greenness to TWSA across China

The state of the underlying surface is represented by NDVI, which characterizes the vegetation growth state. This study analyzed the spatiotemporal variation characteristics of NDVI across China from 1982 to 2019 (Figure 6). As illustrated in Figure 6a, the spatial distribution of NDVI manifested a downward trend from southeast to northwest across China during the period 1982–2019. The range of NDVI was between 0.01 and 0.86, with an average value of 0.48. In addition, there was spatial heterogeneity in the changing trend of NDVI across China (Figure 6b). The NDVI displayed a gradually increasing trend, but the vegetation degraded in some areas. From the calculation, it could be seen that the percentages of NDVI pixels with a significantly increasing trend, and increasing trend, were 54.80% and 75.78%, respectively. Overall, the vegetation degradation was more severe in parts of northwest China, while the vegetation had improved significantly in eastern China.
The spatial pattern of the relationship between NDVI and TWSA (or precipitation) across China from 1982 to 2019 was studied (Figure 7). The positive correlation between NDVI and TWSA was 48.64%, and the significant positive correlation accounted for 30.09% of the pixels (Figure 7a). Meanwhile, 51.36% of the pixels showed a negative correlation between the NDVI and TWSA; the significant negative correlation was 30.25%. It was found that NDVI was significantly negative in contact with TWSA in the Song-Liao River basin, Haihe River basin, and Yellow River basin. Spatially, the negative correlation between NDVI and TWSA appeared in arid and semi-arid areas covered mainly by grasslands and agriculture (Figure 7c). In contrast, the positive correlation between NDVI and TWSA appeared in relatively humid regions primarily covered by forests and savannas. As for the precipitation, 61.26% of the pixels exhibited a positive correlation between NDVI and precipitation distribution in most areas of China (Figure 7b). In addition, the positive correlation between NDVI and precipitation was more substantial in areas dominated by grasslands, while savanna-dominated areas were weaker (Figure 7d).
To avoid the impact of snow in winter, it is necessary to better reflect the growth of vegetation [49,50]. This study further analyzed the partial correlation analysis between NDVI, TWSA, and precipitation in the growing season (April–October). Subsequently, the growing season was divided into spring (April–May), summer (June–August), and autumn (September–October). The spatial distribution of the partial correlation between seasonal NDVI, TWSA, and precipitation from 1982 to 2019 across China is shown in Figure 8. Table 6 shows the area proportion of the NDVI, TWSA, and precipitation relationship. Overall, NDVI was positively correlated with TWSA and precipitation. In spring, 52.79% of NDVI in the study area were positively correlated with TWSA, and the significant positive correlation was mainly distributed in the Yangtze River basin (Figure 8a). NDVI was positively correlated with TWSA in summer and autumn, accounting for 60.45% and 57.86%, respectively (Figure 8c,e). As for precipitation, NDVI and precipitation were positively correlated in spring and autumn, accounting for 65.99% and 73.43%, respectively (Figure 8b,f). In summer, the positive and negative correlations between NDVI and precipitation accounted for 56.87% and 43.13% of the study area, respectively (Figure 8d). Among them, the negative correlation was mainly distributed in southern China. Due to the influence of the Asian monsoon, summer precipitation was concentrated [51]. Most of the south was humid, and it would negatively impact vegetation activities when the precipitation increment exceeded its demand [52].
There was spatial heterogeneity in the lags of NDVI to TWSA and precipitation counterparts (Figure 9). The 0–1 month lag of NDVI to TWSA was generally distributed in the southeast and arid areas of China (Figure 9a). NDVI lagged behind TWSA for 5–6 months and was mainly distributed in the Song-Liao, Haihe, and Southwest Rivers. The region of the most significant lag between the NDVI and TWSA series might be the reason for the negative correlation between NDVI and TWSA on an annual scale (Figure 7). The lagged response periods of NDVI to precipitation changes significantly differed between the north and south of China (Figure 9b). The synchronous response of NDVI to precipitation was mainly distributed in the Song-Liao, Haihe, and Yellow Rivers. NDVI lagged in the southern region for 2–4 months in response to precipitation. In addition, the reaction of NDVI to precipitation changes was more substantial in the north than in the south of China. Additionally, short-time lags appeared in arid and semi-arid areas covered mainly by grasslands. In contrast, longer time lags appeared in relatively humid regions primarily covered by forests and savannas (Figure 9c,d).

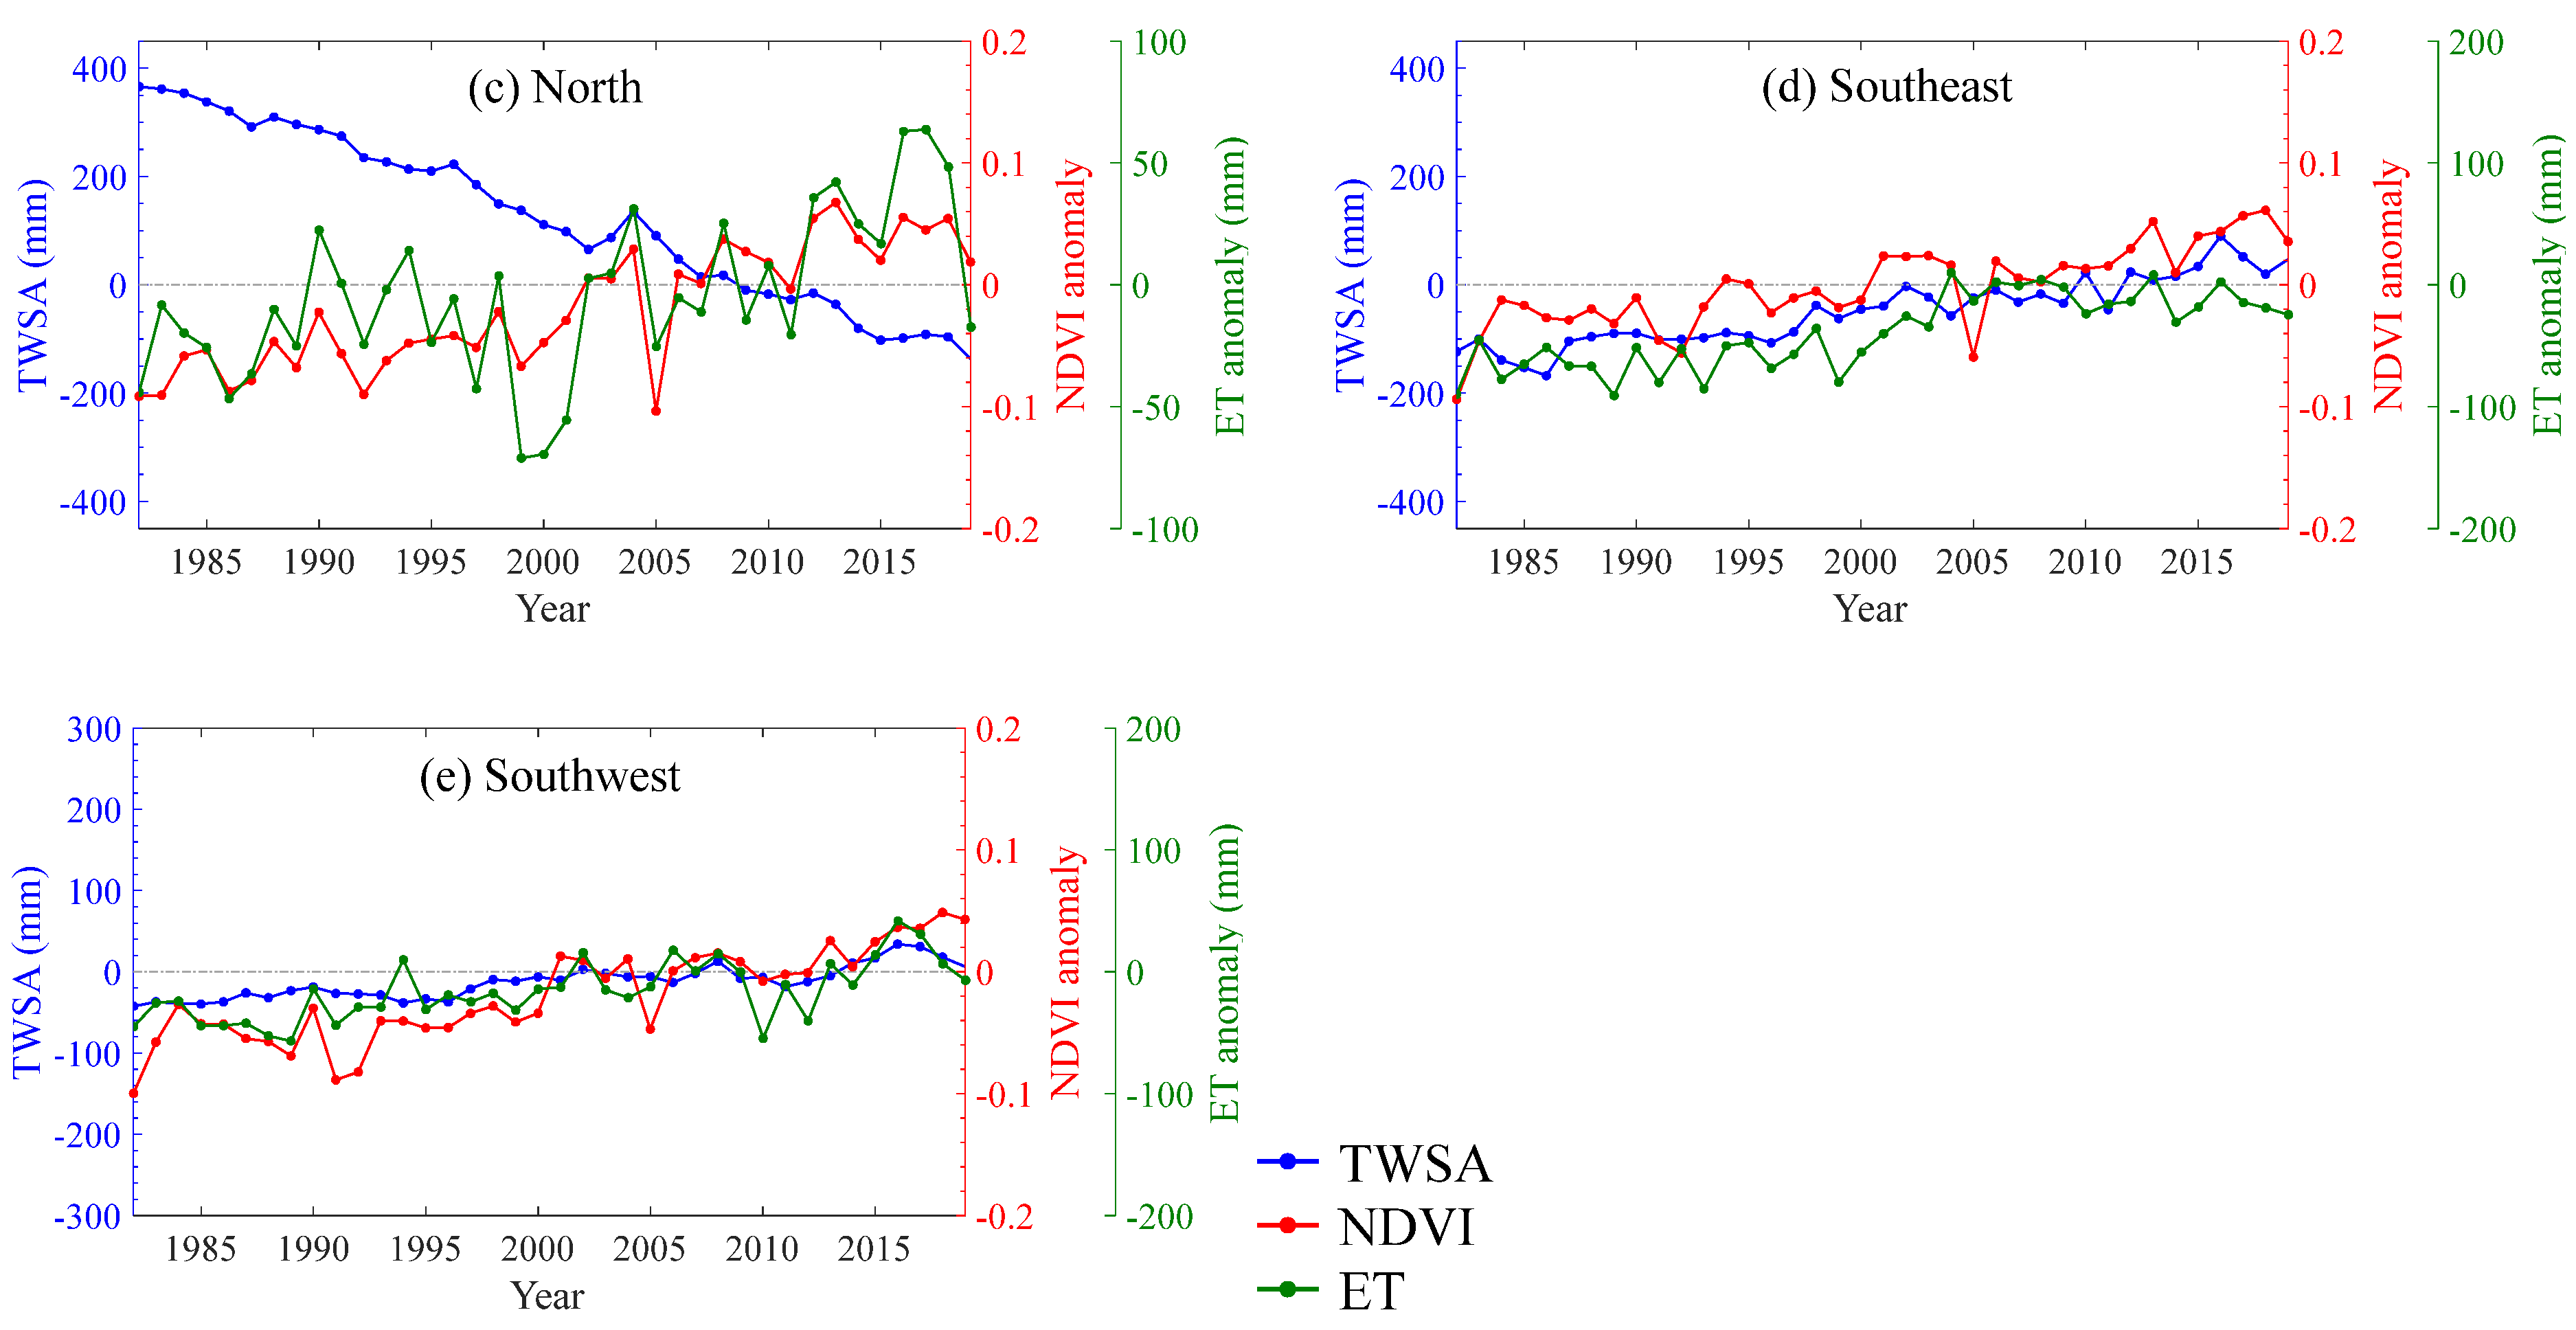
3.4. Relationship between Vegetation and TWSA in Typical Ecological Regions

This study selected five distinct ecological regions to understand the relationship between vegetation and TWSA better. Figure 10 shows the correlation analysis of NDVI and ET in five areas of China from 1982 to 2019. ET was an essential part of the water and heat balance of vegetation ecosystems and a key indicator for measuring the moisture status of vegetation [53]. Except for the Northeast region, the correlation coefficients between NDVI and ET in the other areas passed the significance test above 95%. Notably, the correlation coefficients of NDVI and ET were all greater than 0.65. There was a specific linear relationship between vegetation NDVI and ET. Furthermore, ET could be further added to the analysis of vegetation greenness to terrestrial water storage.
Figure 11 shows the long-term changes in TWSA, NDVI, and ET across China from 1982 to 2019. Since ET was the primary way that vegetation alters TWSA, it was included. In the Northwest and North regions, TWSA showed a downward trend, while NDVI and ET presented an upward trend (Figure 11a,c). Furthermore, the TWSA and ET exhibited similar fluctuation trends, while NDVI showed an increasing trend in the Northeast (Figure 11b). TWSA showed an increasing trend in humid regions with increasing NDVI and ET (Figure 11d,e). Notably, precipitation in moisturizing areas was often not a driving factor for vegetation changes. In general, TWSAs in the Northwest and North regions decreased as NDVI and ET increased, and in Southeast and Southwest humid regions with NDVI and ET increased.

4. Discussion

China experienced substantial changes in vegetation cover, with a 75.78% increase trend in NDVI from 1982 to 2019. Afforestation largely explains the spatial pattern of vegetation greening across China. Some studies have shown whether large-scale vegetation restoration leads to a decrease in regional water storage. Previous studies suggested that implementing ecological engineering was beneficial in promoting vegetation greening and related ET [8]. The increase in ET has led to decreased surface water and negatively impacted TWSA, especially in water-limited areas. For instance, Li et al. [54] showed that large-scale afforestation in North China led to an enhanced trend in soil drying. Lv et al. [55] investigated that the increase in ET and precipitation dominated the decrease in TWS change in the Yellow River basin, and that the increased vegetation coverage could affect multiple hydrological processes. Li et al. [56] indicated that increased vegetation productivity promoted increased ET but resulted in decreased TWSA in the Three-North Region of China and Mongolia. However, it should be noted that high spatial heterogeneity in the vegetation impacts TWSA variables across China.
The positive correlation between NDVI and TWSA accounts for 48.64% of the total vegetation area across China. Spatially, the negative correlation between NDVI and TWSA appeared in arid and semi-arid areas covered mainly by grasslands and agriculture. In contrast, the positive correlation between NDVI and TWSA appeared in relatively humid regions primarily covered by forests and savannas. Previous studies have reached similar conclusions about the interaction between vegetation and TWSA. For instance, Asoka et al. [57] reported that TWS was strikingly positively contacted with NDVI in most places in the world, except for the energy-limited environment in northern latitudes. Xie et al. [1] revealed that TWSA was significantly positively correlated with NDVI in about 43.17% of the world’s regions from 2003 to 2015. In addition, the response of vegetation greenness lags behind the TWSA and precipitation, and short-time lags appeared in arid and semi-arid areas covered mainly by grasslands. In contrast, longer-time lags appeared in relatively humid regions primarily covered by forests and savannas. This result was consistent with some other studies. For example, Wu et al. [58] reported that the time lag in arid and semiarid areas was approximately 1 month, indicating the demand for water by regional vegetation in these areas. Anderson et al. [59] suggested that the response of vegetation greenness lags behind the TWSA, and the length of the time lags seems to depend on the climate aridity, with more arid climates corresponding to shorter time lags.
In addition, TWSAs in Northwest and North China decreased as NDVI and ET increased, and in Southeast and Southwest China, with NDVI and ET increased. The increasing temperature, ameliorative vegetational coverage, and excessive groundwater withdrawal jointly led to decreased TWSAs in the Northwest region [60]. Meanwhile, warming-caused snowmelt and enhanced ET might also be responsible for the TWSA decrease in the Northwest region [61,62]. Furthermore, the Haihe River was a typical irrigation agricultural area, and groundwater pumping led to the rapid decline in TWSA [63]. In the humid regions of Southeast and Southwest China, greening vegetation enhances the water cycle by increasing ET and precipitation [16]. However, the atmospheric water circulation caused by ET is relatively reduced in arid regions. Previous studies have also reached similar conclusions. For instance, Xu et al. [23] showed that ice melting under human-caused climate change was a driver of decreasing TWS in northwestern China. At the same time, human water use was responsible mainly for groundwater depletion in northern China. They also found that precipitation increases likely caused the increasing TWS in southern China. Xie et al. [1] suggested that the increase in vegetation greenness was an important reason for the decline of TWSA in Northern and Northwest China, and vegetation greenness had an optimistic influence on TWSA in Southwest and South China. Zeng et al. [16] showed that the increase in vegetation did not markedly diminish runoff and soil moisture in humid regions, but it did strikingly decrease soil moisture in arid regions.
Global warming and vegetation greening may impact the change in TWSA. However, anthropogenic activities, such as land use/land cover changes, can also significantly alter TWSA. Through the quantitative analysis of natural and human factors on TWSA by the Geodetector model, it could be found that NDVI, precipitation, and ET were some of the main factors affecting TWSA. Previous research indicated that water conservation was mainly influenced by climate and vegetation. For instance, Chen et al. [28] suggested that the water conservation capacity of the entire region, mountains, plateaus, and plains of Beijing-Tianjin-Hebei was affected mainly by the soil-saturated hydraulic conductivity, plant-available water content, precipitation, and precipitation, respectively. Zeng and Li [64] found that the key influencing factors impacting water conservation included precipitation, ET, and land use from 2005 to 2050 in the Weihe River. They also found that the key state subset of key variables corresponding to the highest state of water conservation had the characteristics of high vegetation coverage. From the perspective of water balance, Meng et al. [65] reported that TWS changes were mainly attributed to changes in precipitation and evaporation in the Tibetan Plateau from 2003 to 2014.
This study was mainly based on satellite products, so certain limitations and uncertainties existed. Firstly, satellite products would be affected by atmospheric conditions, sun angle, and other factors; thus, there was a specific deviation in accuracy [66]. Satellite-observed NDVI often suffer from saturation problems in areas with high vegetation coverage [67]. Secondly, GRACE has monitored the global TWSA since 2002. This study employed a new global reconstruction of the long-term TWSA from 1982 to 2019. Although the results verified that the reconstructed TWSA has high reliability, there were also specific errors [33]. Thirdly, the potential factors affecting TWSA change selected in this study are not comprehensive. Some other natural and anthropogenic factors (e.g., solar radiation, soil moisture, geomorphic type, GDP, water conservation projects, and human water usage) should be considered in future research [29]. Despite these limitations, this study effectively quantified the relative contribution of the main driving factors and their interactions with TWSA.

5. Conclusions

Based on the observed and satellite hydro-meteorological data, this study investigated the effects of climate change and vegetation greening on TWSA across China using the Geodetector model. The main conclusions are as follows:
(1)
The area of TWSA showed a decreasing trend of 61.16%, and only 38.84% of the region showed an increasing trend across China from 1982 to 2019. Simultaneously, the areas of significant decline were mainly distributed in North China, southeast Tibet, and Xinjiang in the northwest, and the areas of significant increase were primarily in the Qaidam Basin, the Yangtze River, and the Songhua River.
(2)
Vegetation showed a significant greening trend, and the increase accounted for 75.78% across China from 1982 to 2019. The positive correlation between NDVI and TWSA was 48.64% across China. Considering the lag effect between monthly NDVI and TWSA, precipitation, the lag time was shorter in arid and semi-arid regions dominated by grasslands, and longer in relatively humid regions dominated by forests and savannas.
(3)
TWSAs decreased with the increase in NDVI and ET in arid and semi-arid regions and increased with the increase in NDVI and ET in humid regions. The Geodetector model further discussed the influence of climate and human factors on the variability of TWSA. The results showed that the three most critical variables affecting TWSA were NDVI, precipitation, and ET, with 0.213, 0.198, and 0.162 values, respectively.

Author Contributions

Conceptualization, Z.Z.; methodology, Y.Z. and Y.W.; software, Z.P.; formal analysis and writing—original draft, R.K.; writing—review and editing, Z.Z. and C.-Y.X.; supervision, X.C. All authors have read and agreed to the published version of the manuscript.

Funding

This work was supported by the Key Research and Development Program of Xinjiang Uygur Autonomous Region, China (2022B03030), the National Natural Science Foundation of China (No. 41971025), the West Light Foundation of the Chinese Academy of Sciences (No. 2019-XBYJRC-001 and 2019-XBQNXZ-B-004), and the Postgraduate Research & Practice Innovation Program of Jiangsu Province (No. KYCX22_0634).

Data Availability Statement

Not applicable.

Acknowledgments

We would like to thank the National Climate Center in Beijing for providing valuable climate datasets. In addition, we sincerely thank the editor and anonymous reviewers for their valuable comments and suggestions for improving the quality of this paper.

Conflicts of Interest

The authors declare no conflict of interest.

References

  1. Xie, X.; He, B.; Guo, L.; Miao, C.; Zhang, Y. Detecting hotspots of interactions between vegetation greenness and terrestrial water storage using satellite observations. Remote Sens. Environ. 2019, 231, 111259. [Google Scholar] [CrossRef]
  2. Meng, S.; Xie, X.; Zhu, B.; Wang, Y. The relative contribution of vegetation greening to the hydrological cycle in the Three-North region of China: A modelling analysis. J. Hydrol. 2020, 591, 125689. [Google Scholar] [CrossRef]
  3. Tong, X.; Brandt, M.; Yue, Y.; Ciais, P.; Rudbeck Jepsen, M.; Penuelas, J.; Wigneron, J.P.; Xiao, X.; Song, X.P.; Horion, S.; et al. Forest management in southern China generates short term extensive carbon sequestration. Nat. Commun. 2020, 11, 129. [Google Scholar] [CrossRef] [Green Version]
  4. Liu, Y.; Xiao, J.; Ju, W.; Xu, K.; Zhou, Y.; Zhao, Y. Recent trends in vegetation greenness in China significantly altered annual evapotranspiration and water yield. Environ. Res. Lett. 2016, 11, 094010. [Google Scholar] [CrossRef]
  5. Chen, H.; Zhang, X.; Abla, M.; Lü, D.; Yan, R.; Ren, Q.; Ren, Z.; Yang, Y.; Zhao, W.; Lin, P.; et al. Effects of vegetation and rainfall types on surface runoff and soil erosion on steep slopes on the Loess Plateau, China. Catena 2018, 170, 141–149. [Google Scholar] [CrossRef]
  6. Jiang, B.; Liang, S. Improved vegetation greenness increases summer atmospheric water vapor over Northern China. J. Geophys. Res. Atmos. 2013, 118, 8129–8139. [Google Scholar] [CrossRef]
  7. Wei, Z.; Yoshimura, K.; Wang, L.; Miralles, D.G.; Jasechko, S.; Lee, X. Revisiting the contribution of transpiration to global terrestrial evapotranspiration. Geophys. Res. Lett. 2017, 44, 2792–2801. [Google Scholar] [CrossRef] [Green Version]
  8. Feng, X.; Fu, B.; Piao, S.; Wang, S.; Ciais, P.; Zeng, Z.; Lü, Y.; Zeng, Y.; Li, Y.; Jiang, X.; et al. Revegetation in China’s Loess Plateau is approaching sustainable water resource limits. Nat. Clim. Chang. 2016, 6, 1019–1022. [Google Scholar] [CrossRef]
  9. Lu, F.; Hu, H.; Sun, W.; Zhu, J.; Liu, G.; Zhou, W.; Zhang, Q.; Shi, P.; Liu, X.; Wu, X.; et al. Effects of national ecological restoration projects on carbon sequestration in China from 2001 to 2010. Proc. Natl. Acad. Sci. USA 2018, 115, 4039–4044. [Google Scholar] [CrossRef] [Green Version]
  10. Wang, X.; Xiao, X.; Zou, Z.; Dong, J.; Qin, Y.; Doughty, R.B.; Menarguez, M.A.; Chen, B.; Wang, J.; Ye, H.; et al. Gainers and losers of surface and terrestrial water resources in China during 1989–2016. Nat. Commun. 2020, 11, 3471. [Google Scholar] [CrossRef]
  11. Zhao, M.; Geruo, A.; Zhang, J.; Velicogna, I.; Liang, C.; Li, Z. Ecological restoration impact on total terrestrial water storage. Nat. Sustain. 2020, 4, 56–62. [Google Scholar] [CrossRef]
  12. Jia, X.; Shao, M.A.; Zhu, Y.; Luo, Y. Soil moisture decline due to afforestation across the Loess Plateau, China. J. Hydrol. 2017, 546, 113–122. [Google Scholar] [CrossRef]
  13. van Dijke, A.J.H.; Herold, M.; Mallick, K.; Benedict, I.; Machwitz, M.; Schlerf, M.; Pranindita, A.; Theeuwen, J.J.E.; Bastin, J.F.; Teuling, A.J. Shifts in regional water availability due to global tree restoration. Nat. Geosci. 2022, 15, 363–368. [Google Scholar] [CrossRef]
  14. Papagiannopoulou, C.; Miralles, D.G.; Dorigo, W.; Verhoest, N.E.C.; Depoorter, M.; Waegeman, W. Vegetation anomalies caused by antecedent precipitation in most of the world. Environ. Res. Lett. 2017, 12, 074016. [Google Scholar] [CrossRef]
  15. Yang, Y.; Long, D.; Guan, H.; Scanlon, B.R.; Simmons, C.T.; Jiang, L.; Xu, X. GRACE satellite observed hydrological controls on interannual and seasonal variability in surface greenness over mainland Australia. J. Geophys. Res. Biogeosci. 2014, 119, 2245–2260. [Google Scholar] [CrossRef]
  16. Zeng, Z.; Piao, S.; Li, L.Z.X.; Wang, T.; Ciais, P.; Lian, X.; Yang, Y.; Mao, J.; Shi, X.; Myneni, R.B. Impact of Earth Greening on the Terrestrial Water Cycle. J. Clim. 2018, 31, 2633–2650. [Google Scholar] [CrossRef]
  17. Chen, Y.; Yang, K.; Qin, J.; Zhao, L.; Tang, W.; Han, M. Evaluation of AMSR-E retrievals and GLDAS simulations against observations of a soil moisture network on the central Tibetan Plateau. J. Geophys. Res. Atmos. 2013, 118, 4466–4475. [Google Scholar] [CrossRef]
  18. Chen, A.; Guan, H.; Batelaan, O. Non-linear interactions between vegetation and terrestrial water storage in Australia. J. Hydrol. 2022, 613, 128226. [Google Scholar] [CrossRef]
  19. Andrew, R.L.; Guan, H.; Batelaan, O. Large-scale vegetation responses to terrestrial moisture storage changes. Hydrol. Earth Syst. Sci. 2017, 21, 4469–4478. [Google Scholar] [CrossRef] [Green Version]
  20. Wang, H.; Duan, K.; Liu, B.; Chen, X. Assessing the large-scale plant-water relations using remote sensing products in the humid subtropical Pearl River Basin in south China. Hydrol. Earth Syst. Sci. 2020. [Google Scholar] [CrossRef]
  21. Song, C.; Ke, L.; Huang, B.; Richards, K.S. Can mountain glacier melting explains the GRACE-observed mass loss in the southeast Tibetan Plateau: From a climate perspective? Glob. Planet. Change 2015, 124, 1–9. [Google Scholar] [CrossRef]
  22. Wang, D.; Hejazi, M. Quantifying the relative contribution of the climate and direct human impacts on mean annual streamflow in the contiguous United States. Water Resour. Res. 2011, 47, W00J12. [Google Scholar] [CrossRef] [Green Version]
  23. Xu, L.; Chen, N.; Zhang, X.; Chen, Z. Spatiotemporal Changes in China’s Terrestrial Water Storage From GRACE Satellites and Its Possible Drivers. J. Geophys. Res. Atmos. 2019, 124, 11976–11993. [Google Scholar] [CrossRef]
  24. Xie, X.; Liang, S.; Yao, Y.; Jia, K.; Meng, S.; Li, J. Detection and attribution of changes in hydrological cycle over the Three-North region of China: Climate change versus afforestation effect. Agric. For. Meteorol. 2015, 203, 74–87. [Google Scholar] [CrossRef]
  25. Gao, G.; Fu, B.; Wang, S.; Liang, W.; Jiang, X. Determining the hydrological responses to climate variability and land use/cover change in the Loess Plateau with the Budyko framework. Sci. Total Environ. 2016, 557–558, 331–342. [Google Scholar] [CrossRef]
  26. Scanlon, B.R.; Zhang, Z.; Save, H.; Sun, A.Y.; Muller Schmied, H.; van Beek, L.P.H.; Wiese, D.N.; Wada, Y.; Long, D.; Reedy, R.C.; et al. Global models underestimate large decadal declining and rising water storage trends relative to GRACE satellite data. Proc. Natl. Acad. Sci. USA 2018, 115, E1080–E1089. [Google Scholar] [CrossRef] [Green Version]
  27. Wang, J.F.; Zhang, T.L.; Fu, B.J. A measure of spatial stratified heterogeneity. Ecol. Ind. 2016, 67, 250–256. [Google Scholar] [CrossRef]
  28. Chen, J.; Wang, D.; Li, G.; Sun, Z.; Wang, X.; Zhang, X.; Zhang, W. Spatial and Temporal Heterogeneity Analysis of Water Conservation in Beijing-Tianjin-Hebei Urban Agglomeration Based on the Geodetector and Spatial Elastic Coefficient Trajectory Models. GeoHealth 2020, 4, e2020GH000248. [Google Scholar] [CrossRef]
  29. Wang, Y.; Zhang, Z.; Chen, X. Quantifying Influences of Natural and Anthropogenic Factors on Vegetation Changes Based on Geodetector: A Case Study in the Poyang Lake Basin, China. Remote Sens. 2021, 13, 5081. [Google Scholar] [CrossRef]
  30. Chu, J.; Su, X.; Wu, H.; Liu, Y.; Feng, K. Analysis of China’s terrestrial water storage and its component anomalies in recent 20 years. Water Resour. Pro. 2022, 1, 1–13. [Google Scholar]
  31. Zhang, Z.; Chen, X.; Xu, C.-Y.; Yuan, L.; Yong, B.; Yan, S. Evaluating the non-stationary relationship between precipitation and streamflow in nine major basins of China during the past 50 years. J. Hydrol. 2011, 409, 81–93. [Google Scholar] [CrossRef]
  32. Jiang, P.; Ding, W.; Yuan, Y.; Ye, W.; Mu, Y. Interannual variability of vegetation sensitivity to climate in China. J. Environ. Manag. 2022, 301, 113768. [Google Scholar] [CrossRef] [PubMed]
  33. Li, F.; Kusche, J.; Chao, N.; Wang, Z.; Löcher, A. Long-Term (1979-Present) Total Water Storage Anomalies Over the Global Land Derived by Reconstructing GRACE Data. Geophys. Res. Lett. 2021, 48, e2021GL093492. [Google Scholar] [CrossRef]
  34. Reager, J.T.; Thomas, B.F.; Famiglietti, J.S. River basin flood potential inferred using GRACE gravity observations at several months lead time. Nat. Geosci. 2014, 7, 588–592. [Google Scholar] [CrossRef]
  35. Feng, W.; Zhong, M.; Lemoine, J.-M.; Biancale, R.; Hsu, H.-T.; Xia, J. Evaluation of groundwater depletion in North China using the Gravity Recovery and Climate Experiment (GRACE) data and ground-based measurements. Water Resour. Res. 2013, 49, 2110–2118. [Google Scholar] [CrossRef]
  36. Zhao, M.; Geruo, A.; Velicogna, I.; Kimball, J.S. A Global Gridded Dataset of GRACE Drought Severity Index for 2002–14: Comparison with PDSI and SPEI and a Case Study of the Australia Millennium Drought. J. Hydrometeorol. 2017, 18, 2117–2129. [Google Scholar] [CrossRef] [Green Version]
  37. Martens, B.; Miralles, D.G.; Lievens, H.; van der Schalie, R.; de Jeu, R.A.M.; Fernández-Prieto, D.; Beck, H.E.; Dorigo, W.A.; Verhoest, N.E.C. GLEAM v3: Satellite-based land evaporation and root-zone soil moisture. Geosci. Model Dev. 2017, 10, 1903–1925. [Google Scholar] [CrossRef] [Green Version]
  38. Miralles, D.G.; Holmes, T.R.H.; De Jeu, R.A.M.; Gash, J.H.; Meesters, A.G.C.A.; Dolman, A.J. Global land-surface evaporation estimated from satellite-based observations. Hydrol. Earth Syst. Sci. 2011, 15, 453–469. [Google Scholar] [CrossRef] [Green Version]
  39. Aybar, C.; Wu, Q.; Bautista, L.; Yali, R.; Barja, A. rgee: An R package for interacting with Google Earth Engine. J. Open Sour. Soft. 2020, 5, 2272. [Google Scholar] [CrossRef]
  40. Gorelick, N.; Hancher, M.; Dixon, M.; Ilyushchenko, S.; Thau, D.; Moore, R. Google Earth Engine: Planetary-scale geospatial analysis for everyone. Remote Sens. Environ. 2017, 202, 18–27. [Google Scholar] [CrossRef]
  41. Zhu, B.; Zhang, Z.; Tian, J.; Kong, R.; Chen, X. Increasing Negative Impacts of Climatic Change and Anthropogenic Activities on Vegetation Variation on the Qinghai–Tibet Plateau during 1982–2019. Remote Sens. 2022, 14, 4735. [Google Scholar] [CrossRef]
  42. Zhe, M.; Zhang, X. Time-lag effects of NDVI responses to climate change in the Yamzhog Yumco Basin, South Tibet. Ecol. Ind. 2021, 124, 107431. [Google Scholar] [CrossRef]
  43. Sheffield, J.; Ferguson, C.R.; Troy, T.J.; Wood, E.F.; McCabe, M.F. Closing the terrestrial water budget from satellite remote sensing. Geophys. Res. Lett. 2009, 36, L07403. [Google Scholar] [CrossRef]
  44. Mehdizadeh, S.; Ahmadi, F.; Danandeh Mehr, A.; Safari, M.J.S. Drought modeling using classic time series and hybrid wavelet-gene expression programming models. J. Hydrol. 2020, 587, 125017. [Google Scholar] [CrossRef]
  45. Zhang, Y.; Hu, X.; Zhang, Z.; Kong, R.; Peng, Z.; Zhang, Q.; Chen, X. The increasing risk of future simultaneous droughts over the Yangtze River basin based on CMIP6 models. Stoch. Environ. Res. Risk Assess. 2023. [Google Scholar] [CrossRef]
  46. Sen, P.K. Estimates of the Regression Coefficient Based on Kendall’s Tau. J. Am. Stat. Assoc. 1968, 63, 1379–1389. [Google Scholar] [CrossRef]
  47. Wang, J.; Xu, C. Geodetector: Principle and prospective. Acta Geogr. Sin. 2017, 72, 116–134. [Google Scholar]
  48. Peng, W.; Kuang, T.; Tao, S. Quantifying influences of natural factors on vegetation NDVI changes based on geographical detector in Sichuan, western China. J. Clean Prod. 2019, 233, 353–367. [Google Scholar] [CrossRef]
  49. Piao, S.; Mohammat, A.; Fang, J.; Cai, Q.; Feng, J. NDVI-based increase in growth of temperate grasslands and its responses to climate changes in China. Glob. Environ. Change 2006, 16, 340–348. [Google Scholar] [CrossRef]
  50. Hou, W.; Gao, J.; Wu, S.; Dai, E. Interannual Variations in Growing-Season NDVI and Its Correlation with Climate Variables in the Southwestern Karst Region of China. Remote Sens. 2015, 7, 11105–11124. [Google Scholar] [CrossRef] [Green Version]
  51. Zhong, L.; Ma, Y.; Salama, M.S.; Su, Z. Assessment of vegetation dynamics and their response to variations in precipitation and temperature in the Tibetan Plateau. Clim. Change 2010, 103, 519–535. [Google Scholar] [CrossRef]
  52. Ukkola, A.M.; Prentice, I.C.; Keenan, T.F.; van Dijk, A.I.J.M.; Viney, N.R.; Myneni, R.B.; Bi, J. Reduced streamflow in water-stressed climates consistent with CO2 effects on vegetation. Nat. Clim. Change 2015, 6, 75–78. [Google Scholar] [CrossRef] [Green Version]
  53. Zhu, X.J.; Yu, G.R.; Hu, Z.M.; Wang, Q.F.; He, H.L.; Yan, J.H.; Wang, H.M.; Zhang, J.H. Spatiotemporal variations of T/ET (the ratio of transpiration to evapotranspiration) in three forests of Eastern China. Ecol. Ind. 2015, 52, 411–421. [Google Scholar] [CrossRef] [Green Version]
  54. Li, Y.; Piao, S.; Li, L.Z.X.; Chen, A.; Wang, X.; Ciais, P.; Huang, L.; Lian, X.; Peng, S.; Zeng, Z.; et al. Divergent hydrological response to large-scale afforestation and vegetation greening in China. Sci. Adv. 2018, 4, eaar4182. [Google Scholar] [CrossRef] [Green Version]
  55. Lv, M.; Ma, Z.; Li, M.; Zheng, Z. Quantitative Analysis of Terrestrial Water Storage Changes Under the Grain for Green Program in the Yellow River Basin. J. Geophys. Res.-Atmos. 2019, 124, 1336–1351. [Google Scholar] [CrossRef]
  56. Li, D.; Liu, K.; Wang, S.; Wu, T.; Li, H.; Bo, Y.; Zhang, H.; Huang, Y.; Li, X. Four decades of hydrological response to vegetation dynamics and anthropogenic factors in the Three-North Region of China and Mongolia. Sci. Total Environ. 2023, 857, 159546. [Google Scholar] [CrossRef] [PubMed]
  57. Asoka, A.; Wardlow, B.; Tsegaye, T.; Huber, M.; Mishra, V. A Satellite-Based Assessment of the Relative Contribution of Hydroclimatic Variables on Vegetation Growth in Global Agricultural and Nonagricultural Regions. J. Geophys. Res.-Atmos. 2021, 126, e2020JD033228. [Google Scholar] [CrossRef]
  58. Wu, D.; Zhao, X.; Liang, S.; Zhou, T.; Huang, K.; Tang, B.; Zhao, W. Time-lag effects of global vegetation responses to climate change. Glob. Change Biol. 2015, 21, 3520–3531. [Google Scholar] [CrossRef] [PubMed]
  59. Anderson, L.O.; Malhi, Y.; Aragao, L.E.; Ladle, R.; Arai, E.; Barbier, N.; Phillips, O. Remote sensing detection of droughts in Amazonian forest canopies. New Phytol. 2010, 187, 733–750. [Google Scholar] [CrossRef]
  60. Xie, Y.; Huang, S.; Liu, S.; Leng, G.; Peng, J.; Huang, Q.; Li, P. GRACE-Based Terrestrial Water Storage in Northwest China: Changes and Causes. Remote Sens. 2018, 10, 1163. [Google Scholar] [CrossRef] [Green Version]
  61. Xiang, L.; Wang, H.; Steffen, H.; Wu, P.; Jia, L.; Jiang, L.; Shen, Q. Groundwater storage changes in the Tibetan Plateau and adjacent areas revealed from GRACE satellite gravity data. Earth Planet. Sci. Lett. 2016, 449, 228–239. [Google Scholar] [CrossRef] [Green Version]
  62. Deng, H.; Chen, Y. Influences of recent climate change and human activities on water storage variations in Central Asia. J. Hydrol. 2017, 544, 46–57. [Google Scholar] [CrossRef]
  63. Pan, Y.; Zhang, C.; Gong, H.; Yeh, P.J.F.; Shen, Y.; Guo, Y.; Huang, Z.; Li, X. Detection of human-induced evapotranspiration using GRACE satellite observations in the Haihe River basin of China. Geophys. Res. Lett. 2017, 44, 190–199. [Google Scholar] [CrossRef]
  64. Zeng, L.; Li, J. A Bayesian belief network approach for mapping water conservation ecosystem service optimization region. J. Geogr. Sci. 2019, 29, 1021–1038. [Google Scholar] [CrossRef] [Green Version]
  65. Meng, F.; Su, F.; Li, Y.; Tong, K. Changes in Terrestrial Water Storage During 2003–2014 and Possible Causes in Tibetan Plateau. J. Geophys. Res.-Atmos. 2019, 124, 2909–2931. [Google Scholar] [CrossRef]
  66. Shen, X.; Liu, B.; Henderson, M.; Wang, L.; Jiang, M.; Lu, X. Vegetation Greening, Extended Growing Seasons, and Temperature Feedbacks in Warming Temperate Grasslands of China. J. Clim. 2022, 35, 5103–5117. [Google Scholar] [CrossRef]
  67. Morton, D.C.; Nagol, J.; Carabajal, C.C.; Rosette, J.; Palace, M.; Cook, B.D.; Vermote, E.F.; Harding, D.J.; North, P.R. Amazon forests maintain consistent canopy structure and greenness during the dry season. Nature 2014, 506, 221–224. [Google Scholar] [CrossRef] [Green Version]
Figure 1. Locations of the nine river basins and land cover across China.
Remotesensing 15 03104 g001
Figure 2. Spatial distribution of the rate of TWSA (a), precipitation (b), ET (c), and streamflow (d) across China from 1982 to 2019. The dots indicate the significant trend was estimated at the 95% confidence level based on the MMK test.
Remotesensing 15 03104 g002
Figure 3. Comparison between annual mean TWSA and precipitation, ET, and streamflow anomalies in the nine river basins of China (ai) from 1982 to 2019.
Remotesensing 15 03104 g003
Figure 4. The q values of driving factors across China.
Remotesensing 15 03104 g004
Figure 5. The q values of interaction between factors across China. Note: “*” and “**” represent the interaction types of bi-variable enhanced and nonlinear-enhanced, respectively.
Remotesensing 15 03104 g005
Figure 6. Spatial distribution of vegetation NDVI across China from 1982 to 2019 (a); Spatial distribution of the rate of vegetation NDVI across China from 1982 to 2019 (b). The dots indicate the significant trend was estimated at the 95% confidence level based on the MMK test.
Remotesensing 15 03104 g006
Figure 7. The partial correlation coefficient between NDVI and TWSA (a), and precipitation (b) across China from 1982 to 2019; (c,d) indicate area ratios with land cover types.
Remotesensing 15 03104 g007aRemotesensing 15 03104 g007b
Figure 8. The partial correlation coefficient between seasonal NDVI and TWSA (a,c,e), and precipitation (b,d,f) across China from 1982 to 2019; (a,b) represent spring; (c,d) represent summer; (e,f) represent autumn.
Remotesensing 15 03104 g008
Figure 9. The time lags of the NDVI to TWSA (a) and precipitation (b) correspond to the maximum coefficient across China from 1982 to 2019; (c,d) indicate area ratios with land cover types.
Remotesensing 15 03104 g009
Figure 10. Scatterplot of interannual NDVI and ET from 1982 to 2019 in Northwest (a), Northeast (b), North (c), Southeast (d), and Southwest (e) China.
Remotesensing 15 03104 g010
Figure 11. Linear change trends of the TWSA, NDVI, and ET from 1982 to 2019 in Northwest (a), Northeast (b), North (c), Southeast (d), and Southwest (e) China.
Remotesensing 15 03104 g011aRemotesensing 15 03104 g011b
Table 1. Representative typical natural vegetation and climate factors in the nine river basins.
SerialTypical Natural VegetationArea
(×104 km2)
Precipitation
(mm)
Temperature
(°C)
IConiferous forest, Broad-leaved mixed forest, Meadow123.81518.212.44
IIConiferous forest, Deciduous broad-leaved forest, Meadow31.70511.099.66
IIIDeciduous broad-leaved forest, Shrublands, Meadow80.89468.315.93
IVBroad-leaved mixed forest32.40835.1014.37
VEvergreen broad-leaved forest179.921086.2410.99
VISubtropical evergreen broad-leaved forest24.021753.2017.11
VIIEvergreen broad-leaved forest57.061527.8519.25
VIIIEvergreen broad-leaved forest, Broad-leaved mixed forest, Shrublands, Meadow85.26709.234.29
IXAlpine shrub meadow, alpine steppe333.89183.663.31
Table 2. Information of the data used in this study.
DatePeriodResolutionSource
GRACE TWSA (mm)1982–20190.5° × 0.5°https://doi.org/10.5061/dryad.z612jm6bt, accessed on 15 May 2022
GLEAM ET (mm)1982–20190.25° × 0.25°https://www.gleam.eu/, accessed on 21 July 2022
AVHRR NDVI1982–20190.05° × 0.05°http://www.geodata.cn/, accessed on 14 July 2022
Precipitation (mm)1982–20190.5° × 0.5°https://data.cma.cn/, accessed on 10 January 2021
Temperature (°C)1982–20190.5° × 0.5°https://data.cma.cn/, accessed on 10 January 2021
Streamflow (mm3/s)1982–2019//
Land cover (categorical)20190.05° × 0.05°https://lpdaac.usgs.gov/products/mcd12c1v006/,
accessed on 21 May 2023
Elevation (m)/90 mhttp://www.gscloud.cn/, accessed on 22 August 2022
Soil type (categorical)/1 kmhttp://www.resdc.cn/, accessed on 18 June 2022
Population density (people/km2)20191 kmhttps://www.worldpop.org/, accessed on 10 May 2022
Table 3. Influencing factors of TWSA change.
CategoryFactorsCodeUnit
Natural factorsElevationX1m
SlopeX2degree
Soil typeX3categorical
TemperatureX4°C
PrecipitationX5mm
ETX6mm
NDVIX7/
Human factorsLand coverX8categorical
Population densityX9people/km2
Table 4. Definition of the interaction types in the Geodetector model.
Interaction RelationshipInteraction Types
q(Xi∩Xj) < Min(q(Xi), q(Xj))Nonlinear-weaken
Min(q(Xi), q(Xj)) < q(Xi∩Xj) < Max(q(Xi), q(Xj))Uni-variable weaken
q(Xi∩Xj) = q(Xi) + q(Xj)Independent
Max(q(Xi), q(Xj)) < q(Xi∩Xj) < q(Xi) + q(Xj)Bi-variable enhanced
q(Xi∩Xj) > q(Xi) + q(Xj)Nonlinear-enhanced
Table 5. Statistical trend R value of TWSA, precipitation, ET, streamflow, and TWS change anomalies across China from 1982 to 2019.
SerialTWSAPrecipitationETStreamflowΔTWS (P-ET-R)
I−0.72 **0.020.48 **−0.28−0.07
II−0.99 **0.010.49 **−0.36 *−0.27
III−0.99 **0.280.69 **−0.23−0.05
IV−0.98 **−0.010.56 **−0.19−0.07
V0.97 **0.040.81 **−0.08−0.28
VI0.95 **0.190.84 **−0.020.09
VII0.92 **0.100.74 **0.06−0.06
VIII−0.99 **−0.110.76 **−0.06−0.28
IX−0.98 **0.70 **0.78 **0.40 *0.06
Note: **: p < 0.01; *: p < 0.05.
Table 6. Area ratios with positive/negative seasonal NDVI, TWSA, and precipitation relationship determined across China from 1982 to 2019 (Unit: %).
RelationshipNDVI and TWSANDVI and Precipitation
SpringSummerAutumnSpringSummerAutumn
Positive52.7960.4557.8665.9956.8773.43
Significant positive18.6024.2213.9825.2614.4233.62
Negative47.2139.5542.1434.0143.1326.57
Significant negative12.6917.1410.580.843.210.34
Disclaimer/Publisher’s Note: The statements, opinions and data contained in all publications are solely those of the individual author(s) and contributor(s) and not of MDPI and/or the editor(s). MDPI and/or the editor(s) disclaim responsibility for any injury to people or property resulting from any ideas, methods, instructions or products referred to in the content.

