Article

ESarDet: An Efficient SAR Ship Detection Method Based on Context Information and Large Effective Receptive Field

Faculty of Computer and Software Engineering, Huaiyin Institute of Technology, No. 1 Meicheng Road East, Huaian 223003, China
*
Author to whom correspondence should be addressed.
These authors contributed equally to this work.
Remote Sens. 2023, 15(12), 3018; https://doi.org/10.3390/rs15123018
Submission received: 4 May 2023 / Revised: 28 May 2023 / Accepted: 5 June 2023 / Published: 9 June 2023

Abstract

:
Ship detection using synthetic aperture radar (SAR) has been extensively utilized in both the military and civilian fields. On account of complex backgrounds, large scale variations, small-scale targets, and other challenges, it is difficult for current SAR ship detection methods to strike a balance between detection accuracy and computation efficiency. To overcome those challenges, ESarDet, an efficient SAR ship detection method based on contextual information and a large effective receptive field (ERF), is proposed. We introduce the anchor-free object detection method YOLOX-tiny as a baseline model and make several improvements to it. First, CAA-Net, which has a large ERF, is proposed to better merge the contextual and semantic information of ships in SAR images to improve ship detection, particularly for small-scale ships with complex backgrounds. Further, to prevent the loss of semantic information regarding ship targets in SAR images, we redesign a new spatial pyramid pooling network, namely A2SPPF. Finally, in consideration of the challenge posed by the large variation in ship scale in SAR images, we design a novel convolution block, called A2CSPlayer, to enhance the fusion of feature maps from different scales. Extensive experiments are conducted on three publicly available SAR ship datasets, DSSDD, SSDD, and HRSID, to validate the effectiveness of the proposed ESarDet. The experimental results demonstrate that ESarDet has distinct advantages over current state-of-the-art (SOTA) detectors in terms of detection accuracy, generalization capability, computational complexity, and detection speed.

1. Introduction

Nowadays, remote sensing technologies are widely used for cartography, military reconnaissance, ocean monitoring, and other purposes due to its wide coverage and ability to quickly collect data [1,2]. Among them, synthetic aperture radar (SAR) is an essential research branch, which is an active earth observation system that can be installed on different flight platforms. SAR employs the principle of synthetic aperture to accomplish high-resolution microwave imaging, allowing it to monitor the Earth around-the-clock and in any condition. Moreover, SAR has a certain penetration capability, so SAR is widely utilized in various sectors, such as ship monitoring [3], environment monitoring [4], resource surveying [5], and crop estimation [6]. Its advantages of all-day, all-weather, high-resolution, and large-format work especially play an essential role in ship monitoring. It shows unique advantages in tasks such as marine traffic control [7], fishery supervision [8], and military operations [9] and performs better in comparison with remote sensing methods. Nowadays, more and more scholars are conducting studies on ship monitoring using SAR to improve the detection accuracy of ships.
Initially, the constant false alarm rate (CFAR) algorithm was introduced for detecting targets in SAR images [10]. The CFAR-based detection methods can adaptively calculate the detection threshold by estimating the statistical arithmetic of background clutter. The CFAR algorithm has low computational complexity and is slightly robust to local uniform clutter. This algorithm, nevertheless, has a poor generalization ability and a low detection accuracy in complex scenes. In [11,12,13], to polish up the detection performance of CFAR, different statistical models were added to CFAR. The detection performance of the improved CFAR algorithm is robust in simple scenes. However, due to the difficulty of modeling, when small ships are present in SAR images or the scene is complex, these models perform poorly in detection accuracy.
Recently, methods for detecting targets based on deep learning have advanced significantly regarding detection efficiency and precision. Therefore, many researchers have introduced deep learning-based methods into the study of SAR ship detection. Current SAR ship detection methods based on deep learning can be broadly classified as either anchor-based or anchor-free [14]. Refs. [15,16,17,18] introduced anchor-based target detection methods for SAR ship detection. These methods outperform traditional methods in detection precision. Nevertheless, anchor-based methods rely on fixed, manually designed anchors, resulting in a significant decrease in detection precision when the scale of ship targets varies significantly. To accommodate the extensive scale variation of ships in SAR images, Refs. [19,20,21,22,23] introduced anchor-free methods to detect ships. The anchor-free method overcomes the challenge of detecting ships in different scales and improves detection accuracy. Nevertheless, its high computational complexity makes efficient ship detection difficult. Methods for SAR ship detection based on deep learning significantly improved detection performance. However, existing SAR ship detection methods still have difficulty in striking a balance between detection precision and speed due to the following challenges [16,20,24]:
  • The background in SAR images is complex. Due to the clutter caused by SAR, imaging principles, land structures, and other factors make it difficult for existing detection methods to differentiate the targets from the background.
  • The scale of ships in SAR images, particularly small ships, is highly variable. Due to the varied scales of the ships in SAR images, it is challenging to extract efficient features from SAR images with existing methods.
  • SAR is deployed on flight platforms, which have limited computational resources. Existing methods make it challenging to perform accurate ship detection in such conditions.
To overcome the aforementioned challenges, we propose an efficient SAR ship detection method, ESarDet, which is based on the anchor-free object detection method YOLOX-tiny [25] with a number of improvements to expand the effective receptive field (ERF) and to extract contextual information. The main contributions of this paper are shown below:
  • For the characteristics of ships in SAR images, such as complex backgrounds, large scale variations, and small-scale targets, we propose ESarDet, a novel SAR ship detection method based on contextual information and a large effective receptive field.
  • The context attention auxiliary network (CAA-Net) is proposed to improve the merging of contextual and semantic information in order to detect small ships in SAR images. Atrous attentive spatial pyramid pooling fast (A2SPPF) is designed to avoid loss of detail information and to improve the computational efficiency. In addition, the atrous attentive cross-stage partial layer (A2CSPlayer) is proposed to dynamically adjust the dilation rate to achieve efficient fusion of feature maps at different scales.
  • We conduct extensive experiments to validate the effectiveness of the proposed ESarDet on three SAR ship datasets: DSSDD, SSDD, and HRSID. In addition to the ablation and comparison experiments, we conduct exhaustive experiments to evaluate the generalization ability and robustness of the proposed ESarDet.
This paper contains six sections. In Section 2, we present recent advances in deep-learning-based ship detection methods as well as techniques for detecting small targets. In Section 3, we elaborate on the proposed method in detail. In Section 4, the evaluation metrics, experimental design, and experiment results are presented. In Section 5, we discuss the experimental results, the limitations of ESarDet, and future work. The conclusion is presented in Section 6.

2. Related Work

2.1. SAR Ship Detection Methods Based on Deep Learning

In recent years, deep learning (DL) has risen to the forefront of computer vision. After the proposal of AlexNet [26], convolutional neural network (CNN)-based target detection methods generally outperformed traditional methods in many aspects. However, current DL-based methods generally had unperceived imbalance problems such as image sample imbalance, ship-scale feature imbalance, etc. Therefore, how to handle those imbalances while improving the efficiency of ship detection without sacrificing accuracy is the latest research direction for DL-based methods. Lately, the DL-based methods for SAR ship detection have mainly been divided into anchor-based methods and anchor-free methods.
The anchor-based method generates prediction frames based on manually pre-designed anchors. Jiang et al. [15] refined the YOLOv4-light network with a multi-channel fusion SAR image processing method to extract features more effectively. As a result, the improved YOLOv4-light could not only make up for the loss of accuracy due to the original lightweight network but also implemented real-time ship detection. Based on the Cascade Mask R-CNN model, Xia et al. [16] innovatively integrated the merits of Swin Transformer and CNN, coming up with a brand-new backbone, CRbackbone. By taking great advantage of contextual information, the detection accuracy of ships at different scales was enhanced, while the training cost was also increased. For scatters and noises in SAR images and densely distributed small ships, Bai et al. [17] designed a feature-enhanced pyramid and shallow feature reconstruction network (FEPS-Net). Although retaining shallow high-resolution features could effectively improve the detection performance, the computational cost was correspondingly multiplied. To directly apply the detection method with strong performance to SAR ship identification, Muhammad et al. [18] introduced an upgraded YOLOv5s using the C3 convolution and a new neck structure created by combining FPN and PAN. Though the network performance was further enhanced by the addition of an attention mechanism, it is still hard to achieve efficient detection of ships in SAR images in the face of complex situations such as azimuth ambiguity, wave measurement, and sea state. Anchor-based detectors eliminate the need to scan images with sliding windows, which effectively raises detection efficiency. However, these anchor-based detectors still have shortcomings and problems in terms of detection accuracy. First, the detection performance of anchor-based detectors is dependent on the quantity of anchors, making it difficult to adjust parameters. Second, due to the fixed size of anchors, the robustness of the anchor-based method is not strong when encountering a significant deformation of the ship targets. Finally, anchor-based methods may cause sample imbalance and complex computation.
In contrast to anchor-based methods, anchor-free methods are based on point-to-predict frames. For the two difficulties of small ships with low resolution and complex overland backgrounds, Guo et al. [19] proposed an effective detector called CenterNet++. On the basis of CenterNet, three modules were added to address the above issues: the feature refinement module, the feature pyramid fusion module, and the head enhancement module. Yet, it performed poorly on detecting the adjacent ships. In order to strike a balance between accuracy and speed without limiting the detection performance, Wan et al. [20] set YOLOX as the basic framework, which redesigned the backbone into the lightweight MobileNetV2S. Moreover, channel and spatial attention mechanisms called CSEMPAN and a new target detection head ESPHead were brought up to mitigate the scattering characteristics of SAR images and to extract features from different scales, respectively. Hu et al. [21] put forward an anchor-free method based on a balance attention network to enhance the generalization capability of multiscale ship detection. In this network, a local attention module was designed to further enhance the robustness of the network. A nonlocal attention module was also introduced to effectively derive nonlocal features from SAR images. While this is an approach to detecting ships of different sizes by extracting multiscale features, features from different scales may be not strictly aligned, which would interfere with the detection results. To deal with this problem, Xiao et al. [22] proposed an anchor-free model, namely power transformations and feature alignment-guided network (Pow-FAN). Li et al. [23] improved YOLOX to tackle the challenges in SAR ship detection and to achieve a high detection accuracy. The application of high-frequency sub-band channel fusion mitigates the issues of speckle noise and blurred ship contour. In addition, an ultra-lightweight backbone, including GhostCSP and a lightweight spatial dilation convolution pyramid, was designed to improve detection performance. Compared with anchor-based methods, anchor-free methods better locate the scattered and sparse ships in SAR images. Nevertheless, anchor-free methods require strong semantic information to be extracted from the backbone, resulting in its high computational complexity. Therefore, it is still a struggle for existing anchor-free methods to effectively detect ships from SAR images. Considering the aforementioned methods with low detection efficiency, we propose an efficient anchor-free SAR ship detection model that can effectively extract valuable feature information from SAR ship images while reducing model computational complexity.

2.2. Small Object Detection Methods

One of the biggest challenges of ship detection in SAR images is detecting small-scale ships in clutter and complex backgrounds. In recent years, considerable work has taken place concerning the development of a better small object detection method, which can be separated into three main categories: increasing the resolution of input images, augmenting the data, and optimizing the network structure [27]. However, the first two methods significantly increase the parameters and lead to computation inefficiency. Therefore, this subsection concentrates on several foundational optimization network-based approaches in small object detection.
Yu et al. [28] developed a new convolution block that applied dilated convolutions to process multi-scale prediction by aggregating contextual information in different scales. Dilated convolution increased the respective fields and avoided the loss of contextual information. Lin et al. [29] designed the feature pyramid network (FPN), a top-down feature fusion network, to fuse feature maps from different scales. The fusion factor in the FPN was implemented to regulate the transmission of information from deep to shallow layers, which made the FPN adaptive to small object detection. While, unlike FPN, Wu et al. [30] variegated the feature diversity by integrating a spatial-frequency channel feature (SFCF). In an SFCF, pixel-wise spatial channel feature and region-based channel feature representations are extracted to emphasize small mutations in the image’s smooth area and to better obtain the semantically contextual information, respectively. Moreover, the abilities feature learning and refinement are enhanced for the robustness of the ORSIm detector. To avoid the intensive computational cost in image pyramids, Singh et al. [31] developed the algorithm SNIPER for efficient multi-scale training, which processes context regions around ground-truth instances in appropriate proportions. This method adaptively adjusts the number of chips according to the complexity of the scene in the image. Lim et al. [32] proposed FA-SSD, which combines feature fusion and the attention mechanism in a conventional SSD. In this method, several high-level feature maps that contain contextual information of small objects were fused via a one-stage attention module with low levels. On the basis of U-Net, Wu et al. [33] innovatively nested two U-Nets to obtain a novel framework, namely UIU-Net, which could effectively prevent the loss of tiny objects and acquire more object contrast information. In detail, UIU-Net was separated into two modules, RM-DS and IC-A, to generate multi-scale features while learning global context information and encoding the local context information from different levels, respectively. The aforementioned methods for optimizing the network structure can achieve more precise detection of small targets without increasing the number of parameters or the computation cost, thereby enabling real-time detection of small objects. Nevertheless, not only is there the challenge of having difficulty detecting small scale ships but also variable degradation, noise effects, or variabilities generated during the imaging of SAR images will affect the detection accuracy of the model. It is worth emphasizing that our proposed ESarDet can maintain a high detection accuracy even in these complex conditions.

3. Methodology

Aiming to achieve efficient ship detection in SAR images, we innovatively design an efficient anchor-free detector, namely ESarDet. 
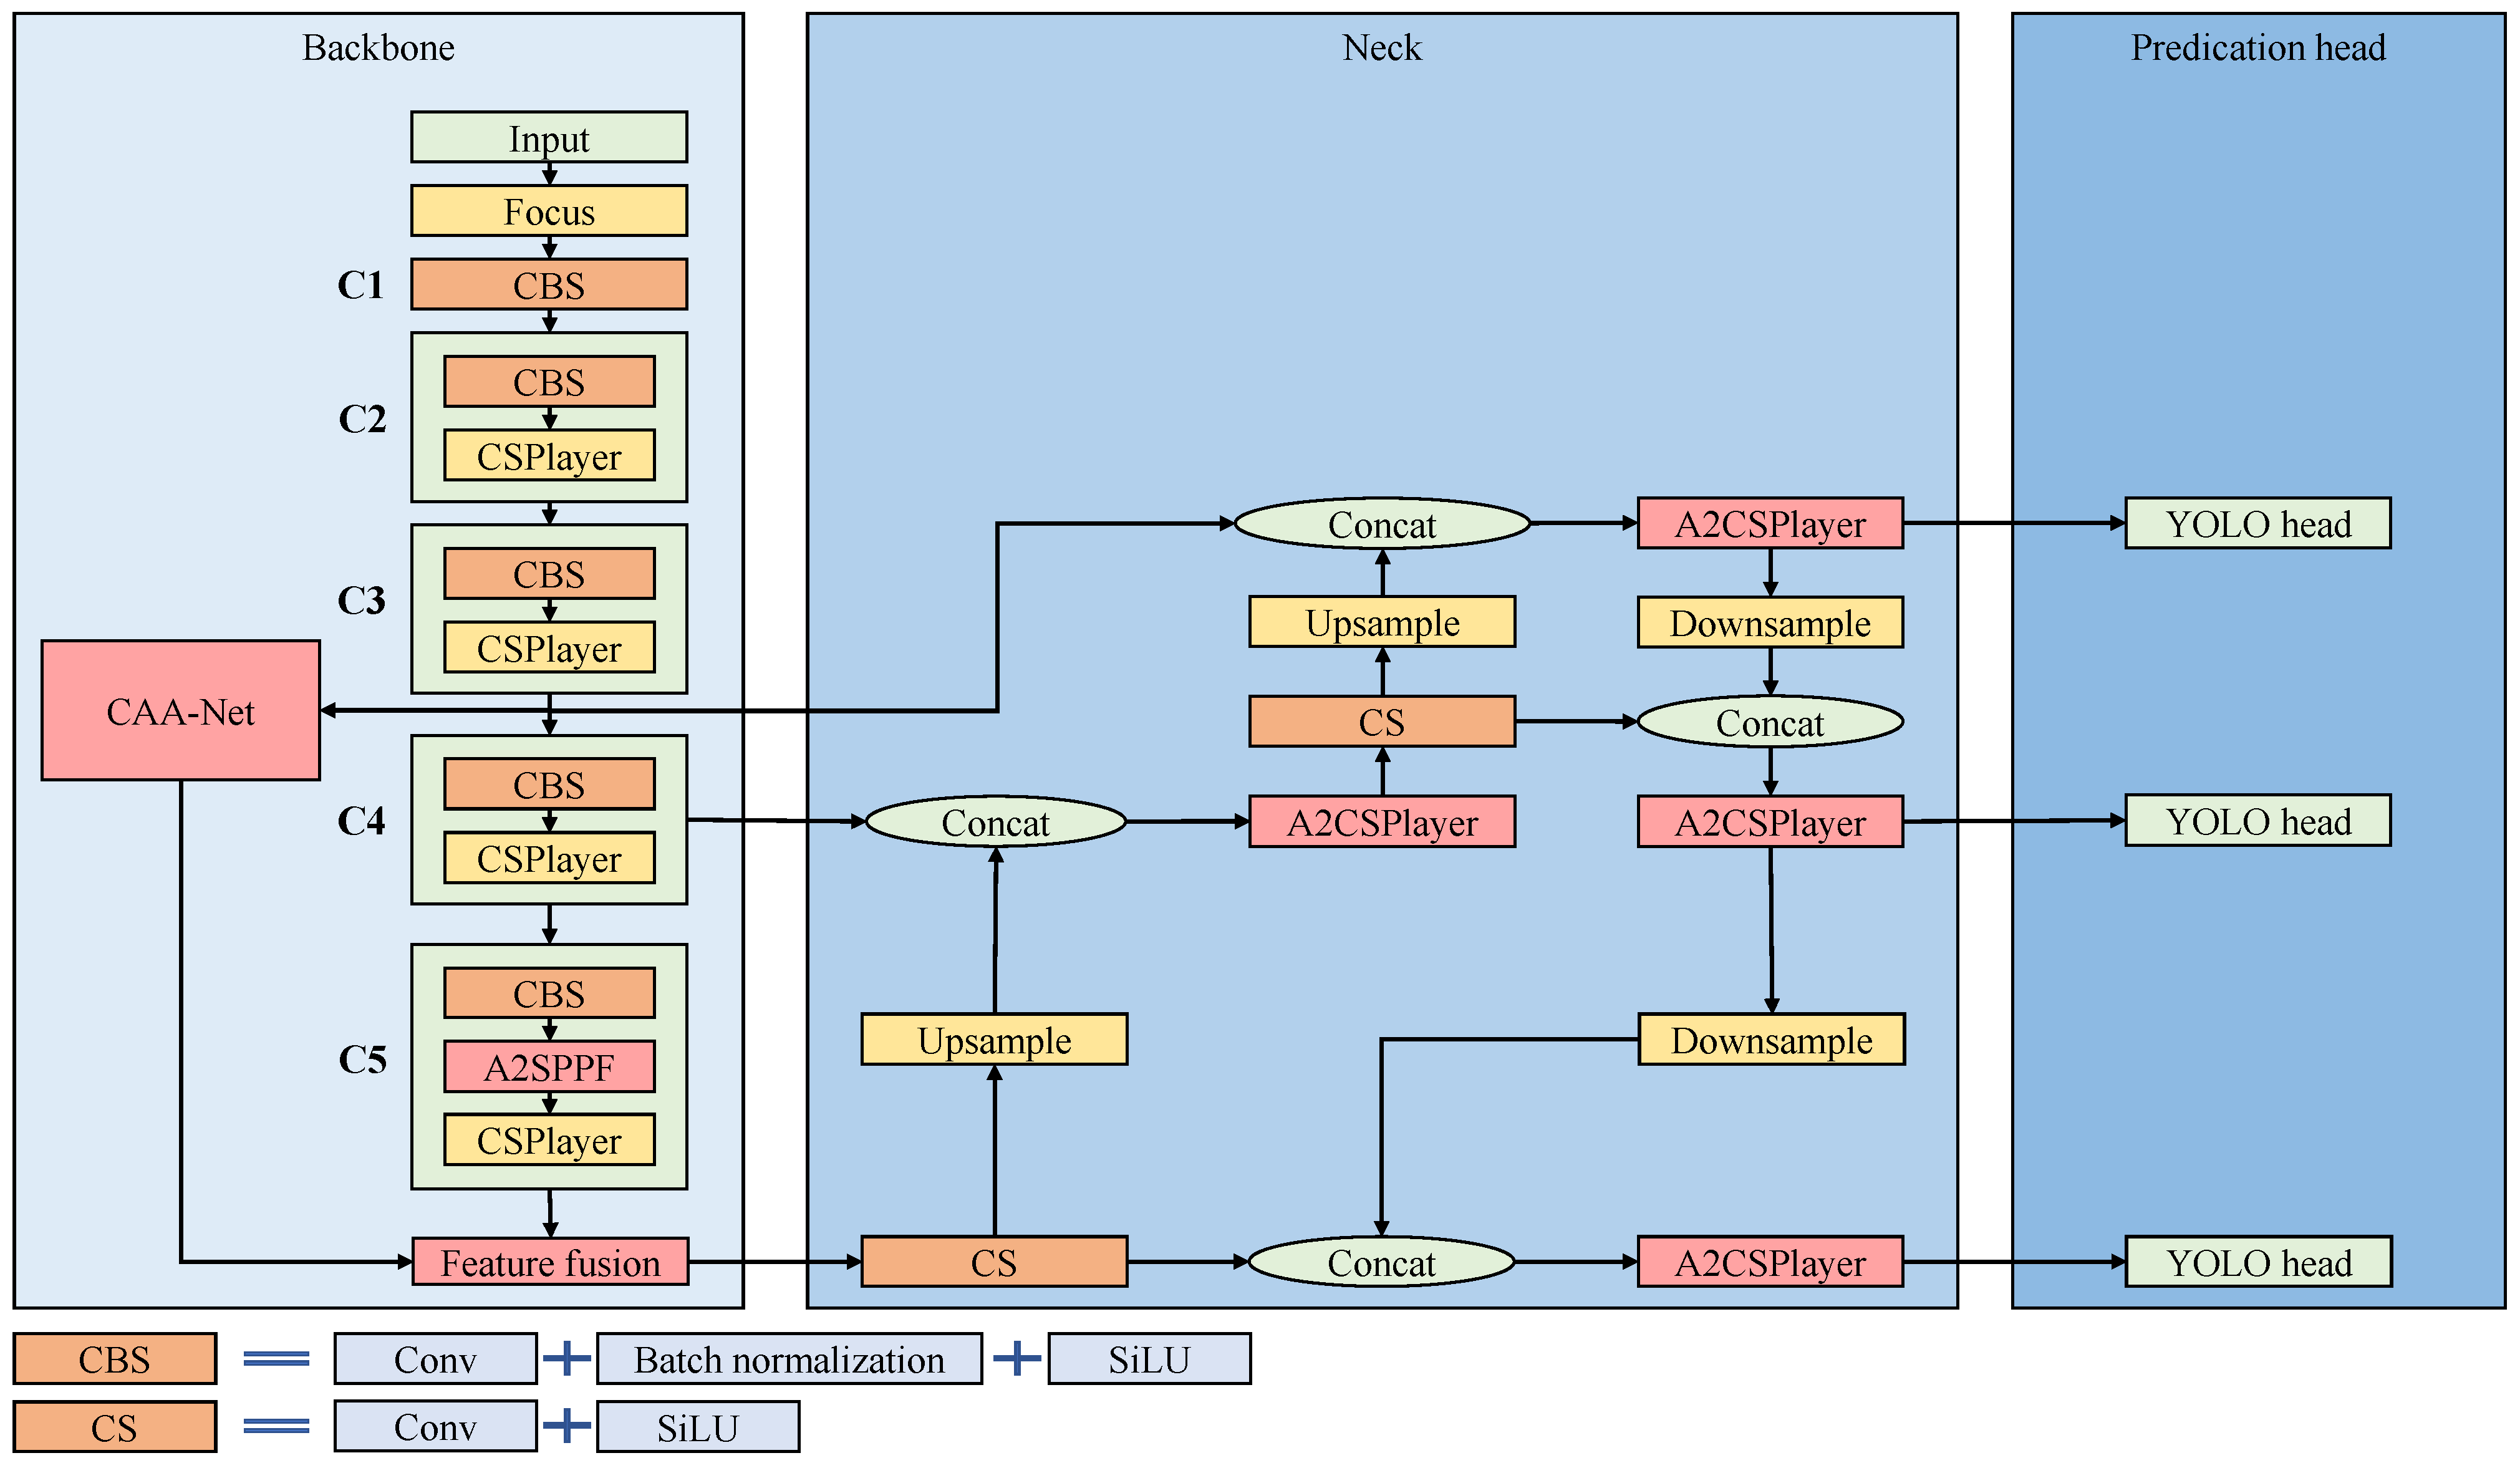
Figure 1 depicts the work flow of the proposed ESarDet. Due to complicated computation and sample imbalance caused by anchor-based methods, we chose the latest lightweight, universal anchor-free object detection model, YOLOX-tiny [25], as the baseline model. Taking into account the complex backgrounds, large scale variation, small-scale targets, and limited computational resources, three modules are proposed for the baseline model to optimize ship detection performance. First, to improve the detection of small ships in SAR images, we propose CAA-Net, which can effectively fuse context and semantic information. Second, to prevent losing the semantic information of ship targets at the bottom layer and to improve detection efficiency, A2SPPF is designed to replace the SPP in YOLOX-tiny. Lastly, aiming to better detect multi-scale ships, we propose a new convolution block named A2CSPlayer to better fuse feature maps of different scales. In the section that follows, the main components of ESarDet are described in detail.

3.1. CAA-Net

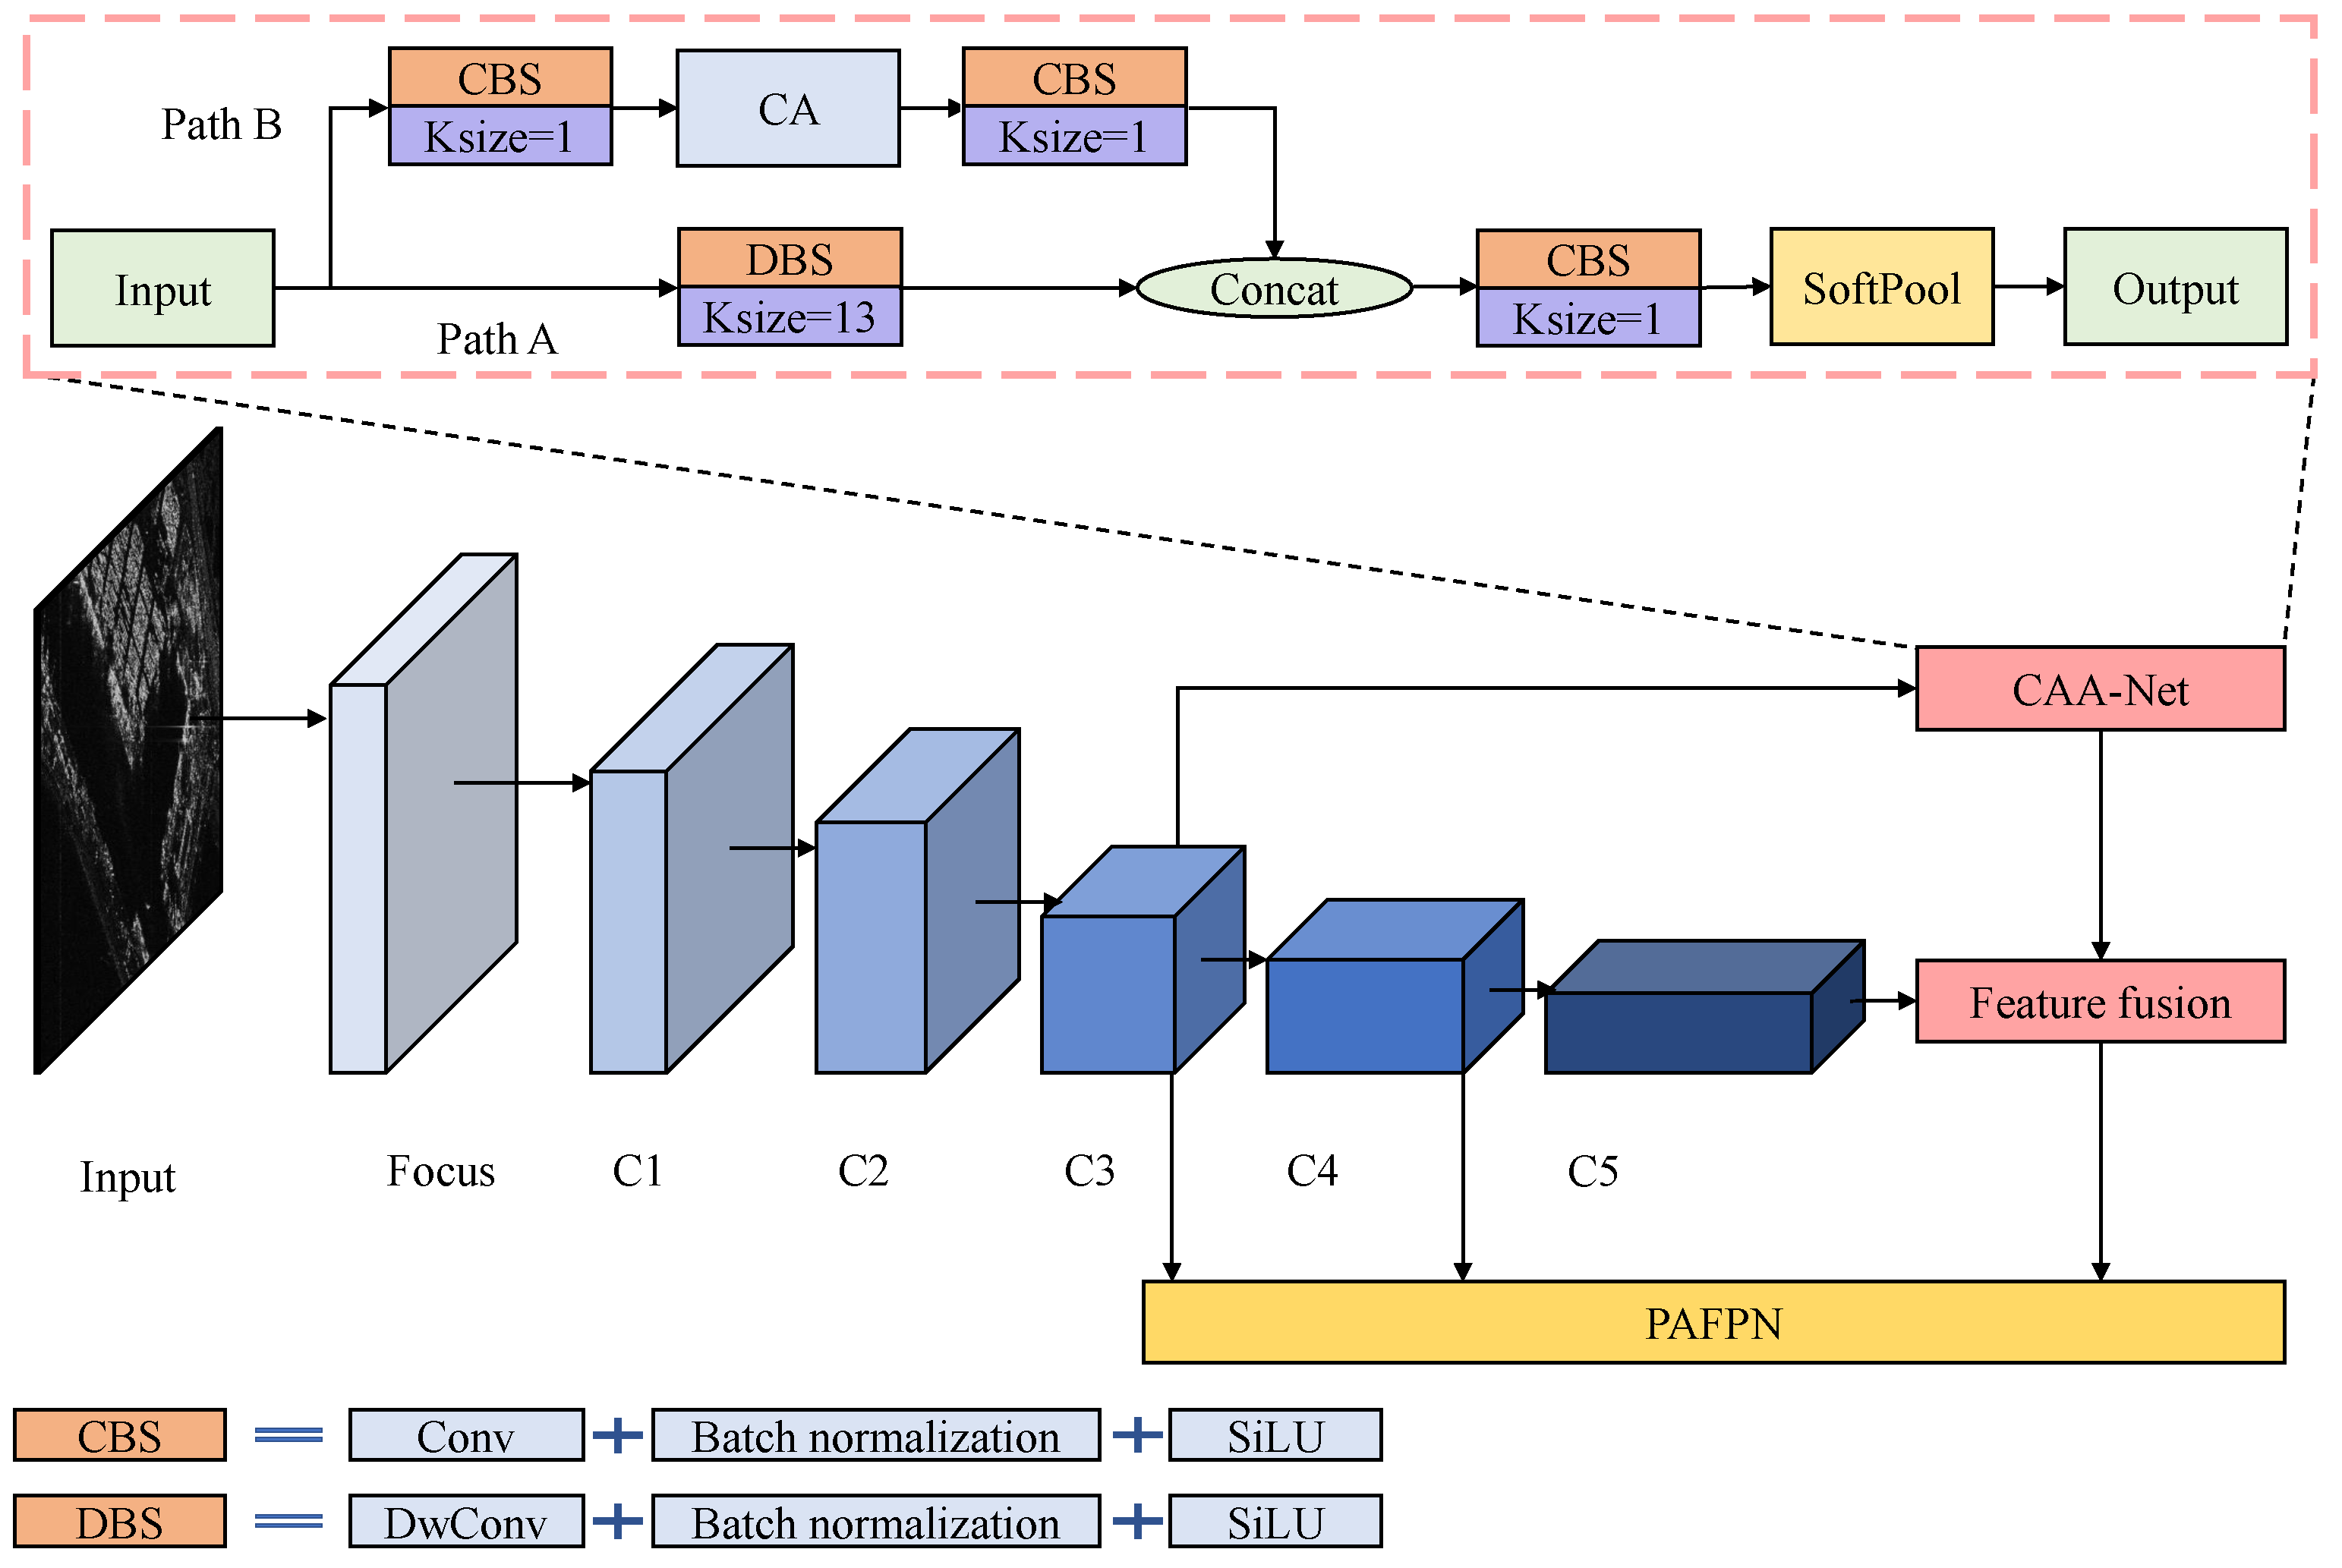
YOLOX-tiny applies a cross-stage partial network (CSPNet) as the backbone, which can enhance the networks’ capacity for learning and reduce memory costs. However, due to the stacking of multiple small kernel convolutions, the ERF of CSPNet is small, which makes it challenging to capture the contextual information of ships. In addition, the network extracts more semantic information but retains less contextual information as the layer’s number of network increases. To address these problems with CSPNet, a context attention auxiliary network (CAA-Net) is proposed to enhance the network’s ability to extract contextual information and to expand the ERF. Figure 2 depicts the work process of the proposed CAA-Net.
The proposed CAA-Net contains the two path network to process the input feature map C3. In the proposed CAA-Net, path A contains the 13 × 13 depthwise separable convolution (DwConv) block [34]. Path B contains three parts: a 1 × 1 convolution block, a coordinate attention (CA) module [35], and a 1 × 1 convolution block. Subsequently, the results of the two paths are concatenated and reshaped via 1 × 1 convolution and SoftPool [36] to obtain the output of CAA-Net.
Most networks expand the receptive field by stacking convolutions with small kernel sizes. However, stacking small convolutions does not effectively increase the effective receptive field [37,38]. A large ERF can help the network better extract the contextual information of ships, especially small ones. The ERF is calculated according to Equation (1).
V a r [ S n ] = n m = 0 k 1 m 2 k ( m = 0 k 1 m k ) 2 = n ( k 2 1 ) 12 = O ( K n )
where V a r [ S n ] is a standard deviation that indicates the size of the ERF, S n is roughly a Gaussian with mean and variance, and V a r [ S n ] denotes the Gaussian model of S n . Moreover, m represents the pixel point in the kernel, k represents the kernel size, and n denotes the convolution layers.
The ERF of a convolution is proportional to its kernel size and the square root of the number of layers, as demonstrated by the equation. It can be concluded that using a large kernel convolution expands the ERF more effectively than increasing the depth of small convolution layers. The use of large kernel convolution not only expands the effective receptive field but also enhances its ability to extract the contextual information of ships. Therefore, 13 × 13 convolution is added to the proposed CAA-Net, expanding the ERF and increasing the extraction of small ship contextual information from SAR images.
Nevertheless, convolution with a large kernel size has a low computational efficiency. In addition, large kernel convolution makes it challenging to extract local features, which play crucial roles in ship detection. We introduce DwConv to increase the computational efficiency and performance of large convolutions to mitigate the aforementioned issues, and the equation of DwConv is shown in Equation (2).
DwConv ( F ) = PWC 1 × 1 ( Concat i = 1 N ( DWC 13 × 13 ( F i ) ) )
where PWC denotes the pointwise convolution operation and DWC denotes depthwise convolution. Moreover, c o n c a t represents the feature map’s concatenate operation.
Different from conventional convolution, DwConv decouples the spatial information and cross-channel information of the input feature map. DwConv employs depthwise convolution (DWC) to process the input channel by channel and then concatenates these feature maps, merging them into an output. However, using only DWC to process feature maps may cause a loss of cross-channel information. Thus, pointwise convolution (PWC) is designed, in which 1 × 1 convolution is introduced to cope with the cross-channel information. After the whole process mentioned above, a new feature map is generated. Compared with conventional convolution, DwConv significantly reduces the model’s computational cost.
Aiming to balance the contextual information extracted using the large kernel convolution in path A, we add a shortcut path, path B, to CAA-Net. In path B, the input is first processed via a 1 × 1 convolution block, which can prevent network overfitting and increases the generalization ability. Additionally, the 1 × 1 convolution block can deepen the neural network and add more nonlinear information to help extract more features. Moreover, we introduce the CA module, a lightweight attention module, to path B of CAA-Net to better balance the contextual information extracted in path A and enhance the network’s capacity to extract ship location data from SAR images. 
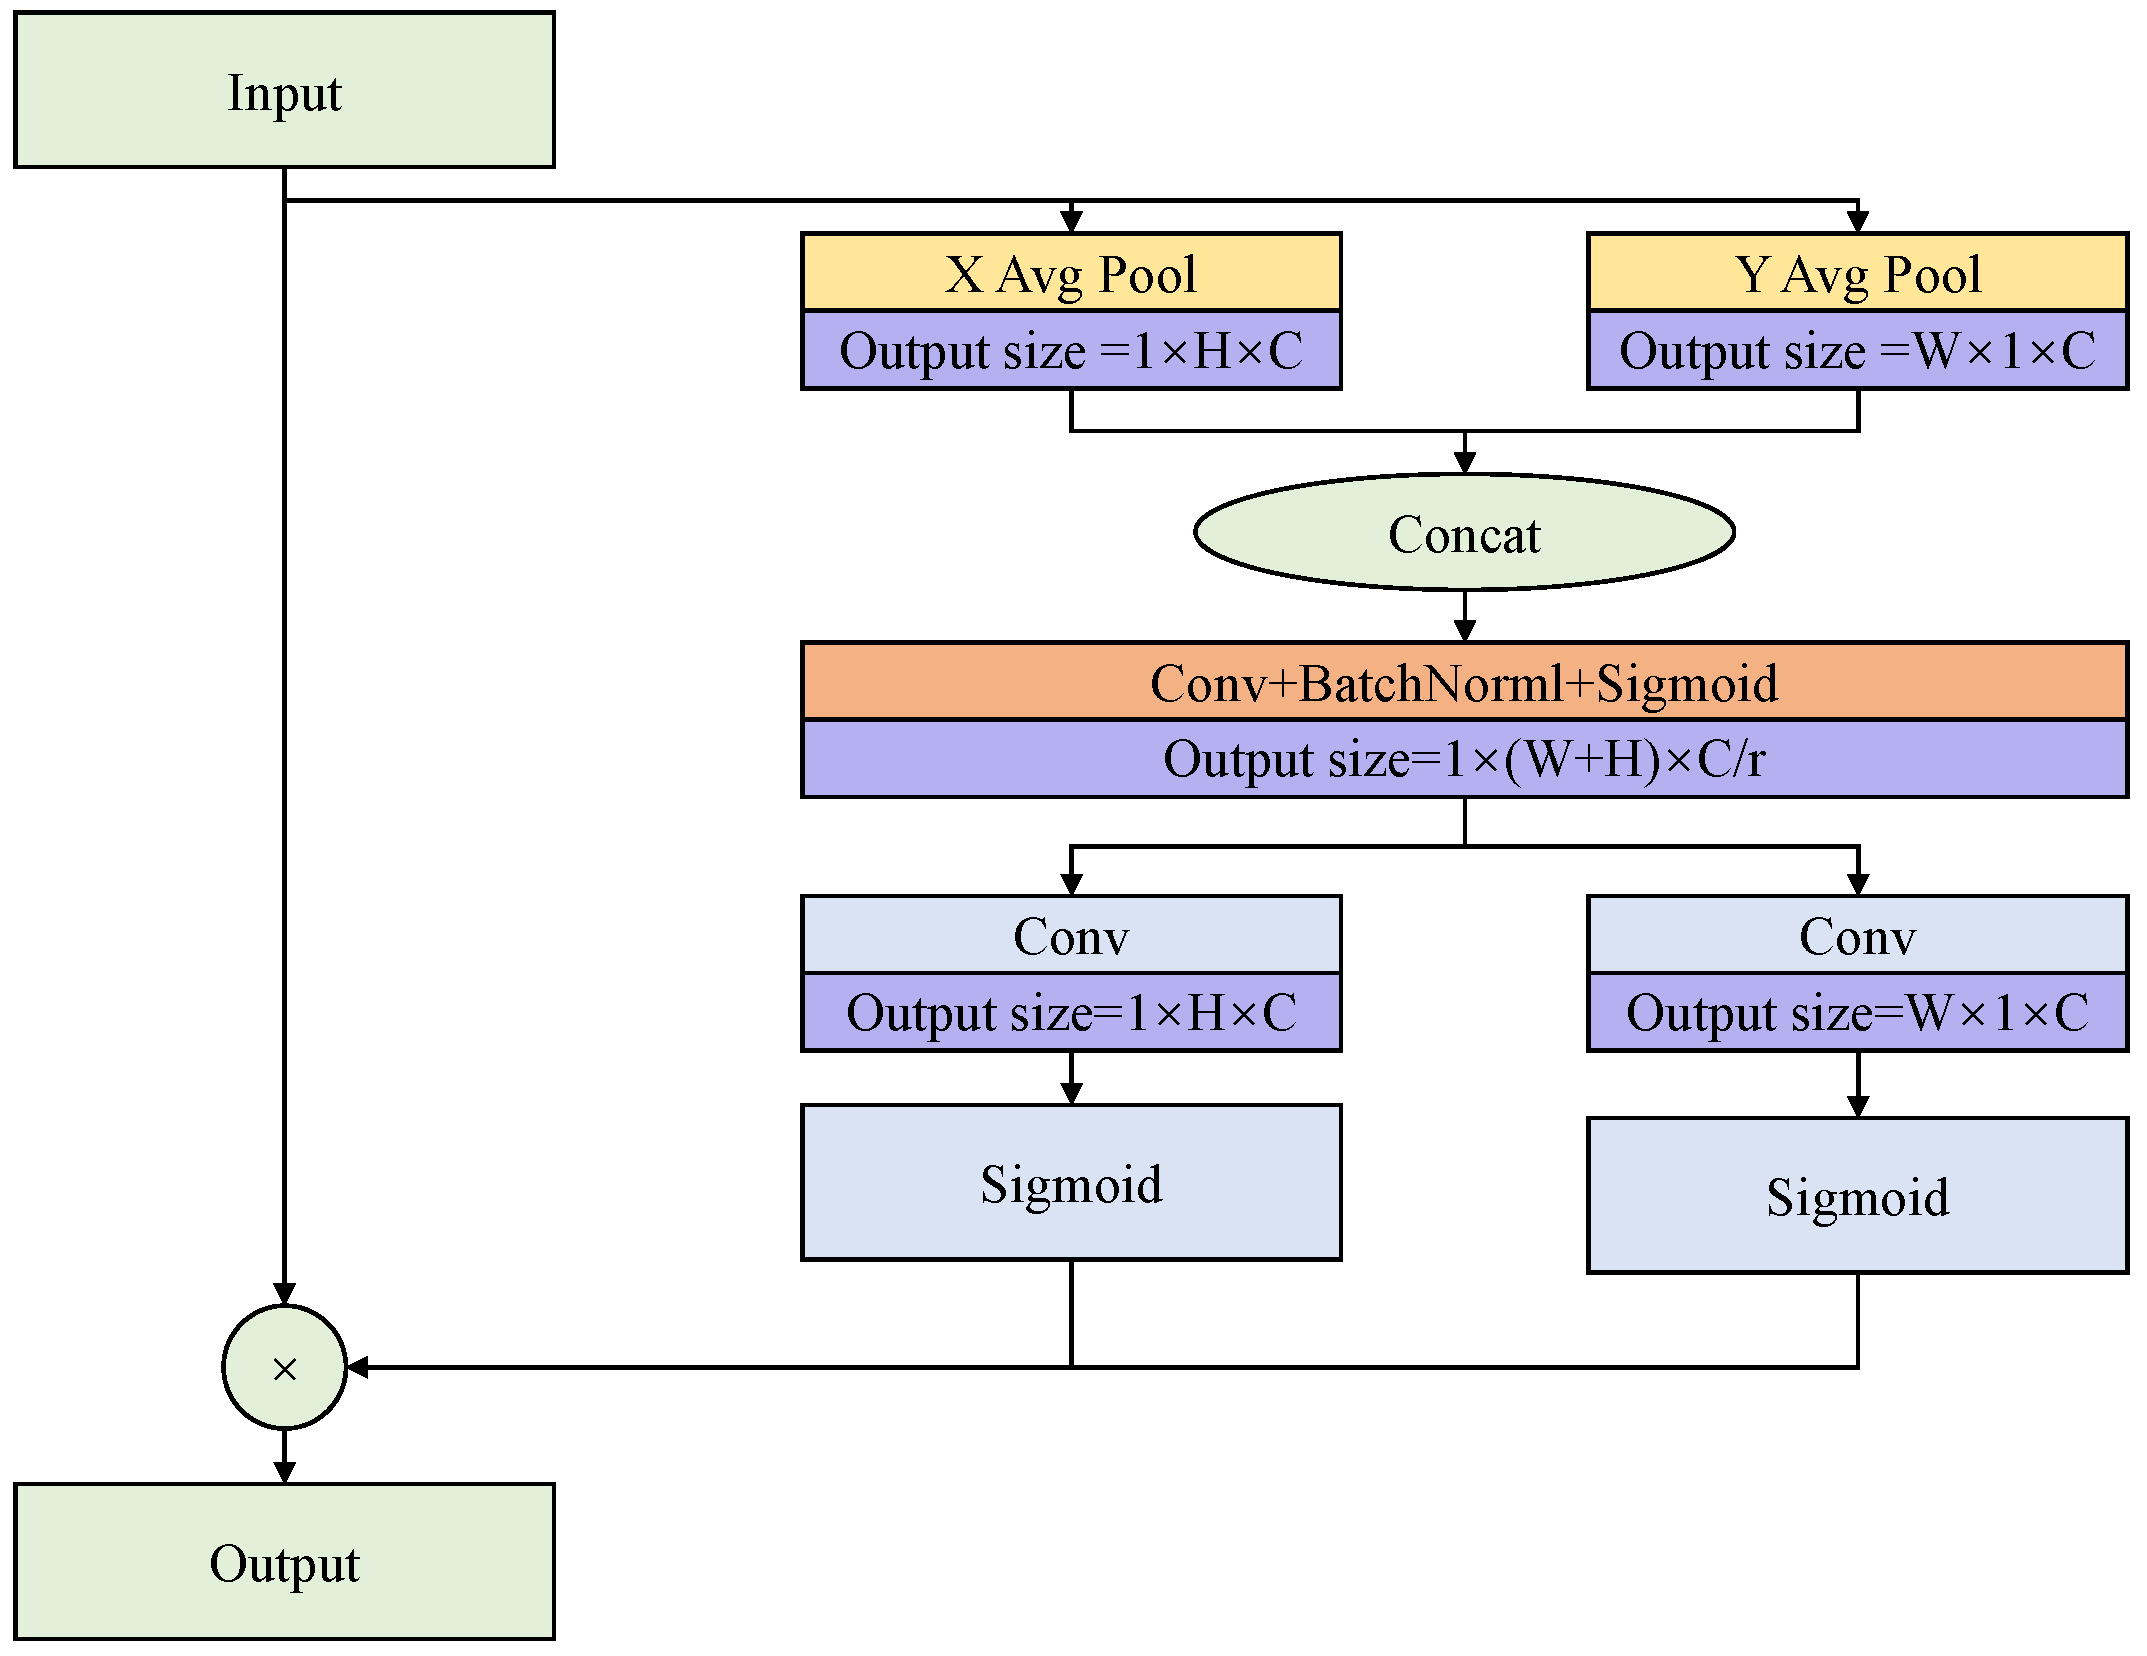
Figure 3 depicts the work process of the CA module.
In particular, the CA module contains two main steps, coordinate information embedding and coordinate attention generation, which can encode channel relations and long-range relations. The input X is first compressed by X and Y global average pooling to 1 × H × C and W × 1 × C , respectively. After that, the two feature maps are concatenated together. The concatenated results are reshaped to 1 × ( W + H ) × C / r via a 1 × 1 convolution block (r = 16 in this paper). The reshaped result is subsequently divided into two distinct feature maps. The two feature maps are transformed into 1 × H × C and W × 1 × C via two additional 1 × 1 convolution and sigmoid functions. Finally, combining the output feature maps into a weighting matrix, the input feature map X is multiplied by two weighting matrices to refine the weights. The CA module’s operational flow can be summarized as Equations (3)–(6).
Z C h ( h ) = 1 W 0 i W X c ( h , i )
Z C w ( w ) = 1 H 0 j H X c ( j , w )
F = σ ( B N ( C o n v 1 × 1 ( C o n c a t ( Z h , Z w ) )
F c ( i , j ) = X c ( i , j ) × σ ( C o n v 1 × 1 ( F h ) ) × σ ( C o n v 1 × 1 ( F w ) )
where W and H are the width and height of the input feature map, and Z C h ( h ) and Z C w ( w ) denote the results of X Avg Pool and Y Avg Pool, respectively. F 1 × R ( H + W ) × C / r , C o n v k × k represents convolution with a kernel size k × k , σ denotes the sigmoid activation function, and B N represents the batch normalization operation.
The feature maps, respectively, from path A and path B, are concatenated into a new feature map with a size of W × H × 2 C . Then, the feature map is reshaped via 1 × 1 convolution to W × H × C .
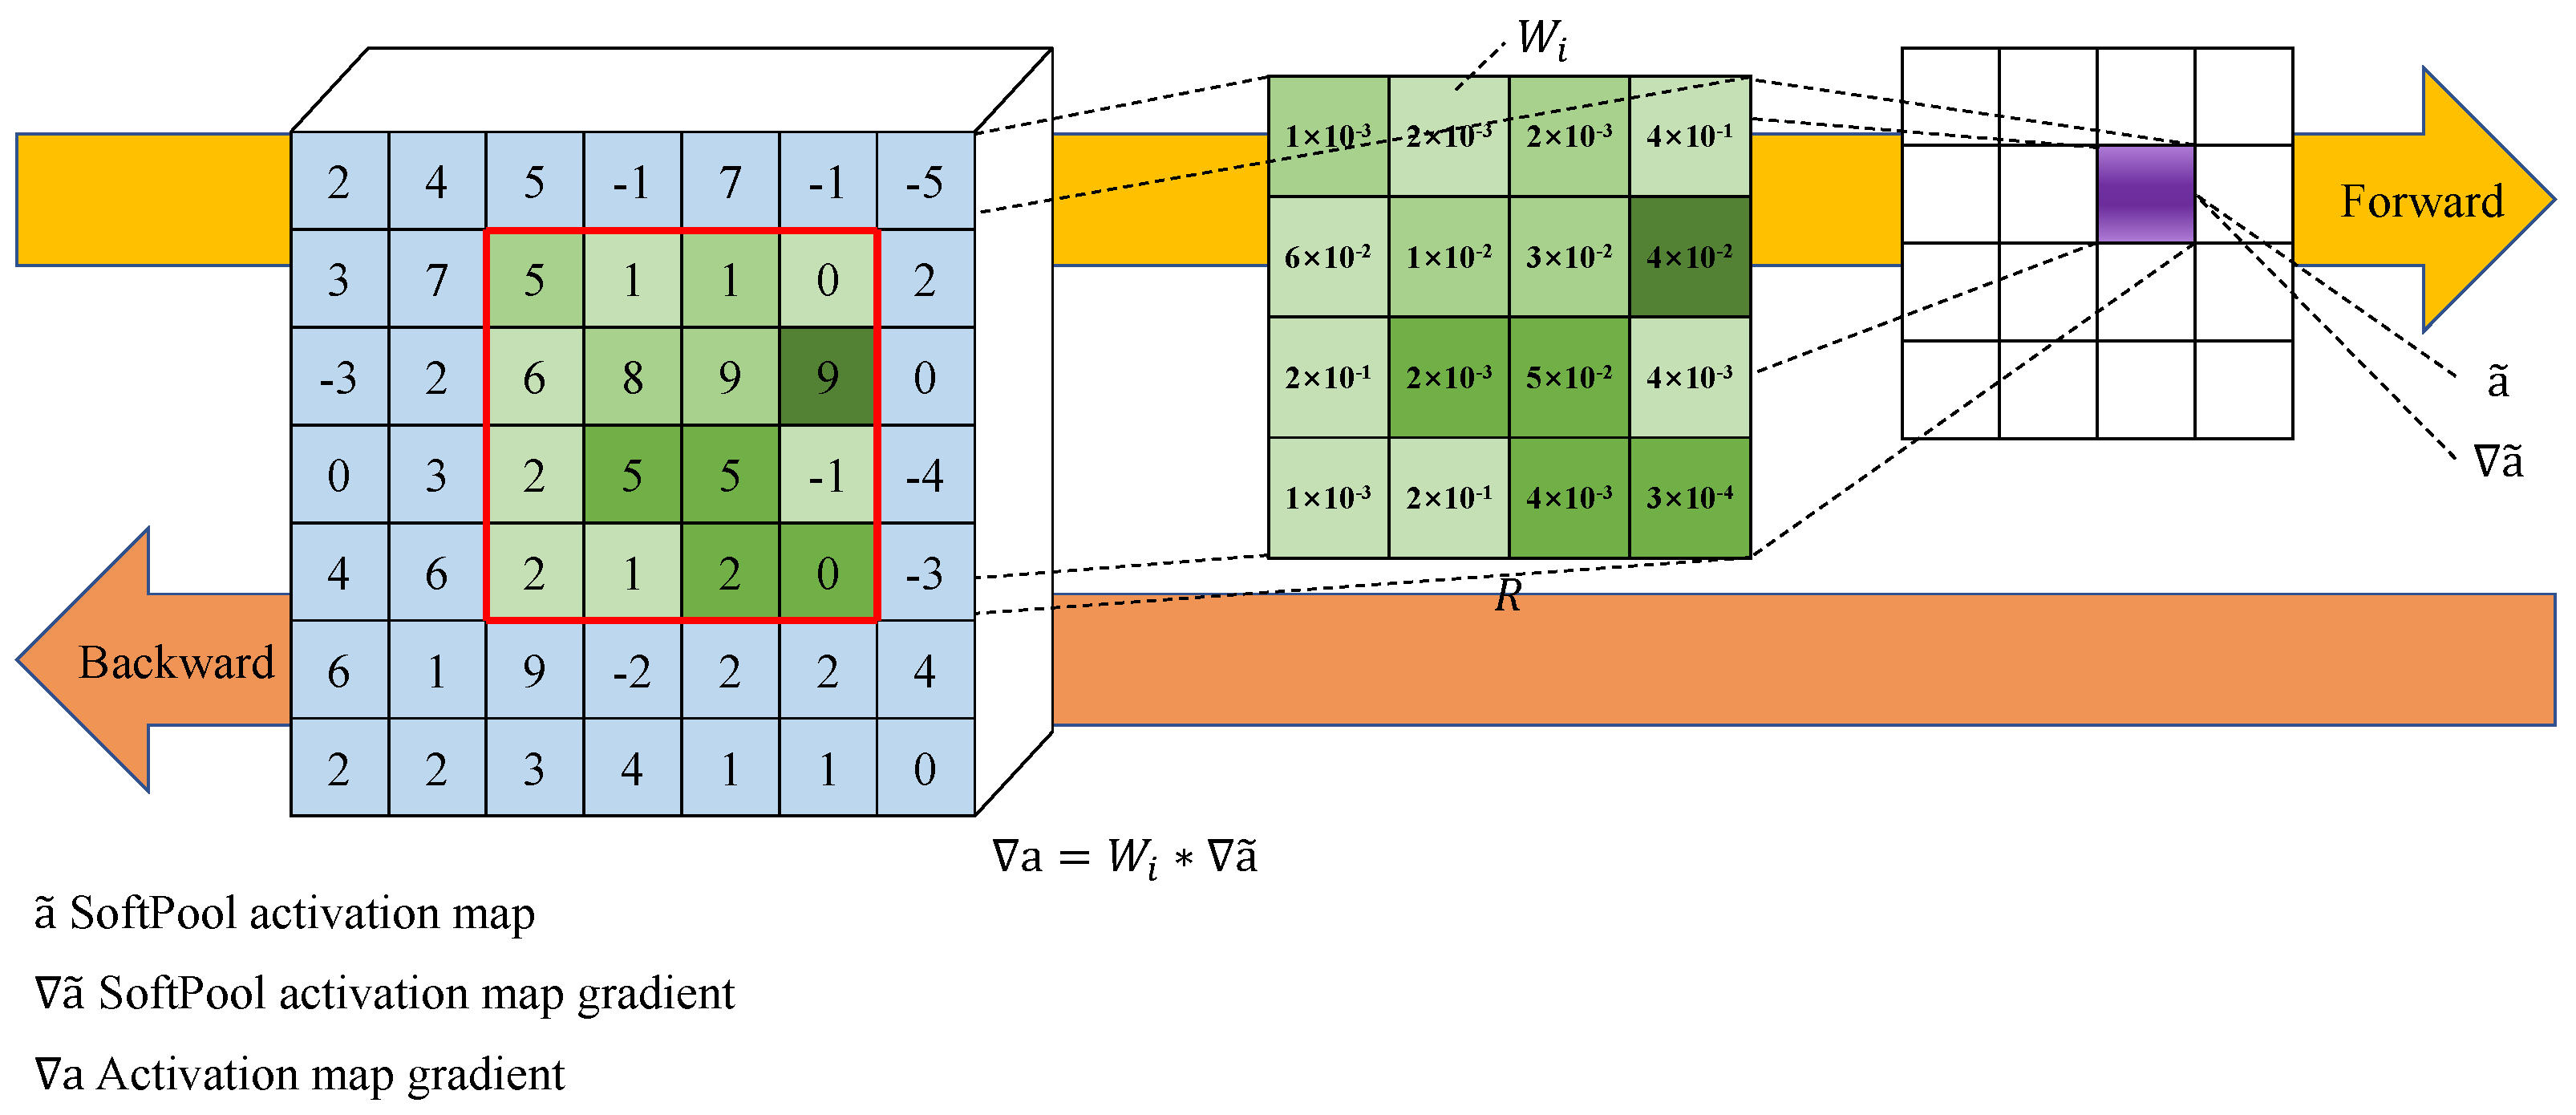
To fuse with the feature map extracted from CSPNet, SoftPool is introduced to downsample the feature map to W / 4 × H / 4 × C , and its operation flow is depicted in Figure 4. Conventional pooling operations, such as maximum and average pooling, result in the loss of semantic information of the feature map, which affects the precision of SAR ship detection. Unlike conventional pooling operations, SoftPool downsamples the feature map by using softmax of regions, producing normalized results that preserve more semantic information. The forward process of SoftPool can be summarized as Equations (7) and (8).
W i = e a i j R e a j
a ˜ = j R W i a i
where R denotes the kernel size of the SoftPool, e represents the natural exponent, a i denotes the input feature map, W i is the weights of a i , and a ˜ is the final output activation map.
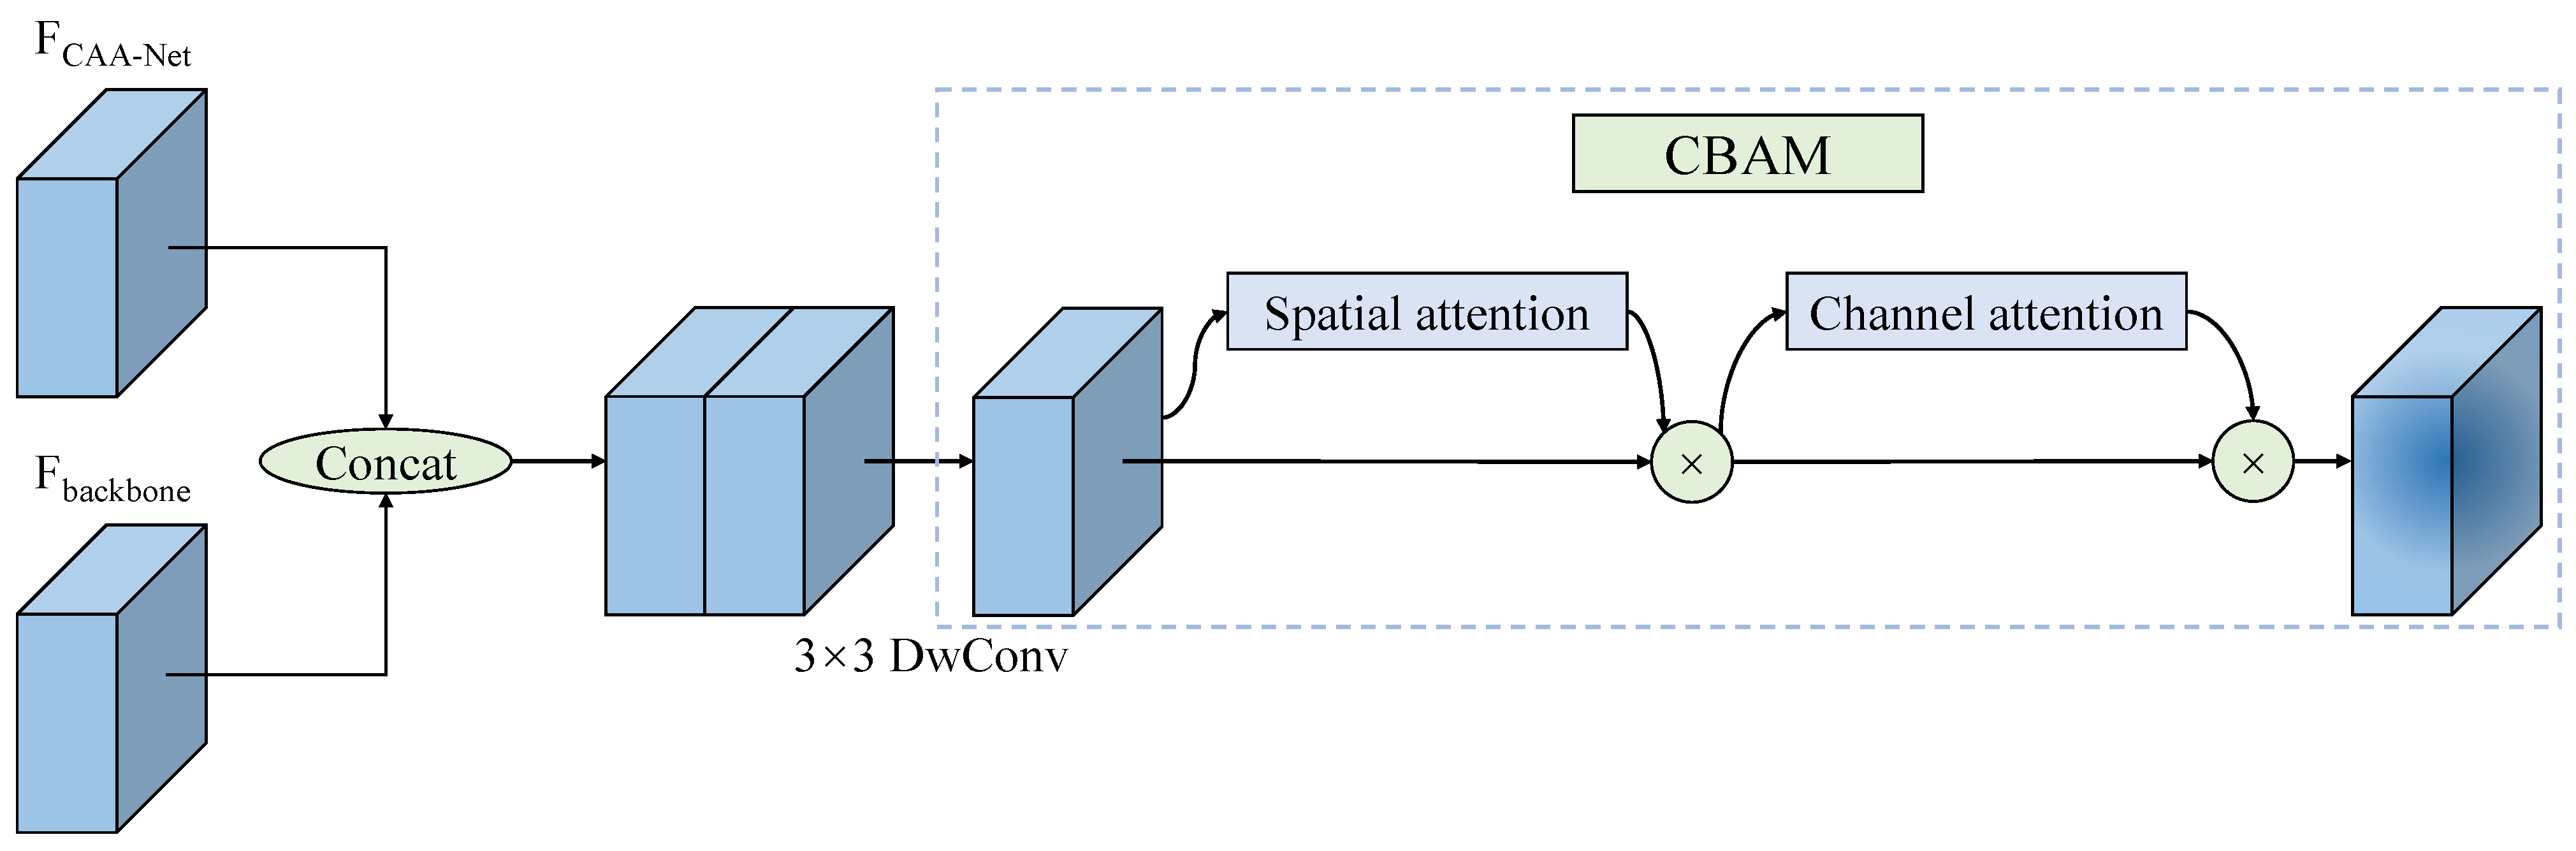
Finally, in order to fuse the contextual information extracted by CAA-Net with the semantic information extracted by the backbone, an efficient feature fusion module is proposed. Its structure is depicted in Figure 5. The process of the proposed feature fusion module can be summarized in Equations (9) and (10).
F = C o n c a t ( F C 5 , F C A A N e t )
F o u t p u t = CBAM ( DBS 3 × 3 ( F ) )
where CBAM denotes the CBAM attention module, and DBS3×3 represents a convolution block, which consists of a DwConv with a kernel size of 3 × 3 , batch normalization, and the SiLu activation function.
The feature maps extracted via CAA-Net and the backbone are first concatenated in the feature fusion module. Then, the concatenated result is reshaped via a 3 × 3 DwConv block. To better merge semantic information with contextual information, the convolutional block attention module (CBAM) [39], a mixed attention module, is subsequently applied to refine the feature map. The CBAM module’s operating principle can be summarized as shown in Equations (11)–(13).
C B A M ( F ) = A t t S ( A t t C ( F ) )
A t t C ( F ) = ( σ ( MLP ( GAPool ( F ) ) + MLP ( GMPool ( F ) ) ) ) × F
A t t S ( F ) = ( σ ( C o n v 7 × 7 ( C o n c a t ( APool ( F ) , MPool ( F ) ) ) ) ) × F
where A t t S and A t t C are spatial attention and channel attention modules. MLP is a multilayer perceptron. GAPool and GMPool denote global average pooling (GAPool) and global max pooling (GMPool), respectively. Meanwhile, APool and MPool stand for average pooling (APool) and max pooling (MPool), respectively.
In CBAM, the input feature map will first be calculated via the channel attention submodule. In this submodule, two 1 × 1 × C attention maps are obtained via GAPool and GMPool, respectively. After that, two attention maps are refined independently via a two-layer multilayer perceptron (MLP) and merged by summing the refined feature map. In addition, to normalize the merged results, the sigmoid activation function is also introduced. Finally, to obtain the results of the channel attention submodule, the input is multiplied with the attention map. Then, the spatial attention submodule processes the refined feature map. The feature map, which is processed by the channel attention submodule, is first processed separately by APool and MPool. After that, the two feature maps are concatenated and reshaped via a 7 × 7 convolution. As with the channel attention submodule, sigmoid activation functions are also applied to normalize the attention map. The CBAM module’s final result is generated by multiplying the feature map with the attention map extracted by the spatial attention submodule.

3.2. A2SPPF

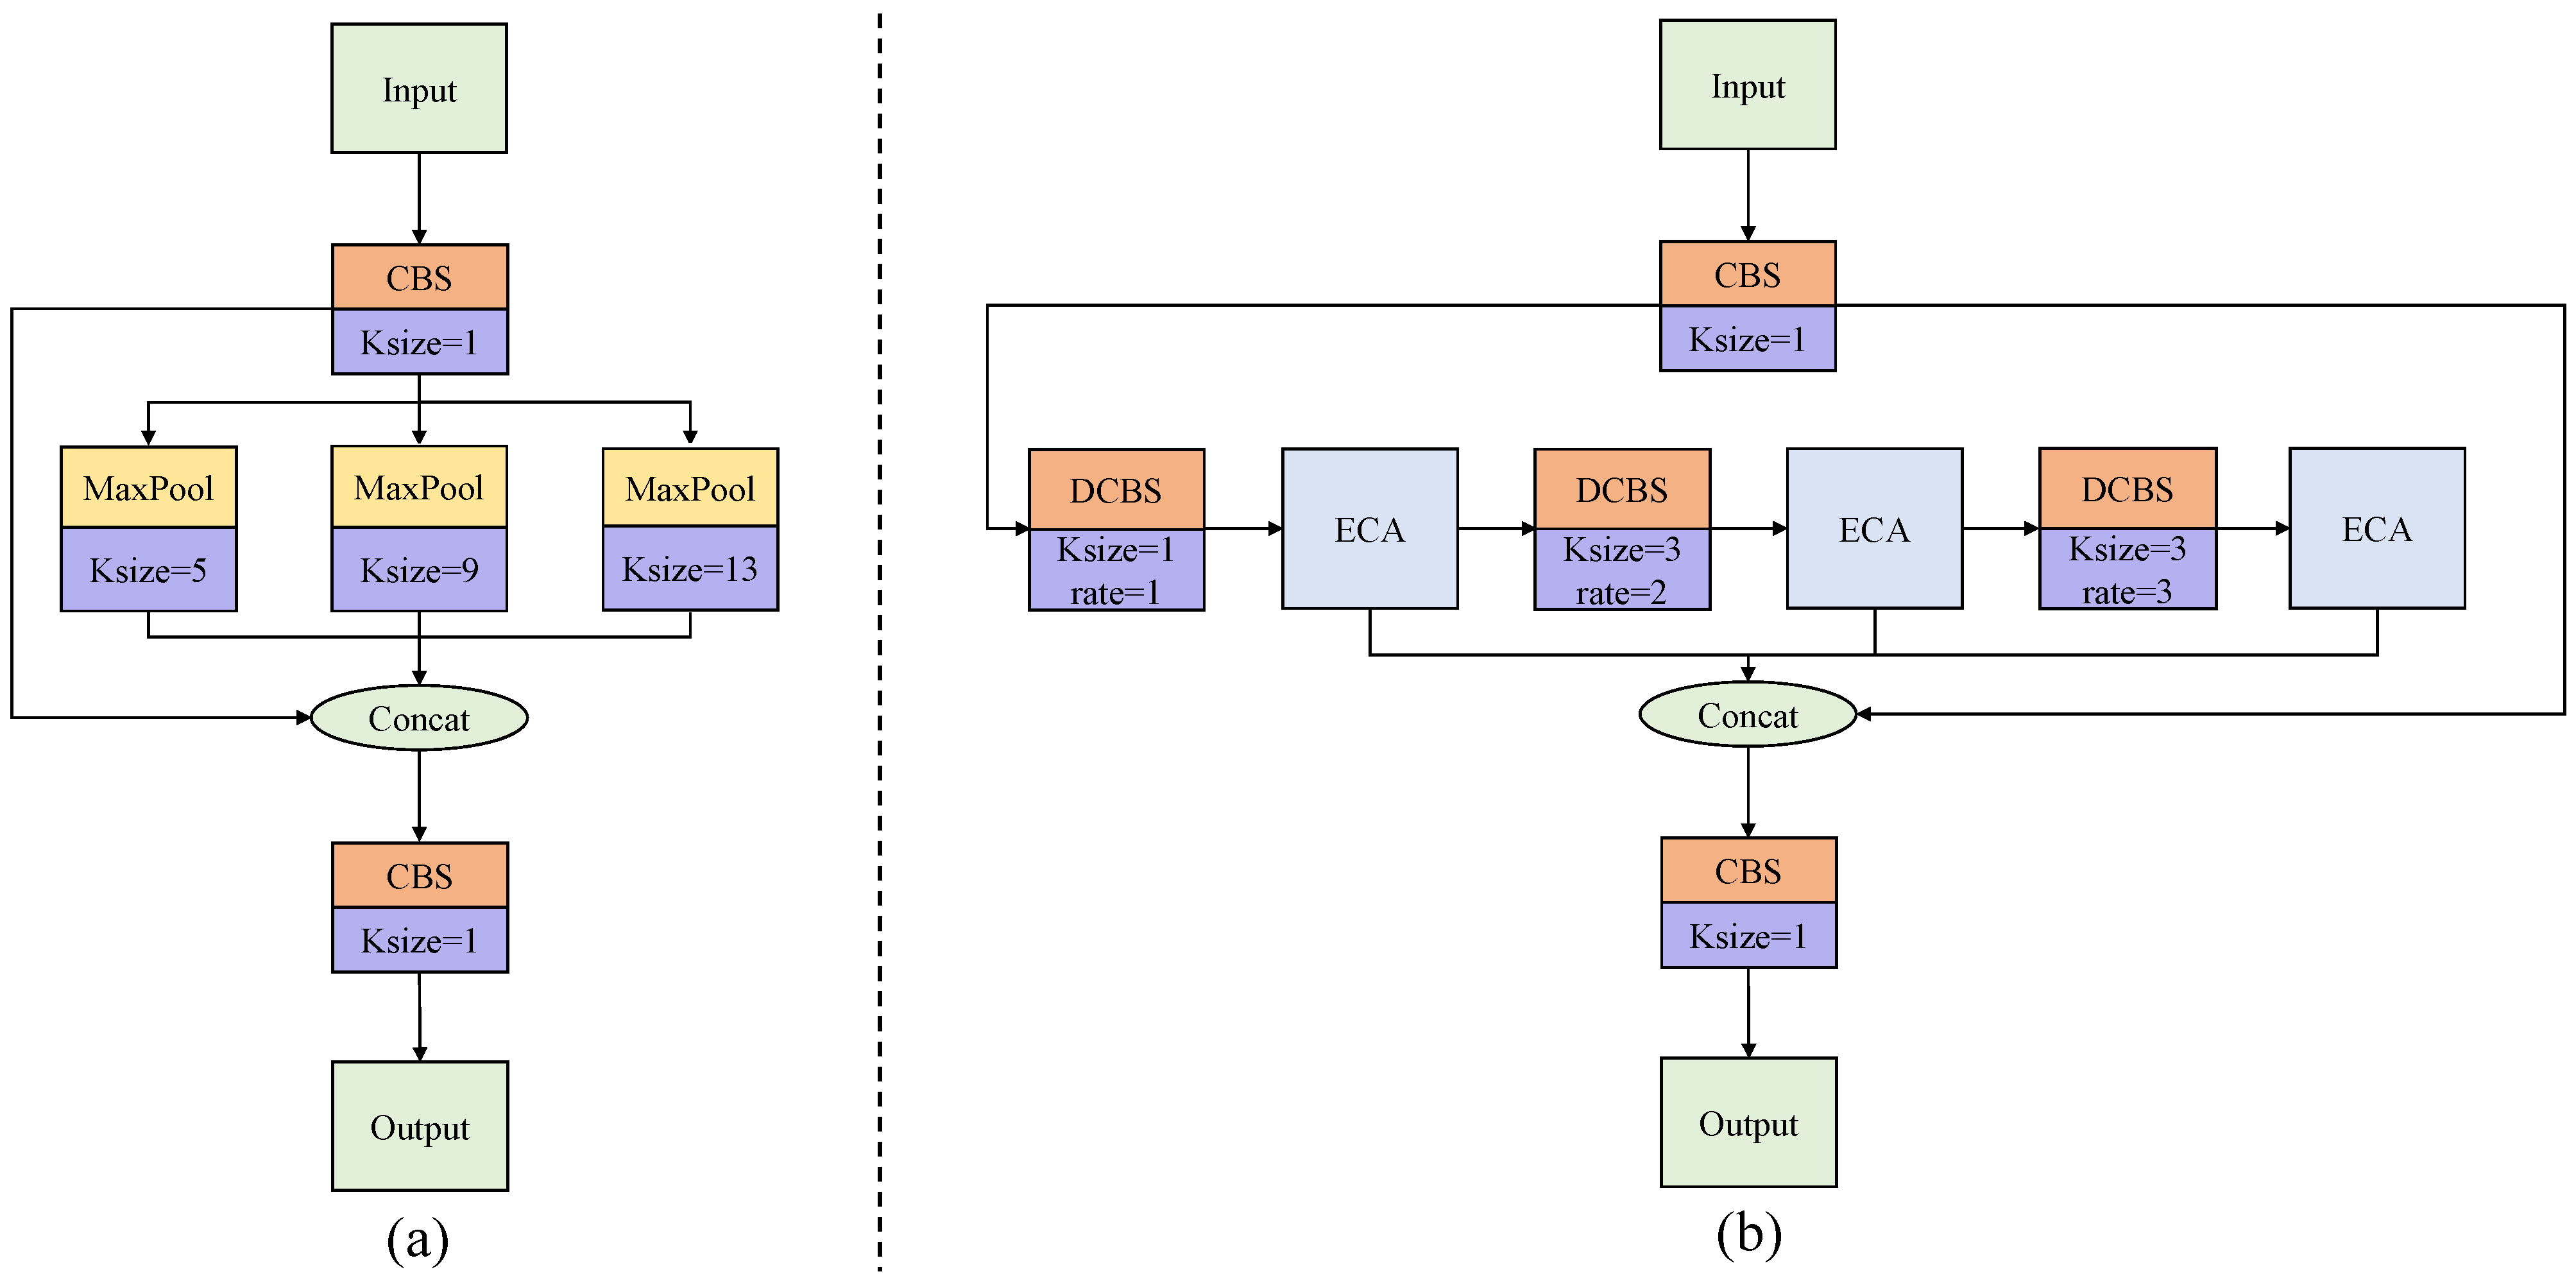
YOLOX-tiny introduces SPP [40] in the backbone to remove the fixed-size constraint of the network. As shown in Figure 6a, in SPP, the input feature map is parallel processed via the three max pooling operation. The three independently processed feature maps are concatenated with a residual feature map and then reshaped via a 1 × 1 convolution block. However, the pooling operations in SPP result in loss of the ship’s semantic information in SAR images. In addition, the parallel processing of three feature maps in SPP leads to a low computational efficiency. Moreover, SPP cannot extract the information in different channels well.
Inspired by [41,42,43], we propose atrous attentive spatial pyramid pooling fast (A2SPPF), and its work flow is depicted in Figure 6b. In comparison with SPP, the designed A2SPPF employs a serial operation to improve the computational efficiency. Moreover, the proposed A2SPPF replaces the max pooling operation with dilated convolutions with different dilate rates and kernel sizes to expand the ERF and to prevent loss of detailed information in the feature map. The dilation rates of these three dilated convolutions are 1 , 2 , 3 , and their kernel sizes are 1 , 3 , 3 . We also introduce the efficient channel attention (ECA) module, a lightweight attention module [
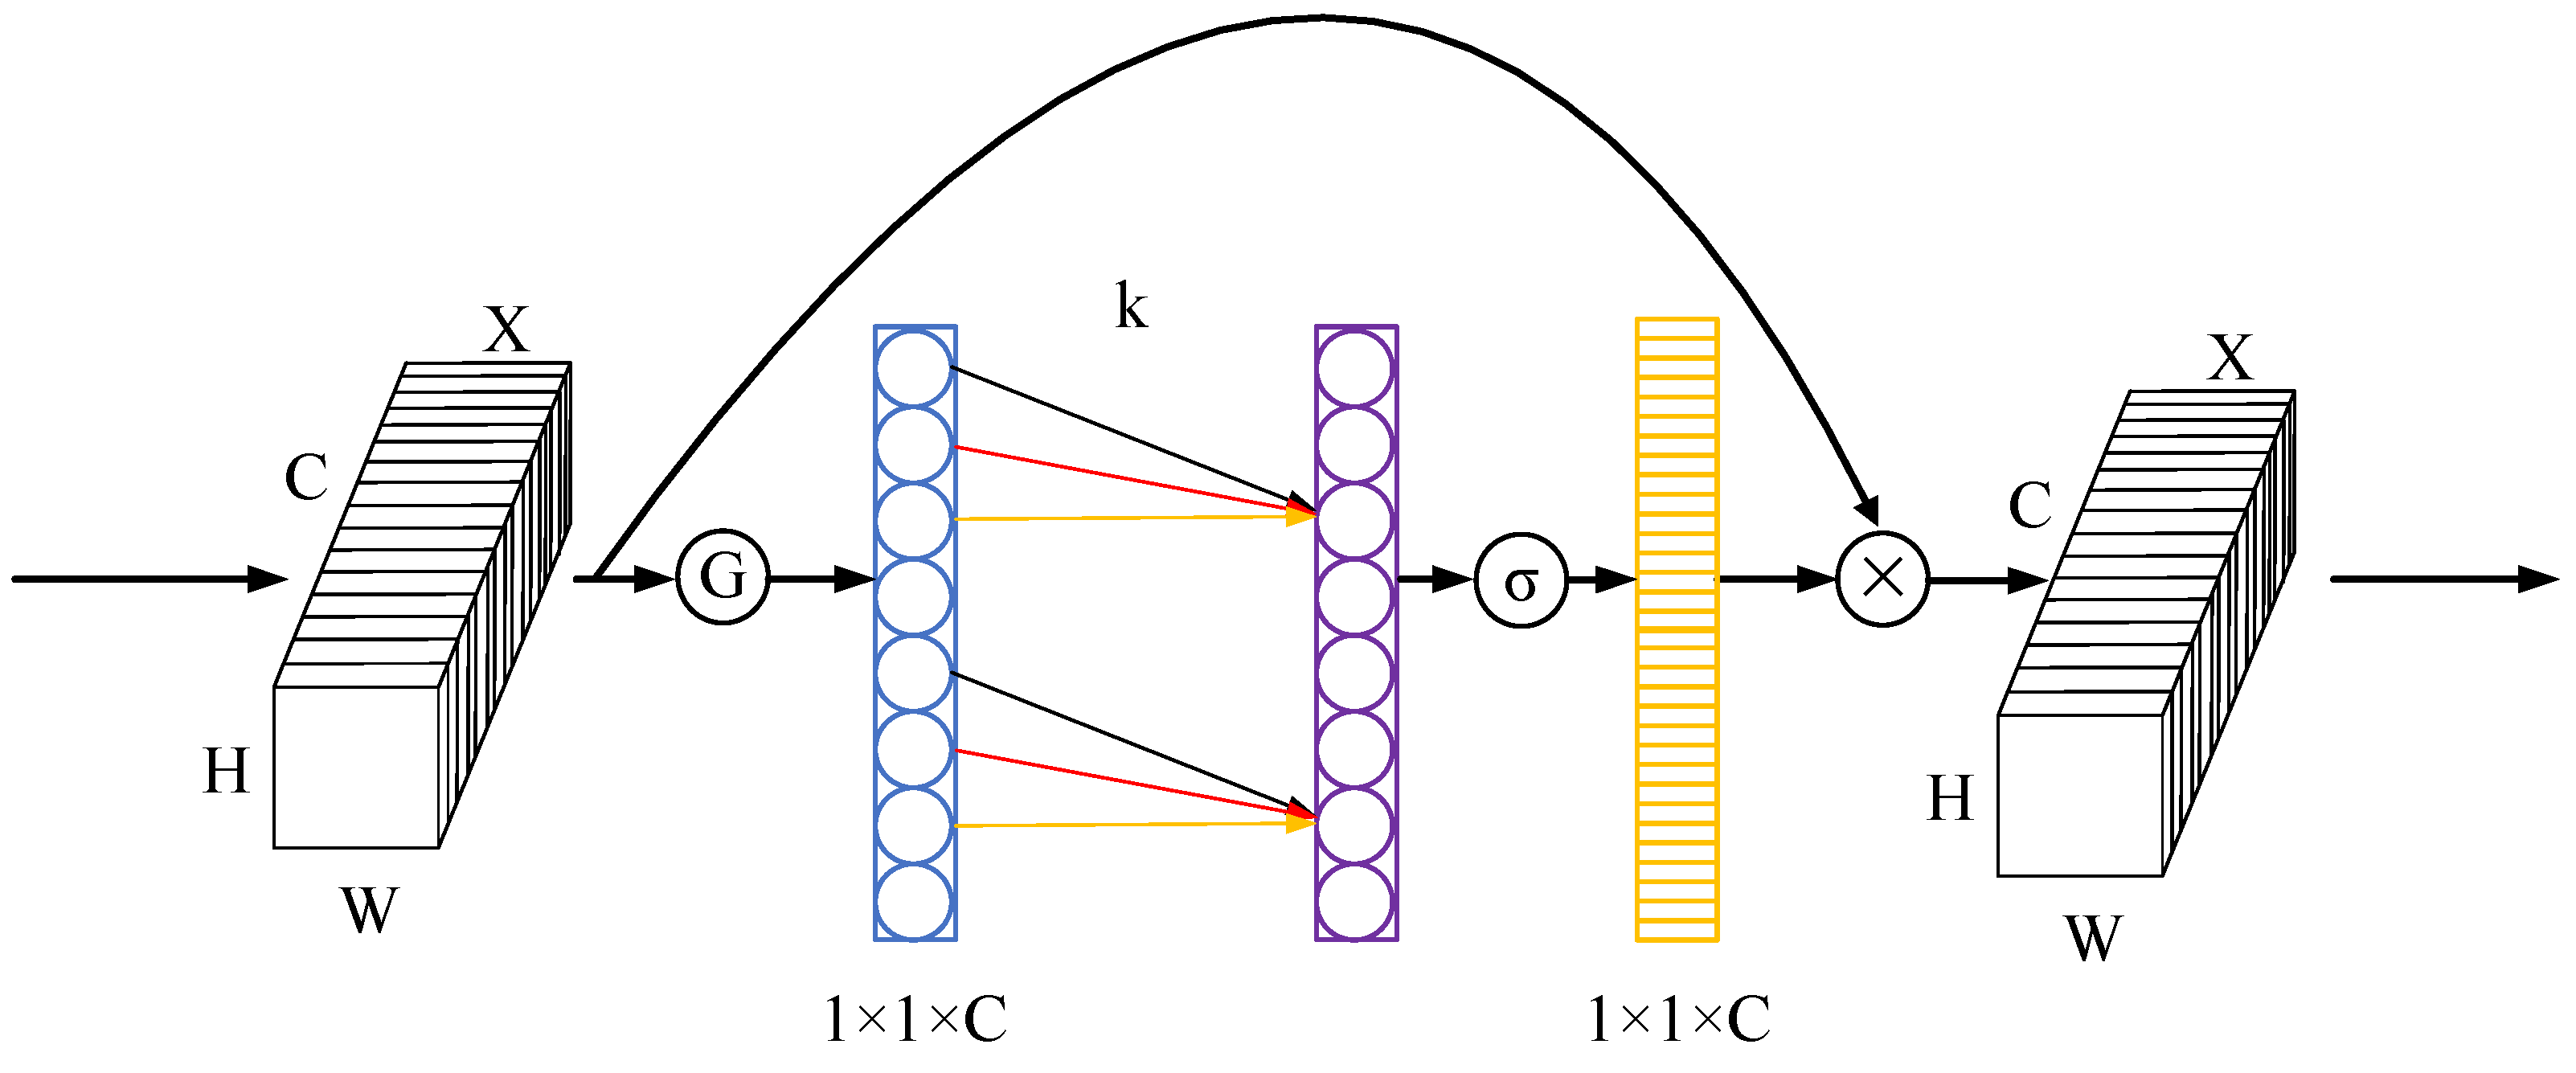
44], to refine the weights. The structure diagram of the ECA module is depicted in Figure 7. The ECA operating principle can be summarized as Equation (14).
F = F c h a n n e l × σ ( C o n v 1 D k ( GAPool ( F ) ) )
where C o n v 1 D k denotes a 1D convolution with kernel k, and in this paper, k = 3 . σ represents the sigmoid activation function. The ECA module obtains a 1 × 1 × C feature map via GAPool. A 1D convolution and a sigmoid function are subsequently applied to obtain the attention map. Lastly, feature maps are refined by multiplying them with the relevant channels of the input.
Three feature maps, which are processed via the ECA module, are concatenated with the residual feature map. At the end of the proposed A2SPPF, the results are reshaped via a 1 × 1 convolution to obtain the final output.

3.3. A2CSPlayer

How to efficiently merge the different scale features extracted from the backbone is an important issue for detecting multi-scale ships in SAR images. YOLOX-tiny introduces PAFPN, in which CSPlayer can effectively merge the feature maps from different scales. The CSPlayer increases the network’s depth by stacking 1 × 1 
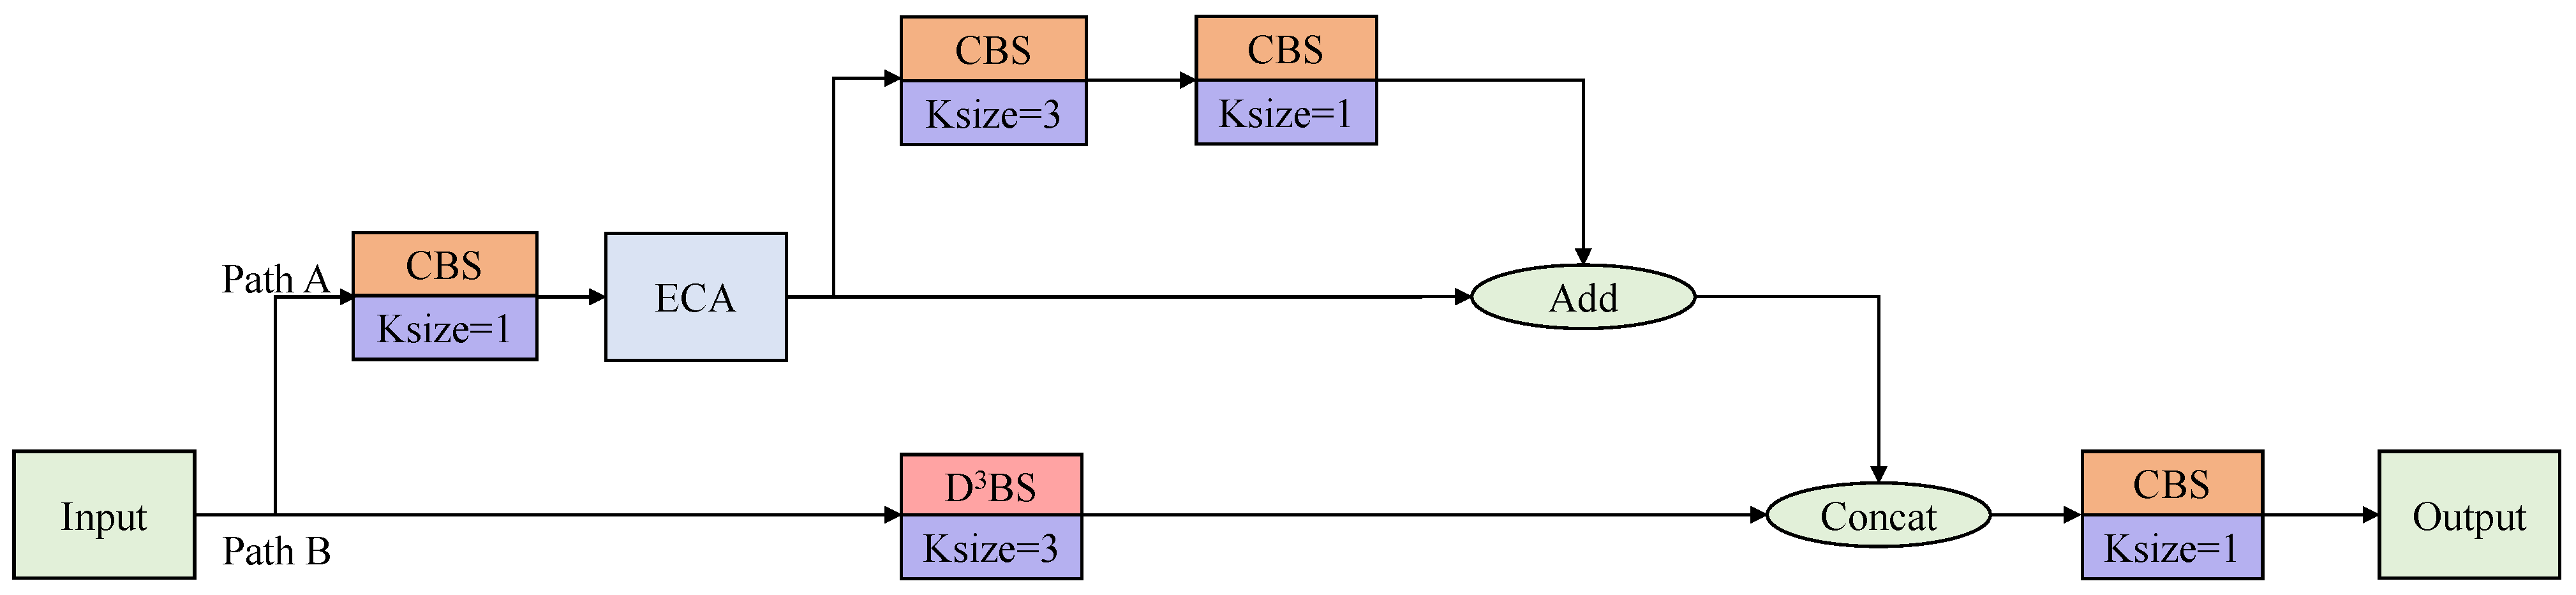
convolutions, and the bottleneck structure raises the network’s computational efficiency. However, CSPlayer has a small ERF. In addition, it is also challenging for CSPlayer to effectively extract the features of small ships that are scattered in different channels. To achieve more effective fusion of features from different scales, we propose the A2CSPlayer to process the concatenated feature maps. The architecture of the proposed A2CSPlayer is depicted in Figure 8.
The proposed A2CSPlayer contains two branches. In path A, a 1 × 1 convolution block and an ECA module refine the input feature map F i n p u t to extract the small ship features scattered in multiple channels. Then, the feature map is split into two parts. In one part, two convolutions with respective kernel sizes of 3 × 3 and 1 × 1 are applied to process the input feature map. Then, the feature map of this part is added to the residual part to generate the final result of path A. The convolution operation of path A can be formulated as Equations (15) and (16).
F A = E C A ( S i L u ( B N ( C o n v 1 × 1 ( F i n p u t ) ) ) )
F A = F A + S i L u ( B N ( C o n v 1 × 1 ( S i L u ( B N ( C o n v 3 × 3 ( F A ) ) ) ) )
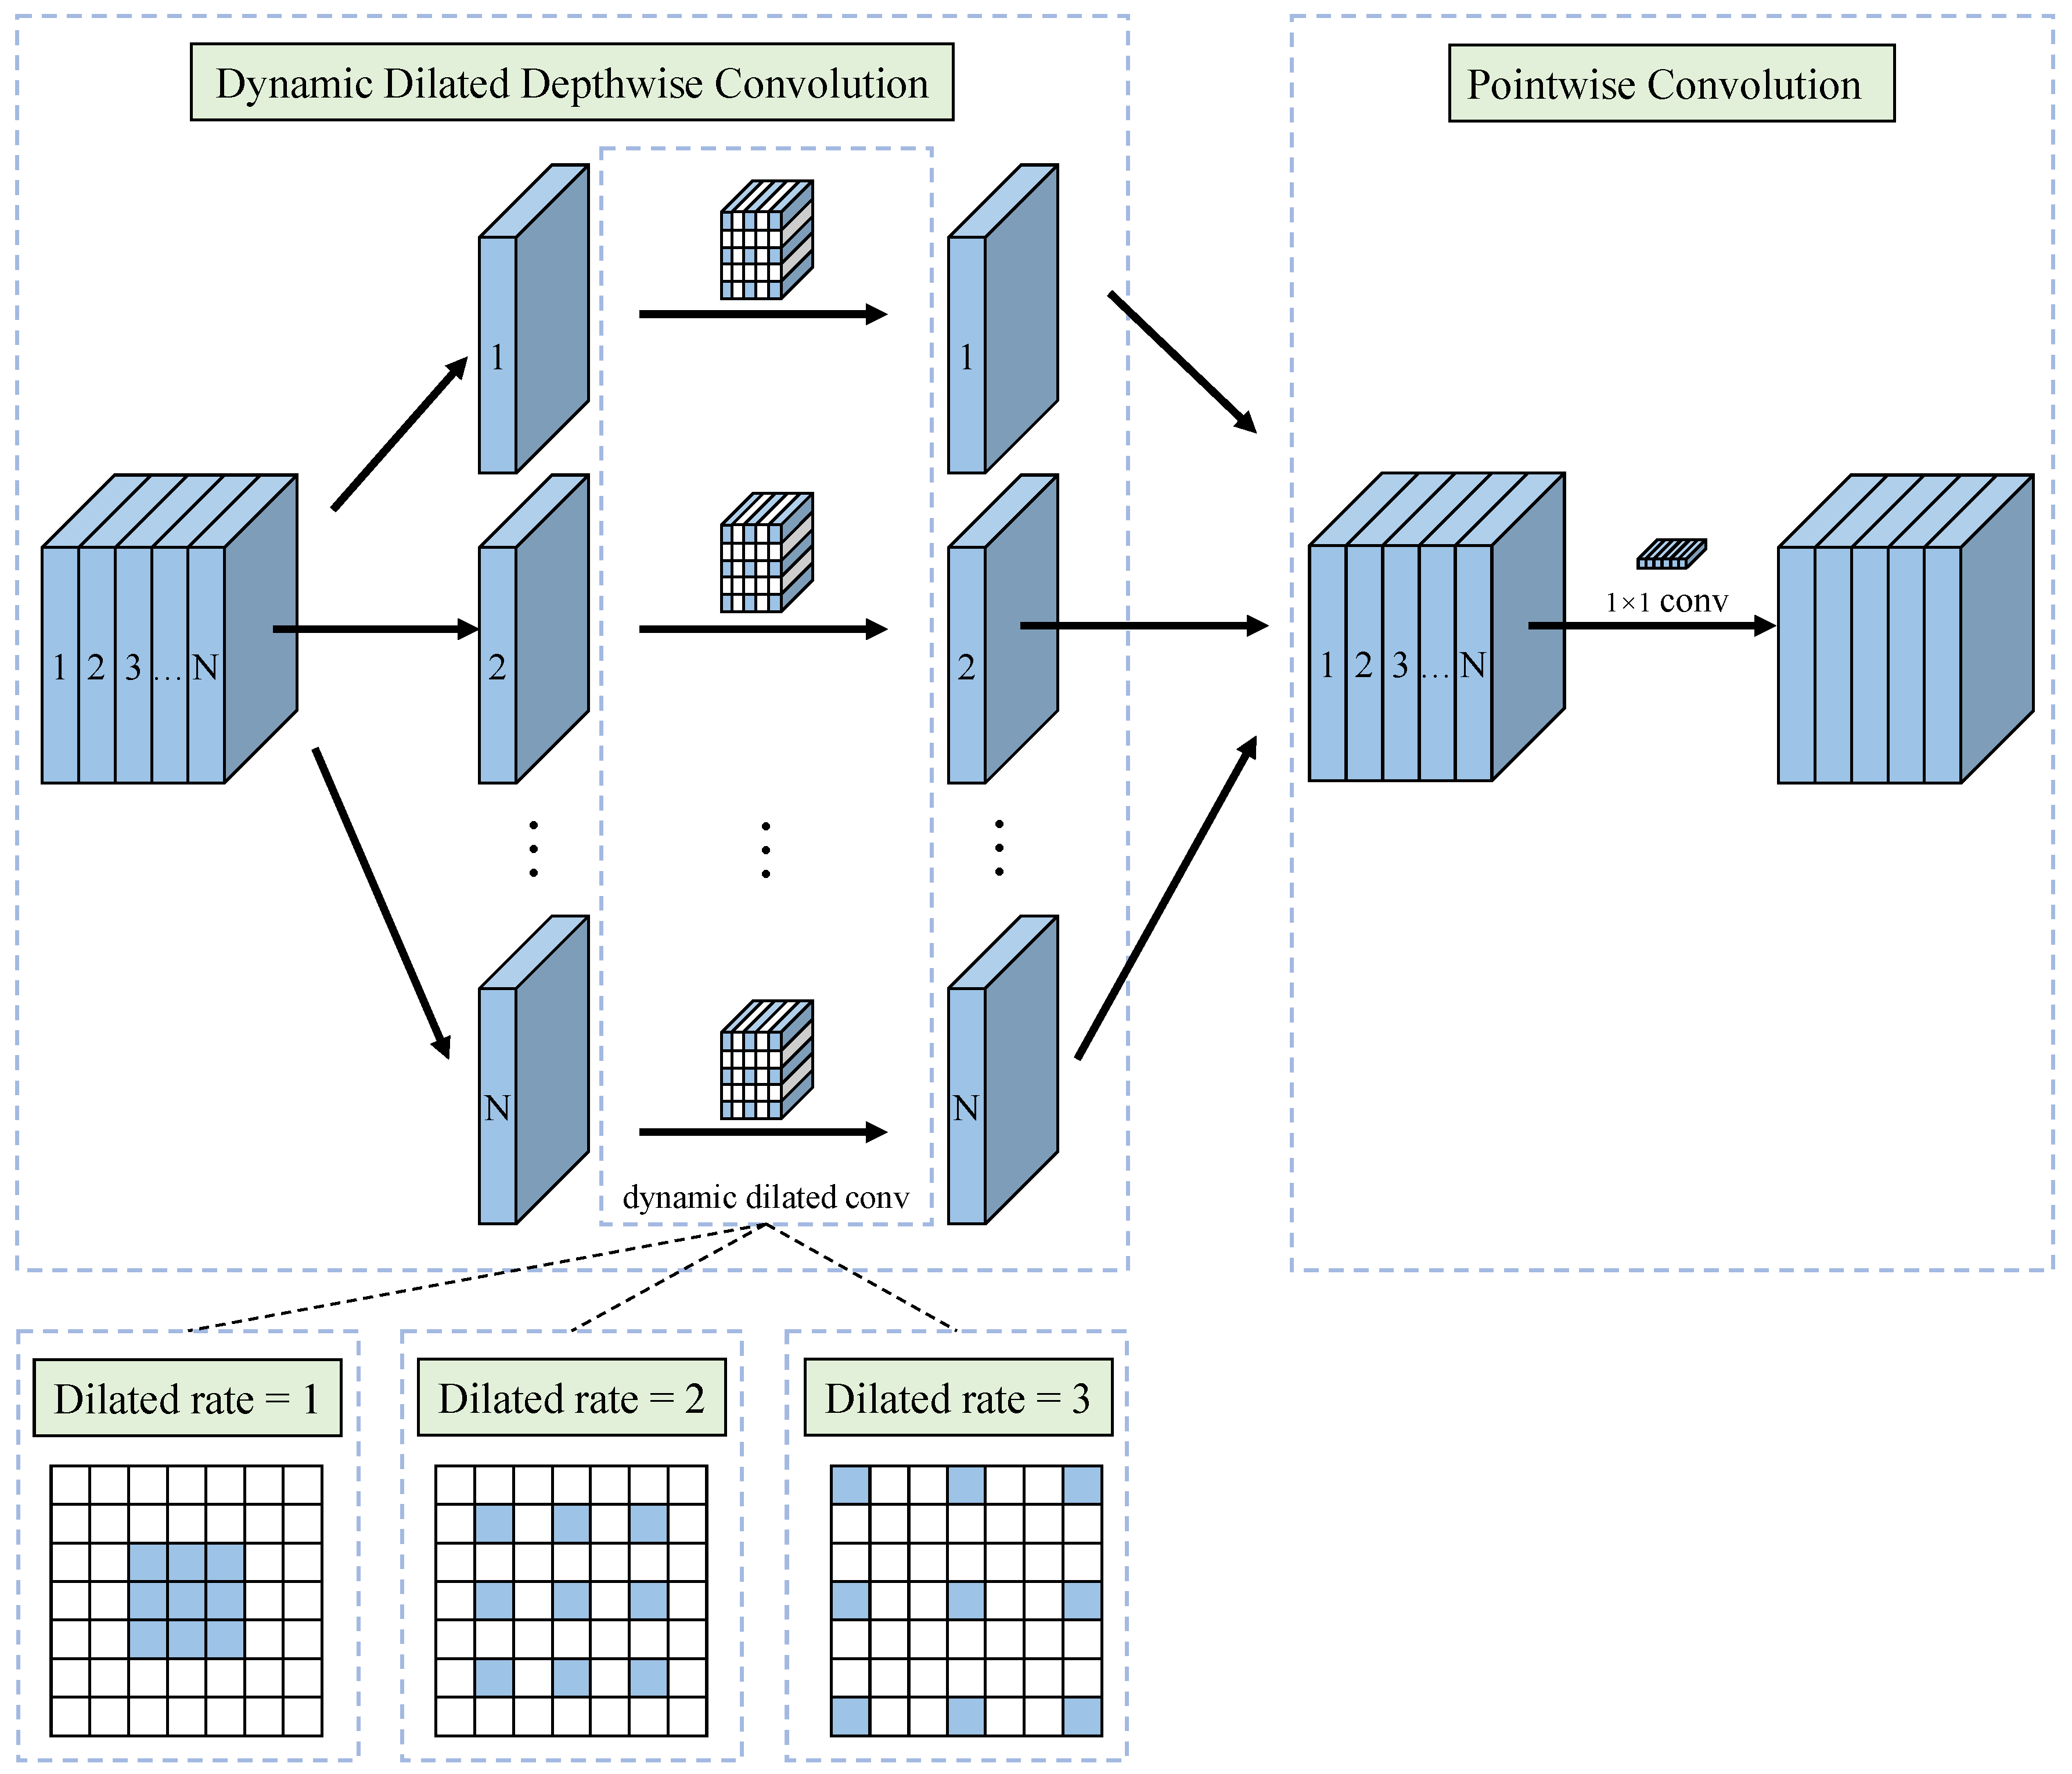
In path B, the input feature map F i n p u t is processed via the proposed dynamic dilated depthwise separable convolution ( D 3 SConv ), which has a larger ERF than conventional convolution, and the convolution operation can be expressed as Equation (17).
F B = D 3 BS 3 × 3 dr ( F input ) = SiLu ( BN ( PWC 1 × 1 ( Concat i = 1 N ( DWC 3 × 3 dr ( F input ) ) ) ) )
The designed D 3 SConv is shown in Figure 9. To expand the ERF and to improve the computational efficiency, we first combine DwConv with dilated convolution. To expand the ERF, we substitute the PWC convolution process in DwConv with a dilated convolution. However, feature maps of varying scales have varying widths and heights, and the contextual information they contain varies in scale. To improve the extraction of contextual information, we establish a mapping relationship among the dilation rate of d r , the width W i and height H i of the input image, and the width W c and height H c of the current feature map.
The proposed mapping relationship should meet both of the following conditions. (1) The dilation rate d r increases proportionally with the size of the feature map; (2) to prevent the loss of long-range information due to the large dilation rate, the dilation rate d r of the proposed D 3 SConv should be constrained. The proposed mapping relationship is shown in Equation (18).
d r = k t b = k W c + H c W i + H i b
where . is a floor operation. In this paper, to meet the two previous conditions above, k and b are set to 3 and 0.2, respectively. Table 1 shows the relationship after calculation among the input image size, the current feature map size, and dilation rate.
After the operation above, the two feature maps obtained from paths A and B are concatenated first. Finally, to obtain the output of the A2CSPlayer, a 1 × 1 convolution block is used to reshape the feature map. The operation can be summarized as Equation (19).
F o u t p u t = S i L u ( B N ( C o n v 1 × 1 ( C o n c a t ( F A , F B ) ) ) )

4. Experiments

To validate the validity of the proposed ESarDet, extensive experiments are conducted on DSSDD [45], SSDD [46], and HRSID [47], three challenging public datasets. This section initially describes the experimental environment, dataset, evaluation metrics, and training details. Subsequently, ablation experiments are then conducted to confirm the efficacy of each proposed module and the effects of large kernel convolution. Following that, we conduct comparison experiments to compare the proposed ESarDet with the current state-of-the-art (SOTA) detector. Generalization study are also conducted to verify the generalization capability of the proposed ESarDet. Finally, a visual robust analysis is conducted to evaluate the model’s robustness.

4.1. Experimental Environment

All experiments in this paper are conducted in the same environment. The configuration of the environment is shown in Table 2.

4.2. Dataset Description

4.2.1. DSSDD

The dual-polarimetric SAR ship detection dataset (DSSDD) is a unique public dataset that contains dual-polarization images [45]. The DSSDD dataset includes 1236 images collected from Sentinel-1 satellites, containing 3540 ship targets in total. Moreover, the image size in DSSDD is fixed at 256 pixels by 256 pixels. Among these images, 856 are trainable, and the remaining 380 are testing data.

4.2.2. SSDD

The SAR ship detection dataset (SSDD) is the most widely used public dataset in SAR ship detection [46]. The SSDD dataset includes 1160 images collected from three different satellites, totaling 2456 ship targets. In SSDD, 928 of these images are used for training, while the remaining 232 are used for testing. The image size of the SSDD dataset is not fixed. The edge of the images in SSDD varies from 256 pixels to 608 pixels, and the distance resolution is 1∼15 m.

4.2.3. HRSID

The high-resolution SAR images dataset (HRSID) is one of the most utilized datasets for ship detection tasks in high-resolution SAR images [47]. HRSID contains a total of 5604 images and 16,965 ship targets in the dataset, which is gathered from the Sentinel-1 and TerraSAR-X satellites. Among these 5604 images, the training set has 3642 images and the test set has 1962. The size of images in the HRSID dataset is fixed at 800 pixels by 800 pixels, and distance resolutions are 0.5 m, 1 m, and 3 m.

4.3. Training Details

This paper’s training parameters are established with reference to [25]. The optimization algorithm of the experiments used stochastic gradient descent (SGD) with a learning rate set to 0.01, a momentum set to 0.937, and a weight decay set to 0.0005. Furthermore, the unfreeze training batch size is 16. To obtain a pre-trained model, we first initialize all models with weights by random parameters. These models are then trained on the DSSDD dataset by unfreeze training for 30 epochs. Finally, the training results are applied as pre-trained models for subsequent training. Based on the pre-trained model, we trained 300 epochs by unfreeze training. The input image sizes are 256 × 256 in DSSDD, 416 × 416 in SSDD, and 800 × 800 in HRSID. Mosaic [48] and MixUp [49] data augmentation is also included in the training pipeline.

4.4. Evaluation Metrics

To measure the performance of the proposed ESarDet model, we introduce average precision ( A P ) and F 1 as evaluation indicators. The A P and F 1 are calculated as Equations (20)–(23).
A P = 0 1 P ( R ) d R ,
F 1 = 2 × P × R P + R
where P represents precision and R represents recall, and they are calculated as follows:
P = T P T P + F P
R = T P T P + F N
where T P , F P , and F N denote the number of true positives, false positives, and false negatives, respectively. True positives and false positives denote the proper detection of the model and the incorrect detection of the detector, respectively. False negative refers to a ground truth that the detector misses or does not detect.
In addition, the parameters ( P a r a m e t e r s ), floating-point operations per second ( F L O P s ), and frames per second ( F P S ) are also applied to measure the computational complexity and efficiency of the proposed model.

4.5. Ablation Experiments

4.5.1. Effects of Each Proposed Module

To verify the validation of each proposed module in ESarDet, we conduct three sets of ablation experiments on DSSDD, SSDD, and HRSID. Each set of ablation experiments contains five sub-experiments, containing fifteen sub-experiments in total.
In each set of ablation experiments, the first experiment is the YOLOX-tiny without any improvement as a baseline to provide a basis for comparison in subsequent experiments. The second experiment is the introduction of the proposed CAA-Net in the backbone of YOLOX-tiny to verify the effectiveness of the context attention auxiliary network (CAA-Net). In the third experiment, to validate the effectiveness of the proposed atrous attention spatial pyramid pooling fast (A2SPPF), we use the A2SPPF to replace the SPP in YOLOX-tiny. In the fourth experiment, we replace the CSPlayer in YOLOX-tiny’s PAFPN with the A2CSPlayer to verify the performance of the proposed atrous attentive cross-stage partial layer (A2CSPlayer) in feature fusion. Finally, in the fifth experiment, we superimposed the second experiment, the third experiment, and the fourth experiment in order to verify the validity of the proposed ESarDet. In addition, the training environment, parameters, and dataset used in each set of ablation experiments are kept consistent. The results of the three sets of ablation experiments are shown in Table 3, Table 4 and Table 5, and the visual ablation experiment results are shown in Figure 10.
First, compared with the baseline YOLOX-tiny, the proposed ESarDet obtains a significant improvement in A P for 97.93% (+1.63%), 97.96% (+2.88%), and 93.2% (+2.57%) of the DSSDD, SSDD, and HRSID datasets, respectively. As demonstrated in Figure 10, the proposed ESarDet accurately detects all ships in SAR images. In the second experiment, we added the proposed CAA-Net to the backbone of YOLOX-tiny, which improved the A P by 1.42% on DSSDD, 2.56% on SSDD, and 1.56% on HRSID. CAA-Net can expand the ERF and efficiently merge contextual information with semantic information, which is helpful for small ship detection. As shown in the first row in Figure 10, after adding CAA-Net, the model detected all ships in the image, whereas the baseline model missed some small ships. In the third experiment, we substituted the SPP of YOLOX-tiny with the proposed A2SPPF, and the A P of DSSDD, SSDD, and HRSID increased by 0.48%, 1.67%, and 1.19%, respectively, compared with the baseline. Figure 10 demonstrates that when there are dense small ships in the image, the detection performance of A2SPPF is superior to that of the baseline model. The results prove that the designed A2SPPF can effectively prevent loss of information. In the fourth experiment, we replaced the CSPlayer with the A2CSPlayer in the neck of YOLOX-tiny, and the A P increased by 0.67% on DSSDD, 1.51% on SSDD, and 1.25% on HRSID, while the p a r a m e t e r s increased by only 0.25%. As demonstrated in the third row of Figure 10, the designed A2CSPlayer is capable of detecting multi-scale ships in SAR images.
According to the results of the experiments, the three modules proposed in this paper can effectively improve the performance of SAR ship detection.

4.5.2. Effects of Large Kernel Convolution

In this subsection, we investigate the effect of large kernel convolution on SAR ship detection. We replace the kernel size of the convolution block in path A of CAA-Net with different sizes and test it on the HRSID dataset. The results are shown in Table 6. The A P of the model is 91.38% when the kernel size of convolution is 1 × 1 . As the kernel size increases, the A P also increases. According to the conclusion of Ding et al. [37], the performance should reach its maximum level when the kernel size of the convolution is large enough to completely cover the input feature map. Nevertheless, the model achieves an A P of 92.21% on the HRSID dataset when the kernel size is 13 × 13 . When we continue to increase the kernel size, the model’s performance does not significantly improve. We directly set the kernel size to 101 × 101 , which can completely cover the input feature map, but its A P is only 92.17% while the number of p a r a m e t e r s reaches 6.448 M. Moreover, the F P S of our model is greater than that of other kernel size models when the kernel size is 13 × 13 . Combining the above experiments, the proposed ESarDet finally selects 13 × 13 kernel convolution.

4.6. Comparison Experiments

4.6.1. Comparison with State-of-the-Art Detectors

In this section, several state-of-the-art (SOTA) detectors, including anchor-free detectors such as YOLOX-m [25], FCOS [50], and YOLOv8-l [51] and anchor-based detectors such as Faster-RCNN [52], YOLOv4 [48], YOLOv5-l [53] and YOLOv7 [54], are selected to verify the detection performance of the proposed ESarDet. Among these SOTA detectors, Faster-RCNN is a two-stage detector, while the others are single-stage detectors. We conduct comparative experiments on the DSSDD, SSDD, and HRSID datasets, and the experimental results are shown in Table 7, Table 8 and Table 9. From an overall perspective, the proposed ESarDet performs well in terms of detection performance, computational complexity, and detection speed.
Results on DSSDD. On the DSSDD dataset, the proposed ESarDet achieved an A P of 97.93% and an F 1 of 0.95. Among the listed SOTA detectors, YOLOX-m [25] achieved the highest detection accuracy, with an A P of 96.47%, 1.46% less than that of ESarDet. From the perspective of computational complexity, the p a r a m e t e r s of ESarDet, 6.2 M, are significantly lower than that of YOLOX-m, 25.281 M, accounting for only 24.5% of the latter. FCOS [50] comes closest to ESarDet in terms of detection speed, with an F P S of 69.01, which is 2.35 frames slower than ESarDet, but the detection accuracy of FCOS is 2.22%, which is 0.08 lower than that of ESarDet in A P and F 1 , respectively.
Results on SSDD. On this dataset, the proposed ESarDet obtained the highest A P and F 1 , 97.96% and 0.96, respectively. Compared with the anchor-based detectors, including Faster-RCNN [52], YOLOv4 [48], YOLOv5-l [53], and YOLOv7 [54], the proposed ESarDet obtained results that were 8.22%, 4.08%, 1.03%, and 0.74% higher in A P , respectively. Among these anchor-based detectors, YOLOv7 has the lowest p a r a m e t e r s , 37.192 M, which is six times higher than that of ESarDet (6.2 M).
Results on HRSID. The proposed ESarDet has the best performance in detection accuracy, with A P and F 1 reaching 93.22% and 0.91, respectively. Since the input image size on the HRSID dataset is 800 × 800 × 3 , the model has a significant increase in F L O P s in comparison with the first two datasets. Among all models, Faster-RCNN [52] has the highest F L O P s metric at 546.925 G, while ESarDet’s F L O P s is 27.572 G, only 5% of Faster-RCNN’s; however, ESarDet improves the detection accuracy by 7.27% in A P compared with Faster-RCNN. In terms of detection speed, the proposed ESarDet has an F P S of 60.58, while the model with the fastest detection speed is YOLOv5-l [53], which has an F P S metric of 46.36, 14.22 F P S slower than ESarDet.
Furthermore, two SAR images with complex backgrounds are selected to demonstrate the detection performance of the proposed ESarDet, the detection results are depicted in Figure 11 and Figure 12, and the ground truth of two SAR images is also shown in those figures. Only the proposed ESarDet accurately detects all ships in two sample images.
In the sample image I , FCOS missed the two in-shore small ships on the right side of the two images. YOLOv5-l mistook the buildings on the shore and the noise on the sea for ships. The other detectors also missed some ships and had false results. In the sample image II , only the proposed ESarDet, FCOS, and YOLOv7 accurately detected two ships docked together. Other detectors are less effective at identifying dense ship targets than the proposed ESarDet. In addition, YOLOv4 missed detecting a large quantity of ships in the images. YOLOv5-l incorrectly identified the structures on shore as ships. Moreover, three superior detectors, YOLOv7, YOLOv8-l, and YOLOX-m, missed detecting several ships as well.

4.6.2. Comparison with SAR Ship Detectors

To further validate the performance of the proposed ESarDet, a comparison experiment was conducted on the SSDD dataset. In this subsection, several SOTA SAR ship detectors, including the two-stage detectors CRTransSar and BL-Net and the one-stage detectors FEPS-Net, CenterNet++, AFSar, and Pow-FAN were chosen for comparison with the proposed ESarDet. Due to the fact that the majority of SAR ship detectors do not release their source code, we cannot reproduce them and can only compare them based on the data they provide.
The results of the comparison experiments are shown in Table 10. When the input images are smaller than those of the other six SAR ship detectors, the proposed ESarDet still achieves an A P and an F 1 of 97.96% and 0.96, respectively, which are superior to the other detectors. Compared with CenterNet++, ESarDet improved A P and F 1 by 2.86% and 0.08, respectively, while the detection speed improved by 35.45 F P S . In comparison with BL-Net, ESarDet improved A P and F 1 by 2.71% and 0.03 respectively, while decreasing the p a r a m e t e r s and F L O P s by 41.61 M, 34.254 G, respectively. In terms of detection speed, ESarDet improved by 60.73 F P S compared with BL-Net’s 5.02 F P S , reaching 65.75 F P S . In addition, ESarDet reduced the p a r a m e t e r s by 31.11 M and increased the A P by 1.96% when compared with FEPS-Net. In contrast to FEPS-Net, the detection speed of ESarDet increased by 34.21 F P S . The comparison experiments’ results demonstrate that the proposed ESarDet performs better than the existing SOTA SAR ship detector in a number of performance metrics.

4.7. Generalization Study

There are apparent variations between ships in different images due to distinctions in polarization, sensor models, and shooting locations; therefore, an efficient SAR ship detection method should have a high capacity for generalization. To verify the generalization capability of the proposed ESarDet, a generalization study was conducted. In this section, we train the model on the HRSID dataset and then directly test the trained model on the DSSDD test dataset, and the results of the experiments are shown in Table 11.
From the results of the generalization study, the performance of anchor-based detectors is dependent on the quality of the manually pre-designed anchors, so the generalization ability of anchor-based detectors is poor. In contrast, anchor-free detectors such as FCOS, YOLOX-m, and the proposed ESarDet have better generalization ability. In the generalization test, the A P of ESarDet reached 81.49%, which was 2.45%, 42.26%, 13.02%, 66.51%, 5.46%, and 5.46% higher than those of FCOS, YOLOv4, YOLOv5-l, YOLOv7, YOLOv8-l, and YOLOX-m, respectively, and the F 1 of ESarDet reached 0.82 over several other detectors. According to the results of the generalization study, our proposed ESarDet has greater generalization capability than other SOTA detectors.

4.8. Visual Robust Analysis

Due to variability in the imaging process, such as noise and various degradations, the detector is susceptible to false positives and false negatives [55]. In this section, we discuss the effectiveness of the proposed ESarDet when SAR image quality is degraded. Three low-quality images were selected, and visual results are presented in Figure 13. In order to better visually explain the performance, Grad-CAM [56] is also introduced to generate heatmaps.
Despite the variability affecting these images, the proposed ESarDet detects all ships in the three SAR images successfully and accurately. This demonstrates that ESarDet maintains excellent detection accuracy even when low-quality SAR images are present. However, the heatmaps in Figure 13 show that noise and other factors do interfere with ESarDet, and in some of the images, the background is given the incorrect weights.

5. Discussion

To address the challenges of complex background, small ship scale, large scale variation, and limited computational resources in SAR images, three modules, CAA-Net, A2SPPF, and A2CSPlayer, are proposed in this paper. To validate the effectiveness of the proposed ESarDet, we conduct extensive experiments on the DSSDD, SSDD, and HRSID datasets. The experimental results demonstrate that the proposed ESarDet outperforms the existing SOTA detector in terms of detection accuracy, generalization capability, computational complexity, detection speed and robustness.
However, the proposed ESarDet still has certain limitations. Due to its network architecture that involves the parallel operation of CAA-Net and the backbone, ESarDet does not exhibit significant advantages in terms of detection speed. In addition, the proposed ESarDet may still be affected by image noise, clutter, and degradation, so there is room for improvement. In future work, we will continue to investigate the effects of noise and other factors on the network and try to design more efficient network structures.

6. Conclusions

In this paper, an efficient SAR ship detection method based on a large effective receptive field and contextual information called ESarDet was proposed. For the characteristics of ships in SAR images, such as complex backgrounds, large scale variations, small scale targets, and limited computational resources, three modules were proposed to improve detection performance. First, CAA-Net, a large kernel convolution-based module for contextual information extraction, was designed to detect small-scale ships in SAR images. CAA-Net can effectively merge context and semantic information to enhance the model’s detection performance. Subsequently, A2SPPF was proposed to avoid loss of ship detail information. This module uses dilated convolution with an attention mechanism to avoid information loss and improves the computational efficiency by improving the network structure. Finally, A2CSPlayer, which can adaptively adjust the dilation rate to more effectively fuse the feature maps from different scales, was constructed.
Extensive experiments were conducted on the DSSDD, SSDD, and HRSID datasets, respectively, to validate the effectiveness of the proposed ESarDet. The proposed ESarDet achieved 97.93%, 97.96%, and 93.22% A P on the DSSDD, SSDD, and HRSID datasets, respectively, which was higher than that of the baseline model and other SOTA methods. Regarding computational efficiency, the proposed ESarDet model has only 6.2 M p a r a m e t e r s , significantly less than that in other SOTA models. The experimental results prove that the proposed ESarDet can achieve accurate and efficient ship detection in SAR images.
However, the proposed ESarDet still has limitations, such as no significant advantage in detection speed, and the possibility of still being disturbed by noise and clutter. In future work, we will continue to investigate the effects of noise and other factors on the network and try to design more efficient network structures.

Author Contributions

Conceptualization, Y.Z. and C.C.; methodology, Y.Z. and C.C.; software, Y.Z. and C.C.; validation, Y.Z. and C.C.; formal analysis, R.H. and Y.Y.; investigation, R.H.; resources, R.H.; data curation, Y.Z. and C.C.; writing—original draft preparation, Y.Z. and C.C.; writing—review and editing, Y.Z., C.C., R.H. and Y.Y.; visualization, Y.Z.; supervision, R.H.; project administration, R.H.; funding acquisition, Y.Y. All authors have read and agreed to the published version of the manuscript.

Funding

This work was supported by the National Natural Science Foundation of China under grant 62076107 and the Natural Science Foundation of Jiangsu Province under grant BK20211365.

Data Availability Statement

Our code is available at https://github.com/ZYMCCX/ESarDet (accessed on 8 June 2023).

Conflicts of Interest

The authors declare no conflict of interest.

References

  1. Hong, D.; Gao, L.; Yokoya, N.; Yao, J.; Chanussot, J.; Du, Q.; Zhang, B. More diverse means better: Multimodal deep learning meets remote-sensing imagery classification. IEEE Trans. Geosci. Remote Sens. 2020, 59, 4340–4354. [Google Scholar] [CrossRef]
  2. Hong, D.; Gao, L.; Yao, J.; Zhang, B.; Plaza, A.; Chanussot, J. Graph Convolutional Networks for Hyperspectral Image Classification. IEEE Trans. Geosci. Remote Sens. 2020, 59, 5966–5978. [Google Scholar] [CrossRef]
  3. Jiao, J.; Zhang, Y.; Sun, H.; Yang, X.; Gao, X.; Hong, W.; Fu, K.; Sun, X. A densely connected end-to-end neural network for multiscale and multiscene SAR ship detection. IEEE Access. 2018, 6, 20881–20892. [Google Scholar] [CrossRef]
  4. Bianchi, F.M.; Espeseth, M.M.; Borch, N. Large-scale detection and categorization of oil spills from SAR images with deep learning. Remote Sens. 2020, 12, 2260. [Google Scholar] [CrossRef]
  5. Lapini, A.; Pettinato, S.; Santi, E.; Paloscia, S.; Fontanelli, G.; Garzelli, A. Comparison of Machine Learning Methods Applied to SAR Images for Forest Classification in Mediterranean Areas. Remote Sens. 2020, 12, 369. [Google Scholar] [CrossRef] [Green Version]
  6. Mandal, D.; Rao, Y. SASYA: An integrated framework for crop biophysical parameter retrieval and within-season crop yield prediction with SAR remote sensing data. Remote Sens. Appl. Soc. Environ. 2020, 20, 100366. [Google Scholar] [CrossRef]
  7. Bethke, K.H.; Baumgartner, S.; Gabele, M.; Hounam, D.; Kemptner, E.; Klement, D.; Krieger, G.; Erxleben, R. Air-and spaceborne monitoring of road traffic using SAR moving target indication—Project TRAMRAD. ISPRS J. Photogramm. Remote Sens. 2006, 61, 243–259. [Google Scholar] [CrossRef]
  8. Snapir, B.; Waine, T.W.; Biermann, L. Maritime Vessel Classification to Monitor Fisheries with SAR: Demonstration in the North Sea. Remote Sens. 2016, 33, 353. [Google Scholar] [CrossRef] [Green Version]
  9. Sun, Z.; Leng, X.; Lei, Y.; Xiong, B.; Ji, K.; Kuang, G. BiFA-YOLO: A Novel YOLO-Based Method for Arbitrary-Oriented Ship Detection in High-Resolution SAR Images. Remote Sens. 2021, 13, 4209. [Google Scholar] [CrossRef]
  10. Kuttikkad, S.; Chellappa, R. Non-Gaussian CFAR techniques for target detection in high resolution SAR images. In Proceedings of the ICIP-94, Austin, TX, USA, 13–16 November 1994; pp. 910–914. [Google Scholar]
  11. Banerjee, A.; Burlina, P.; Chellappa, R. Adaptive target detection in foliage-penetrating SAR images using Alpha-Stable models. IEEE Trans. Image Process. 1999, 8, 1823–1831. [Google Scholar] [CrossRef] [Green Version]
  12. Qin, X.; Zhou, S.; Zou, H.; Gao, G. A CFAR detection algorithm for generalized gamma distributed background in high-resolution SAR images. IEEE Geosci. Remote Sens. Lett. 2012, 10, 806–810. [Google Scholar]
  13. Ai, J.; Qi, X.; Yu, W.; Deng, Y.; Liu, F.; Shi, L. A new CFAR ship detection algorithm based on 2-D joint log-normal distribution in SAR images. IEEE Geosci. Remote Sens. Lett. 2010, 7, 806–810. [Google Scholar] [CrossRef]
  14. Li, J.; Xu, C.; Su, H.; Gao, L.; Wang, T. Deep Learning for SAR Ship Detection: Past, Present and Future. Remote Sens. 2022, 14, 2712. [Google Scholar] [CrossRef]
  15. Jiang, J.; Fu, X.; Qin, R.; Wang, X.; Ma, Z. High-speed lightweight ship detection algorithm based on YOLO-v4 for three-channels RGB SAR image. Remote Sens. 2021, 13, 1909. [Google Scholar] [CrossRef]
  16. Xia, R.; Chen, J.; Huang, Z.; Wan, H.; Wu, B.; Sun, L.; Yao, B.; Xiang, H.; Xing, M. CRTransSar: A Visual Transformer Based on Contextual Joint Representation Learning for SAR Ship Detection. Remote Sens. 2022, 14, 1488. [Google Scholar] [CrossRef]
  17. Bai, L.; Yao, C.; Ye, Z.; Xue, D.; Lin, X.; Hui, M. Feature Enhancement Pyramid and Shallow Feature Reconstruction Network for SAR Ship Detection. IEEE J. Sel. Top. Appl. Earth Obs. Remote Sens. 2023, 16, 1042–1056. [Google Scholar] [CrossRef]
  18. Yasir, M.; Shanwei, L.; Mingming, X.; Hui, S.; Hossain, S.; Colak, A.T.I.; Wang, D.; Jianhua, W.; Dang, K.B. Multi-scale ship target detection using SAR images based on improved Yolov5. Front. Mar. Sci. 2023, 9, 1086140. [Google Scholar] [CrossRef]
  19. Guo, H.; Yang, X.; Wang, N.; Gao, X. A Centernet++ model for ship detection in SAR images. Pattern Recognit. 2021, 112, 107787. [Google Scholar] [CrossRef]
  20. Wan, H.Y.; Chen, J.; Huang, Z.X.; Xia, R.F.; Wu, B.C.; Sun, L.; Yao, B.D.; Liu, X.P.; Xing, M.D. AFSar: An anchor-free SAR target detection algorithm based on multiscale enhancement representation learning. IEEE Trans. Geosci. Remote Sens. 2021, 60, 1–14. [Google Scholar] [CrossRef]
  21. Hu, Q.; Hu, S.; Liu, S. BANet: A Balance Attention Network for Anchor-Free Ship Detection in SAR Images. IEEE Trans. Geosci. Remote Sens. 2022, 60, 1–12. [Google Scholar] [CrossRef]
  22. Xiao, M.; He, Z.; Li, X.; Lou, A. Power Transformations and Feature Alignment Guided Network for SAR Ship Detection. IEEE Geosci. Remote Sens. Lett. 2022, 19, 1–5. [Google Scholar] [CrossRef]
  23. Li, S.; Fu, X.; Dong, J. Improved Ship Detection Algorithm Based on YOLOX for SAR Outline Enhancement Image. Remote Sens. 2022, 14, 4070. [Google Scholar] [CrossRef]
  24. Zhang, T.; Zhang, X.; Liu, C.; Shi, J.; Wei, S.; Ahmad, I.; Zhan, X.; Zhou, Y.; Pan, D.; Li, J.; et al. Balance learning for ship detection from synthetic aperture radar remote sensing imagery. ISPRS J. Photogramm. Remote Sens. 2021, 182, 190–207. [Google Scholar] [CrossRef]
  25. Zheng, G.; Songtao, L.; Feng, W.; Zeming, L.; Jian, S. YOLOX: Exceeding YOLO Series in 2021. arXiv 2021, arXiv:2107.08430. [Google Scholar]
  26. Krizhevsky, A.; Sutskever, I.; Hinton, G. Imagenet classification with deep convolutional neural networks. Commun. ACM 2017, 60, 84–90. [Google Scholar] [CrossRef] [Green Version]
  27. Yang, C.; Huang, Z.; Wang, N. QueryDet: Cascaded Sparse Query for Accelerating High-Resolution Small Object Detection. In Proceedings of the IEEE/CVF Conference on Computer Vision and Pattern Recognition (CVPR), New Orleans, LA, USA, 18–24 June 2022; pp. 13668–13677. [Google Scholar]
  28. Yu, F.; Koltun, V. Multi-scale context aggregation by dilated convolutions. arXiv 2015, arXiv:1511.07122. [Google Scholar]
  29. Lin, T.Y.; Dollár, P.; Girshick, R.; He, K.; Hariharan, B.; Belongie, S. Feature pyramid networks for object detection. In Proceedings of the IEEE Conference on Computer Vision and Pattern Recognition, Honolulu, HI, USA, 21–26 July 2017; pp. 2117–2125. [Google Scholar]
  30. Wu, X.; Hong, D.; Tian, J.; Chanussot, J.; Li, W.; Tao, R. ORSIm detector: A novel object detection framework in optical remote sensing imagery using spatial-frequency channel features. IEEE Trans. Geosci. Remote Sens. 2019, 57, 5146–5158. [Google Scholar] [CrossRef] [Green Version]
  31. Singh, B.; Najibi, M.; Davis, L.S. SNIPER: Efficient multi-scale training. In Proceedings of the Advances in Neural Information Processing Systems (NeurIPS), Montréal, QC, Canada, 3–8 December 2018; pp. 9310–9320. [Google Scholar]
  32. Lim, J.; Astrid, M.; Yoon, H.; Lee, S. Small Object Detection using Context and Attention. In Proceedings of the 2019 IEEE Conference on Computer Vision and Pattern Recognition, Long Beach, CA, USA, 15–21 June 2019. [Google Scholar]
  33. Wu, X.; Hong, D.; Chanussot, J. UIU-Net: U-Net in U-Net for Infrared Small Object Detection. IEEE Trans. Image Process. 2022, 32, 364–376. [Google Scholar] [CrossRef]
  34. Chollet, F. Xception: Deep learning with depthwise separable convolutions. In Proceedings of the 2017 IEEE Conference on Computer Vision and Pattern Recognition (CVPR), Honolulu, HI, USA, 21–26 July 2017; pp. 1251–1258. [Google Scholar]
  35. Hou, Q.; Zhou, D.; Feng, J. Coordinate attention for efficient mobile network design. In Proceedings of the 2021 IEEE/CVF Conference on Computer Vision and Pattern Recognition (CVPR), Nashville, TN, USA, 20–25 June 2021; pp. 13713–13722. [Google Scholar]
  36. Stergiou, A.; Poppe, R.; Kalliatakis, G. Refining activation downsampling with SoftPool. In Proceedings of the IEEE/CVF International Conference on Computer Vision, Montreal, BC, Canada, 11–17 October 2021; pp. 10357–10366. [Google Scholar]
  37. Ding, X.; Zhang, X.; Han, J.; Ding, G. Scaling up your kernels to 31x31: Revisiting large kernel design in cnns. In Proceedings of the IEEE/CVF Conference on Computer Vision and Pattern Recognition, New Orleans, LA, USA, 19–24 June 2022; pp. 11963–11975. [Google Scholar]
  38. Luo, W.; Li, Y.; Urtasun, R.; Zemel, R. Understanding the effective receptive field in deep convolutional neural networks. arXiv 2017, arXiv:1701.04128. [Google Scholar]
  39. Woo, S.; Park, J.; Lee, J.Y. Cbam: Convolutional block attention module. In Proceedings of the European Conference on Computer Vision (ECCV), Glasgow, UK, 23–28 August 2018; pp. 3–19. [Google Scholar]
  40. He, K.; Zhang, X.; Ren, S.; Sun, J. Spatial pyramid pooling in deep convolutional networks for visual recognition. IEEE Trans. Pattern Anal. Mach. Intell. 2015, 37, 1904–1916. [Google Scholar] [CrossRef] [Green Version]
  41. Chen, L.-C.; Papandreou, G.; Kokkinos, I.; Murphy, K.; Yuille, A.L. DeepLab: Semantic Image Segmentation with Deep Convolutional Nets, Atrous Convolution, and Fully Connected CRFs. IEEE Trans. Pattern Anal. Mach. Intell. 2018, 40, 834–848. [Google Scholar] [CrossRef] [PubMed] [Green Version]
  42. Li, C.; Li, L.; Jiang, H.; Weng, K.; Geng, Y.; Li, L.; Ke, Z.; Li, Q.; Cheng, M.; Nie, W.; et al. YOLOv6: A Single-Stage Object Detection Framework for Industrial Applications. arXiv 2022, arXiv:2209.02976. [Google Scholar]
  43. Qiu, Y.; Liu, Y.; Chen, Y.; Zhang, J.; Zhu, J.; Xu, J. A2SPPNet: Attentive Atrous Spatial Pyramid Pooling Network for Salient Object Detection. IEEE Trans. Multimed 2022, 25, 1991–2006. [Google Scholar] [CrossRef]
  44. Wang, Q.; Wu, B.; Zhu, P.; Li, P.; Zuo, W.; Hu, Q. ECA-Net: Efficient Channel Attention for Deep Convolutional Neural Networks. In Proceedings of the 2020 IEEE/CVF Conference on Computer Vision and Pattern Recognition, Seattle, WA, USA, 13–19 June 2020. [Google Scholar]
  45. Hu, Y.; Li, Y.; Pan, Z. A Dual-Polarimetric SAR Ship Detection Dataset and a Memory-Augmented Autoencoder-Based Detection Method. Sensors 2021, 21, 8478. [Google Scholar] [CrossRef]
  46. Zhang, T.; Zhang, X.; Li, J.; Xu, X.; Wang, B.; Zhan, X.; Xu, Y.; Ke, X.; Zeng, T.; Su, H.; et al. SAR Ship Detection Dataset (SSDD): Official Release and Comprehensive Data Analysis. Remote Sens. 2021, 13, 3690. [Google Scholar] [CrossRef]
  47. Wei, S.; Zeng, X.; Qu, Q.; Wang, M.; Su, H.; Shi, J. HRSID: A high-resolution SAR images dataset for ship detection and instance segmentation. IEEE Access. 2020, 8, 120234–120254. [Google Scholar] [CrossRef]
  48. Bochkovskiy, A.; Wang, C.Y.; Liao, H.M. YOLOv4: Optimal Speed and Accuracy of Object Detection. arXiv 2020, arXiv:2004.10934. [Google Scholar]
  49. Zhang, H.; Cisse, M.; Dauphin, Y.N.; Lopez-Paz, D. mixup: Beyond empirical risk minimization. In Proceedings of the International Conference on Learning Representations (ICLR), Vancouver, BC, Canada, 30 April–3 May 2018. [Google Scholar]
  50. Tian, Z.; Shen, C.; Chen, H.; He, T. Fcos: Fully Convolutional One-Stage Object Detection. In Proceedings of the the IEEE International Conference on Computer Vision, Seoul, Republic of Korea, 27 October–2 November 2019; pp. 9627–9636. [Google Scholar]
  51. Jocher, G. YOLOv8. 2023. Available online: https://github.com/ultralytics/ultralytics (accessed on 14 February 2023).
  52. Ren, S.; He, K.; Girshick, R.; Sun, J. Faster R-CNN: Towards Real-Time Object Detection with Region Proposal Networks. IEEE Trans. Pattern Anal. Mach. Intell. 2017, 39, 1137–1149. [Google Scholar] [CrossRef] [Green Version]
  53. Jocher, G. YOLOv5. 2020. Available online: https://github.com/ultralytics/yolov5 (accessed on 14 February 2023).
  54. Wang, C.Y.; Bochkovskiy, A.; Liao, H.Y.M. YOLOv7: Trainable bag-of-freebies sets new state-of-the-art for real-time object detectors. arXiv 2022, arXiv:2207.02696. [Google Scholar]
  55. Hong, D.; Yokoya, N.; Chanussot, J.; Zhu, X.X. An Augmented Linear Mixing Model to Address Spectral Variability for Hyperspectral Unmixing. IEEE Trans. Image Process. 2019, 28, 1923–1938. [Google Scholar] [CrossRef] [Green Version]
  56. Selvaraju, R.R.; Cogswell, M.; Das, A.; Vedantam, R.; Parikh, D.; Batra, D. Grad-cam: Visual explanations from deep networks via gradient-based localization. In Proceedings of the IEEE International Conference on Computer Vision, Venice, Italy, 22–29 October 2017; pp. 618–626. [Google Scholar]
Figure 1. The flow diagram of the proposed ESarDet. (a) The output of the C3 convolution block is fed to CAA-Net to extract contextual information, which is then fused with the semantic information extracted by the backbone via the feature fusion module. (b) To avoid loss of detail and to improve the computational efficiency, A2SPPF is added to the C5 convolution block of the backbone. (c) To better fuse the feature maps from different scales, A2CSPlayer is introduced to the neck to refine the concatenated feature maps.
Remotesensing 15 03018 g001
Figure 2. The overall work process of the proposed CAA-Net. A detailed flow diagram of CAA-Net is shown in the red dashed box. In the figure, CA stands for the coordinate attention module, and Ksize is the convolution block’s kernel size.
Remotesensing 15 03018 g002
Figure 3. The structure of the CA module; output size represents the size of the output feature map after the operation.
Remotesensing 15 03018 g003
Figure 4. The work flow of SoftPool.
Remotesensing 15 03018 g004
Figure 5. The feature fusion module concatenates feature maps from CAA-Net and the backbone. Afterward, 3 × 3 DwConv is applied to reshape the concatenated results. Finally, CBAM refines the reshaped feature map to obtain the feature fusion module’s output.
Remotesensing 15 03018 g005
Figure 6. The structure of the (a) SPP, and (b) proposed A2SPPF, where ECA stands for efficient channel attention module, Ksize represents the kernel size of the operation, and rate represents the dilation rate of the dilated convolution. DCBS is the convolution operation of dilated convolution+batch normalization+silu.
Remotesensing 15 03018 g006
Figure 7. The operation flow of the ECA module.
Remotesensing 15 03018 g007
Figure 8. The architecture of the proposed A2CSPlayer. D 3 SConv represents the proposed dynamic dilated depthwise separable convolution, and ECA denotes the efficient channel attention module.
Remotesensing 15 03018 g008
Figure 9. The architecture of the proposed D 3 SConv . Given that the contextual information contained in the feature maps varies in scale, the proposed D 3 SConv can dynamically adjust the dilation rate based on the Equation (19) in order to more effectively merge concatenated feature maps.
Remotesensing 15 03018 g009
Figure 10. Visual ablation experiment. GT represents ground truth; labels 1–5 correspond to the row IDs 1–5 in Table 3, Table 4 and Table 5. The yellow circles represent the ships that missed detection, and the orange circles are the ships that are detected incorrectly.
Remotesensing 15 03018 g010
Figure 11. Comparison of SAR ship detection of sample image I . The yellow circles represent the ships that missed detection, and the orange circles are the ships that are detected incorrectly.
Remotesensing 15 03018 g011
Figure 12. Comparison of SAR ship detection of sample image II . The yellow circles represent the ships that missed detection, and the orange circles are the ships that are detected incorrectly.
Remotesensing 15 03018 g012
Figure 13. Visualization results of low-quality SAR images, where GT represents ground truth.
Remotesensing 15 03018 g013
Table 1. The relationship among input image size, current feature map size, and dilation rate.
Input Image SizeCurrent Feature Map SizeDilation Rate
800 × 800 25 × 25 1
50 × 50 2
100 × 100 3
416 × 416 13 × 13 1
26 × 26 2
52 × 52 3
256 × 256 8 × 8 1
16 × 16 2
32 × 32 3
Table 2. Configuration of the experimental environment.
ConfigurationParameter
CPUAMD Ryzen 7 5800X @3.8 GHz
RAM32 GB RAM for DDR4 3200 MHz
GPUNVIDIA GeForce RTX 3090 24 GB GPU
Operating systemUbuntu 18.04
Developing toolsPyTorch 1.8.2; NumPy 1.21.6; OpenCV 4.6; SciPy 1.1.0; CUDA 11.1
Table 3. Ablation experiment on DSSDD dataset.
IDCAA-NetA2SPPFA2CSPlayerAP (%)F1ParametersFLOPs
1FFF96.300.945.0332.437
2TFF97.720.955.4852.724
3FTF96.780.945.7342.527
4FFT96.970.945.0462.447
5TTT97.930.956.2002.824
Table 4. Ablation experiment on SSDD dataset.
IDCAA-NetA2SPPFA2CSPlayerAP (%)F1ParametersFLOPs
1FFF95.080.955.0336.435
2TFF97.640.955.4857.192
3FTF96.750.955.7346.673
4FFT96.590.955.0466.461
5TTT97.960.966.2007.456
Table 5. Ablation experiment on HRSID dataset.
IDCAA-NetA2SPPFA2CSPlayerAP (%)F1ParametersFLOPs
1FFF90.650.895.03323.799
2TFF92.210.905.48526.597
3FTF91.840.915.73424.678
4FFT91.900.905.04623.894
5TTT93.220.916.20027.572
Table 6. Effects of large kernel convolution in HRSID.
Kernel SizeAP (%)F1Parameters (M)FPS
1 × 1 91.380.905.46972.57
3 × 3 91.400.895.47072.47
7 × 7 91.590.905.47470.78
11 × 11 92.050.905.48173.12
13 × 13 92.210.905.48574.89
15 × 15 92.210.905.49173.82
19 × 19 92.140.905.50473.44
23 × 23 92.230.905.52070.57
101 × 101 92.170.916.44853.12
Table 7. Comparison with the SOTA detectors on DSSDD dataset.
MethodAPF1ParametersFLOPsFPS
Faster-RCNN90.180.90136.689184.80634.49
YOLOX-m96.470.9525.28111.79647.65
FCOS95.710.8732.11125.78269.01
YOLOv492.400.9363.93822.70456.83
YOLOv5-l95.830.9346.63118.32958.42
YOLOv794.580.9237.19216.81860.33
YOLOv8-l95.690.9343.63126.46466.61
ESarDet97.930.956.2002.82471.36
Table 8. Comparison with the SOTA detectors on SSDD dataset.
MethodAPF1ParametersFLOPsFPS
Faster-RCNN89.740.88136.689252.58232.97
YOLOX-m96.970.9525.28131.14946.41
FCOS96.460.9232.11168.20962.32
YOLOv493.880.9063.93859.95352.11
YOLOv5-l96.930.9446.63148.40156.74
YOLOv797.220.9437.19544.41048.93
YOLOv8-l96.520.9443.63169.88346.09
ESarDet97.960.966.2007.45665.75
Table 9. Comparison with the SOTA detectors on HRSID dataset.
MethodAPF1ParametersFLOPsFPS
Faster-RCNN85.950.81136.689546.92528.53
YOLOX-m92.330.9025.281115.19730.15
FCOS88.430.8332.111252.01541.67
YOLOv481.740.7863.938221.71934.77
YOLOv5-l92.030.8846.631178.99846.36
YOLOv792.850.8837.192164.23923.04
YOLOv8-l92.180.9043.631258.44246.09
ESarDet93.220.916.20027.57260.58
Table 10. Comparison with SOTA SAR ship detection methods on SSDD dataset.
MethodInput SizeAP (%)F1ParametersFLOPsFPS
CRTransSar [16] 640 × 640 97.00.9596-7.5
FEPS-Net [17] 448 × 448 96.0-37.31-31.54
CenterNet++ [19] 512 × 512 95.10.88--30.30
AFSar [20] 640 × 640 97.70.96-9.86-
Pow-FAN [22] 512 × 512 96.350.95--31
BL-Net [24] 512 × 512 95.250.9347.8141.715.02
ESarDet 416 × 416 97.960.966.2007.45665.75
Table 11. Generalization experiment on DSSDD dataset.
MethodAP (%)F1ParametersFLOPsFPS
Faster-RCNN62.460.51136.689184.80634.49
YOLOX-m76.030.8025.28111.79647.65
FCOS79.040.6532.11125.78269.01
YOLOv439.230.3863.93822.70456.83
YOLOv5-l68.470.7246.63118.32958.42
YOLOv714.980.3137.19216.81860.33
YOLOv870.960.7443.63169.88366.61
ESarDet81.490.826.2002.82471.36
Disclaimer/Publisher’s Note: The statements, opinions and data contained in all publications are solely those of the individual author(s) and contributor(s) and not of MDPI and/or the editor(s). MDPI and/or the editor(s) disclaim responsibility for any injury to people or property resulting from any ideas, methods, instructions or products referred to in the content.

