
Satellite-Based Estimation of Roughness Length over Vegetated Surfaces and Its Utilization in WRF Simulations

 ,
,  ,
,
Abstract
:
1. Introduction

| Vegetation Type | Method | Study Area | Roughness Length (m) | Literature |
|---|---|---|---|---|
| Evergreen broad-leaved forest | Meteorological | Camp Borden (Canada) | 0.97 | Lo [11] |
| Meteorological | North America | 1.81 | Yang and Friedl [12] | |
| Meteorological | Changbai Mountains | 2.103 ± 0.366 (Fitting) 2.068 ± 0.481 (Newton’s iterative method) 1.736 ± 0.553 (TVM) 0.518 ± 0.649 (Martano’s method) | Zhou et al. [15] | |
| Meteorological | Northern China | 0.5826 | Zhang et al. [16] | |
| Meteorological | Zhuhai | 1.51–3.90 (spring and summer) 1.26–2.96 (winter) | Liu et al. [18] | |
| Morphological | China | 1.1–1.2 | Xing [17] | |
| Morphological | Beijing | 0.6–1.3 | Liu et al. [19] | |
| Evergreen needle-leaf forest | Meteorological | North America | 1.65 | Yang and Friedl [12] |
| Morphological | China | 1.43–1.53 | Xing [17] | |
| Deciduous broad-leaved forest | Morphological | China | 0.51–0.77 | Xing [17] |
| Deciduous needleleaf forest | Morphological | China | 0.5–0.8 | Xing [17] |
| Mixed forest | Meteorological | Kanto Plain (Japan) | 1.16 | Mikami et al. [13] |
| Morphological | China | 1.1–1.35 | Xing [17] | |
| Cropland | Meteorological | Western India | 0.001–0.45 | Patil [14] |
| Meteorological | Inner Mongolia | 0.21 | Mao et al. [20] | |
| Meteorological | The Loess Plateau | 0.017 (spring) 0.062 (summer) 0.065 (autumn) 0.018 (winter) | Zhang et al. [21] | |
| Meteorological | Northern China | 0.2341 | Zhang et al. [16] | |
| Grassland | Meteorological | Hebei | 0.17–0.41 | Ju [22] |
| Meteorological | Yuzhong | 0.123 | Yao et al. [23] | |
| Meteorological | Maqu area in the upper reaches of the Yellow River | 0.035 | Li et al. [24] | |
| Meteorological | Northern China | 0.0641 | Zhang et al. [16] | |
| Meteorological | Qinghai | 0.014–0.046 | Ju [22] | |
| Meteorological | Yuzhong | 0.015 | Yao et al. [23] | |
| Morphological | Northern Tibetan Plateau | 0.001–0.043 | Sun et al. [25] |
2. Methodology
2.1. Research Data
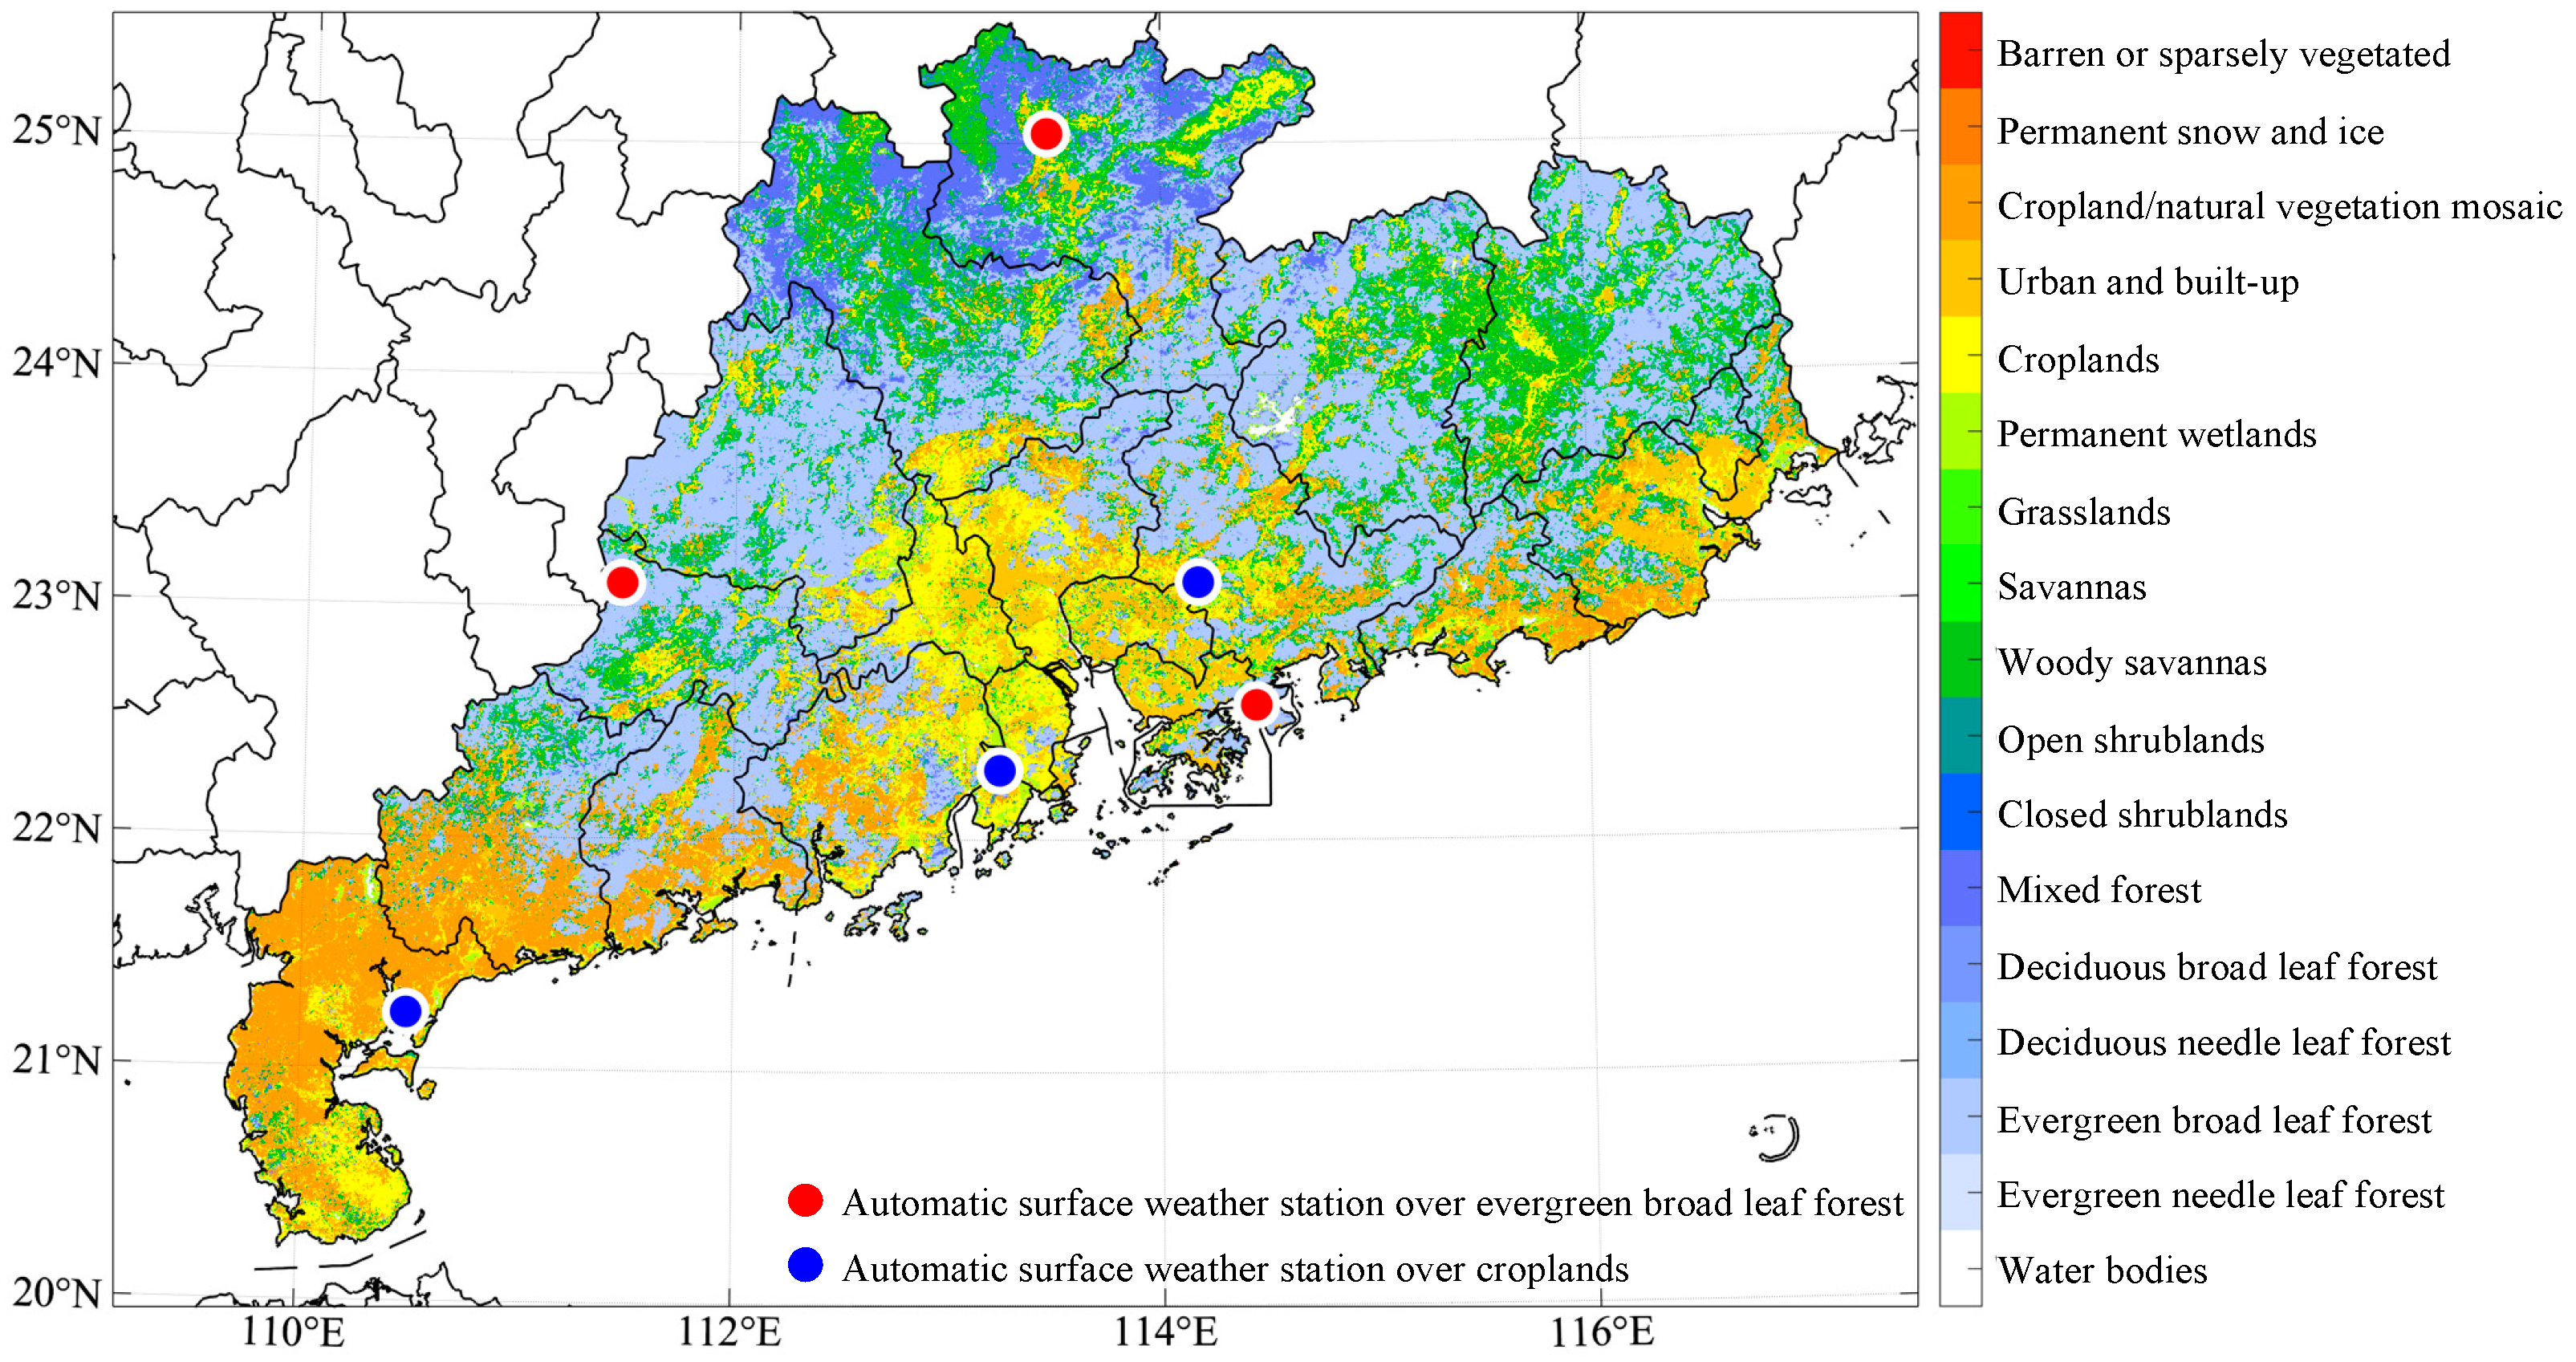
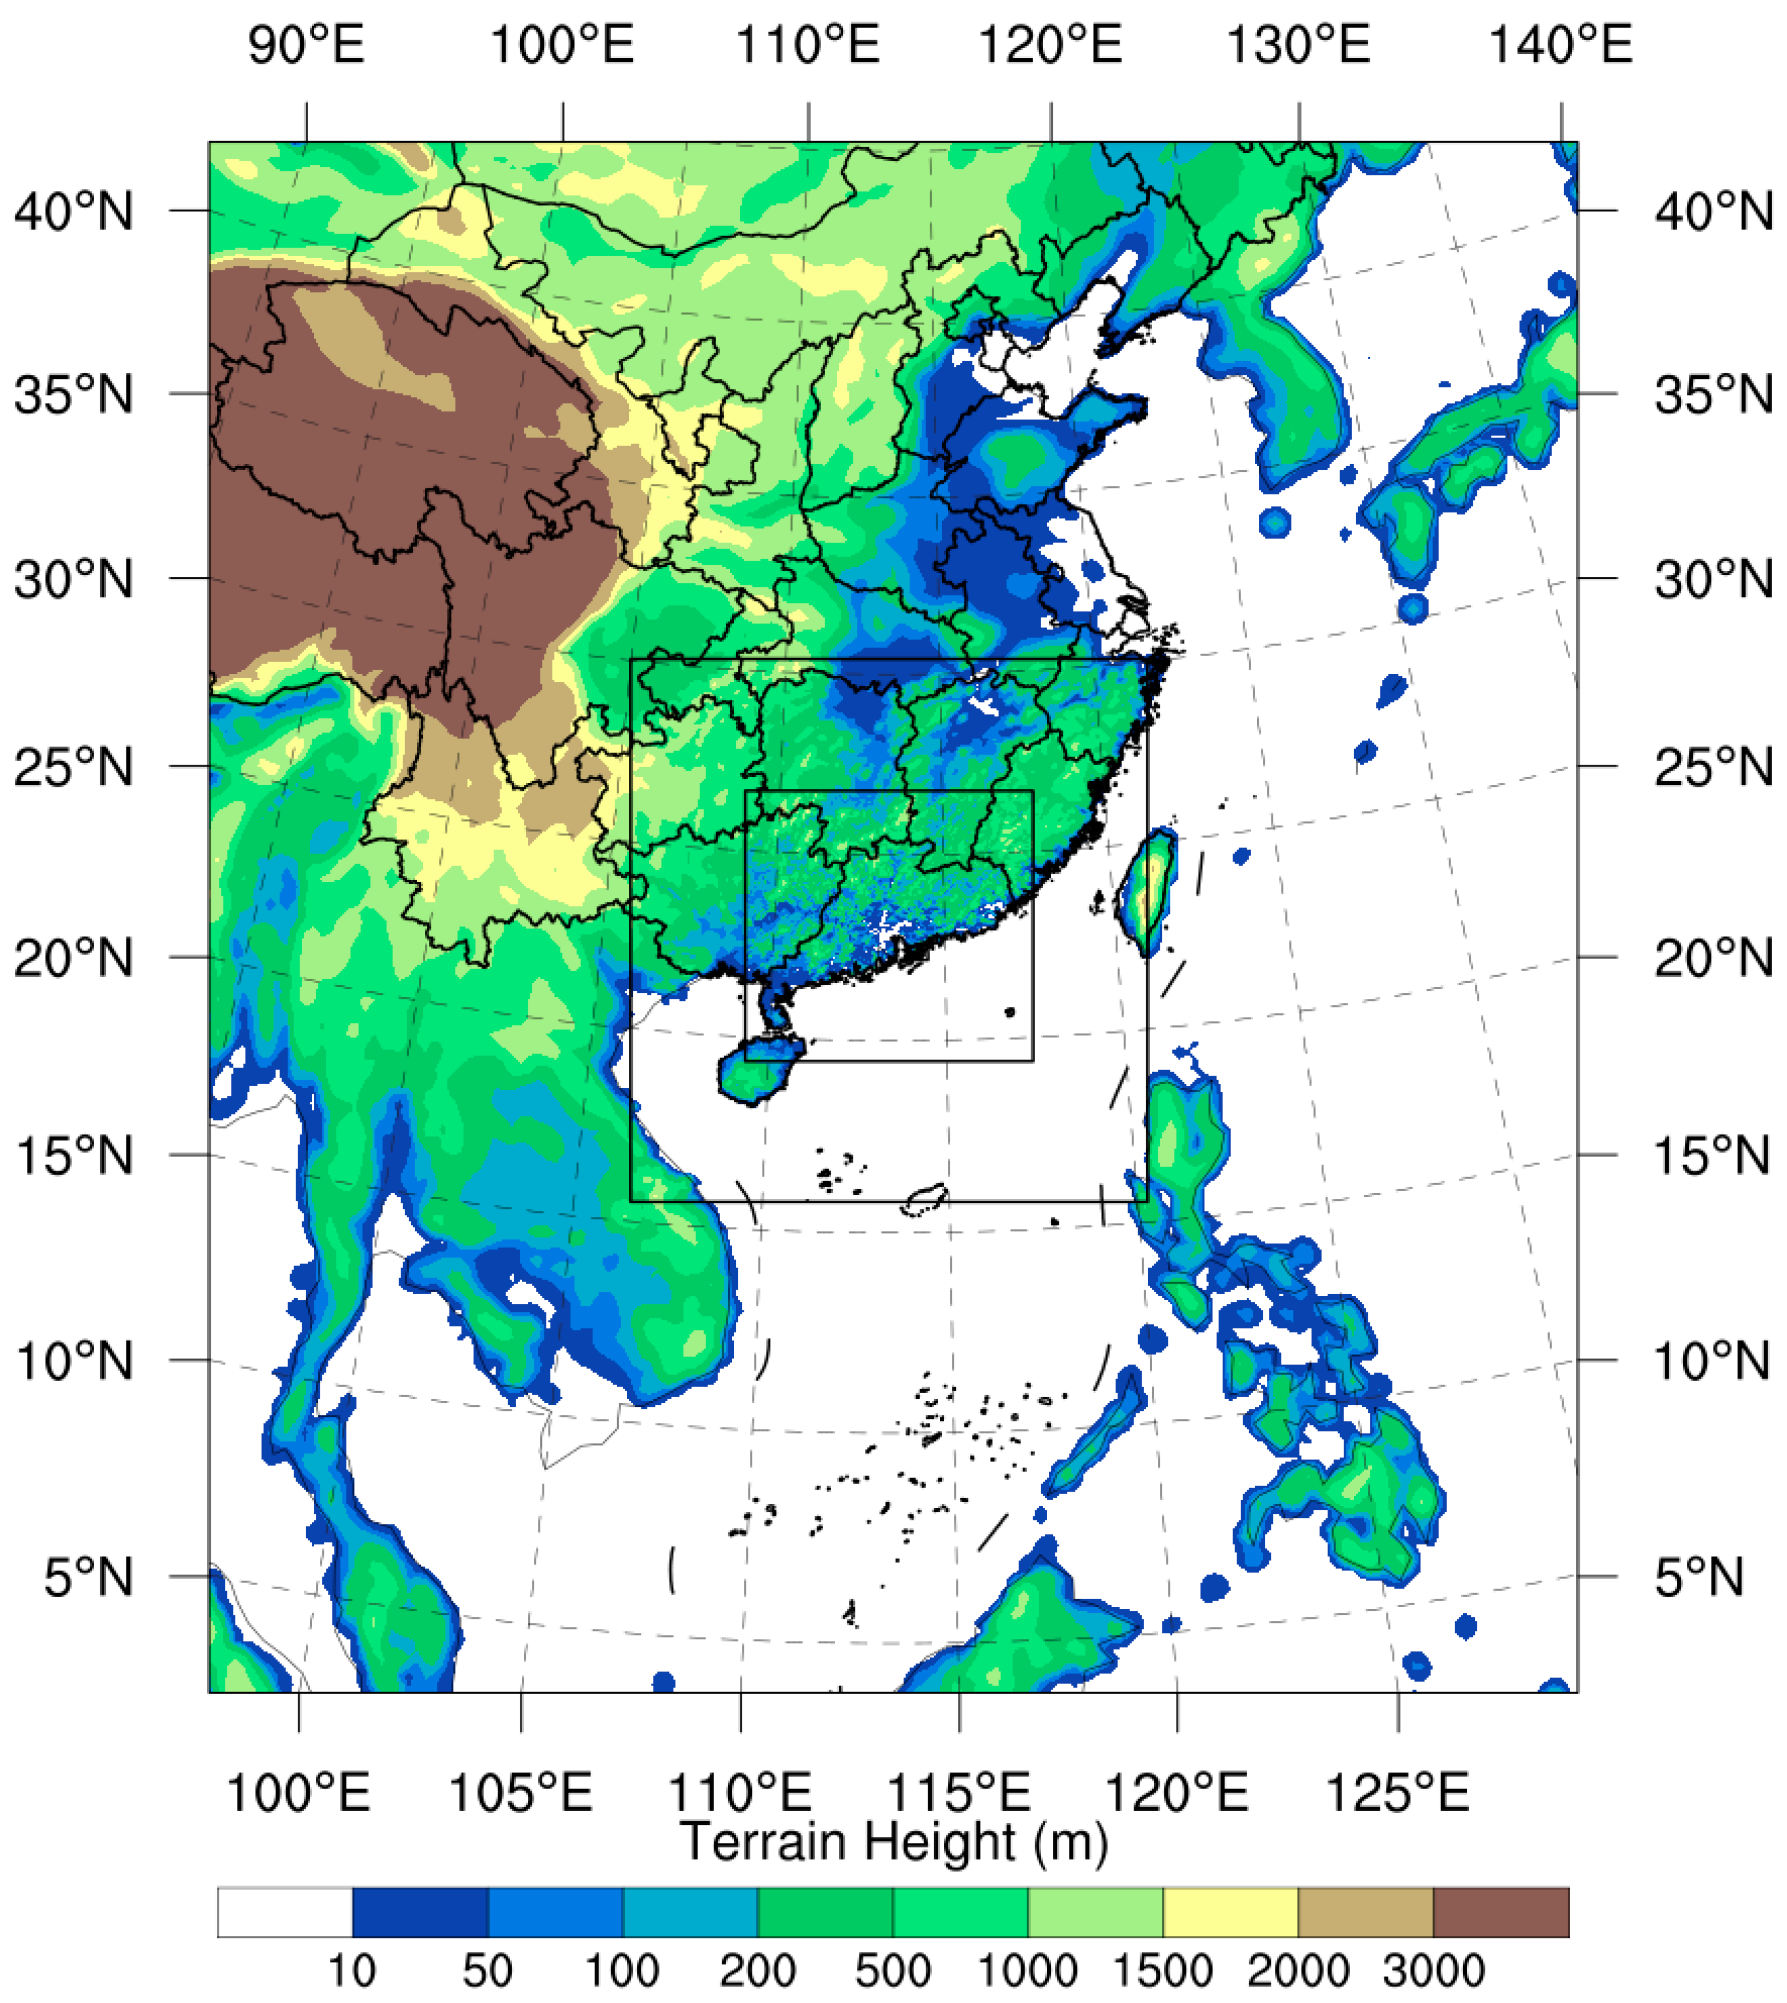
2.2. Study Area
2.3. Introduction of Morphological Estimation Methods
3. Result and Discussion
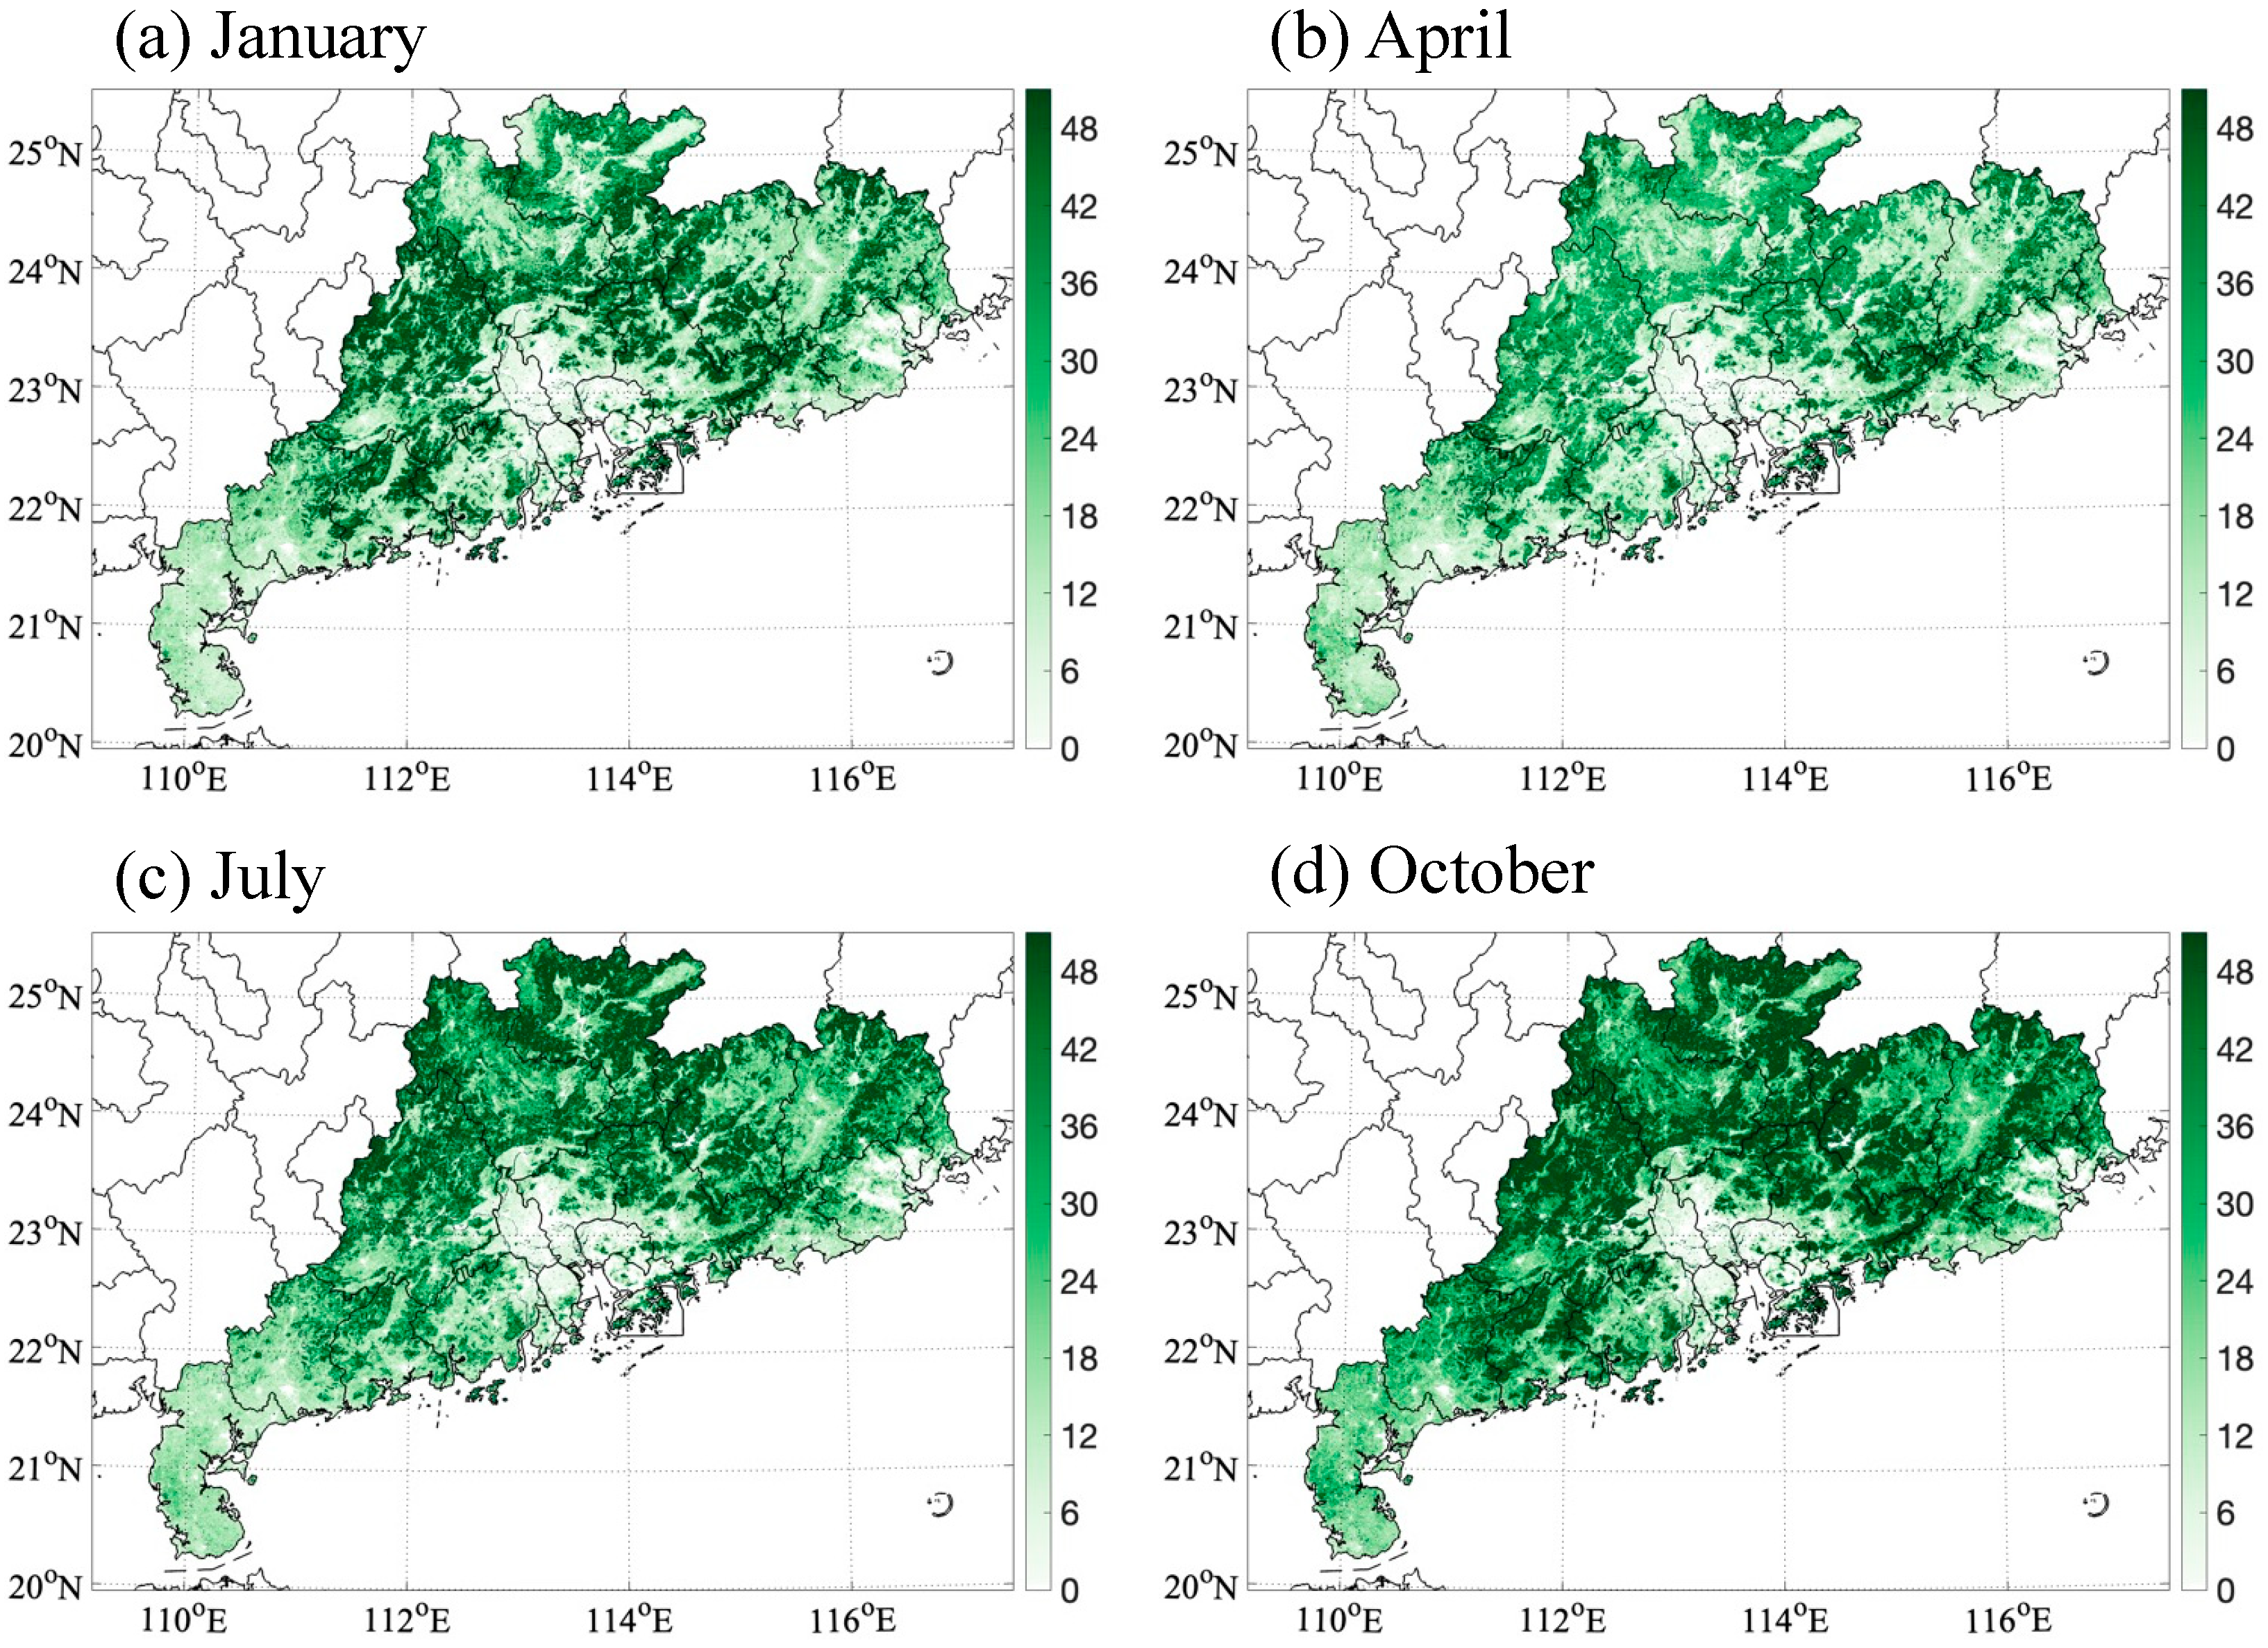
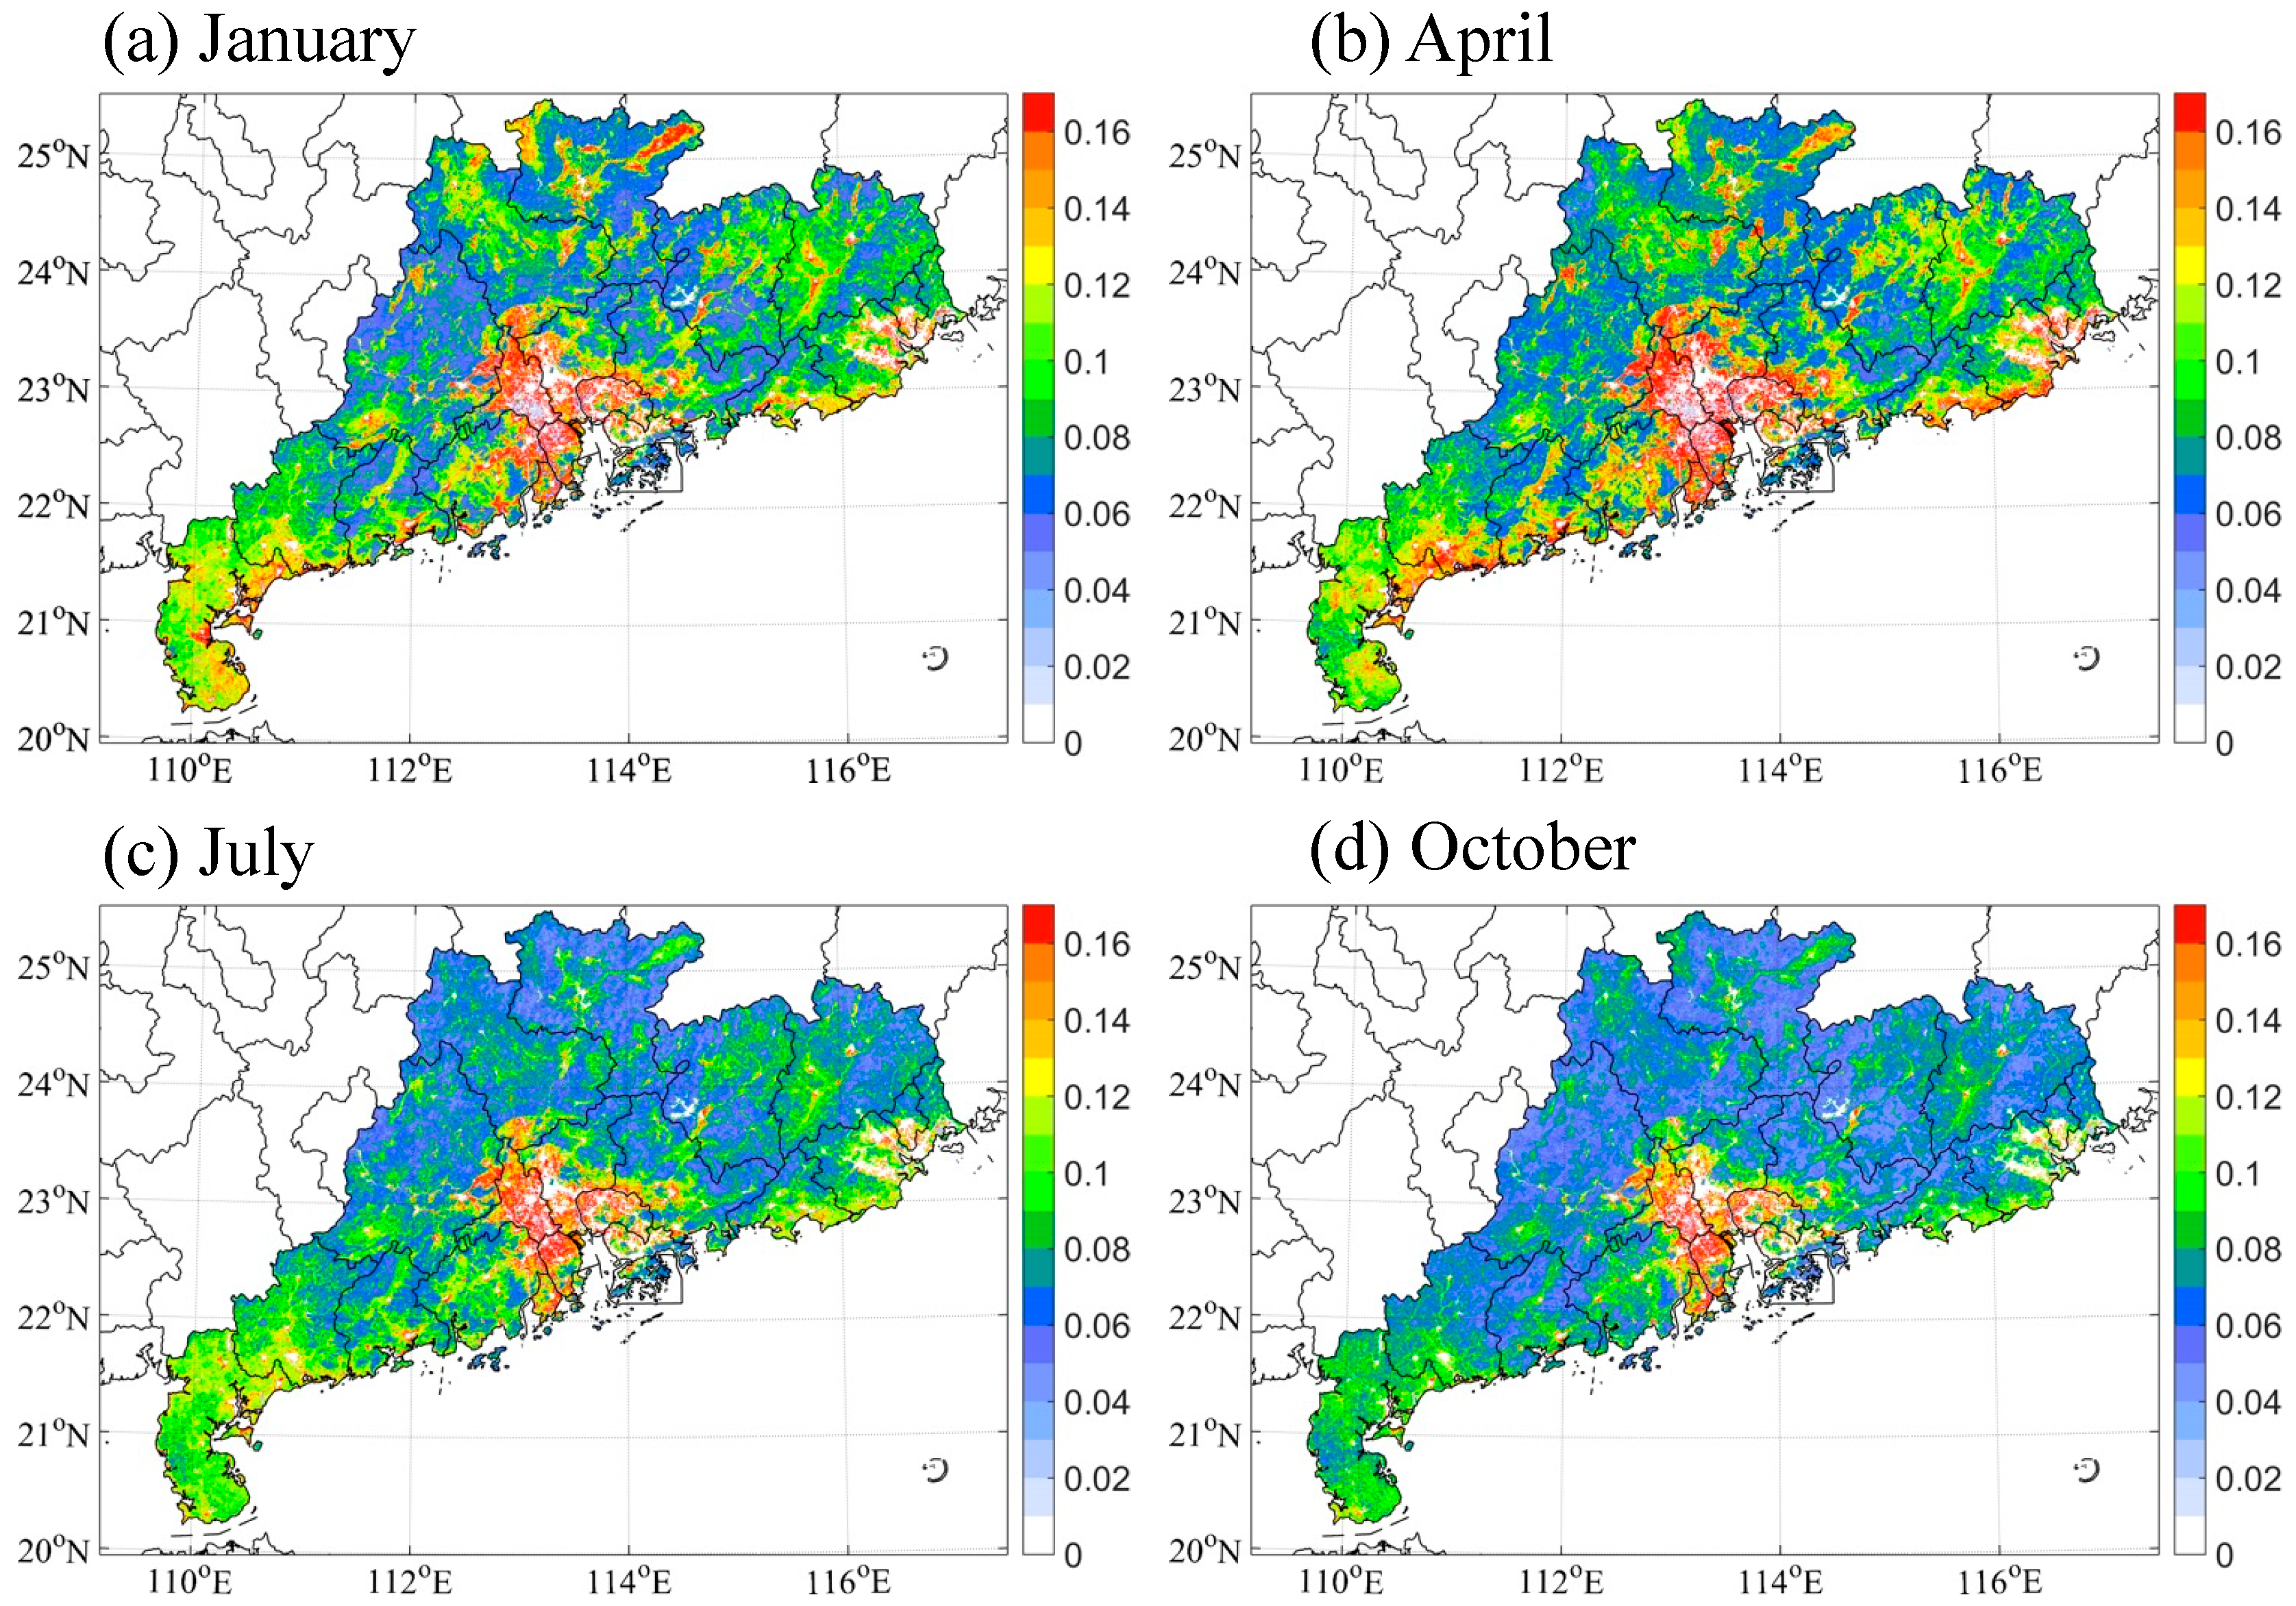
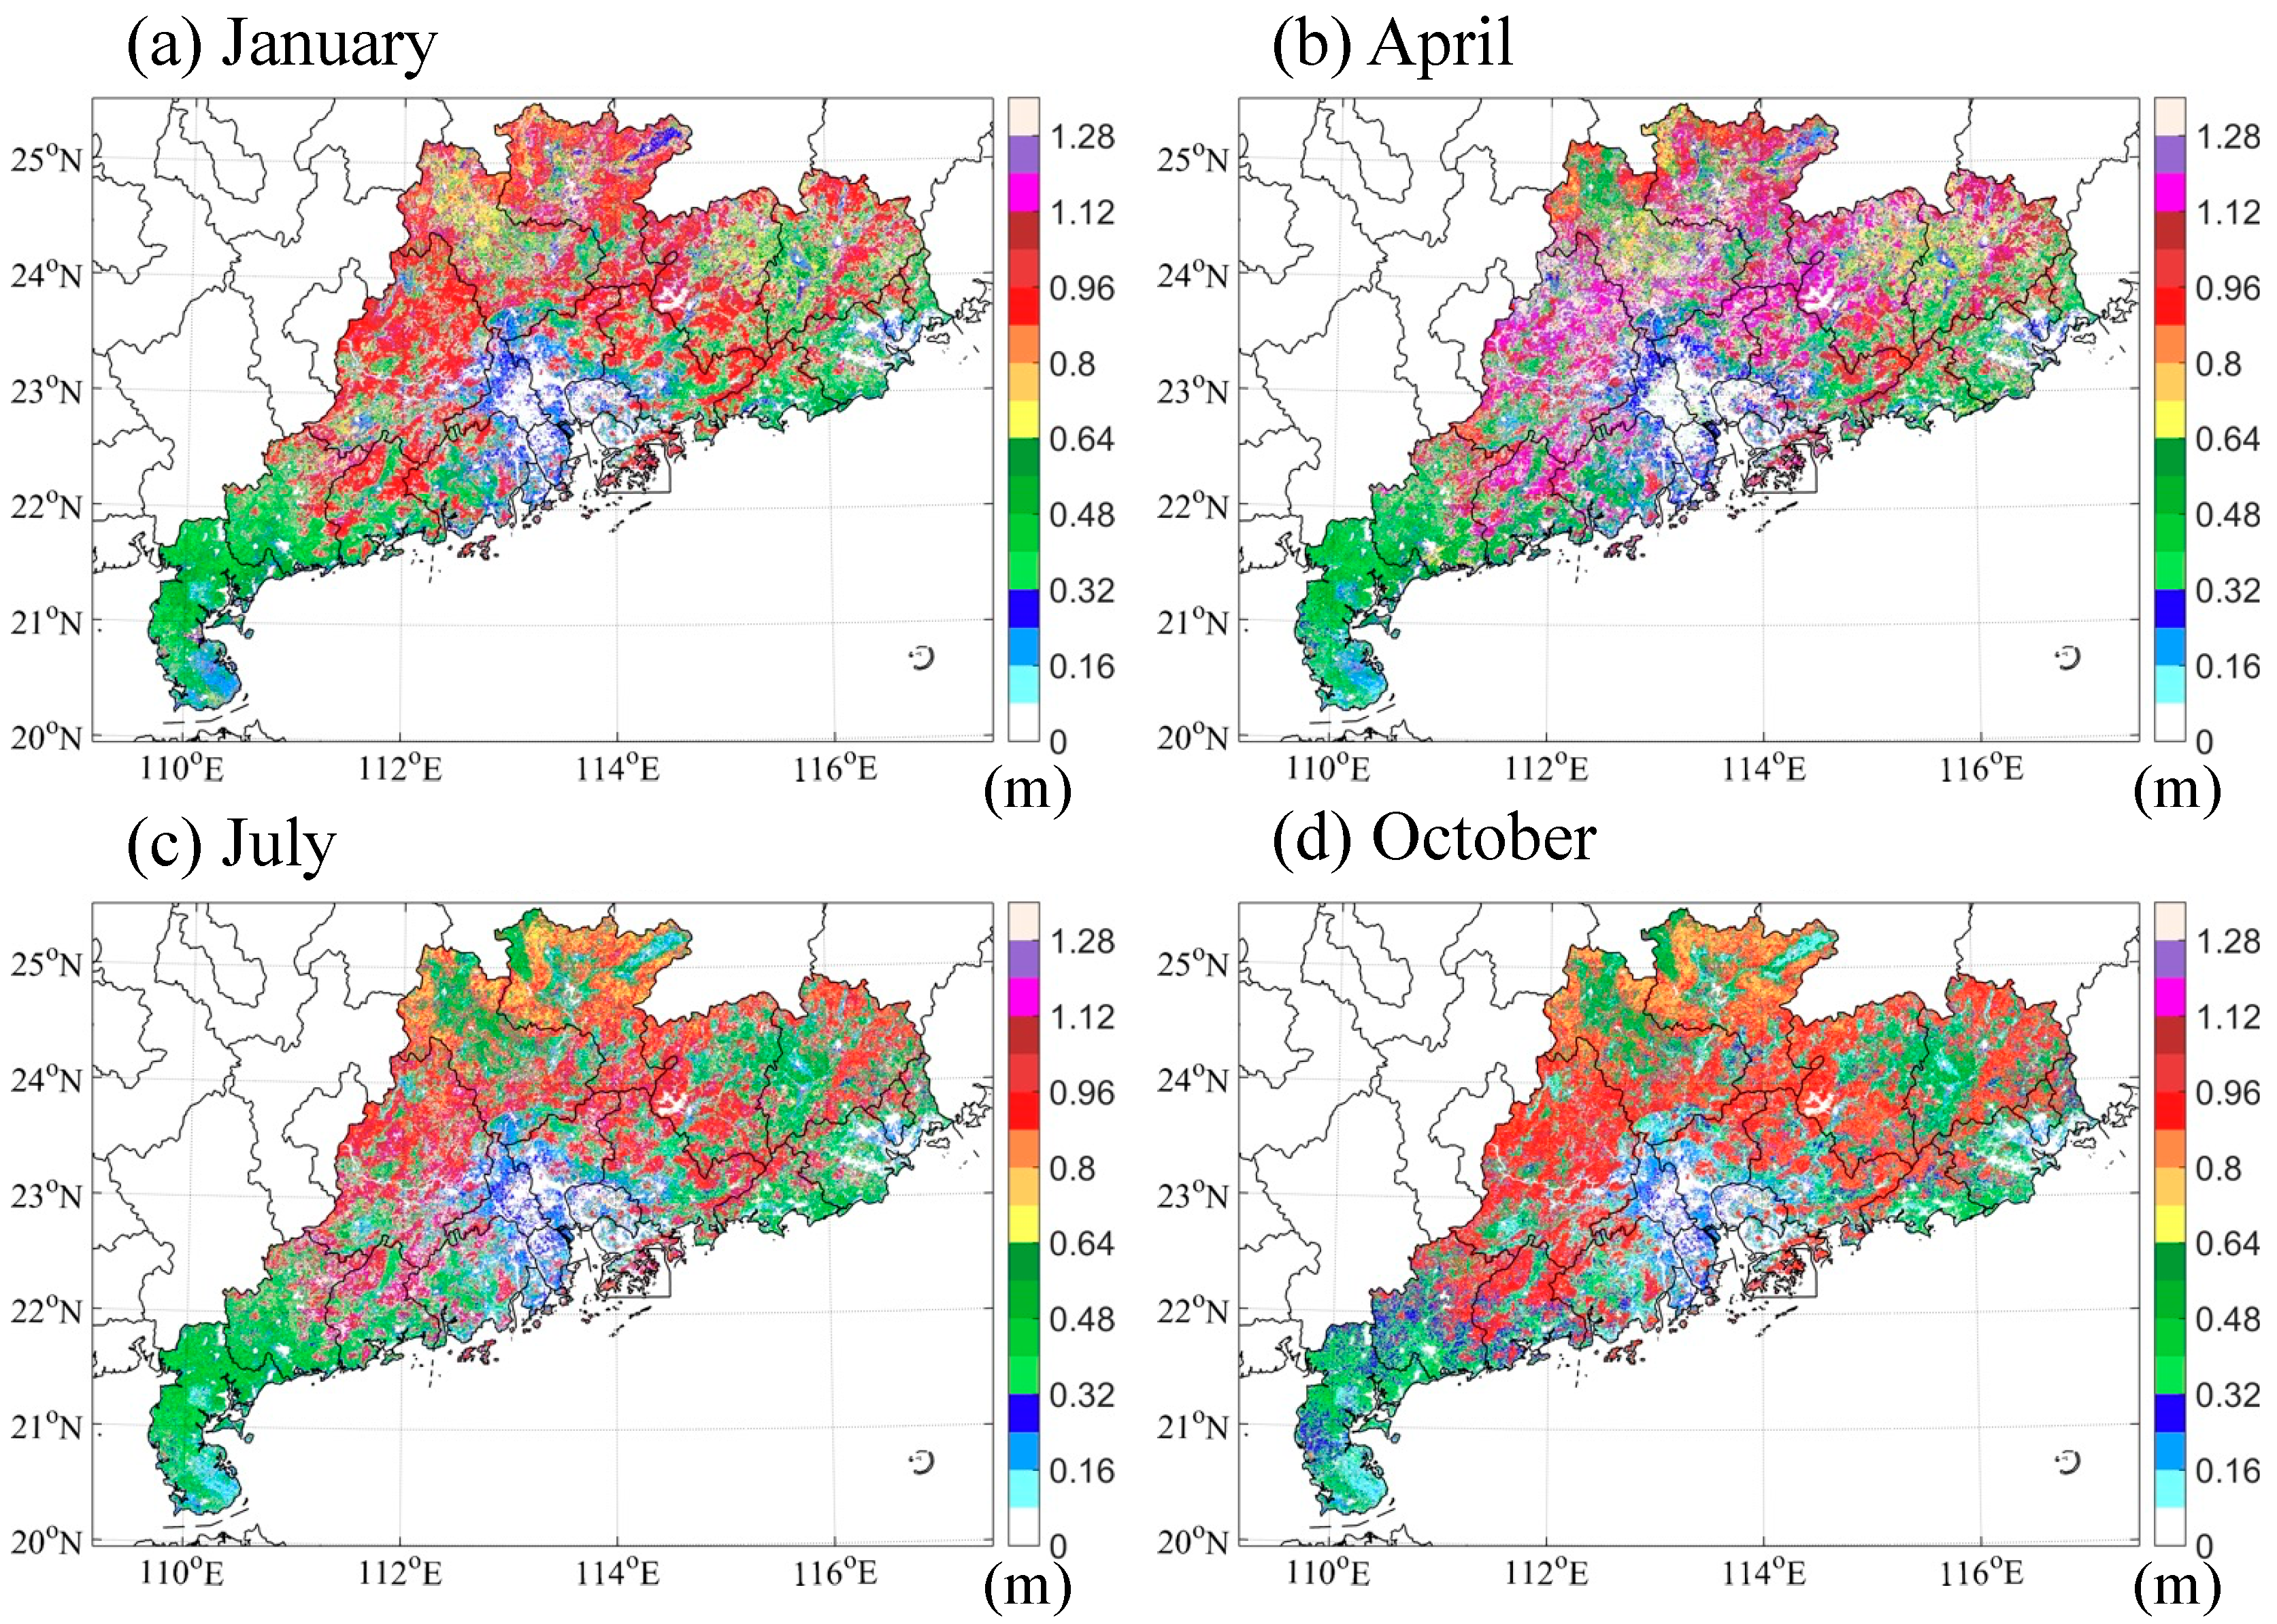
3.1. Temporal and Spatial Analysis of Roughness Length
3.2. Improvement of Roughness Length in Models
3.3. Assessment of the Impact of Roughness Length Improvement on the Near-Surface Thermodynamic Field
3.3.1. Simulation Scheme Settings
3.3.2. Assessment of Impact on the Thermodynamic Field
4. Conclusions
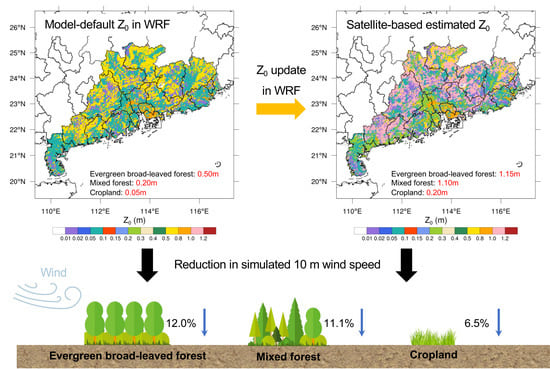
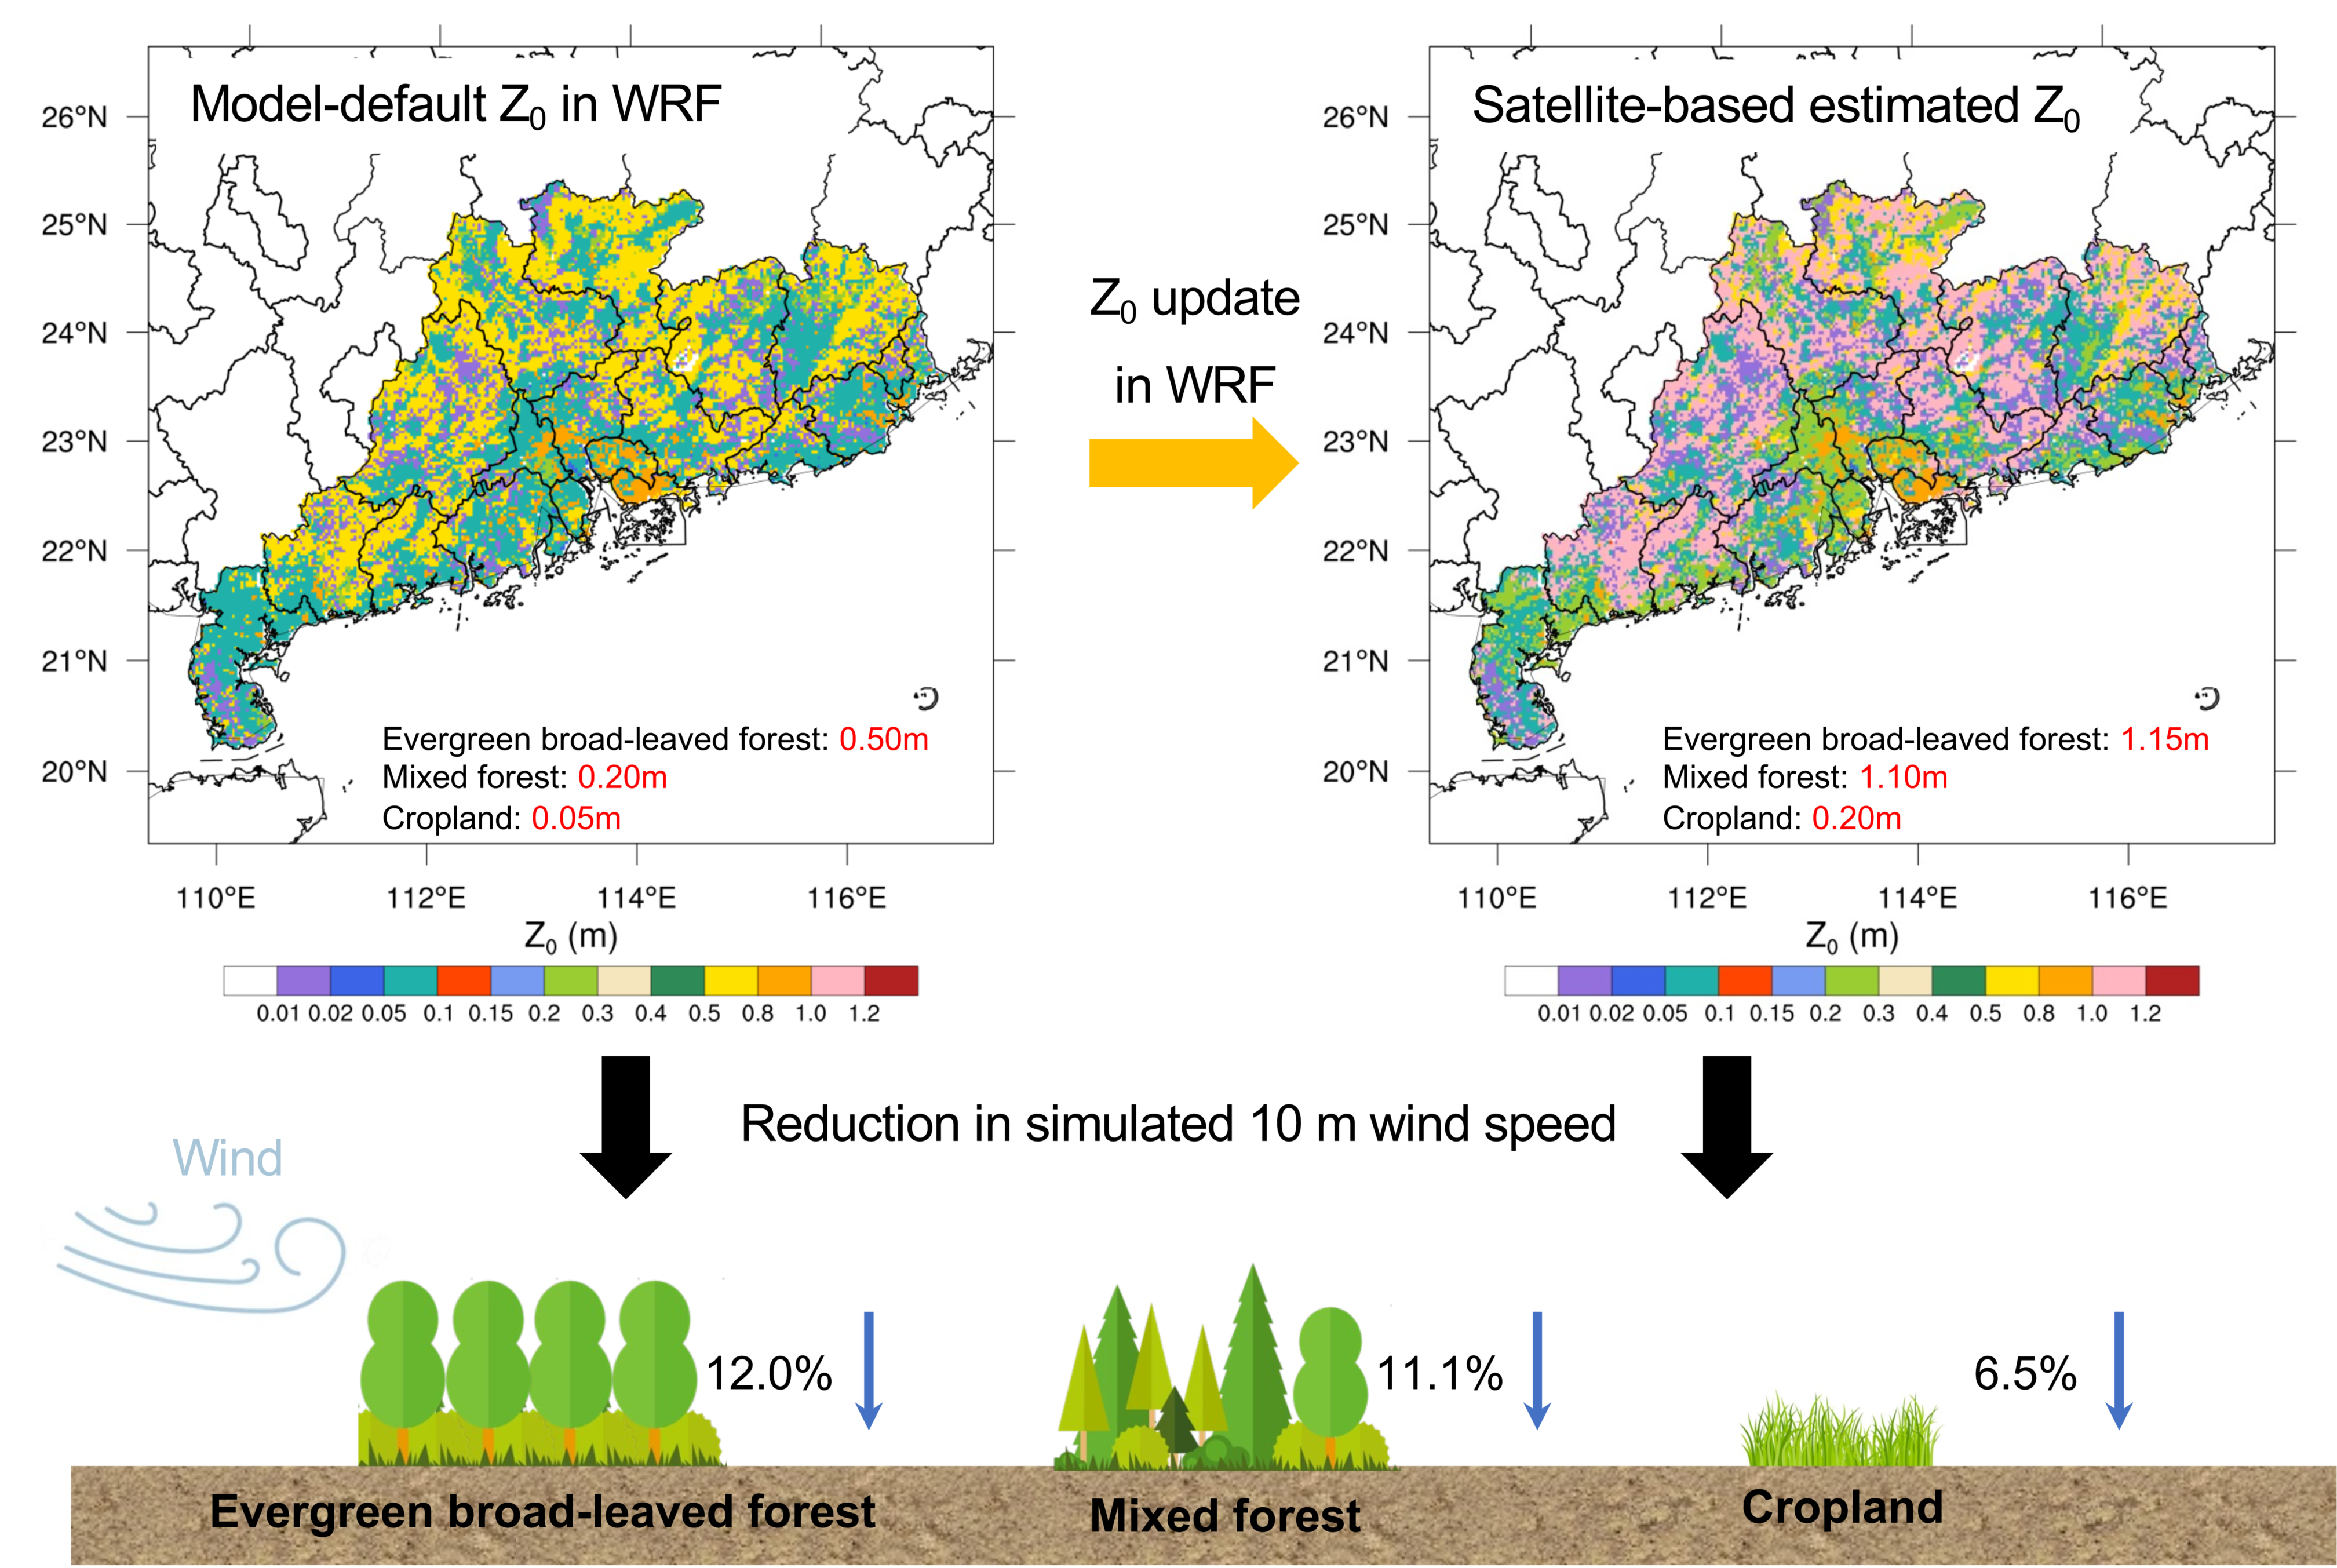
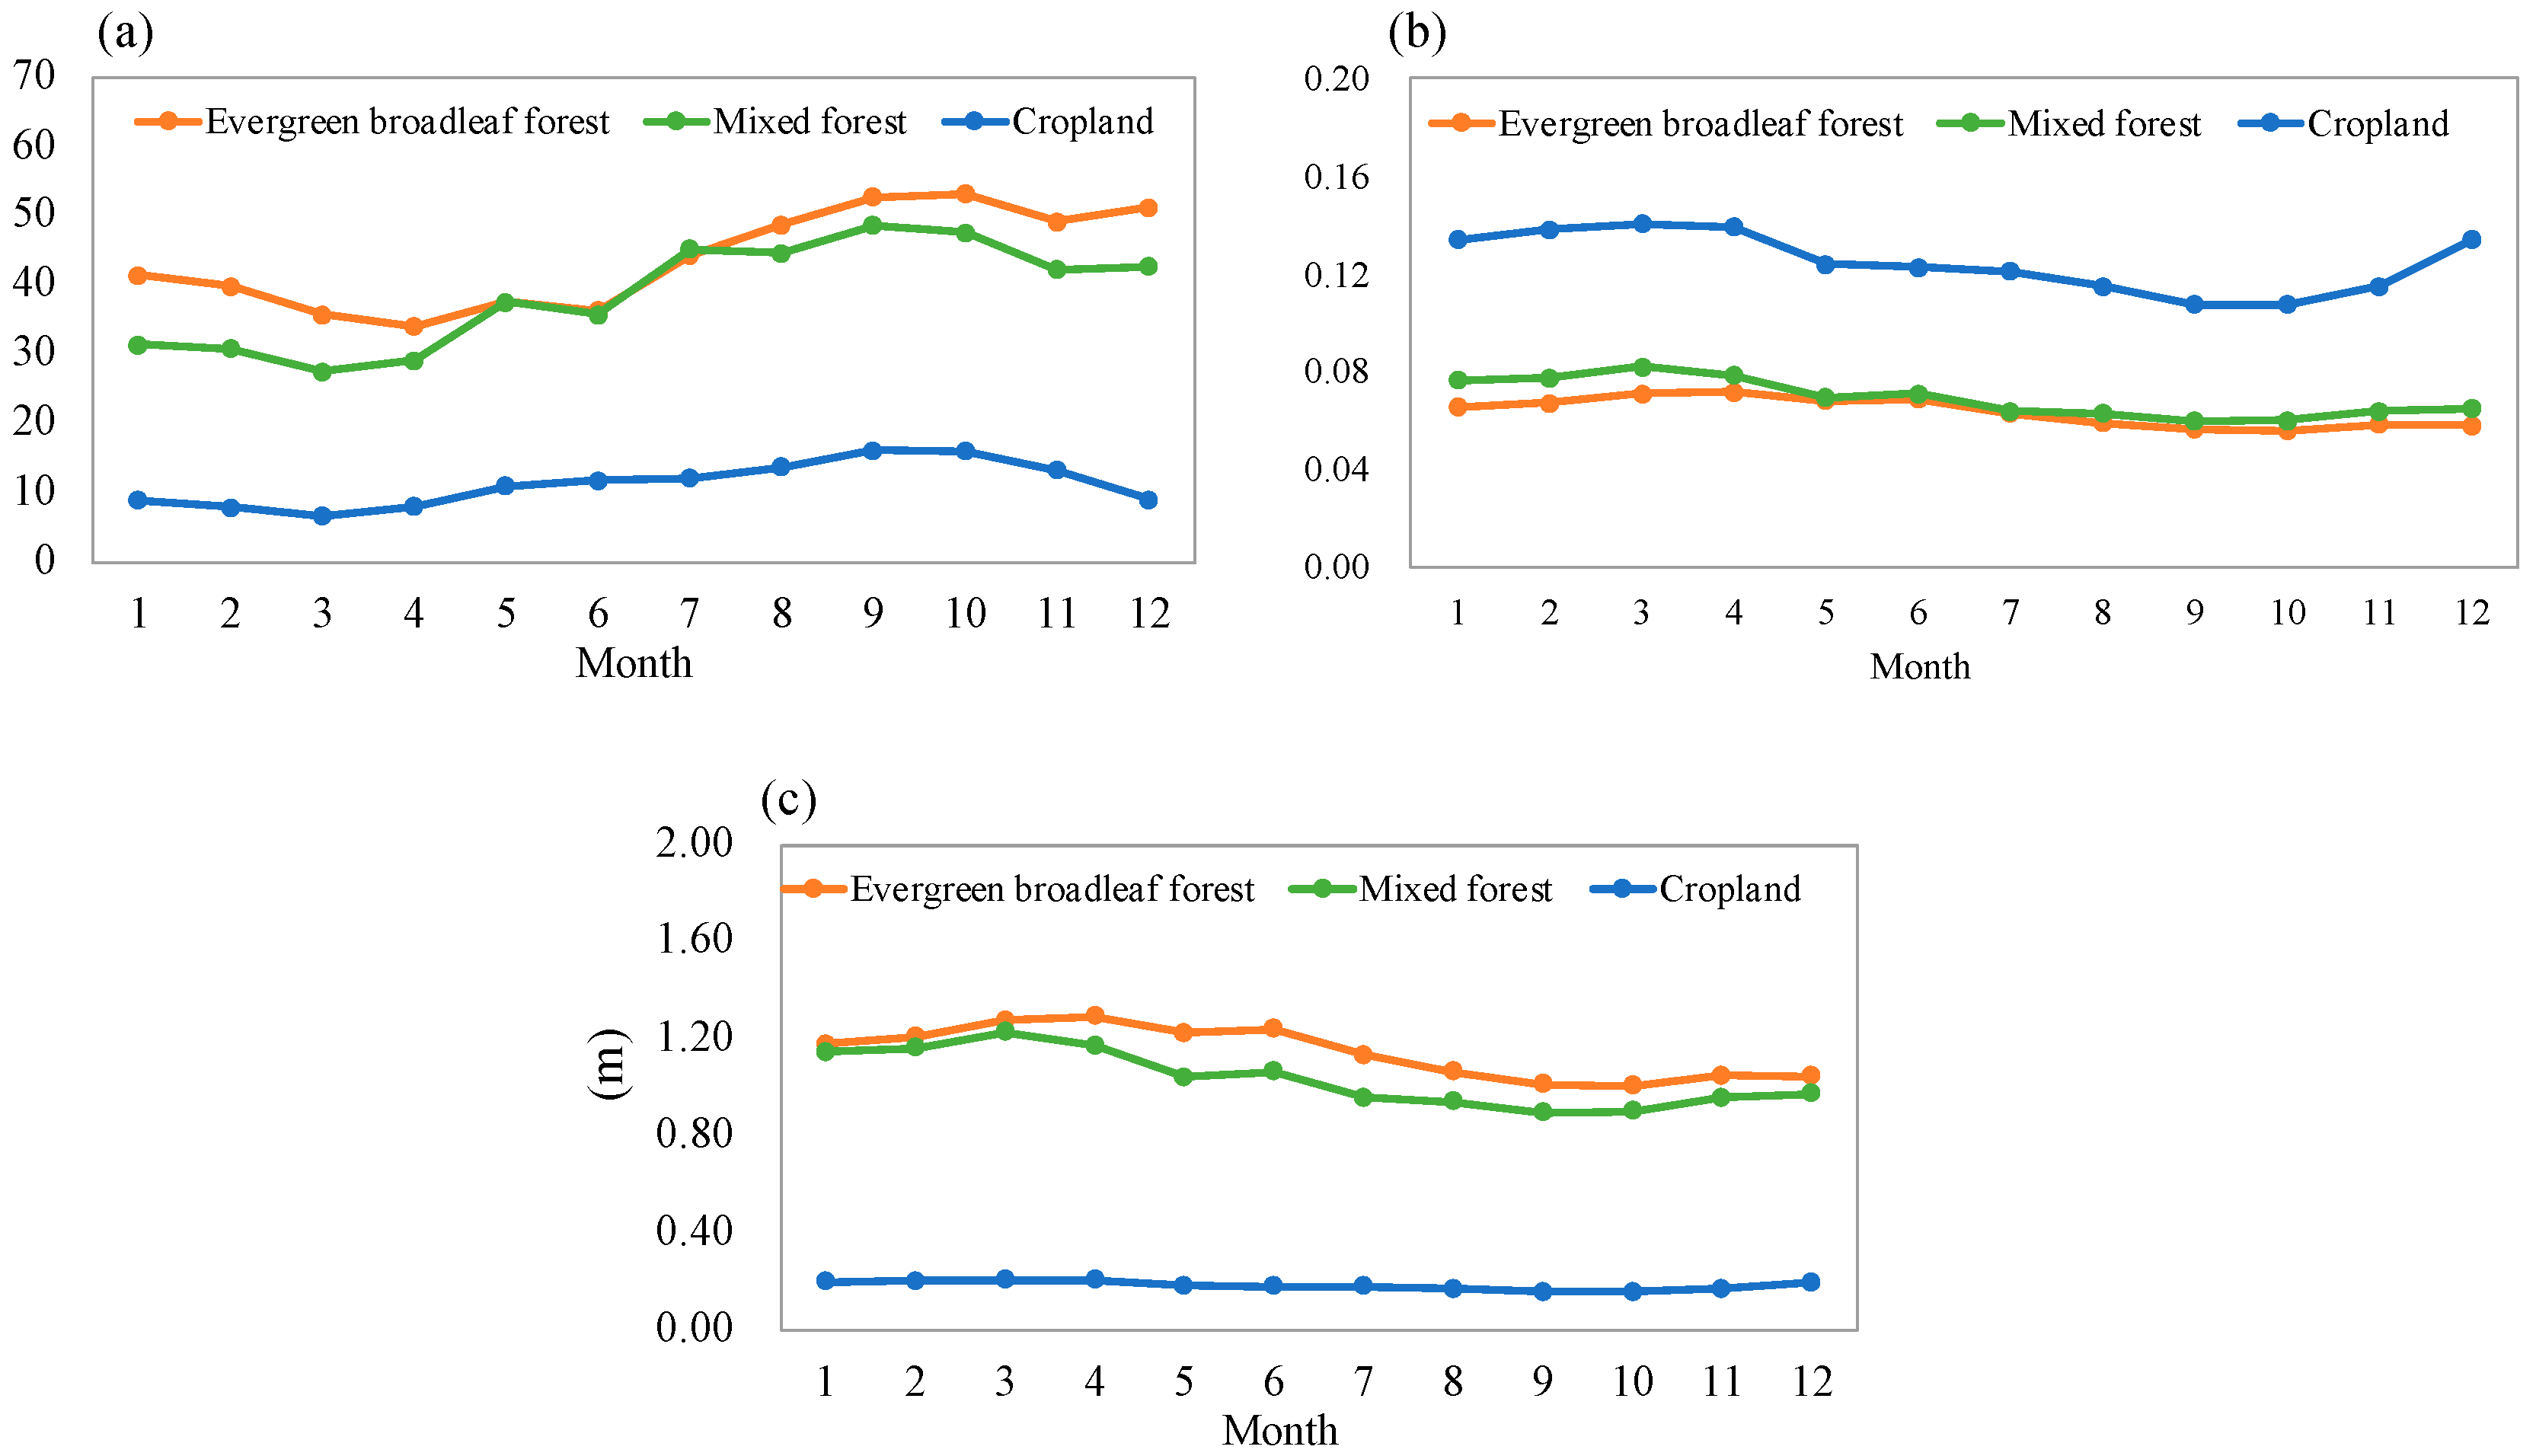
- Vegetation-covered surfaces in Guangdong Province can be listed in the descending order of Z0 as evergreen broad-leaved forest, mixed forest, and cropland. The average Z0 values of evergreen broad-leaved forests in each season were 1.27 m, 1.15 m, 1.03 m, and 1.15 m, which are all above 1 m. The average Z0 of mixed forests in each season ranged between 0.9 and 1.2 m. The Z0 of croplands was the lowest, with average values between 0.17 and 0.2 m. The roughness length was higher in spring and lower in autumn for all individual vegetation cover types.
- The estimated values of Z0 for each vegetation type in Guangdong Province were quite different from the default values of the model, with the estimated values being significantly higher than the default values, especially in winter. The default Z0 of evergreen broad-leaved forests in the model is 0.5 m for all seasons, but the estimated value for Guangdong was 1.15 m for both the summer and winter seasons. The default Z0 values of mixed forests in the model are 0.5 m in summer and 0.2 m in winter, but the estimated values for Guangdong were 0.99 m and 1.10 m, respectively, showing a slight seasonal difference. The default Z0 values of croplands in the model are 0.15 m and 0.05 m for summer and winter, respectively, but the estimated values for Guangdong were 0.18 m for summer and 0.20 m for winter.
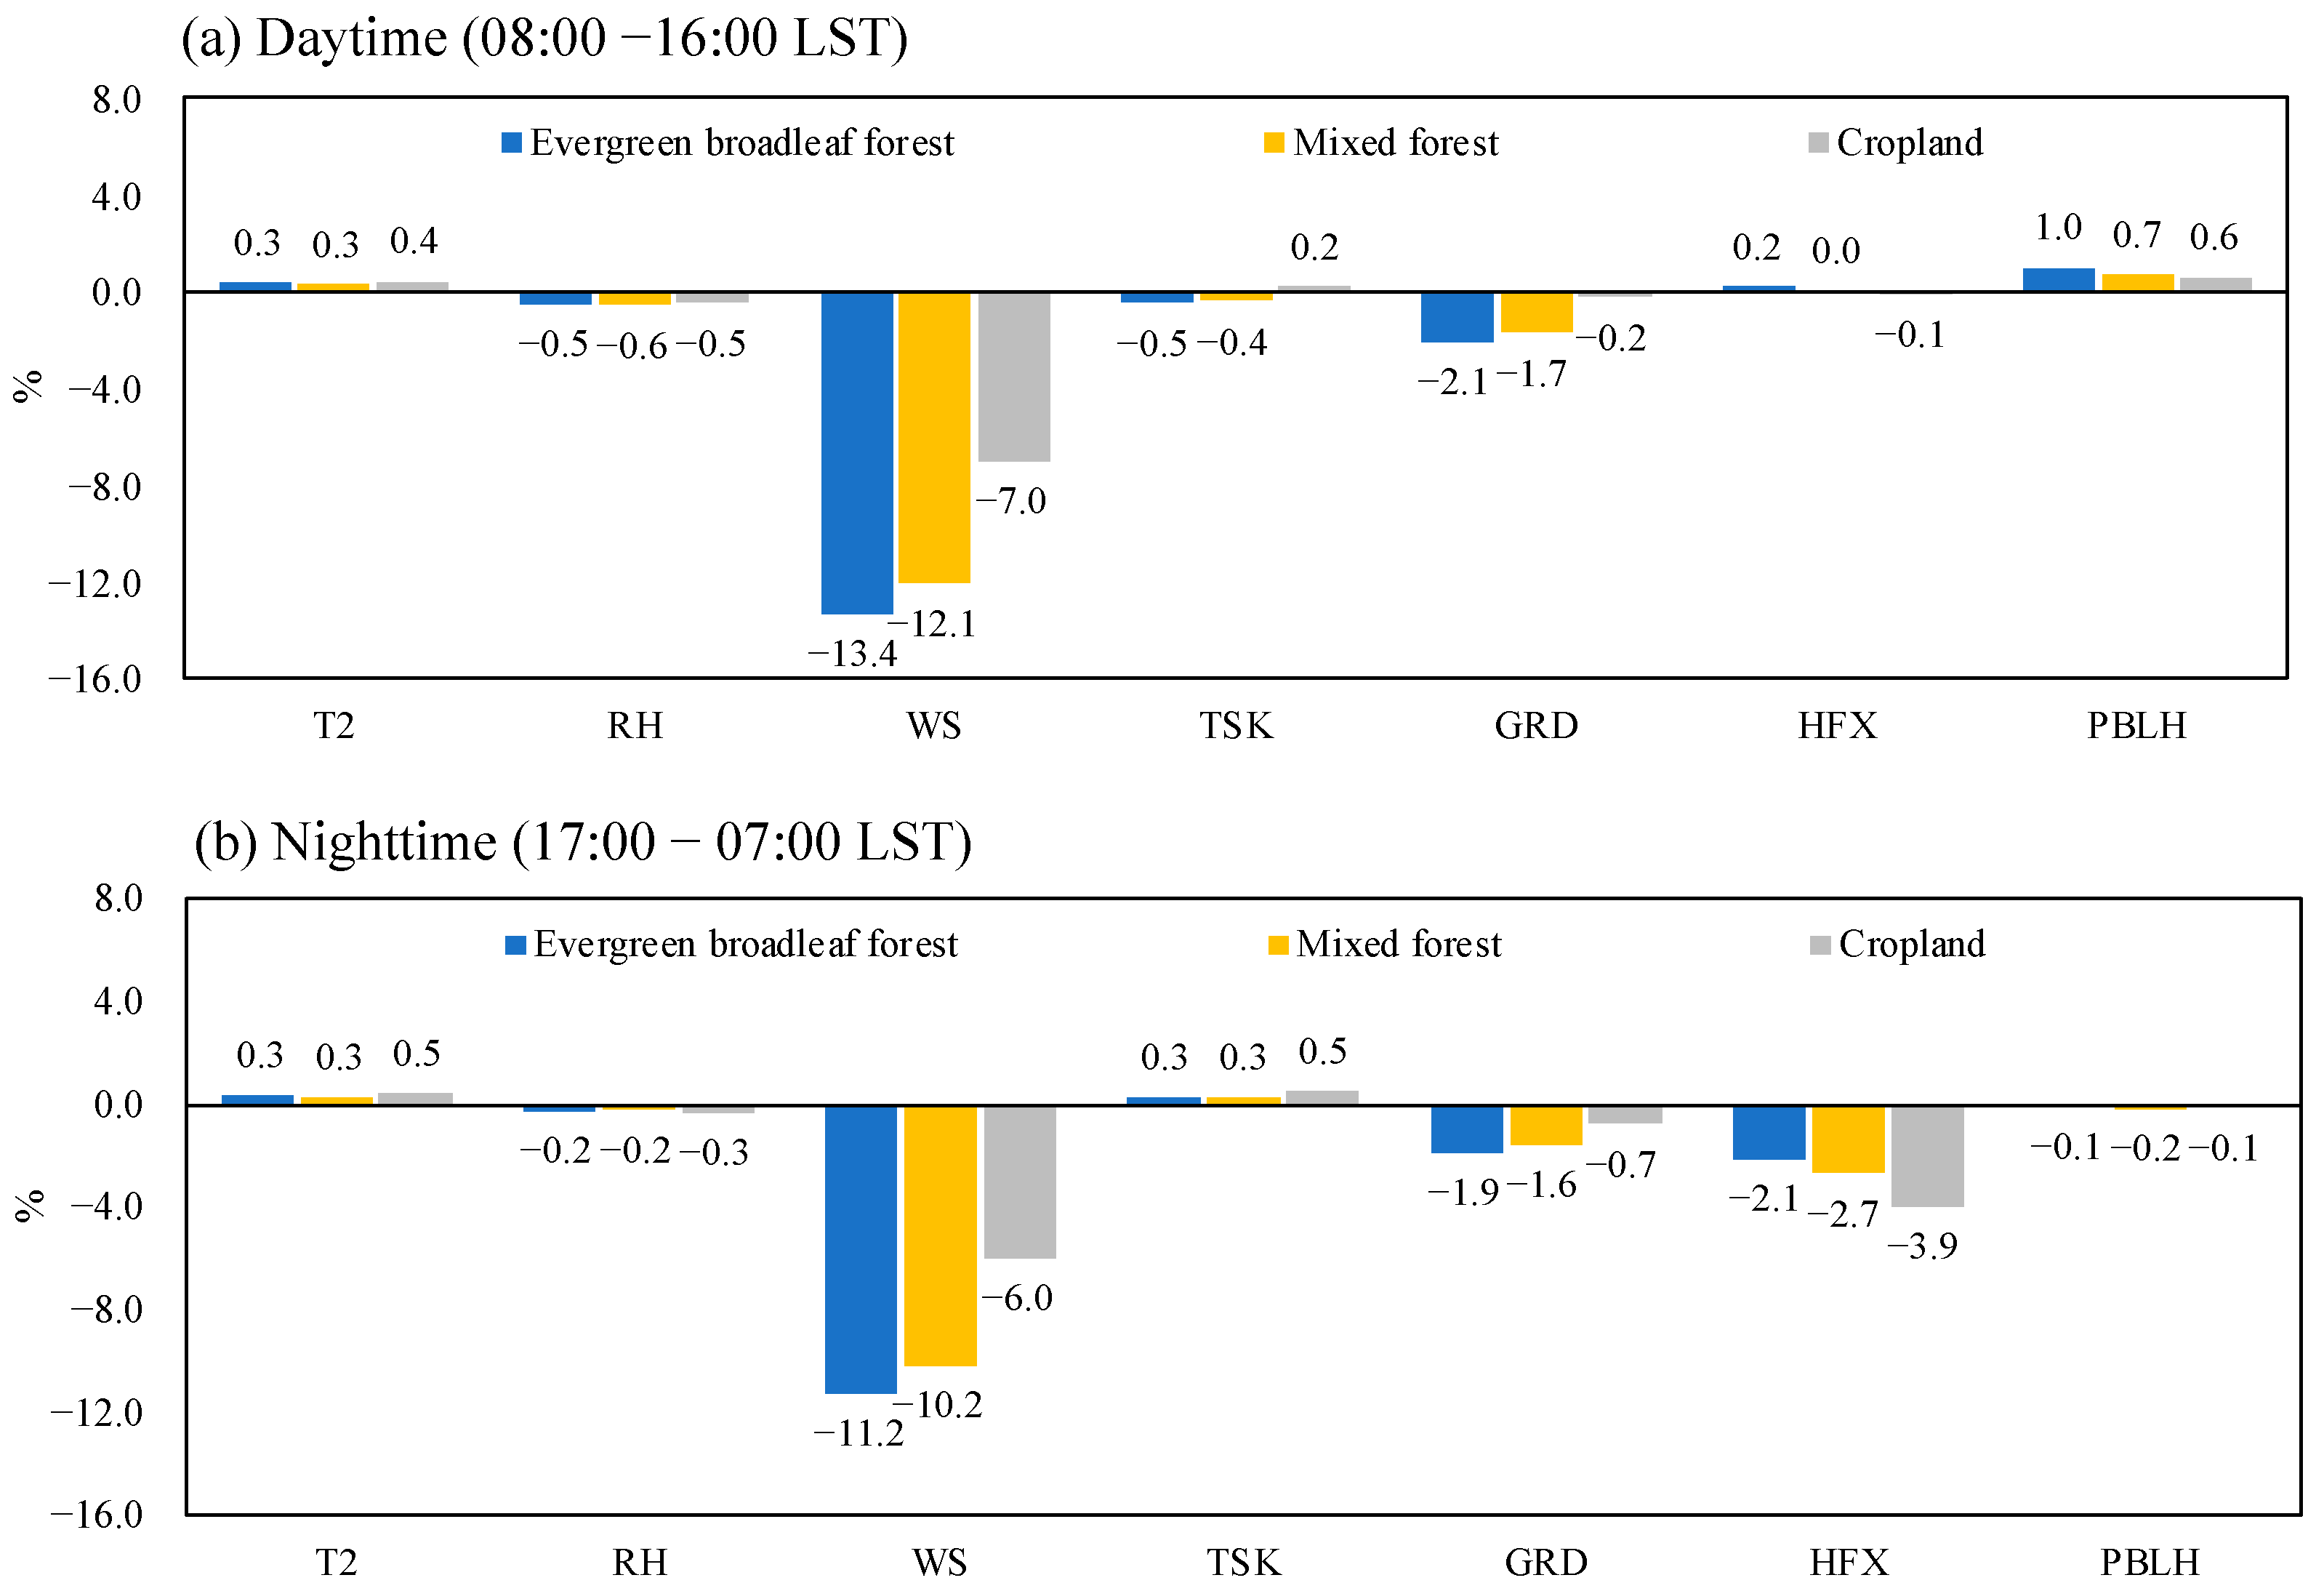
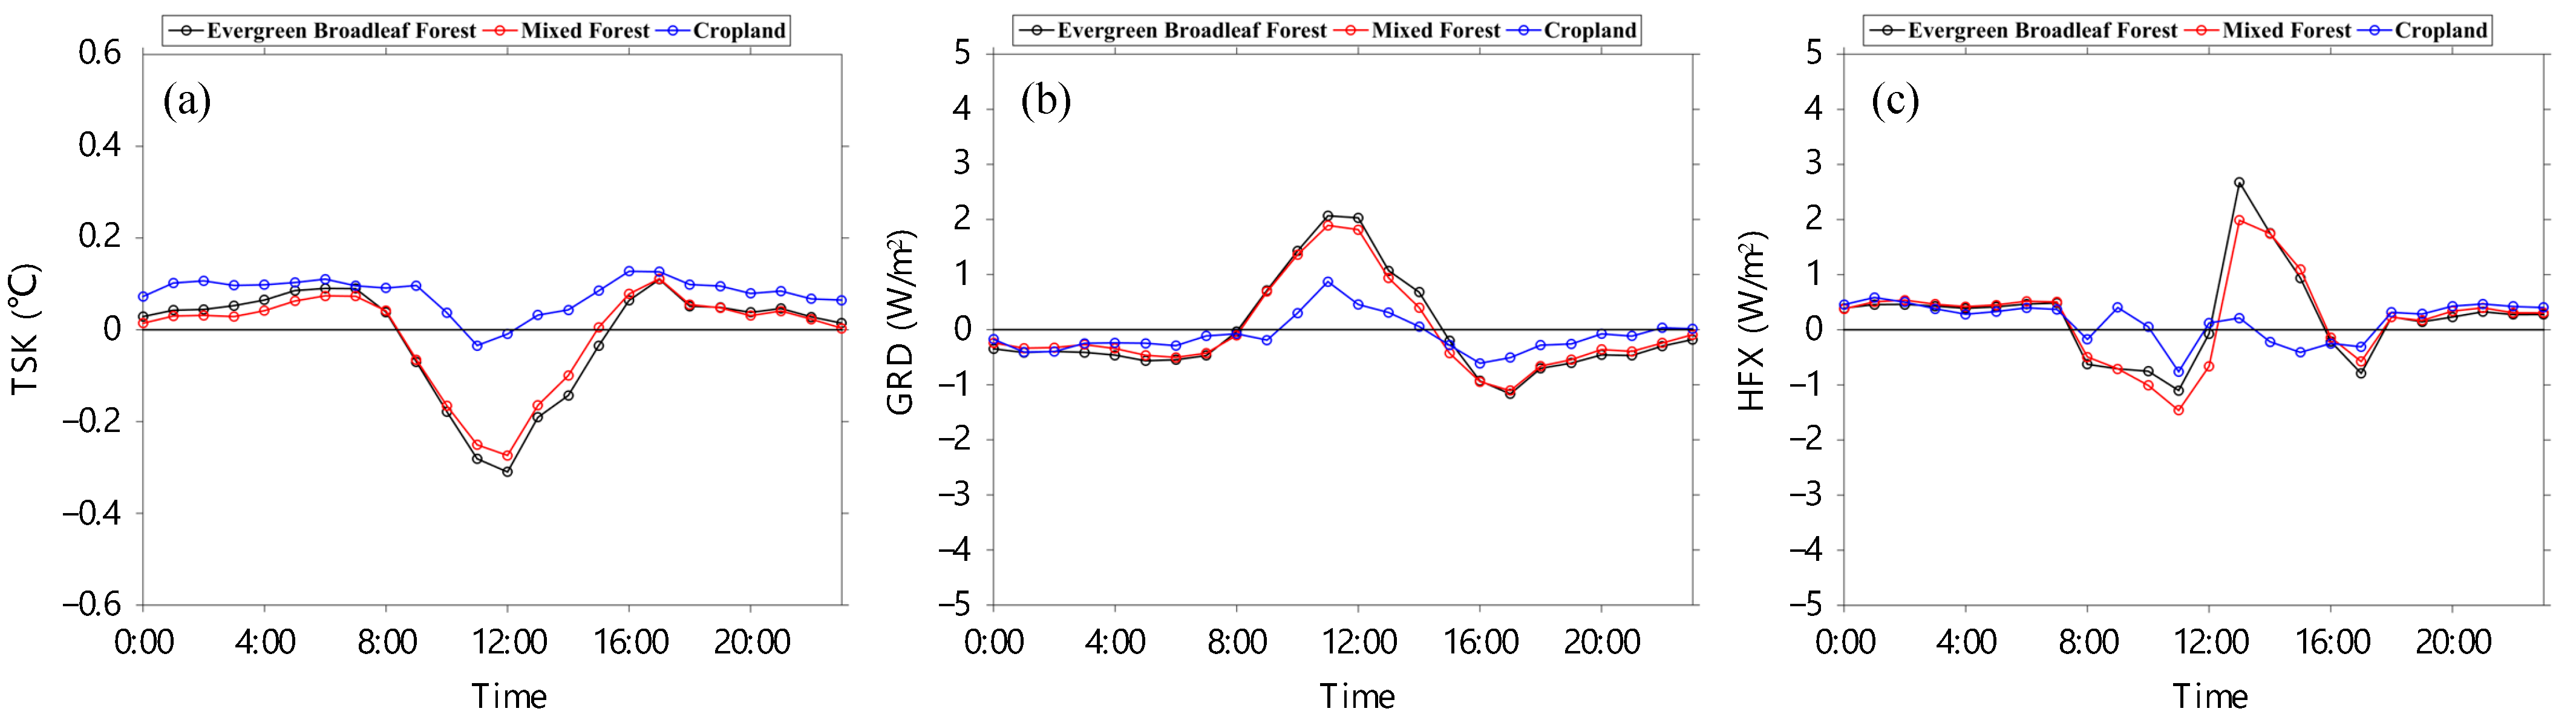
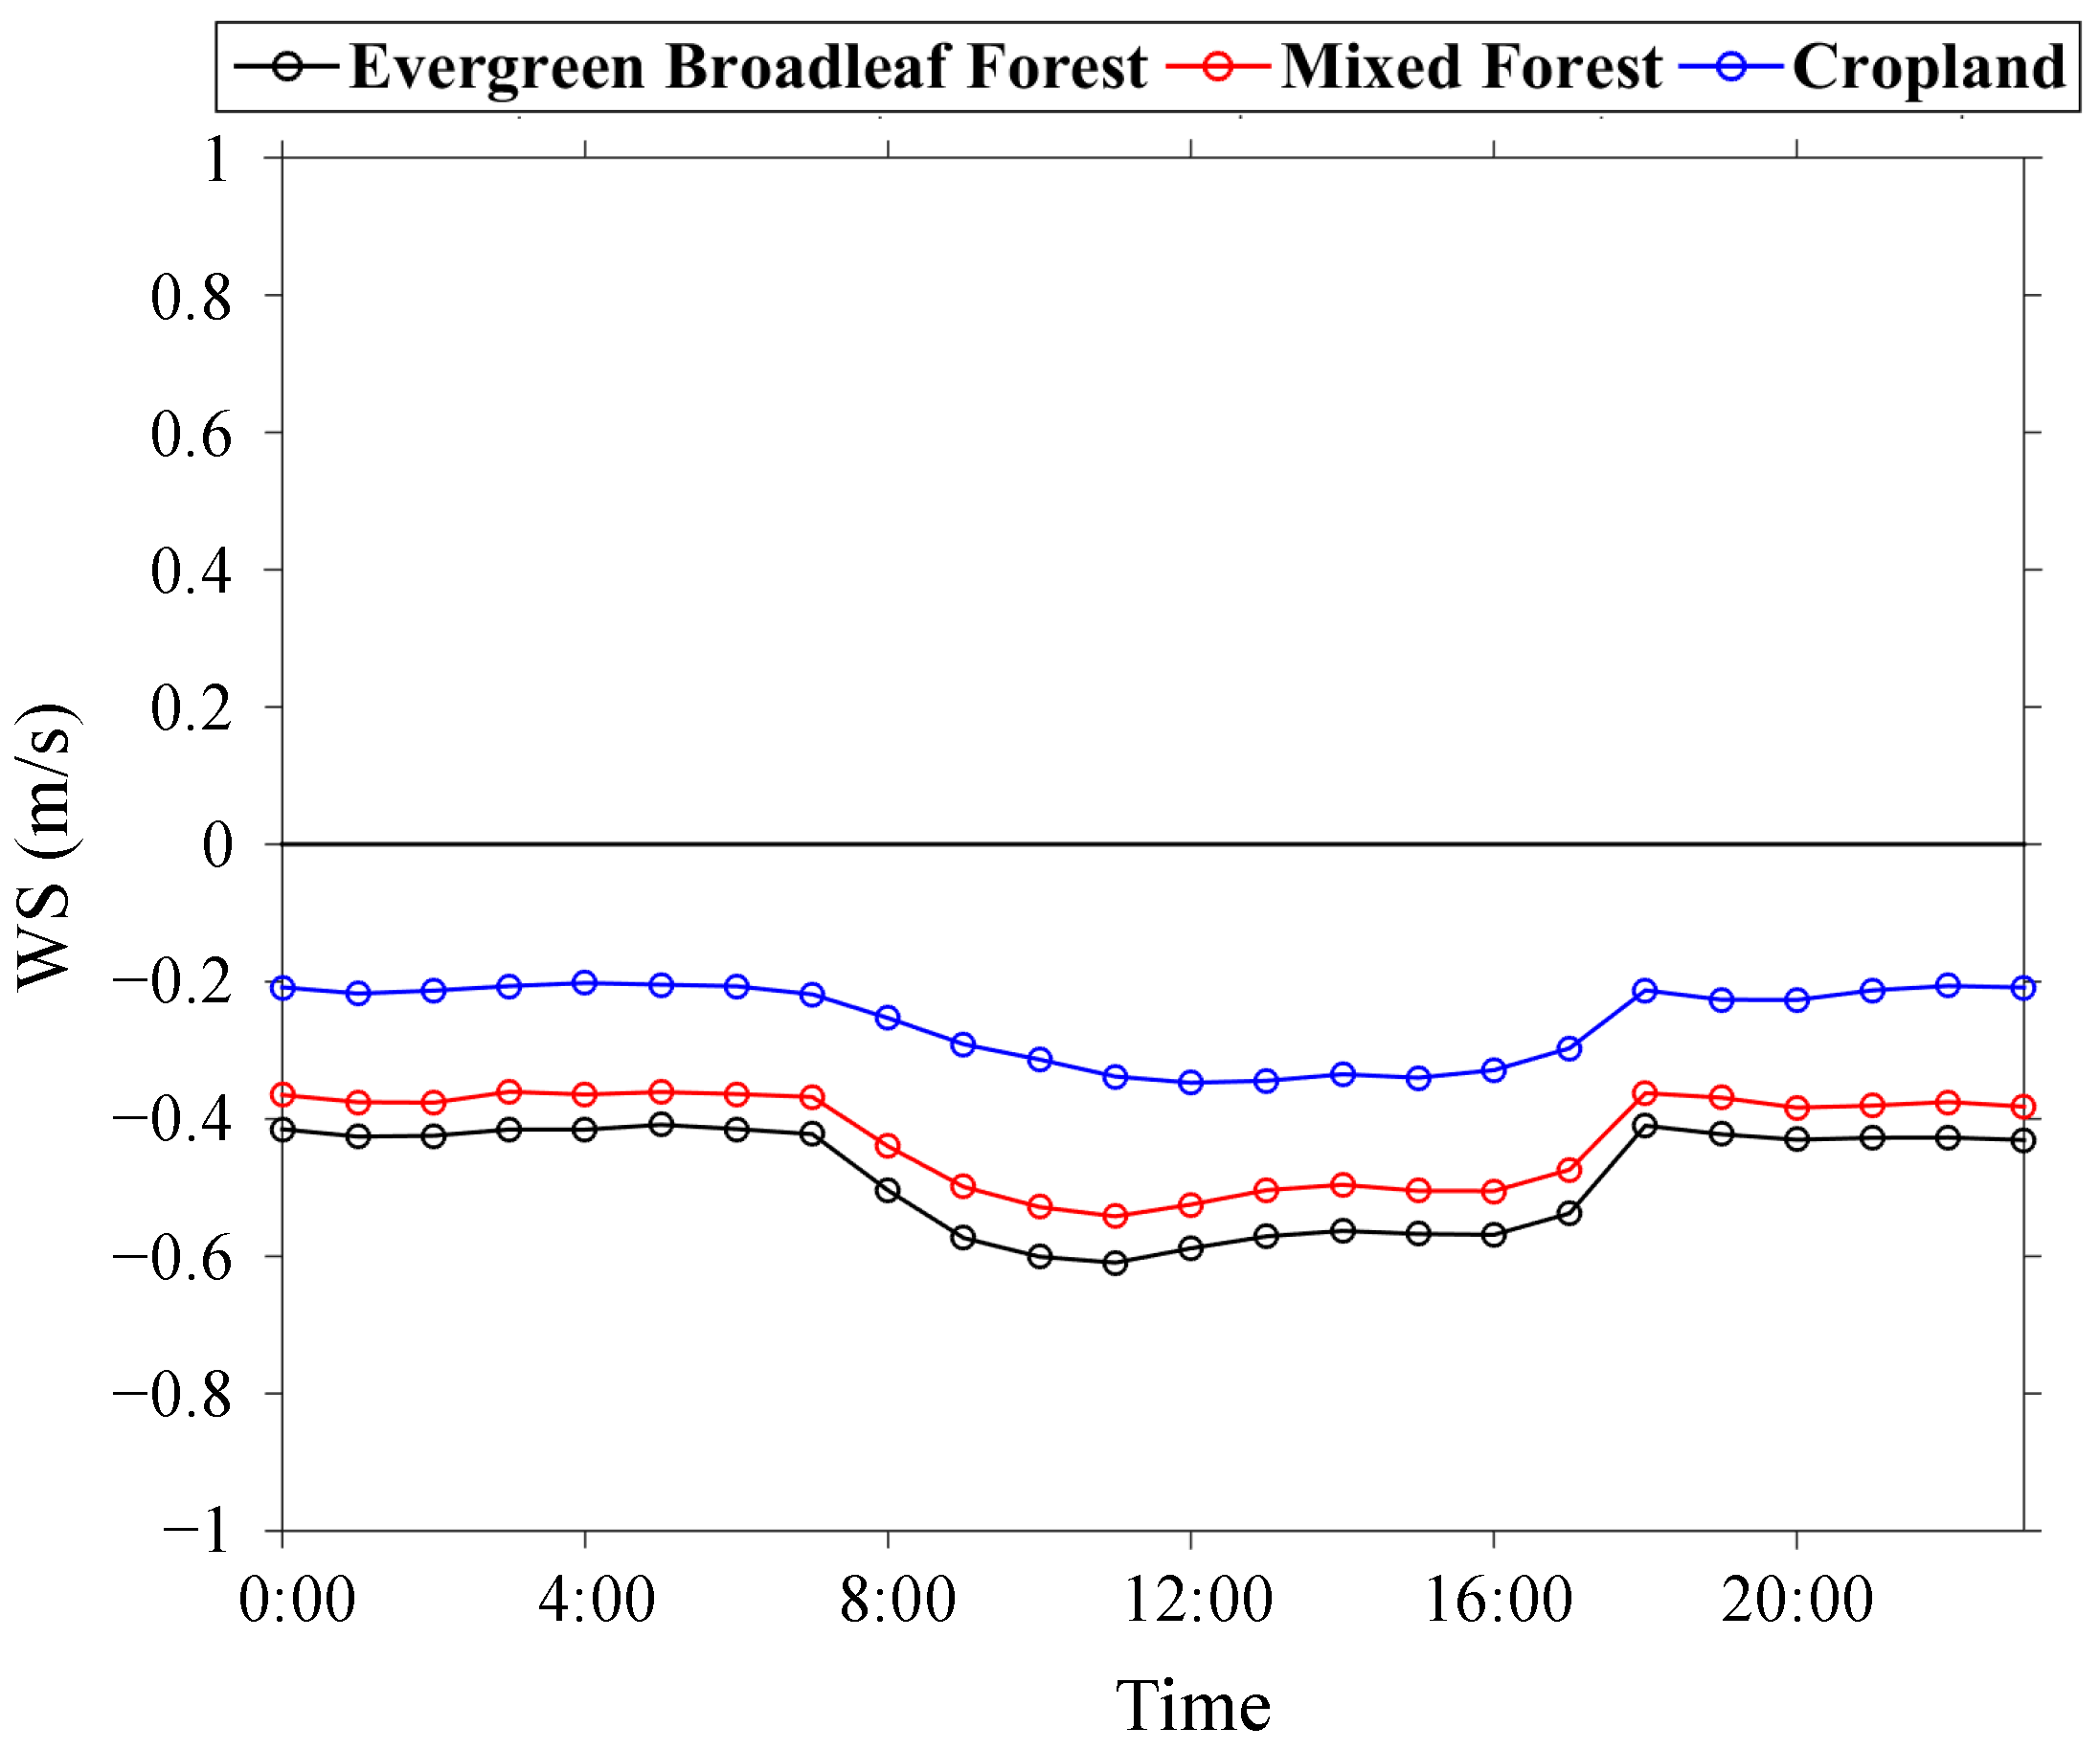
- The default Z0 values in the model were revised for the surfaces underlying evergreen broad-leaved forests, mixed forests, and croplands. The updated Z0 was found to have a slightly greater impact on meteorological elements during the day than at night. The change of Z0 has a relatively small effect on T2, RH, TSK, and PBLH of each underlying surface, with all changes below 1%. The updated (increased) Z0 resulted in a decrease in daily average WS by 0.48 m/s, 0.43 m/s, and 0.26 m/s for surfaces underlying evergreen broad-leaved forests, mixed forests, and croplands, respectively, accounting for changes of 12.0%, 11.1%, and 6.5%, respectively. The updated Z0 also resulted in a 1–2% reduction in the daytime and nighttime GRD of surfaces underlying evergreen broad-leaved forests and mixed forests, and a 1% increase and 2–4% decrease in HFX during the day and night, respectively.
- The overestimation of wind speed has long been a concern in atmospheric modelling [40,41,42,43]. The increase in Z0 over vegetated surfaces that is parametrized in the land surface model can partly reduce the overestimation of wind speed. The approach of this study can be extended to other regions to improve the simulations and forecasts using the atmospheric numerical model. Such improvement can further yield better simulation results in the modelling of air quality and climate. The weakness of this study is that the current vegetation height to derive Z0 over vegetated surfaces is based on the literature values. We expect to collect actual vegetation heights for further estimation in the future.
Supplementary Materials
Author Contributions
Funding
Data Availability Statement
Acknowledgments
Conflicts of Interest
References
- Hu, Z.; Yu, B. Review on methods calculating aerodynamic parameters over urban underlying surface. J. Meteorol. Environ. 2008, 24, 55–60. [Google Scholar]
- Huang, J.; Zhong, Z.; Guo, W.; Lu, W. Statistical Features of Aerodynamic Effective Roughness Length Over Heterogeneous Terrain. Acta Phys. Sin. 2013, 62, 194–199. [Google Scholar] [CrossRef]
- Liu, Y.; Guo, W.; Song, Y. Estimation of key surface parameters in semi-arid region and their impacts on improvement of surface fluxes simulation. Sci. China Earth Sci. 2015, 45, 1524–1536. [Google Scholar] [CrossRef]
- Zhang, Q.; Yao, T.; Yue, P. Development and test of a multifactorial parameterization scheme of land surface aerodynamic roughness length for flat land surfaces with short vegetation. Sci. China Earth Sci. 2016, 59, 281–295. [Google Scholar] [CrossRef]
- Hu, W.; Zhang, W.; Zhang, Y.; Guo, Z.; Liu, X. Variance Analysis on the Simulated and Observed Values of Underlaying Surface Roughness in Gansu Corridor. Plateau Meteorol. 2010, 29, 51–55. [Google Scholar]
- Wood, N.; Mason, P. The Pressure force induced by neutral, turbulent flow over hills. Q. J. R. Meteorol. Soc. 2010, 119, 1233–1267. [Google Scholar] [CrossRef]
- Rotach, M.W. Determination of the zero plane displacement in an urban environment. Bound. Layer Meteorol. 1994, 67, 187–193. [Google Scholar] [CrossRef]
- Martano, P. Estimation of Surface Roughness Length and Displacement Height from Single-Level Sonic Anemometer Data. J. Appl. Meteorol. 2000, 39, 708–715. [Google Scholar] [CrossRef]
- Chen, J.; Wang, J.; Guang, T. An independent method to determine the surface roughness length. Atmos. Sci. 1993, 17, 21–26. [Google Scholar]
- Lettau, H. Note on Aerodynamic Roughness-Parameter Estimation on the Basis of Roughness-Element Description. J. Appl. Meteorol. 1969, 8, 828–832. [Google Scholar] [CrossRef]
- Lo, A.K. Determination of zero-plane displacement and roughness length of a forest canopy using profiles of limited height. Bound. -Layer Meteorol. 1995, 75, 381–402. [Google Scholar]
- Yang, R.; Friedl, M.A. Determination of Roughness Lengths for Heat and Momentum Over Boreal Forests. Bound. Layer Meteorol. 2003, 107, 581–603. [Google Scholar] [CrossRef]
- Mikami, M.; Toya, T.; Yasuda, N. An analytical method for the determination of the roughness parameters over complex regions. Bound. Layer Meteorol. 1996, 79, 23–33. [Google Scholar] [CrossRef]
- Patil, M.N. Aerodynamic drag coefficient and roughness length for three seasons over a tropical western Indian station. Atmos. Res. 2006, 80, 280–293. [Google Scholar] [CrossRef]
- Zhou, Y.; Sun, X.; Zhu, Z.; Wen, X.; Tian, J.; Zhang, R. Comparative research on four typical surface roughness length calculation methods. Geogr. Res. 2007, 26, 887–896. [Google Scholar]
- Zhang, Q.; Zeng, J.; Yao, T. Interaction of aerodynamic roughness length and windflow conditions and its parameterization over vegetation surface. Chin. Sci. Bull. 2012, 57, 647–655. [Google Scholar] [CrossRef]
- Xing, L. The Aerodynamic Roughness Length of Chinese Surface Vegetation Based on MODIS and GLAS Data Inversion of Time-Serials. Master’s Thesis, Capital Normal University, Beijing, China, 2012. [Google Scholar]
- Liu, W.; Wei, X.; Shi, W.; Dong, W.; Zheng, Z.; Zhu, X.; Wei, Z. The Calculation of zero-plane displacement and aerodynamic roughness of heterogeneous terrain—With the evergreen broad-leaf forest in Zhuhai as an example. J. Trop. Meteorol. 2016, 32, 524–532. [Google Scholar]
- Liu, Y.; Fang, X.; Luan, Q. Estimation of roughness length of Beijing area based on satellite data and GIS technique. Plateau Meteorol. 2016, 35, 1625–1638. [Google Scholar]
- Mao, Y.; Liu, S.; Liu, J. Study of Aerodynamic Parameters on Different Underling Surfaces. Acta Meteorol. Sin. 2006, 64, 325–334. [Google Scholar]
- Zhang, W.; Zhang, Y.; Lu, X.; Guo, Z.; Wang, X. Analysis on Heterogeneous Underlying Surface Roughness Length in Semi-Arid Mountains Area of Loess Plateau, China. Plateau Meteorol. 2009, 28, 763–768. [Google Scholar]
- Ju, Y. Research on Dynamic Roughness and Thermodynamic Roughness of Different Underlying Surface Types. Master’s Thesis, Nanjing University of Information Science and Technology, Nanjing, China, 2012. [Google Scholar]
- Yao, T.; Zhang, Q.; Yin, H. The Annual Variation and Its Influencing Mechanism of Surface Roughness Length of Yuzhong in Semi-arid Areas. J. Appl. Meteorol. Sci. 2014, 25, 454–462. [Google Scholar]
- Li, S.; Lv, S.; Liu, Y.; Zhang, Y.; Ao, Y.; Gao, Y.; Cheng, S.; Shang, L. Determination of Aerodynamical Parameter in Maqu Area in the Upper Reach of Yellow River and Its Application in Land Surface Process Model. Plateau Meteorol. 2010, 29, 1408–1413. [Google Scholar]
- Sun, G.; Hu, Z.; Wang, J.; Xie, Z.; Lin, Y.; Huang, F. Upscaling analysis of aerodynamic roughness length based on In situ data at different spatial Scales and remote sensing in North Tibetan plateau. Atmos. Res. 2016, 176–177, 231–239. [Google Scholar] [CrossRef]
- Lu, S.; Zuo, H.; Guo, Y.; Chen, J.; Feng, K.; Wang, S.; Wu, L. Modification and Simulation of Key Parameters in Land Surface Process in Desert Underlying Surface. Arid Zone Res. 2017, 34, 551–563. [Google Scholar]
- Chen, S.; Lv, S. Calculation of Roughness Length of Desert and Its Application in Land Surface Process Model. J. Desert Res. 2013, 33, 174–178. [Google Scholar]
- Zheng, D.; Velde, R.V.D.; Su, Z.; Booij, M.J.; Hoekstra, A.Y. Assessment of Roughness Length Schemes Implemented within the Noah Land Surface Model for High-Altitude Regions. J. Hydrometeorol. 2014, 15, 921–937. [Google Scholar] [CrossRef]
- Huang, Y.; Salama, M.S.; Su, Z.; Velde, R.V.D.; Zheng, D.; Krol, M.S.; Hoekstra, A.Y.; Zhou, Y. Effects of Roughness Length Parameterizations on Regional Scale Land Surface Modelling of Alpine Grasslands in the Yangtze River Basin. J. Hydrometeorol. 2016, 17, 1069–1085. [Google Scholar] [CrossRef]
- Shen, C.; Shen, A.; Tian, C.; Zhou, S.; Zhu, L.; Chan, P.; Fan, Q.; Fan, S.; Li, W. Evaluating the impacts of updated aerodynamic roughness length in the WRF/Chem model over Pearl River Delta. Meteorol. Atmos. Phys. 2020, 132, 427–440. [Google Scholar] [CrossRef]
- Guangdong Statistical Yearbook on Agriculture Editorial Committee. Guangdong Statistical Yearbook on Agriculture (2019); China Statistics Press: Beijing, China, 2019. [Google Scholar]
- Raupach, M.R. Drag and drag partition on rough surfaces. Bound. Layer Meteorol. 1992, 60, 375–395. [Google Scholar] [CrossRef]
- Raupach, M.R. Simplified expressions for vegetation roughness length and zero-plane displacement as functions of canopy height and area index. Bound. Layer Meteorol. 1994, 71, 211–216. [Google Scholar] [CrossRef]
- Jasinski, M.F.; Borak, J.; Crago, R. Bulk surface momentum parameters for satellite-derived vegetation fields. Agric. For. Meteorol. 2005, 133, 55–68. [Google Scholar] [CrossRef]
- Zeng, X.; Shaikh, M.; Dai, Y.; Dickinson, R.E.; Myneni, R. Coupling of the Common Land Model to the NCAR Community Climate Model. J. Clim. 2002, 15, 1832–1854. [Google Scholar] [CrossRef]
- Liu, M.; Xing, Y.; Wu, H.; You, H. Study on Mean Forest Canopy Height Estimation Based on ICESat-GLAS Waveforms. For. Res. 2014, 27, 309–315. [Google Scholar]
- Powers, J.G.; Klemp, J.B.; Skamarock, W.C.; Davis, C.A.; Dudhia, J.; Gill, D.O.; Coen, J.L.; Gochis, D.J.; Ahmadov, R.; Peckham, S.E. The weather research and forecasting model: Overview, system efforts, and future directions. Bull. Am. Meteorol. Soc. 2017, 98, 1717–1737. [Google Scholar] [CrossRef]
- Chang, M.; Fan, S.; Wang, X. Impact of refined land-cover data on WRF performance over the Pearl River Delta region, China. Acta Sci. Circumstantiae 2014, 34, 1922–1933. [Google Scholar]
- Shen, C.; Shen, A.; Cui, Y.; Chen, X.; Liu, Y.; Fan, Q.; Chan, P.; Tian, C.; Wang, C.; Lan, J.; et al. Spatializing the roughness length of heterogeneous urban underlying surfaces to improve the WRF simulation-part 1: A review of morphological methods and model evaluation. Atmos. Environ. 2022, 270, 118874. [Google Scholar] [CrossRef]
- Liu, Y.; Wang, T. Worsening urban ozone pollution in China from 2013 to 2017—Part 1: The complex and varying roles of meteorology. Atmos. Chem. Phys. 2020, 20, 6305–6321. [Google Scholar] [CrossRef]
- Hu, J.; Chen, J.; Ying, Q.; Zhang, H. One-year simulation of ozone and particulate matter in China using WRF/CMAQ modeling system. Atmos. Chem. Phys. 2016, 16, 10333–10350. [Google Scholar] [CrossRef]
- Hong, Y.; Liu, Y.; Chen, X.; Fan, Q.; Chen, C.; Chen, X.; Wang, M. The role of anthropogenic chlorine emission in surface ozone formation during different seasons over eastern China. Sci. Total Environ. 2020, 723, 137697. [Google Scholar] [CrossRef]
- Tuccella, P.; Curci, G.; Visconti, G.; Bessagnet, B.; Menut, L.; Park, R.J. Modeling of gas and aerosol with WRF/Chem over Europe: Evaluation and sensitivity study. J. Geophys. Res. Atmos. 2012, 117, D03303. [Google Scholar] [CrossRef]


| Rank | Land Cover Type | Proportion (%) |
|---|---|---|
| 1 | Evergreen broad-leaved forest | 37.40 |
| 2 | Woody savannas | 16.51 |
| 3 | Cropland/natural vegetation mosaic | 16.18 |
| 4 | Croplands | 12.53 |
| 5 | Mixed forest | 7.67 |
| 6 | Urban and built-up | 4.31 |
| 7 | Permanent wetlands | 2.27 |
| 8 | Water bodies | 1.76 |
| 9 | Others | 1.37 |
| Roughness Length (m) | Evergreen Broad-Leaved Forest | Mixed Forest | Cropland |
|---|---|---|---|
| Spring | 1.27 | 1.15 | 0.20 |
| Summer | 1.15 | 0.99 | 0.18 |
| Autumn | 1.03 | 0.92 | 0.17 |
| Winter | 1.15 | 1.10 | 0.20 |
| Type of Vegetation Cover | Default Model Value | Estimated Value in Guangdong Province | Values in China from the Literature (Table 1) | ||
|---|---|---|---|---|---|
| Summer | Winter | Summer | Winter | ||
| Evergreen broad-leaved forest | 0.5 | 0.5 | 1.15 | 1.15 | 0.52–3.90 |
| Mixed forest | 0.5 | 0.2 | 0.99 | 1.10 | 1.10–1.35 |
| Cropland | 0.15 | 0.05 | 0.18 | 0.20 | 0.21–0.23 |
| Land Cover Type | Sites | MB | MAE | RMSE | R | ||||
|---|---|---|---|---|---|---|---|---|---|
| Base | Case | Base | Case | Base | Case | Base | Case | ||
| Evergreen broad-leaved forest | 3 | 1.51 | 1.04 | 1.80 | 1.43 | 2.21 | 1.75 | 0.29 | 0.27 |
| Croplands | 3 | 1.64 | 1.47 | 1.82 | 1.69 | 2.24 | 2.06 | 0.37 | 0.36 |
Disclaimer/Publisher’s Note: The statements, opinions and data contained in all publications are solely those of the individual author(s) and contributor(s) and not of MDPI and/or the editor(s). MDPI and/or the editor(s) disclaim responsibility for any injury to people or property resulting from any ideas, methods, instructions or products referred to in the content. |
© 2023 by the authors. Licensee MDPI, Basel, Switzerland. This article is an open access article distributed under the terms and conditions of the Creative Commons Attribution (CC BY) license (https://creativecommons.org/licenses/by/4.0/).
Share and Cite
Liu, Y.; Shen, C.; Chen, X.; Hong, Y.; Fan, Q.; Chan, P.; Wang, C.; Lan, J. Satellite-Based Estimation of Roughness Length over Vegetated Surfaces and Its Utilization in WRF Simulations. Remote Sens. 2023, 15, 2686. https://doi.org/10.3390/rs15102686
Liu Y, Shen C, Chen X, Hong Y, Fan Q, Chan P, Wang C, Lan J. Satellite-Based Estimation of Roughness Length over Vegetated Surfaces and Its Utilization in WRF Simulations. Remote Sensing. 2023; 15(10):2686. https://doi.org/10.3390/rs15102686
Chicago/Turabian StyleLiu, Yiming, Chong Shen, Xiaoyang Chen, Yingying Hong, Qi Fan, Pakwai Chan, Chunlin Wang, and Jing Lan. 2023. "Satellite-Based Estimation of Roughness Length over Vegetated Surfaces and Its Utilization in WRF Simulations" Remote Sensing 15, no. 10: 2686. https://doi.org/10.3390/rs15102686