
Detecting Individual Plants Infected with Pine Wilt Disease Using Drones and Satellite Imagery: A Case Study in Xianning, China
 , , ,
, , ,
Abstract
:1. Introduction
- To train an object detection model capable of detecting PWD-infected trees in both middle and late stages of the disease, we constructed a dataset of such trees. This dataset involved categorizing the trees into middle-stage and late-stage categories based on their distinct characteristics at different stages. We then cut and labeled the high-resolution image data from the drone, resulting in a dataset of 1853 images and 51,124 infected trees.
- In order to increase the accuracy of identifying trees affected by PWD and achieve efficient and accurate detection of individual PWD-infected tree, we propose an improved YOLOv5-PWD model specifically designed for PWD-infected tree identification.
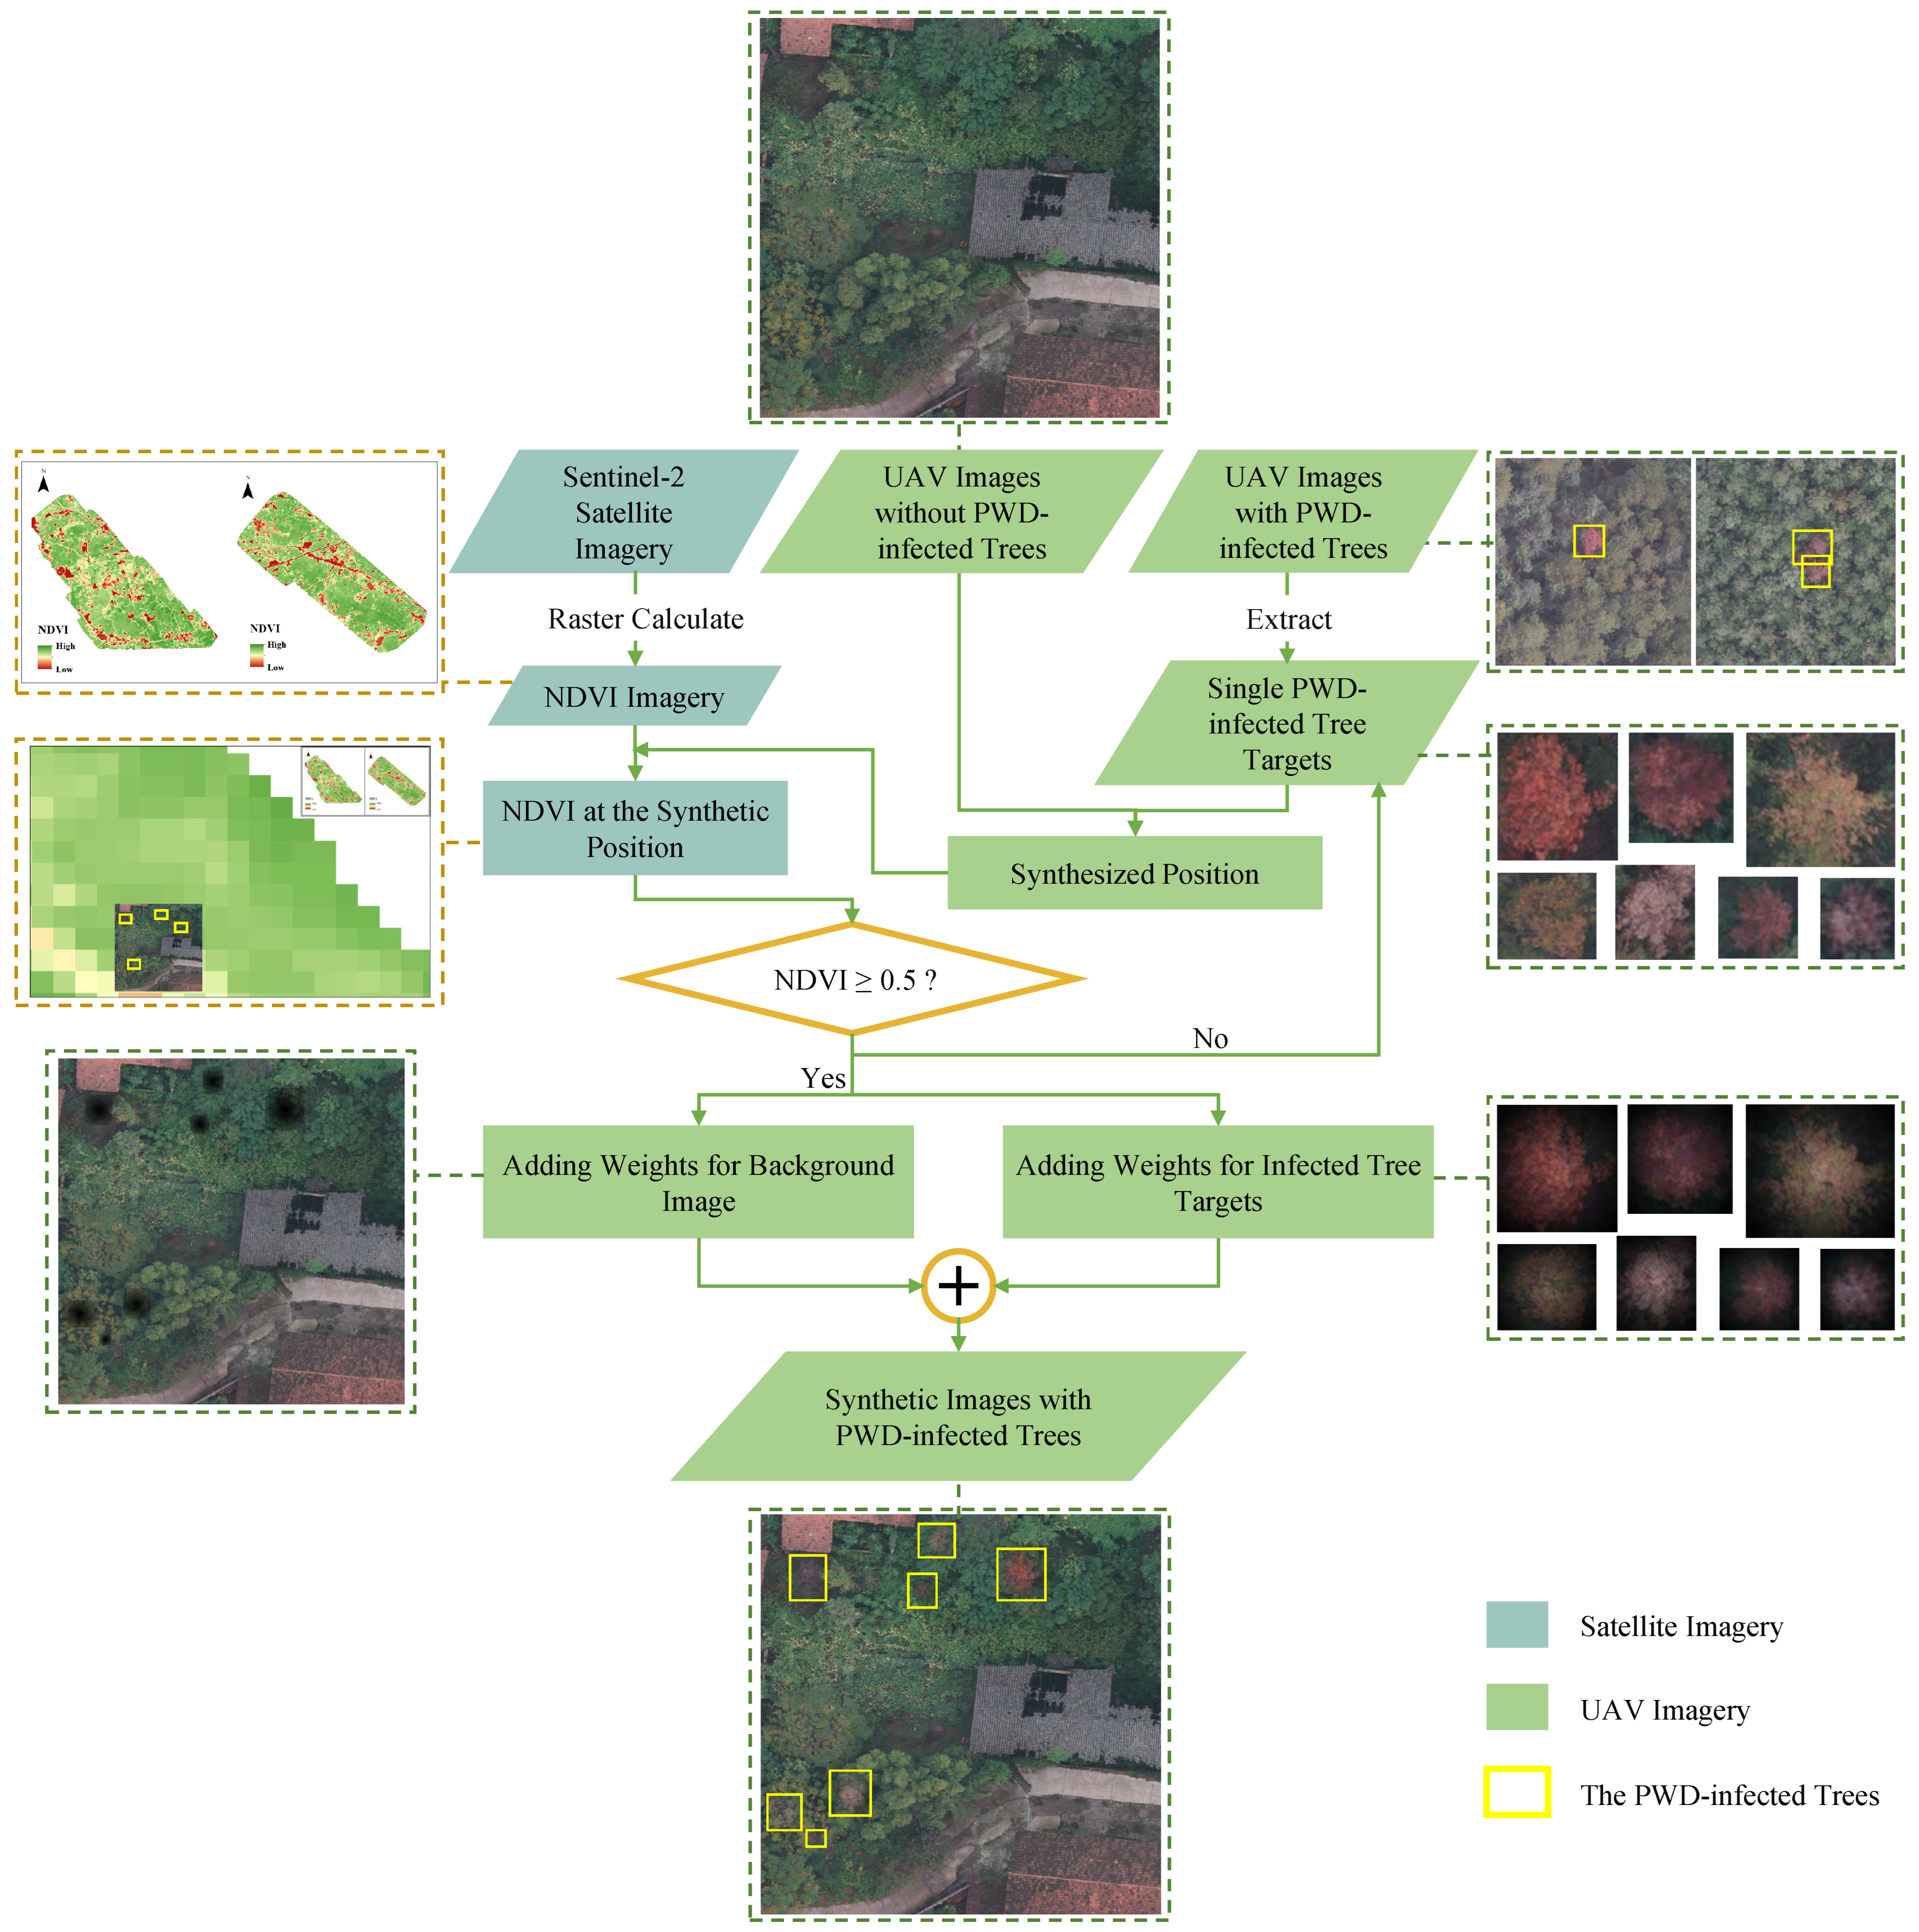
- To overcome the challenge of limited training samples and further improve the detection accuracy of the model, we propose a cost-effective and efficient sample synthesis method that leverages Sentinel-2 satellite data and UAV images. This approach enables an increase in the size of the dataset and improves detection accuracy without needing to collect more data using drones.
2. Materials and Methods
2.1. Data Collection and Dataset Construction
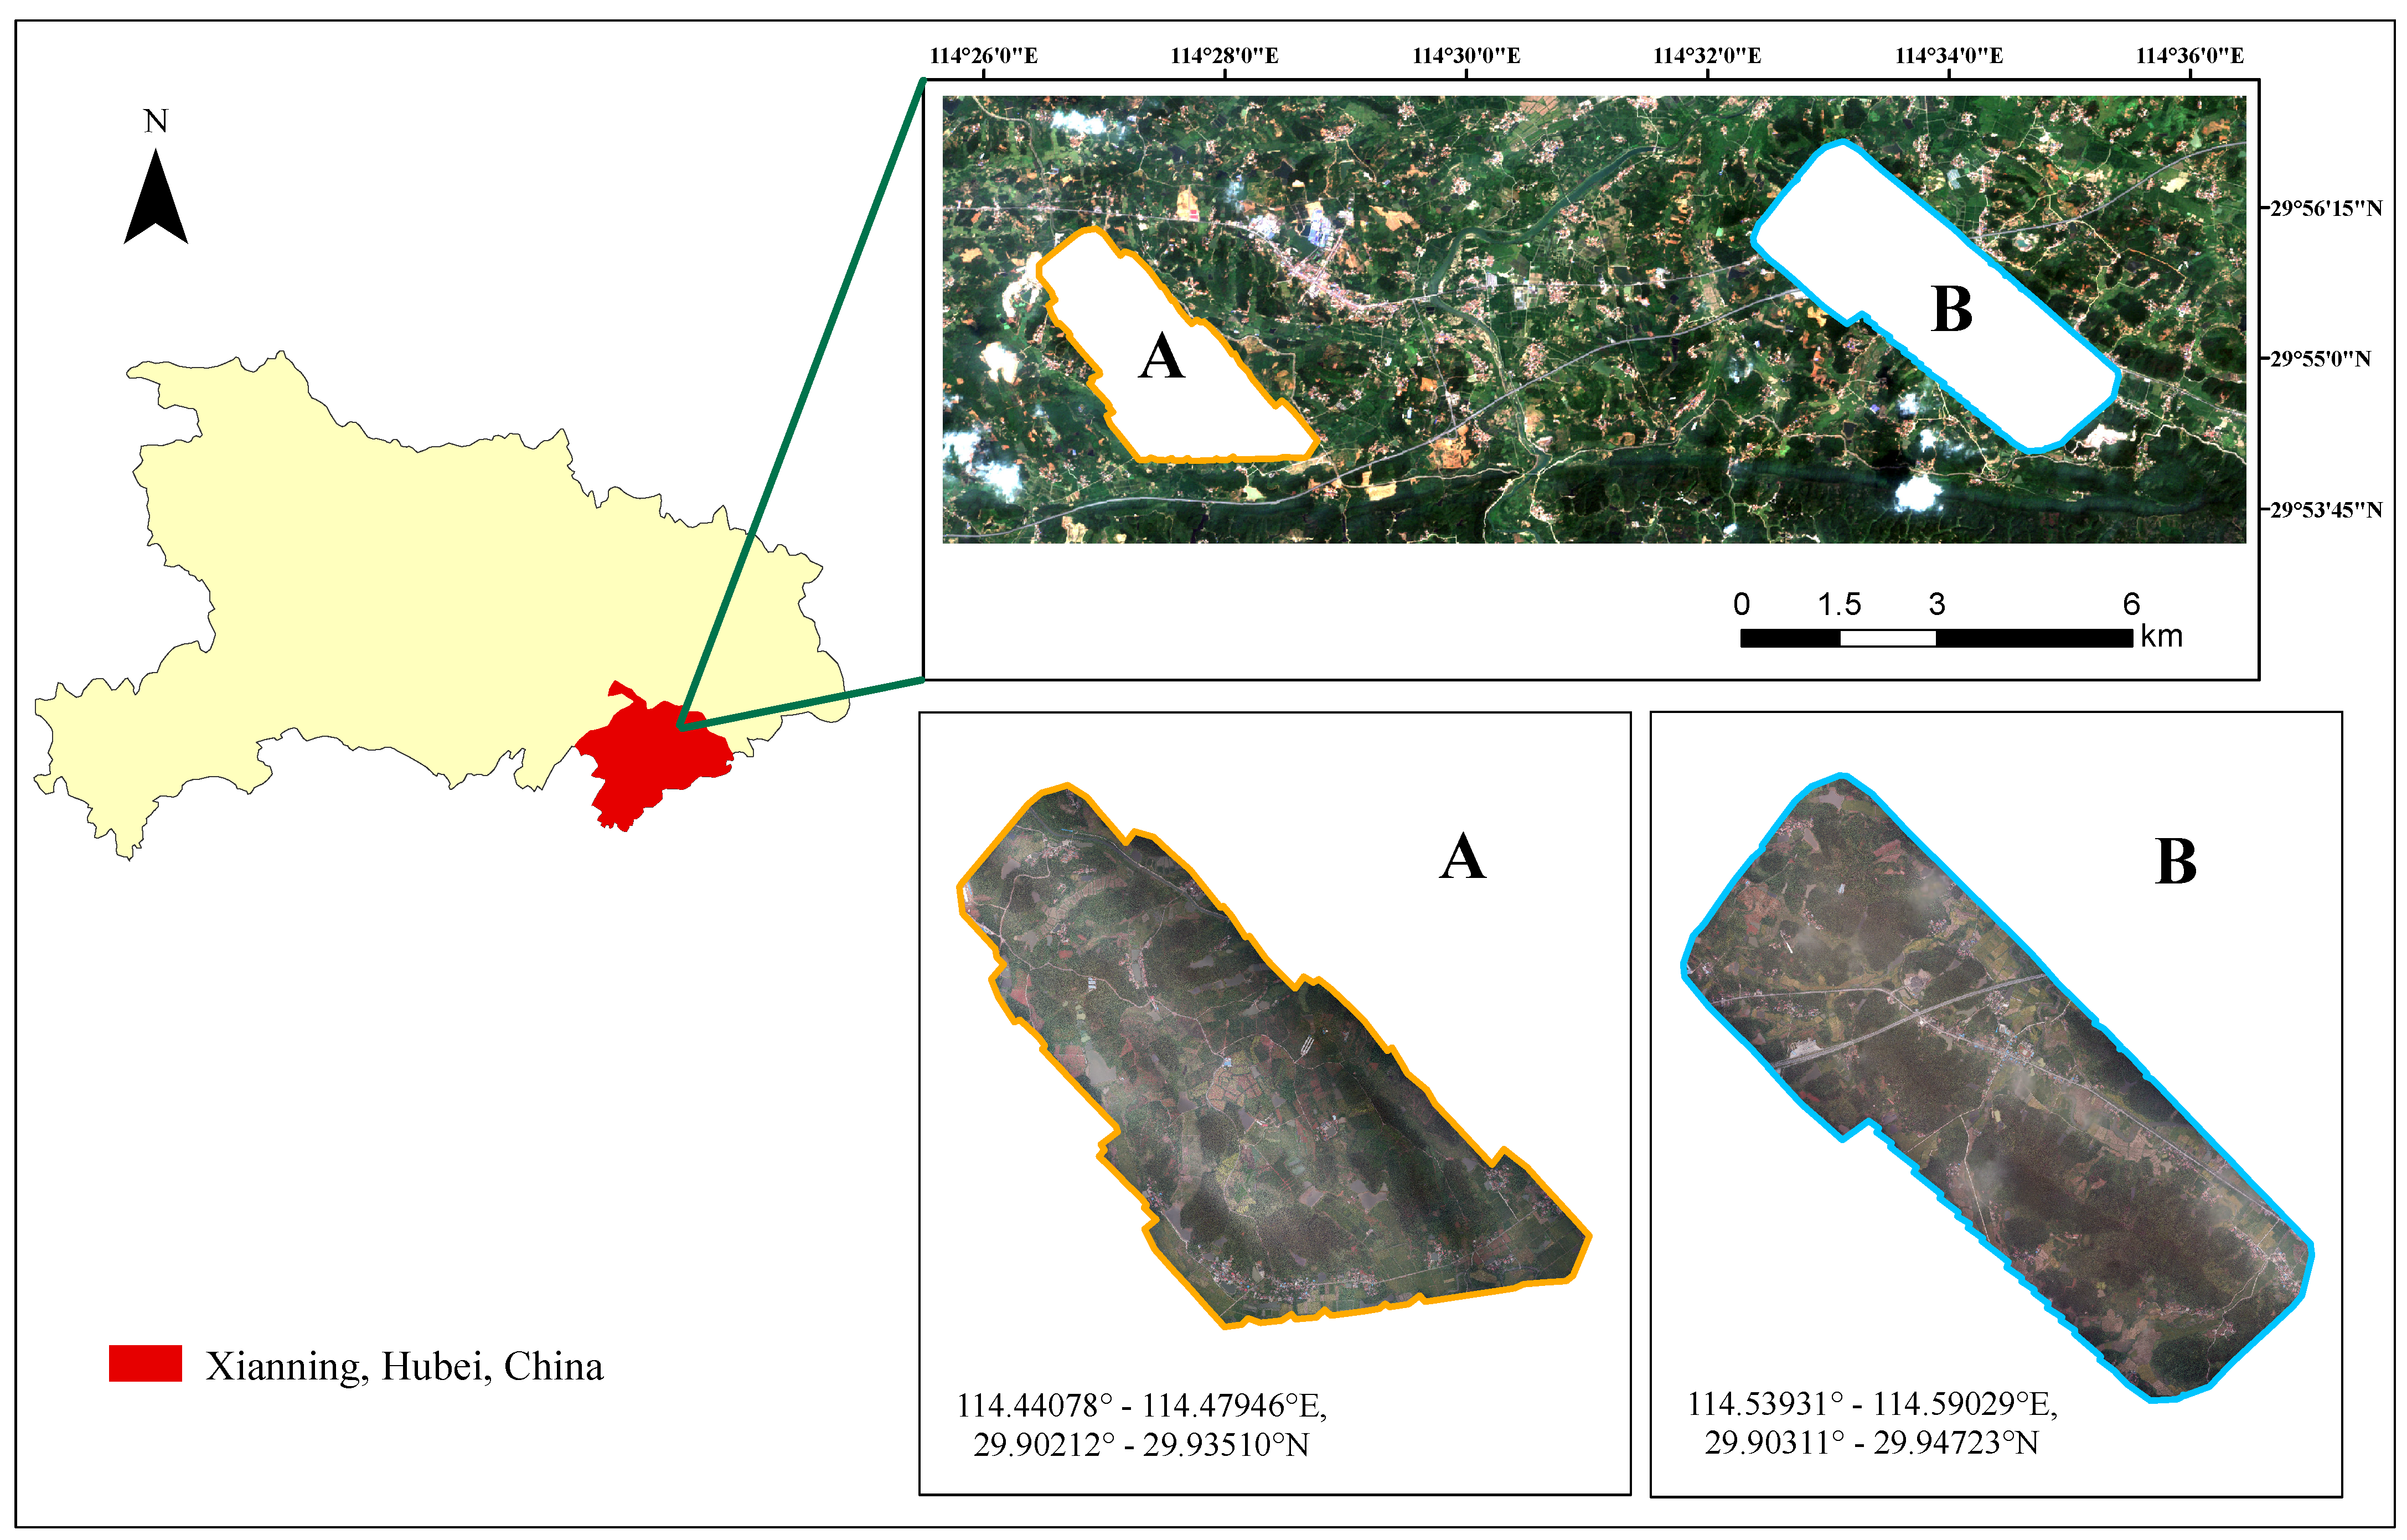
2.1.1. Study Area
2.1.2. Imagery Source
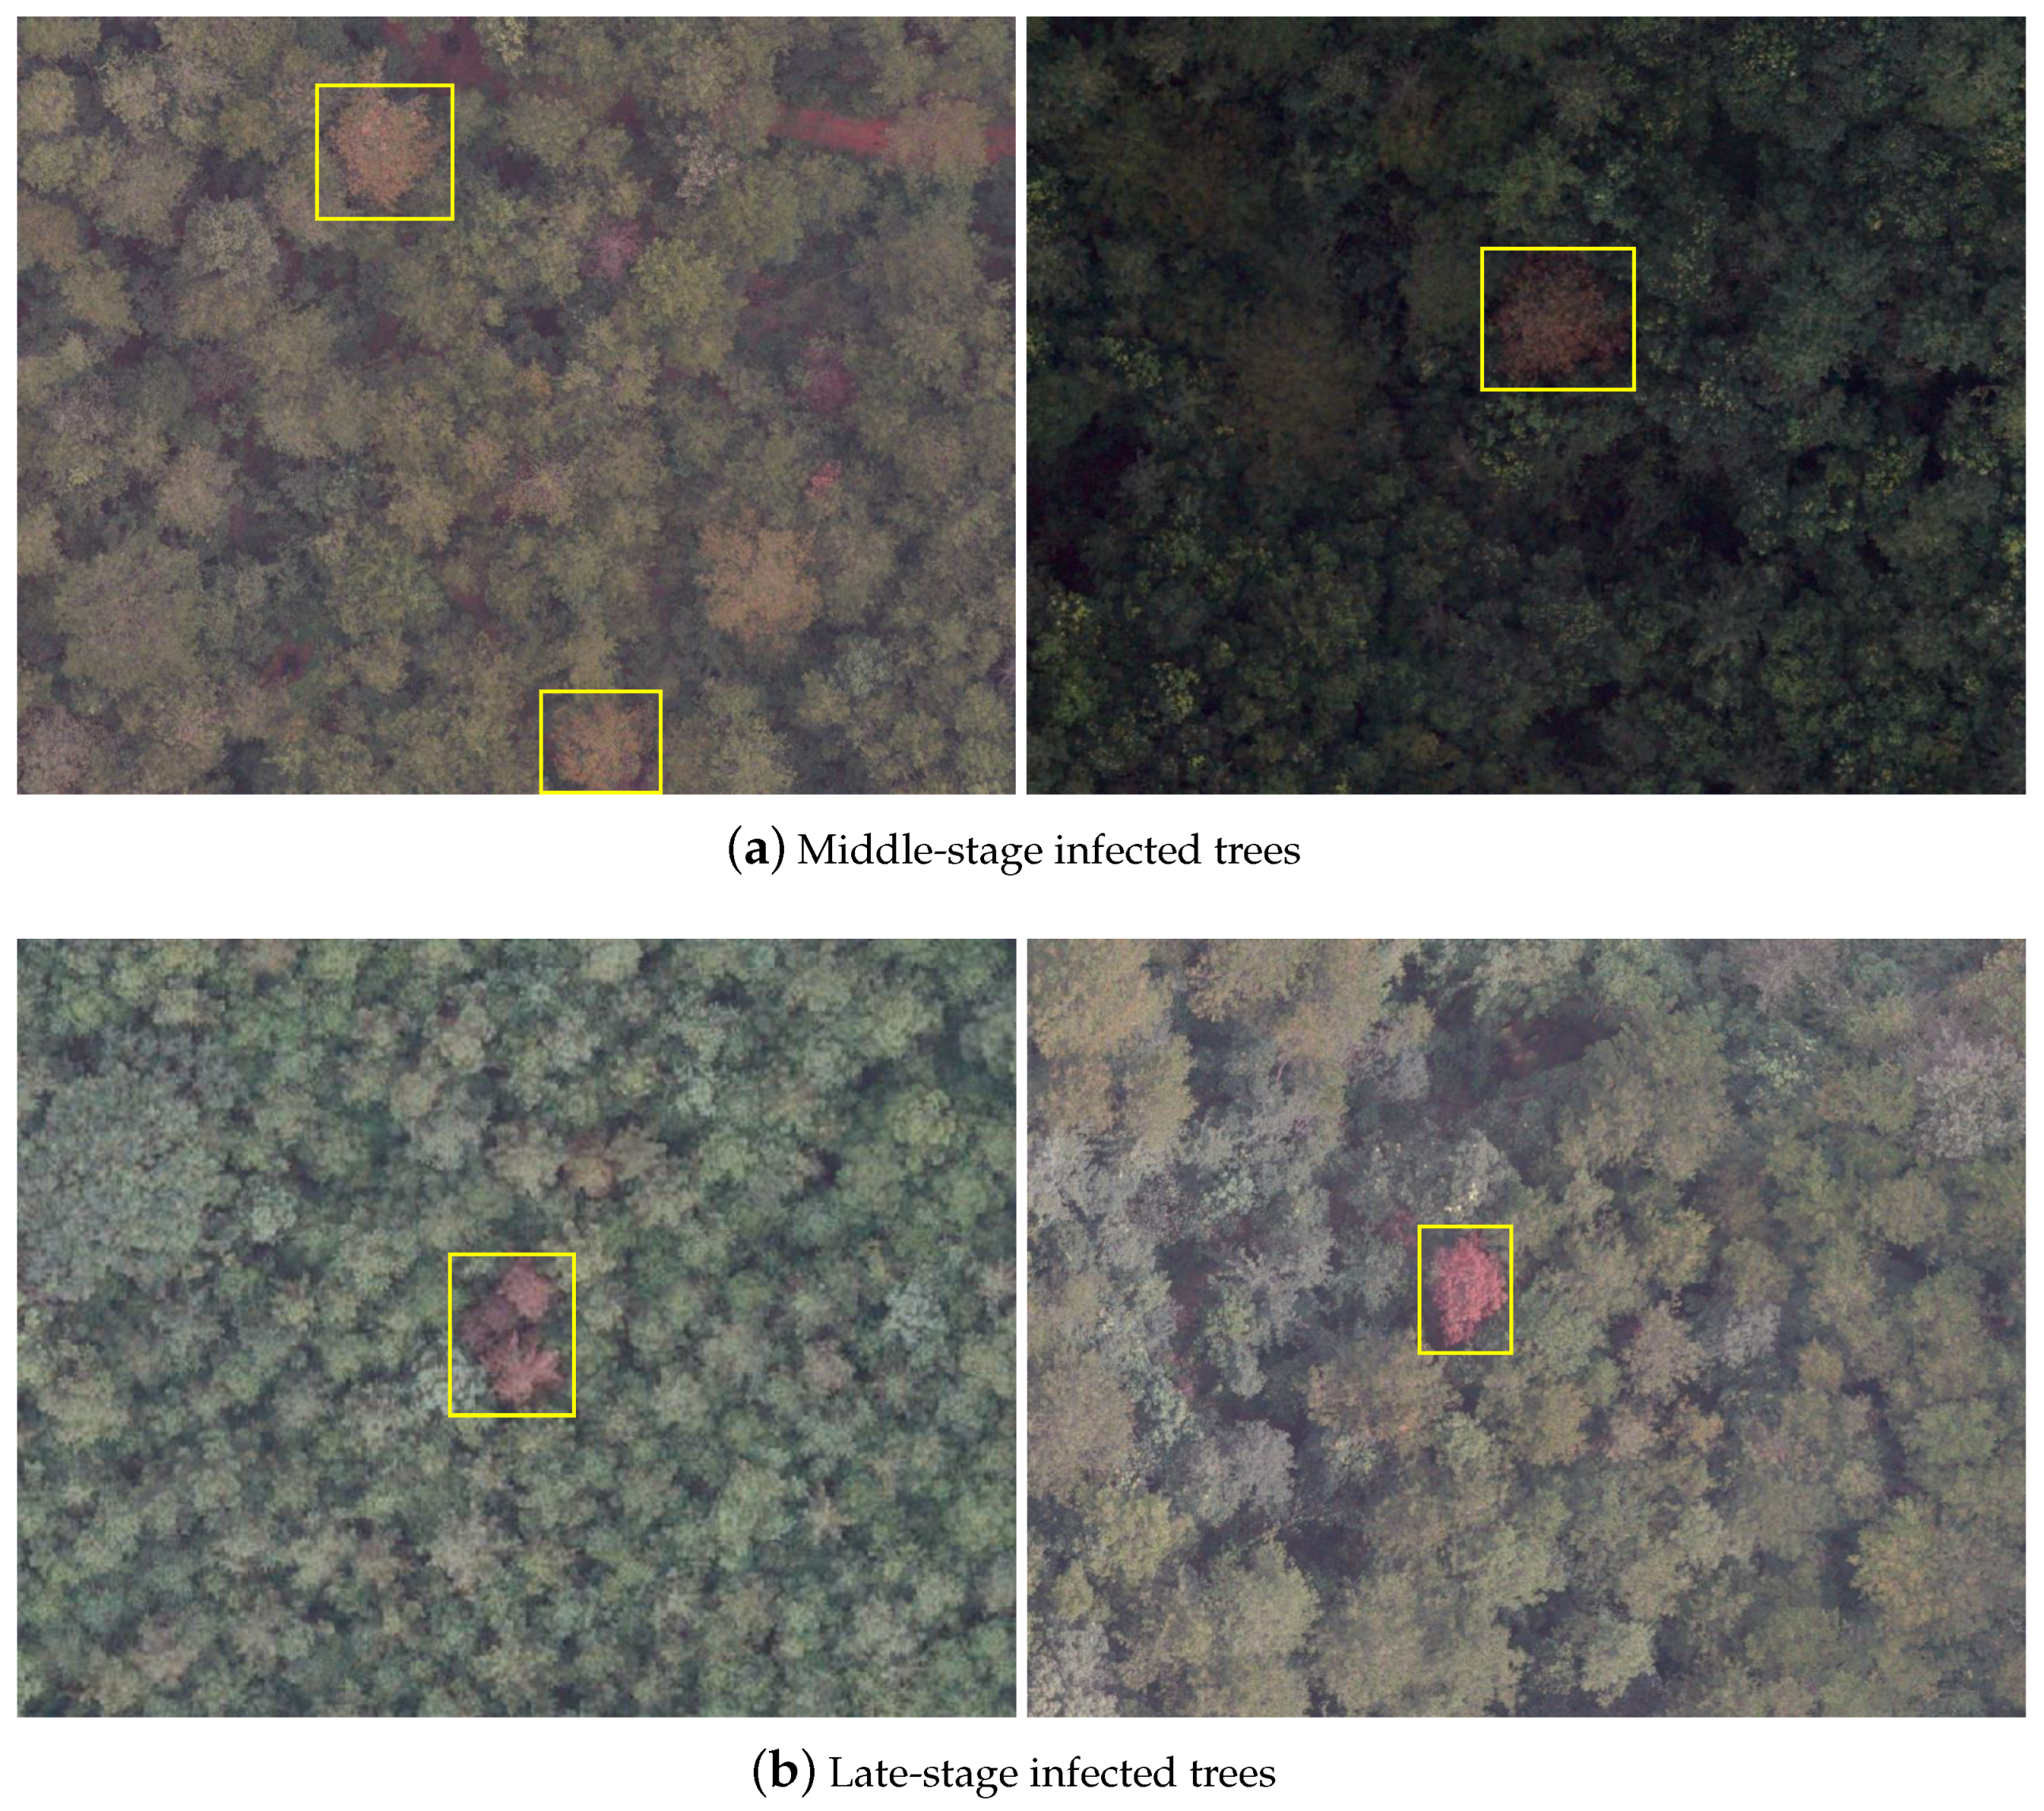
2.1.3. Disease Tree Category System and Labeling Solution
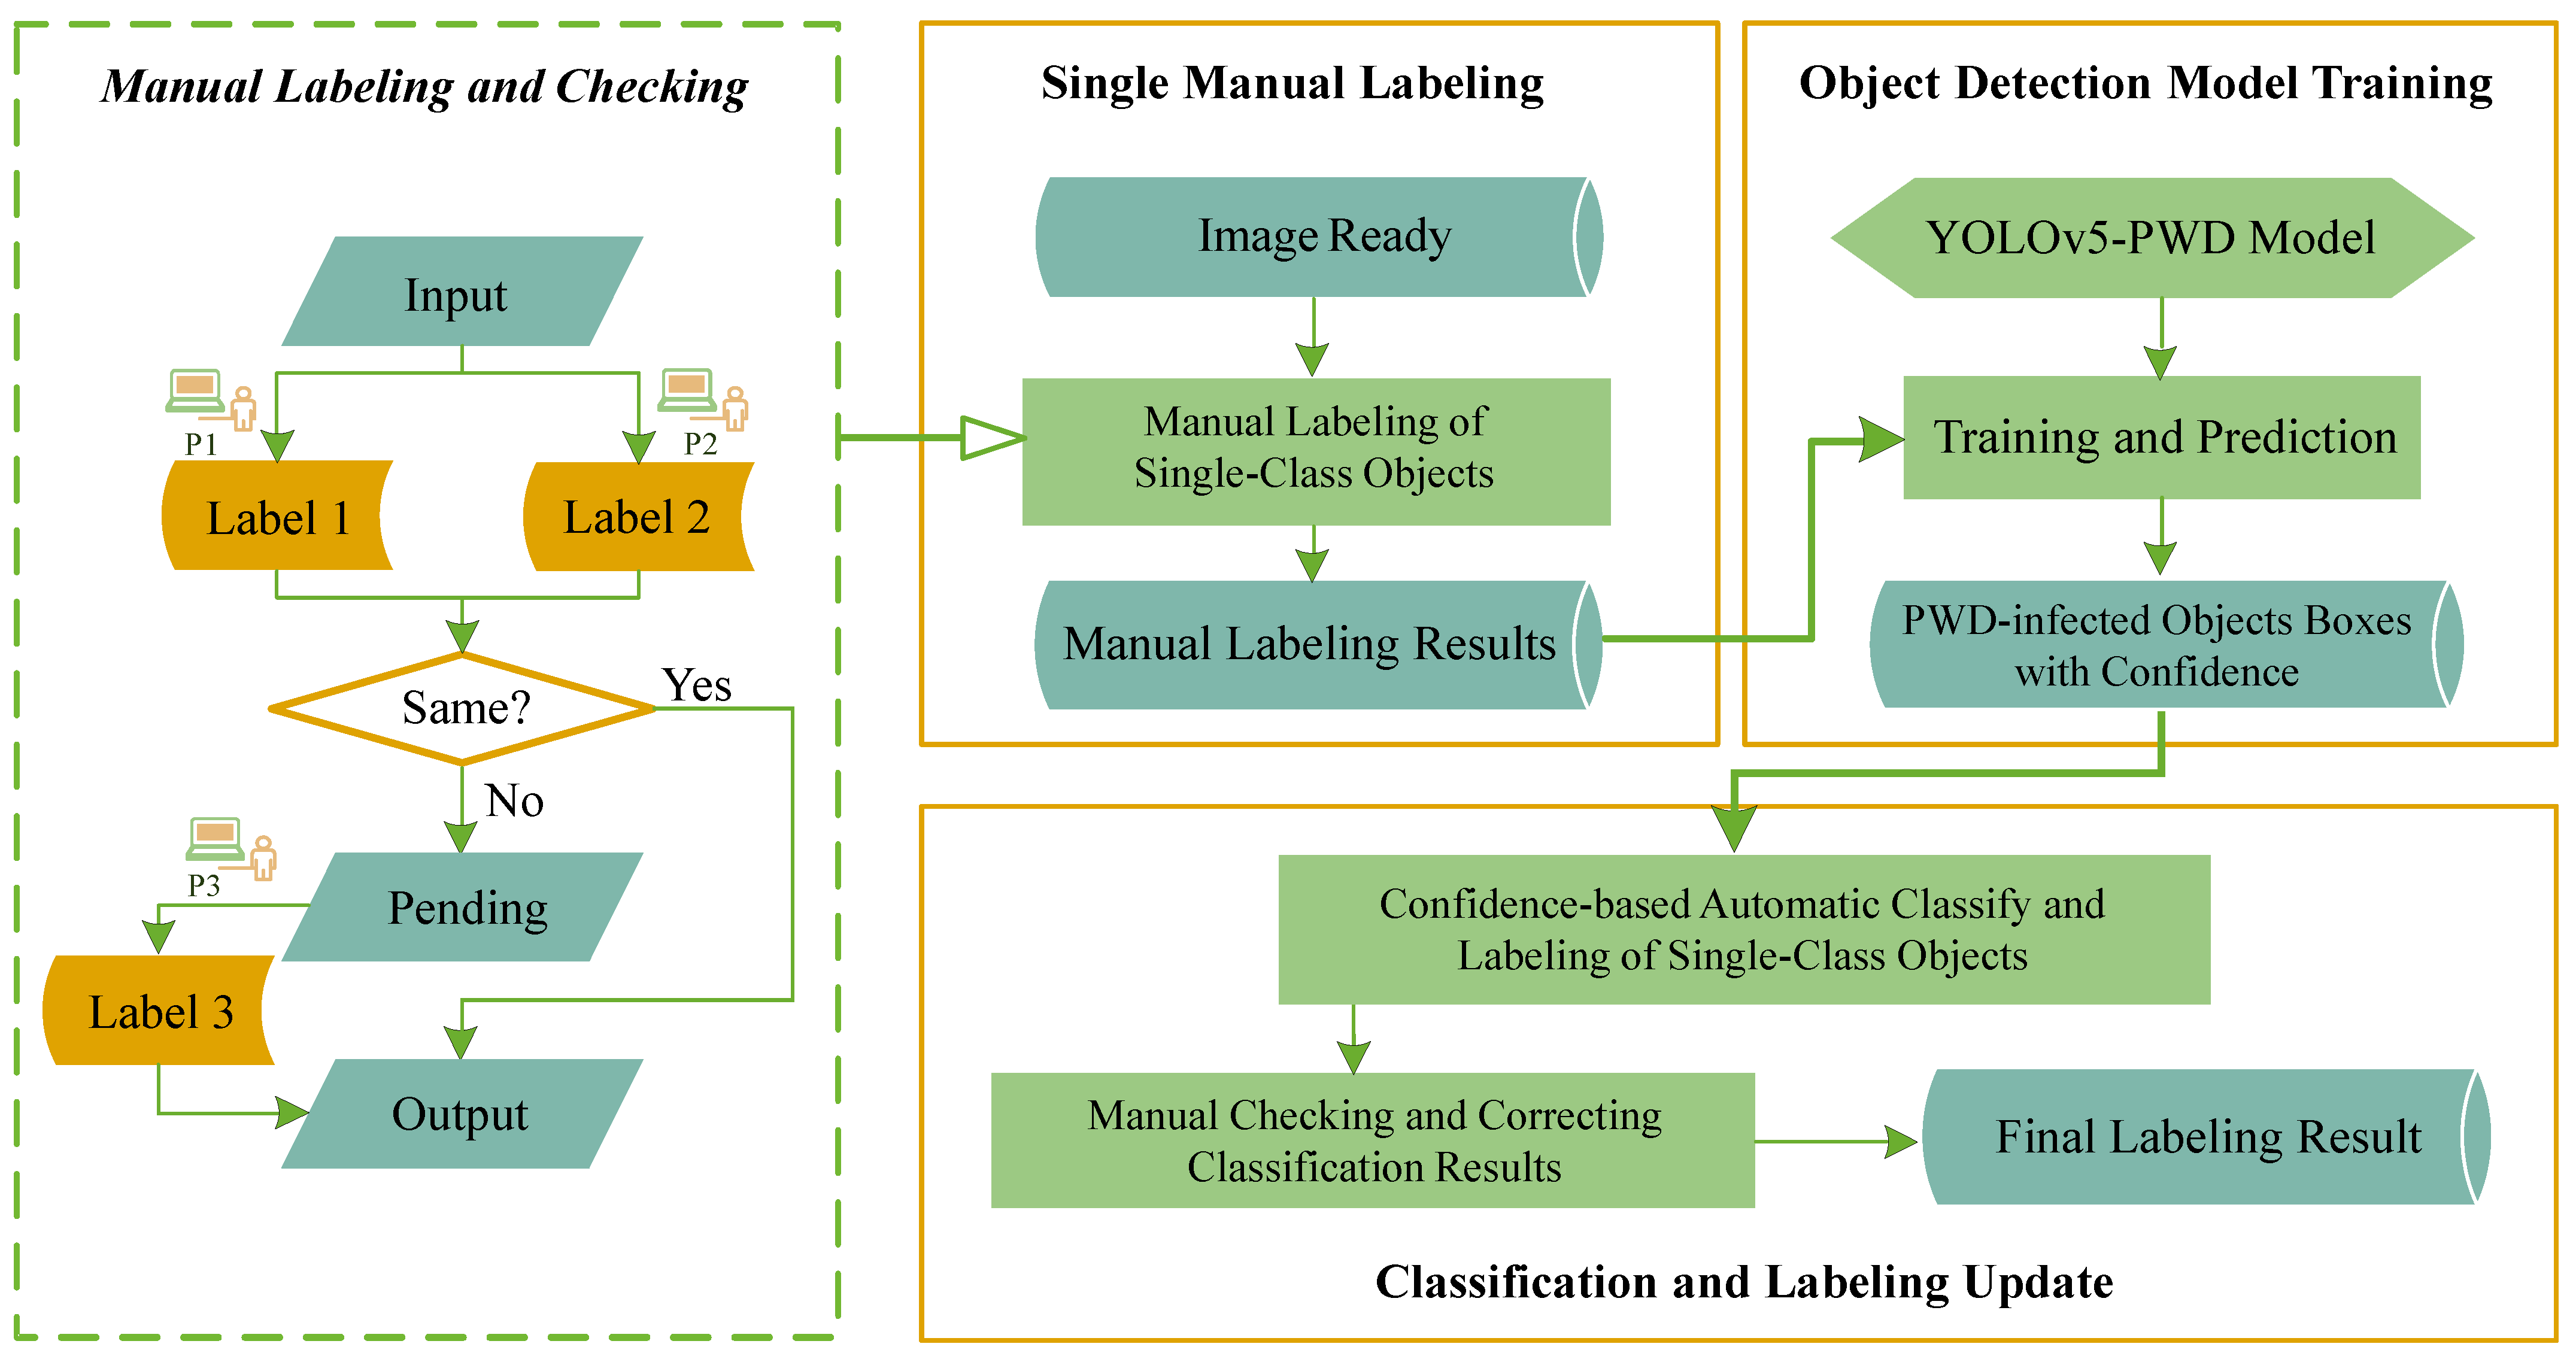
2.1.4. Object-Level Labeling
2.2. Methodology
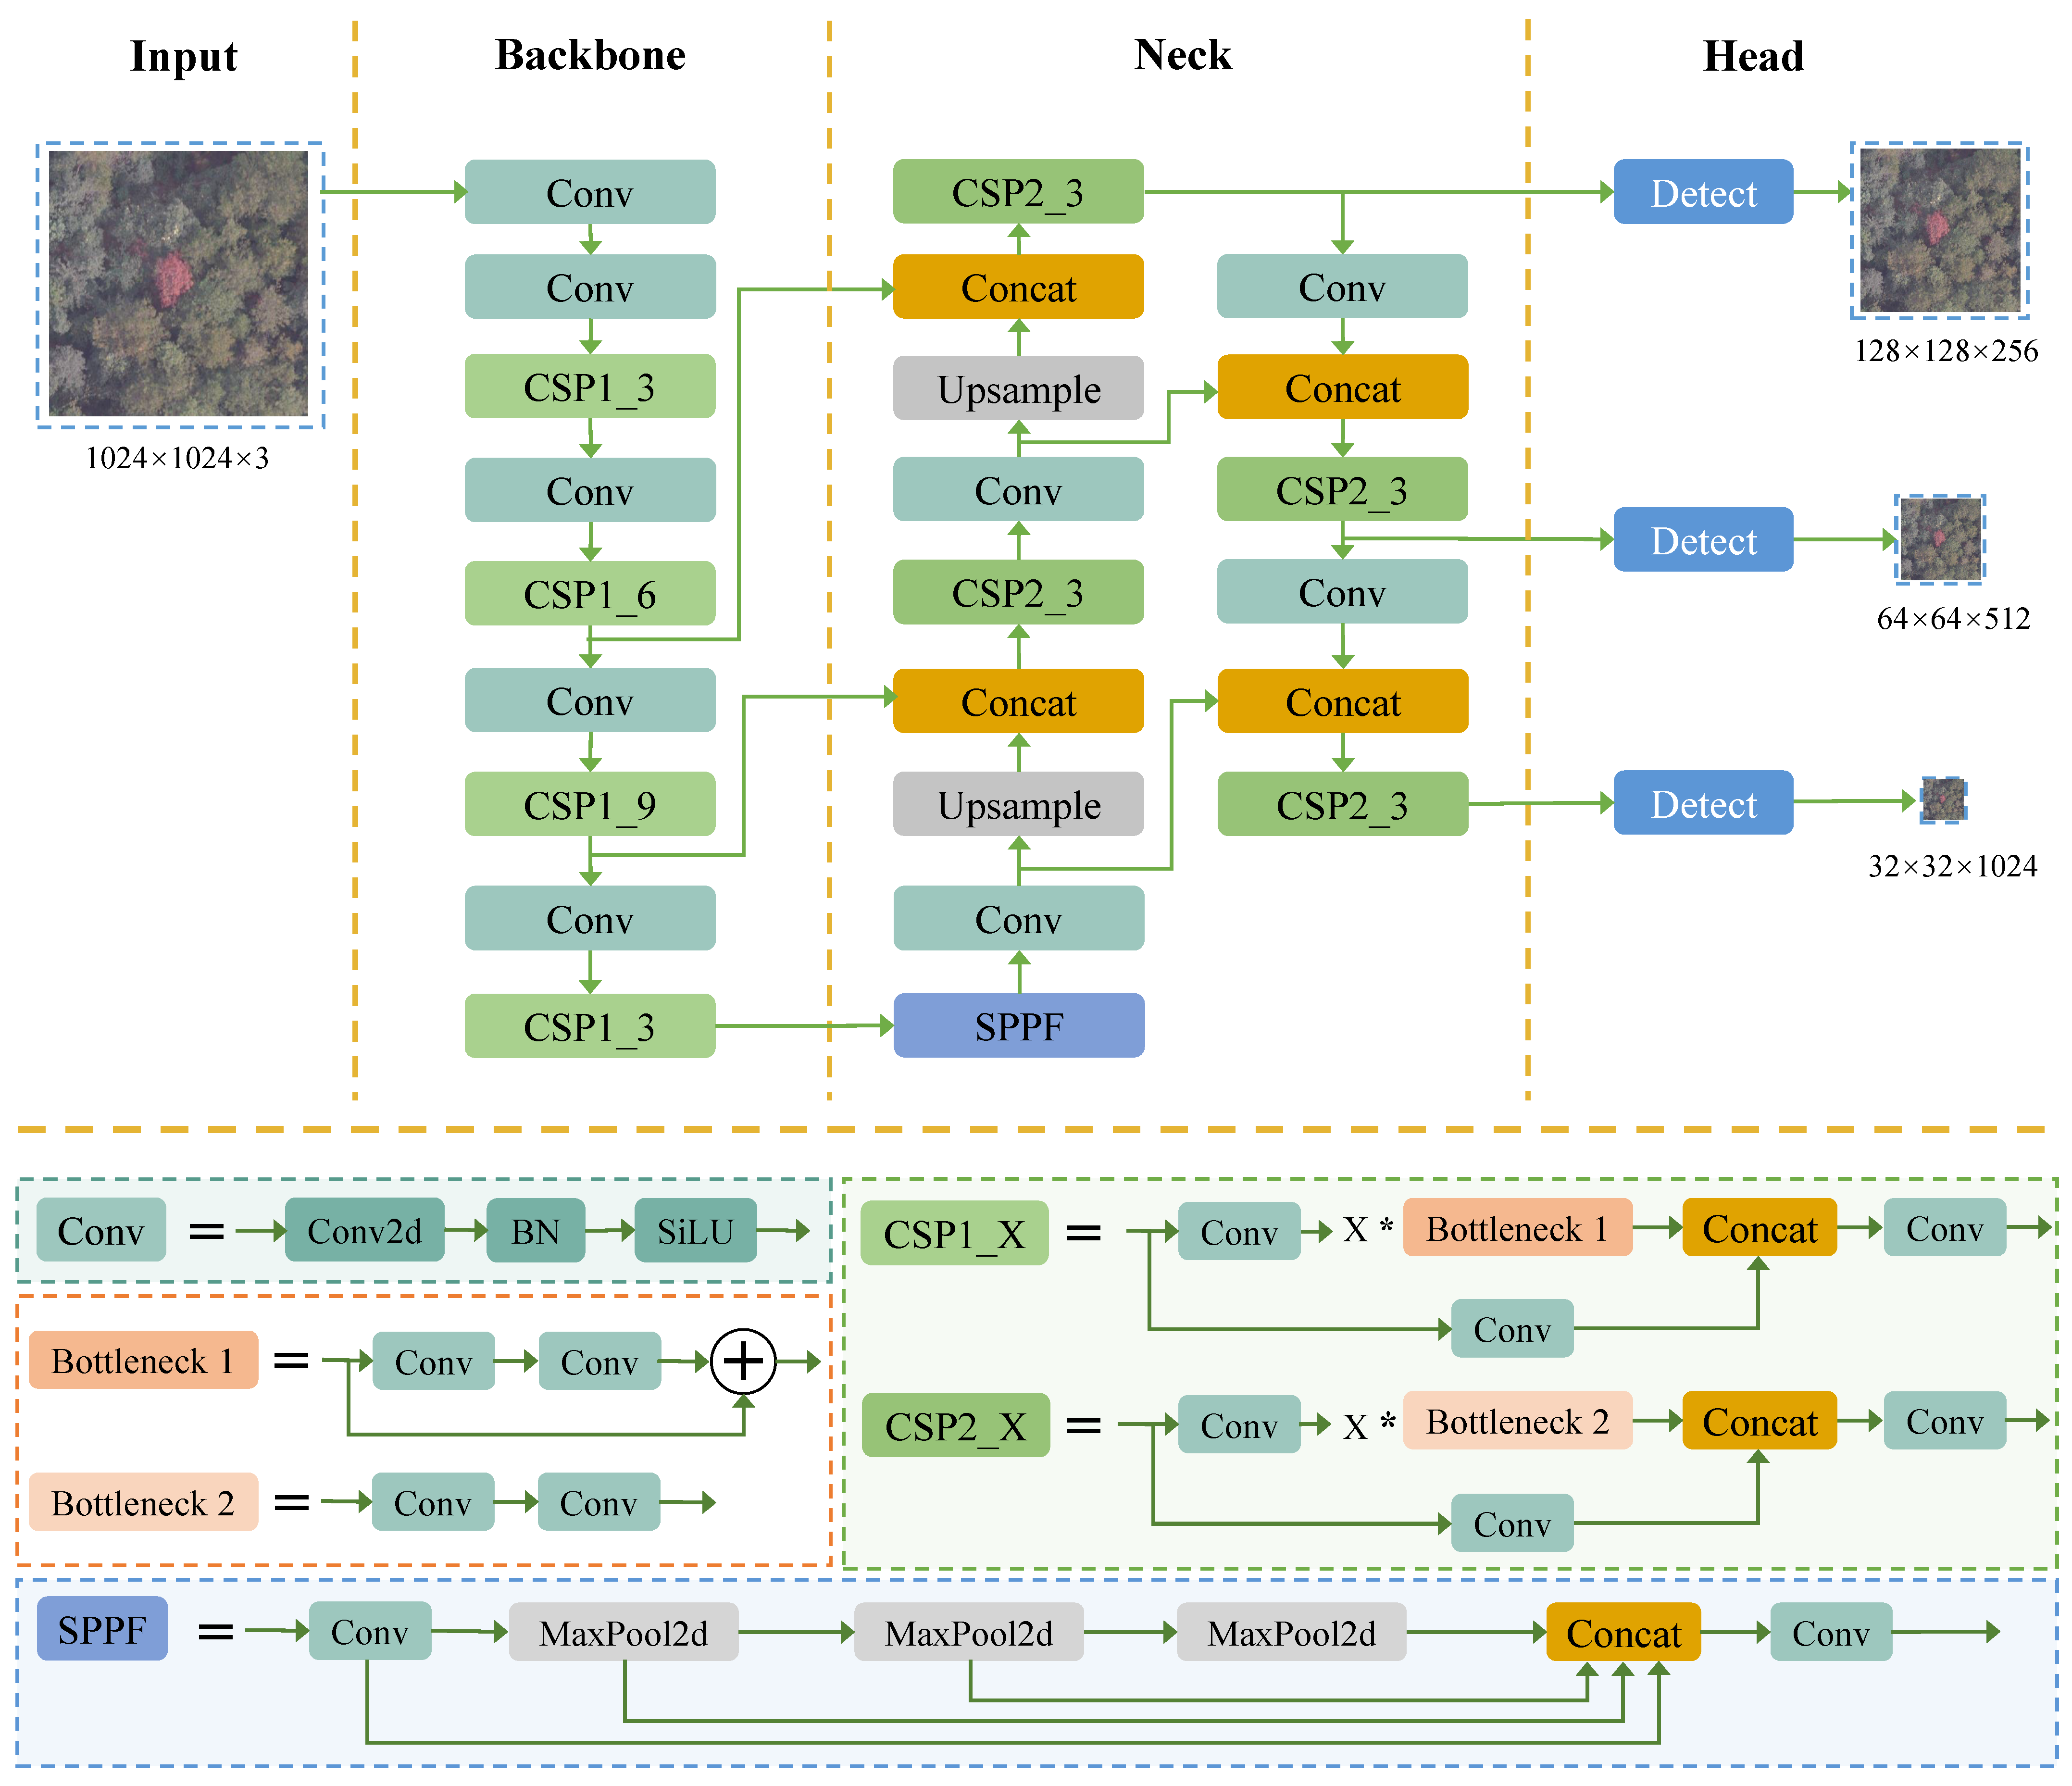
2.2.1. Yolov5-Pwd Detection Model
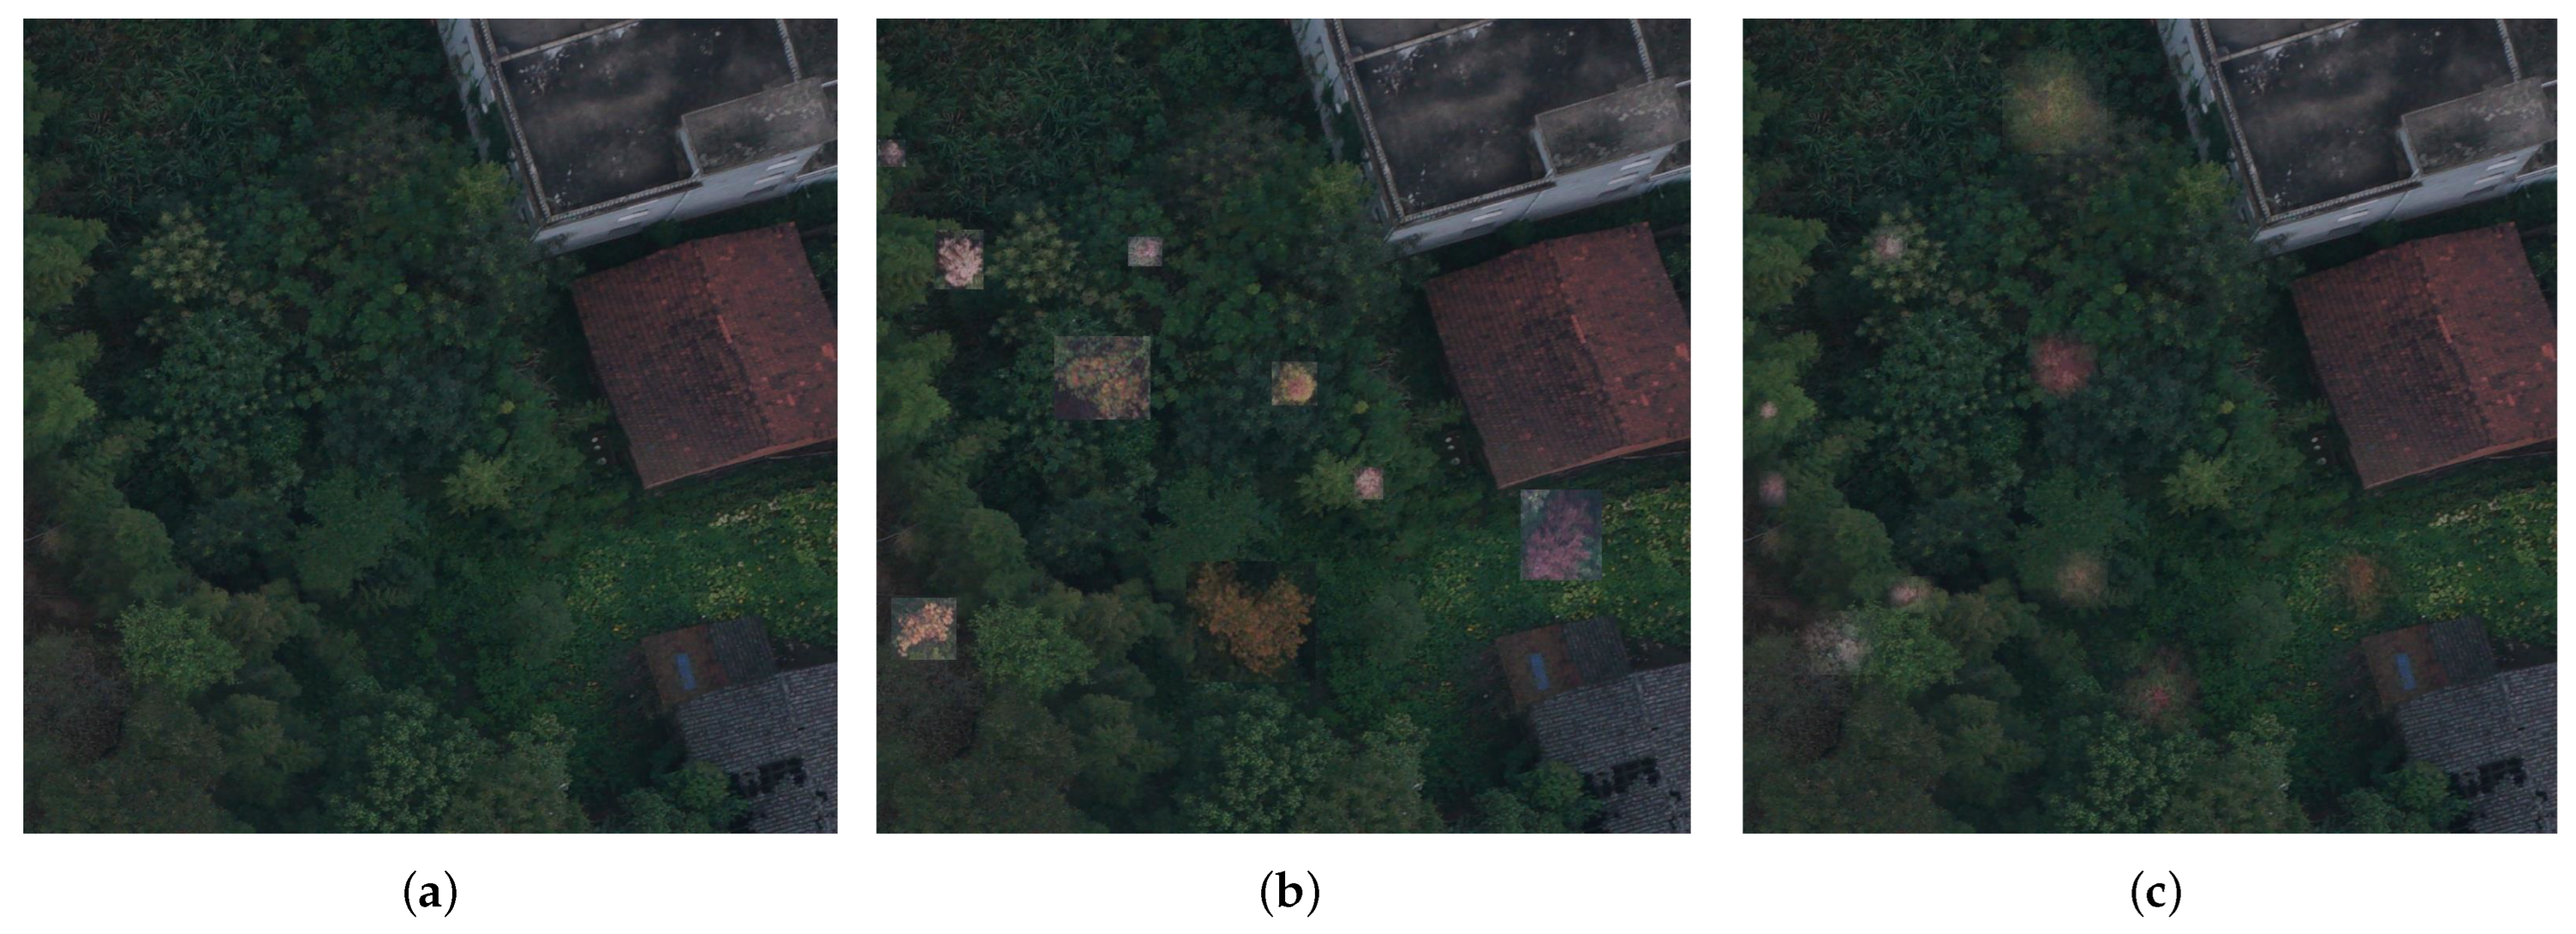
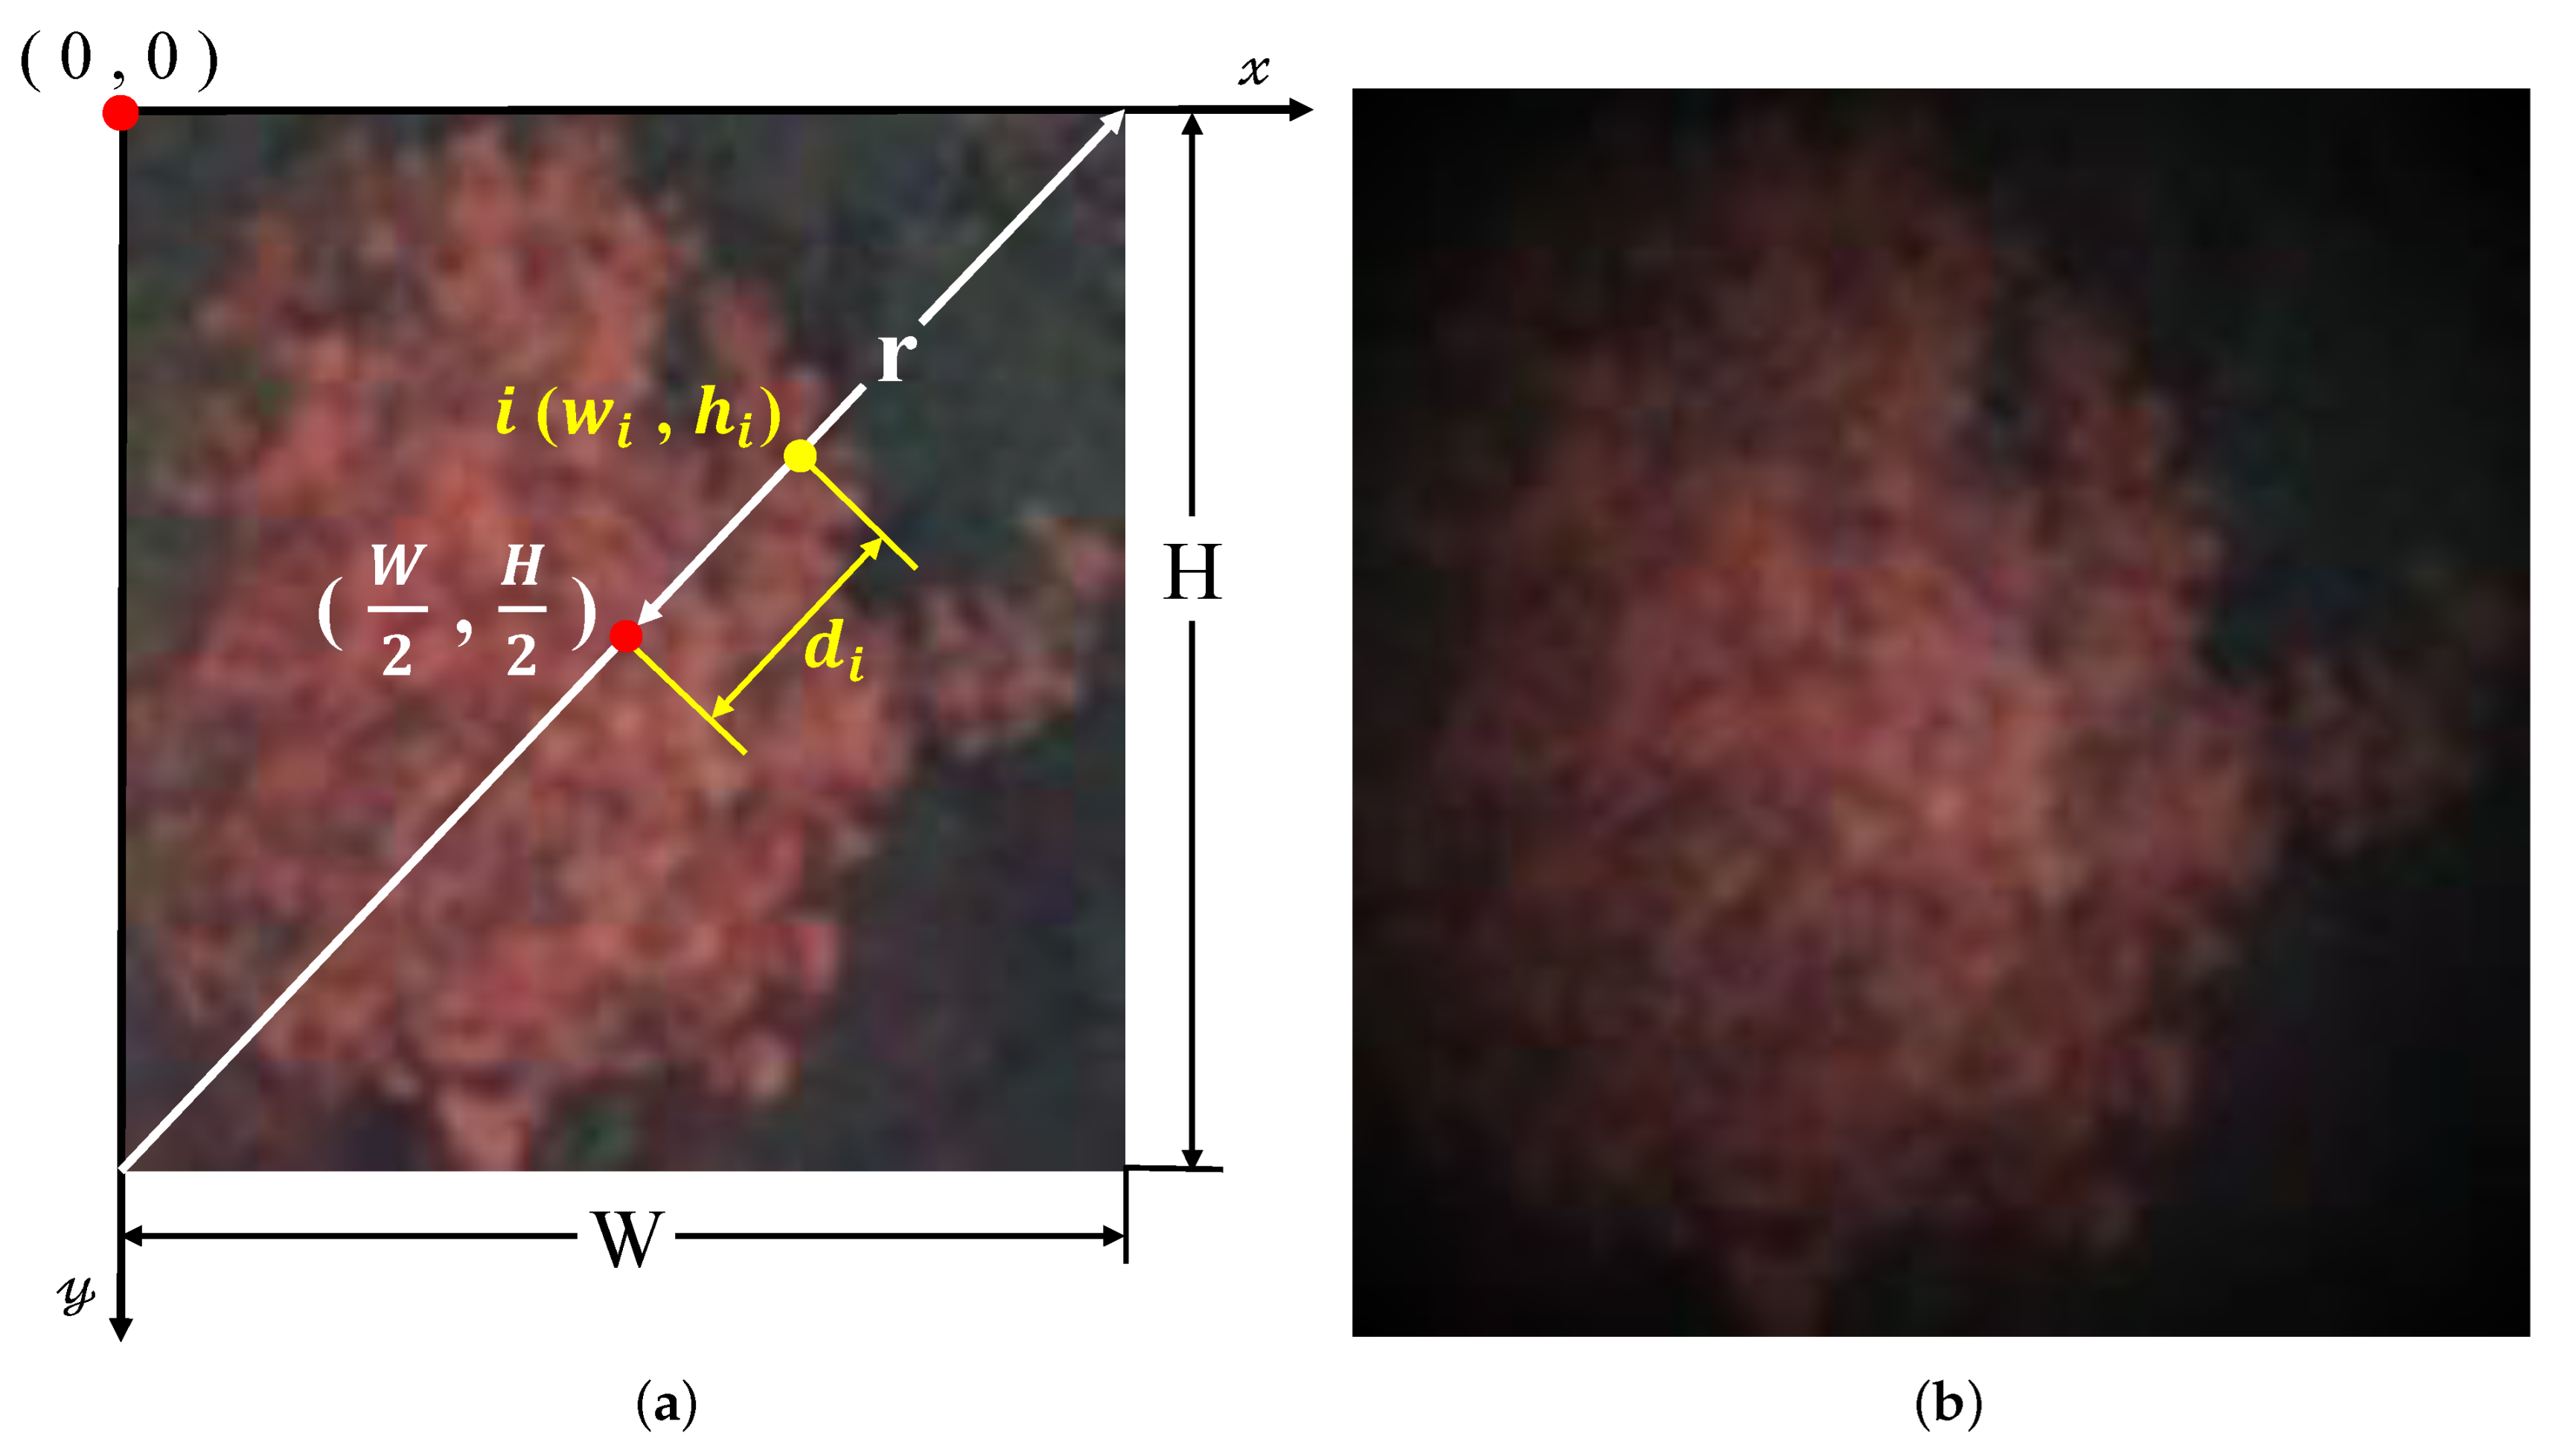
2.2.2. A Method for Synthesizing Samples Using Sentinel-2 Imagery to Augment UAV Image Data
2.3. Experiment Settings
2.3.1. Design of Experiments
2.3.2. Evaluation and Metrics
2.3.3. Experimental Settings
3. Results
3.1. Results of External Experiments
3.2. Results of Internal Experiments
4. Discussion
5. Conclusions
Author Contributions
Funding
Conflicts of Interest
References
- Li, H.; Xu, H.; Zheng, H.; Chen, X. Research on pine wood nematode surveillance technology based on unmanned aerial vehicle remote sensing image. J. Chin. Agric. Mech. 2020, 41, 170–175. [Google Scholar]
- Zhang, X.; Yang, H.; Cai, P.; Chen, G.; Li, X.; Zhu, K. Research progress on remote sensing monitoring of pine wilt disease. Trans. Chin. Soc. Agric. Eng. 2022, 38, 184–194. [Google Scholar]
- Huan, T.; Cunjun, L.; Cheng, C.; Liya, J.; Haitang, H. Progress in remote sensing monitoring for pine wilt disease induced tree mortality: A review. For. Res. 2020, 33, 172–183. [Google Scholar]
- Syifa, M.; Park, S.J.; Lee, C.W. Detection of the pine wilt disease tree candidates for drone remote sensing using artificial intelligence techniques. Engineering 2020, 6, 919–926. [Google Scholar] [CrossRef]
- Kim, S.R.; Lee, W.K.; Lim, C.H.; Kim, M.; Kafatos, M.C.; Lee, S.H.; Lee, S.S. Hyperspectral analysis of pine wilt disease to determine an optimal detection index. Forests 2018, 9, 115. [Google Scholar] [CrossRef]
- Yu, R.; Ren, L.; Luo, Y. Early detection of pine wilt disease in Pinus tabuliformis in North China using a field portable spectrometer and UAV-based hyperspectral imagery. For. Ecosyst. 2021, 8, 44. [Google Scholar] [CrossRef]
- Yu, R.; Luo, Y.; Zhou, Q.; Zhang, X.; Wu, D.; Ren, L. Early detection of pine wilt disease using deep learning algorithms and UAV-based multispectral imagery. For. Ecol. Manag. 2021, 497, 119493. [Google Scholar] [CrossRef]
- Yu, R.; Luo, Y.; Zhou, Q.; Zhang, X.; Wu, D.; Ren, L. A machine learning algorithm to detect pine wilt disease using UAV-based hyperspectral imagery and LiDAR data at the tree level. Int. J. Appl. Earth Obs. Geoinf. 2021, 101, 102363. [Google Scholar] [CrossRef]
- Zhang, Y.; Dian, Y.; Zhou, J.; Peng, S.; Hu, Y.; Hu, L.; Han, Z.; Fang, X.; Cui, H. Characterizing Spatial Patterns of Pine Wood Nematode Outbreaks in Subtropical Zone in China. Remote Sens. 2021, 13, 4682. [Google Scholar] [CrossRef]
- Zhou, H.; Yuan, X.; Zhou, H.; Shen, H.; Ma, L.; Sun, L.; Fang, G.; Sun, H. Surveillance of pine wilt disease by high resolution satellite. J. For. Res. 2022, 33, 1401–1408. [Google Scholar] [CrossRef]
- Zhou, Z.; Li, R.; Ben, Z.; He, B.; Shi, Y.; Dai, W. Automatic identification of Bursaphelenchus xylophilus from remote sensing images using residual network. J. For. Eng. 2022, 7, 185–191. [Google Scholar]
- Liu, S.; Wang, Q.; Tang, Q.; Liu, L.; He, H.; Lu, J.; Dai, X. High-resolution image identification of trees with pinewood nematode disease based on multi-feature extraction and deep learning of attention mechanism. J. For. Eng. 2022, 7, 177–184. [Google Scholar]
- Wu, B.; Liang, A.; Zhang, H.; Zhu, T.; Zou, Z.; Yang, D.; Tang, W.; Li, J.; Su, J. Application of conventional UAV-based high-throughput object detection to the early diagnosis of pine wilt disease by deep learning. For. Ecol. Manag. 2021, 486, 118986. [Google Scholar] [CrossRef]
- Li, F.; Liu, Z.; Shen, W.; Wang, Y.; Wang, Y.; Ge, C.; Sun, F.; Lan, P. A remote sensing and airborne edge-computing based detection system for pine wilt disease. IEEE Access 2021, 9, 66346–66360. [Google Scholar] [CrossRef]
- Park, H.G.; Yun, J.P.; Kim, M.Y.; Jeong, S.H. Multichannel Object Detection for Detecting Suspected Trees with Pine Wilt Disease Using Multispectral Drone Imagery. IEEE J. Sel. Top. Appl. Earth Obs. Remote Sens. 2021, 14, 8350–8358. [Google Scholar] [CrossRef]
- Xia, L.; Zhang, R.; Chen, L.; Li, L.; Yi, T.; Wen, Y.; Ding, C.; Xie, C. Evaluation of Deep Learning Segmentation Models for Detection of Pine Wilt Disease in Unmanned Aerial Vehicle Images. Remote Sens. 2021, 13, 3594. [Google Scholar] [CrossRef]
- Qin, J.; Wang, B.; Wu, Y.; Lu, Q.; Zhu, H. Identifying pine wood nematode disease using UAV images and deep learning algorithms. Remote Sens. 2021, 13, 162. [Google Scholar] [CrossRef]
- Yu, R.; Luo, Y.; Li, H.; Yang, L.; Huang, H.; Yu, L.; Ren, L. Three-Dimensional Convolutional Neural Network Model for Early Detection of Pine Wilt Disease Using UAV-Based Hyperspectral Images. Remote Sens. 2021, 13, 4065. [Google Scholar] [CrossRef]
- Huang, H.; Ma, X.; Hu, L.; Huang, Y.; Huang, H. The preliminary application of the combination of Fast R-CNN deep learning and UAV remote sensing in the monitoring of pine wilt disease. J. Environ. Entomol. 2021, 43, 1295–1303. [Google Scholar]
- Vollenweider, P.; Günthardt-Goerg, M.S. Diagnosis of abiotic and biotic stress factors using the visible symptoms in foliage. Environ. Pollut. 2005, 137, 455–465. [Google Scholar] [CrossRef]
- Liu, C.; Zhang, X.; Wang, T.; Chen, G.; Zhu, K.; Wang, Q.; Wang, J. Detection of vegetation coverage changes in the Yellow River Basin from 2003 to 2020. Ecol. Indic. 2022, 138, 108818. [Google Scholar] [CrossRef]
- Zhang, X.; Chen, G.; Wang, W.; Wang, Q.; Dai, F. Object-based land-cover supervised classification for very-high-resolution UAV images using stacked denoising autoencoders. IEEE J. Sel. Top. Appl. Earth Obs. Remote Sens. 2017, 10, 3373–3385. [Google Scholar] [CrossRef]
- Zhang, X.; Tan, X.; Chen, G.; Zhu, K.; Liao, P.; Wang, T. Object-based classification framework of remote sensing images with graph convolutional networks. IEEE Geosci. Remote Sens. Lett. 2021, 19, 1–5. [Google Scholar] [CrossRef]
- Xu, X.; Tao, H.; Li, C.; Cheng, C.; Guo, H.; Zhou, J. Detection and Location of Pine Wilt Disease Induced Dead Pine Trees Based on Faster R-CNN. Trans. Chin. Soc. Agric. Mach. 2020, 51, 228–236. [Google Scholar]
- Jincang, L.; Chengbo, W.; Yuanfei, C. Monitoring method of bursaphelenchus xylophilus based on multi-feature CRF by UAV image. Bull. Surv. Mapp. 2019, 25, 78. [Google Scholar] [CrossRef]
- You, J.; Zhang, R.; Lee, J. A Deep Learning-Based Generalized System for Detecting Pine Wilt Disease Using RGB-Based UAV Images. Remote Sens. 2021, 14, 150. [Google Scholar] [CrossRef]
- Girshick, R.; Donahue, J.; Darrell, T.; Malik, J. Rich feature hierarchies for accurate object detection and semantic segmentation. In Proceedings of the IEEE Conference on Computer Vision and Pattern Recognition, Washington, DC, USA, 23–28 June 2014; pp. 580–587. [Google Scholar]
- Girshick, R. Fast r-cnn. In Proceedings of the IEEE International Conference on Computer Vision, Santiago, Chile, 7–13 December 2015; pp. 1440–1448. [Google Scholar]
- Ren, S.; He, K.; Girshick, R.; Sun, J. Faster r-cnn: Towards real-time object detection with region proposal networks. In Proceedings of the Advances in Neural Information Processing Systems, Montreal, QC, Canada, 7–12 December 2015; Volume 28. [Google Scholar]
- Redmon, J.; Divvala, S.; Girshick, R.; Farhadi, A. You only look once: Unified, real-time object detection. In Proceedings of the IEEE Conference on Computer Vision and Pattern Recognition, Las Vegas, NV, USA, 26 June–1 July 2016; pp. 779–788. [Google Scholar]
- Liu, W.; Anguelov, D.; Erhan, D.; Szegedy, C.; Reed, S.; Fu, C.; Berg, A.C. SSD: Single shot multibox detector. In Proceedings of the Computer Vision–ECCV 2016: 14th European Conference, Amsterdam, The Netherlands, 11–14 October 2016; pp. 21–37. [Google Scholar]
- Zhang, X.; Zhu, K.; Chen, G.; Tan, X.; Zhang, L.; Dai, F.; Liao, P.; Gong, Y. Geospatial object detection on high resolution remote sensing imagery based on double multi-scale feature pyramid network. Remote Sens. 2019, 11, 755. [Google Scholar] [CrossRef]
- Li, F.; Shen, W.; Wu, J.; Sun, F.; Xu, L.; Liu, Z.; Lan, P. Study on the Detection Method for Pinewood Wilt Disease Tree Based on YOLOv3-CloU. J. Shandong Agric. Univ. 2021, 52, 224–233. [Google Scholar]
- Huang, L.; Wang, Y.; Xu, Q.; Liu, Q. Recognition of abnormally discolored trees caused by pine wilt disease using YOLO algorithm and UAV images. Trans. Chin. Soc. Agric. Eng 2021, 37, 197–203. [Google Scholar]
- Chen, W.; Huihui, Z.; Jiwang, L.; Shuai, Z. Object Detection to the Pine Trees Affected by Pine Wilt Disease in Remote Sensing Images Using Deep Learning. J. Nanjing Norm. Univ 2021, 44, 84–89. [Google Scholar]
- Xu, H.; Luo, Y.; Zhang, Q. Changes in water content, pigments and antioxidant enzyme activities in pine needles of Pinus thunbergii and Pinus massoniana affected by pine wood nematode. Sci. Silvae Sin. 2012, 48, 140–143. [Google Scholar]
- dos Santos, C.S.S.; de Vasconcelos, M.W. Identification of genes differentially expressed in Pinus pinaster and Pinus pinea after infection with the pine wood nematode. Eur. J. Plant Pathol. 2012, 132, 407–418. [Google Scholar] [CrossRef]
- Xu, H.; Luo, Y.; Zhang, T.; Shi, Y. Changes of reflectance spectra of pine needles in different stage after being infected by pine wood nematode. Spectrosc. Spectr. Anal. 2011, 31, 1352–1356. [Google Scholar]
- Zhang, Y.; Ren, W.; Zhang, Z.; Jia, Z.; Wang, L.; Tan, T. Focal and efficient IOU loss for accurate bounding box regression. Neurocomputing 2022, 506, 146–157. [Google Scholar] [CrossRef]
- Jocher, G. YOLOv5 by Ultralytics. 2020. Available online: https://doi.org/10.5281/zenodo.3908559 (accessed on 1 April 2023).
- Redmon, J.; Farhadi, A. YOLO9000: Better, faster, stronger. In Proceedings of the IEEE Conference on Computer Vision and Pattern Recognition, Honolulu, HI, USA, 21–26 July 2017; pp. 7263–7271. [Google Scholar]
- Wang, C.Y.; Liao, H.Y.M.; Wu, Y.H.; Chen, P.Y.; Hsieh, J.W.; Yeh, I.H. CSPNet: A new backbone that can enhance learning capability of CNN. In Proceedings of the IEEE/CVF Conference on Computer Vision and Pattern Recognition Workshops, Seattle, WA, USA, 14–19 June 2020; pp. 390–391. [Google Scholar]
- Lin, T.Y.; Dollár, P.; Girshick, R.; He, K.; Hariharan, B.; Belongie, S. Feature pyramid networks for object detection. In Proceedings of the IEEE Conference on Computer Vision and Pattern Recognition, Honolulu, HI, USA, 21–26 July 2017; pp. 2117–2125. [Google Scholar]
- Liu, S.; Qi, L.; Qin, H.; Shi, J.; Jia, J. Path aggregation network for instance segmentation. In Proceedings of the IEEE Conference on Computer Vision and Pattern Recognition, Salt Lake City, UT, USA, 18–23 June 2018; pp. 8759–8768. [Google Scholar]
- He, K.; Zhang, X.; Ren, S.; Sun, J. Spatial pyramid pooling in deep convolutional networks for visual recognition. IEEE Trans. Pattern Anal. Mach. Intell. 2015, 37, 1904–1916. [Google Scholar] [CrossRef]
- Zheng, Z.; Wang, P.; Liu, W.; Li, J.; Ye, R.; Ren, D. Distance-IoU loss: Faster and better learning for bounding box regression. In Proceedings of the AAAI Conference on Artificial Intelligence, New York, NY, USA, 7–12 February 2020; Volume 34, pp. 12993–13000. [Google Scholar]
- Zhu, K.; Zhang, X.; Chen, G.; Li, X.; Cai, P.; Liao, P.; Wang, T. Multi-Oriented Rotation-Equivariant Network for Object Detection on Remote Sensing Images. IEEE Geosci. Remote Sens. Lett. 2022, 19, 1–5. [Google Scholar] [CrossRef]
- Chen, K.; Wang, J.; Pang, J.; Cao, Y.; Xiong, Y.; Li, X.; Sun, S.; Feng, W.; Liu, Z.; Xu, J.; et al. MMDetection: Open MMLab Detection Toolbox and Benchmark. arXiv 2019, arXiv:1906.07155. [Google Scholar]
- Van der Maaten, L.; Hinton, G. Visualizing Data using t-SNE. J. Mach. Learn. Res. 2008, 9, 2579–2605. [Google Scholar]


| Model | Middle-Stage AP | Late-Stage AP | mAP@0.5 | FPS |
|---|---|---|---|---|
| Faster R-CNN | 43.8% | 74.0% | 58.9% | 7.35 |
| DetectoRS Cascade RCNN | 44.5% | 74.1% | 59.3% | 5.41 |
| RetinaNet | 37.8% | 72.4% | 55.1% | 12.20 |
| Cascade RCNN | 43.5% | 74.2% | 58.8% | 10.99 |
| YOLOv5 | 57.4% | 84.4% | 70.9% | 12.20 |
| YOLOv5-PWD | 59.4% | 84.8% | 72.1% | 11.49 |
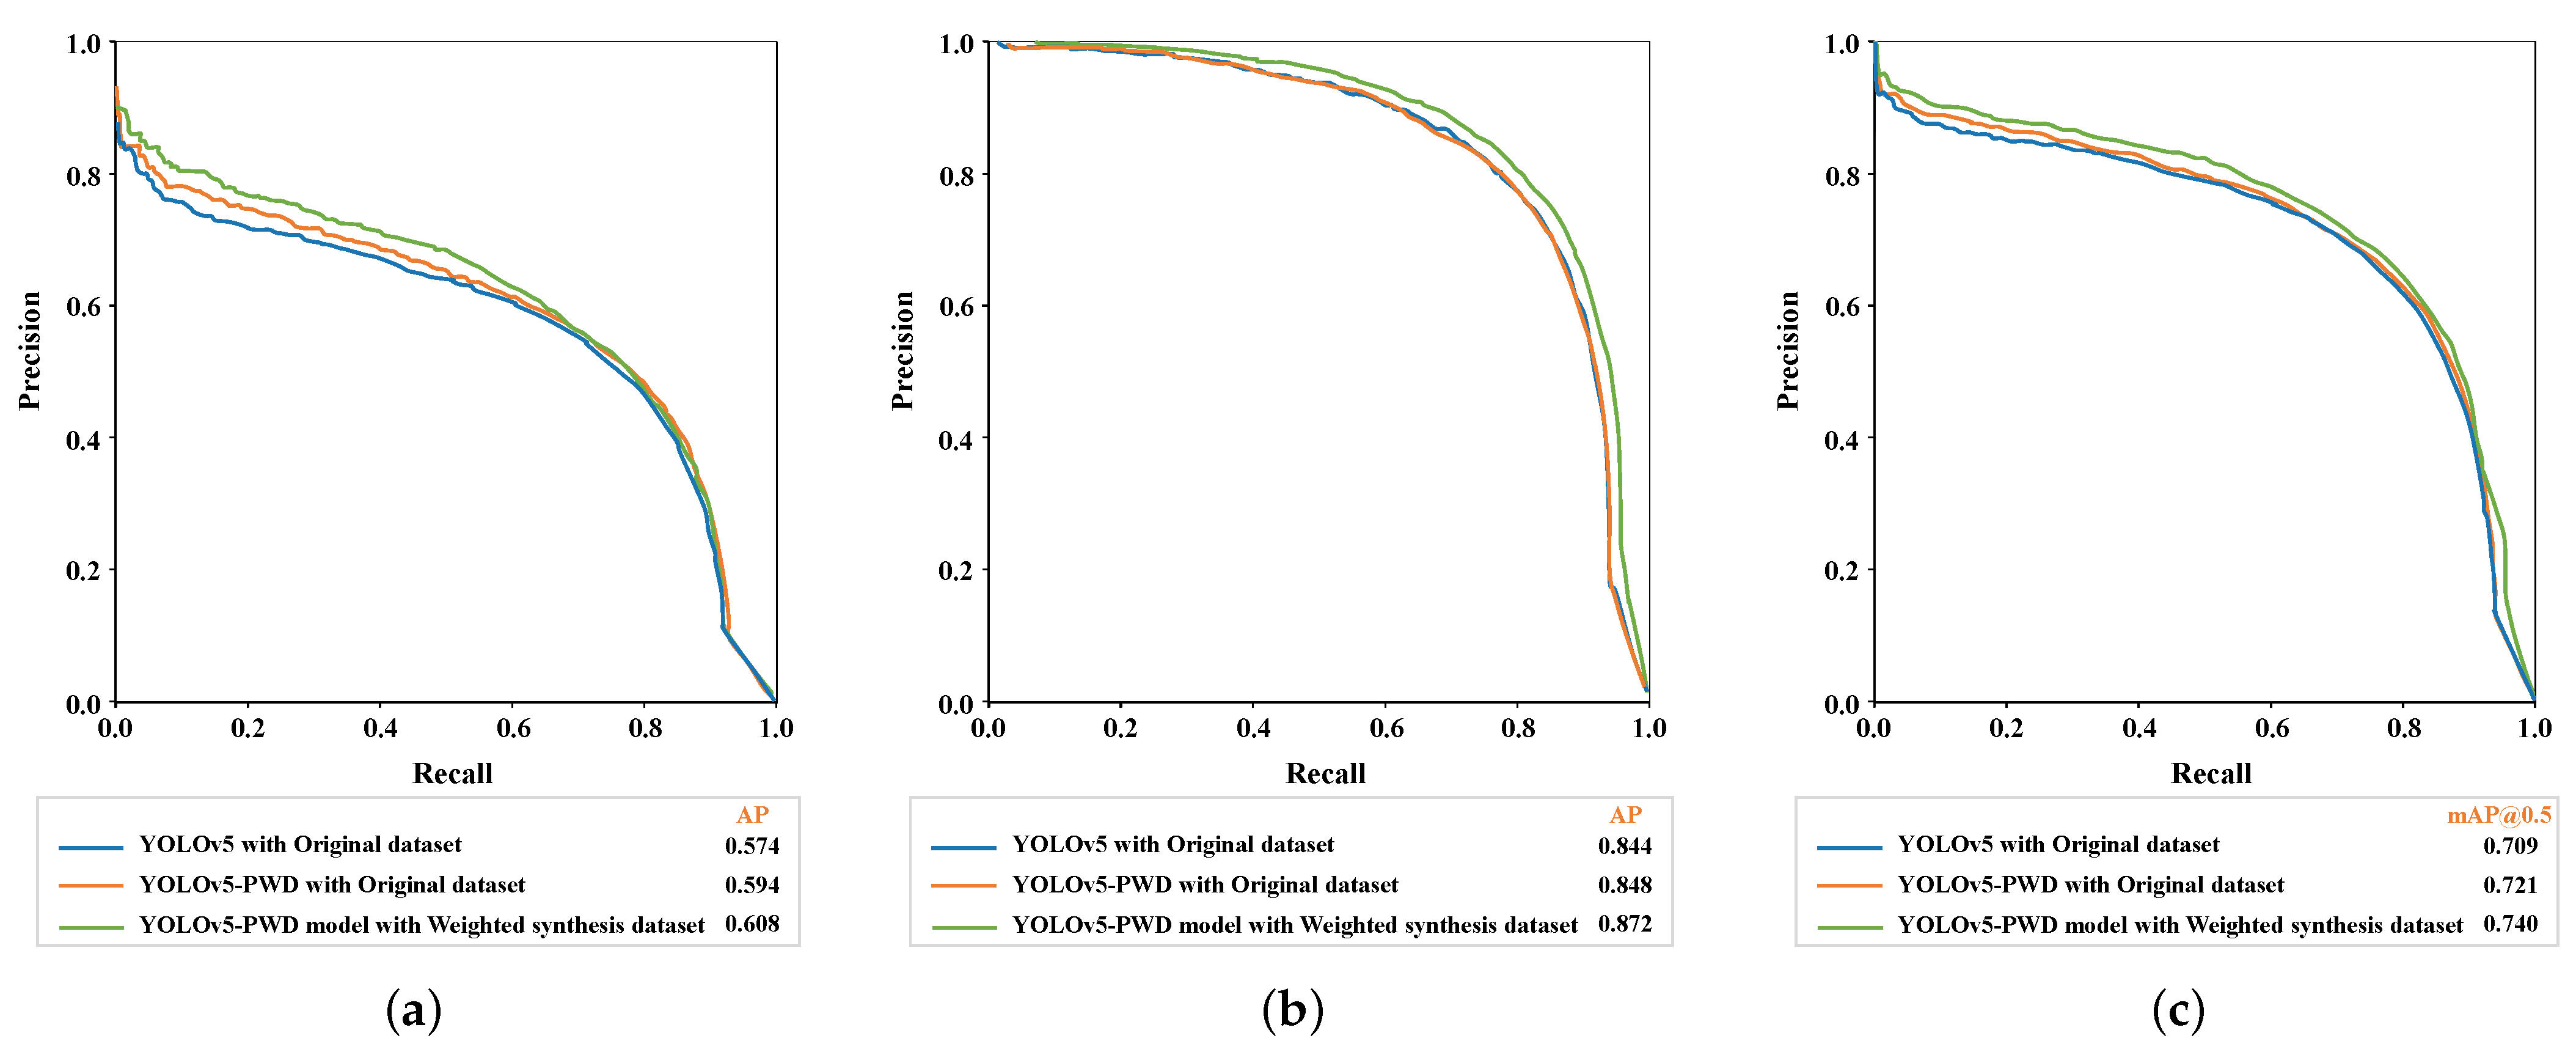
| Middle-Stage AP (%) | Late-Stage AP (%) | mAP@0.5 (%) | |||||
|---|---|---|---|---|---|---|---|
| Training Set | Number of Images | YOLOv5 | YOLOv5-PWD | YOLOv5 | YOLOv5-PWD | YOLOv5 | YOLOv5-PWD |
| Original | 889 | 57.4 | 59.4 | 84.4 | 84.8 | 70.9 | 72.1 |
| General synthesis | 5480 | 57.9 | 59.6 | 84.6 | 85.8 | 71.2 | 72.7 |
| Direct synthesis | 5471 | 59.1 | 60.4 | 85.6 | 86.5 | 72.3 | 73.5 |
| Weighted synthesis | 5470 | 59.7 | 60.8 | 86.6 | 87.2 | 73.1 | 74.0 |
Disclaimer/Publisher’s Note: The statements, opinions and data contained in all publications are solely those of the individual author(s) and contributor(s) and not of MDPI and/or the editor(s). MDPI and/or the editor(s) disclaim responsibility for any injury to people or property resulting from any ideas, methods, instructions or products referred to in the content. |
© 2023 by the authors. Licensee MDPI, Basel, Switzerland. This article is an open access article distributed under the terms and conditions of the Creative Commons Attribution (CC BY) license (https://creativecommons.org/licenses/by/4.0/).
Share and Cite
Cai, P.; Chen, G.; Yang, H.; Li, X.; Zhu, K.; Wang, T.; Liao, P.; Han, M.; Gong, Y.; Wang, Q.; et al. Detecting Individual Plants Infected with Pine Wilt Disease Using Drones and Satellite Imagery: A Case Study in Xianning, China. Remote Sens. 2023, 15, 2671. https://doi.org/10.3390/rs15102671
Cai P, Chen G, Yang H, Li X, Zhu K, Wang T, Liao P, Han M, Gong Y, Wang Q, et al. Detecting Individual Plants Infected with Pine Wilt Disease Using Drones and Satellite Imagery: A Case Study in Xianning, China. Remote Sensing. 2023; 15(10):2671. https://doi.org/10.3390/rs15102671
Chicago/Turabian StyleCai, Peihua, Guanzhou Chen, Haobo Yang, Xianwei Li, Kun Zhu, Tong Wang, Puyun Liao, Mengdi Han, Yuanfu Gong, Qing Wang, and et al. 2023. "Detecting Individual Plants Infected with Pine Wilt Disease Using Drones and Satellite Imagery: A Case Study in Xianning, China" Remote Sensing 15, no. 10: 2671. https://doi.org/10.3390/rs15102671