Article

Ionospheric Perturbations Due to Large Thunderstorms and the Resulting Mechanical and Acoustic Signatures

1
Key Laboratory for Middle Atmosphere and Global Environment Observation (LAGEO), Institute of Atmospheric Physics (IAP), Chinese Academy of Sciences, Beijing 100029, China
2
Department of Physics, Federal University of Technology, Akure 340252, Nigeria
3
College of Earth and Planetary Sciences, University of Chinese Academy of Sciences, Beijing 100049, China
4
Space and Atmospheric Science Division, North Eastern Space Applications Centre, Umiam 793103, India
5
Department of Physics, Federal University Oye Ekiti, Oye 370111, Nigeria
6
Geophysical Institute, University of Alaska, Fairbanks, AK 99775, USA
*
Author to whom correspondence should be addressed.
Remote Sens. 2023, 15(10), 2572; https://doi.org/10.3390/rs15102572
Submission received: 24 February 2023 / Revised: 4 May 2023 / Accepted: 11 May 2023 / Published: 15 May 2023
(This article belongs to the Special Issue Satellite Observations of the Global Ionosphere and Plasma Dynamics)

Abstract

:
Perturbations from thunderstorms can play a notable role in the dynamics of the ionosphere. In this work, ionospheric perturbation effects due to thunderstorms were extracted and studied. Thunderstorm-associated lightning activities and their locations were detected by the World-Wide Lightning Location Network (WWLLN). The mechanical components of ionospheric perturbations due to thunderstorms were extracted from the total electron content (TEC), which was measured at selected thunderstorm locations using the polynomial filtering method. Further analyses were conducted using wavelet analysis and Discrete Fourier Transform (DFT) to study the frequency modes and periodicities of TEC deviation. It was revealed that the highest magnitudes of TEC deviations could reach up to ~2.2 TECUs, with dominant modes of frequency in the range of ~0.2 mHz to ~1.2 mHz, falling within the gravity wave range and the second dominant mode in the acoustic range of >1 mHz to <7.5 mHz. Additionally, a 20–60 min time delay was observed between the sprite events, the other high-energy electrical discharges, and the time of occurrence at the highest peak of acoustic-gravity wave perturbations extracted from TEC deviations. The possible mechanism responsible for this phenomenon is further proposed and discussed.

1. Introduction

The effect of thunderstorms on the ionosphere is one of the most important gateways to understanding the influence of the tropospheric/lower atmosphere on the ionosphere. The effect of thunderstorms on the ionosphere is an aspect of the study that has attracted attention in recent times [1,2,3,4,5,6,7]. The thunderstorm, which comprises both a mechanical component and the electrical component, has been described as impacting ionospheric dynamics in diverse ways [6,7,8,9,10,11]. The effect of the two mentioned components has been revealed to appear on the ionosphere in various ways. However, to understand the total effect of thunderstorms on the dynamics of the ionosphere, it is important to study the components of the ionosphere as an open dynamic system that respond to external influence in different ways. According to findings from previous works [5,12,13,14,15], the ionosphere is influenced by the electrical components of thunderstorms, such as lightning and Transient Luminous Events (TLEs).
The electromagnetic components of thunderstorms (lightning and TLEs) have been reported to have an impact on the ionosphere in various ways. The effects of lightning have been reported to include D-layer heating and E-layer perturbations. Evidence from previous works has revealed the heating effect of thunderstorms’ quasi-electrostatic fields on the D-layer [11,12,15], particularly the direct heating effects of electromagnetic energy from lightning pulses on the D-layer [11,12]. Additionally, modeling the results of ionospheric perturbations and attempting to describe the thunderstorm-induced heating of the lower ionosphere can be correlated with the experimental results [1,8]. Electromagnetic pulses have been inferred to produce intense ionospheric perturbations during thunderstorms and lightning events [16]. The simultaneous effect of a vertical electrical discharge and atmospheric gravity waves (AGW) have been inferred to perturb the E-layer [17]. TLEs such as sprites and gigantic jets, which are associated in most cases with stratiform regions and extremely high energy lightning occurrences [18,19,20,21], have been reported to influence the background dynamics of the ionosphere by creating perturbations in a localized system of the ionosphere [22,23].
Investigations have shown the impact of acoustic and gravity waves resulting from the convective region of thunderstorms. An initial study on the influence of thunderstorms on the ionospheric total electron content (TEC) revealed responsive TEC deviations based on associated gravity wave effects [2,3,4,11]. Ogunsua et al. (2020) showed significant daytime TEC perturbations with notable gravity wave effects during equatorial thunderstorms [11]. The observed perturbation effect of thunderstorm-associated gravity waves was found to modify the ionosphere above the region of the thunderstorm occurrence during the day, while the nighttime gravity wave was invisible due to the irregularities of the equatorial ionosphere [11].
In this work, a further step was taken to consider the various contributions of these components during thunderstorms and to consider the temporal variation in the different components as they impact the ionosphere. It is also important to consider the possible lag between the components at their highest peaks of impact and the distinct aspects of the ionosphere when affected by each component. It is also important to understand the effect of thunderstorms on the ionospheric TEC around the Northeastern China/Yellow Sea region (see Figure 1) in comparison with other regions of the Globe, which could be seen from previous works [2,3,4,9,11]. A further investigation into the understanding of the midlatitude ionospheric responses to thunderstorms is important, considering a recent finding by Ogunsua et al. (2020) that thunderstorm-associated gravity wave signatures are invisible in ionospheric variations during nocturnal thunderstorms due to nighttime equatorial irregularities, which contradicts the findings of Lay et al., (2013, 2015) [5,9]. New results obtained from this work provide a clearer insight into the difference between low latitude/equatorial ionospheric responses to thunderstorm effects compared to midlatitude ionospheric responses. These results will also provide additional information for the modeling of ionospheric responses to thunderstorms.

2. Materials and Methods
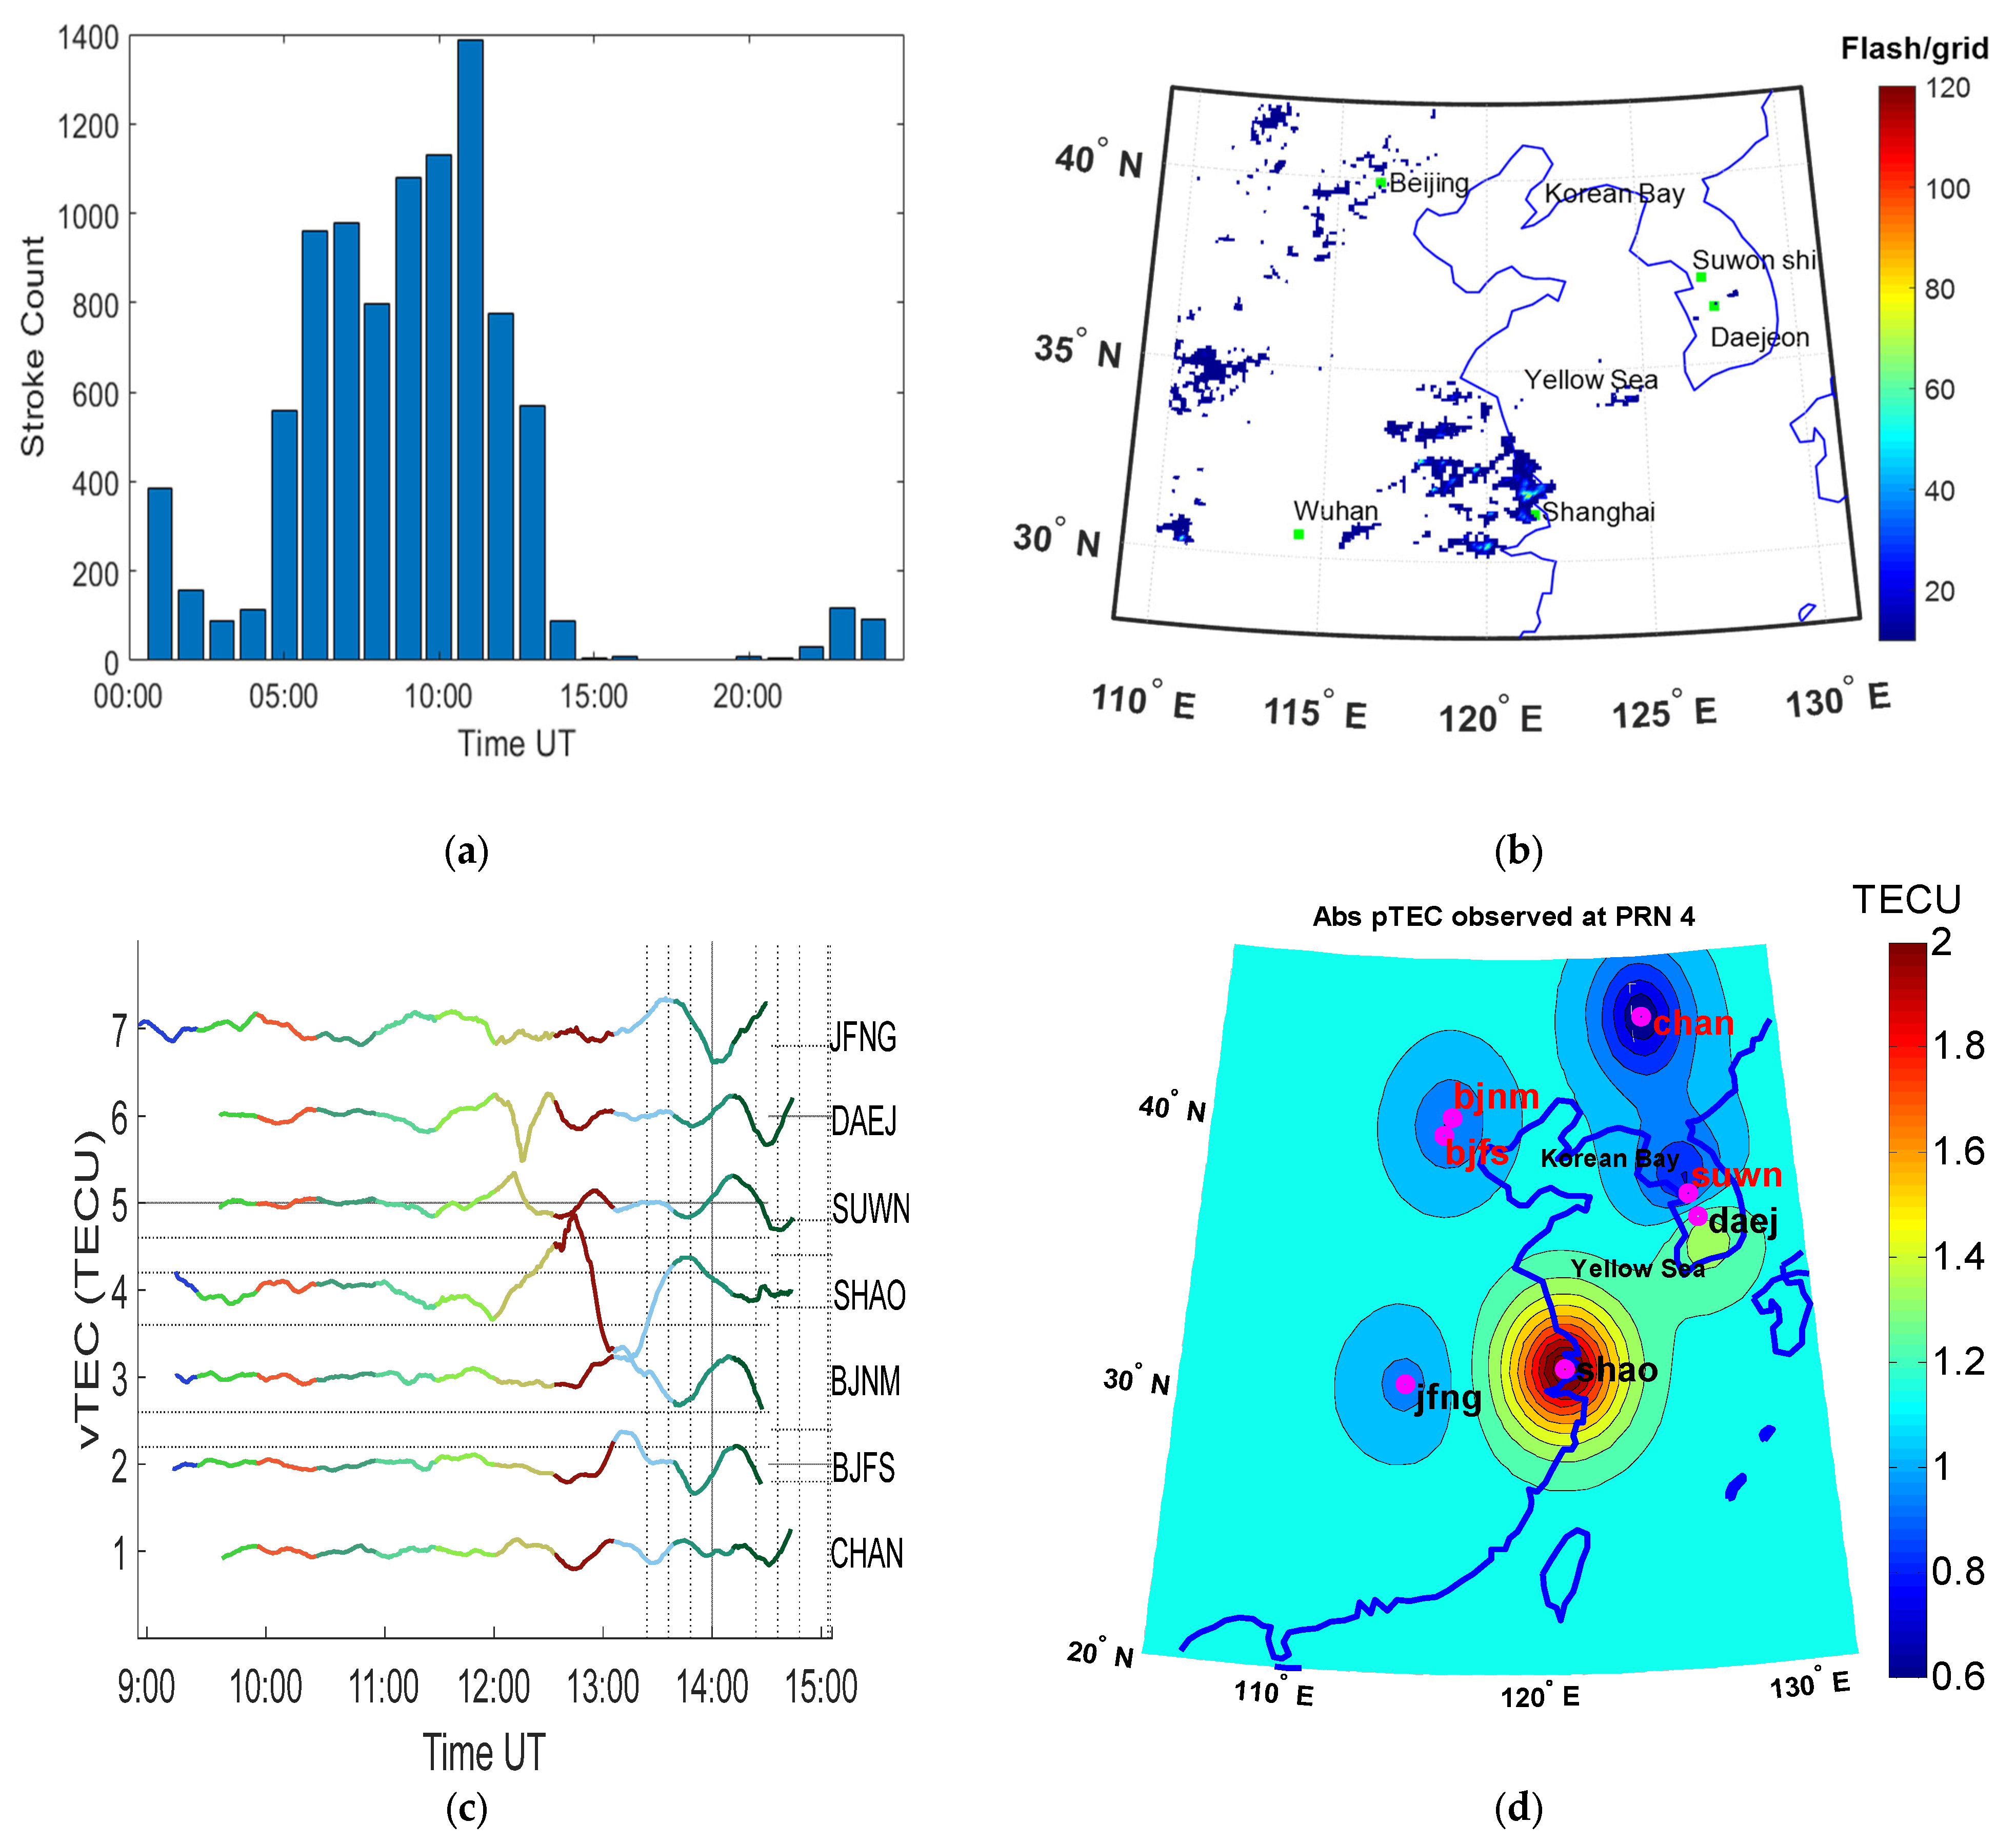
In this work, the sets of data used were selected based on thunderstorm events. The selected events were based on two categories: the first category of events was associated with high-energy lightning, and the second was associated with TLEs (such as sprites). Additionally, 5 strong convection-associated events were selected. In selecting these events, special caution was taken to exclude cases that coincided with the dates of geomagnetic storms or strong solar activity occurrences to avoid the influence of space weather impacts.

2.1. Lightning Data

First, thunderstorms in the selected area were mapped using data from Worldwide Lightning Location Network (WWLLN) to identify the highest concentration area of the thunderstorm event. The WWLLN is a global network of sensors that can measure the very low frequencies emitted during lightning events [24,25,26,27] and provide the locations of strong lightning flashes, their timings, and energy. In general, the detection efficiency of the WWLLN is about 10–20% of total lightning occurrences [25,26]. Similarly, the performance of WWLLN around Beijing was obtained at around 20% with a relatively short baseline network [27].
The study area spanned the northeastern part of China close to the Yellow Sea area and selected parts of South Korea close to the Korean Bay (see Figure 1). Severe thunderstorms, such as squall lines and hailstorms, frequently occur in this region in the summertime [28,29,30,31,32] and produce active lightning discharges [33,34,35,36].

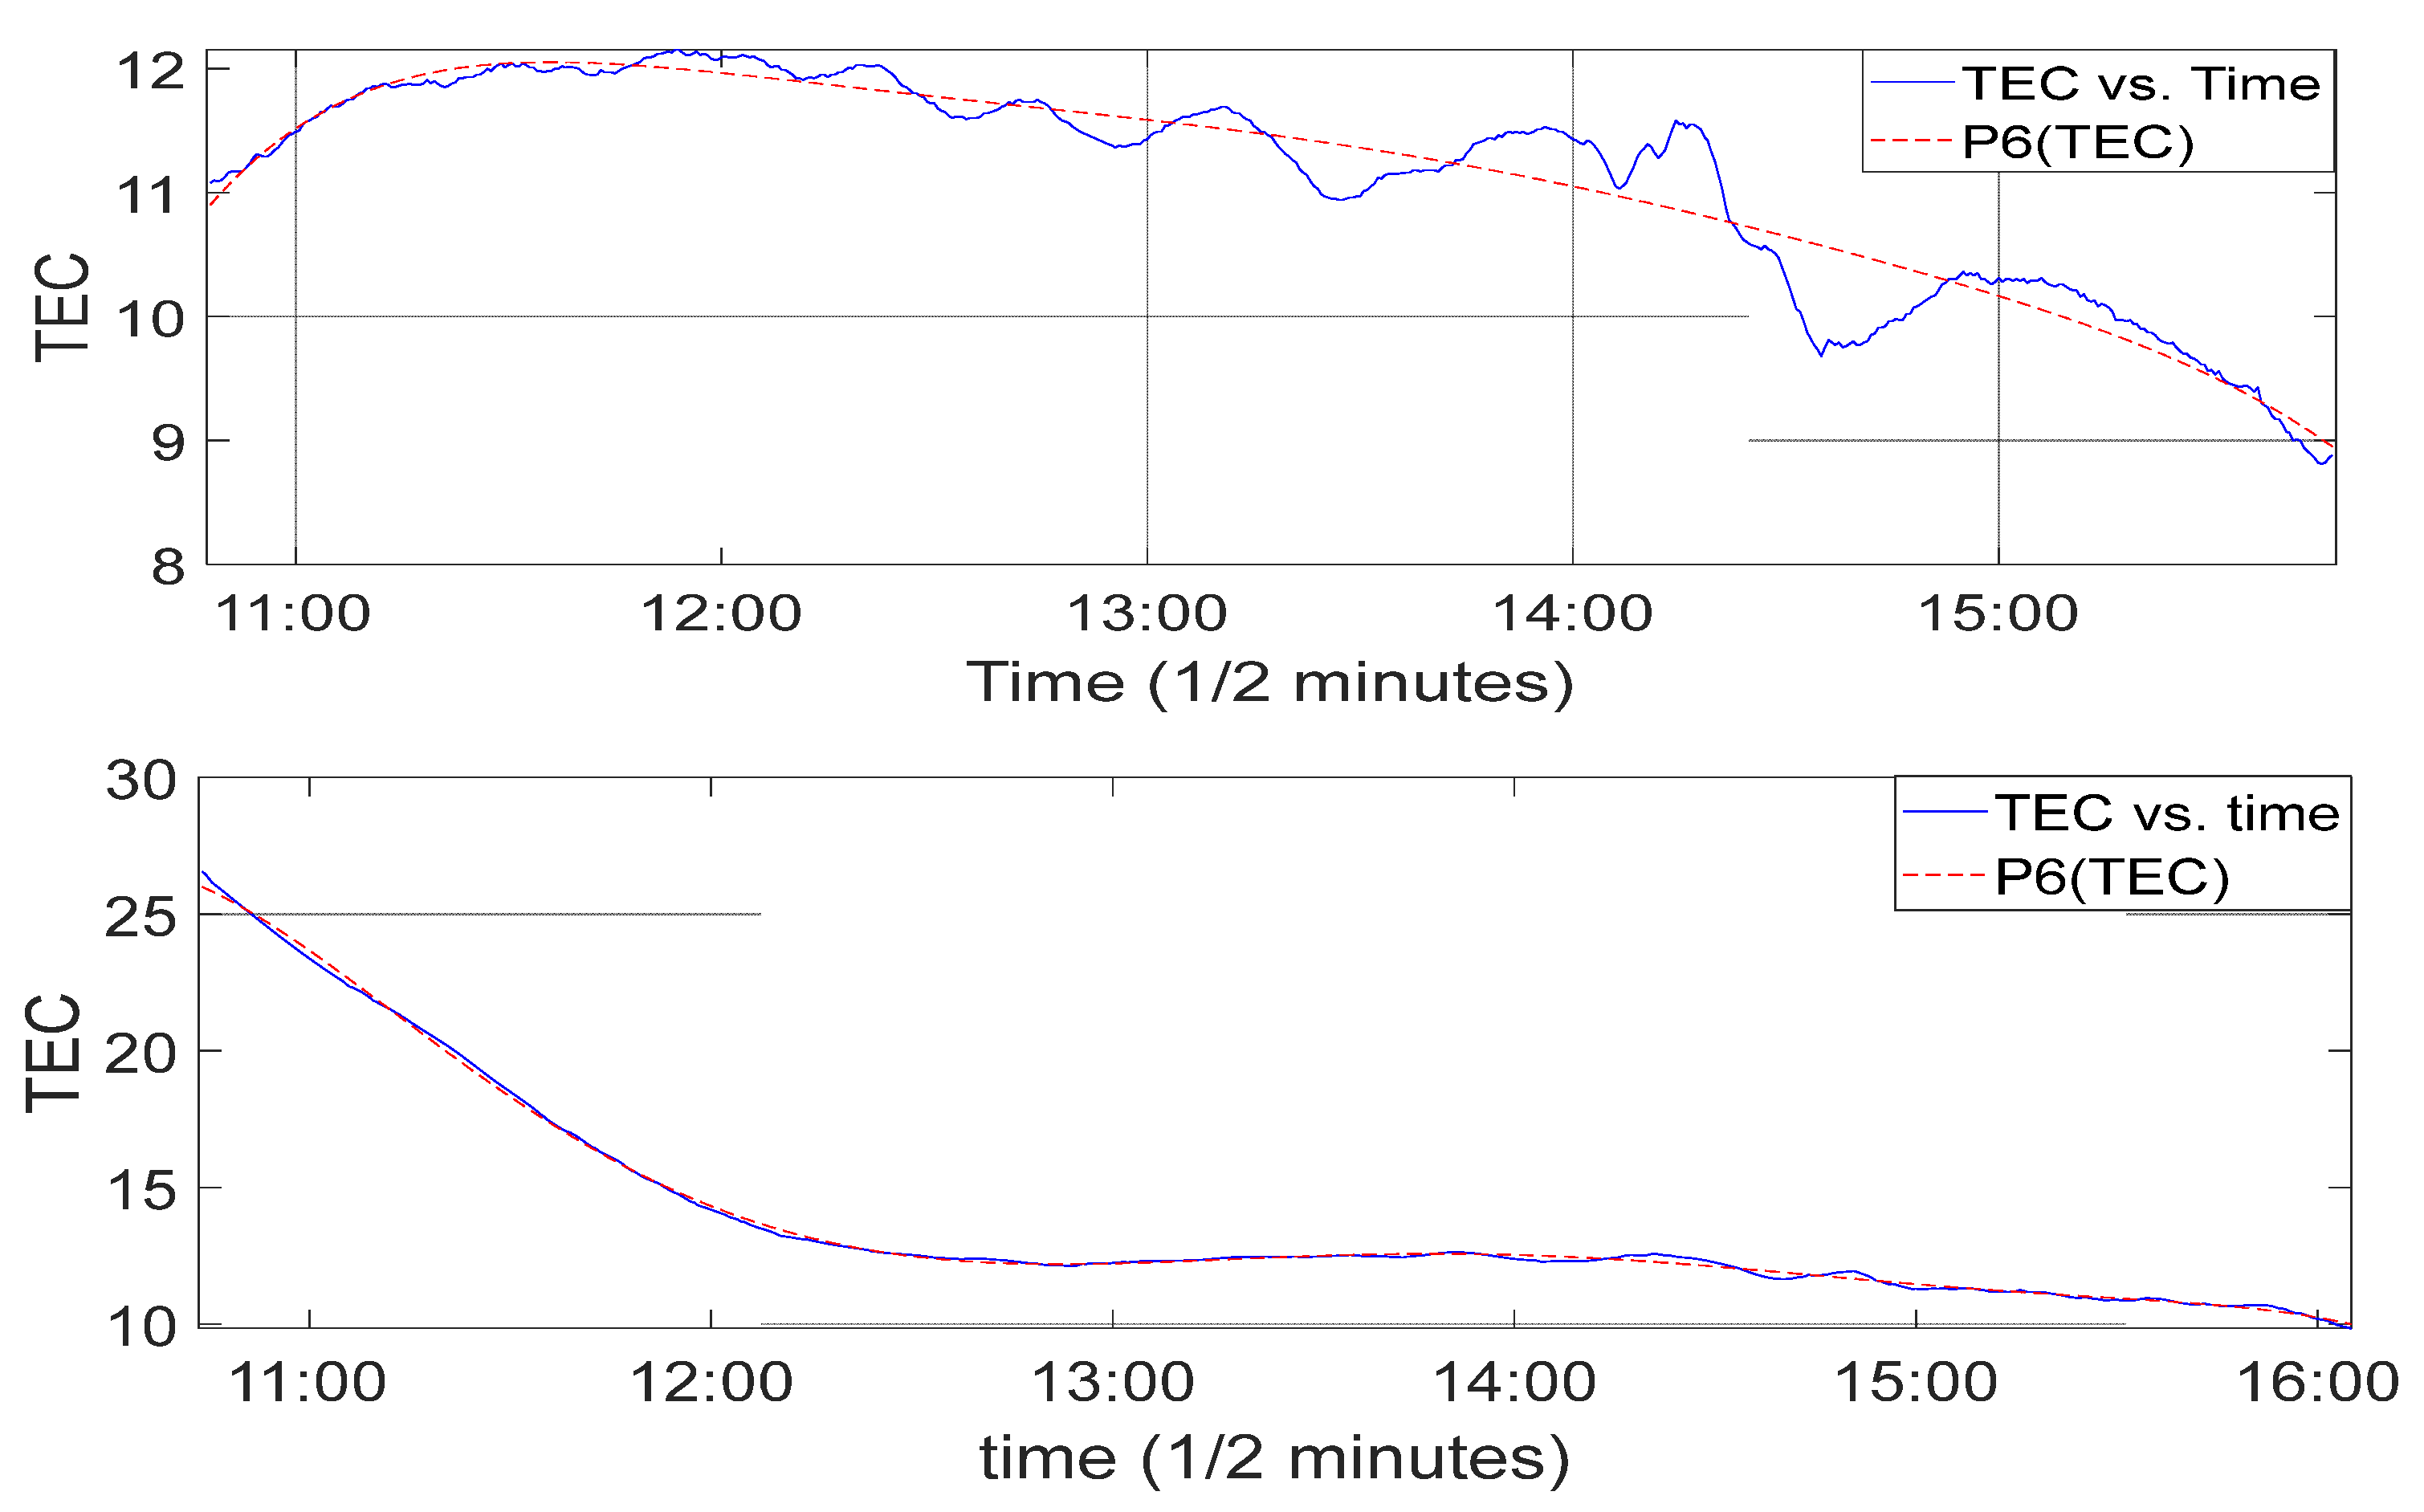
2.2. TEC Data Extraction

To investigate the relative ionospheric TEC deviation around the North-eastern China region along the Yellow Sea and the Korean region close to the Korean Bay, the dataset from the ground based on the global navigation satellite system (GNSS) receiver stations at the geographic coordinates (latitudes: 30.5–43.79°; longitudes: 114.49–125.53°) were used (see Table 1). The selected International GNSS service (IGS) network TEC stations were also chosen based on the availability of GNSS data from the receiver stations during the period of the thunderstorm events.
The data obtained from the GNSS measurement stations were primarily archived in the Receiver Independent Exchange (RINEX) format, which comprised double compressions for optimal storage. The compressed data were decompressed using Hatanaka and gun zip software in a readable format. The ionospheric TEC has been estimated in previous works using dual-frequency GNSS receivers [37,38]. The first carrier frequency, f1, was centred at 1575.42 MHz, and the second carrier frequency, f2, was centred at 1227.60 MHz. Carrier phase measurements obtained from GNSS were used to estimate the slant TEC (sTEC) along the signal path from the satellite to the receiver as follows [37]:
s T E C = f 1 2 f 2 2 40.3 ( f 1 2 f 1 2 ) [ ( λ 2 L 2 λ 1 L 1 ) ( λ 1 A 1 + λ 2 A 2 + ε L ) ]
where L1 is the carrier phase measurement on frequency f1 (cycles), L2 is the carrier phase measurement on frequency f2 (cycles), A1 is the ambiguity integer measure on the carrier phase on L1 frequency (cycles), A2 is the ambiguity integer measure on the carrier phase on L2 frequency (cycles), ε L is the noise and multipath associated with carrier phase measurements (cycles), and λ1 and λ2 are the wavelengths (m) corresponding to f1 and f2, respectively.
The carrier phase measurements used to compute sTEC sometimes exhibit cycle slips [38]. These cycle slips are the discontinuities in the time series of carrier phase measurements because the GNSS receiver loses its lock on the carrier of a GNSS signal during tracking due to signal blockage or other factors. Cycle slips were detected in the GNSS sets data using Ciraolo’s calibration algorithm techniques (GNSS_TEC Sep2015Beta version) [38].
As sTEC is dependent on ray path geometry through the ionosphere, it is necessary to calculate an equivalent vertical TEC (VTEC) value that is independent of the elevation of the ray path. Hence, VTEC was computed by taking the projection from the slant to vertical using a mapping function (MF) as presented in previous works [39,40]:
v T E C = s T E C × M F
where M F = [ 1 ( R e cos ( θ ) R e + h m a x ) 2 ] 1 2 and Re is the mean earth radius; 6371 km, θ is the elevation angle of the satellite in degrees, where hmax is the maximum height above the surface of the Earth assumed for the ionospheric pierce point (IPP). A height of 400 km was taken to the be hmax value because, at this height, the ionosphere can be assumed to be spatially uniform and simplified as a thin layer. Hence, this is considered to be the height of maximum electron density at the F2 peak [40,41]. In respect of the lower region (Bottom-side ionosphere close to E and lower parts of the F region) of the ionosphere, where we intended to examine the thunderstorm effects of internal mechanical forcing, a 200 km height was considered for the computation of TEC along the satellite paths.

2.3. Analysis

Lightning data were obtained from the WWLLN. Using the lightning flashes over the observation region, a density map was prepared in per-hour time slots with a grid size of 10 square km. Based on the changes in the position of the density and identified boundaries, the thunderstorm directions were observed. More details about boundary identification and thunderstorm tracking using lightning data can be found in the literature [42]. The timing and location of lightning associated with thunderstorms were tracked using the WWLLN data sets by creating the thunderstorm cell, as explained above.
The TEC data obtained were analyzed based on satellite visibility at the point of the thunderstorm event. The GPS satellites’ Pseudo Random Noise (PRN) was used for the identification of visible GPS satellites. TEC deviations during the thunderstorm were extracted from the computed TEC obtained from the visible PRN with the highest angle of elevation at the time of the event. Angles of elevation between 65° and 80° were mostly considered in this work. Additionally, we ensured that the GPS satellite that was tracked within the duration of the peak of events fell within the angle of 60–90 degrees. The method of polynomial filtering was used for the extraction of TEC deviations. A polynomial of order 6 was fit to the TEC to extract the disturbed TEC from the measured TEC for the period of the selected events [4,11,43]. The computation of the TEC deviation using the polynomial order 6 is as follows:
Given a time series X ( t ) function from the measured series x 1 , x 2 , x 3 , , x i , we can obtain a polynomial P n ( X ) = q 1 ( X n ) + q 2 ( X n 1 ) +   + q n ( X ) + q n + 1 , where q n are quantities derived based on P. The TEC deviation T d e v can be given as:
T d e v = X ( t ) P 6 ( X )
The extracted TEC deviations were compared between stations based on their proximity to the point of thunderstorm events. The extracted TEC variations were further analyzed to obtain spatial and time variations. The TEC deviation data were further subjected to Fast Fourier Transform (FFT) and Discrete Fourier Transform (DFT) analysis to evaluate all the possible frequency spectra for the ionospheric TEC deviations. Similarly, wavelet analysis was conducted to evaluate the dominant frequencies present in TEC deviation samples.

3. Results

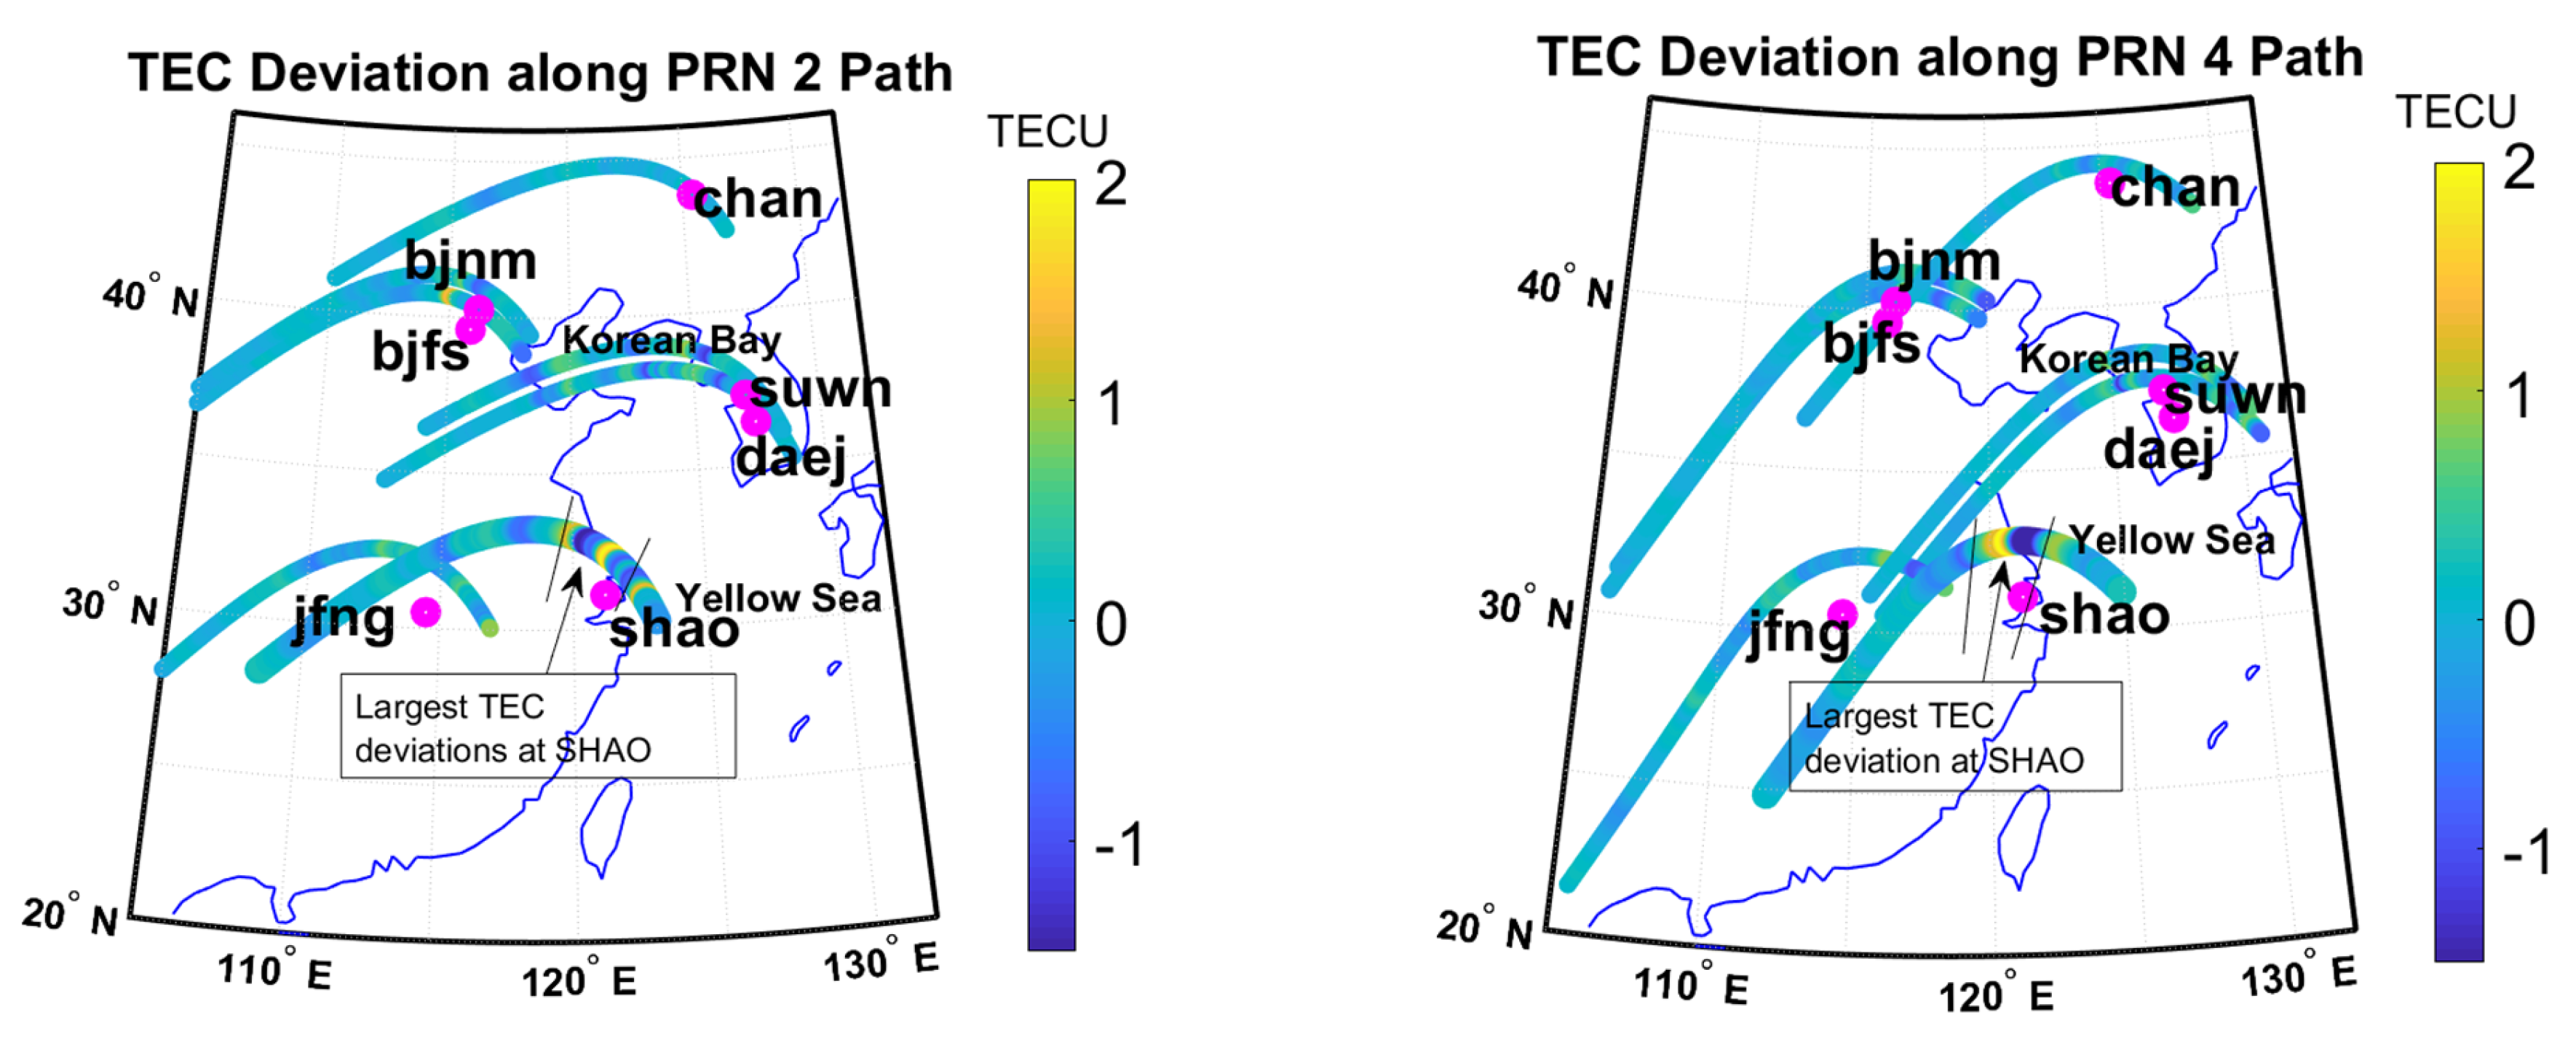
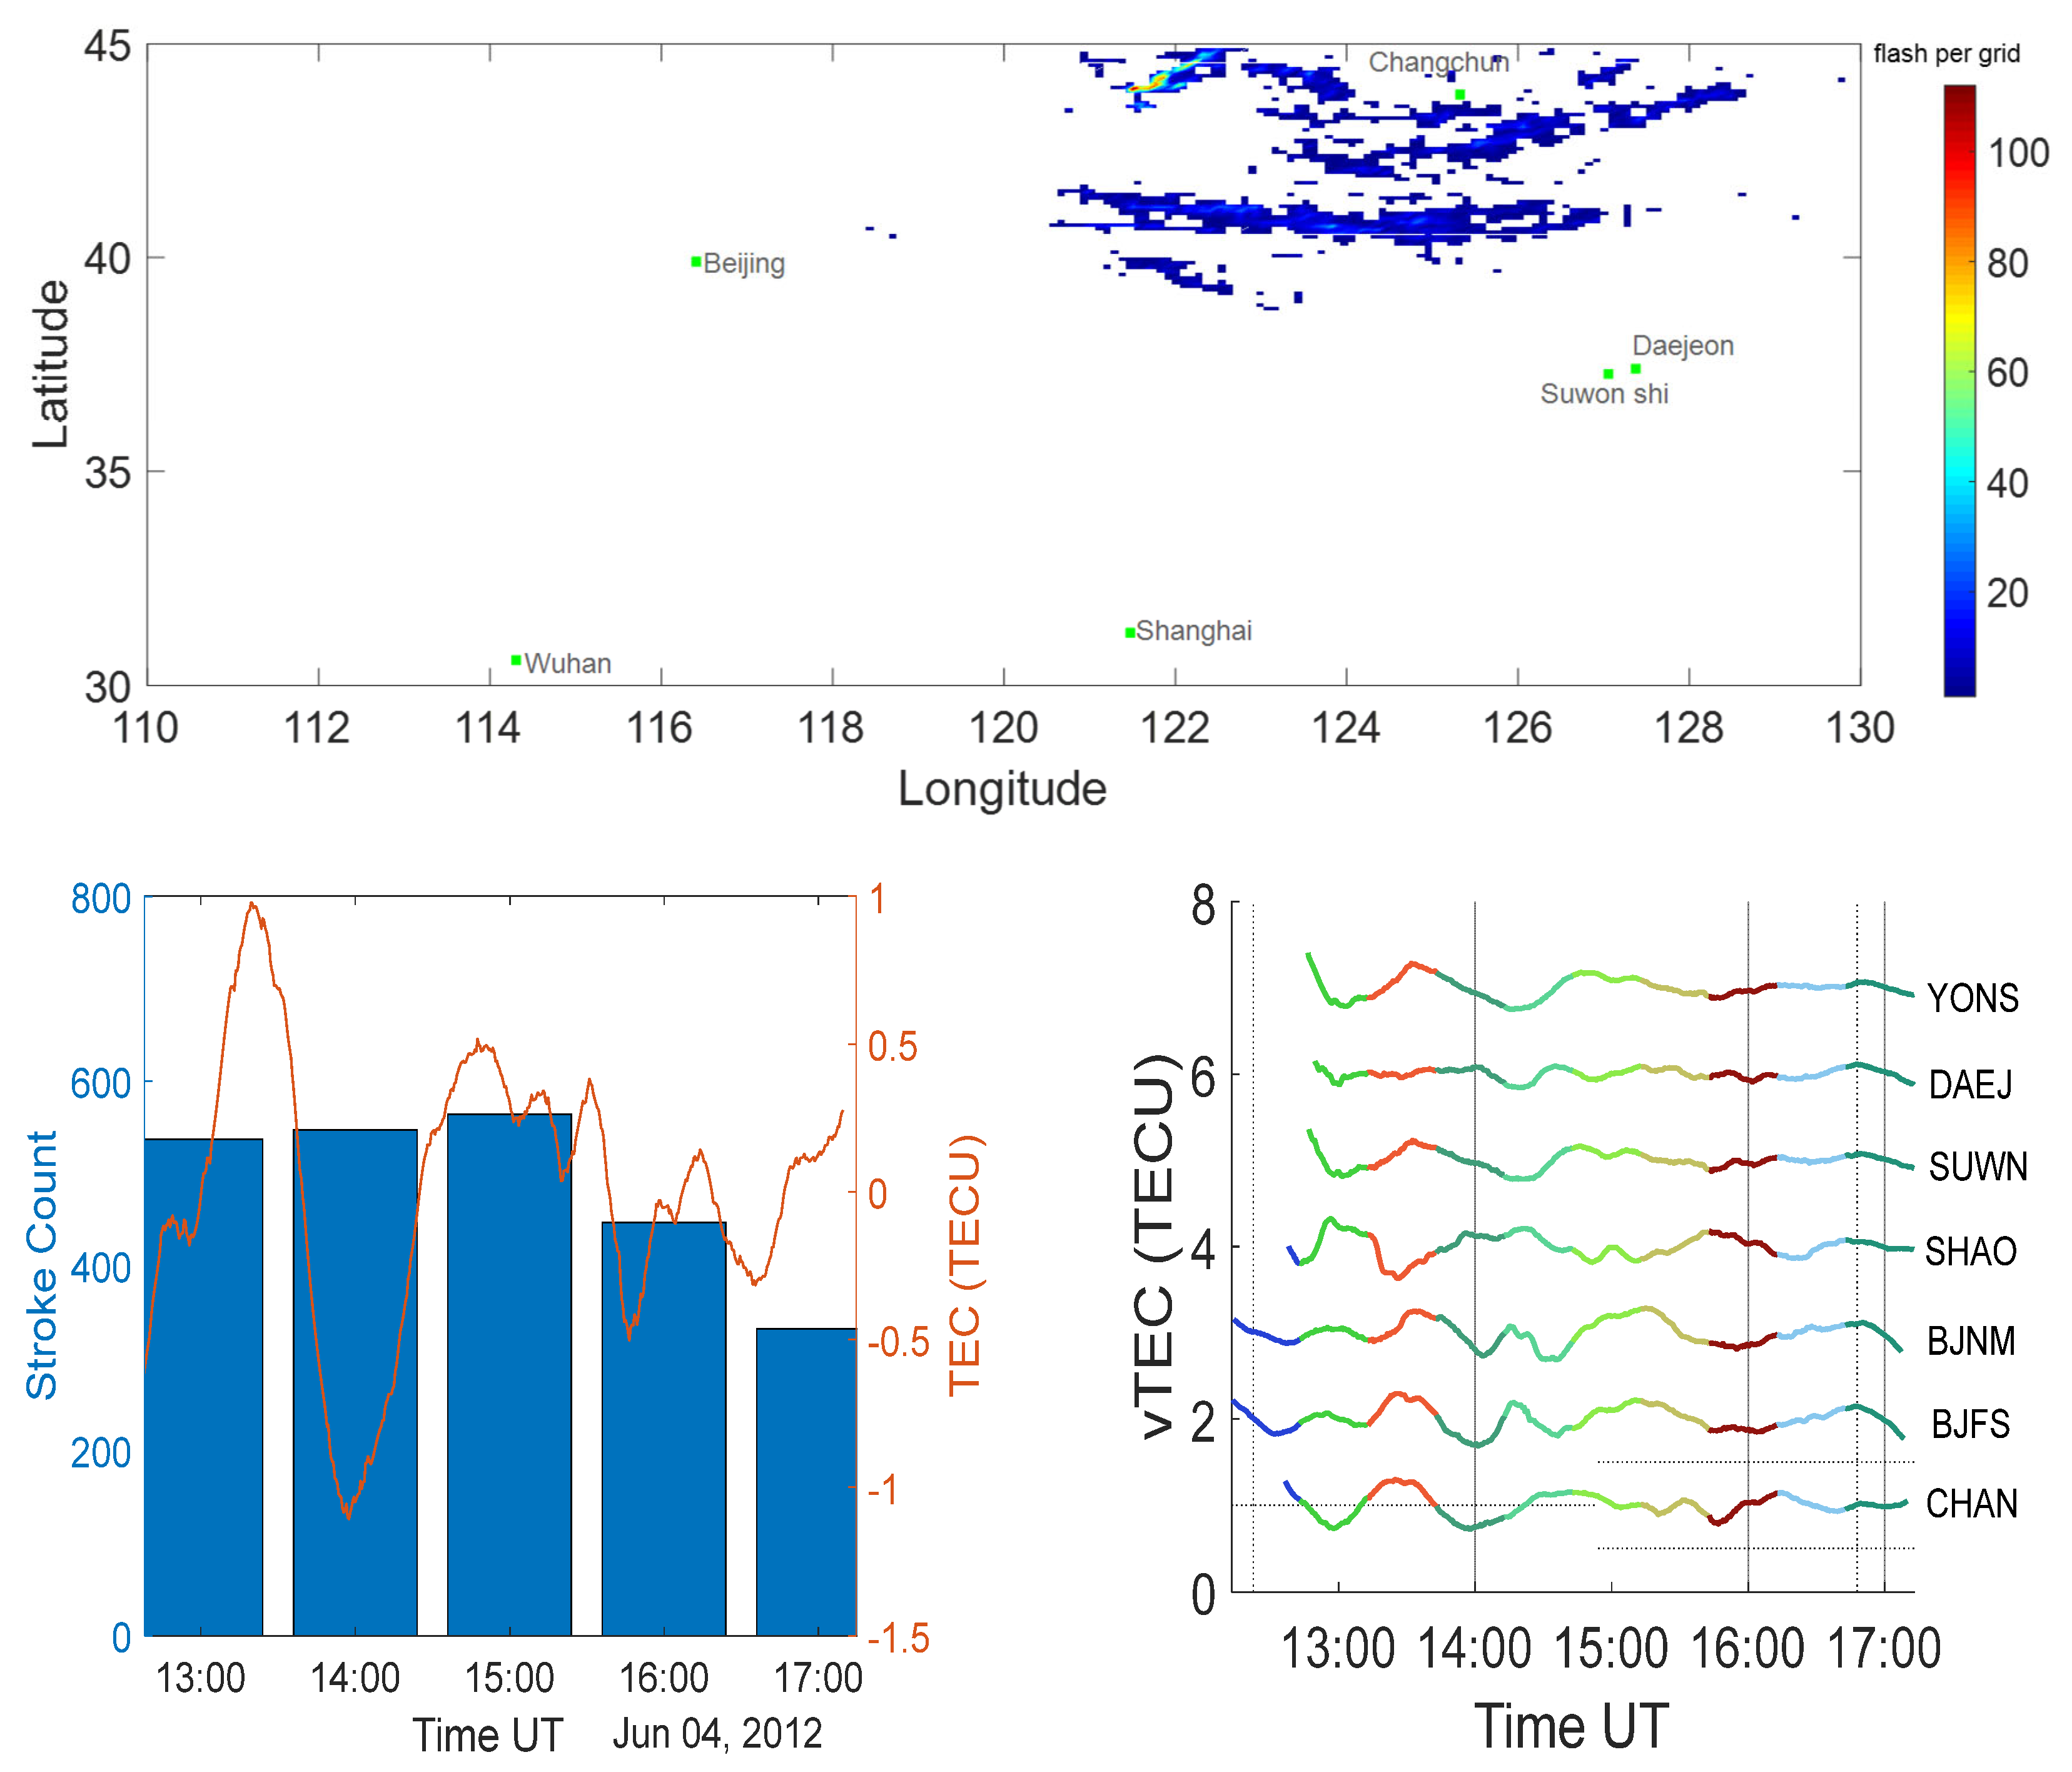
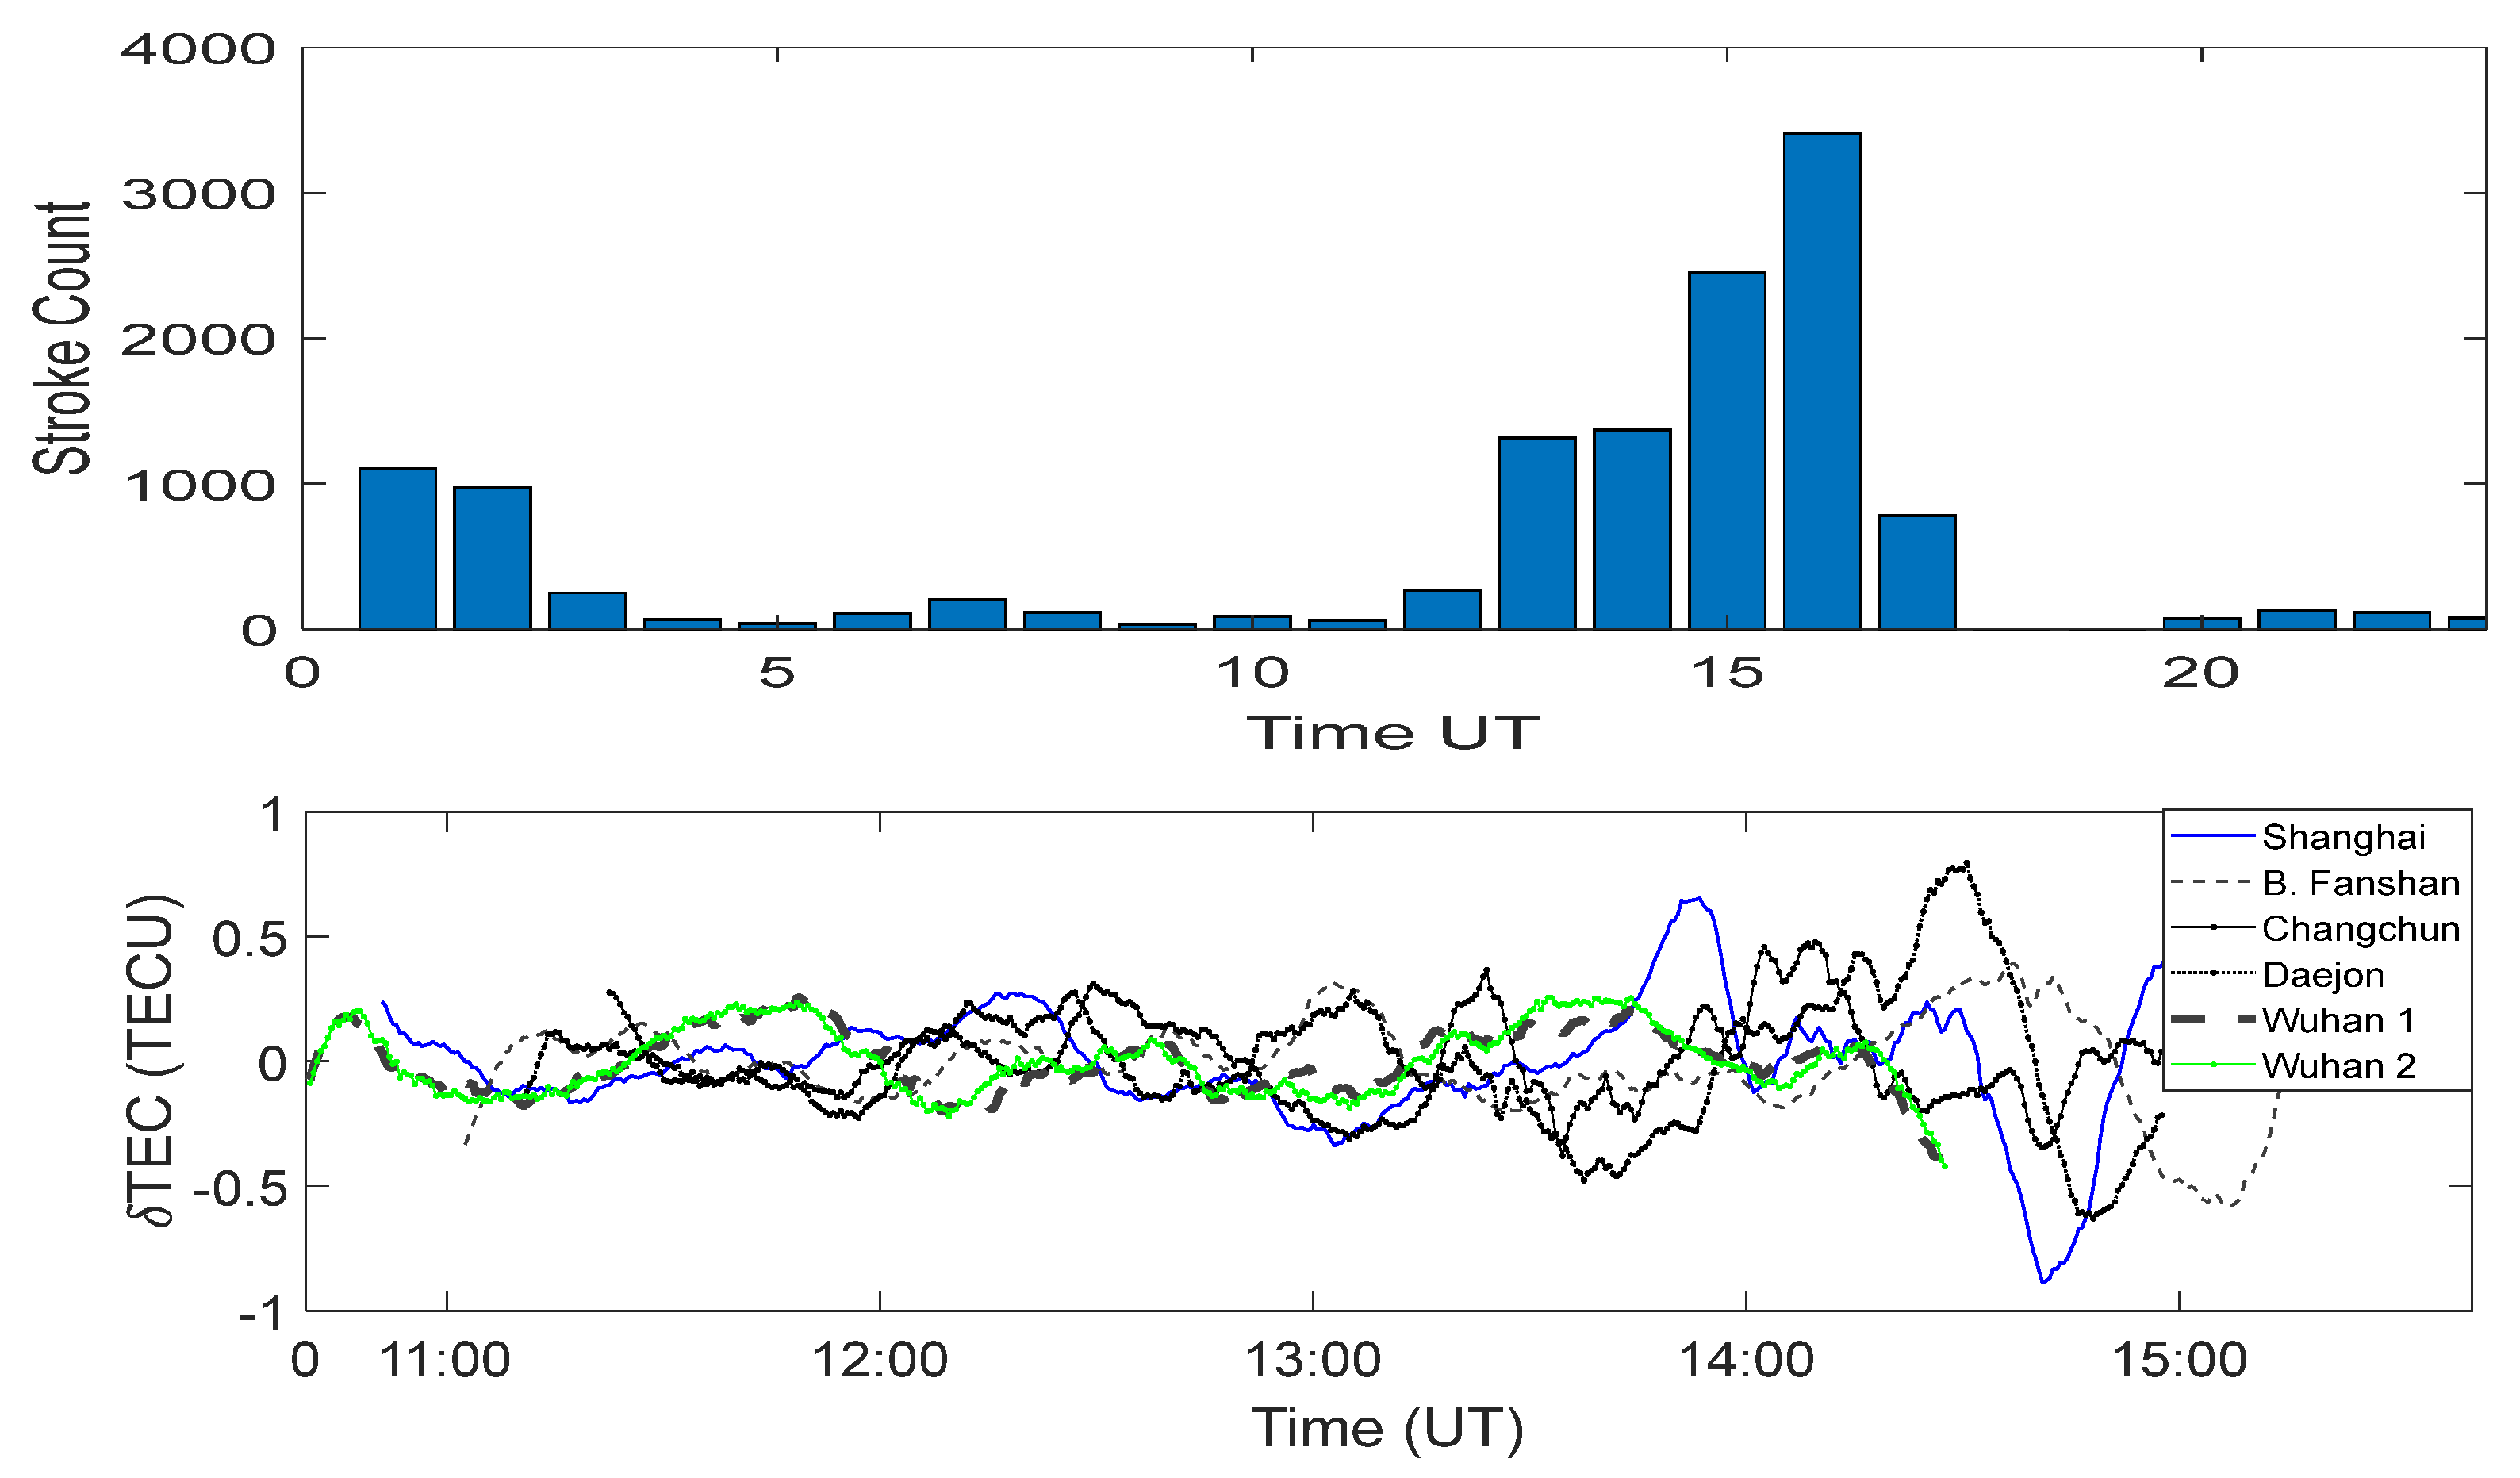
3.1. Thunderstorm Effects and Large TEC Response

In this work, the response of the ionosphere to thunderstorm effects was evaluated to understand the magnitude of the impact of the thunderstorm effect on the ionospheric TEC and the characteristics of the thunderstorm signatures. In this section, we attempt to clearly present the linear and spatial response of TEC to different thunderstorm cases. The TEC deviations were computed for selected thunderstorm locations to study the impact of the thunderstorm (See Figure 2 for TEC deviation illustrations).
On the 21st of June 2016, there were strong convective thunderstorm systems with high lightning flash rates observed in Beijing, Shanghai, Wuhan, and various parts of Northern China (see Figure 3). However, the most intense thunderstorms were observed in Shanghai with exceptionally high flash rates and high energy flashes, which were mostly up to ~280 kJ, with a daily average of about 2.643 kJ (see Table 2).
Convective activities in this region were also characterized by large flash rates in Shanghai (up to 1500 flashes per hour) and lower flash rates in Beijing (see Figure 3a,c). As a consequence of these convective activities, very large TEC deviations were computed for Shanghai and other areas with high proximity to the storm region. The spatial variation in TEC deviations over the region at the time of the storm was evaluated through the interpolation and extrapolation of the absolute peak TEC deviations in different locations during the event. The spatial variation in the absolute peak TEC also showed that the Shanghai and Beijing area experienced TEC perturbations of the highest magnitudes in this region (Figure 3a–d). Uniformed line plots of TEC deviations from June 2016 (see Figure 3b) show the wavelike perturbations of TEC for the stations closest to the storm event (such as the stations at Shanghai and Beijing), with the highest stroke count coinciding with the largest TEC deviations at 15:00 UT. As observed from Figure 3b,d, the TEC deviation in these regions was up to 2 TECU in magnitude, which is similar to results from other cases examined. The observed largest TEC deviations were (TEC measured at an ionospheric height of 200 km) from ~2 to ~2.2 TECUs accounted more than ~14% of the daily TEC average, in which the peak value for the average daily TEC was about 13 TECUs. Based on our initial examination of the TEC signatures obtained, the signal properties appeared to demonstrate that the dynamics of the ionospheric were being modified by acoustic and gravity wave dynamics associated with thunderstorm events. More findings are presented on the periodic and frequency domain analysis in Section 3.3. The flash counts for the thunderstorm events around Shanghai were particularly large, with the number of lightning strokes well above 1300 flashes per hour, which accounted for only 20% of the total flashes, based on the WWLLN detection method. This type of intense flash rate usually characterizes large convective activity. Considering the ionospheric TEC deviations, the highest deviations were recorded at about the same time as the largest stroke count. The TEC deviation at Shanghai was slightly greater than 2 TECUs, which was higher than the TEC deviation observed from the other stations.
The mesoscale convective system observed on the 31st of July 2013 (see Figure 4) was identified as the strongest thunderstorm characterized by the strongest intensity of = cloud-to-ground lightning associated with red sprites [15,44].
In addition to the system of overlapping sprites during the thunderstorm and the large-scale flashes (see Figure 4a), the tracing of the storm cell system using WWLLN also revealed a large-scale system around Shanghai. The resulting TEC deviation could be seen in the observation displayed in Figure 4b, which revealed a large TEC deviation during the periods with a large flash rate.
The lightning strikes with the highest intensity for this event were also associated with sprites. However, the connective system in Shanghai tended to be stronger, with a higher flash count rate per grid (see Figure 4c). The intensity of the flash, as indicated in the kilojoules of energy discharged, was found to be at an average of ~6 kJ, with maximum energy up to ~860 kJ (see Table 2). The intensity of the lightning flashes observed during the convective processes appeared to correlate with the flash count per hour, with the highest flash rate and highest energy discharge occurring at about the same hour. The response of the ionosphere was revealed in the form of exceptionally large TEC deviations with absolute Peak TEC values up to 2 TECUs (Figure 4b), which accounted for ~10% of the daily TEC average in this case, as the highest TEC deviation was ~20 TECUs.
The ionospheric response to the thunderstorm, which was reflected by TEC deviations, could also be observed in the TEC deviation along the satellite path (see Figure 5). TEC deviations along the satellite path for the thunderstorm event that occurred on the 21st of June 2016 and on the 31st of July 2013 are represented in Figure 5 (left panel, right pane). The TEC along the satellite path shows the difference in TEC deviation for various locations.
The thunderstorm with a large flash rate in the northeastern part of China on the 4 June 2012 is another example of a highly intense event with responses of TEC (see Figure 6). Although the event took place along a 37° to 45° latitude and between 120° and 129° longitude (see Figure 6 upper panel), the average daily stroke count for that day was about 500–600 strokes per hour (see Figure 6 bottom left panel), which depicted active convective and microphysical processes. The convective activity and storm impact appeared to be directed southwestwards. The event, which took place mainly in the northeastern part of China, revealed the concentration of cells around the northeastern city of Changchun and its environs (see Figure 6 upper panel). Even though there was no record of convection in other areas of the region, the impact of the thunderstorm was found to have traveled southwards beyond Beijing and toward the Shanghai region. Even though there was no appearance of convective activity southwards after a 37° latitude, the propagation of the impact on the convective activity could be observed in the southwestern parts of this region, as TEC deviations obtained from this region reflected the direction and impact of the storm (see Figure 6 bottom right panel). The impact on the TEC revealed high magnitude perturbations on the TEC measured within the storm region, such that the TEC deviations obtained in the southwestern direction at Beijing, Shanghai, and other stations in the region revealed the degree of impact relative to their proximity to the convective region.
Even though the findings from this work show that there are large TEC deviations due to the effects of thunderstorms, there can also be large TEC deviations due to other factors in the absence of thunderstorms. The effect of space weather events can result in such TEC deviations. However, in most cases, thunderstorms can result in large TEC deviations in the absence of solar activities (further clarifications and results of the analysis for days without thunderstorms can be found in the Supplementary Materials to this work).
Considering that the months of June, July, and August were continually characterized by thunderstorms and lightning flashes, the days without thunderstorms were not noticed after careful analysis for June 2016 and July 2013. However, a close examination of the days around thunderstorms revealed that the day with the highest flash rates was also associated with the largest TEC deviation (please refer to Supplementary Figures S7–S10). Even though the highest TEC deviations mostly coincided with the highest flash rates, the presence of day-to-day thunderstorms was also responsible for the relatively high TEC deviation signatures observed for the days around the thunderstorm. This further substantiated the effect of the thunderstorm on ionospheric dynamics.

3.2. Low Amplitude TEC Responses during Large Thunderstorms with TLEs

The thunderstorm event on 8 August 2017 was associated with high-energy flashes and sprites with a high intensity flash rate per square kilometer. The sprites, on 8 August 2017, were reported in a previously published work [44]. Although this thunderstorm was characterized by a highly intense number of flashes with associated TLEs, the energy dynamics based on the gravity wave intensity did not show a high-intensity impact on the ionosphere (see Figure 7), considering that ionospheric TEC deviations values were not as high as the TEC deviations recorded for other storm cases (without the occurrence of sprites) of a similar magnitude. A possible explanation for this may include the fact that there could be a wave-breaking occurrence in a situation whereby a large wave is being transported upwards. The breaking of waves could have occurred before reaching the thermosphere, hence the lower amplitude. The dissipation of gravity waves in the upper atmosphere, particularly in the thermospheric region, has been discussed in previous works [45,46,47,48]; the gravity wave dissipation is usually preceded by wave breaking. Another possible explanation could be that the intensity and the nature of the flashes may not always be associated with the size of the storm. That is, the highest flash rates may not necessarily result from the highest convective process, and hence, gravity wave energy might be independent of the flash rates [11].
Additionally, a 20–30 min delay was observed between the TEC deviations and the intense sprite occurrences in different cases. This is because sprites were mostly produced in the stratiform region of the precipitation system [18,19,45], and high-magnitude gravity waves were mostly produced during the convective segments of the precipitation region [46,47,48,49]. A group of investigators reported that more than 80% (more than four out of five) of the sprites recorded in their work occurred in the stratiform phase of convective systems observed in their work [50]. This implies that the gravity wave was produced during the active lightning period of the mature stage of the thunderstorm, while sprites are produced later after the active lightning period and were associated with the convective region because sprites are usually associated with positive lightning that is produced from the stratiform region, in the late stage of the thunderstorm. Hence, the possibility of a delay between the observed gravity wave impact on the ionosphere and the sprite occurrence could exist.

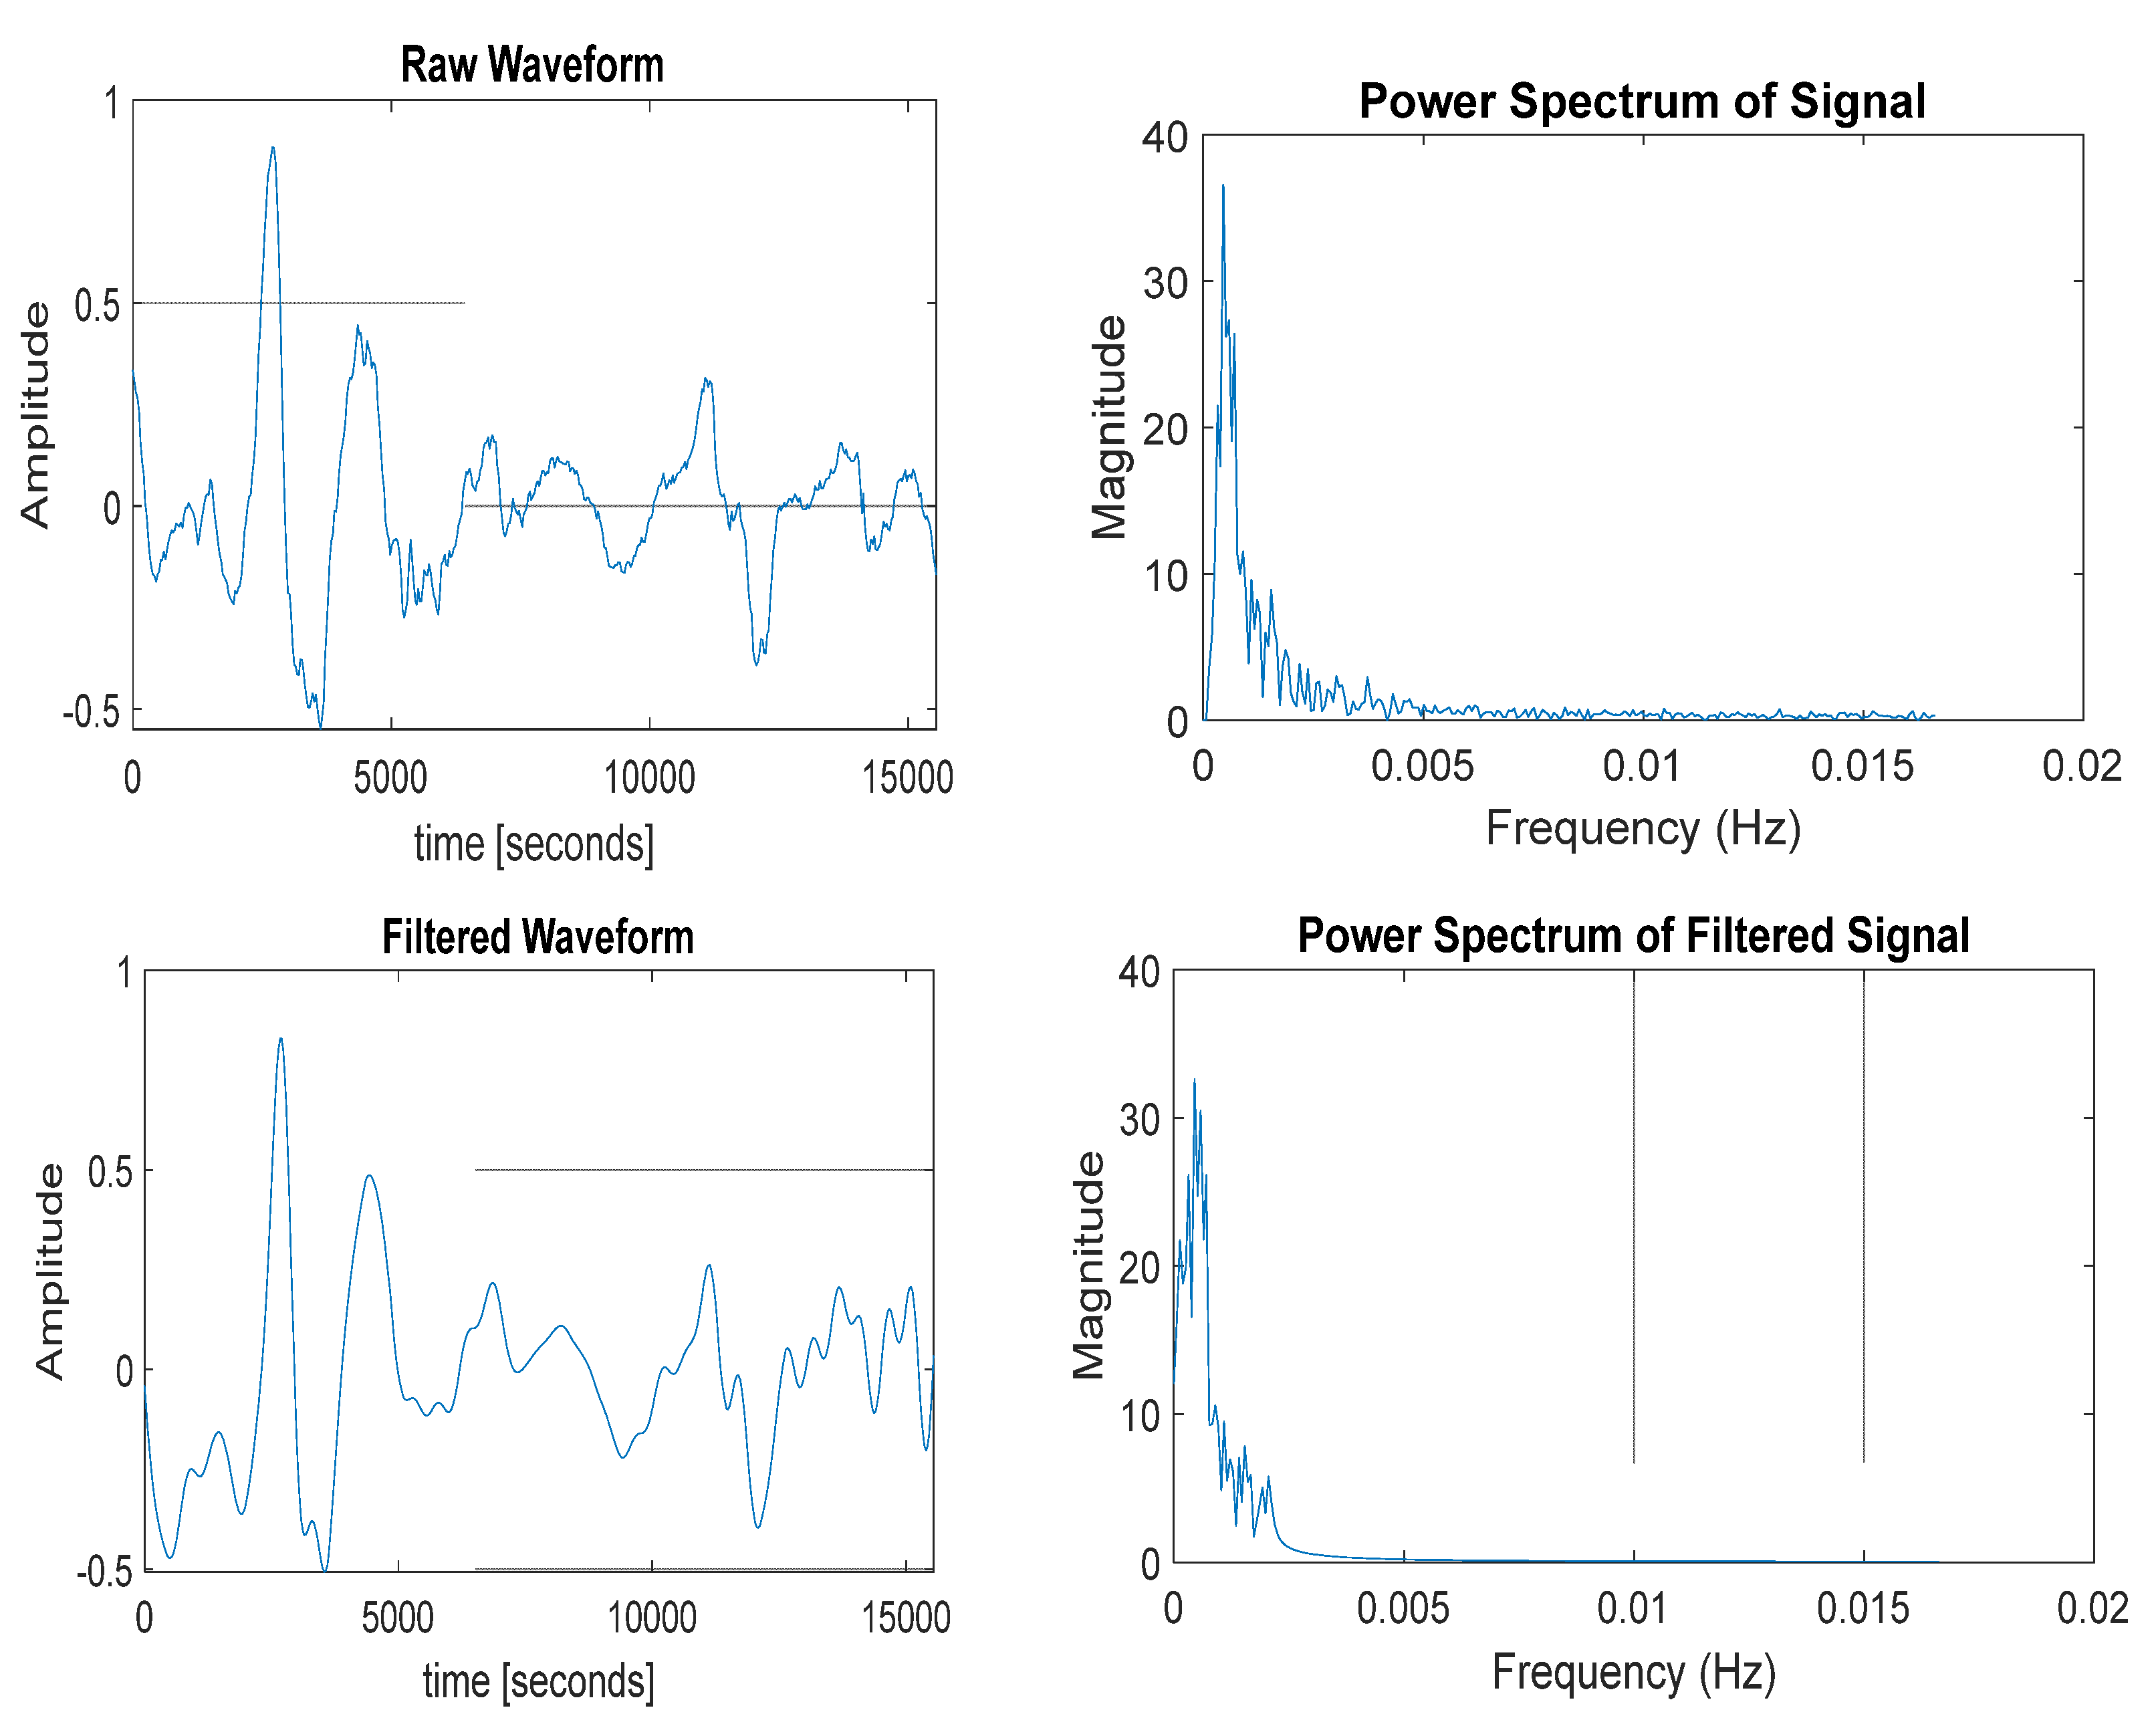
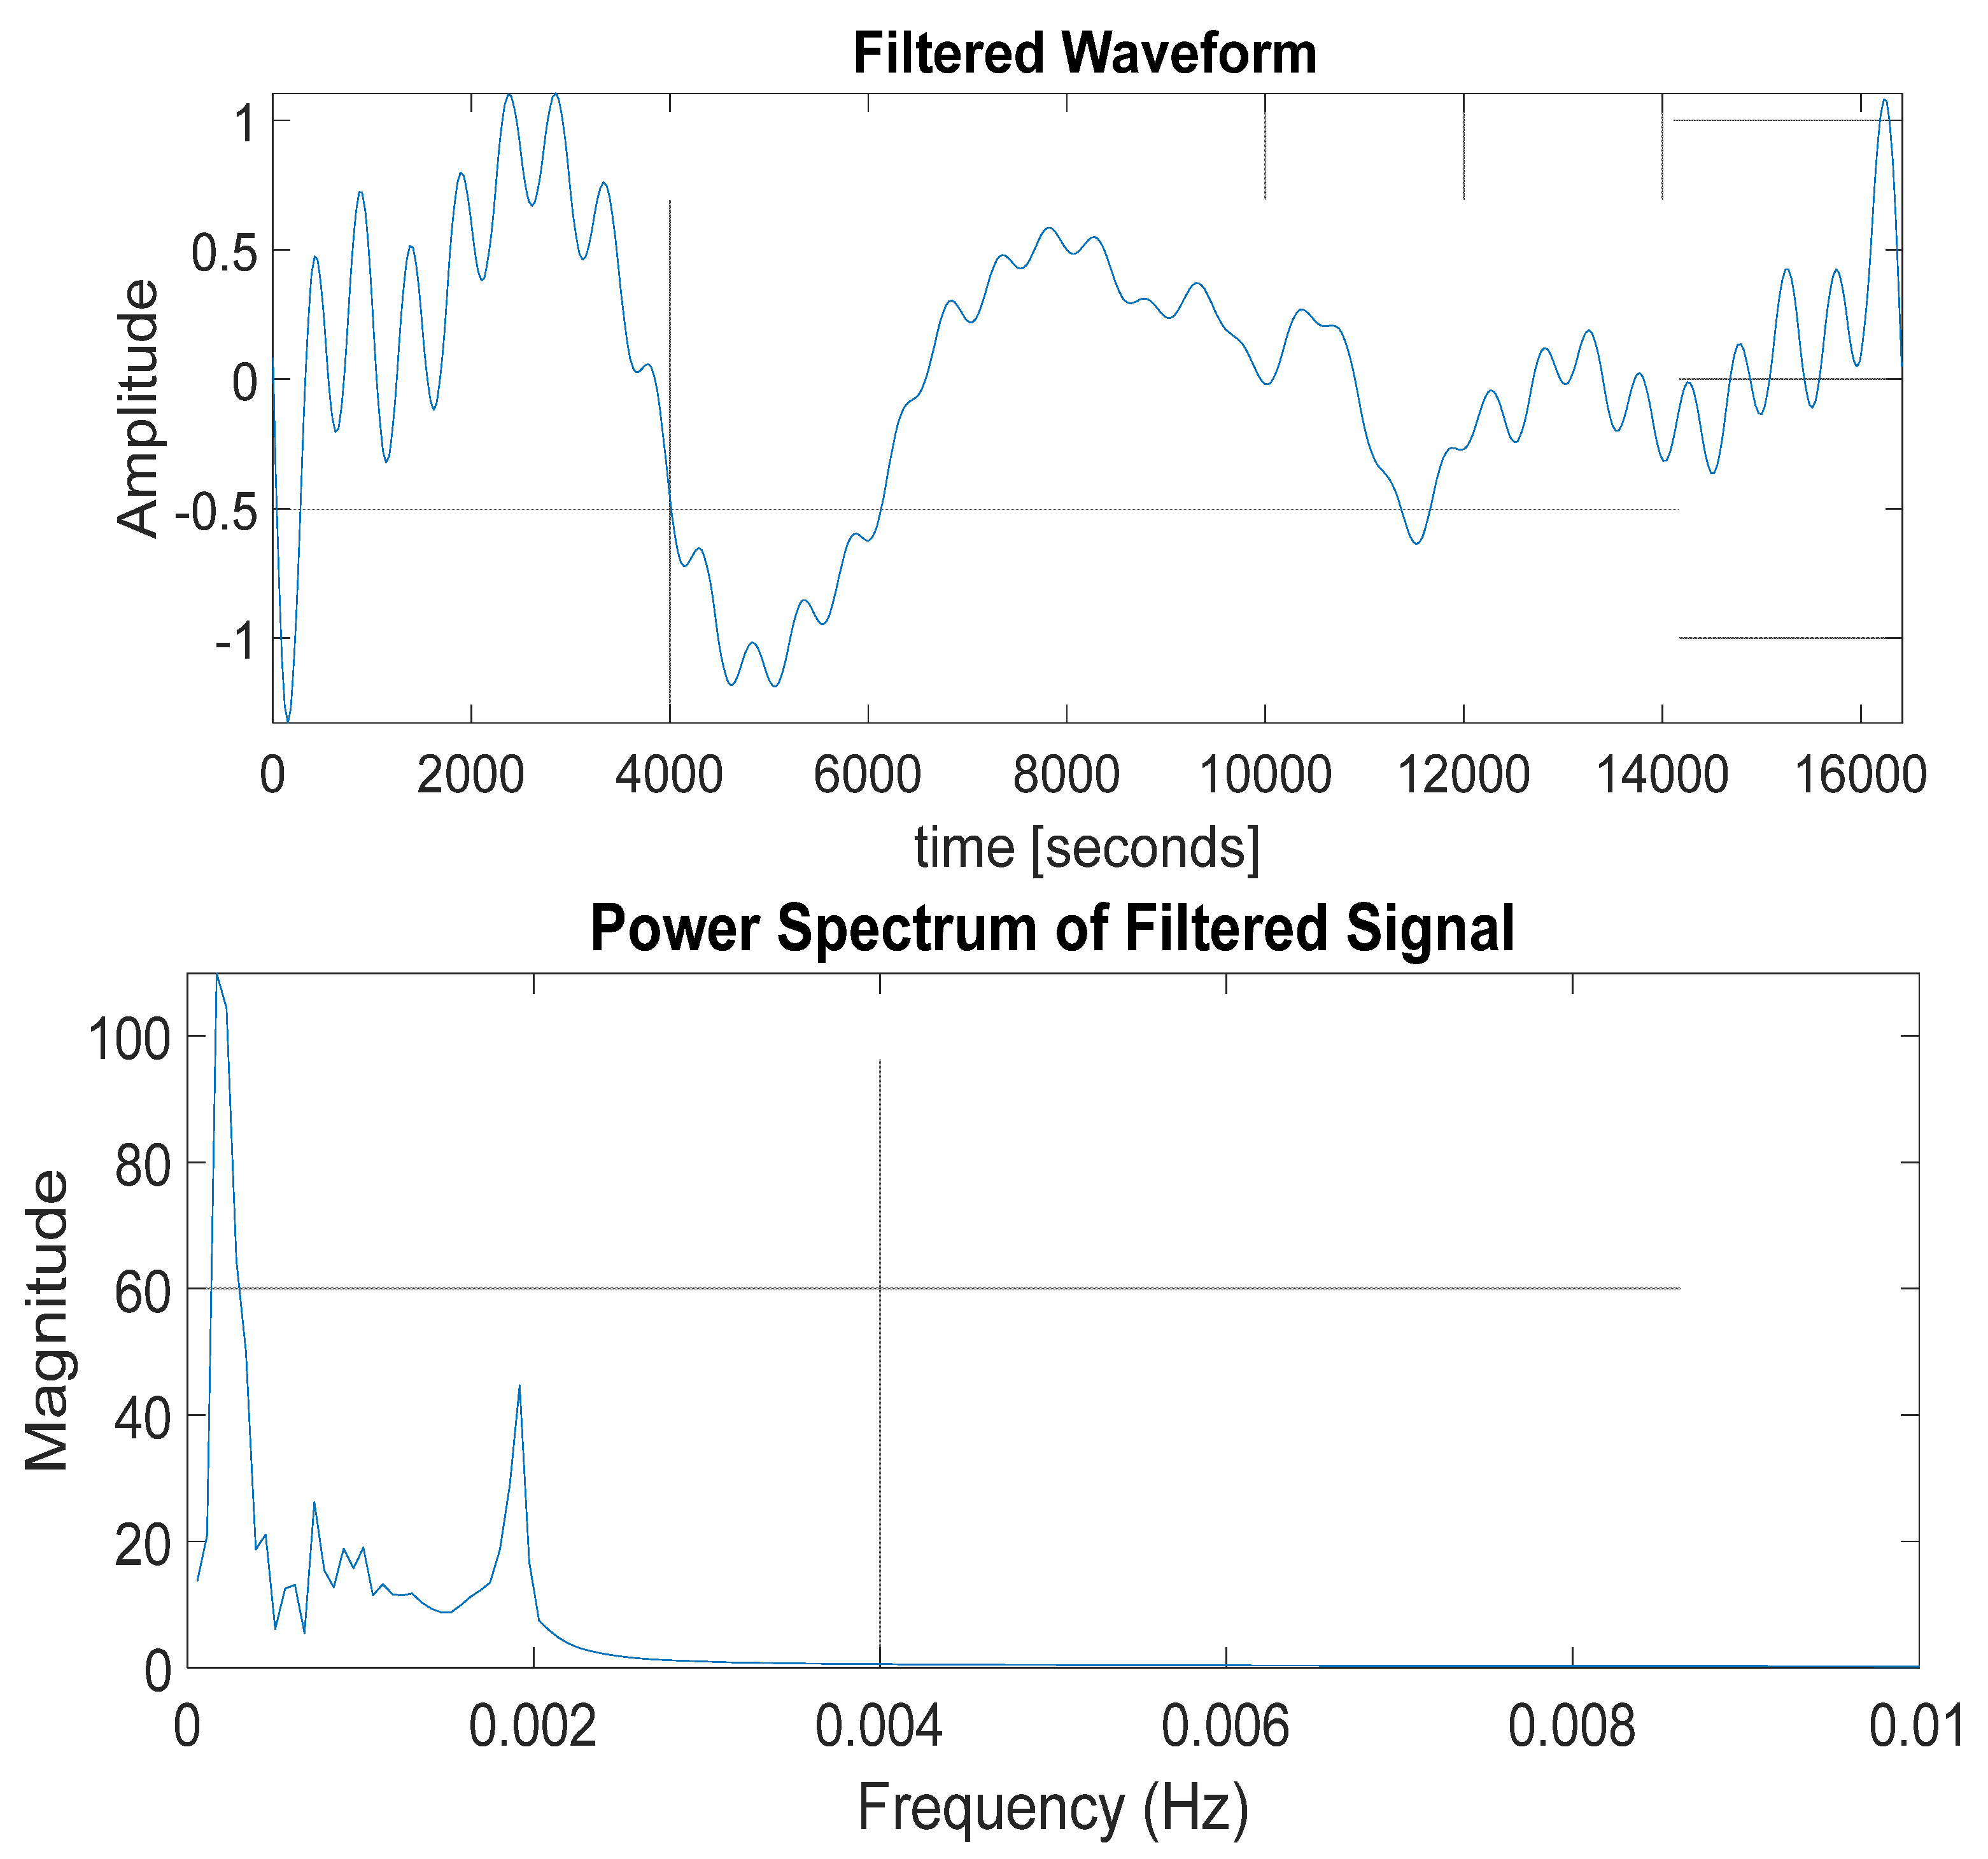
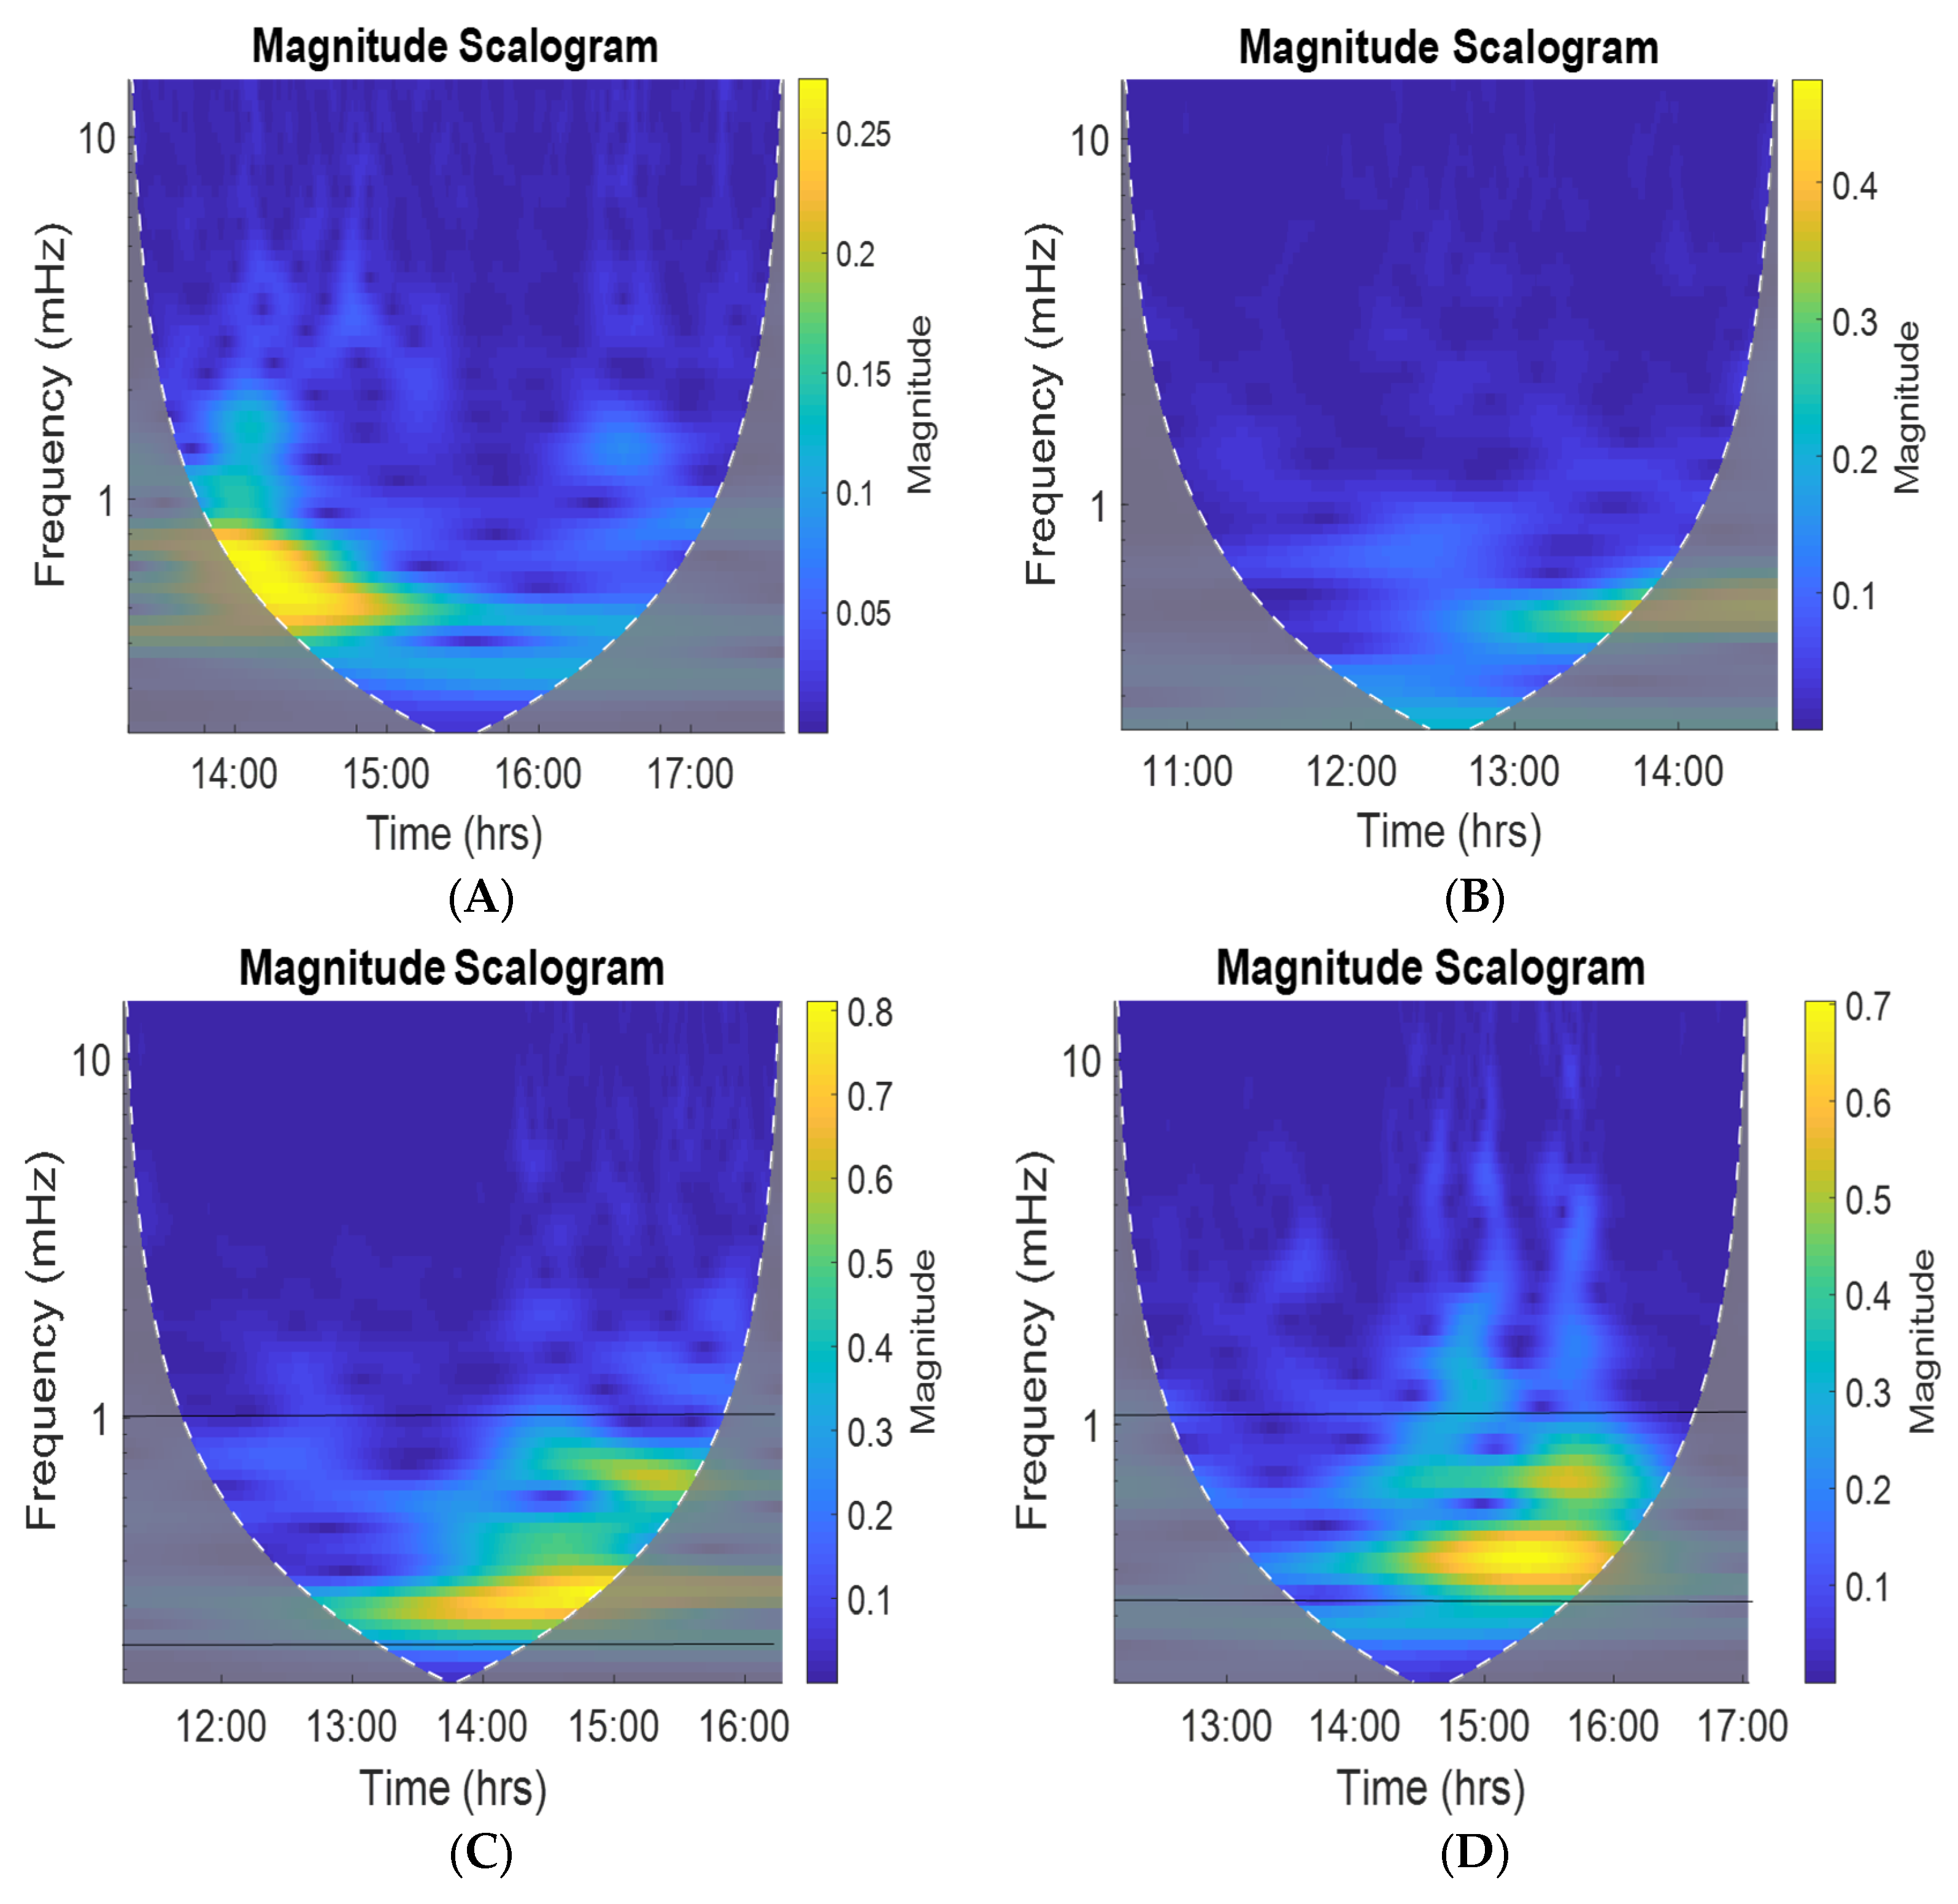
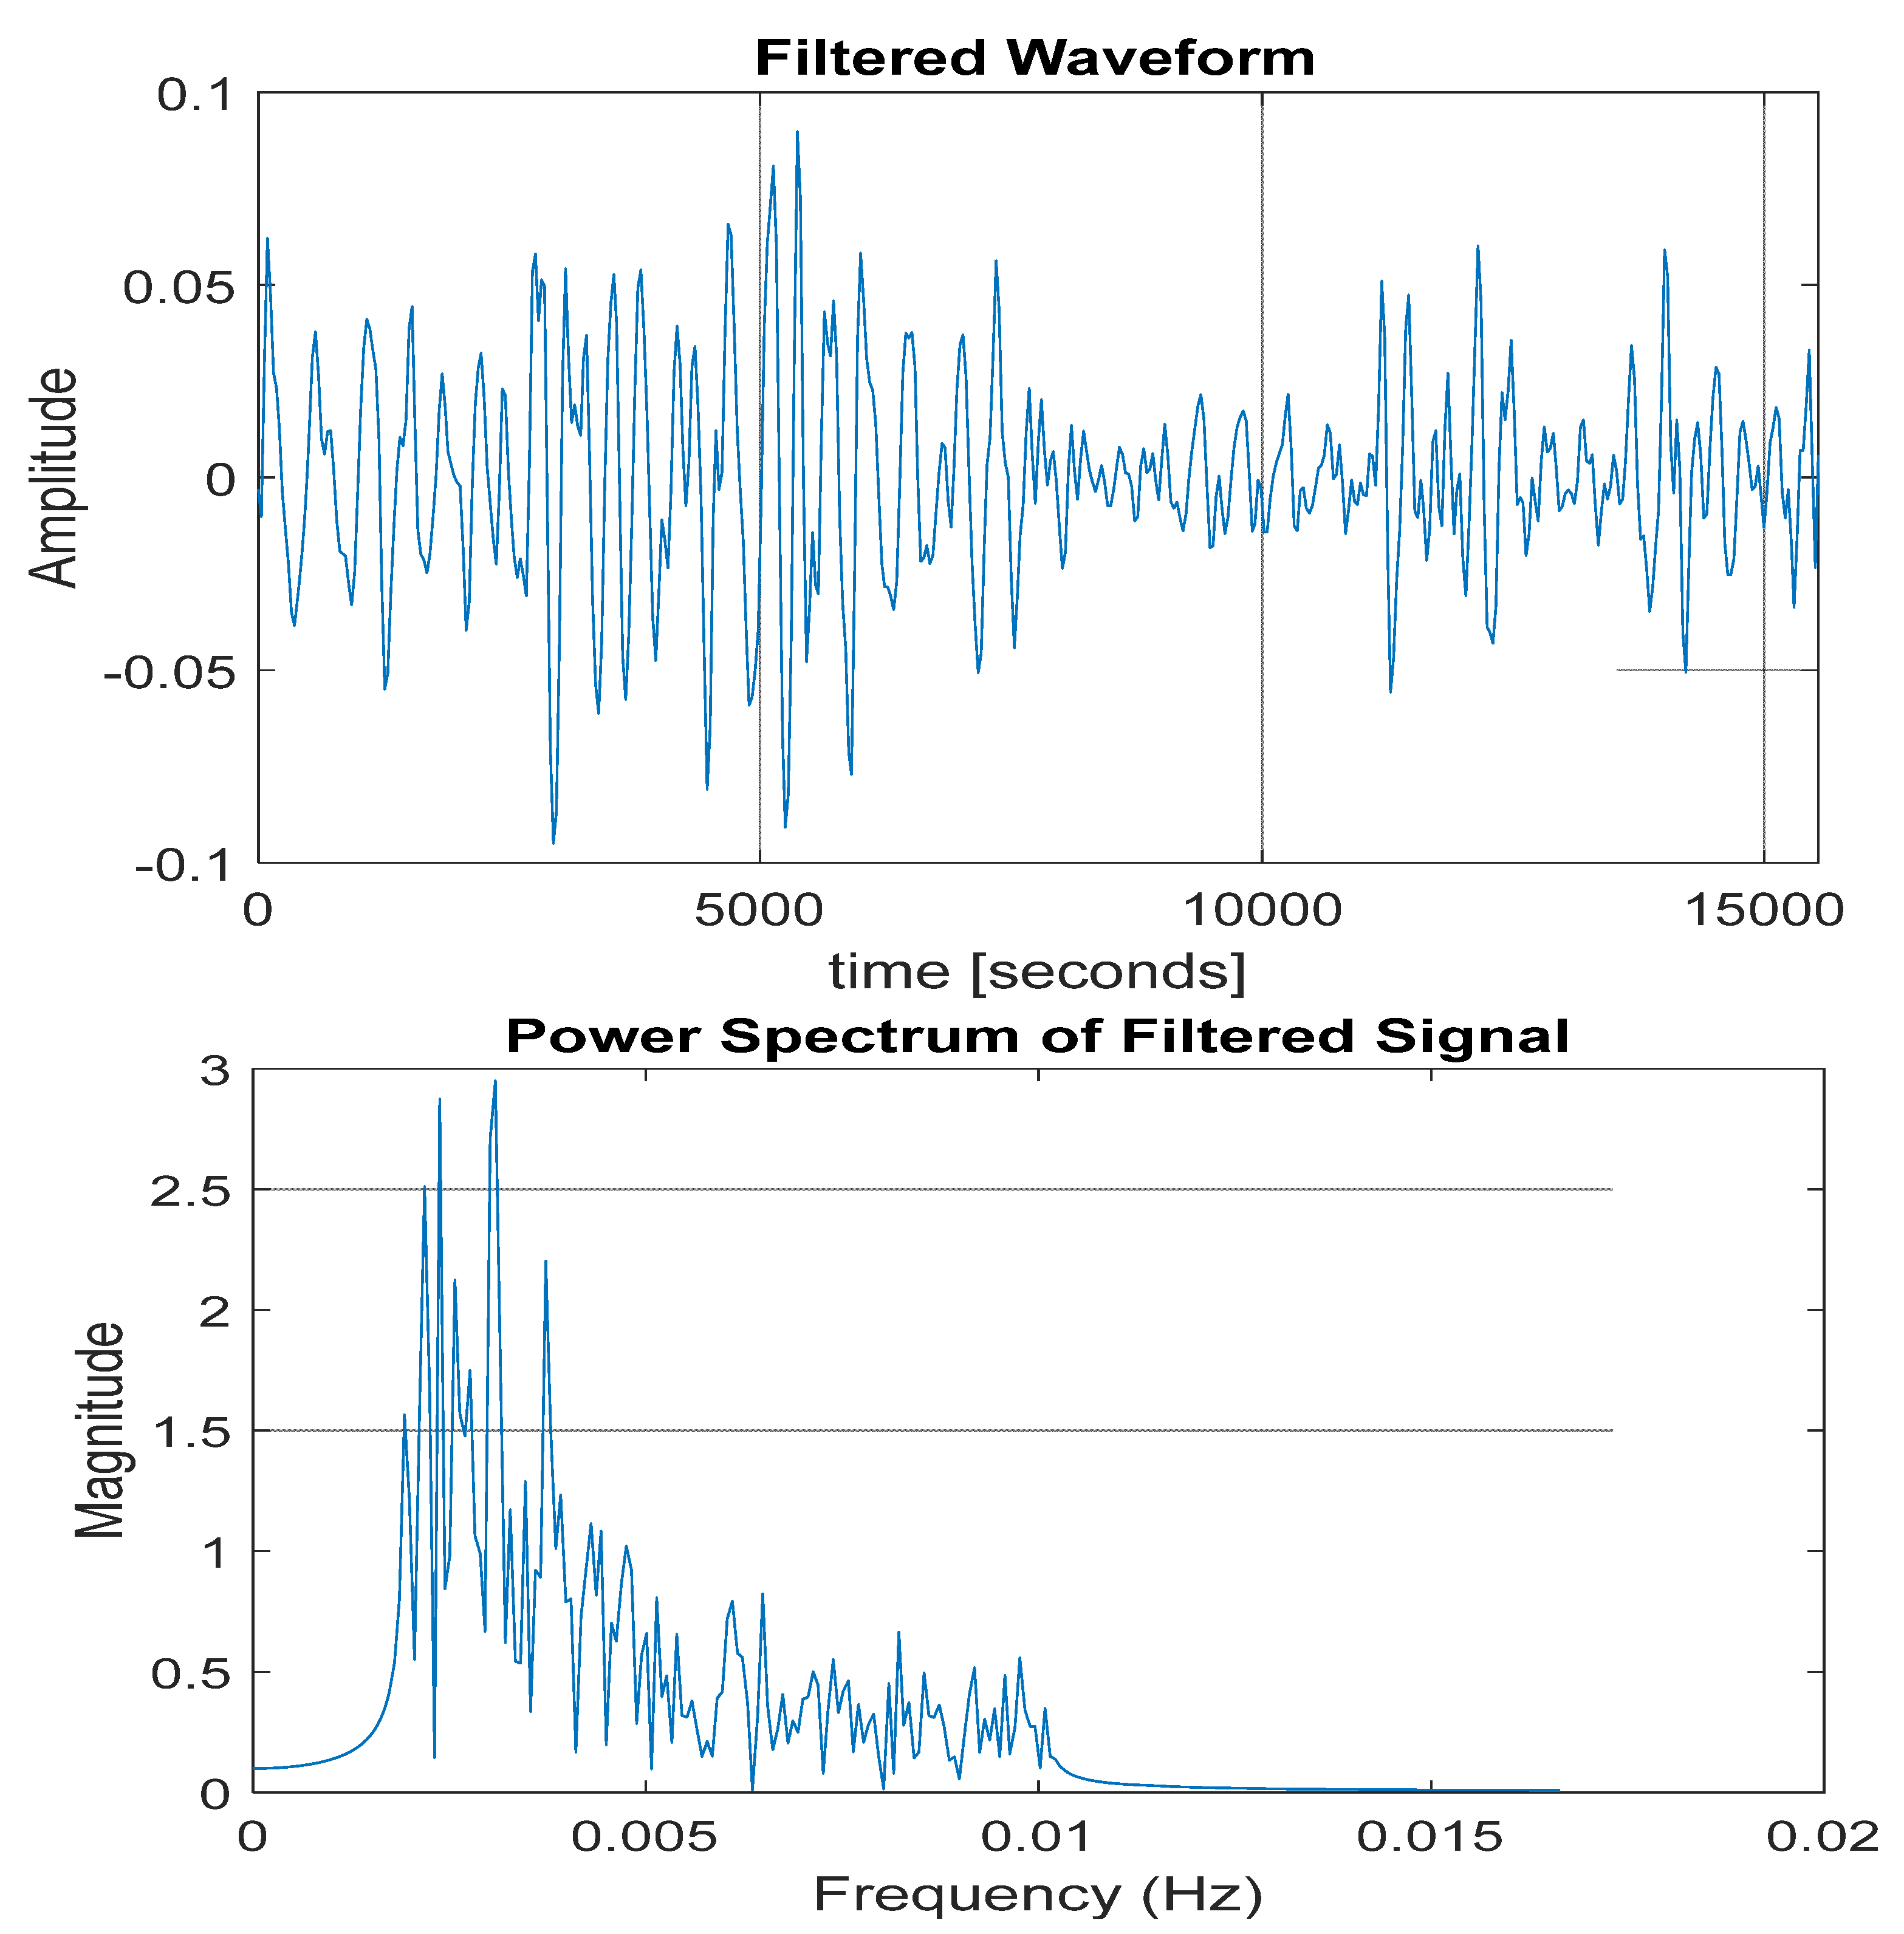
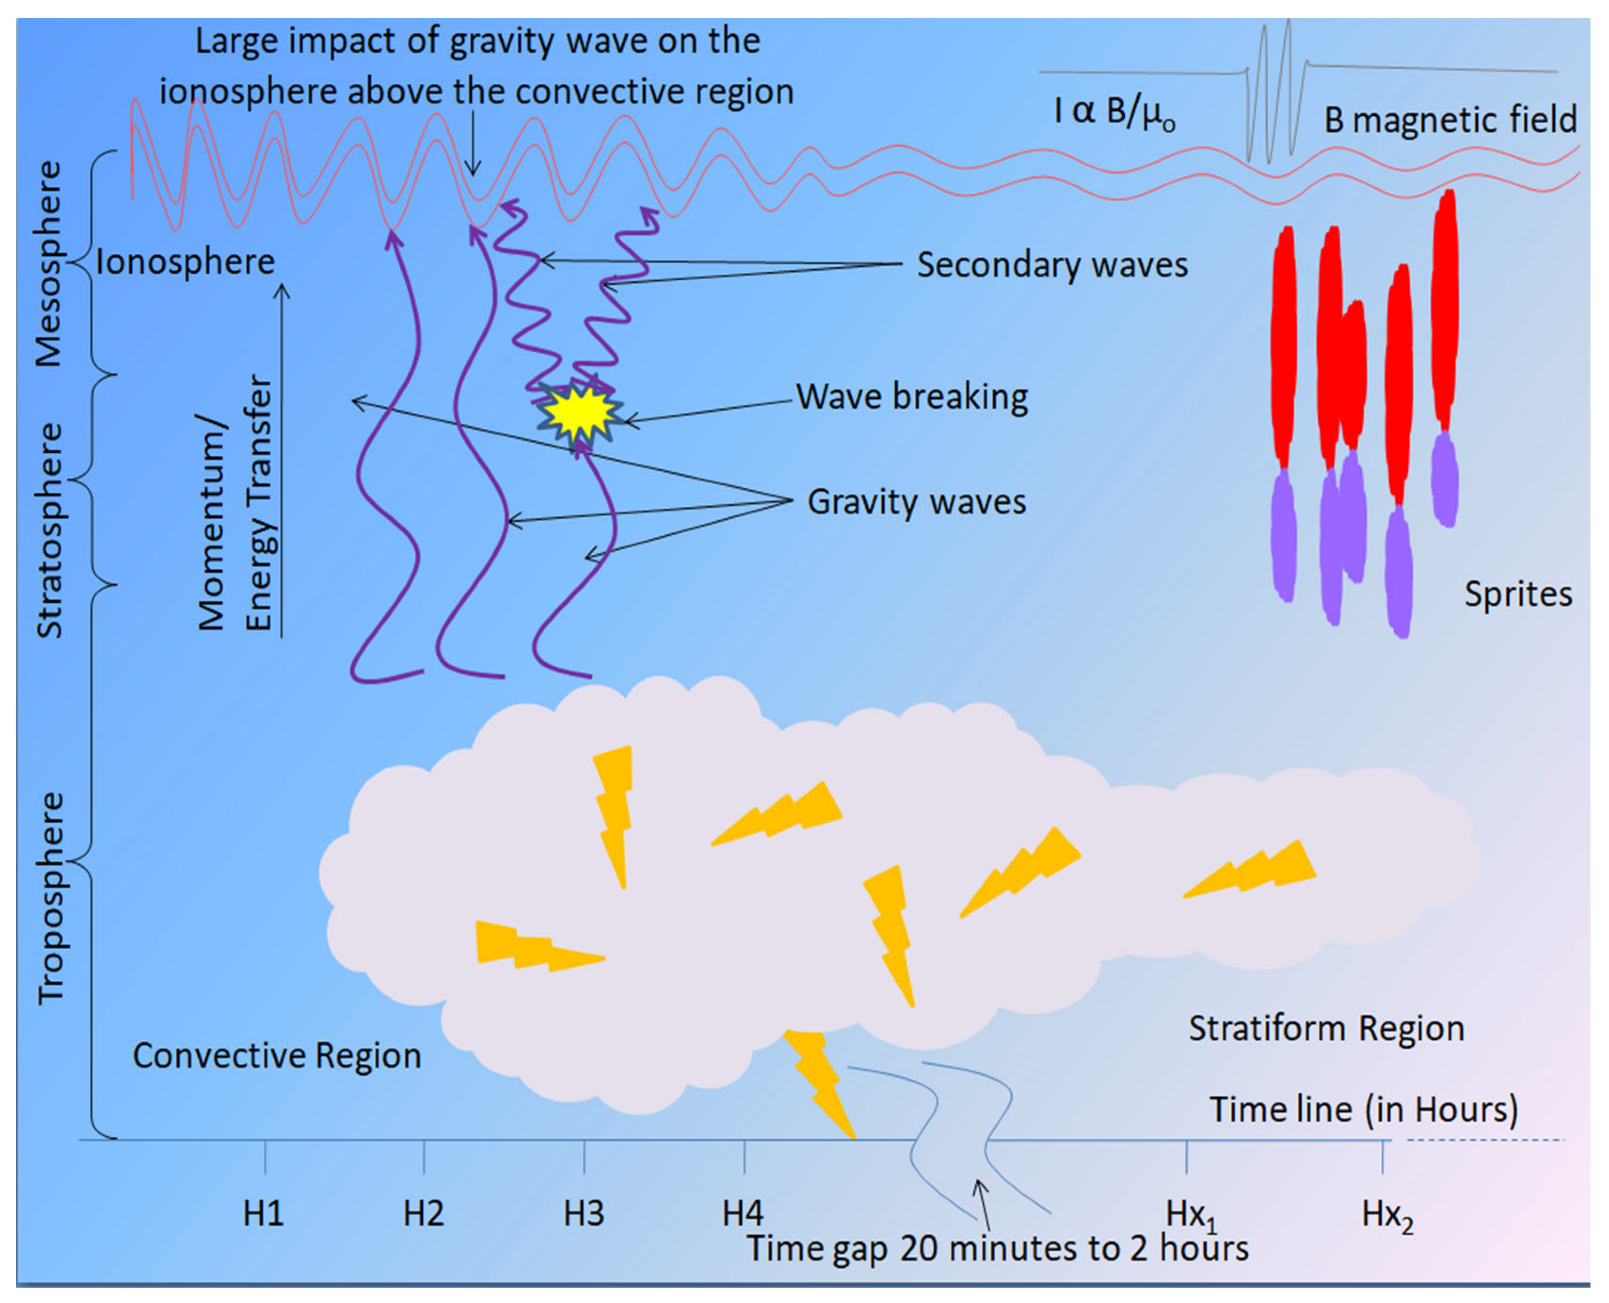
3.3. Gravity and Acoustic Waves

The results of the frequency spectrum and wavelet analysis show that TEC deviations were reactions to the dominant effect of gravity waves on the ionosphere in all cases (Figure 8, Figure 9, Figure 10 and Figure 11). The dominant gravity wave spectrum can be seen in Figure 8, showing the extracted gravity wave from the TEC deviations recorded for 8 August 2017.
The wave analysis of TEC deviations reveals the oscillation of the TEC perturbations oscillates within the gravity wave range between ~16 min and ~80 min (which is from a frequency range of about 0.2 millihertz to about 1 millihertz) for 8 August 2017. Gravity waves propagate in the upper atmosphere (within the ionospheric and tropospheric regions) and could range from a period of ~10 min to ~90 min [51]. Considering the event at Changchun, TEC deviations showed a multi-ripple variation in the TEC signal (see Figure 9), which could be seen as a superposition of a dominant gravity wave with less dominant acoustic waves (see Figure 9 upper panel), a large depletion of the TEC and a continuous ripple of small perturbations in TEC values within the time variation as the TEC measurements.
The TEC deviations at Changchun revealed gravity wave variations ranging periodically from 8 min to about 90 min. As observed in the power spectrum plot (see Figure 9 Lower panel) and for the frequency domain analysis of TEC deviations obtained at some of the stations, there was sometimes a burst of acoustic and gravity wave frequencies. The illustration in Figure 9 shows that the power spectrum for the TEC deviation measured by PRN 17 on the 4th of June 2012 revealed that the dominant energy peaked at 0.169 mHz, which is at a gravity wave range. The second energy peak, 1.9 mHz, occurred approaching the acoustic wave range. The frequencies of the measured TEC deviations usually ranged from about 0.12 mHz to 2 mHz for most of the cases considered.
From the wavelet analysis (see example in Figure 10), we could observe that the main dominant frequencies for which the highest magnitude was observed in most cases ranged between 0.3 mHz and ~1.2 mHz, which accounted for a 13 min to 55 min periodic range. The second set of dominant periodic ranges obtained from the wavelet analysis was from 7 min to 13 min, and another less dominant but visible periodic range was 2–7 min. These frequency ranges are within the gravity wave, acoustic-gravity wave, and acoustic wave ranges, respectively, with the most dominant being in the gravity wave range.
To further ascertain this result using the DFT method, a spectrum analysis of derived TEC variations at the time of the thunderstorm was performed (Figure 9 and Figure 11). The spectrum analysis showed that the dominant frequency of the TEC deviation waveform was in the gravity wave frequency range (see Figure 9). The second most dominant frequency based on the DFT analysis was found to be in the acoustic wave frequency with periods ranging from about 2 min (8 mHz) to 8 min; 20 s (2 mHz) (see Figure 11).

4. Discussion

This work demonstrates the progress in understanding the dynamics of the ionosphere during extreme thunderstorms with high lightning flash rates. In previous works, it was affirmed that gravity waves were associated with the thunderstorm mechanism for energy transfer into the upper atmosphere. In a similar manner as with previous works, gravity wave effects were measured indirectly from ionospheric TEC deviations during the period of the thunderstorm event. In this work, the thunderstorm events and the time of the event were observed by tracing convective processes through the lightning location method and using the data from WWLLN.
Although the mechanism responsible for gravity waves associated with thunderstorms was not related directly to the lightning activities that occurred during the thunderstorm, they could be related to the cloud movements system above the location and the total electric field. The lightning flashes from the convection cells, which were associated with the thunderstorm, could help us to track the location of the storm and its intensity [52,53,54].
Gravity waves from thunderstorms have been linked to traveling ionospheric disturbances (TIDs). TIDs are wavelike undulations that occur in ionospheres due to external influences that produce AGWs. Large-scale AGWs have been found to oscillate between about 10 min and 90 min [51]. The wide range of oscillation frequencies (or period of oscillation) could be due to the superposition of the traveling disturbances generated as GWs of different frequencies during the convective process. A continuous impact of the vertical propagation of AGWs could result in such undulations found in the ionosphere [55].
Gravity waves resulting from thunderstorm events are mostly propagated vertically from the troposphere through the stratosphere and the mesosphere to the lower parts of the thermosphere at oscillation periods ranging from about 10 min to about 90 min. The AGW, in different instances, propagates vertically to lower thermospheric heights and horizontally at the thermosphere through secondary waves. The forcing mechanism between the mesosphere and the thermosphere layers sometimes results in the breaking of waves (see Figure 12) into secondary waves, which can spread horizontally in the lower thermosphere [48,51].
Gravity wave transportation from the troposphere all the way to the mesosphere/thermosphere is an indication of the coupling dynamics and energy transfer between the troposphere and the ionosphere during extreme events. The generated gravity waves function as a medium for the propagation of energy and momentum from the troposphere to the ionosphere. The transfer of energy through the layers of the atmosphere results in momentum propagation from the next layer, and hence, the wave propagation continues in the next atmospheric layer until it travels through the mesosphere into the thermosphere from 90 kilometers upward in the region where the ionosphere exists.
In relation to previous works, the investigations conducted around the equator showed the most significant perturbation effect of the gravity waves on the daytime equatorial ionosphere, with the physical evidence of gravity and signatures in the form of an exceedingly large TEC deviation during the day, whereas the gravity wave signature on the ionosphere at night was unnoticeable [11]. Findings from the equatorial investigation revealed that the difference between the visibility of gravity waves during the day compared to the night-time was due to the Equatorial ionospheric anomalies [11]. The invisible gravity wave effect at night might be due to plasma instabilities due to the scintillation effect and the effects of electromagnetic Rayleigh–Taylor modes [56,57,58,59]. Other investigations have shown the effect of sporadic E and other factors that are responsible for transient night-time TEC depletions and enhancement could be responsible for the plasma variation in the equatorial region [58,59,60,61]. In contrast to this, we found in this work that gravity wave signatures were visible both during the daytime and night-time, in as much as there was a tangible amount of the electron in the ionosphere at the time of the day. This is because our study area, which is in the mid-latitude, is not characterised by the type of irregularities found in the low-latitude Equatorial region.
Similar to previous works, the thunderstorm influence on the ionosphere over the region shows the presence of gravity waves in the range of 10–60 min. We also observed the concentric mode wave propagation based on diagrams and video frames. Based on this outcome, we could attribute these observed patterns to the influence of concentric gravity waves (CGWs). A series of CGWs over northern China were consistently observed within the summer months of 2012 to 2014, from June to September [6], and the observed CGWs could be attributed to convective plumes that usually result in thunderstorms [46,49].
Although it is evident that transient luminous emissions (TLEs) can be associated with the mesoscale to large-scale convective processes [15,44], the results from this work show that large TEC deviations may result from gravity waves that may not necessarily occur during TLE events. The absence of a correlation between the TLEs and the TEC deviations due to the thunderstorm events shows that the TEC deviation relies on convective processes, despite the presence of TLEs such as sprites as in the case of 8 August 2017, which was not as large as the TEC deviation on 21 June.
The only possible inference that could be drawn from these observations is that the effect of TLEs on TEC is negligible. Even though this might be attributed to the elevated level and the dominance of the gravity waves. It can be affirmed here that the rate of ionization that resulted from TLE pulses was not active enough to produce bulk TEC displacements in TEC at a magnitude as high as the TEC displacement due to acoustic waves not to mention the magnitude of the TEC displacement by gravity waves. The required energy for photoionization in the ionosphere is usually up to 40–100 eV, whereas the photon energy from sprites is usually within the range of 1.5–3.5 eV [62], by which we can speculate that the photon energy from sprites can barely contribute to a bulk increase in the ionospheric electron density. In addition to this, we strongly believe that the contribution of TLEs to the ionosphere would be mostly based on their impact on the ionospheric current and its resultant magnetic field, considering that the ionosphere is part of the global electric circuit [15]. This observation cannot discredit the fact that TLEs can influence ionospheric dynamics, but our inference is that the TLEs events would mostly have a far stronger effect on the ionospheric current system than on TEC. An investigation that showed the influence of TLEs on the ionosphere was conducted using magnetic (B)-field measurements [15,44]; this has been suggested to be related to the ionospheric current when producing the magnetic field (see Figure 12).
The effect of lightning and TLEs resulting from thunderstorms could drive the ionospheric dynamics in other forms; reports have shown that sporadic E-layer enhancement could be driven by lightning-stroke energy. Evidence has shown that the Es layer can be enhanced with an increase in the critical frequency δ f 0 E during lightning events [10,17]. The evidence of this influence of lightning on the ionosphere, which has been reported to possess metallic species such as Na, Mg, and k, shows that there is an enhancement in the neutral Na layer above thunderstorms at a height of up to 100 km and above [5,63].
Although, in different cases, the dynamics of the ionospheric thunderstorm effect might involve the horizontal propagation of resulting perturbations [11], it has been reported that the propagation of ionospheric disturbances can be mostly propagated in a specific direction. In this work, however, there was no visible propagation direction except for the concentric perturbations evident in the spatial plots and video frames. We can infer that the gravity waves were mostly directed vertically and resulted in undulating perturbations and, hence, the coupling between the two atmospheric layers. Based on the results obtained from our investigations (See Figure 3d and Figure 4d), there was a concentric propagation of waves at the area of the event. In support of this, the lightning cell grids produced by WWLLN for the thunderstorms appeared to be almost stationary without any given direction for the shorter duration, or that might be due to slow movement. The only explanation for this point is that the energy transfer was mostly vertical.
The observed and extracted dynamical variations based on the thunderstorm dynamics showed particularly large ionospheric responses to these events in the Northern China Yellow Sea region for thunderstorm events at different locations. The large TEC dynamics could be attributed to the frequent deep convective systems frequently observed in this region. The concentric mode disturbance observed in our spatial analysis shows that our observations are in tandem with previous works, as mentioned earlier [6,46,49]. The observed periodic disturbances were mostly found to oscillate within the acoustic-gravity wave range. Our results clearly exhibit the effects of the response of the ionosphere to extreme atmospheric events. This gives further clarity to the existing knowledge of tropospheric–ionospheric interactions during extreme lower atmospheric events. The continuation of this research should include more investigations and inquisition into this area of study to further understand the time lag between gravity wave variations and the electromagnetic components of thunderstorm events and to further differentiate between the impact of these two components. Further research may also help to establish the true response of the ionospheric dynamics to the effect of extreme tropospheric weather and other transient high-energy atmospheric conditions.

5. Conclusions

The responses of the ionosphere to perturbations resulting from thunderstorm events were examined in this work to observe their acoustic and mechanical responses. To accomplish this, ionospheric TEC deviations were extracted from GPS satellite measurements and analyzed further using two periodic and frequency domain analytical methods, which were DFT for the frequency spectrum analysis and wavelet analysis to observe the dominant frequency ranges of TEC deviations. These findings, when compared to previous works show that night-time variations were more visible around the region examined, contrary to previous works involving the equator [11].
The following observations were found to be the highlights of this work:
  • Large variations of about a 10–15% TEC increase/depletion in comparison with average diurnal peak TECs demonstrated severe impacts on the ionosphere.
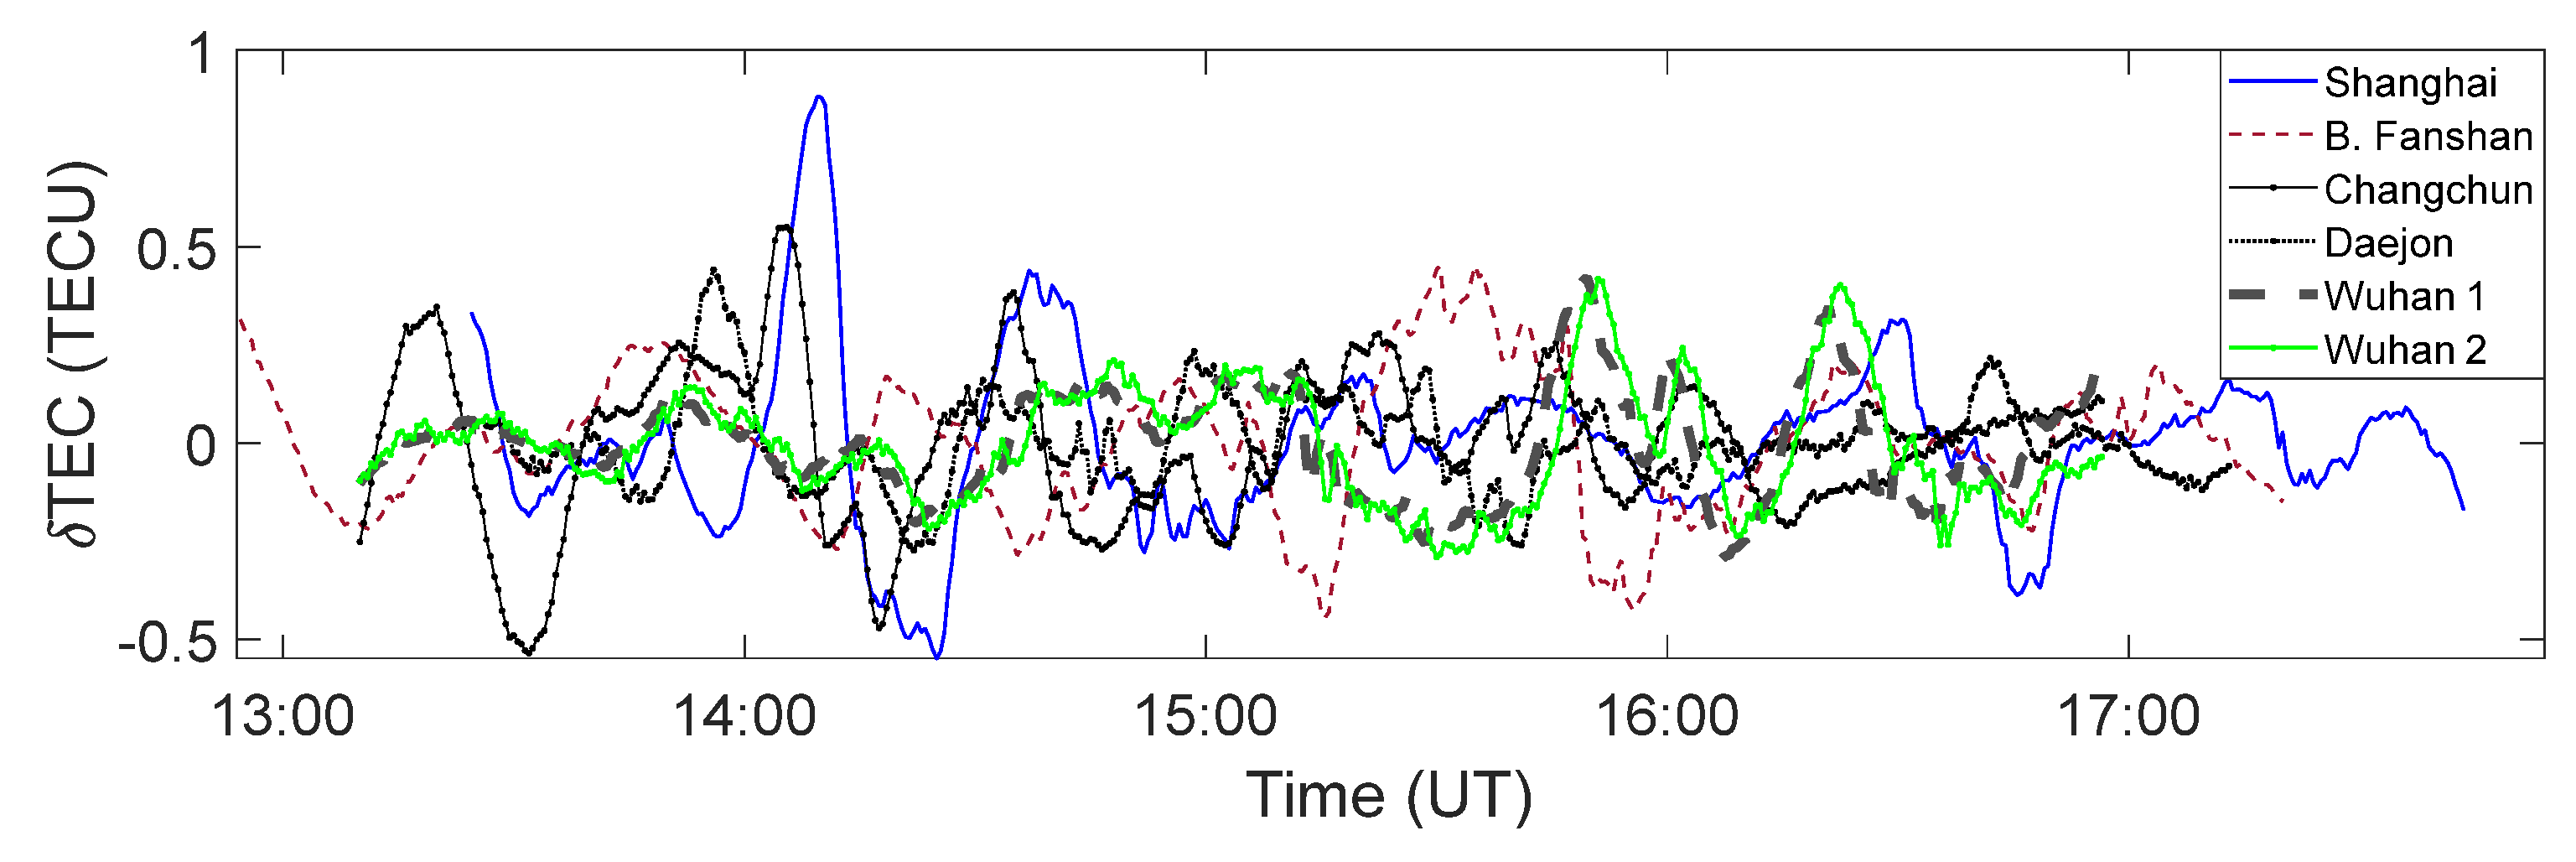
  • Spatial concentric ionospheric gravity wave signatures were observed with a 2–60 min period and dominant oscillations between 16 and 60 min.
  • About a 30 min delay between the Peak TEC deviation and the time of sprite occurrence was observed.
These observations emphasize the importance of the study of the coupling dynamics between the troposphere and ionosphere during extreme tropospheric events. Our findings are an indication for a further examination of the responses of the ionosphere due to these events. Additionally, the findings from this work can open more possible pathways to modeling the ionospheric responses to tropospheric responses. In the future, more work is required on the coupling dynamics of the lower atmosphere and the ionosphere, particularly during extreme events. Additionally, the effect of sprites on the ionosphere should be further explored.

Supplementary Materials

The following supporting information can be downloaded at: https://www.mdpi.com/article/10.3390/rs15102572/s1, File: A Supplementary to Article. Figures S1–S4: Spatial time plots for days without thunderstorms; Figures S5 and S6: line plots for days without thunderstorms; Figures S7–S10: Illustration plots day around the thunderstorms; Figure S11: Spatial time illustration of TEC deviation; Figure S12: Contour of extrapolated absolute peak TEC.

Author Contributions

Conceptualization, B.O.O., methodology, B.O.O.; software, B.O.O., A.S., C.O., O.E.A.; validation, B.O.O., X.Q., A.S., R.J., J.Y. and C.O.; formal analysis, B.O.O., A.S. and O.E.A.; investigation, B.O.O.; resources, B.O.O., X.Q., J.Y. and R.J.; data curation, B.O.O., A.S., J.Y.; writing—original draft preparation, B.O.O.; writing—review and editing B.O.O., X.Q., A.S., R.J., J.Y., O.E.A. and C.O.; visualization, B.O.O., A.S., O.E.A. and C.O.; supervision, X.Q.; project administration, X.Q., B.O.O. and R.J.; funding acquisition, X.Q. All authors have read and agreed to the published version of the manuscript.

Funding

This research is jointly supported by the National Natural Science Foundation of China (Grant Nos. 42230609, 41630425).

Data Availability Statement

The authors would like to thank the World-Wide Lightning Location Network (http://wwlln.net (accessed on 23 February 2023)) for providing the lightning flash data. We also thank the international GPS service (IGS) for the TEC data.

Conflicts of Interest

The authors declare no conflict of interest.

References

  1. Cheng, Z.; Cumber, S.A.; Su, H.-T.; Hsu, R.R. Broadband very low frequency measurement of D region ionospheric perturbations caused by lightning electromagnetic pulses. J. Geophys. Res. 2007, 112, A06318. [Google Scholar] [CrossRef]
  2. Lay, E.H.; Shao, X.-M. High temporal and spatial resolution detection of D-layer fluctuations by using time-domain lightning waveforms. J. Geophys. Res. 2011, 116, A01317. [Google Scholar] [CrossRef]
  3. Lay, E.H.; Shao, X.-M. Multi-station probing of thunderstorm-generated D-layer fluctuations by using time-domain lightning waveforms. Geophys. Res. Lett. 2021, 38, L23806. [Google Scholar] [CrossRef]
  4. Lay, E.H.; Shao, X.M.; Carrano, C.S. Variation in total electron content above large thunderstorms. Geophys. Res. Lett. 2013, 40, 1945–1949. [Google Scholar] [CrossRef]
  5. Shao, X.M.; Lay, E.H.; Jacobson, A.R. Reduction of electron density in the night-time lower ionosphere in response to a thunderstorm. Nat. Geosci. 2013, 6, 29–33. [Google Scholar] [CrossRef]
  6. Xu, J.; Li, Q.; Yue, J.; Hoffmann, L.; Straka, W.C.; Wang, C.; Liu, M.; Yuan, W.; Han, S.; Miller, S.D.; et al. Concentric gravity waves over northern China observed by an airglow imager network and satellites. J. Geophys. Res. Atmos. 2015, 120, 11058–11078. [Google Scholar] [CrossRef]
  7. Yu, B.; Xue, X.; Lu, G.; Kuo, C.; Dou, X.; Gao, Q.; Tang, Y. The enhancement of neutral metal Na layer above thunderstorms. Geophys. Res. Lett. 2017, 44, 9555–9563. [Google Scholar] [CrossRef]
  8. Cheng, Z.; Cummer, S.A. Broadband VLF measurements of lightning-induced ionospheric perturbations. Geophys. Res. Lett. 2005, 32, L08804. [Google Scholar] [CrossRef]
  9. Lay, E.H.; Shao, X.-M.; Kendrick, A.K.; Carrano, C.S. Ionospheric acoustic and gravity waves associated with midlatitude thunderstorms. J. Geophys. Res. Space Physics 2015, 120, 6010–6020. [Google Scholar] [CrossRef]
  10. Yu, B.; Xue, X.; Lu, G.; Ma, M.; Dou, X.; Qie, X.; Ning, B.; Hu, L.; Wu, J.; Chi, Y. Evidence for lightning-associated enhancement of the ionospheric sporadic E layer dependent on lightning stroke energy. J. Geophys. Res. Space Physics 2015, 120, 9202–9212. [Google Scholar] [CrossRef]
  11. Ogunsua, B.O.; Srivastava, A.; Bian, J.; Qie, X.; Wang, D.; Jiang, R.; Yang, J. Significant Day-time Ionospheric Perturbation by Thunderstorms along the West African and Congo Sector of Equatorial Region. Sci. Rep. 2020, 10, 8466. [Google Scholar] [CrossRef]
  12. Pasko, V.P.; Inan, U.S.; Taranenko, Y.N.; Bell, T.F. Heating, ionization and upward discharges in the mesosphere due to intense Quasi electrostatic thundercloud fields. Geophys. Res. Lett. 1995, 22, 365–368. [Google Scholar] [CrossRef]
  13. Inan, U.S.; Pasko, V.P.; Bell, T.F. Sustained heating of the ionosphere above thunderstorms as evidenced in the early/fast VLF events. Geophys. Res. Lett. 1995, 23, 1067–1070. [Google Scholar] [CrossRef]
  14. Yang, J.; Qie, X.; Zhang, G.; Zhao, Y.; Zhang, T. Red sprites over thunderstorms in the coast of Shandong province, China. Chin. Sci. Bull. 2008, 53, 1079–1086. [Google Scholar]
  15. Huang, A.; Lu, G.; Zhang, H.; Liu, F.; Fan, Y.; Zhu, B.; Yang, J.; Wang, Z. Locating Parent Lightning Strokes of Sprites Observed over a Mesoscale Convective System in Shandong Province, China. Adv. Atmos. Sci. 2018, 35, 1396–1414. [Google Scholar] [CrossRef]
  16. Kabirzadeh, R.; Marshall, R.A.; Inan, U.S. Early/fast VLF events produced by the quiescent heating of the lower ionosphere by thunderstorms. J. Geophys. Res. Atmos. 2017, 122, 6217–6230. [Google Scholar] [CrossRef]
  17. Davis, C.J.; Johnson, C.G. Lightning-induced intensification of the ionospheric sporadic E layer. Nature 2005, 435, 799–801. [Google Scholar] [CrossRef]
  18. Soula, S.; Mlynarczyk, J.; Füllekrug, M.; Georgis, J.-F.; van der Velde, O.; Fabró, F. Dancing sprites: Detailed analysis of two case studies. J. Geophys. Res. Atmos. 2017, 122, 3173–3192. [Google Scholar] [CrossRef]
  19. Yang, J.; Qie, X.S.; Feng, G.L. Characteristics of one sprite-producing summer thunderstorm. Atmos. Res. 2013, 127, 90–115. [Google Scholar] [CrossRef]
  20. Yang, J.; Sato, M.; Liu, N.; Lu, G.; Wang, Y.; Wang, Z. A gigantic jet observed over a mesoscale convective system in midlatitude region. J. Geophys. Res. Atmos. 2018, 123, 977–996. [Google Scholar] [CrossRef]
  21. Yang, J.; Liu, N.; Sato, M.; Lu, G.; Wang, Y.; Feng, G. Characteristics of thunderstorm structure lightning activity causing negative positive sprites. J. Geophys. Res. Atmos. 2018, 123, 8190–8207. [Google Scholar] [CrossRef]
  22. Liu, N.; Dwyer, J.R.; Stenbaek-Nielsen, H.C.; McHarg, M.G. Sprite streamer initiation from natural mesospheric structures. Nat. Comm. 2015, 6, 7540. [Google Scholar] [CrossRef] [PubMed]
  23. Qin, J.; Pasko, V.P.; McHarg, M.G.; Stenbeak-Nielsen, H.C. Plasma irregularities in the D-region ionosphere in association with sprite streamer initiation. Nat. Comm. 2014, 5, 3740. [Google Scholar] [CrossRef]
  24. Dowden, R.L.; Holzworth, R.H.; Rodger, C.J.; Lichtenberger, J.; Thomson, N.R.; Jacobson, A.R.; Lay, E.; Brundell, J.B.; Lyons, T.J.; Kawasaki, Z.; et al. World-wide lightning location using VLF propagation in the Earth-ionosphere waveguide. IEEE Antennas Propag. Mag. 2008, 50, 40–60. [Google Scholar] [CrossRef]
  25. Abarca, S.F.; Corbosiero, K.L.; Galarneau, T.J. An evaluation of the Worldwide Lightning Location Network (WWLLN) using the National Lightning Detection Network (NLDN) as ground truth. J. Geophys. Res. Atmos. 2010, 115, 1–11. [Google Scholar] [CrossRef]
  26. Abreu, D.; Chandan, D.; Holzworth, R.H.; Strong, K. A performance assessment of the World-Wide Lightning Location Network (WWLLN) via comparison with the Canadian Lightning Detection Network (CLDN). Atmos. Meas. Tech. 2010, 3, 1143–1153. [Google Scholar] [CrossRef]
  27. Srivastava, A.; Tian, Y.; Qie, X.; Wang, D.; Sun, Z.; Yuan, S.; Wang, Y.; Chen, Z.; Xu, W.; Zhang, H.; et al. Performance assessment of Beijing Lightning Network (BLNET) and comparison with other lightning location networks across Beijing. Atmos. Res. 2017, 197, 76–83. [Google Scholar] [CrossRef]
  28. Feng, G.; Qie, X.; Yuan, T.; Niu, S. Analysis on lightning activity and precipitation structure of hailstorms. Sci. China Ser. D Earth Sci. 2007, 50, 629–639. [Google Scholar] [CrossRef]
  29. Liu, D.; Qie, X.; Xiong, Y.; Feng, G. Evolution of the total lightning activity in a leading-line and trailing stratiform mesoscale convective system over Beijing. Adv. Atmos. Sci. 2011, 28, 866–878. [Google Scholar] [CrossRef]
  30. Pan, L.; Qie, X.; Wang, D. Lightning activity and its relation to the intensity of typhoons over the Northwest Pacific Ocean. Adv. Atmos. Sci. 2014, 31, 581–592. [Google Scholar] [CrossRef]
  31. Qie, X.; Yuan, S.; Chen, Z.; Wang, D.; Liu, D.; Sun, M.; Sun, Z.; Srivastava, A.; Zhang, H.; Lu, J.; et al. Understanding the dynamical-microphysical-electrical processes associated with severe thunderstorms over the Beijing metropolitan region. Sci. China Earth Sci. 2021, 64, 10–26. [Google Scholar] [CrossRef]
  32. Lu, J.; Qie, X.; Xiao, X.; Jiang, R.; Mansell, E.R.; Fierro, A.O.; Liu, D.; Chen, Z.; Yuan, S.; Sun, M.; et al. Effects of convective mergers on the evolution of microphysical electrical activity in a severe squall line simulated by WRF coupled with explicit electrification scheme. J. Geophys. Res. Atmos. 2022, 127, e2021JD036398. [Google Scholar] [CrossRef]
  33. Chen, Z.; Qie, X.; Sun, J.; Xiao, X.; Zhang, Y.; Cao, D.; Yang, J. Evaluation of Fengyun-4A Lightning Mapping Imager (LMI) Performance during Multiple Convective Episodes over Beijing. Remote Sens. 2021, 13, 1746. [Google Scholar] [CrossRef]
  34. Xiao, X.; Qie, X.; Chen, Z.; Lu, J.; Ji, L.; Wang, D.; Zhang, L.; Chen, M.; Chen, M. Evaluating the Performance of Lightning Data Assimilation from BLNET Observations in a 4DVAR-Based Weather Nowcasting Model for a High-Impact Weather over Beijing. Remote Sens. 2021, 13, 2084. [Google Scholar] [CrossRef]
  35. Wang, Y.; Lu, G.; Shi, T.; Ma, M.; Zhu, B.; Liu, D.; Peng, C.; Wang, Y. Enhancement of cloud-to-ground lightning activity caused by the urban effect: A case study in the Beijing metropolitan area. Remote Sens. 2021, 13, 1228. [Google Scholar] [CrossRef]
  36. Xu, M.; Qie, X.; Pang, W.; Shi, G.; Liang, L.; Sun, Z.; Yuan, S.; Zhu, K.; Zhao, P. Lightning climatology across the Chinese continent from 2010 to 2020. Atmos. Res. 2022, 275, 106251. [Google Scholar] [CrossRef]
  37. Ciraolo, L.; Spalla, P. Comparison of TEC evaluation from NNSS and GPS. Radio Sci. 1997, 32, 1071–1080. [Google Scholar] [CrossRef]
  38. Ciraolo, L.; Azpilicueta, F.; Brunini, C.; Meza, A.; Radicella, S.M. Calibration errors on experimental slant total electron content (TEC) determined with GPS. J. Geodesy 2007, 81, 111–120. [Google Scholar] [CrossRef]
  39. Klobuchar, J.A. Design and Characteristics of the GPS Ionospheric Time Delay Algorithm for Single Frequency Users. In Proceedings of the PLANS’86—Position Location and Navigation Symposium, Las Vegas, NV, USA, 4–7 November 1986; pp. 280–286. [Google Scholar]
  40. Mannucci, A.J.; Wilson, B.D.; Yuan, D.N.; Ho, C.H.; Lindqvister, U.J.; Runge, T.F. A global mapping technique for GPS-derived ionospheric total electron content measurements. Radio Sci. 1998, 33, 565–582. [Google Scholar] [CrossRef]
  41. Norsuzila, Y.; Abdullah, M.; Ismail, M.; Zaharim, A. Model validation for GPS total electron content using 10th polynomial function technique at an equatorial region. WSEAS Trans. Comp. 2009, 8, 1533–1542. [Google Scholar]
  42. Srivastava, A.; Liu, D.; Xu, C.; Yuan, S.; Wang, D.; Ogunsua, B.; Sun, Z.; Chen, Z.; Zhang, H. Lightning nowcasting with an algorithm of thunderstorm tracking based on lightning location data over the Beijing area. Adv. Atmos. Sci. 2022, 39, 178–188. [Google Scholar] [CrossRef]
  43. Ozeki, M.; Heki, K. Ionospheric holes made by ballistic missiles from North Korea detected with a Japanese dense GPS array. J. Geophys. Res. 2010, 115, A09314. [Google Scholar] [CrossRef]
  44. Wang, Y.; Lu, G.; Ma, M.; Zhang, H.; Fan, Y.; Liu, G.; Wan, Z.; Wang, Y.; Peng, K.-M.; Peng, C.; et al. Triangulation of red sprites observed above a mesoscale convective system in North China. Earth Planet. Phys. 2019, 3, 111–125. [Google Scholar] [CrossRef]
  45. Vadas, S.L.; Fritts, D.C. Influence of solar variability on gravity wave structure and dissipation in the thermosphere from tropospheric convection. J. Geophys. Res. 2006, 111, A10S12. [Google Scholar] [CrossRef]
  46. Yue, J.; Vadas, S.L.; She, C.-Y.; Nakamura, T.; Reising, S.C.; Liu, H.-L.; Stamus, P.; Krueger, D.A.; Lyons, W.; Li, T. Concentric gravity waves in the mesosphere generated by deep convective plumes in the lower atmosphere near Fort Collins, Colorado. J. Geophys. Res. 2009, 114, D06104. [Google Scholar] [CrossRef]
  47. Lyons, W.A.; Nelson, T.E.; Williams, E.R.; Cummer, S.A.; Stanley, M.A. Characteristics of Sprite-Producing Positive Cloud-to-Ground Lightning during the 19 July 2000 STEPS Mesoscale Convective Systems. Mon. Weather. Rev. 2003, 131, 2417–2427. [Google Scholar] [CrossRef]
  48. Vadas, S.L. Horizontal and vertical propagation and dissipation of gravity waves in the thermosphere from lower atmospheric and thermospheric sources. J. Geophys. Res. 2007, 112, A06305. [Google Scholar] [CrossRef]
  49. Vadas, S.L.; Yue, J.; She, C.Y.; Stamus, P.; Liu, A.Z. A model study of the effects of winds on concentric rings of gravity waves from a convective plume near Fort Collins on 11 May 2004. J. Geophys. Res. 2009, 114, D06103. [Google Scholar] [CrossRef]
  50. Suzuki, T.; Kamogawa, M.; Fujiwara, H.; Hayashi, S. MCS Stratiform and Convective Regions Associated with Sprites Observed from Mt. Fuji. Atmosphere 2022, 13, 1460. [Google Scholar] [CrossRef]
  51. Azeem, I.; Yue, J.; Hoffmann, L.; Miller, S.D.; Straka, W.C., III; Crowley, G. Multi-sensor profiling of a concentric gravity wave event propagating from the troposphere to the ionosphere. Geophys. Res. Lett. 2015, 42, 7874–7880. [Google Scholar] [CrossRef]
  52. Blanc, E.; Farges, T.; Le Pichon, A.; Heinrich, P. Ten-year observations of gravity waves from thunderstorms in western Africa. J. Geophys. Res. Atmos. 2014, 119, 6409–6418. [Google Scholar] [CrossRef]
  53. Figueras i Ventura, J.; Pineda, N.; Besic, N.; Grazioli, J.; Hering, A.; van der Velde, O.A.; Romero, D.; Sunjerga, A.; Mostajabi, A.; Azadifar, M.; et al. Analysis of the lightning production of convective cells. Atmos. Meas. Tech. 2019, 12, 5573–5591. [Google Scholar] [CrossRef]
  54. Voormansik, T.; Müürsepp, T.; Post, P. Climatology of Convective Storms in Estonia from Radar Data and Severe Convective Environments. Remote Sens. 2021, 13, 2178. [Google Scholar] [CrossRef]
  55. Liu, T.; Yu, Z.; Ding, Z.; Nie, W.; Xu, G. Observation of Ionospheric Gravity Waves Introduced by Thunderstorms in Low Latitudes China by GNSS. Remote Sens. 2021, 13, 4131. [Google Scholar] [CrossRef]
  56. Basu, B. On the linear theory of equatorial plasma instability: Comparison of different descriptions. J. Geophys. Res. 2002, 107, 1199. [Google Scholar] [CrossRef]
  57. Basu, B. Characteristics of electromagnetic Rayleigh-Taylor modes in nighttime equatorial plasma. J. Geophys. Res. 2005, 110, A02303. [Google Scholar] [CrossRef]
  58. Muella, M.T.A.H.; Kherani, E.A.; de Paula, E.R.; Cerruti, A.P.; Kinter, P.M.; Kantor, I.J.; Mitchell, C.N.; Batista, I.S.; Abdu, M.A. Scintillation-producing Fresnel-scale irregularities associate with the regions of steepest TEC gradients adjacent to the equatorial ionization anomaly. J. Geophys. Res. 2010, 115, A03301. [Google Scholar] [CrossRef]
  59. Jiao, Y.; Morton, Y.T. Comparison of the effect of high-latitude and equatorial ionospheric scintillation on GPS signals during the maximum of solar cycle 24. Radio Sci. 2015, 50, 886–903. [Google Scholar] [CrossRef]
  60. Cohen, R.; Bowles, K.L.; Calvert, W. On the nature of equatorial slant sporadic E. J. Geophys. Res. 1962, 67, 965–972. [Google Scholar] [CrossRef]
  61. Matyugov, S.S.; Yakovlev, O.I.; Pavelyev, A.G.; Pavelyev, A.A.; Anufriev, V.A. Sporadic Structures in the Equatorial Ionosphere from the GPS-Formosat-3 Radio-Occultation Experiments. Radiophys. Quantum Electron. 2015, 58, 233–244. [Google Scholar] [CrossRef]
  62. Takahashi, Y.; Yoshida, A.; Sato, M.; Adachi, T.; Kondo, S.; Hsu, R.R.; Su, H.T.; Chen, A.B.; Mende, S.B.; Frey, H.U.; et al. Absolute optical energy of sprites its relationship to charge moment of parentlightning discharge based on measurement by, IISUAL/AP. J. Geophys. Res. 2010, 115, A00E55. [Google Scholar] [CrossRef]
  63. Yu, B.; Xue, X.; Kuo, C.; Lu, G.; Scott, C.J.; Wu, J.; Ma, J.; Dou, X.; Gao, X.; Ning, B.; et al. The intensification of metallic layered phenomena above thunderstorms through the modulation of atmospheric tides. Sci. Rep. 2019, 9, 17907. [Google Scholar] [CrossRef]
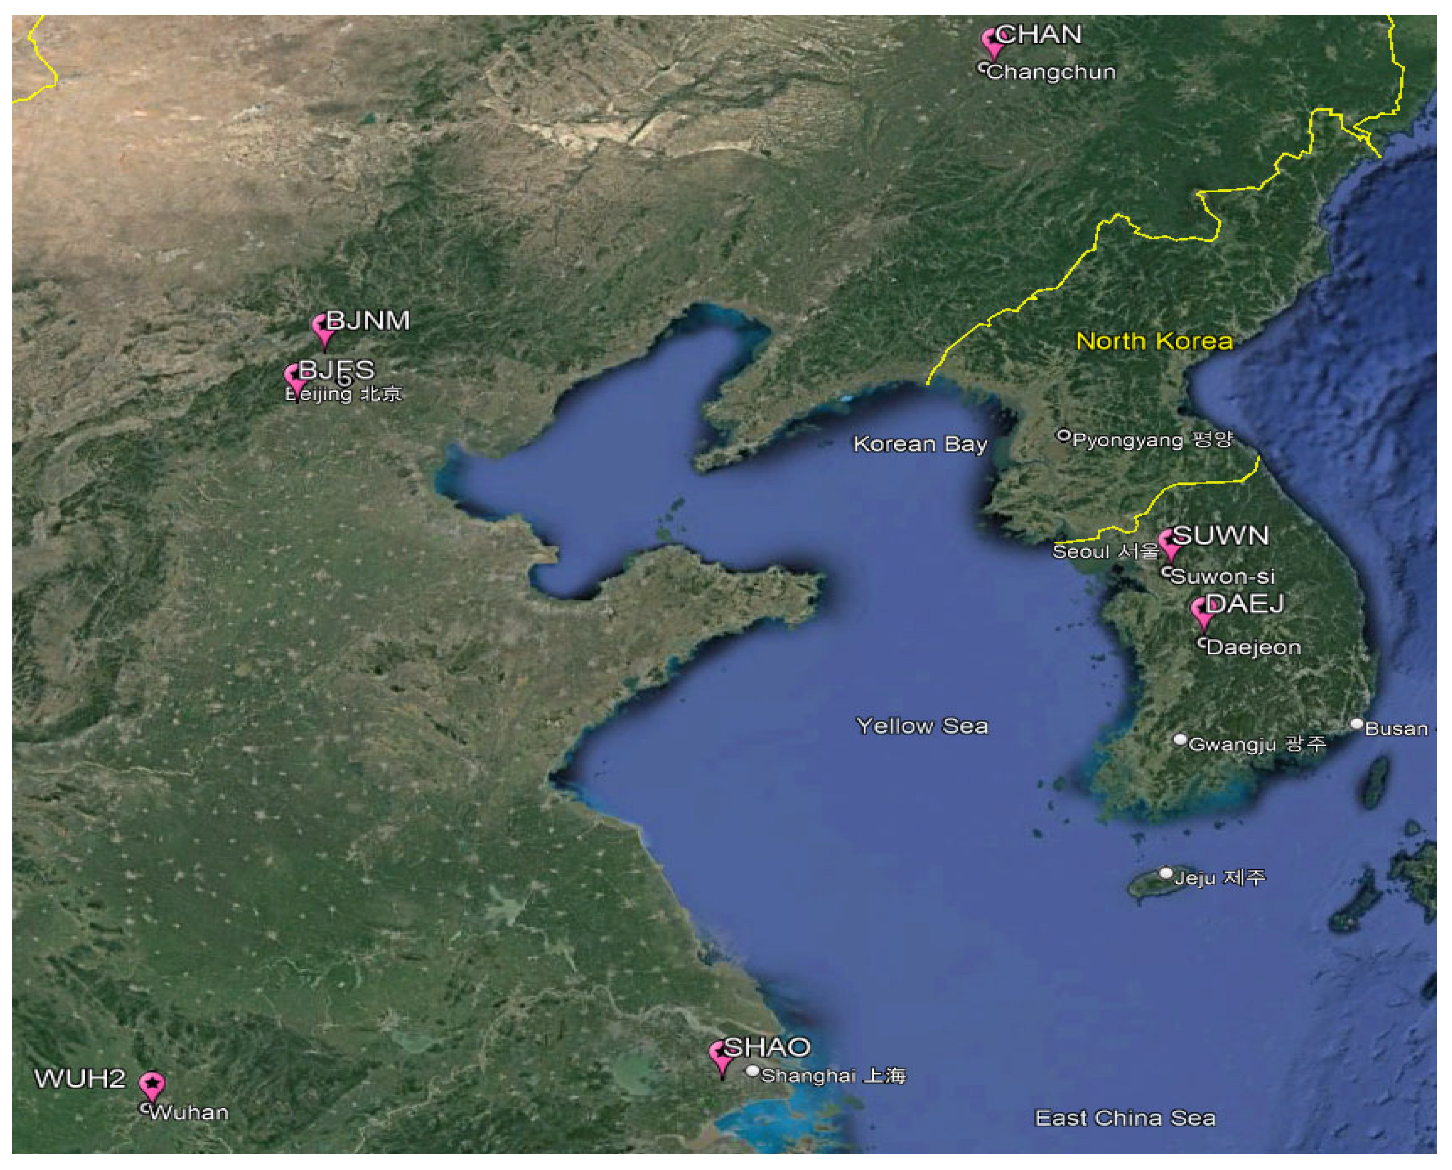
Figure 1. Selected stations in the study area around the North Easter China-Yellow Sea Region (courtesy IGS).
Remotesensing 15 02572 g001
Figure 2. TEC deviations along the lines of best fit for Beijing (upper panel) and Wuhan (lower panel) for TECs measured along PRN 2 satellite path between 10:46 UT and 16:03 UT on 21 June 2016.
Remotesensing 15 02572 g002
Figure 3. The storm on 21 June 2016: (a) The hourly flash count showing the lowest and highest flash counts. (b) The deviation showing responses to the thunderstorm between 13:40 UT and 15:30 UT, with the highest stroke count and TEC deviation around 15:00 UT. (c) Spatial distribution of the flashes showing the highest intensity near Shanghai (d) Contour of extrapolated absolute peak TEC showing highest TEC near the location of the highest storm at Shanghai.
Remotesensing 15 02572 g003
Figure 4. The thunderstorm on 31 July 2013: (a) The hourly flash count showing the lowest and highest flash counts. (b) The deviation showing responses to the thunderstorm between 12:00 UT and 14:00 UT. (c) Spatial distribution of the flashes showing the highest intensity near Shanghai (d) Contour of extrapolated absolute peak TEC showing the highest TEC near the location of the highest storm at Shanghai.
Remotesensing 15 02572 g004
Figure 5. TEC deviation during the thunderstorm event on the satellite paths for PRN 2 (left panel) and PRN 4 (right panel), respectively, for the thunderstorm occurrence on the 21st of June 2021.
Remotesensing 15 02572 g005
Figure 6. Event summary for the thunderstorm recorded on 4 June 2012. Upper Panel: Spatial distribution of flash cells in the northeast of China. Bottom Left: TEC deviation for PRN 17 measured at Changchun (Red line); stroke counts per hour at the same region. Bottom Right: Uniformed plots of TEC deviations for stations within the region.
Remotesensing 15 02572 g006
Figure 7. Stroke count associated with the thunderstorm on the 8th of August 2017 (upper panel), TEC deviations ( δTEC) between 13:00 and 15:00 on the 8th of August for PRN 15 (middle panel) and PRN 18 (bottom panel), respectively, with the largest TEC deviation between 13:00 and 15:00 UT during the main phase of the storm.
Remotesensing 15 02572 g007aRemotesensing 15 02572 g007b
Figure 8. Upper Panel. The TEC deviations for 8 August 2017 (Left) and its power spectrum (Right). Lower Panel. Filtered TEC deviations in the gravity wave range ~16 min to ~80 min for 8 August 2017 (Left) and its power spectrum (Right).
Remotesensing 15 02572 g008
Figure 9. Upper Panel: The gravity wave effects obtained from the ionospheric TEC deviation measured for PRN 17 at Changchun on the 4th of June 2012 showing multi-ripple effects. Lower Panel: The power spectrum showing the peaks of frequency burst at 0.169 mHz and 1.9 mHz.
Remotesensing 15 02572 g009
Figure 10. Wavelets show the dominant frequencies for different TEC magnitudes. Panels (A,B): Wavelet with “Cone of Influence (dotted line)” for TEC deviation PRN 15 and PRN 18, respectively, measured on 8 August at Shanghai. Panels (C,D): Wavelet “Cone of Influence (dotted line)” for TEC deviation PRN 2 and PRN 5, respectively, measured on 21 June 2016, at Shanghai.
Remotesensing 15 02572 g010
Figure 11. Filtered TEC deviations in the acoustic wave range (2–8) min for 8 August 2017 (Upper panel); its power spectrum (Lower Panel).
Remotesensing 15 02572 g011
Figure 12. Details of the timeline of a precipitation system showing the convective gravity wave momentum and energy transfer from the convective region and the production of sprites due to interactions between the ionosphere around the mesosphere and stratiform clouds.
Remotesensing 15 02572 g012
Table 1. GPS receiver stations and their locations (all stations are part of the IGS network).
Station CodeCity/Location NameLatitudeLongitudeMagnetic Latitude
SHAOShanghai Observatory31.100121.20024.68356
WUH2Wuhan City30.532114.35724.29664
BJFSBeijing (Fangshan)39.609115.89234.12889
BJNMBeijing40.245116.22434.94217
CHANChangchun43.791125.44338.86885
SUWNSuwon-Shi37.276127.05431.27664
DAEJDeajeon36.399127.37430.60097
Table 2. Table showing the dates of occurrence, highest energy level, time of occurrence and the daily averages.
DateEnergy (KJ)TimeDaily Average (J)
21 June 20162809 UTC2643.4
31 July 201386313 UTC6368.6
4 June 201290007 UTC2585.5
8 August 201768.713 UTC900.8
Disclaimer/Publisher’s Note: The statements, opinions and data contained in all publications are solely those of the individual author(s) and contributor(s) and not of MDPI and/or the editor(s). MDPI and/or the editor(s) disclaim responsibility for any injury to people or property resulting from any ideas, methods, instructions or products referred to in the content.

