Article

Satellite and In Situ Sampling Mismatches: Consequences for the Estimation of Satellite Sea Surface Salinity Uncertainties

by
Clovis Thouvenin-Masson
1,2,3,*,
Jacqueline Boutin
1,
Jean-Luc Vergely
2,
Gilles Reverdin
1,
Adrien C. H. Martin
4,
Sébastien Guimbard
5,
Nicolas Reul
6,
Roberto Sabia
7,
Rafael Catany
8 and
Odile Hembise Fanton-d’Andon
2
1
LOCEAN/IPSL Laboratory, Sorbonne University, SU-CNRS–IRD–MNHN, 75005 Paris, France
2
ACRI-st, 06904 Sophia-Antipolis, France
3
CNES (Centre National des Études Spatiales), 31401 Toulouse, France
4
National Oceanography Centre, Southampton SO14 3ZH, UK
5
Ocean Scope, 29200 Brest, France
6
IFREMER (Institut Français de Recherche Pour l’Exploitation de la Mer), 29280 Plouzané, France
7
Telespazio-UK for ESA, ESRIN, 00044 Frascati, Italy
8
ARGANS Ltd., Plymouth PL6 8BU, UK
*
Author to whom correspondence should be addressed.
Remote Sens. 2022, 14(8), 1878; https://doi.org/10.3390/rs14081878
Submission received: 14 February 2022 / Revised: 22 March 2022 / Accepted: 28 March 2022 / Published: 13 April 2022

Abstract

:
Validation of satellite sea surface salinity (SSS) products is typically based on comparisons with in-situ measurements at a few meters’ depth, which are mostly done at a single location and time. The difference in term of spatio-temporal resolution between the in-situ near-surface salinity and the two-dimensional satellite SSS results in a sampling mismatch uncertainty. The Climate Change Initiative (CCI) project has merged SSS from three satellite missions. Using an optimal interpolation, weekly and monthly SSS and their uncertainties are estimated at a 50 km spatial resolution over the global ocean. Over the 2016–2018 period, the mean uncertainty on weekly CCI SSS is 0.13, whereas the standard deviation of weekly CCI minus in-situ Argo salinities is 0.24. Using SSS from a high-resolution model reanalysis, we estimate the expected uncertainty due to the CCI versus Argo sampling mismatch. Most of the largest spatial variability of the satellite minus Argo salinity is observed in regions with large estimated sampling mismatch. A quantitative validation is performed by considering the statistical distribution of the CCI minus Argo salinity normalized by the sampling and retrieval uncertainties. This quantity should follow a Gaussian distribution with a standard deviation of 1, if all uncertainty contributions are properly taken into account. We find that (1) the observed differences between Argo and CCI data in dynamical regions (river plumes, fronts) are mainly due to the sampling mismatch; (2) overall, the uncertainties are well estimated in CCI version 3, much improved compared to CCI version 2. There are a few dynamical regions where discrepancies remain and where the satellite SSS, their associated uncertainties and the sampling mismatch estimates should be further validated.

1. Introduction

Knowledge of salinity is crucial for understanding the thermohaline circulation of the ocean as salinity makes a large contribution to water density. As an advected property, it is an interesting tracer of oceanic phenomena. Salinity also conditions the stratification of the surface layer and thus influences the ability of the ocean surface to mix [1]. Salinity is a key indicator for monitoring the water cycle as it integrates the freshwater input to the ocean, through interactions with the atmosphere (precipitation and evaporation), with the continents (river discharges) or with ice [2].
Sea Surface Salinity (SSS) has been measured by satellite for more than 12 years, thanks to three satellite missions: the Soil Moisture and Ocean Salinity (SMOS), the first SSS observing satellite mission launched in 2009 and still operating today; the Aquarius mission, which operated from 2011 to 2015; and the Soil Moisture Active Passive (SMAP) mission launched in 2015 and still operating today. These three satellite missions measure brightness temperature at 1.4 GHz, allowing for the retrieval of SSS, with unprecedented spatio-temporal coverage (see reviews in [3,4]). Although they operate in the same frequency band, they have their own characteristics in terms of spatial resolution: the spatial resolution of SMOS and SMAP-retrieved SSS (~40 to 50 km) is about a factor 2 to 3 higher than that of the Aquarius SSS (see more details in [3]).
The recent ESA Climate Change Initiative project (CCI+SSS) combines measurements of these three satellite missions, resulting in a decrease of the differences between satellite salinity fields and Argo float surface salinities (standard deviation (robust standard deviation) of the monthly CCI SSS minus the Argo float surface salinities over the whole period equal to 0.27 (0.16) globally) [5,6]. However, the interpretation of such comparisons in terms of satellite field uncertainties is tricky as it involves not only uncertainties in satellite estimates but also uncertainties in in-situ estimates and sampling mismatches [7]. In this paper, we focus on better understanding these differences by estimating the contribution of the sampling mismatch between in-situ salinity and the CCI+SSS fields as produced with the last CCI+SSS version (version 3).
Satellite SSS is typically compared to in-situ measurements for validation. The in-situ data used are of several types: either at fixed point (moorings) or from moving platforms (ships; floats). A major problem with these comparisons is the difference in sampling between satellite and in-situ datasets [8]: satellite data are integrated over a surface, of nearly 50 km in diameter for the CCI products, and are either for a single time or over a weekly or monthly period, in the case a temporal optimal interpolation is applied, as is done for the CCI fields. In-situ data are generally at a single point in space and time, as is the case for ships, Argo floats and mooring measurements. Moreover, satellite salinity represents the upper 1 cm depth, whereas in situ salinity is mostly measured at a few meters’ depth.
This difference in sampling necessarily implies a different sensitivity of both types of measurements to small-scale variability and distorts the uncertainty estimate of the satellite data if the in-situ data is used as a reference without taking into account the uncertainty due to the sampling mismatch. This issue is particularly important in regions of high SSS variability such as river plumes (e.g., Amazon plume), meanders of large currents (e.g., Gulf Stream) or rainy regions, as illustrated on Figure 1. The variability of salinity is of three kinds: spatial, temporal and vertical [8]. We mainly focus on spatial and temporal variability in this paper.
Thus, to get a valid estimate of the uncertainties of satellite products obtained by comparison with in-situ data, it is important to complement the satellite SSS uncertainty with the uncertainty due to the sampling mismatch [7]. In case of satellite salinities, Vinogradova et al. [9] found that, in several ocean regions, including the tropics and western boundary current regions, small-scale variability, simulated with a 1/12° HYCOM model, is an important source of sampling mismatch in comparisons between 1° (~Aquarius footprint) satellite SSS and in situ salinities. More recent studies (see [10]) used in situ measurements and high-resolution models (1/48°) to estimate the sub-footprint variability (SFV) at level 2 and simulate spatial integration for Aquarius at footprint size of 100 km and for SMAP at 40 km. Strong dependencies of SFV on region, season and footprint size have been found. SFV is particularly high in rainy regions [11], along the continental shelves where strong river outflow is present [12], and near frontal zones such as the western boundary currents [13]. The variabilities obtained range from less than 0.1 to 1 pss. To simulate expected RMS between satellite and Argo salinities, Bingham et al. [13] derives Representation Errors (RE) between a footprint integrated satellite SSS and a local SSS using one year of high-resolution simulations; Bingham et al. [13] reports that the distribution of RE for a 40 km footprint peaks at 0.06 pss, with typical values of 0.01–0.15 pss but also some high values reaching 0.4 pss or even larger (see Figure 9b in [13]).
The objective of this paper is, for the first time, to demonstrate the applicability of using uncertainties related to sampling mismatch, to validate satellite SSS and its uncertainties. Indeed, until now, the uncertainty related to sampling mismatch has been neglected in satellite SSS validations, and the satellite SSS uncertainties provided by satellite retrieval systems are very rarely evaluated. This demonstration study is used to interpret the differences observed between the weekly (monthly) satellite CCI+SSS fields and Argo salinities, given the uncertainties attributed to the CCI+SSS fields and the sampling mismatches between both types of measurements. We will then focus on validating the CCI+SSS and associated uncertainties. The sampling mismatch uncertainty is estimated using SSS simulated with a 1/12° resolution model, and small-scale variability not resolved by the model will be estimated following a spectral method similar to that proposed by [12]. We conduct our study using three years (2016–2018) of SSS simulation contemporary to CCI+SSS fields. We consider both the spatial variability within a satellite footprint and the temporal variability within one week (month).
We report results obtained with the weekly products in the main paper; results obtained with the monthly products are reported in the Supplementary Material. A similar study was conducted on CCI v2 in order to compare the two versions, and the results obtained with CCI v2 are also in Supplementary Materials.
The datasets and methods are described in Section 2. Results are presented in Section 3, followed by a discussion (Section 4) and conclusions (Section 5).

2. Materials and Methods

2.1. Materials

The study is performed from 2016 to 2018, a period during which SMOS and SMAP data are available, and focuses on the interpretation of the comparisons between CCI+SSS and Argo salinities. We use three data sources:
-
Satellite product: CCI v3.2.
We use version 3.2 of the SSS products generated in the framework of the ESA CCI project [14]. They have been generated following a methodology very similar to the one described in [5] with main modifications described in [15,16]. They are summarized below.
These Level 4 (L4) SSS products are derived using a temporal optimal interpolation of SSS retrieved from the three L-band radiometric satellite missions launched since 2010: SMOS (2010–present), SMAP (2015–present), and Aquarius (2012–2015). The SSS fields span a period from 2010 to 2020 and are available on a 25 km Equal-Area Scalable Earth (EASE 2) Grid [17] and at weekly and monthly temporal resolutions. During the period studied here (2016–2018), both SMOS and SMAP data are available.
The CCI v3.2 SSS fields have been generated following an optimal interpolation similar to CCI v2 [5]. Compared to the CCI v2 processing, the CCI v3 processing has been updated to improve the long-term stability of the SMOS SSS entering in the CCI L4 optimal interpolation and to improve the L4 SSS uncertainty estimates. In particular:
-
Instead of using SMOS SSS produced by the Centre Aval de Traitement des Données SMOS (CATDS) operational chain, the SMOS SSS were reprocessed with a modified ESA v662 processor [15].
-
Instead of using European Center for Medium Weather Forecast (ECMWF) Integrated Forecast System (IFS) fields as auxiliary parameters, the processing used ECMWF ERA5 fields.
-
The SMOS vicarious calibration, the so-called Ocean Target Transformation, is estimated using in situ interpolated SSS fields produced by the In Situ Analysis System (ISAS) [18] instead of using a salinity climatology.
-
The dielectric constant model is updated as proposed by [5].
-
The SMOS SSS affected by instantaneous rain rate are adjusted for RR up to 10 mm h−1 [19] and are sorted out in case of stronger RR. SMAP SSS retrieved with RR larger than 0.5 mm h−1 are filtered out. Therefore, in rainy regions the CCI v3 fields are close to bulk salinities.
-
In the CCI v3 L4 optimal interpolation, a full least square propagation of the errors is implemented, instead of a simplified propagation.
-
Representativity uncertainties between the swath measurements of the SMOS and SMAP level 2 SSS and that of the L4 estimated SSS (weekly or monthly fields), corresponding to the temporal variability of the SSS at the SMOS and SMAP resolution (~50 km), within one week or one month, are taken into account as described in [5] and in its Supplementary Information (S3). The equations are the same for CCI version 2 and version 3, but the numerical implementation differs: a full error propagation scheme has been implemented in version 3.
The original footprint sizes of level 2 SMOS and SMAP SSS entering in the CCI v3.2 processing are slightly less than 50 km (close to 45 km for SMOS (depending on the across swath location) and to 43 km for SMAP). SMOS original SSS are provided on an icosahedral Snyder equal area (ISEA) grid at 12 km resolution. SMAP original SSS are on a regular 0.25° grid. In a first CCI+SSS processing step, SMOS and SMAP SSS are reprojected on the 25 km EASE 2 grid using nearest neighbors method. In the later stages of the CCI+SSS processing, no spatial smoothing is applied, with each grid point being treated independently. Based on that, we consider in the following that each grid point is representative of SSS obtained with a simple average within 50 km grid cell. In order not to add too much complexity to the processing and the computing time, we consider that the weekly and monthly temporal OI is equivalent to a simple average of SSS over one week and one month.
-
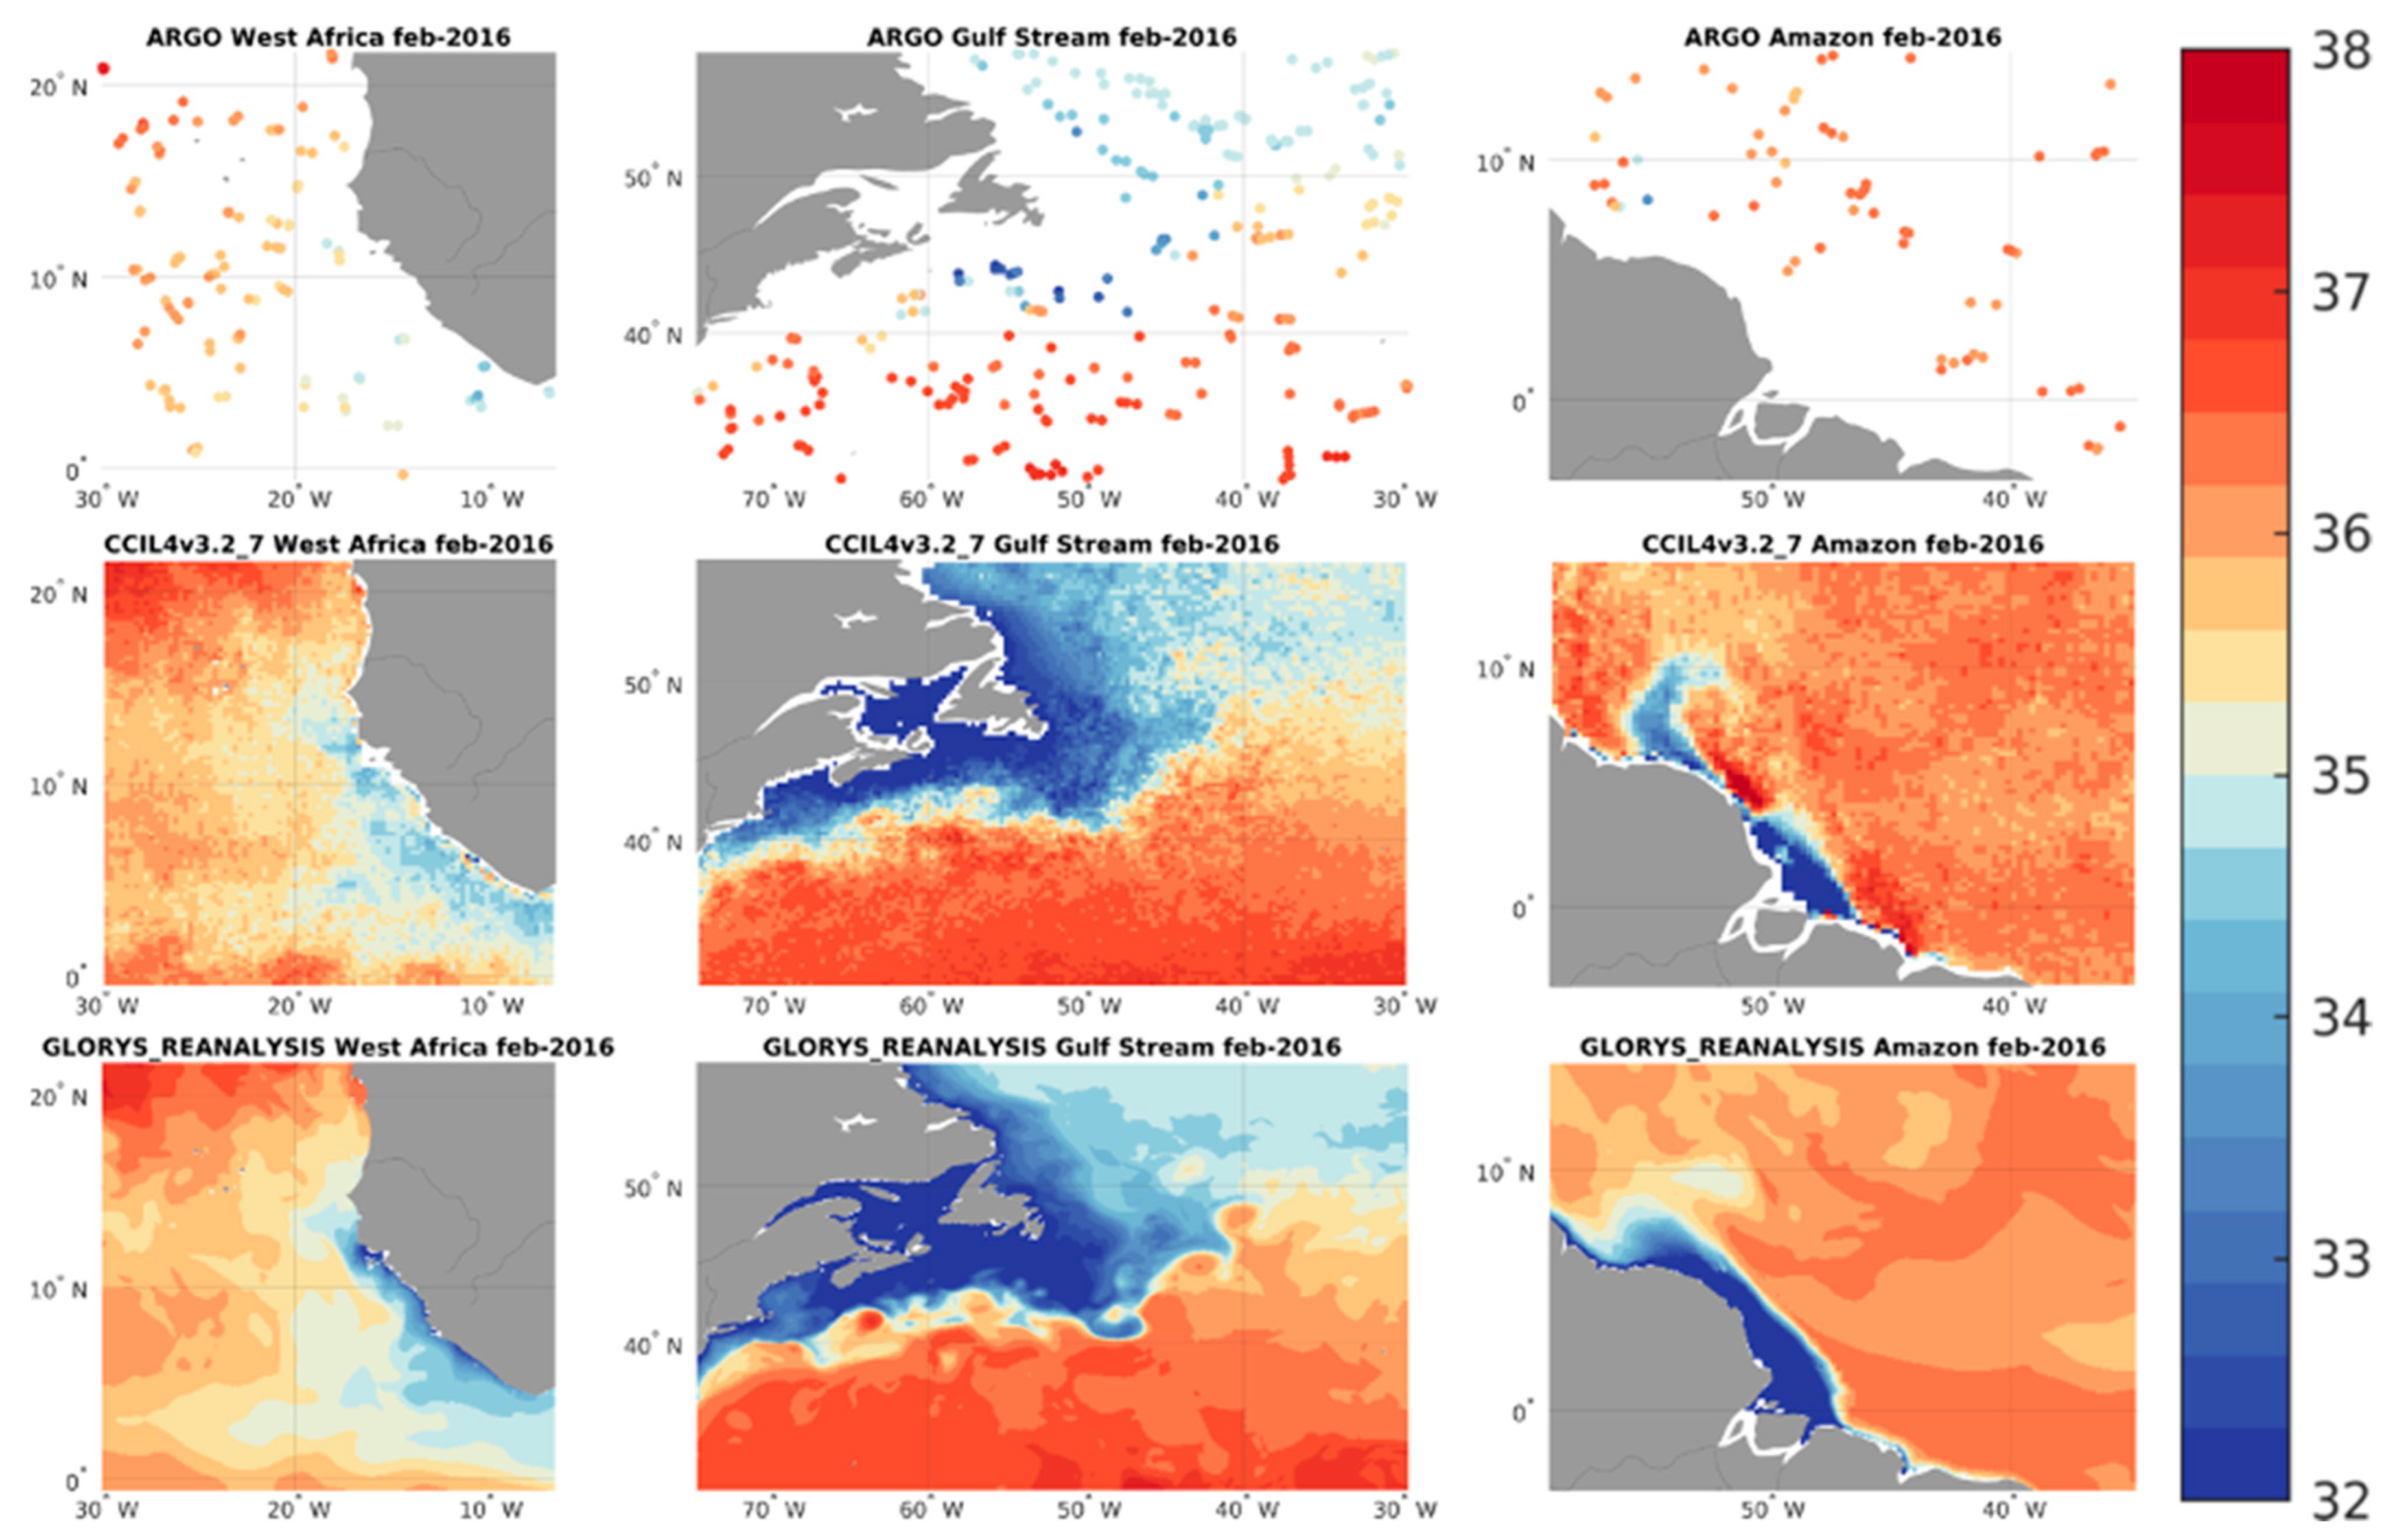
In-situ products: Argo floats
The Argo [20] project is a set of ~3000 floats moving in the upper 2000 m of the global ocean. These floats give access to about 100,000 measurements of salinity and temperature per year with a global coverage, and an average spacing of 3° between measurements. These data are collected and made freely available by the international Argo project and the national programs that contribute to it.
We use the collocations provided by the SMOS Pilot-Mission Exploitation Platform (Pi-MEP) [21] between the CCI fields and Argo floats. The colocation methodology will be described in Section 2.2.
The Pi-MEP collocations are made from Argo data with a quality index of 1 or 2. Argo upper measurements between 10 m depth and 0 m depth are considered as surface data and are used as a comparison to satellite data. Most of the Argo data resulting from this selection are taken at a depth of about 5 m. More details about this method are available in the Pi-MEP reports.
-
Mercator GLORYS reanalysis
We use the daily high-resolution (1/12°) Mercator GLORYS reanalyzed SSS. We consider that it resolves variability above the Nyquist wavelength (1/6°). These SSS simulated fields have a slightly reduced spatial resolution compared to studies [12,13] to allow global ocean coverage, while keeping the small scales that contribute much to SSS variability in a satellite pixel [22].
The GLORYS12V1 product is a CMEMS global ocean eddy-resolving (50 vertical levels) reanalysis. These data are available from 1993 to today. These reanalyses are based on the NEMO ocean model, forced, at the surface by ECMWF ERA5 data, and by climatological runoffs. Satellite sea level anomalies, SST, sea ice concentration, in-situ temperature and salinity vertical profiles (but not satellite SSS) are assimilated using a reduced-order Kalman filter derived from a singular evolutive extended Kalman (SEEK) filter with a three-dimensional multivariate background error covariance matrix and a 7 day assimilation cycle [23].
Data are available at daily temporal resolution, and on a regular 1/12° grid, for 50 levels, starting from the sea surface with levels at 0.5 m, 1.5 m, 2.6 m, 3.8 m and 5 m. We use the level at 5 m depth as a proxy for Argo upper salinity. See [24] for a complete description of the model.
An example of the estimation of GLORYS SSS variability within satellite grid cells (the calculation method is described in Section 2.2) is shown on Figure 2. This map shows the standard deviation of the GLORYS salinities accumulated in boxes of 50 km × 50 km and during a 7-day period, corresponding to the spatiotemporal resolution of the weekly CCI data for the day of 15 February 2017. This estimation has been computed for every day over the entire period from 2016 to the end of 2018. As described in the methods section, this represents the variability of salinity at 5 m depth. The same maps were generated with surface salinities for a better understanding of the vertical variability of near-surface salinity (see discussion below). As expected from previous studies [12,25], high standard deviation values are observed in areas of high natural variability, such as river plumes (e.g., Amazon, Congo) and regions with strong salinity gradients (e.g., Gulf Stream). The 30-day variability is similar to the 7-day variability with stronger values (the map is available in the Supplementary Materials).

2.2. Methods

-
Uncertainties balance
We follow the methodology proposed by [7] to validate the uncertainties of the satellite products, by considering the total uncertainty composed of three terms:
U sat is the uncertainty of each satellite estimate.
U mis is the uncertainty due to sampling mismatch between satellite data and in-situ data.
U ref corresponds to the uncertainties of the reference in-situ data.
According to [7], uncertainties of satellite measurements are well represented when the observed differences between satellite and reference in-situ measurements, normalized by the quadratic sum of these uncertainties, follow a Gaussian distribution with a standard deviation of 1.
STD ( x sat x ref U sat 2 +   U mis 2 +   U ref 2 ) = 1
In Equation (1), STD stands for the standard deviation, x sat represents the satellite measurements and x ref represents the reference in-situ data. We now detail how the various terms of Equation (1) are obtained.
-
x sat x ref
The colocations between CCI+SSS and Argo floats measurements are performed by the Pi-MEP, as described in [5,21], and summarized below.
CCI products are sampled on a Rsat spatial grid (corresponding to the 25 km EASE grid) and with RT time sampling: RT is one day for weekly products and 15 days for monthly products. Given CCI products centered at T0, each Argo data sampled within [T0−RT/2 T0+RT/2] is colocated with the CCI SSS at grid nodes located within a radius of Rsat/2 from the Argo data location. If several CCI SSS product samples are found to meet these criteria, the final CCI SSS match-up point is chosen to be the CCI SSS with central time, which is the closest in time to the in situ data measurement date. Hence, there is a unique matchup corresponding to each Argo measurement.
The locations of xref corresponding to the Argo measurement points made available in the Pi-MEP database are used as the basis for calculating the normalized differences described in Equation (1). The terms Usat and Umis are thus collocated at these locations as described below.
-
U sat
The uncertainty of each CCI+SSS gridpoint is estimated in the course of the CCI+SSS temporal OI using the formalism described in the Supplementary Information (S3) of [5]. It takes into account uncertainties of SMOS and SMAP individual SSS, their representativity uncertainties with respect to a weekly (or monthly) integrated field, and uncertainties on the bias corrected by the CCI processing. In the CCI+SSS v3 processing, while the formalism remains the same as the one of version 2, the numerical implementation differs: a full least square propagation of the uncertainties is implemented, instead of a simplified propagation involving matrix inversion over limited time period as in version 2. This quantity is described in Figure 3b.
-
U ref
In our case, U ref corresponds to the uncertainty of the Argo salinity. As we only use Argo data with a quality index of 1 or 2, these uncertainties are small, in the order of 0.01 or less [26]. They are expected to be much smaller than the other uncertainties in Equation (1) and are neglected in the following.
-
U mis
To estimate the uncertainties due to sampling mismatch, we first compute the variability of SSS from Mercator GLORYS reanalysis at a resolution of 1/12° (Umis_glo).
We approximate the sampling mismatch as the standard deviation of GLORYS SSS within a radius of R km (R = 25 km) and a temporal range of dt/2, corresponding to the spatio-temporal integration of CCI products of 50 km and of 3.5 days for weekly fields and 15 days for monthly fields. Since the Pi-MEP matchups consider only the closest matchups, this sub-pixel variability slightly overestimates the variability. We performed tests considering various spatio-temporal R, and dt radii, and we concluded that the overestimate is less than 5%, with the major effect arising from the spatio-temporal smoothing of the CCI products relatively to non-averaged SSS; the spatio-temporal distance between the center of the CCI product and the individual in-situ measurements is a second order effect.
As our study focuses on the comparison between in-situ data taken at 5 m depth, we compute the standard deviation of the GLORYS model data at 5 m depth. CCI+SSS v3.21 fields are adjusted from the instantaneous rain effect, based on earlier comparisons between SMOS SSS in rainy conditions and Argo salinities [19], hence reducing the difference expected between satellite SSS in the upper 1cm depth and the Argo salinity at ~5 m depth.
We calculate the sampling mismatch for each day over three years (2016–2018).
The above estimate of Umis_glo is limited, however, by the resolution of the GLORYS reanalysis (1/12°). This means that the variability at scales smaller than 1/6° present in the point measurements will not be well represented in GLORYS simulations. We take this limitation into account by estimating the variability missed by the GLORYS reanalysis following a wavenumber spectral analysis [12], as summarized below and described with more details in Appendix A.
The variance of a signal between a chosen wavelength and the Nyquist wavelength can be inferred assuming that the slope of the spectrum between the two wavelengths is reasonably known. This variance is given by the following formula, which follows from the integration of the power spectral density (PSD):
σ λ = 2 π b m 2 ( λ m 2 λ n m 2 )
where m corresponds to the slope of the PSD when viewed as a log-log plot, b is the y-intercept of the PSD, λ is the wavelength below which we calculate the variance and   λ n is the Nyquist wavelength.
What we want to estimate is the influence of a change in Nyquist wavelength on the variance of salinity below a wavenumber of 50 km. We therefore calculate σ 50 for λ n = 20   km , which corresponds to the STD actually measured by GLORYS, and σ 50 for λ n = 0   km , which corresponds to a perfect case where all the signal power is considered.
Spectral studies in the Arabian Sea and in the western Pacific [12], as well as in the tropical and subtropical Atlantic Ocean [22], suggest that at the scale of interest, for a wavelength below 50 km, the salinity PSD has a slope close to m = 3.3. This is quite close to a k−3 power law expected for a passive tracer under the influence of advection, with the slightly steeper slope being likely attributable to atmospheric processes [12]. Even though this slope is likely to vary slightly from time to time and place to place, we use it to infer an order of magnitude of the ratio between the variability expected in the case where all wavelengths below 50 km are considered, Umis, and the variability estimated with GLORYS reanalysis resolution, Umis_glo, using Equation (2). We find the following relation:
U mis = 1.1985 U mis _ glo
The results are given thereafter with and without this adjustment.
We evaluate the Gaussian shape of the normalized differences distributions Equation (1) following two methods:
-
When considering large regions (global ocean or in boxes represented on Figure 2 and defined in Table 1), we approximate the statistical distributions of the normalized differences with a Gaussian fit and we compare the fitted STD with the expected value of 1.
-
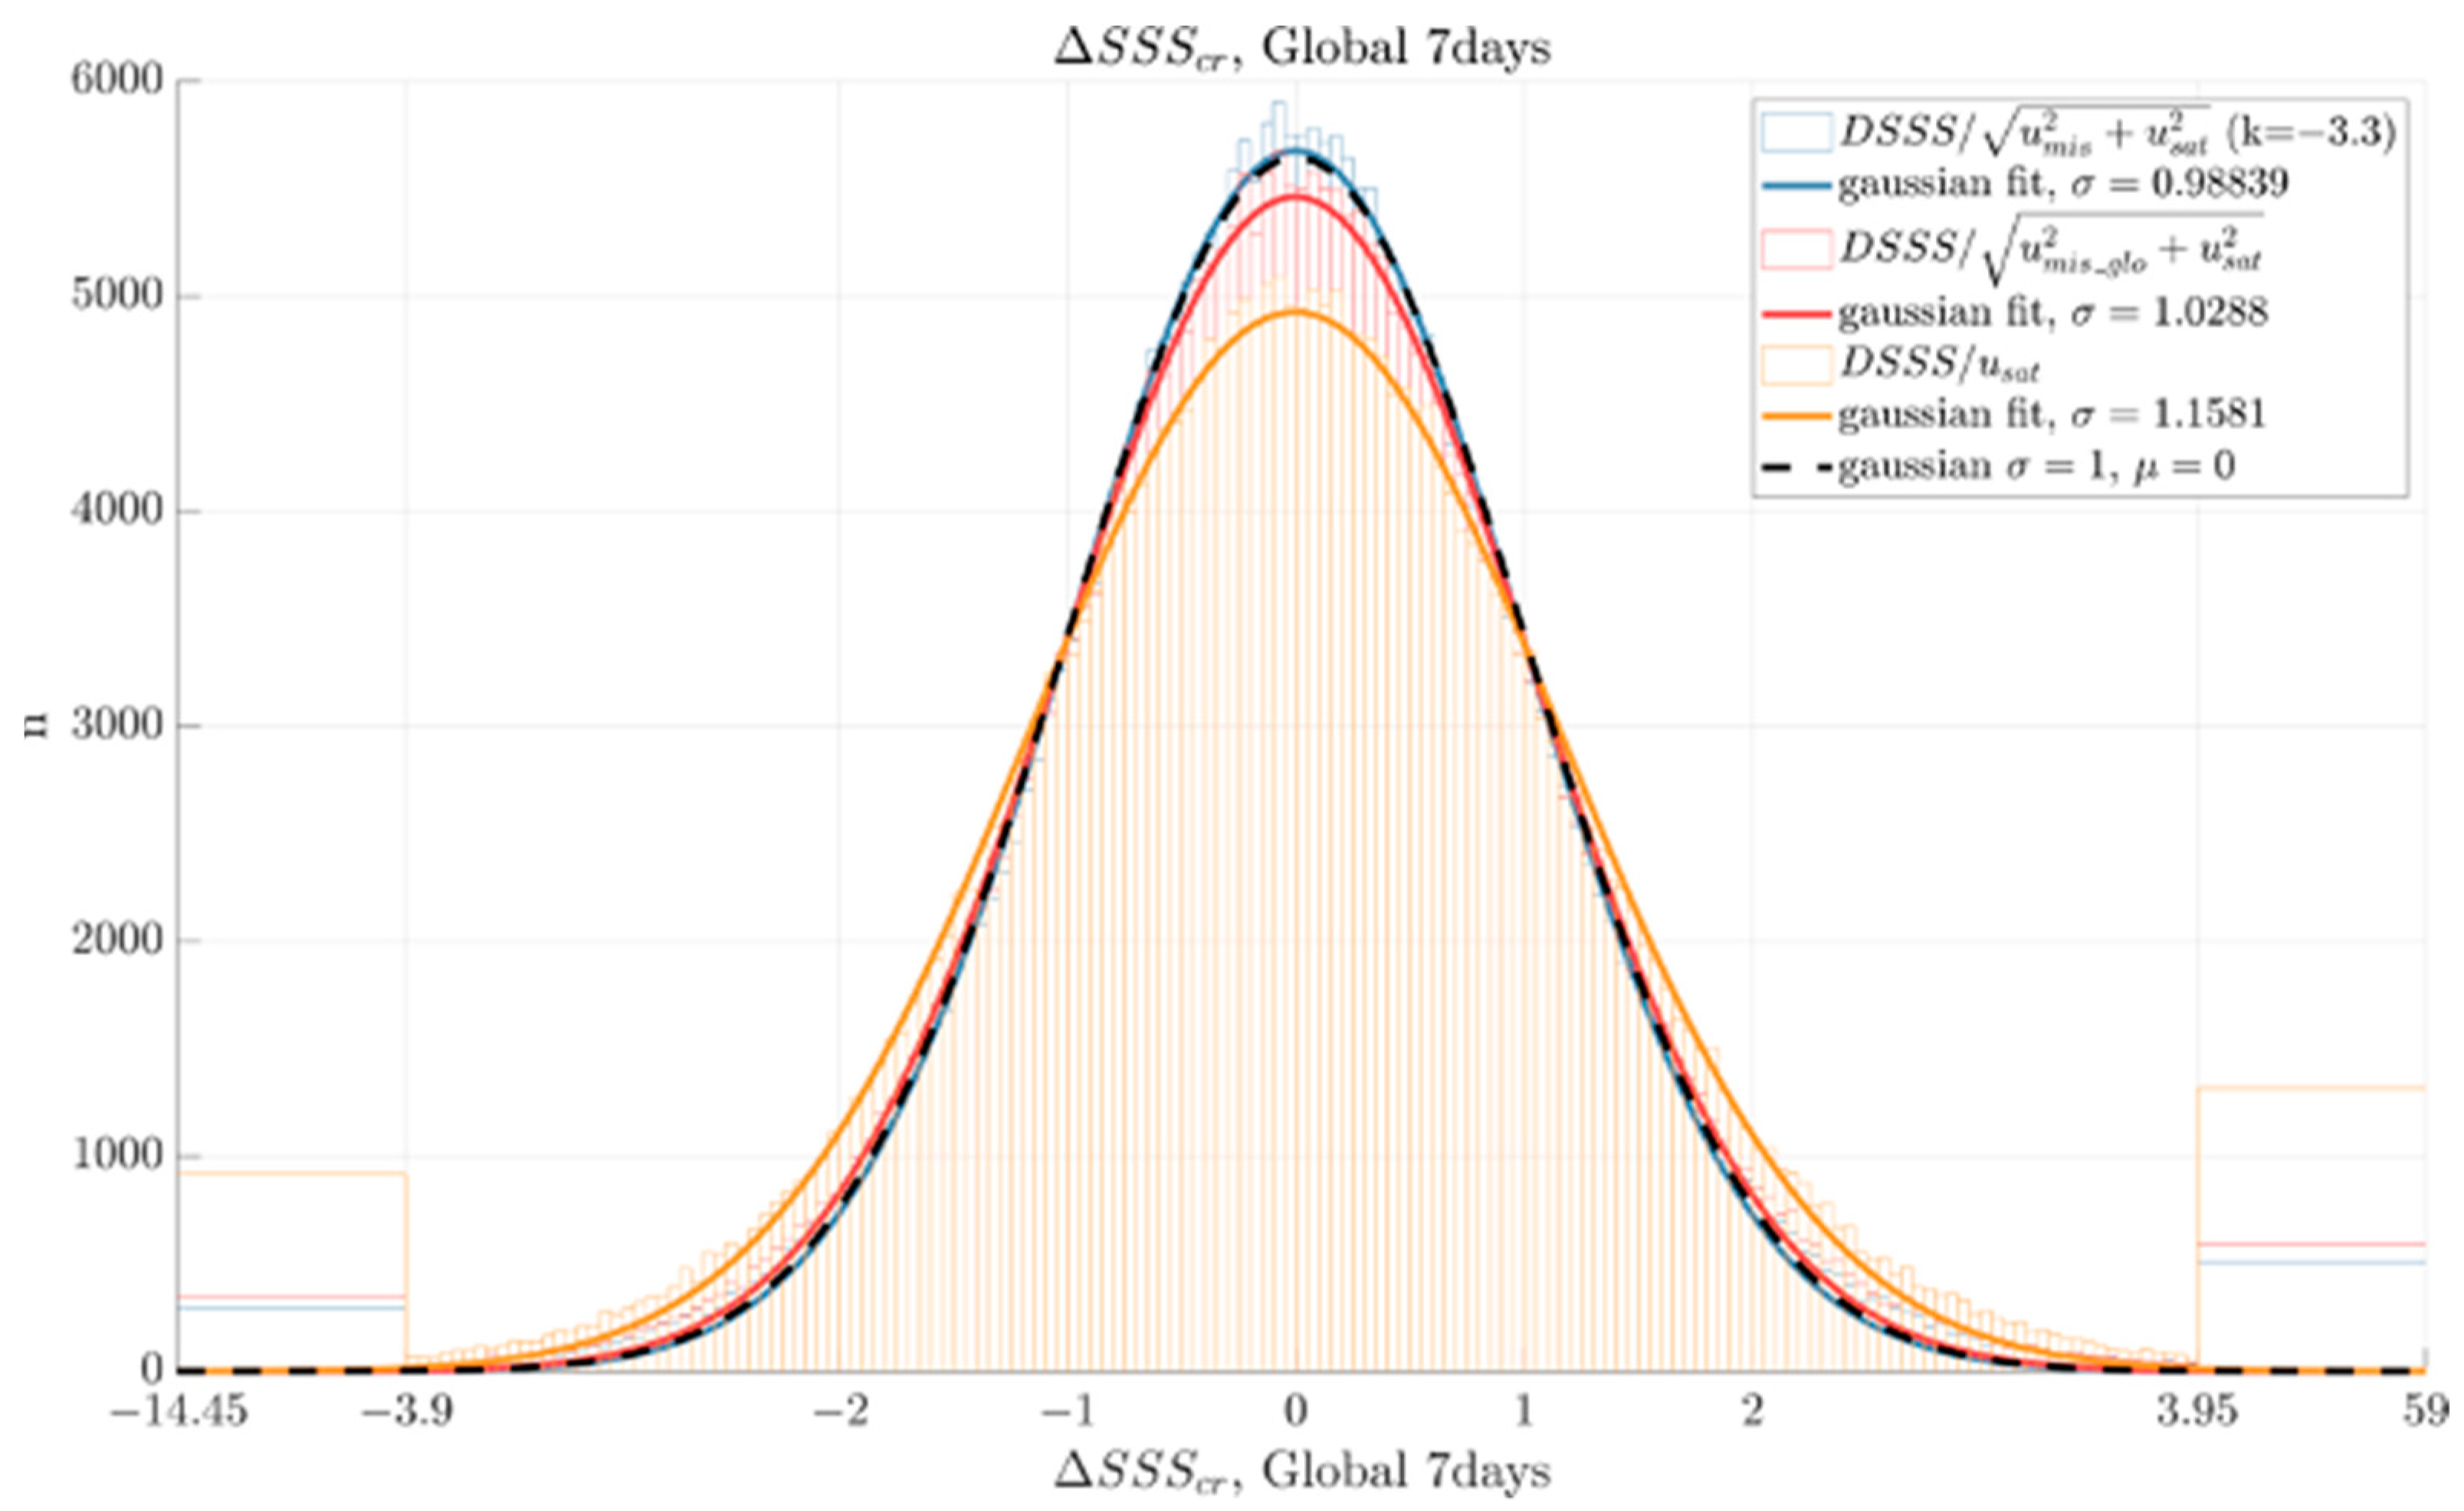
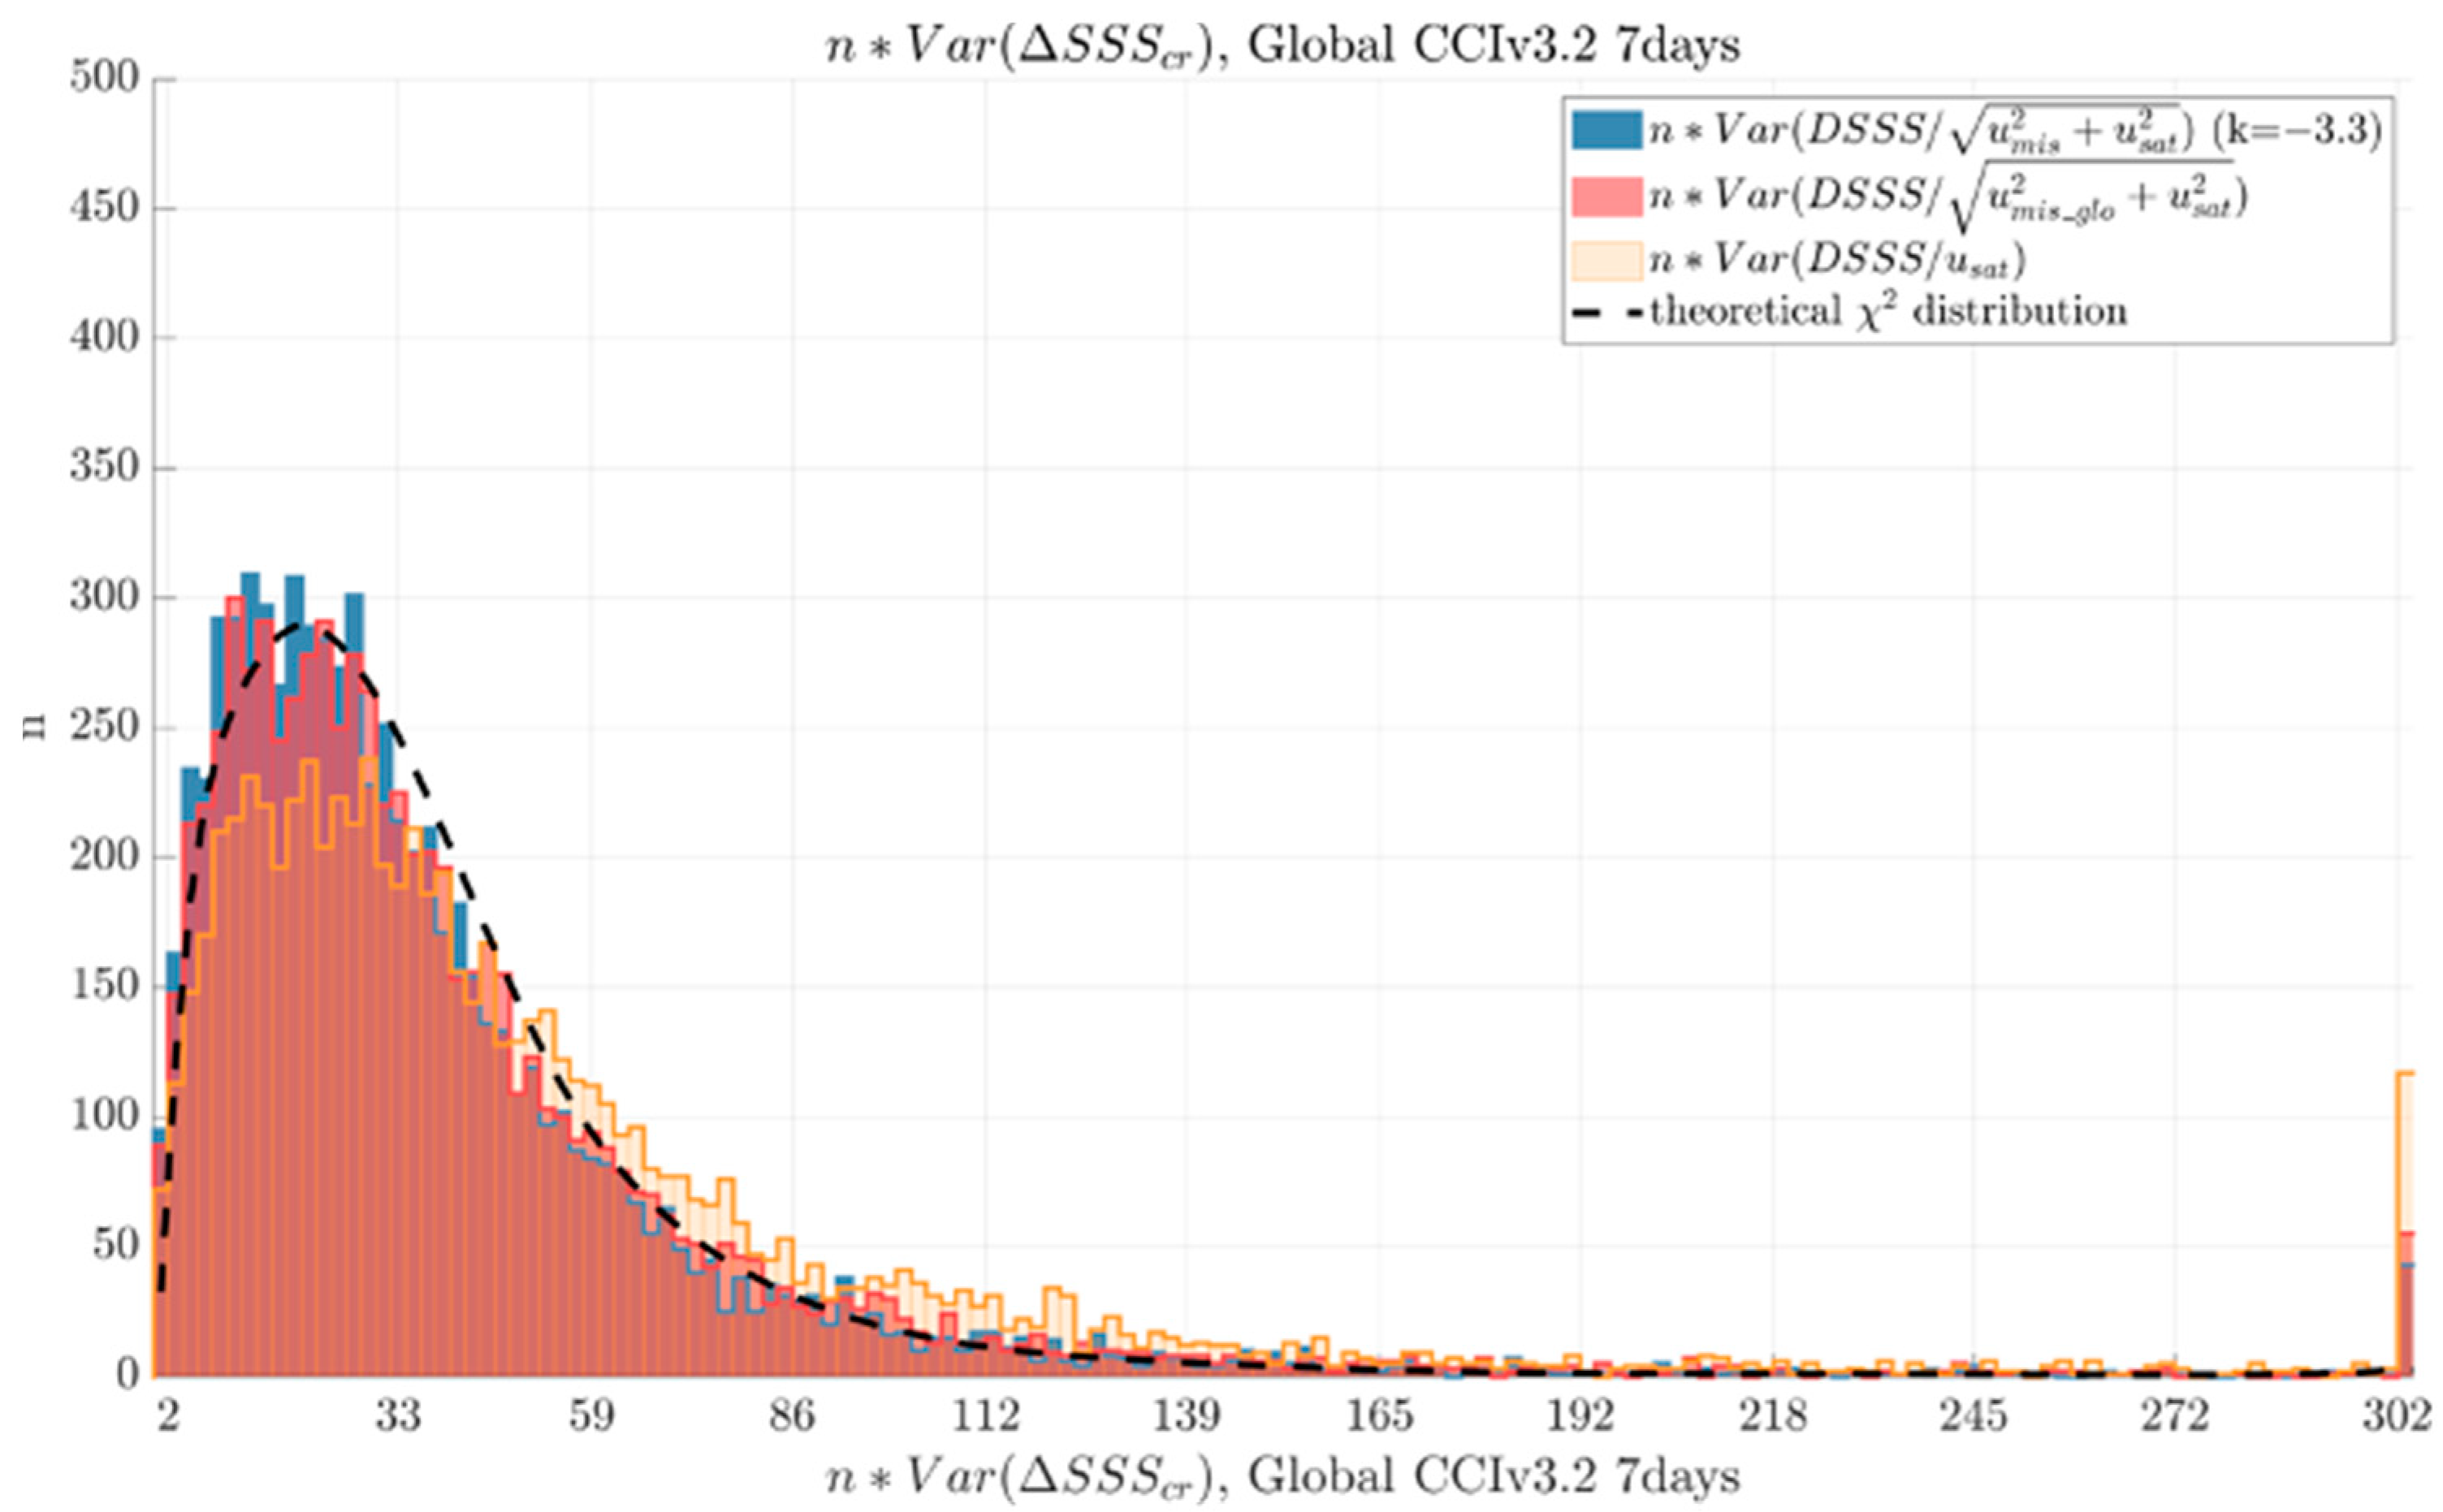
In order to make local analysis, we also compute STD of normalized differences in 2° boxes. However, due to the reduced number of colocations in 2° boxes (as will be seen in Section 3.2.2), they are noisy and it is not possible to estimate a reliable fit of the normalized differences distribution in each box. Nevertheless, we look at to which extent the statistical distribution of STD estimated in 2° boxes is consistent with Gaussian distributions of the normalized differences in each box. This is performed by considering the histograms of the variances, STD2, multiplied by the number of measurements. Indeed, given X1, ⋯, Xn a random sample from a Gaussian distribution (with a μ average and a σ standard deviation) N(μ,σ2), in any of the 2° boxes, with S 2 = 1 n 1 1 n ( X i X ¯ ) , the random variable Y = (n−1)S2/σ2 = n Var(X)/σ2 follows a χ2n−1 distribution (See p. 211 of [27]). This choice of representation allows us to compare the histograms obtained to a theoretical curve that Y should follow if the normalized differences distributions in each box followed a N(0,1) distribution, as is expected if the uncertainties are correctly estimated. The theoretical curve is deduced by cumulating the distributions of the Y term expected for each of the 2° boxes, considering σ = 1.
The reliability of the salinity variability derived from GLORYS reanalysis will be discussed, based on comparisons with the salinity variabilities measured in-situ by sensors onboard ships.
Actually, Ship ThermoSalinoGraph (TSG) measurements are sampled at a few kilometers resolution along ship transects, hence allowing for an estimate of the variability at a higher resolution than GLORYS. We use the TSG-LEGOS-DM delayed mode data set derived from voluntarily observing ships collected, validated, archived and made freely available by the French Sea Surface Salinity Observation Service [28]. For that, we select adjusted values when available and only TSG data with quality flags = 1 and 2 (‘good’ or ‘probably good’).
As the SSS variability along a line is different from the SSS variability over a surface, for this exercise, a one-dimensional GLORYS variability is computed along ship lines: the standard deviation of salinity values from GLORYS reanalysis along 50 km-long lines, with a direction close to ship transects (with a precision of ±22.5°). Fitting the variability to the direction of the ship transect allows for the possible anisotropy of the SSS field.

3. Results

We first consider global maps of the main terms in the uncertainties balance Equation (1) after integrating them over the 2016–2018 period by taking their quadratic mean. After this qualitative and raw analysis (temporal correlations between the various terms are neglected in that analysis), a thorough analysis is presented based on an exact computation of Equation (1).

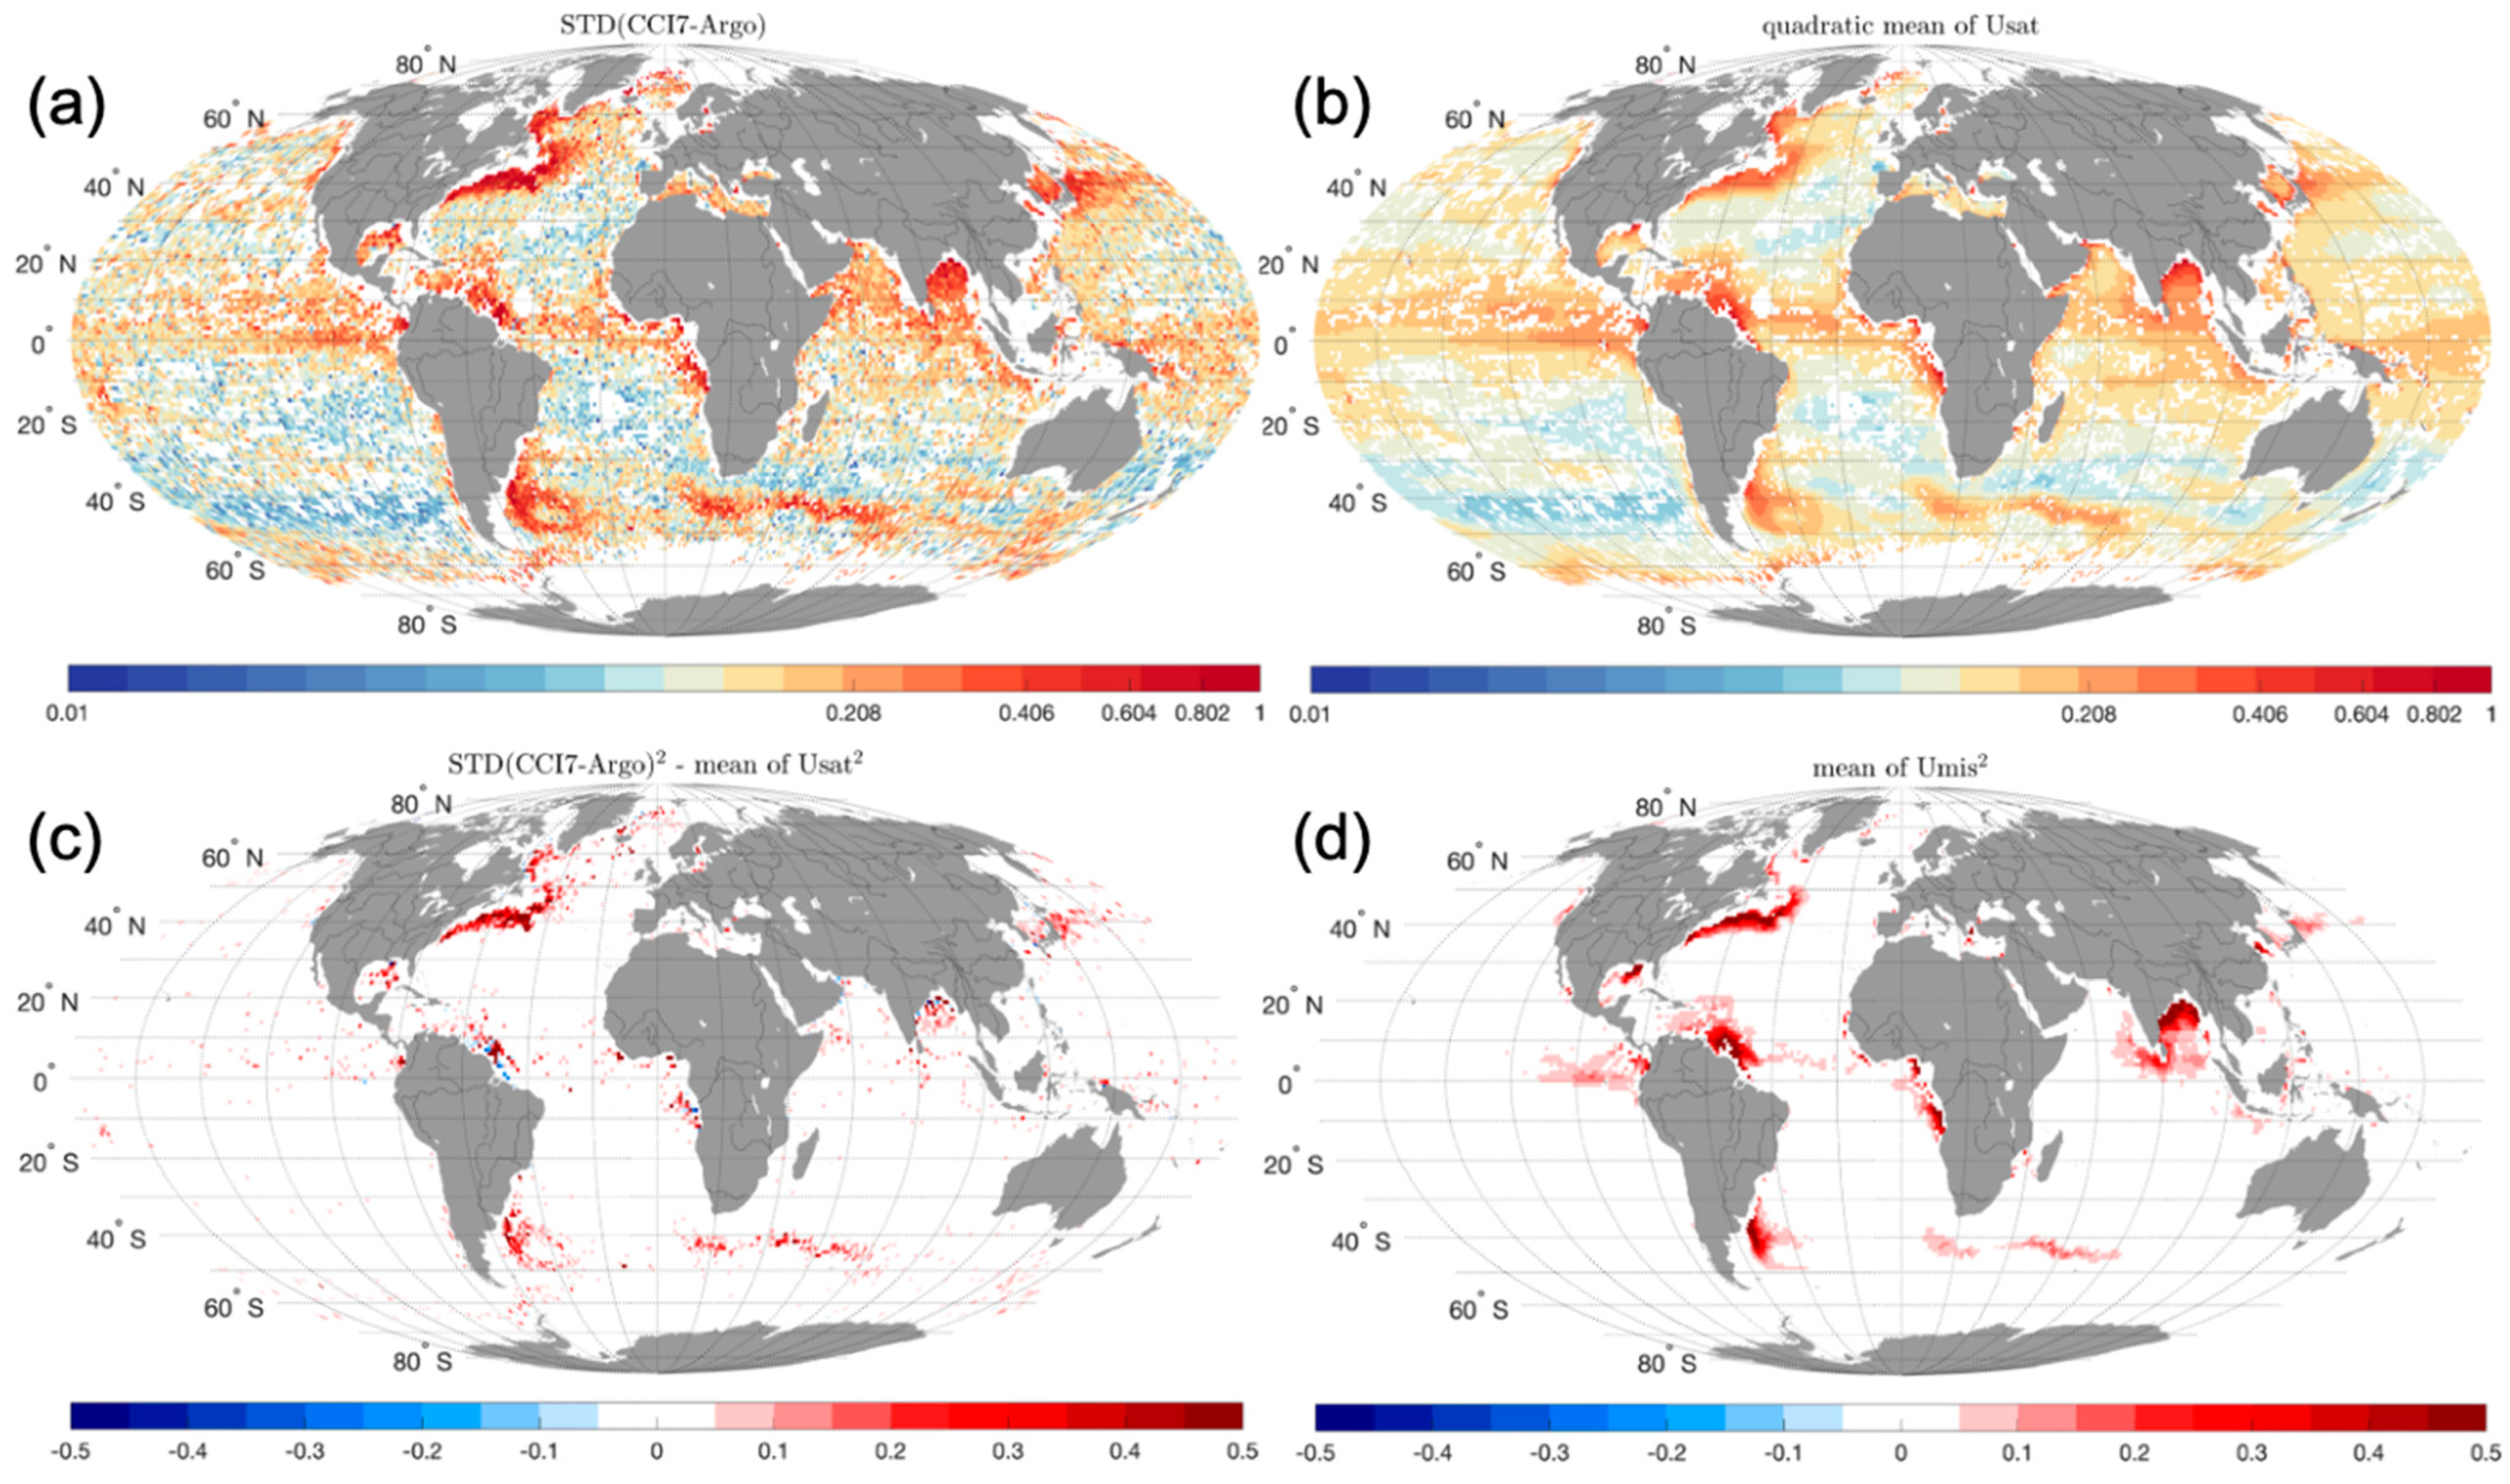
3.1. The Different Contributions to the Uncertainty Balance

Before analyzing the observed differences between CCI+SSS and Argo salinities normalized by the uncertainties for each collocated matchup, we focus on the main contributors to Equation (1), temporally integrated over the 2016–2018 period (Figure 3). Qualitatively, the STD differences between Argo and CCI salinities (STD (CCI7-Argo), Figure 3a) and the quadratic mean of Usat from CCI data (Figure 3b) are similar in most open ocean regions, where the natural variability of salinity is expected to be low (below 0.2). The STD of CCI7-Argo SSS seems therefore bounded by the value of the satellite uncertainty Usat in regions of low variability. High values of STD (CCI7-Argo) (>0.5, going up to 1) are observed in Figure 3a in regions where natural variability is important, for example, in river plumes (notably the Amazon, Congo, Malvinas, Ganga Brahmaputra and Mississippi) and in areas of important fronts (Gulf Stream region, Agulhas return current and Kurushio). In these regions, Usat is also higher than in low variability regions due to an increased uncertainty in the CCI weekly SSS field related to the temporal undersampling of SMOS and SMAP, but Usat remains, in these regions, lower than the STD(CCI7-Argo). The difference between the squared terms (STD2(CCI7-Argo)—mean (Usat2), Figure 3c) and Umis2 (Figure 3d) agree qualitatively well, even though Umis appears higher in river plumes between 20°N and 20°S. In a few regions, notably near Japan and in the Labrador Current region, we observe large values of STD(CCI7-Argo) that are stronger than Usat and Umis. These differences are likely due to the frequent presence of RFIs in these regions [26].

3.2. Detailed Analysis of Uncertainties Balance

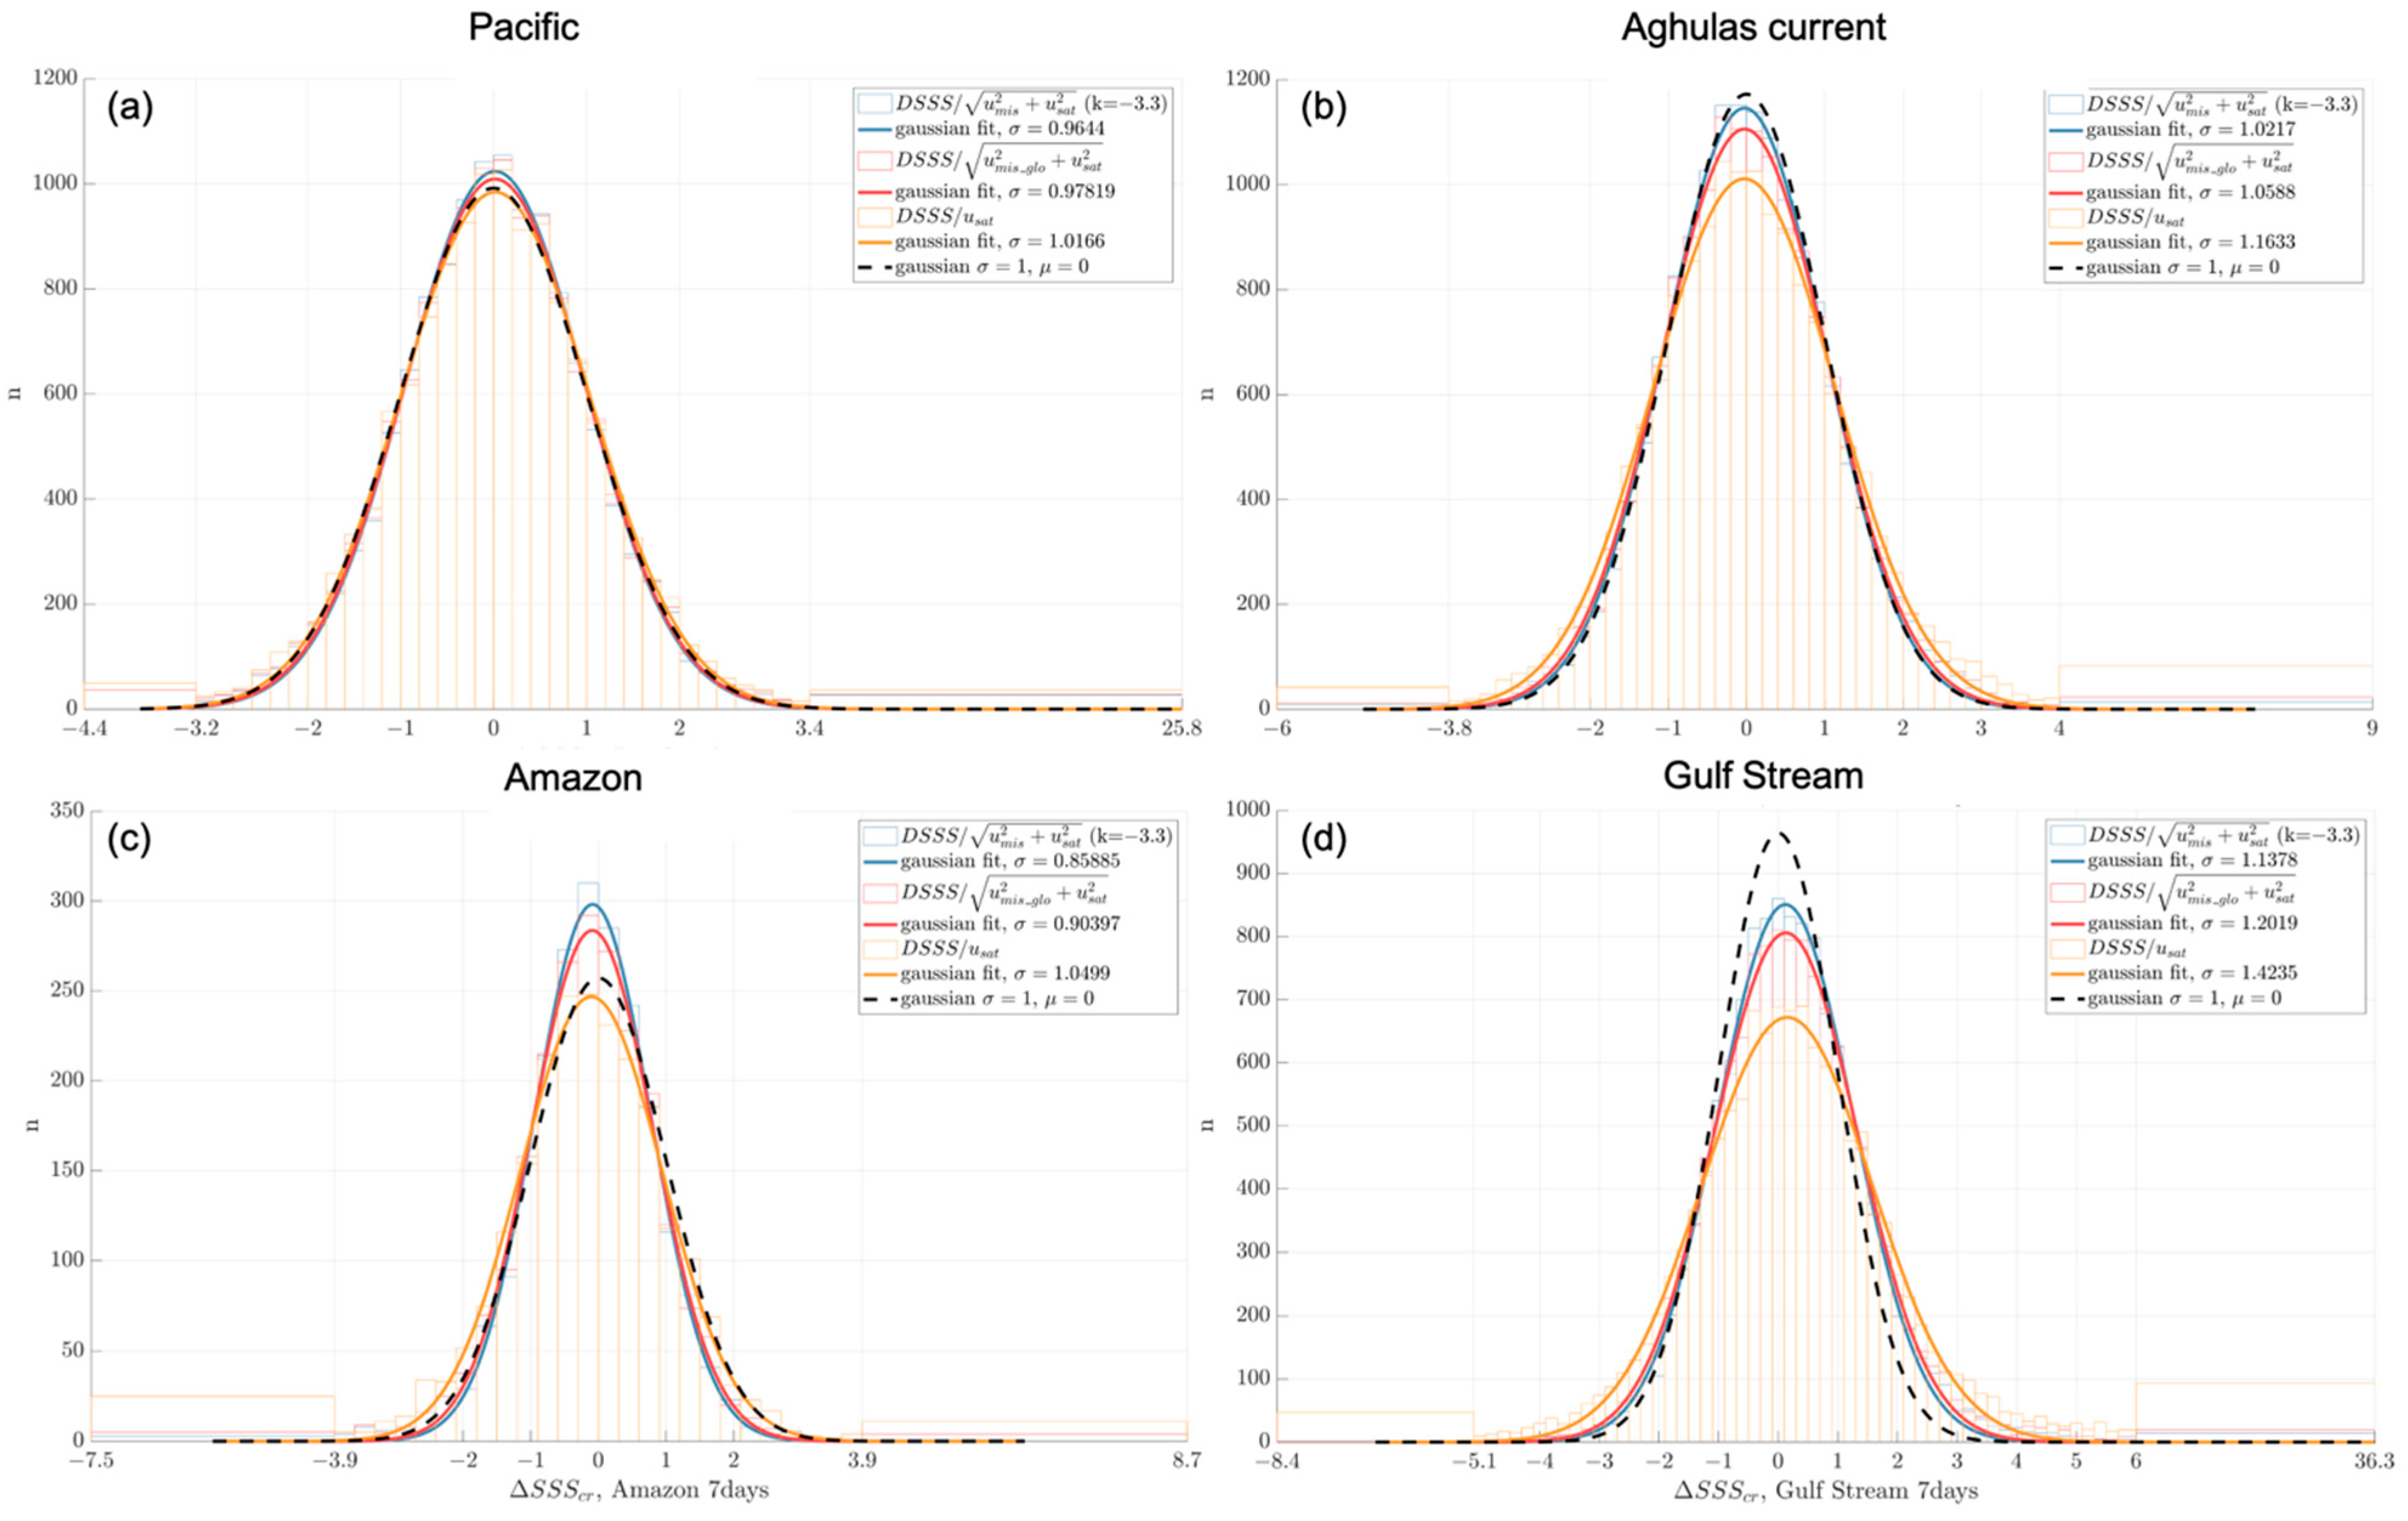
3.2.1. Distribution of Reduced Differences

We first analyze the distribution of all differences taken between 2016 and 2018. Figure 4 shows the distribution obtained over the global ocean, and Figure 5 shows the distributions obtained in the various areas indicated on Figure 2 and Table 1. The corresponding STD of the distributions are in Table 2.
In order to estimate the impact of the uncertainty mismatch Umis_glo on the comparisons between in-situ Argo values and CCI products, we analyze the STD of the differences normalized by:
(a)
The satellite uncertainty Usat only (orange curves);
(b)
The quadratic mean of Usat and Umis_glo (red curves); and
(c)
The quadratic mean of Usat and Umis (blue curves).
We then test the closeness of the distribution of the error-reduced salinity differences to a Gaussian distribution with a STD equal to 1 as proposed by [6].
A Gaussian fit (mean and STD estimated using Matlab Non-Linear Least Squares fitting method) is superimposed on the different histograms, and we consider the standard deviation of this fit in each case. If the uncertainties are correctly estimated, we expect the normalized difference to follow a Gaussian distribution with a standard deviation of 1 and mean of 0; such a distribution is represented in the black dotted lines. This Gaussian distribution is calculated by considering the same number of measurements as the populations studied, i.e., the distributions have the same integral value. The outliers at the ends of the histograms have been gathered into a single class.
These figures show a clear improvement of the distributions when the sampling mismatch uncertainty is taken into account: over the global ocean, the standard deviation goes from a value of 1.16 with Usat only (orange curve), which is too large, to a value of 1.03 much closer to unity with the quadratic sum of Usat and Umis_glo (red curve). Using Umis (blue curve) results in a STD of 0.99, very close to the value of 1 we are looking for.
In addition, taking into account Umis_glo considerably reduces the distribution tails: the values higher than 3.9 are reduced by about one half, and even more with Umis.
More relevant comparisons can be made by focusing on regions of particularly high or low variability. First, in the low variability region of the eastern South Pacific, we observe that the uncertainty that plays a major role is Usat, and that the addition of Umis_glo has little impact on the distribution of differences. On Figure 5a, the STD of the red and blue curves taking into account Umis_glo are slightly too low, which means that Umis_glo or Usat is slightly overestimated in this region.
In the variable regions, the improvement is not homogeneous. In the region of the Agulhas current retroflection (Figure 5b), we obtain good results, taking into account Umis_glo and Umis allows one to obtain a STD of 1.05 and 1.02, respectively.
In the Gulf Stream region, Figure 5d, the histograms are under the black curve meaning that Umis_glo or Usat are too low. Taking into account Umis_glo or Umis allows one to get closer to a Gaussian of standard deviation of 1, going from a STD = 1.42 for the orange curve to a STD = 1.20 or STD = 1.13 with Umis_glo and with Umis, respectively. This corresponds to an improvement of about 30% but remains imperfect. This may be related to remaining seasonal biases observed in this region in the CCI data whose origin remains under study.
In the Amazon plume (Figure 5c), on the other hand, the orange curve is already close to a Gaussian distribution with STD = 1, and adding Umis_glo and Umis has a too strong impact. This could be related to uncertainty in GLORYS derived variability, as discussed in next section.
To highlight the potential of the method to validate Usat, we compare the standard deviation values to the distributions obtained with the previous version of the CCI products (v2.3), for the global ocean, in which Usat was estimated with a simplified approach.
With version 2.3 at global scale, the STD obtained was less than 1 (standard deviation of 0.93 with Umis_glo and 0.89 with Umis). In version 2.3, the errors were therefore overestimated by about 12% and particularly too high in regions of low variability. This has been corrected in version 3.2. Histograms for version 2.3 are available in Supplementary Materials.
For monthly products (figures available in Supplementary Materials), the superposition of histograms shows a clear improvement in the distribution of reduced differences when mismatch uncertainty is taken into account, both at the global level and in the variable regions. Indeed, this shifts from a STD always higher than 1 (1.55 at the global scale) to a STD close to 1 (1.1 with Umis_glo, 1.003 with Umis). In the Pacific region, the importance of mismatch uncertainty is less, but taking it into account also allows one to approach the STD = 1 curve. The histograms on the variable regions yield the same conclusions as with the weekly products.

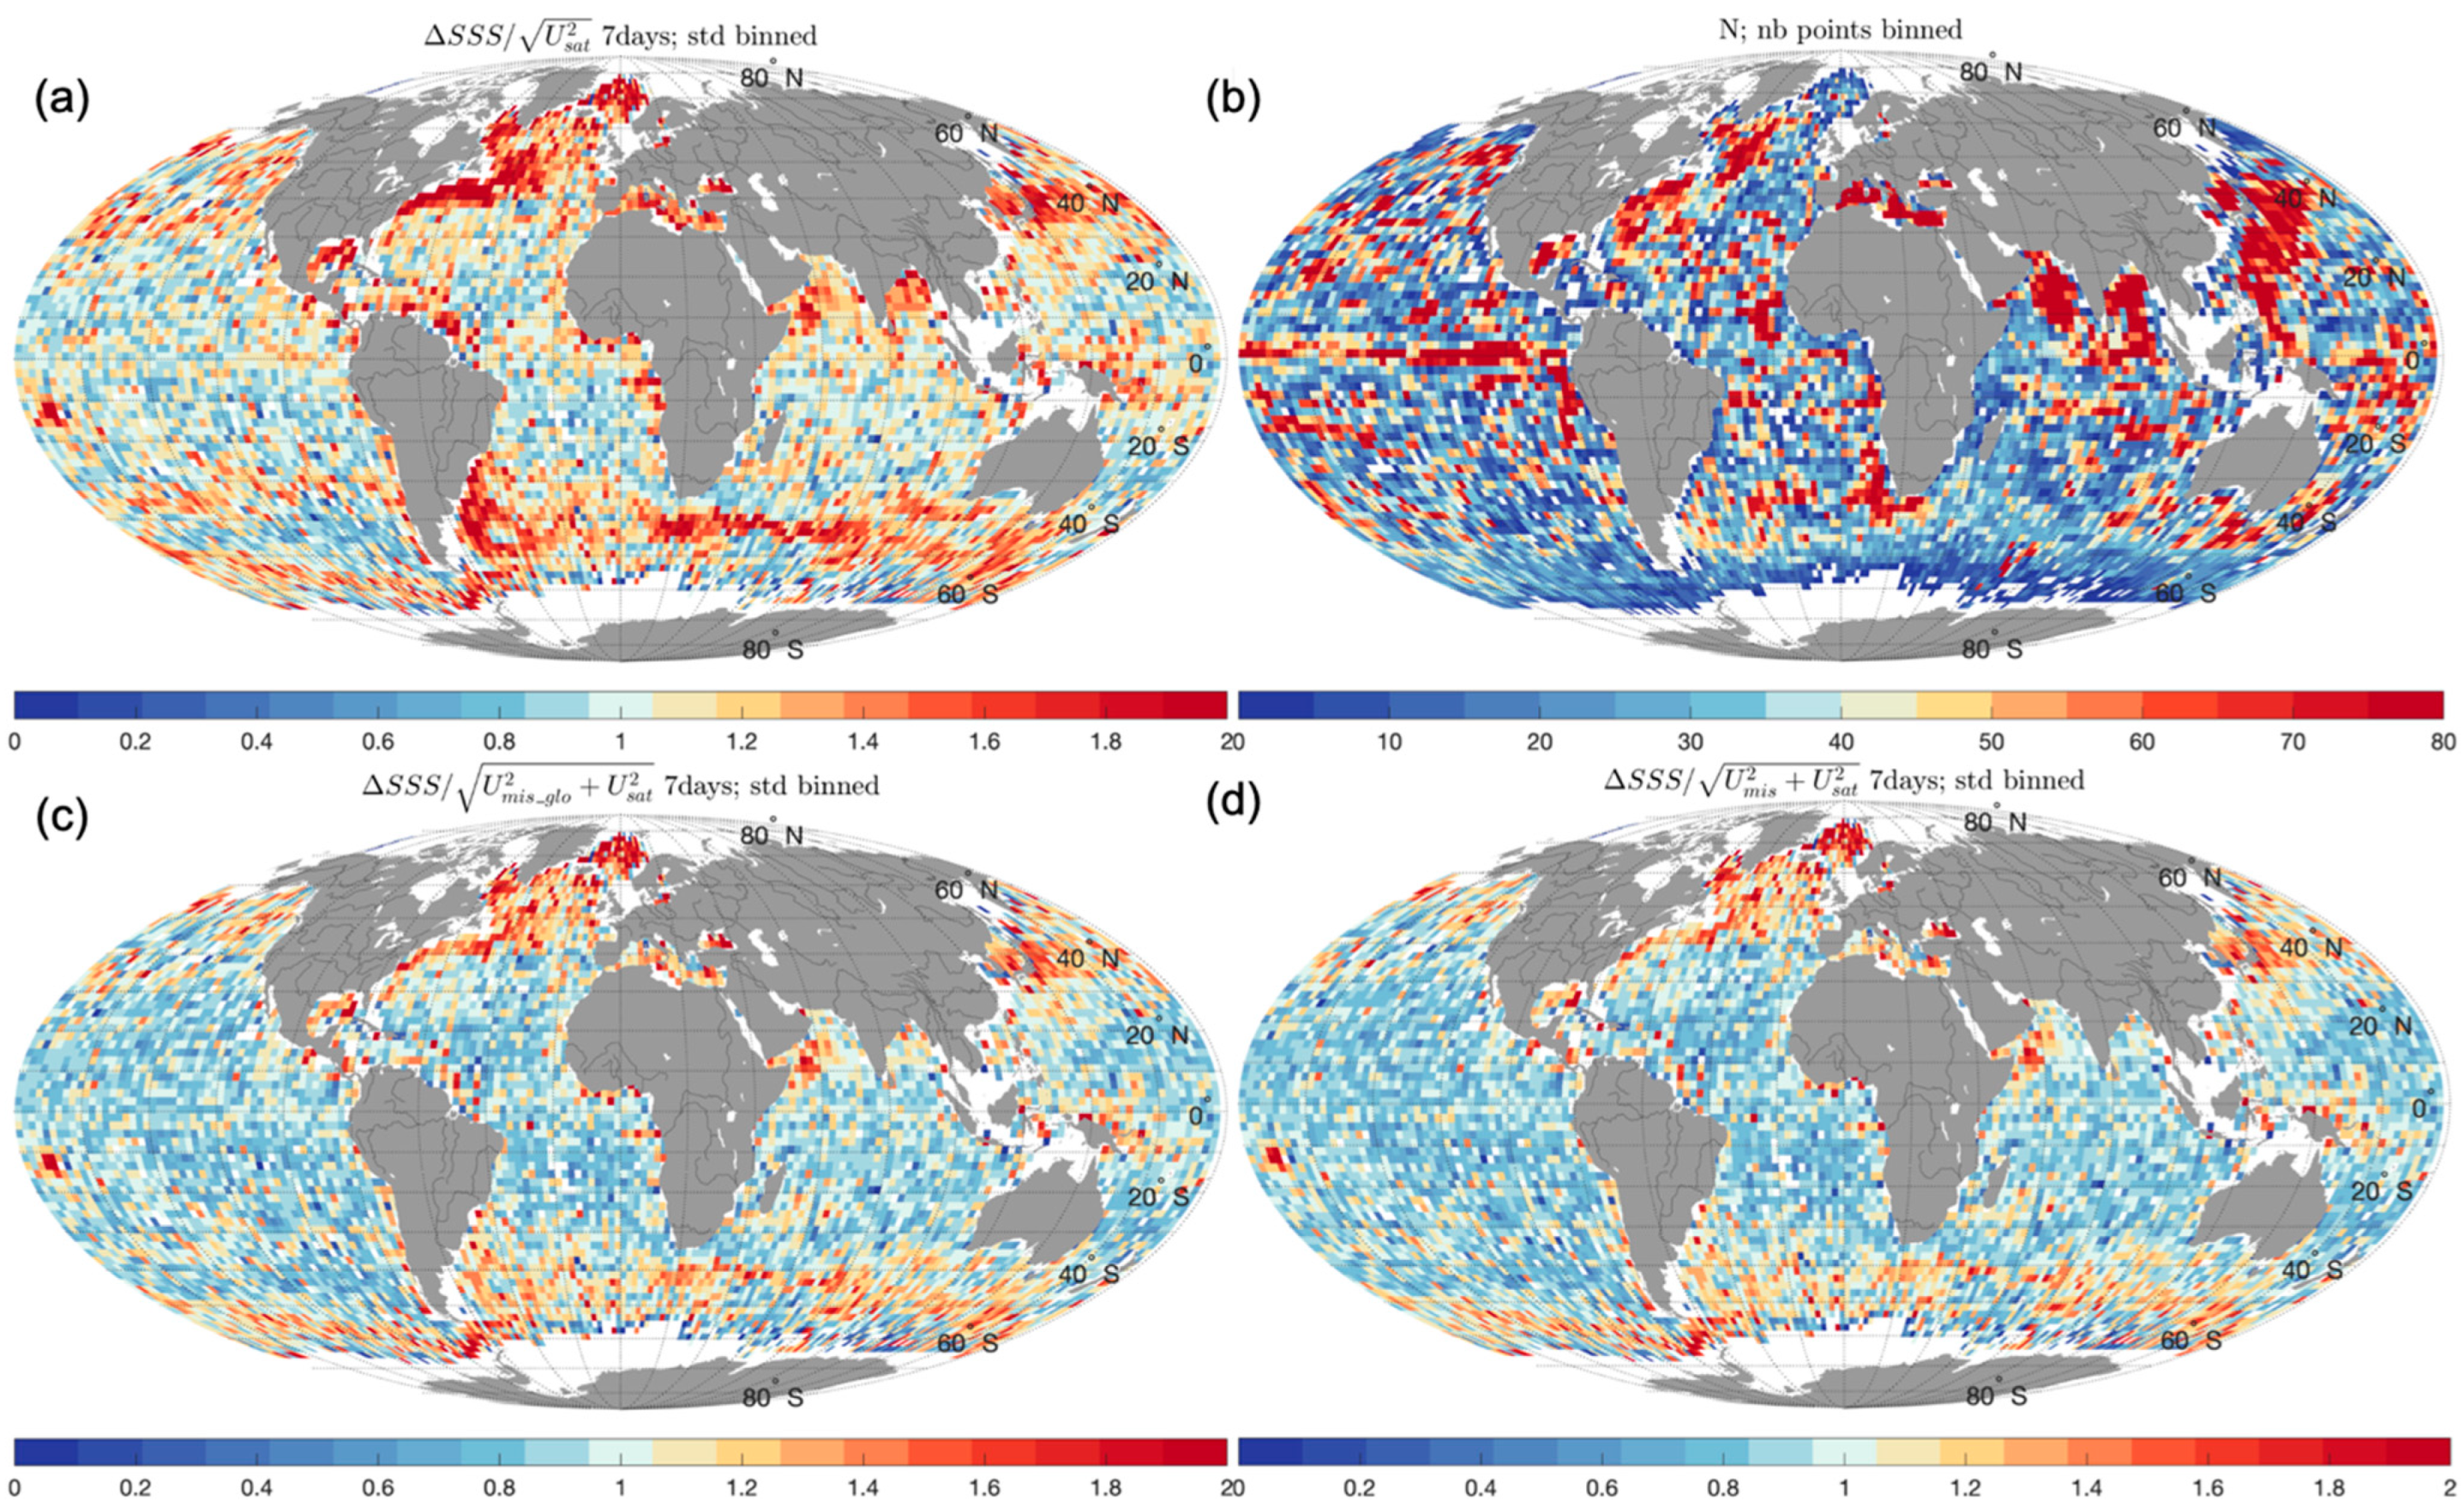
3.2.2. Global Distributions

We now investigate further the spatial distribution of STD computed in 2° boxes. In this section, we focus on the validation of the CCI v3.2 weekly SSS and associated uncertainties, taking into account, step by step, the different sources of uncertainties involved in Equation (1) (Figure 6) and in 2° boxes to provide a better understanding of the geographical variations of the different sources of uncertainty. As in the previous section, the three normalization methods are evaluated here.
Figure 7 shows histograms of the variances multiplied by the number of measurements in the 2° boxes shown in Figure 6a,c,d. The black dashed curve represents the theoretical curve that these histograms should follow if the normalized differences distributions in each box follow a N(0,1) distribution, as we expect when the uncertainties are correctly estimated.
The introduction of Umis_glo (Figure 6c) reduces the very large STD in highly variable regions such as the Gulf Stream or the Agulhas Current retroflection. This reduction is even stronger with Umis (Figure 6d). This can be seen in the histograms (Figure 7), where the red and blue histograms, which take into account Umis_glo and Umis, respectively, are much closer to the black theoretical curve for high values (above 50) corresponding to high variances than the orange histogram, where the differences are normalized by Usat only. Quantitatively, the correlation coefficient between the χ2 theoretical distribution and the one obtained with Usat only is 0.95, and, respectively, 0.97 and 0.98 when taking into account Umis_glo or Umis.
This result is similar and more pronounced for monthly products (see maps in Supplementary Materials). By normalizing the differences by Usat only, the STD obtained is clearly greater than 1 and often even greater than 2 in a large majority of the 2° boxes. Taking into account Umis_glo or Umis gives quite similar maps (Figure 6c,d), which again shows the importance of mismatch uncertainties in the validations, especially for monthly products. The histograms obtained for the monthly products also show this clear improvement, which is strengthened with Umis. The correlation coefficient between the χ2 theoretical distribution and the one obtained with Usat only is 0.81, and, respectively, 0.97 and 0.98 when taking into account Umis_glo or Umis.
When the same study was conducted on the CCI version 2 weekly products, the results were further from the calculated theoretical χ2 curve, with a very large number of points at low values of n Var(X) indicating that the Usat of version 2 was overestimated, mostly because of the simplified propagation of errors in version 2 instead of the full least square propagation of the errors implemented in version 3. The correlation coefficient between the χ2 theoretical distribution and the one obtained with Usat only is 0.71 and, respectively, 0.75 and 0.76 when taking into account Umis_glo or Umis for CCI v2.

4. Discussion

4.1. Estimation of the Sampling Mismatch Uncertainty

The issue of quantitative comparison between datasets with different spatio-temporal resolution is common to other research areas, such as the ocean model community, and methodologies of different complexities have been proposed to address it (e.g., [9]). In this study, we estimate the sampling mismatch uncertainty with a classical methodology, with our focus being not on the development of original methods for estimating sub-pixel SSS heterogeneity but rather on demonstrating possible improvements in satellite SSS validation by including a quantification of sampling mismatch effects in routine SSS validation exercises. In particular, the Pi-MEP validation platform does not yet include representativity uncertainties between satellite and in situ SSS, but it is planned to include different ways of taking them into account in the coming years.
One can question the legitimacy to use the GLORYS reanalysis to represent the in-situ point measurement. This product has several limitations.
The first limitation is the spatial resolution of the model, 1/12°, which corresponds to about 10 km near the equator, which is a higher resolution than the satellite salinity data but is still far from a point data. Nominally, this grid resolution corresponds to a Nyquist cutoff wavelength of about 20 km. It was not feasible in this study to use higher resolution simulations due to numerical computation limitations. It would nevertheless be of importance in further studies to look at the spectral information content of both GLORYS and CCI SSS products to confirm the nominal product resolutions considered in our study.
To counter this limitation, we have multiplied our uncertainties mismatch estimates by a coefficient, in order to adjust these values by taking into account the finer scales. This coefficient is calculated by assuming a PSD slope in k−3.3 constant in time and space, but this slope could vary slightly according to regions and time. We note, however, a weak variation of the coefficient according to the slope of the spectrum: +(−)2% for a spectrum of slope of k−3.2 (k−3.4), compared to the used spectrum of slope k−3.3.
To validate the sampling mismatch derived from GLORYS simulations, we have compared model variability to in-situ variability derived along ship tracks available between 2016 and 2018.
The GLORYS variability compared to TSG variability derived along merchant ships lines (Figure 8a,b) indicates that the differences are small, less than 0.02 for most measurements, with the GLORYS variability being generally slightly higher than the in-situ variability. The difference is greater in regions of high variability such as fronts or river flows but remains below ~20%, as shown in the histogram in Figure 8c. This result seems counter-intuitive as one would expect the GLORYS salinity variability to be lower since the resolution of the reanalysis is lower than the resolution of the ships measurements and since we did not add contribution for the small scales not resolved by GLORYS in these comparisons.
The observed discrepancies near river plumes may be due to a limitation of the GLORYS reanalysis, which uses climatological river run-offs as a forcing [29] (as explained in [23]) and thus does not take into account interannual variability in river discharge. The study [30] shows that the RMSD of the GLORYS model relative to Argo data decreases near the Amazon and Congo estuaries when assimilated with SMOS satellite data. This suggests that the spatial variability of the model is overestimated in the river plume regions, confirming the biases observed in the comparisons to merchant ships in these regions.
Another study [31] shows that sub-mesoscale structures are poorly represented in the GLORYS model, due to the too coarse spatial resolution. This could explain the differences observed in the Gulf Stream.
Overall, however, the observed differences between the TSG and GLORYS model variabilities are relatively small. We consider the GLORYS reanalysis variability to be a sufficiently good representation of the natural variability on a global scale, although we note that the differences are greater in regions of high variability.
The way we estimate Umis_glo is close to the one used by [13] to estimate the Representation Error (RE), except that [13] uses higher resolution (1/48°) simulations. We have compared both estimates, made within an area of 50 km radius for Umis_glo and within 40 km for RE. Maps of the median of Umis_glo over the 3 years of our study (available in Supplementary Materials) are qualitatively in agreement with the 40 km RE (Table S5 of [13]).

4.2. Sampling Mismatch Uncertainty and Representativity Uncertainty Included in Usat

Usat quantifies the uncertainty on the weekly-50 km smoothed SSS related to the temporal undersampling of SMOS and SMAP. This temporal variability, taken into account in the CCI temporal optimal interpolation, is deduced from the GLORYS SSS fields smoothed to 50 km. Therefore, Usat does not include information on the spatial variability at scales smaller than 50 km nor on the expected variability between a point in time measurement and a weekly field, contrary to Umis. Nevertheless, a flaw in GLORYS SSS fields that would affect SSS fields at scales both larger and smaller than 50 km would lead to correlated errors in Usat and Umis. We cannot rule out this kind of error near river plumes between 20°N and 20°S.

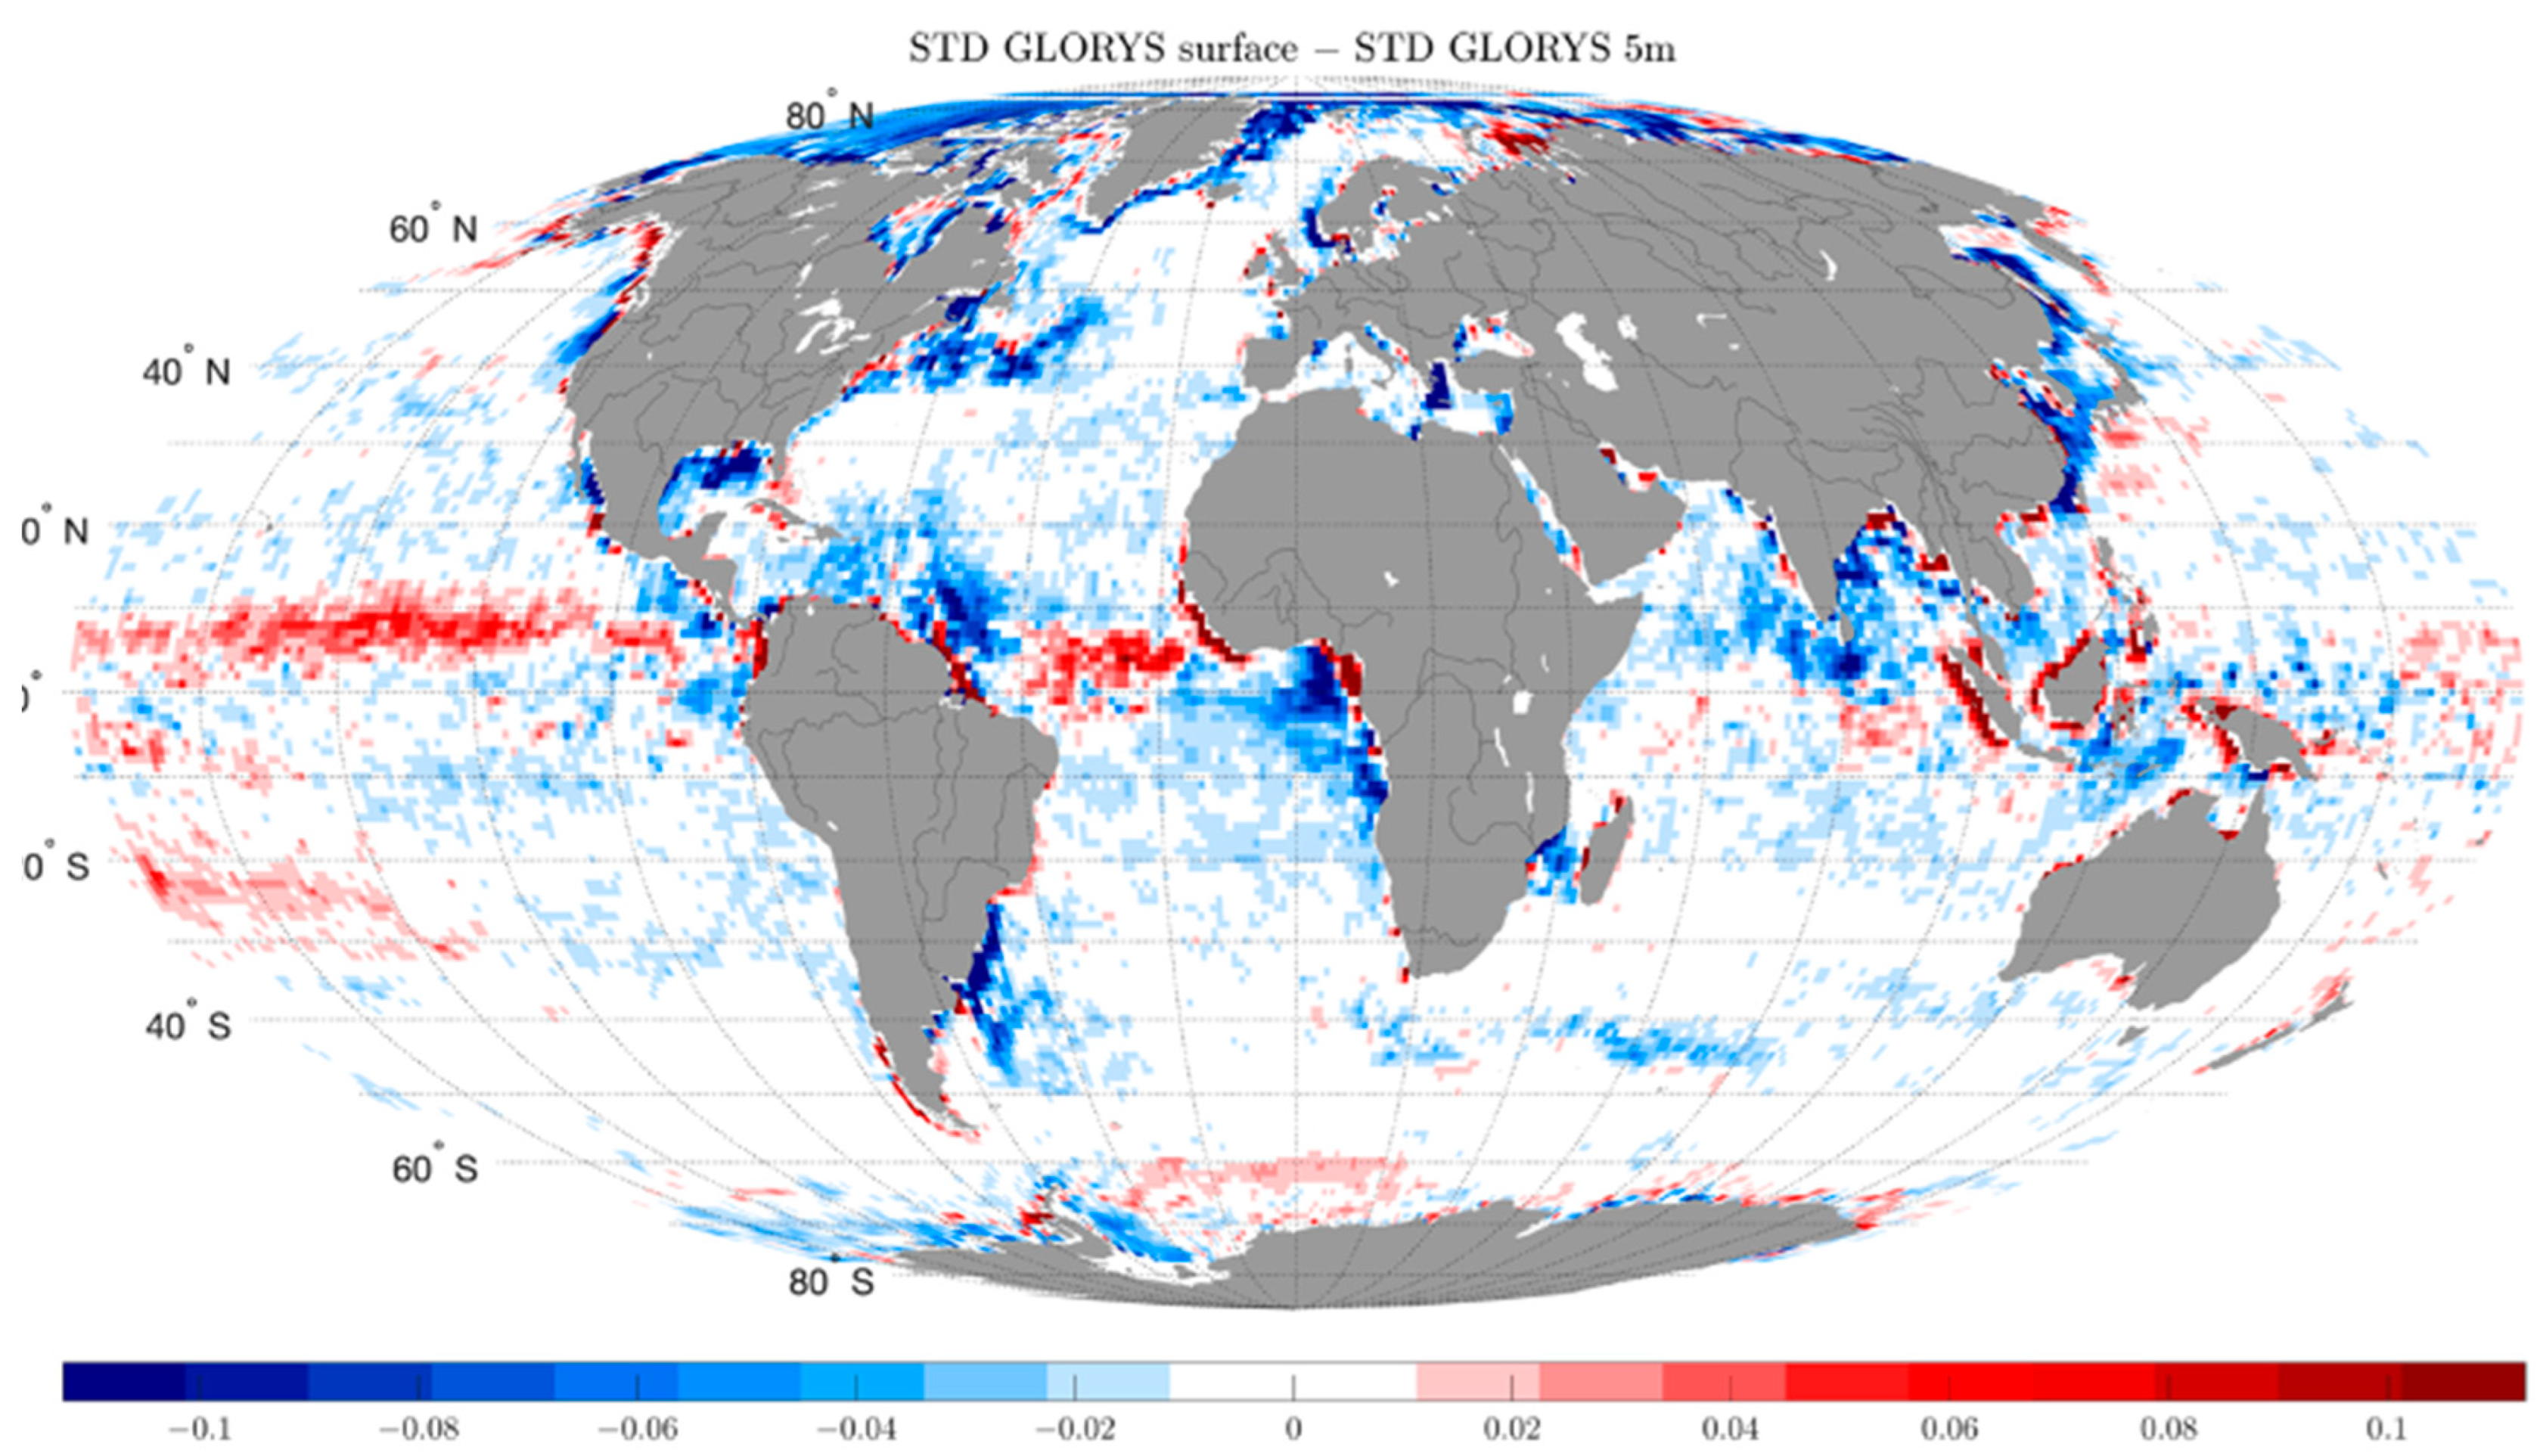
4.3. Vertical Near-Surface Variability

As indicated in the methods section, we used the 5 m depth layer of the GLORYS model to take into account the fact that the majority of the ARGO data are taken at 5 m depth, and that the CCI data are corrected for a ‘nearly-instantaneous’ effect of rain. However, rain is not the only element generating a salinity gradient in the surface layer. To quantify the vertical variability of salinity and its influence on comparisons between Argo at 5 m and satellite surface salinity, we have calculated the GLORYS sub-footprint variability at the surface as well. Figure 9 shows the GLORYS STD at the surface minus the GLORYS STD at 5 m, averaged over 3 years.
The differences obtained can reach 0.1, in regions where salinity is highly variable. We can distinguish three types of regions in Figure 9. In regions strongly impacted by rainfall, the variability of measurements at 5 m depth is lower than the surface variability. The observed differences are indeed very close to the impact of rain on salinity calculated by [32], from SMOS data, and this effect is corrected in the CCI products. Large differences between SSS and a few meters depth salinity are also expected in river plumes characterized by strong vertical stratification (e.g., [33]). However, in areas off the mouth of the river, the variability calculated at 5 m is often higher than the surface variability. The origin of these patterns is not well known; 5 m depth could be close to the halocline depth and surface fresh waters could be isolated from the variability of the layers below, but the assimilation of in situ data often performed close 5 m depth could also generate some additional variability. Finally, in regions of low variability, the difference between the variability at 5 m and the surface variability is close to zero.
As the CCI version 3.2 product contains a correction for rainfall effects, it is wise to calculate a STD at 5 m depth in rainy regions. On the other hand, to be completely consistent, it would be necessary to use an STD based on a comparison of individual points at 5 m against a surface average value in regions where a large difference in variability between the surface and 5 m is observed but not affected by rain, such as close to fronts or river plumes. However, since the variability derived from GLORYS at 5 m depth is most of the time higher than the one obtained with in situ measurements (Figure 8), this effect is likely within the uncertainty of the STD derived from GLORYS simulations.

5. Conclusions

We find a remarkable agreement between CCI version 3.21 products (SSS and SSS uncertainties) and Argo upper salinities once the uncertainty due to sampling mismatch between CCI+SSS satellite products and in-situ Argo measurements is taken into account. This is particularly striking for the distributions of the differences between satellite and in situ salinities normalized by the sum of the uncertainties associated with each satellite-in situ colocation Equation (1): at global scale, when mismatch uncertainties are taken into account, the normalized distribution is very close to a Gaussian distribution with a unit sigma contrary to the one normalized with the satellite salinity uncertainty only (Figure 4). The role of the sampling mismatch is particularly important in regions with high variability, as shown in Figure 6. In regions with low variability, on the other hand, the contribution of the sampling mismatch uncertainty is very small compared to the satellite uncertainty. Taking into account Umis_glo or Umis in the validation allows the STD of the normalized differences to get very close to a χ2 theoretical distribution (Figure 7; correlation coefficient of 0.95 with Usat only and of 0.98 when taking into account sampling mismatches).
Even though the spatial resolution of the GLORYS reanalysis does not resolve very fine scale phenomena (<20 km), we find that they should also be taken into consideration to approximate the sampling mismatch uncertainties. At global scale, the STD of the normalized differences is 1.15 when only the satellite SSS uncertainty is considered and 1.03 when the GLORYS derived mismatch is taken into account. Moreover, we find that an efficient way to counter the limited spatial resolution of GLORYS is to adjust the GLORYS derived variabilities by a spectral analysis as proposed by [12]. With this correction, the global scale STD of the normalized differences equals 0.99.
The analyses shown in this main paper have been obtained with weekly CCI fields. Analyses of monthly CCI v3 data compared with Argo data (in Supplementary Information) give similar results but with a reinforced importance of the mismatch uncertainty compared to the uncertainty of the monthly satellite SSS (which is reduced with respect to the uncertainty of the weekly fields). Again, the spectral correction of GLORYS variability improves the comparisons.
The results obtained at global scale are corroborated by analyses of distributions over large regions. The standard deviation of the distribution of differences reduced by the quadratic sum of the uncertainties Usat and Umis has a standard deviation very close to 1 over the global ocean, slightly too high (1.05) in the variable regions and a little too low (0.98) in the region of low variability of the Pacific. These results are significantly better, up to 30% better in the Gulf Stream, than when the sampling mismatch uncertainty is not taken into account.
These results highlight the consistency of satellite uncertainties of CCI version 3 products at the global scale, considering the validation method proposed by [7]. We observe an overly pitted distribution of reduced differences in the Amazon region, corresponding to a 15% overestimate of the total variability. Although this could indicate an overestimation of Usat, as was commented on in the discussion, the calculation of Umis_glo in the river plume regions may be too high. Future studies should address this issue by comparing the variabilities obtained from GLORYS to the ones estimated from other models or with other in situ datasets.
Conversely, in the Gulf Stream region, the distribution of reduced differences is too wide, and the STD is too high by about 15%, which suggests that Usat is too low there. This could be related to remaining seasonal variation of biases at high northern latitudes possibly linked to ice contamination, and to calibration flaws related to sun or antenna temperature or RFIs impacts, which are not well represented in the Usat values.
The interest of this method is also to carry out comparative validations between different products. The results of these tests on the previous version of the CCI products (version 2) highlights the clear improvement of uncertainty estimates in the new version related to modifications in the error propagation in the optimal interpolation methodology. This shows the importance of carrying such tests for the validation of satellite products and their uncertainties.
For reasons of data availability and computational time, we have restricted the study to three years during the period common to SMOS and SMAP. It would be interesting for complete validations to conduct a similar study for the whole period of the CCI products. Indeed, the information used to derive Usat, the satellite measurements uncertainties and the representativity uncertainties is specific to each instrument and strongly differs for the Aquarius measurements. Aquarius SSS’ uncertainties are lower than the uncertainties of SMOS and SMAP level 2 SSS, while its representativity uncertainties are larger due to the spatial integration over 100–150 km relative to 50 km and to a narrower swath leading to an increased undersampling. The work on level 4 CCI+SSS data presented here could also be applied to other types of data, by adapting the spatio-temporal scales on which the uncertainties due to sampling mismatches are calculated.

Supplementary Materials

The following supporting information can be downloaded at: https://www.mdpi.com/article/10.3390/rs14081878/s1. Figure S1: Monthly GLORYS SSS SFV, 15 February 2017. Figure S2: Same as Figure 4 and Figure 5 of main paper, for CCI v3.2 monthly products. Figure S3: Same as Figure 4 and Figure 5 of main paper, for CCI v2.3 weekly products. Figure S4: Same as Figure 4 and Figure 5 of main paper, for CCI v2.3 monthly products. Figure S5: Same as Figure 6 and Figure 7 of main paper, for CCI v3.2 monthly products. Figure S6: Same as Figure 6 and Figure 7 of main paper, for CCI v2.3 weekly products. Figure S7: Same as Figure 6 and Figure 7 of main paper, for CCI v2.3 monthly products. Table S1: Median SSS SFV, computed from GLORYS for a 50 km footprint for the all the months of the year, for comparison with Bingham 2021 results. Unitless color scale, with the colors scaling with the base 10 logarithm of the SFV. The month is given at the top of each panel.

Author Contributions

Conceptualization, C.T.-M., J.B. and J.-L.V.; methodology, C.T.-M., J.B., J.-L.V. and G.R.; software, C.T.-M., J.B., J.-L.V., A.C.H.M. and S.G.; validation, C.T.-M., J.B., J.-L.V., A.C.H.M., S.G. and G.R.; formal analysis, C.T.-M., J.B., J.-L.V. and A.C.H.M.; investigation, C.T.-M., J.B., J.-L.V., A.C.H.M. and G.R.; resources, J.B., S.G., N.R. and O.H.F.-d.; data curation, J.-L.V., G.R., and S.G.; writing—original draft preparation, C.T.-M. and J.B.; writing—review and editing, C.T.-M., J.B., J.-L.V., G.R., A.C.H.M. and S.G.; visualization, C.T.-M., J.B., J.-L.V. and G.R.; supervision, J.B., J.-L.V. and G.R.; project administration, R.S. and R.C.; funding acquisition, J.B., N.R., R.C. and O.H.F.-d. All authors have read and agreed to the published version of the manuscript.

Funding

Clovis Thouvenin-Masson is cofunded by a CNES and ACRI-st (convention 3233). This study was funded by ESA CCI contract 4000123663/18/I-NB and by CNES TOSCA SMOS-Ocean project.

Data Availability Statement

SSS CCI datasets are freely available [14]. The Pi-MEP MDB are freely available as NetCDF files [34] and corresponding validation reports are available on [35].

Acknowledgments

We thank Elisabeth Rémy from Mercator-Ocean for valuable information about GLORYS simulations and three anonymous reviewers for their careful comments and suggestions.

Conflicts of Interest

The authors declare no conflict of interest.

Appendix A

In this appendix, we describe the method for calculating Umis, based on a spectral analysis of surface salinity. This method has been developed in [12], Appendix A.
The variance of a signal between a chosen wavelength and the Nyquist wavelength can be inferred assuming that the slope of the spectrum between the two wavelengths is reasonably known.
The variance of a signal is defined as the integral of its PSD:
σ k = k k n π π P S D ¯ ( k ) k d θ d k
where k = k x 2 + k y 2 and kn is the Nyquist wavenumber.
We consider the power spectral density of salinity to have a power-law scaling [12,20]
y ( k ) = b k m
where m corresponds to the slope of the PSD when viewed as a log-log plot and b is the y-intercept of the PSD.
Introducing (A1) into (A2) gives
σ k = k k n π π b k m k d θ d k
Additionally, integrating with respect to θ ,
σ k = k k n 2 π b k 1 m d k
And with respect to k,
σ k = 2 π b m 2 ( k 2 m k n 2 m )
We can express this formula as a function of wavelength:
σ λ = 2 π b m 2 ( λ m 2 λ n m 2 )
In this equation, λ is the wavelength below which we calculate the variance and   λ n is the Nyquist wavelength.

References

  1. Li, G.; Cheng, L.; Zhu, J.; Trenberth, K.E.; Mann, M.E.; Abraham, J.P. Increasing ocean stratification over the past half-century. Nat. Clim. Chang. 2020, 10, 1116–1123. [Google Scholar] [CrossRef]
  2. Bindoff, N.L.; Cheung, W.W.L.; Kairo, J.G.; Arístegui, J.; Guinder, V.A.; Hallberg, R.; Hilmi, N.J.M.; Jiao, N.; Karim, M.S.; Levin, L.; et al. Changing ocean, marine ecosystems, and dependent communities. In IPCC Special Report on the Ocean and Cryosphere in a Changing Climate; Intergovernmental Panel on Climate Change: Geneva, Switzerland, 2019; pp. 477–587. [Google Scholar]
  3. Reul, N.; Grodsky, S.; Arias, M.; Boutin, J.; Catany, R.; Chapron, B.; D’Amico, F.; Dinnat, E.; Donlon, C.; Fore, A.; et al. Sea surface salinity estimates from spaceborne L-band radiometers: An overview of the first decade of observation (2010–2019). Remote Sens. Environ. 2020, 242, 111769. [Google Scholar] [CrossRef]
  4. Vinogradova, N.; Lee, T.; Boutin, J.; Drushka, K.; Fournier, S.; Sabia, R.; Stammer, D.; Bayler, E.; Reul, N.; Gordon, A.; et al. Satellite Salinity Observing System: Recent Discoveries and the Way Forward. Front. Mar. Sci. 2019, 6, 243. [Google Scholar] [CrossRef]
  5. Boutin, J.; Reul, N.; Koehler, J.; Martin, A.; Catany, R.; Guimbard, S.; Rouffi, F.; Vergely, J.L.; Arias, M.; Chakroun, M.; et al. Satellite-Based Sea Surface Salinity Designed for Ocean and Climate Studies. J. Geophys. Res. Oceans 2021, 126, e2021JC017676. [Google Scholar] [CrossRef]
  6. Martin, A.C.H.; Guimbard, S.; Koehler, J.; Akhil, V.P.; Vialard, J.; Houdegnonto, O.; Kolodziejczyk, N.; Boutin, J.; Reul, N.; Catany, R. Climate Change Initiative+ (CCI+) Phase 1 Sea Surface Salinity: Product Validation and Intercomparison Report (PVIR) Version 3.0. 2021. Available online: http://nora.nerc.ac.uk/id/eprint/531913 (accessed on 13 February 2022).
  7. Merchant, C.J.; Paul, F.; Popp, T.; Ablain, M.; Bontemps, S.; Defourny, P.; Hollmann, R.; Lavergne, T.; Laeng, A.; de Leeuw, G.; et al. Uncertainty information in climate data records from Earth observation. Earth Syst. Sci. Data 2017, 9, 511–527. [Google Scholar] [CrossRef] [Green Version]
  8. Boutin, J.; Chao, Y.; Asher, W.E.; Delcroix, T.; Drucker, R.; Drushka, K.; Kolodziejczyk, N.; Lee, T.; Reul, N.; Reverdin, G.; et al. Satellite and In Situ Salinity: Understanding Near-Surface Stratification and Subfootprint Variability. Bull. Am. Meteorol. Soc. 2016, 97, 1391–1407. [Google Scholar] [CrossRef] [Green Version]
  9. Vinogradova, N.T.; Ponte, R.M. Small-Scale Variability in Sea Surface Salinity and Implications for Satellite-Derived Measurements. J. Atmos. Ocean. Technol. 2013, 30, 2689–2694. [Google Scholar] [CrossRef]
  10. Bingham, F.; Fournier, S.; Brodnitz, S.; Ulfsax, K.; Zhang, H. Matchup Characteristics of Sea Surface Salinity Using a High-Resolution Ocean Model. Remote Sens. 2021, 13, 2995. [Google Scholar] [CrossRef]
  11. Bingham, F.; Li, Z. Spatial Scales of Sea Surface Salinity Subfootprint Variability in the SPURS Regions. Remote Sens. 2020, 12, 3996. [Google Scholar] [CrossRef]
  12. D’Addezio, J.M.; Bingham, F.; Jacobs, G.A. Sea surface salinity subfootprint variability estimates from regional high-resolution model simulations. Remote Sens. Environ. 2019, 233, 111365. [Google Scholar] [CrossRef]
  13. Bingham, F.M.; Brodnitz, S.; Fournier, S.; Ulfsax, K.; Hayashi, A.; Zhang, H. Sea Surface Salinity Subfootprint Variability from a Global High-Resolution Model. Remote Sens. 2021, 13, 4410. [Google Scholar] [CrossRef]
  14. Boutin, J.; Vergely, J.-L.; Reul, N.; Catany, R.; Koehler, J.; Martin, A.C.H.; Rouffi, F.; Arias, M.; Chakroun, M.; Corato, G.; et al. ESA Sea Surface Salinity Climate Change Initiative (Sea_Surface_Salinity_cci): Weekly and Monthly Sea Surface Salinity Product, v03.21, from 2010 to 2020. NERC EDS Centre for Environmental Data Analysis, 23 December 2021. Available online: http://dx.doi.org/10.5285/5920a2c77e3c45339477acd31ce62c3c (accessed on 13 February 2022).
  15. Perrot, X.; Boutin, J.; Vergely, J.L.; Rouffi, F.; Martin, A.; Guimbard, S.; Koehler, J.; Reul, N.; Catany, R.; Cipollini, P.; et al. CCI+SSS, A New SMOS L2 Reprocessing Reduces Errors on Sea Surface Salinity Time Series. In Proceedings of the International Geoscience and Remote Sensing Symposium (IGARSS), Brussels, Belgium, 11–16 July 2021; pp. 7457–7460. [Google Scholar] [CrossRef]
  16. Vergely, J.L.; Reul, N.; Chakroun, M.; Catany, R.; Cipollini, P. Climate Change Initiative+ (CCI+) Phase 1: Sea Surface Salinity: Algorithm Theoretical Development Basis Document (ATBD). 2021, p. 85. Available online: https://dap.ceda.ac.uk/neodc/esacci/sea_surface_salinity/docs/v03.21/SSS_cci-D2.3-ATBD-v3.1.pdf (accessed on 13 February 2022).
  17. Brodzik, M.J.; Billingsley, B.; Haran, T.; Raup, B.; Savoie, M.H. EASE-Grid 2.0: Incremental but Significant Improvements for Earth-Gridded Data Sets. ISPRS Int. J. Geo-Inf. 2012, 1, 32–45. [Google Scholar] [CrossRef] [Green Version]
  18. Gaillard, F.; Reynaud, T.; Thierry, V.; Kolodziejczyk, N.; Von Schuckmann, K. In Situ–Based Reanalysis of the Global Ocean Temperature and Salinity with ISAS: Variability of the Heat Content and Steric Height. J. Clim. 2016, 29, 1305–1323. [Google Scholar] [CrossRef]
  19. Supply, A.; Boutin, J.; Reverdin, G.; Vergely, J.L.; Bellenger, H. Variability of Satellite Sea Surface Salinity Under Rainfall. In Satellite Precipitation Measurement; Levizzani, V., Kidd, C., Kirschbaum, D.B., Kummerow, C.D., Eds.; Springer International Publishing: Cham, Switzerland, 2020; Volume 2, pp. 1155–1176. [Google Scholar]
  20. ARGO. Argo Float Data and Metadata from Global Data Assembly Centre (Argo GDAC). SEANOE. Available online: https://doi.org/10.17882/42182 (accessed on 13 February 2022). [CrossRef]
  21. Guimbard, S.; Reul, N.; Sabia, R.; Herlédan, S.; Khoury Hanna, Z.E.; Piollé, J.-F.; Paul, F.; Lee, T.; Schanze, J.J.; Bingham, F.M.; et al. The Salinity Pilot-Mission Exploitation Platform (Pi-MEP): A Hub for Validation and Exploitation of Satellite Sea Surface Salinity Data. Remote Sens. 2021, 13, 4600. [Google Scholar] [CrossRef]
  22. Kolodziejczyk, N.; Hernandez, O.; Boutin, J.; Reverdin, G. SMOS salinity in the subtropical North Atlantic salinity maximum: 2. Two-dimensional horizontal thermohaline variability. J. Geophys. Res. Oceans 2015, 120, 972–987. [Google Scholar] [CrossRef] [Green Version]
  23. Lellouche, J.-M.; Greiner, E.; Le Galloudec, O.; Garric, G.; Regnier, C.; Drevillon, M.; Benkiran, M.; Testut, C.-E.; Bourdalle-Badie, R.; Gasparin, F.; et al. Recent updates to the Copernicus Marine Service global ocean monitoring and forecasting real-time 1∕12° high-resolution system. Ocean Sci. 2018, 14, 1093–1126. [Google Scholar] [CrossRef] [Green Version]
  24. Lellouche, J.M.; Greiner, E.; Bourdalle-Badie, R.; Garric, G.; Angelique, M.; Drevillon, M.; Bricaud, C.; Hamon, M.; Le Galloudec, O.; Regnier, C.; et al. The Copernicus Global 1/12° Oceanic and Sea Ice GLORYS12 Reanalysis. Front. Earth Sci. 2021, 9, 585. [Google Scholar]
  25. Bingham, F.; Brodnitz, S.; Yu, L. Sea Surface Salinity Seasonal Variability in the Tropics from Satellites, Gridded In Situ Products and Mooring Observations. Remote Sens. 2020, 13, 110. [Google Scholar] [CrossRef]
  26. Wong, A.P.S.; Wijffels, S.E.; Riser, S.C.; Pouliquen, S.; Hosoda, S.; Roemmich, D.; Gilson, J.; Johnson, G.C.; Martini, K.; Murphy, D.J.; et al. Argo Data 1999–2019: Two Million Temperature-Salinity Profiles and Subsurface Velocity Observations from a Global Array of Profiling Floats. Front. Mar. Sci. 2020, 7, 700. [Google Scholar] [CrossRef]
  27. Emery, W.J.; Thomson, R.E. (Eds.) Statistical Methods and Error Handling. In Data Analysis Methods in Physical Oceanography; Elsevier Science: Amsterdam, The Netherlands, 2001; pp. 193–304. [Google Scholar]
  28. Alory, G.; Delcroix, T.; Téchiné, P.; Diverrès, D.; Varillon, D.; Cravatte, S.; Gouriou, Y.; Grelet, J.; Jacquin, S.; Kestenare, E.; et al. The French contribution to the voluntary observing ships network of sea surface salinity. Deep Sea Res. Part I Oceanogr. Res. Pap. 2015, 105, 1–18. [Google Scholar] [CrossRef]
  29. Dai, A.; Qian, T.; Trenberth, K.E.; Milliman, J.D. Changes in Continental Freshwater Discharge from 1948 to 2004. J. Clim. 2009, 22, 2773–2792. [Google Scholar] [CrossRef]
  30. Martin, M.J.; Remy, E.; Tranchant, B.; King, R.R.; Greiner, E.; Donlon, C. Observation impact statement on satellite sea surface salinity data from two operational global ocean forecasting systems. J. Oper. Oceanogr. 2020, 1–17. [Google Scholar] [CrossRef]
  31. Chassignet, E.P.; Xu, X. Impact of Horizontal Resolution (1/12° to 1/50°) on Gulf Stream Separation, Penetrtion, and Variability. J. Phys. Oceanogr. 2017, 47, 1999–2021. [Google Scholar] [CrossRef]
  32. Supply, A.; Boutin, J.; Vergely, J.-L.; Martin, N.; Hasson, A.; Reverdin, G.; Mallet, C.; Viltard, N. Precipitation Estimates from SMOS Sea-Surface Salinity. Q. J. R. Meteorol. Soc. 2018, 144 (Suppl. S1), 103–119. [Google Scholar] [CrossRef] [Green Version]
  33. Houndegnonto, O.J.; Kolodziejczyk, N.; Maes, C.; Bourlès, B.; Da-Allada, C.Y.; Reul, N. Seasonal Variability of Freshwater Plumes in the Eastern Gulf of Guinea as Inferred from Satellite Measurements. J. Geophys. Res. Oceans 2021, 126. [Google Scholar] [CrossRef]
  34. PIMEP Matchups Database. Available online: https://pimep.ifremer.fr/diffusion/data/ (accessed on 13 February 2022).
  35. PIMEP Matchups Reports. Available online: https://www.salinity-pimep.org/reports/mdb.html (accessed on 13 February 2022).
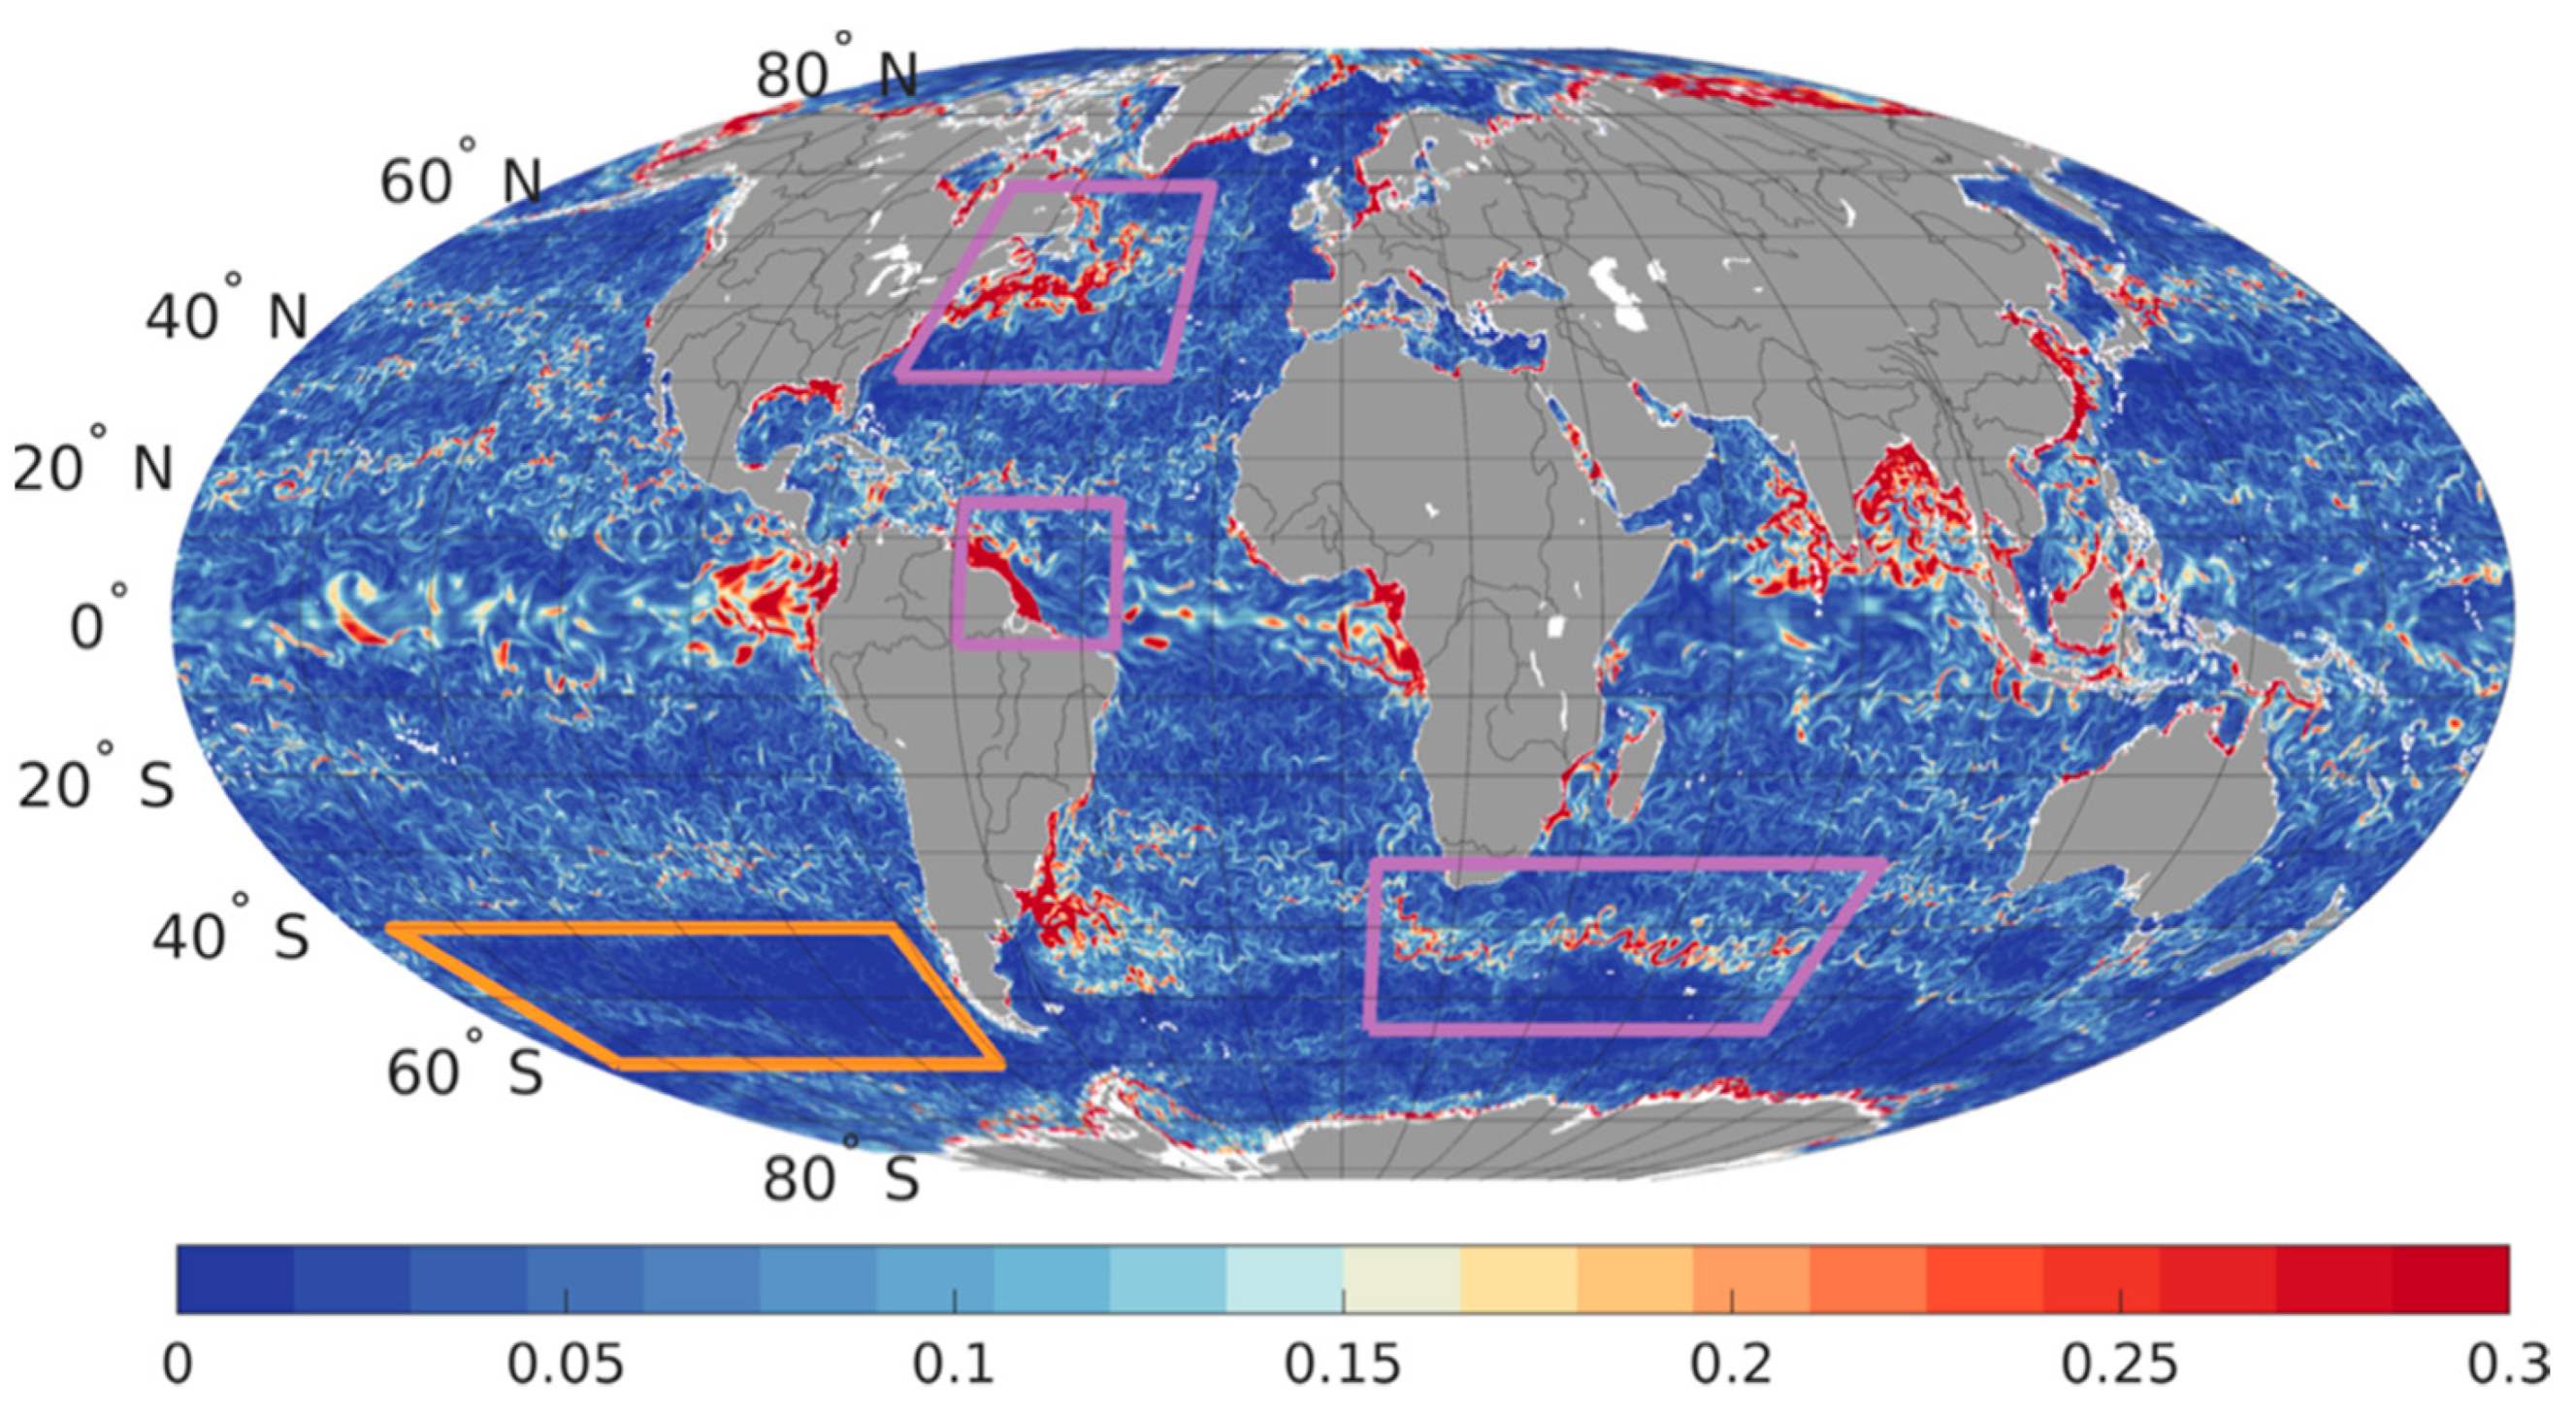
Figure 1. Examples of SSS measured in three regions, in February 2016. Top: ARGO floats, Middle: CCI, Bottom: GLORYS Reanalysis; Column 1: West African coast; Column 2: Gulf Stream; and Column 3: Amazon plume.
Remotesensing 14 01878 g001
Figure 2. Standard deviation of GLORYS data within one week and 50 × 50 km2 surface (Umis_glo) at 5 m depth for the 15 February 2017. Orange (purple) boxes correspond to the low (high) variability regions that are selected for our tests (see regions definition in Table 1).
Remotesensing 14 01878 g002
Figure 3. Terms of Equation (1) integrated for 2016–2018: (a) observed STD of the differences between weekly CCI and Argo salinity; (b) quadratic mean of Usat; (c) the difference of squared terms shown in (a,b), STD2 (CCI7-Argo)—mean (Usat2); and (d) quadratic mean of Umis. The statistics are reported in 1° boxes containing at least 3 Argo measurements (boxes in Figure 3a,b with less than 3 measurements are in white).
Remotesensing 14 01878 g003
Figure 4. Distribution of differences between Argo floats and CCI data normalized with Usat (orange), with Usat and Umis_glo (red) and with Usat and Umis (blue), and corresponding Gaussian fits, over the global ocean. The black line corresponds to a theoretical Gaussian distribution with a standard deviation of 1. Corresponding STD are reported in Table 2.
Remotesensing 14 01878 g004
Figure 5. Same as Figure 4 for regions defined on Table 1: (a) Pacific; (b) Aghulas Current; (c) Amazon; (d) Gulf Stream. Corresponding STD are reported in Table 2.
Remotesensing 14 01878 g005
Figure 6. Standard deviations of CCI-Argo differences normalized by the various sources of uncertainties, in 2° boxes. Only boxes with more than three Argo measurements are considered. (a,c,d) Maps of the STD of the differences normalized Equation (1) by (a) Usat; (c) Usat and Umis_glo; and (d) Usat and Umis. (b) Number of collocated points in each 2° box.
Remotesensing 14 01878 g006
Figure 7. Histograms (bar graph) of number of points multiplied by variance in the pixels shown in Figure 6: (a) (orange), (c) (red) and (d) (blue). Points above 300 are grouped in one single class. This histogram is expected to follow a Chi2 distribution (dashed line) if Equation (1) holds for each pixel of the maps.
Remotesensing 14 01878 g007
Figure 8. Comparison between GLORYS data standard deviation and in-situ variability. (a) Merchant ships averaged over 1° boxes; (b,c) histograms of Merchant ships STD (blue) and GLORYS STD (red) (b) globally, and (c) in very variable areas defined Table 1.
Remotesensing 14 01878 g008
Figure 9. Difference between STD of GLORYS at surface minus STD of GLORYS at 5 m, computed over 2016–2018 period.
Remotesensing 14 01878 g009
Table 1. Definition of regions shown on Figure 2.
RegionLatitude (°)Longitude (°)Very Variable Area
Gulf Stream30.5257.64−74.83−29.70X
Amazon plume−3.4314.37−59.27−34.89X
Agulhas return current−54.84−31.435.8491.43X
South Pacific Ocean−60.27−40.10−172.35−81.57
Table 2. STD of the distributions of the normalized differences between Argo and CCI v3.2 weekly products, in the regions defined in Table 1.
RegionUsatUsat + Umis_gloUsat + Umis
Global1.1581.0290.988
Gulf Stream1.4240.904 1.138
Amazon plume1.0501.202 0.859
Agulhas return current1.1631.0591.022
South Pacific Ocean1.0170.978 0.964
Publisher’s Note: MDPI stays neutral with regard to jurisdictional claims in published maps and institutional affiliations.

