Next Issue
Volume 14, May-1
Previous Issue
Volume 14, April-1
 
 
remotesensing-logo

Journal Browser

Journal Browser

Remote Sens., Volume 14, Issue 8 (April-2 2022) – 186 articles

Cover Story (view full-size image): 
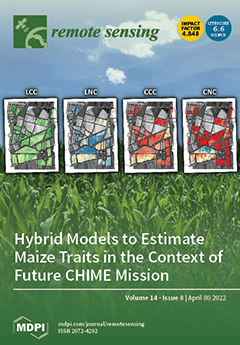
The spaceborne hyperspectral missions foreseen to be launched in the next few years will provide an unprecedented amount of spectroscopic data, enabling new research possibilities within several fields of natural resources, including the “Agriculture and Food Security” domain. In order to efficiently exploit this data stream to extract useful information for sustainable agriculture applications, new processing methods and techniques need to be studied and implemented. This work evaluated the potential of the hybrid approach (radiative transfer model plus machine learning) to assess maize traits (chlorophyll and nitrogen content at leaf and canopy level) within the framework of the future CHIME mission. The promising results obtained in this study support the feasibility of crop traits’ retrieval from spaceborne imaging spectroscopy. View this paper.
  • Issues are regarded as officially published after their release is announced to the table of contents alert mailing list.
  • You may sign up for e-mail alerts to receive table of contents of newly released issues.
  • PDF is the official format for papers published in both, html and pdf forms. To view the papers in pdf format, click on the "PDF Full-text" link, and use the free Adobe Reader to open them.
Order results
Result details
Section
Select all
Export citation of selected articles as:
29 pages, 5415 KiB  
Article
Predicting Landslides Susceptible Zones in the Lesser Himalayas by Ensemble of Per Pixel and Object-Based Models
by Ujjwal Sur, Prafull Singh, Sansar Raj Meena and Trilok Nath Singh
Remote Sens. 2022, 14(8), 1953; https://doi.org/10.3390/rs14081953 - 18 Apr 2022
Cited by 8 | Viewed by 2670
Abstract
Landslide susceptibility is a contemporary method for delineation of landslide hazard zones and holistically mitigating the future landslides risks for planning and decision-making. The significance of this study is that it would be the first instance when the ‘geon’ model will be attempted [...] Read more.
Landslide susceptibility is a contemporary method for delineation of landslide hazard zones and holistically mitigating the future landslides risks for planning and decision-making. The significance of this study is that it would be the first instance when the ‘geon’ model will be attempted to delineate landslide susceptibility map (LSM) for the complex lesser Himalayan topography as a contemporary LSM technique. This study adopted the per-pixel-based ensemble approaches through modified frequency ratio (MFR) and fuzzy analytical hierarchy process (FAHP) and compared it with the ‘geons’ (object-based) aggregation method to produce an LSM for the lesser Himalayan Kalsi-Chakrata road corridor. For the landslide susceptibility models, 14 landslide conditioning factors were carefully chosen; namely, slope, slope aspect, elevation, lithology, rainfall, seismicity, normalized differential vegetation index, stream power index, land use/land cover, soil, topographical wetness index, and proximity to drainage, road, and fault. The inventory data for the past landslides were derived from preceding satellite images, intensive field surveys, and validation surveys. These inventory data were divided into training and test datasets following the commonly accepted 70:30 ratio. The GIS-based statistical techniques were adopted to establish the correlation between landslide training sites and conditioning factors. To determine the accuracy of the model output, the LSMs accuracy was validated through statistical methods of receiver operating characteristics (ROC) and relative landslide density index (R-index). The accuracy results indicate that the object-based geon methods produced higher accuracy (geon FAHP: 0.934; geon MFR: 0.910) over the per-pixel approaches (FAHP: 0.887; MFR: 0.841). The results noticeably showed that the geon method constructs significant regional units for future mitigation strategies and development. The present study may significantly benefit the decision-makers and regional planners in selecting the appropriate risk mitigation procedures at a local scale to counter the potential damages and losses from landslides in the area. Full article
Show Figures

Graphical abstract

19 pages, 15180 KiB  
Article
Discussion on InSAR Identification Effectivity of Potential Landslides and Factors That Influence the Effectivity
by Jingtao Liang, Jihong Dong, Su Zhang, Cong Zhao, Bin Liu, Lei Yang, Shengwu Yan and Xiaobo Ma
Remote Sens. 2022, 14(8), 1952; https://doi.org/10.3390/rs14081952 - 18 Apr 2022
Cited by 11 | Viewed by 2047
Abstract
The southwest mountainous area of China is one of the areas with the most landslides in the world. In this paper, we used Ya’an City and Garzê Tibetan Autonomous Prefecture in Sichuan Province as the research areas to explore the identification application effects [...] Read more.
The southwest mountainous area of China is one of the areas with the most landslides in the world. In this paper, we used Ya’an City and Garzê Tibetan Autonomous Prefecture in Sichuan Province as the research areas to explore the identification application effects of large-area potential landslides using synthetic aperture radar (SAR) data with different wavelength types (Sentinel-1, ALOS-2), different processing methods (SBAS-InSAR, Stacking-InSAR), and different geological environmental conditions. The results show the following: (1) The effect of identifying landslides with different slope directions is largely affected by the satellite orbit direction; when we identify landslide hazards across a large area, the joint monitoring mode of ascending and descending orbit data is required. (2) The period of monitoring affects the identification effect of potential landslides when landslide identification is carried out in southwestern China; the InSAR monitoring period is recommended to be more than 2 years. (3) In different geological environmental regions, SBAS technology and Stacking technology have their own advantages; Stacking technology identifies more potential landslides, and SBAS technology identifies potential landslides with higher accuracy; (4) the degree of vegetation coverage has a great impact on the landslide identification effect of different SAR data sources. In low-density vegetation coverage areas, the landslide identification result using Sentinel-1 data seems to be better than the result using ALOS-2 data. In high-density vegetation coverage areas, the landslide identification result using ALOS-2 data is better than that using Sentinel-1 data. Full article
Show Figures

Graphical abstract

26 pages, 10862 KiB  
Article
Hyperspectral Image Classification Based on Spectral Multiscale Convolutional Neural Network
by Cuiping Shi, Jingwei Sun and Liguo Wang
Remote Sens. 2022, 14(8), 1951; https://doi.org/10.3390/rs14081951 - 18 Apr 2022
Cited by 5 | Viewed by 3230
Abstract
In recent years, convolutional neural networks (CNNs) have been widely used for hyperspectral image classification, which show good performance. Compared with using sufficient training samples for classification, the classification accuracy of hyperspectral images is easily affected by a small number of samples. Moreover, [...] Read more.
In recent years, convolutional neural networks (CNNs) have been widely used for hyperspectral image classification, which show good performance. Compared with using sufficient training samples for classification, the classification accuracy of hyperspectral images is easily affected by a small number of samples. Moreover, although CNNs can effectively classify hyperspectral images, due to the rich spatial and spectral information of hyperspectral images, the efficiency of feature extraction still needs to be further improved. In order to solve these problems, a spatial–spectral attention fusion network using four branch multiscale block (FBMB) to extract spectral features and 3D-Softpool to extract spatial features is proposed. The network consists of three main parts. These three parts are connected in turn to fully extract the features of hyperspectral images. In the first part, four different branches are used to fully extract spectral features. The convolution kernel size of each branch is different. Spectral attention block is adopted behind each branch. In the second part, the spectral features are reused through dense connection blocks, and then the spectral attention module is utilized to refine the extracted spectral features. In the third part, it mainly extracts spatial features. The DenseNet module and spatial attention block jointly extract spatial features. The spatial features are fused with the previously extracted spectral features. Experiments are carried out on four commonly used hyperspectral data sets. The experimental results show that the proposed method has better classification performance than some existing classification methods when using a small number of training samples. Full article
(This article belongs to the Special Issue Recent Advances in Processing Mixed Pixels for Hyperspectral Image)
Show Figures

Graphical abstract

21 pages, 10401 KiB  
Article
An Adaptive Focal Loss Function Based on Transfer Learning for Few-Shot Radar Signal Intra-Pulse Modulation Classification
by Zehuan Jing, Peng Li, Bin Wu, Shibo Yuan and Yingchao Chen
Remote Sens. 2022, 14(8), 1950; https://doi.org/10.3390/rs14081950 - 18 Apr 2022
Cited by 9 | Viewed by 2271
Abstract
To solve the difficulty associated with radar signal classification in the case of few-shot signals, we propose an adaptive focus loss algorithm based on transfer learning. Firstly, we trained a one-dimensional convolutional neural network (CNN) with radar signals of three intra-pulse modulation types [...] Read more.
To solve the difficulty associated with radar signal classification in the case of few-shot signals, we propose an adaptive focus loss algorithm based on transfer learning. Firstly, we trained a one-dimensional convolutional neural network (CNN) with radar signals of three intra-pulse modulation types in the source domain, which were effortlessly obtained and had sufficient samples. Then, we transferred the knowledge obtained by the convolutional layer to nine types of few-shot complex intra-pulse modulation classification tasks in the target domain. We propose an adaptive focal loss function based on the focal loss function, which can estimate the parameters based on the ratio of hard samples to easy samples in the data set. Compared with other existing algorithms, our proposed algorithm makes good use of transfer learning to transfer the acquired prior knowledge to new domains, allowing the CNN model to converge quickly and achieve good recognition performance in case of insufficient samples. The improvement based on the focal loss function allows the model to focus on the hard samples while estimating the focusing parameter adaptively instead of tediously repeating experiments. The experimental results show that the proposed algorithm had the best recognition rate at different sample sizes with an average recognition rate improvement of 4.8%, and the average recognition rate was better than 90% for different signal-to-noise ratios (SNRs). In addition, upon comparing the training processes of different models, the proposed method could converge with the least number of generations and the shortest time under the same experimental conditions. Full article
Show Figures

Figure 1

19 pages, 19673 KiB  
Article
A Pre-Operational System Based on the Assimilation of MODIS Aerosol Optical Depth in the MOCAGE Chemical Transport Model
by Laaziz El Amraoui, Matthieu Plu, Vincent Guidard, Flavien Cornut and Mickaël Bacles
Remote Sens. 2022, 14(8), 1949; https://doi.org/10.3390/rs14081949 - 18 Apr 2022
Cited by 3 | Viewed by 2011
Abstract
In this study we present a pre-operational forecasting assimilation system of different types of aerosols. This system has been developed within the chemistry-transport model of Météo-France, MOCAGE, and uses the assimilation of the Aerosol Optical Depth (AOD) from MODIS (Moderate Resolution Imaging Spectroradiometer) [...] Read more.
In this study we present a pre-operational forecasting assimilation system of different types of aerosols. This system has been developed within the chemistry-transport model of Météo-France, MOCAGE, and uses the assimilation of the Aerosol Optical Depth (AOD) from MODIS (Moderate Resolution Imaging Spectroradiometer) onboard both Terra and Aqua. It is based on the AOD assimilation system within the MOCAGE model. It operates on a daily basis with a global configuration of 1×1 (longitude × latitude). The motivation of such a development is the capability to predict and anticipate extreme events and their impacts on the air quality and the aviation safety in the case of a huge volcanic eruption. The validation of the pre-operational system outputs has been done in terms of AOD compared against the global AERONET observations within two complete years (January 2018–December 2019). The comparison between both datasets shows that the correlation between the MODIS assimilated outputs and AERONET over the whole period of study is 0.77, whereas the biases and the RMSE (Root Mean Square Error) are 0.006 and 0.135, respectively. The ability of the pre-operational system to predict extreme events in near real time such as the desert dust transport and the propagation of the biomass burning was tested and evaluated. We particularly presented and documented the desert dust outbreak which occurred over Greece in late March 2018 as well as the wildfire event which happened on Australia between July 2019 and February 2020. We only presented these two events, but globally the assimilation chain has shown that it is capable of predicting desert dust events and biomass burning aerosols which happen all over the globe. Full article
Show Figures

Graphical abstract

19 pages, 4002 KiB  
Article
Tropical Species Classification with Structural Traits Using Handheld Laser Scanning Data
by Meilian Wang, Man Sing Wong and Sawaid Abbas
Remote Sens. 2022, 14(8), 1948; https://doi.org/10.3390/rs14081948 - 18 Apr 2022
Cited by 5 | Viewed by 2096
Abstract
Information about tree species plays a pivotal role in sustainable forest management. Light detection and ranging (LiDAR) technology has demonstrated its potential to obtain species information using the structural features of trees. Several studies have explored the structural properties of boreal or temperate [...] Read more.
Information about tree species plays a pivotal role in sustainable forest management. Light detection and ranging (LiDAR) technology has demonstrated its potential to obtain species information using the structural features of trees. Several studies have explored the structural properties of boreal or temperate trees from terrestrial laser scanning (TLS) data and applied them to species classification, but the study of structural properties of tropical trees for species classification is rare. Compared to conventional static TLS, handheld laser scanning (HLS) is able to effectively capture point clouds of an individual tree with flexible movability. Therefore, in this study, we characterized the structural features of tropical species from HLS data as 23 LiDAR structural parameters, involving 6 branch, 11 crown and 6 entire tree parameters, and used these parameters to classify the species via 5 machine-learning (ML) models, respectively. The performance of each parameter was further evaluated and compared. Classification results showed that the employed parameters can achieve a classification accuracy of 84.09% using the support vector machine with a polynomial kernel. The evaluation of parameters indicated that it is insufficient to classify four species with only one and two parameters, but ten parameters were recommended in order to achieve satisfactory accuracy. The combination of different types of parameters, such as branch and crown parameters, can significantly improve classification accuracy. Finally, five sets of optimal parameters were suggested according to their importance and performance. This study also showed that the time- and cost-efficient HLS instrument could be a promising tool for tree-structure-related studies, such as structural parameter estimation, species classification, forest inventory, as well as sustainable tree management. Full article
Show Figures

Graphical abstract

22 pages, 32990 KiB  
Article
Global Mapping of Soil Water Characteristics Parameters— Fusing Curated Data with Machine Learning and Environmental Covariates
by Surya Gupta, Andreas Papritz, Peter Lehmann, Tomislav Hengl, Sara Bonetti and Dani Or
Remote Sens. 2022, 14(8), 1947; https://doi.org/10.3390/rs14081947 - 18 Apr 2022
Cited by 9 | Viewed by 3166
Abstract
Hydrological and climatic modeling of near-surface water and energy fluxes is critically dependent on the availability of soil hydraulic parameters. Key among these parameters is the soil water characteristic curve (SWCC), a function relating soil water content (θ) to matric potential [...] Read more.
Hydrological and climatic modeling of near-surface water and energy fluxes is critically dependent on the availability of soil hydraulic parameters. Key among these parameters is the soil water characteristic curve (SWCC), a function relating soil water content (θ) to matric potential (ψ). The direct measurement of SWCC is laborious, hence, reported values of SWCC are spatially sparse and usually have only a small number of data pairs (θ, ψ) per sample. Pedotransfer function (PTF) models have been used to correlate SWCC with basic soil properties, but evidence suggests that SWCC is also shaped by vegetation-promoted soil structure and climate-modified clay minerals. To capture these effects in their spatial context, a machine learning framework (denoted as Covariate-based GeoTransfer Functions, CoGTFs) was trained using (a) a novel and comprehensive global dataset of SWCC parameters and (b) global maps of environmental covariates and soil properties at 1 km spatial resolution. Two CoGTF models were developed: one model (CoGTF-1) was based on predicted soil covariates because measured soil data are not generally available, and the other (CoGTF-2) used measured soil properties to model SWCC parameters. The spatial cross-validation of CoGTF-1 resulted, for the predicted van Genuchten SWCC parameters, in concordance correlation coefficients (CCC) of 0.321–0.565. To validate the resulting global maps of SWCC parameters and to compare the CoGTF framework to two pedotransfer functions from the literature, the predicted water contents at 0.1 m, 3.3 m, and 150 m matric potential were evaluated. The accuracy metrics for CoGTF were considerably better than PTF-based maps. Full article
(This article belongs to the Special Issue Global Gridded Soil Information Based on Machine Learning)
Show Figures

Figure 1

17 pages, 11313 KiB  
Article
Large-Scale Detection of the Tableland Areas and Erosion-Vulnerable Hotspots on the Chinese Loess Plateau
by Kai Liu, Jiaming Na, Chenyu Fan, Ying Huang, Hu Ding, Zhe Wang, Guoan Tang and Chunqiao Song
Remote Sens. 2022, 14(8), 1946; https://doi.org/10.3390/rs14081946 - 18 Apr 2022
Cited by 8 | Viewed by 2167
Abstract
Tableland areas, featured by flat and broad landforms, provide precious land resources for agricultural production and human settlements over the Chinese Loess Plateau (CLP). However, severe gully erosion triggered by extreme rainfall and intense human activities makes tableland areas shrink continuously. Preventing the [...] Read more.
Tableland areas, featured by flat and broad landforms, provide precious land resources for agricultural production and human settlements over the Chinese Loess Plateau (CLP). However, severe gully erosion triggered by extreme rainfall and intense human activities makes tableland areas shrink continuously. Preventing the loss of tableland areas is of real urgency, in which generating its accurate distribution map is the critical prerequisite. However, a plateau-scale inventory of tableland areas is still lacking across the Loess Plateau. This study proposed a large-scale approach for tableland area mapping. The Sentinel-2 imagery was used for the initial delineation based on object-based image analysis and random forest model. Subsequently, the drainage networks extracted from AW3D30 DEM were applied for correcting commission and omission errors based on the law that rivers and streams rarely appear on the tableland areas. The automatic mapping approach performs well, with the overall accuracies over 90% in all four investigated subregions. After the strict quality control by manual inspection, a high-quality inventory of tableland areas at 10 m resolution was generated, demonstrating that the tableland areas occupied 9507.31 km2 across the CLP. Cultivated land is the dominant land-use type on the tableland areas, yet multi-temporal observations indicated that it has decreased by approximately 500 km2 during the year of 2000 to 2020. In contrast, forest and artificial surfaces increased by 57.53% and 73.10%, respectively. Additionally, we detected 455 vulnerable hotspots of the tableland with a width of less than 300 m. Particular attention should be paid to these areas to prevent the potential split of a large tableland, accompanied by damage on roads and buildings. This plateau-scale tableland inventory and erosion-vulnerable hotspots are expected to support the environmental protection policymaking for sustainable development in the CLP region severely threatened by soil erosion and land degradation. Full article
Show Figures

Figure 1

15 pages, 7300 KiB  
Technical Note
Characteristics of Precipitation and Floods during Typhoons in Guangdong Province
by Yan Yan, Guihua Wang, Huan Wu, Guojun Gu and Nergui Nanding
Remote Sens. 2022, 14(8), 1945; https://doi.org/10.3390/rs14081945 - 18 Apr 2022
Cited by 3 | Viewed by 1900
Abstract
The spatial and temporal characteristics of precipitation and floods during typhoons in Guangdong province were examined by using TRMM TMPA 3B42 precipitation data and the Dominant River Routing Integrated with VIC Environment (DRIVE) model outputs for the period 1998–2019. The evaluations based on [...] Read more.
The spatial and temporal characteristics of precipitation and floods during typhoons in Guangdong province were examined by using TRMM TMPA 3B42 precipitation data and the Dominant River Routing Integrated with VIC Environment (DRIVE) model outputs for the period 1998–2019. The evaluations based on gauge-measured and model-simulated streamflow show the reliability of the DRIVE model. The typhoon tracks are divided into five categories for those that landed on or influenced Guangdong province. Generally, the spatial distribution of precipitation and floods differ for different typhoon tracks. Precipitation has a similar spatial distribution to flood duration (FD) but is substantially different from flood intensity (FI). The average precipitation over Guangdong province usually reaches its peak at the landing time of typhoons, while the average FD and FI reach their peaks several hours later than precipitation peak. The lagged correlations between precipitation and FD/FI are hence always higher than their simultaneous correlations. Full article
(This article belongs to the Topic Advanced Research in Precipitation Measurements)
Show Figures

Figure 1

18 pages, 9268 KiB  
Article
Feedback Refined Local-Global Network for Super-Resolution of Hyperspectral Imagery
by Zhenjie Tang, Qing Xu, Pengfei Wu, Zhenwei Shi and Bin Pan
Remote Sens. 2022, 14(8), 1944; https://doi.org/10.3390/rs14081944 - 18 Apr 2022
Cited by 5 | Viewed by 1772
Abstract
Powered by advanced deep-learning technology, multi-spectral image super-resolution methods based on convolutional neural networks have recently achieved great progress. However, the single hyperspectral image super-resolution remains a challenging problem due to the high-dimensional and complex spectral characteristics of hyperspectral data, which make it [...] Read more.
Powered by advanced deep-learning technology, multi-spectral image super-resolution methods based on convolutional neural networks have recently achieved great progress. However, the single hyperspectral image super-resolution remains a challenging problem due to the high-dimensional and complex spectral characteristics of hyperspectral data, which make it difficult for general 2D convolutional neural networks to simultaneously capture spatial and spectral prior information. To deal with this issue, we propose a novel Feedback Refined Local-Global Network (FRLGN) for the super-resolution of hyperspectral image. To be specific, we develop a new Feedback Structure and a Local-Global Spectral block to alleviate the difficulty in spatial and spectral feature extraction. The Feedback Structure can transfer the high-level information to guide the generation process of low-level features, which is achieved by a recurrent structure with finite unfoldings. Furthermore, in order to effectively use the high-level information passed back, a Local-Global Spectral block is constructed to handle the feedback connections. The Local-Global Spectral block utilizes the feedback high-level information to correct the low-level feature from local spectral bands and generates powerful high-level representations among global spectral bands. By incorporating the Feedback Structure and Local-Global Spectral block, the FRLGN can fully exploit spatial-spectral correlations among spectral bands and gradually reconstruct high-resolution hyperspectral images. Experimental results indicate that FRLGN presents advantages on three public hyperspectral datasets. Full article
Show Figures

Figure 1

2 pages, 167 KiB  
Editorial
Editorial for the Special Issue: “3D Virtual Reconstruction for Cultural Heritage”
by Sara Gonizzi Barsanti
Remote Sens. 2022, 14(8), 1943; https://doi.org/10.3390/rs14081943 - 18 Apr 2022
Cited by 1 | Viewed by 1377
Abstract
The use of 3D modelling, computer-aided design (CAD), augmented reality (AR) and virtual reality (VR) for the acquisition and virtual reconstruction of Cultural Heritage is of great importance in the analysis, study, documentation and dissemination of the past [...] Full article
(This article belongs to the Special Issue 3D Virtual Reconstruction for Cultural Heritage)
24 pages, 4907 KiB  
Article
GA-Net-Pyramid: An Efficient End-to-End Network for Dense Matching
by Yuanxin Xia, Pablo d’Angelo, Friedrich Fraundorfer, Jiaojiao Tian, Mario Fuentes Reyes and Peter Reinartz
Remote Sens. 2022, 14(8), 1942; https://doi.org/10.3390/rs14081942 - 17 Apr 2022
Cited by 1 | Viewed by 2292
Abstract
Dense matching plays a crucial role in computer vision and remote sensing, to rapidly provide stereo products using inexpensive hardware. Along with the development of deep learning, the Guided Aggregation Network (GA-Net) achieves state-of-the-art performance via the proposed Semi-Global Guided Aggregation layers and [...] Read more.
Dense matching plays a crucial role in computer vision and remote sensing, to rapidly provide stereo products using inexpensive hardware. Along with the development of deep learning, the Guided Aggregation Network (GA-Net) achieves state-of-the-art performance via the proposed Semi-Global Guided Aggregation layers and reduces the use of costly 3D convolutional layers. To solve the problem of GA-Net requiring large GPU memory consumption, we design a pyramid architecture to modify the model. Starting from a downsampled stereo input, the disparity is estimated and continuously refined through the pyramid levels. Thus, the disparity search is only applied for a small size of stereo pair and then confined within a short residual range for minor correction, leading to highly reduced memory usage and runtime. Tests on close-range, aerial, and satellite data demonstrate that the proposed algorithm achieves significantly higher efficiency (around eight times faster consuming only 20–40% GPU memory) and comparable results with GA-Net on remote sensing data. Thanks to this coarse-to-fine estimation, we successfully process remote sensing datasets with very large disparity ranges, which could not be processed with GA-Net due to GPU memory limitations. Full article
(This article belongs to the Special Issue Remote Sensing Based Building Extraction II)
Show Figures

Figure 1

21 pages, 2191 KiB  
Article
Global Identification of Unelectrified Built-Up Areas by Remote Sensing
by Xumiao Gao, Mingquan Wu, Zheng Niu and Fang Chen
Remote Sens. 2022, 14(8), 1941; https://doi.org/10.3390/rs14081941 - 17 Apr 2022
Cited by 4 | Viewed by 2339
Abstract
Access to electricity (the proportion of the population with access to electricity) is a key indica for of the United Nations’ Sustainable Development Goal 7 (SDG7), which aims to provide affordable, reliable, sustainable, and modern energy services for all. Accurate and timely global [...] Read more.
Access to electricity (the proportion of the population with access to electricity) is a key indica for of the United Nations’ Sustainable Development Goal 7 (SDG7), which aims to provide affordable, reliable, sustainable, and modern energy services for all. Accurate and timely global data on access to electricity in all countries is important for the achievement of SDG7. Current survey-based access to electricity datasets suffers from short time spans, slow updates, high acquisition costs, and a lack of location data. Accordingly, a new method for identifying the electrification status of built-up areas based on the remote sensing of nighttime light is proposed in this study. More specifically, the method overlays global built-up area data with night-time light remote sensing data to determine whether built-up areas are electrified based on a threshold night-time light value. By using our approach, electrified and unelectrified built-up areas were extracted at 500 m resolution on a global scale for the years 2014 and 2020. The acquired results show a significant reduction in an unelectrified built-up area between 2014 and 2020, from 51,301.14 km2 to 22,192.52 km2, or from 3.05% to 1.32% of the total built-up area. Compared to 2014, 117 countries or territories had improved access to electricity, and 18 increased their proportion of unelectrified built-up area by >0.1%. The identification accuracy was evaluated by using a random sample of 10,106 points. The accuracies in 2014 and 2020 were 97.29% and 98.9%, respectively, with an average of 98.1%. The outcomes of this method are in high agreement with the spatial distribution of access to electricity data reported by the World Bank. This study is the first to investigate the global electrification of built-up areas by using remote sensing. It makes an important supplement to global data on access to electricity, which can aid in the achievement of SDG7. Full article
(This article belongs to the Special Issue Remote Sensing for Engineering and Sustainable Development Goals)
Show Figures

Graphical abstract

17 pages, 2870 KiB  
Article
BDS/GPS/UWB Adaptively Robust EKF Tightly Coupled Navigation Model Considering Pedestrian Motion Characteristics
by Jian Zhang, Jian Wang, Ximin Cui and Debao Yuan
Remote Sens. 2022, 14(8), 1940; https://doi.org/10.3390/rs14081940 - 17 Apr 2022
Cited by 1 | Viewed by 1672
Abstract
In the indoor and outdoor transition area, due to its poor availability in a complex positioning environment, the BDS/GPS SPP (single-point positioning by combining BeiDou Navigation Satellite System (BDS) and Global Positioning System (GPS)) is unable to provide an effective positioning service. In [...] Read more.
In the indoor and outdoor transition area, due to its poor availability in a complex positioning environment, the BDS/GPS SPP (single-point positioning by combining BeiDou Navigation Satellite System (BDS) and Global Positioning System (GPS)) is unable to provide an effective positioning service. In view of the poor positioning accuracy and low sampling rate of the BDS/GPS SPP and the gross error, such as the non-line-of-sight error of UWB (Ultra-Wide-Band), making the accuracy of positioning results poor, a BDS/GPS/UWB tightly coupled navigation model considering pedestrian motion characteristics is proposed to make positioning results more reliable and accurate in the transition area. The core content of this paper is divided into the following three parts: (1) Firstly, the dynamic model and positioning theories of BDS/GPS SPP and UWB are introduced, respectively. (2) Secondly, the BDS/GPS/UWB tightly coupled navigation model is proposed. An environment discrimination factor is introduced to adaptively adjust the variance factor of the system state. At the same time, the gross error detection factor is constructed by using the a posteriori residuals to make the variance factor of the measurement information of the combined positioning system able to be adjusted intelligently for the purpose of eliminating the interference of gross error observations on positioning results. On the other hand, pedestrian motion characteristics are introduced to establish the constraint equation to improve the consistency of positioning accuracy. (3) Thirdly, the actual measured data are used to demonstrate and analyze the reliability of the positioning model proposed by this paper. The experimental results show that the BDS/GPS/UWB tightly coupled navigation model can effectively improve the accuracy and availability of positioning. Compared with BDS/GPS SPP, the accuracy of this model is improved by 57.8%, 76.0% and 56.5% in the E, N and U directions, respectively. Full article
Show Figures

Figure 1

18 pages, 4263 KiB  
Article
Simulative Evaluation of the Underwater Geodetic Network Configuration on Kinematic Positioning Performance
by Menghao Li, Yang Liu, Yanxiong Liu, Guanxu Chen, Qiuhua Tang, Yunfeng Han and Yuanlan Wen
Remote Sens. 2022, 14(8), 1939; https://doi.org/10.3390/rs14081939 - 17 Apr 2022
Cited by 8 | Viewed by 3726
Abstract
The construction of underwater geodetic networks (UGN) is crucial in marine geodesy. To provide high-precision kinematic positioning for underwater submersibles, an underwater acoustic geodetic network configuration of three seafloor base stations, one subsurface buoy, and one sea surface buoy is proposed. The simulation [...] Read more.
The construction of underwater geodetic networks (UGN) is crucial in marine geodesy. To provide high-precision kinematic positioning for underwater submersibles, an underwater acoustic geodetic network configuration of three seafloor base stations, one subsurface buoy, and one sea surface buoy is proposed. The simulation results show that, for a 3 km-deep sea, based on the proposed UGN, the submersible positioning range and positioning accuracy are primarily affected by the size of the seafloor base station array, while the height of the subsurface buoy has a greater impact on the submersible positioning accuracy than the positioning range. Considering current acoustic ranging technology, the kinematic positioning performance of the UGN is optimal when the seafloor base stations are 9~13 km apart and the subsurface buoy is less than 2.5 km above the seafloor, which can achieve a submersible positioning accuracy of less than 30 m within an underwater space of 25 km × 25 km × 3 km. The proposed cost-effective UGN configuration can provide high-precision submersible kinematic positioning performance for seafloor surveying and ocean precision engineering. The impact of the underwater environment on the acoustic transmission characteristics should be further investigated. Full article
(This article belongs to the Special Issue Remote Sensing Technology for New Ocean and Seafloor Monitoring)
Show Figures

Graphical abstract

14 pages, 5654 KiB  
Article
Estimating Tree Defects with Point Clouds Developed from Active and Passive Sensors
by Carli J. Morgan, Matthew Powers and Bogdan M. Strimbu
Remote Sens. 2022, 14(8), 1938; https://doi.org/10.3390/rs14081938 - 17 Apr 2022
Cited by 3 | Viewed by 2096
Abstract
Traditional inventories require large investments of resources and a trained workforce to measure tree sizes and characteristics that affect wood quality and value, such as the presence of defects and damages. Handheld light detection and ranging (LiDAR) and photogrammetric point clouds developed using [...] Read more.
Traditional inventories require large investments of resources and a trained workforce to measure tree sizes and characteristics that affect wood quality and value, such as the presence of defects and damages. Handheld light detection and ranging (LiDAR) and photogrammetric point clouds developed using Structure from Motion (SfM) algorithms achieved promising results in tree detection and dimensional measurements. However, few studies have utilized handheld LiDAR or SfM to assess tree defects or damages. We used a Samsung Galaxy S7 smartphone camera to photograph trees and create digital models using SfM, and a handheld GeoSLAM Zeb Horizon to create LiDAR point cloud models of some of the main tree species from the Pacific Northwest. We compared measurements of damage count and damage length obtained from handheld LiDAR, SfM photogrammetry, and traditional field methods using linear mixed-effects models. The field method recorded nearly twice as many damages per tree as the handheld LiDAR and SfM methods, but there was no evidence that damage length measurements varied between the three survey methods. Lower damage counts derived from LiDAR and SfM were likely driven by the limited point cloud reconstructions of the upper stems, as usable tree heights were achieved, on average, at 13.6 m for LiDAR and 9.3 m for SfM, even though mean field-measured tree heights was 31.2 m. Our results suggest that handheld LiDAR and SfM approaches show potential for detection and measurement of tree damages, at least on the lower stem. Full article
(This article belongs to the Special Issue The Future of Remote Sensing: Harnessing the Data Revolution)
Show Figures

Figure 1

22 pages, 2695 KiB  
Article
Fourfold Bounce Scattering-Based Reconstruction of Building Backs Using Airborne Array TomoSAR Point Clouds
by Xiaowan Li, Fubo Zhang, Xingdong Liang, Yanlei Li, Qichang Guo, Yangliang Wan, Xiangxi Bu and Yunlong Liu
Remote Sens. 2022, 14(8), 1937; https://doi.org/10.3390/rs14081937 - 17 Apr 2022
Cited by 5 | Viewed by 1647
Abstract
Building reconstruction using high-resolution tomographic synthetic aperture radar (TomoSAR) point clouds has been very attractive in numerous applications, such as urban planning and dynamic city modeling. However, for side-looking TomoSAR, it is a challenge to reconstruct the obscured backs of buildings using traditional [...] Read more.
Building reconstruction using high-resolution tomographic synthetic aperture radar (TomoSAR) point clouds has been very attractive in numerous applications, such as urban planning and dynamic city modeling. However, for side-looking TomoSAR, it is a challenge to reconstruct the obscured backs of buildings using traditional single-bounce scattering-based methods. It comes to our attention that the higher-order scattering points in airborne array TomoSAR point clouds may provide rich information on the backs of buildings. In this paper, the fourfold bounce (FB) scattering model of combined buildings in airborne array TomoSAR is derived, which not only explains the cause of FB scattering but also gives the distribution pattern of FB scattering points. Furthermore, a novel FB scattering-based method for the reconstruction of building backs is proposed. First, a two-step geometric constraint is used to detect the candidate FB scattering points. Subsequently, the FB scattering points are further detected by seed point selection and density estimation in the radar coordinate system. Finally, the backs of buildings can be reconstructed using the footprint inverted from the FB scattering points and the height information of the illuminated facades. To verify the FB scattering model and the effectiveness of the proposed method, the results from the simulated point clouds and the real airborne array TomoSAR point clouds are presented. Compared with the traditional roof point-based methods, the outstanding advantage of the proposed method is that it allows for the high-precision reconstruction of building backs, even in the case of poor roof points. Moreover, this paper may provide a novel perspective for the three-dimensional (3D) reconstruction of dense urban areas. Full article
(This article belongs to the Special Issue Recent Progress and Applications on Multi-Dimensional SAR)
Show Figures

Graphical abstract

20 pages, 1517 KiB  
Article
On Turbulent Features of E × B Plasma Motion in the Auroral Topside Ionosphere: Some Results from CSES-01 Satellite
by Giuseppe Consolini, Virgilio Quattrociocchi, Simone Benella, Paola De Michelis, Tommaso Alberti, Mirko Piersanti and Maria Federica Marcucci
Remote Sens. 2022, 14(8), 1936; https://doi.org/10.3390/rs14081936 - 17 Apr 2022
Cited by 3 | Viewed by 1483
Abstract
The recent Chinese Seismo-Electromagnetic Satellite (CSES-01) provides a good opportunity to investigate some features of plasma properties and its motion in the topside ionosphere. Using simultaneous measurements from the electric field detector and the magnetometers onboard CSES-01, we investigate some properties of the [...] Read more.
The recent Chinese Seismo-Electromagnetic Satellite (CSES-01) provides a good opportunity to investigate some features of plasma properties and its motion in the topside ionosphere. Using simultaneous measurements from the electric field detector and the magnetometers onboard CSES-01, we investigate some properties of the plasma E × B drift velocity for a case study during a crossing of the Southern auroral region in the topside ionosphere. In detail, we analyze the spectral and scaling features of the plasma drift velocity and provide evidence of the turbulent character of the E × B drift. Our results provide an evidence of the occurrence of 2D E × B intermittent convective turbulence for the plasma motion in the topside ionospheric F2 auroral region at scales from tens of meters to tens of kilometers. The intermittent character of the observed turbulence suggests that the macro-scale intermittent structure is isomorphic with a quasi-1D fractal structure, as happens, for example, in the case of a filamentary or thin-tube-like structure. Furthermore, in the analyzed range of scales we found that both magnetohydrodynamic and kinetic processes may affect the plasma dynamics at spatial scales below 2 km. The results are discussed and compared with previous results reported in the literature. Full article
(This article belongs to the Special Issue Ionosphere Monitoring with Remote Sensing)
Show Figures

Figure 1

21 pages, 8374 KiB  
Article
Evaluation and Comparison of MODIS C6 and C6.1 Deep Blue Aerosol Products in Arid and Semi-Arid Areas of Northwestern China
by Leiku Yang, Xinyao Tian, Chao Liu, Weiqian Ji, Yu Zheng, Huan Liu, Xiaofeng Lu and Huizheng Che
Remote Sens. 2022, 14(8), 1935; https://doi.org/10.3390/rs14081935 - 17 Apr 2022
Cited by 8 | Viewed by 1886
Abstract
The Moderate Resolution Imaging Spectroradiometer (MODIS) Deep Blue (DB) algorithm was developed for aerosol retrieval on bright surfaces. Although the global validation accuracy of the DB product is satisfactory, there are still some regions found to have very low accuracy. To this end, [...] Read more.
The Moderate Resolution Imaging Spectroradiometer (MODIS) Deep Blue (DB) algorithm was developed for aerosol retrieval on bright surfaces. Although the global validation accuracy of the DB product is satisfactory, there are still some regions found to have very low accuracy. To this end, DB has updated the surface database in the latest version of the Collection 6.1 (C6.1) algorithm. Some studies have shown that DB aerosol optical depth (AOD) of the old version Collection 6 (C6) has been seriously underestimated in Northwestern China. However, the status of the new version of the C6.1 product in this region is still unknown. This study aims to comprehensively evaluate the performance of the MODIS DB product in Northwestern China. The DB AOD with high quality (Quality Flag = 2 or 3) was selected to validate against the 23 sites from the China Aerosol Remote Sensing Network (CARSNET) and Aerosol Robotic Network (AERONET) during the period 2002–2014. By the overall analysis, the results indicate that both C6 and C6.1 show significant underestimation with a large fraction of more than 54% of collocations falling below the Expected Error (EE = ±(0.05 + 20% AODground)) envelope and with a large negative Mean Bias (MB) of less than −0.14. Furthermore, the new C6.1 products failed to achieve reasonable improvements in the region of Northwestern China. Besides, C6.1 has slightly fewer collocations than C6 due that some pixels with systematic biases have been removed from the new surface reflectance database. From the analysis of the site scale, the scatter plot of C6.1 is similar to that of C6 in most sites. Furthermore, a significant underestimation of DB AOD was observed at most sites, with the most severe underestimation at two sites located in the Taklimakan Desert region. Among 23 sites in Northwestern China, there are only two sites where C6.1 has largely improved the underestimation of C6. Furthermore, it is interesting to note that there are also two sites where the accuracy of the new C6.1 has declined. Moreover, it is surprising that there is one site where a large overestimation was observed in C6 and improved in C6.1. Additionally, we found a constant value of about 0.05 for both C6 and C6.1 at several sites with low aerosol loading, which is an obvious artifact. The significant improvements of C6.1 were observed in the Middle East and Central Asia but not in most sites of Northwestern China. The results of this study will be beneficial to further improvements in the MODIS DB algorithm. Full article
Show Figures

Graphical abstract

14 pages, 6332 KiB  
Communication
Seasonal and Interannual Variability of Tidal Mixing Signatures in Indonesian Seas from High-Resolution Sea Surface Temperature
by Raden Dwi Susanto and Richard D. Ray
Remote Sens. 2022, 14(8), 1934; https://doi.org/10.3390/rs14081934 - 16 Apr 2022
Cited by 10 | Viewed by 2233
Abstract
With their complex narrow passages and vigorous mixing, the Indonesian seas provide the only low-latitude pathway between the Pacific and Indian Oceans and thus play an essential role in regulating Pacific-Indian Ocean exchange, regional air-sea interaction, and ultimately, global climate phenomena. While previous [...] Read more.
With their complex narrow passages and vigorous mixing, the Indonesian seas provide the only low-latitude pathway between the Pacific and Indian Oceans and thus play an essential role in regulating Pacific-Indian Ocean exchange, regional air-sea interaction, and ultimately, global climate phenomena. While previous investigations using remote sensing and numerical simulations strongly suggest that this mixing is tidally driven, the impacts of monsoon and El Niño Southern Oscillation (ENSO) on tidal mixing in the Indonesian seas must play an important role. Here we use high-resolution sea surface temperature from June 2002 to June 2021 to reveal monsoon and ENSO modulations of mixing. The largest spring-neap (fortnightly) signals are found to be localized in the narrow passages/straits and sills, with more vigorous tidal mixing during the southeast (boreal summer) monsoon and El Niño than that during the northwest (boreal winter monsoon) and La Niña. Therefore, tidal mixing, which necessarily responds to seasonal and interannual changes in stratification, must also play a feedback role in regulating seasonal and interannual variability of water mass transformations and Indonesian throughflow. The findings have implications for longer-term variations and changes of Pacific–Indian ocean water mass transformation, circulation, and climate. Full article
Show Figures

Figure 1

15 pages, 2703 KiB  
Article
A Camera-Based Method for Collecting Rapid Vegetation Data to Support Remote-Sensing Studies of Shrubland Biodiversity
by Erin J. Questad, Marlee Antill, Nanfeng Liu, E. Natasha Stavros, Philip A. Townsend, Susan Bonfield and David Schimel
Remote Sens. 2022, 14(8), 1933; https://doi.org/10.3390/rs14081933 - 16 Apr 2022
Cited by 3 | Viewed by 2726
Abstract
The decline in biodiversity in Mediterranean-type ecosystems (MTEs) and other shrublands underscores the importance of understanding the trends in species loss through consistent vegetation mapping over broad spatial and temporal ranges, which is increasingly accomplished with optical remote sensing (imaging spectroscopy). Airborne missions [...] Read more.
The decline in biodiversity in Mediterranean-type ecosystems (MTEs) and other shrublands underscores the importance of understanding the trends in species loss through consistent vegetation mapping over broad spatial and temporal ranges, which is increasingly accomplished with optical remote sensing (imaging spectroscopy). Airborne missions planned by the National Aeronautics and Space Administration (NASA) and other groups (e.g., US National Ecological Observatory Network, NEON) are essential for improving high-quality maps of vegetation and plant species. These surveys require robust and efficient ground calibration/validation data; however, barriers to ground-data collection exist, such as steep terrain, which is a common feature of Mediterranean-type ecosystems. We developed and tested a method for rapidly collecting ground-truth data for shrubland plant communities across steep topographic gradients in southern California. Our method utilizes semi-aerial photos taken with a high-resolution digital camera mounted on a telescoping pole to capture groundcover, and a point-intercept image-classification program (Photogrid) that allows efficient sub-sampling of field images to derive vegetation percent-cover estimates while reducing human bias. Here, we assessed the quality of data collection using the image-based method compared to a traditional point-intercept ground survey and performed time trials to compare the efficiency of various survey efforts. The results showed no significant difference in estimates of percent cover and Simpson’s diversity derived from the point-intercept and those derived using the image-based method; however, there was lower correspondence in estimates of species richness and evenness. The image-based method was overall more efficient than the point-intercept surveys, reducing the total survey time by 13 to 46 min per plot depending on sampling effort. The difference in survey time between the two methods became increasingly greater when the vegetation height was above 1 m. Due to the high correspondence between estimates of species percent cover derived from the image-based compared to the point-intercept method, we recommend this type of survey for the verification of remote-sensing datasets featuring percent cover of individual species or closely related plant groups, for use in classifying UAS imagery, and especially for use in MTEs that have steep, rugged terrain and other situations such as tall, dense-growing shrubs where traditional field methods are dangerous or burdensome. Full article
Show Figures

Figure 1

17 pages, 3294 KiB  
Article
Polarization Aberrations in High-Numerical-Aperture Lens Systems and Their Effects on Vectorial-Information Sensing
by Yuanxing Shen, Binguo Chen, Chao He, Honghui He, Jun Guo, Jian Wu, Daniel S. Elson and Hui Ma
Remote Sens. 2022, 14(8), 1932; https://doi.org/10.3390/rs14081932 - 16 Apr 2022
Cited by 13 | Viewed by 3012
Abstract
The importance of polarization aberrations has been recognized and studied in numerous optical systems and related applications. It is known that polarization aberrations are particularly crucial in certain photogrammetry and microscopy techniques that are related to vectorial information—such as polarization imaging, stimulated emission [...] Read more.
The importance of polarization aberrations has been recognized and studied in numerous optical systems and related applications. It is known that polarization aberrations are particularly crucial in certain photogrammetry and microscopy techniques that are related to vectorial information—such as polarization imaging, stimulated emission depletion microscopy, and structured illumination microscopy. Hence, a reduction in polarization aberrations would be beneficial to different types of optical imaging/sensing techniques with enhanced vectorial information. In this work, we first analyzed the intrinsic polarization aberrations induced by a high-NA lens theoretically and experimentally. The aberrations of depolarization, diattenuation, and linear retardance were studied in detail using the Mueller matrix polar-decomposition method. Based on an analysis of the results, we proposed strategies to compensate the polarization aberrations induced by high-NA lenses for hardware-based solutions. The preliminary imaging results obtained using a Mueller matrix polarimeter equipped with multiple coated aspheric lenses for polarization-aberration reduction confirmed that the conclusions and strategies proposed in this study had the potential to provide more precise polarization information of the targets for applications spanning across classical optics, remote sensing, biomedical imaging, photogrammetry, and vectorial optical-information extraction. Full article
(This article belongs to the Special Issue Advanced Light Vector Field Remote Sensing)
Show Figures

Figure 1

20 pages, 7136 KiB  
Article
Automated Inventory of Broadleaf Tree Plantations with UAS Imagery
by Aishwarya Chandrasekaran, Guofan Shao, Songlin Fei, Zachary Miller and Joseph Hupy
Remote Sens. 2022, 14(8), 1931; https://doi.org/10.3390/rs14081931 - 16 Apr 2022
Cited by 2 | Viewed by 2346
Abstract
With the increased availability of unmanned aerial systems (UAS) imagery, digitalized forest inventory has gained prominence in recent years. This paper presents a methodology for automated measurement of tree height and crown area in two broadleaf tree plantations of different species and ages [...] Read more.
With the increased availability of unmanned aerial systems (UAS) imagery, digitalized forest inventory has gained prominence in recent years. This paper presents a methodology for automated measurement of tree height and crown area in two broadleaf tree plantations of different species and ages using two different UAS platforms. Using structure from motion (SfM), we generated canopy height models (CHMs) for each broadleaf plantation in Indiana, USA. From the CHMs, we calculated individual tree parameters automatically through an open-source web tool developed using the Shiny R package and assessed the accuracy against field measurements. Our analysis shows higher tree measurement accuracy with the datasets derived from multi-rotor platform (M600) than with the fixed wing platform (Bramor). The results show that our automated method could identify individual trees (F-score > 90%) and tree biometrics (root mean square error < 1.2 m for height and <1 m2 for the crown area) with reasonably good accuracy. Moreover, our automated tool can efficiently calculate tree-level biometric estimations for 4600 trees within 30 min based on a CHM from UAS-SfM derived images. This automated UAS imagery approach for tree-level forest measurements will be beneficial to landowners and forest managers by streamlining their broadleaf forest measurement and monitoring effort. Full article
(This article belongs to the Special Issue UAV Applications for Forest Management: Wood Volume, Biomass, Mapping)
Show Figures

Figure 1

18 pages, 12317 KiB  
Article
Approaches for Joint Retrieval of Wind Speed and Significant Wave Height and Further Improvement for Tiangong-2 Interferometric Imaging Radar Altimeter
by Guo Li, Yunhua Zhang and Xiao Dong
Remote Sens. 2022, 14(8), 1930; https://doi.org/10.3390/rs14081930 - 16 Apr 2022
Cited by 2 | Viewed by 1512
Abstract
The interferometric imaging radar altimeter (InIRA) adopts a short baseline along with small incidence angles to acquire interferometric signals from the sea surface with high accuracy, thus the wide-swath sea surface height (SSH) and backscattering coefficient (σ0) can be obtained [...] Read more.
The interferometric imaging radar altimeter (InIRA) adopts a short baseline along with small incidence angles to acquire interferometric signals from the sea surface with high accuracy, thus the wide-swath sea surface height (SSH) and backscattering coefficient (σ0) can be obtained simultaneously. This work presents an approach to jointly retrieve the wind speed and significant wave height (SWH) for the Chinese Tiangong-2 interferometric imaging radar altimeter (TG2-InIRA). This approach utilizes a multilayer perceptron (MLP) joint retrieval model based on σ0 and SSH data. By comparing with the European Center for Medium-Range Weather Forecasts (ECMWF) reanalysis data, the root mean square errors (RMSEs) of the retrieved wind speed and the SWH are 1.27 m/s and 0.36 m, respectively. Based on the retrieved SWH, two enhanced wind speed retrieval models are developed for high sea states and low sea states, respectively. The results show that the RMSE of the retrieved wind speed is 1.12 m/s when the SWHs < 4 m; the RMSE is 0.73 m/s when the SWHs ≥ 4 m. Similarly, two enhanced SWH retrieval models for relatively larger and relatively smaller wind speed regions are developed based on the retrieved wind speed with corresponding RMSEs of 0.19 m and 0.16 m, respectively. The comparison between the retrieved results and the buoy data shows that they are highly consistent. The results show that the additional information of SWH can be used to improve the accuracy of wind speed retrieval at small incidence angles, and also the additional information of wind speed can be used to improve the SWH retrieval. The stronger the correlation between wind speed and SWH, the greater the improvement of the retrieved results. The proposed method can achieve joint retrieval of wind speed and SWH accurately, which complements the existing wind speed and SWH retrieval methods for InIRA. Full article
(This article belongs to the Section Ocean Remote Sensing)
Show Figures

Figure 1

15 pages, 853 KiB  
Article
Spatial-Temporal Neural Network for Rice Field Classification from SAR Images
by Yang-Lang Chang, Tan-Hsu Tan, Tsung-Hau Chen, Joon Huang Chuah, Lena Chang, Meng-Che Wu, Narendra Babu Tatini, Shang-Chih Ma and Mohammad Alkhaleefah
Remote Sens. 2022, 14(8), 1929; https://doi.org/10.3390/rs14081929 - 16 Apr 2022
Cited by 9 | Viewed by 2987
Abstract
Agriculture is an important regional economic industry in Asian regions. Ensuring food security and stabilizing the food supply are a priority. In response to the frequent occurrence of natural disasters caused by global warming in recent years, the Agriculture and Food Agency (AFA) [...] Read more.
Agriculture is an important regional economic industry in Asian regions. Ensuring food security and stabilizing the food supply are a priority. In response to the frequent occurrence of natural disasters caused by global warming in recent years, the Agriculture and Food Agency (AFA) in Taiwan has conducted agricultural and food surveys to address those issues. To improve the accuracy of agricultural and food surveys, AFA uses remote sensing technology to conduct surveys on the planting area of agricultural crops. Unlike optical images that are easily disturbed by rainfall and cloud cover, synthetic aperture radar (SAR) images will not be affected by climatic factors, which makes them more suitable for the forecast of crops production. This research proposes a novel spatial-temporal neural network called a convolutional long short-term memory rice field classifier (ConvLSTM-RFC) for rice field classification from Sentinel-1A SAR images of Yunlin and Chiayi counties in Taiwan. The proposed model ConvLSTM-RFC is implemented with multiple convolutional long short-term memory attentions blocks (ConvLSTM Att Block) and a bi-tempered logistic loss function (BiTLL). Moreover, a convolutional block attention module (CBAM) was added to the residual structure of the ConvLSTM Att Block to focus on rice detection in different periods on SAR images. The experimental results of the proposed model ConvLSTM-RFC have achieved the highest accuracy of 98.08% and the rice false positive is as low as 15.08%. The results indicate that the proposed ConvLSTM-RFC produces the highest area under curve (AUC) value of 88% compared with other related models. Full article
Show Figures

Figure 1

26 pages, 53673 KiB  
Article
Investigating the Potential of Sentinel-2 MSI in Early Crop Identification in Northeast China
by Mengfan Wei, Hongyan Wang, Yuan Zhang, Qiangzi Li, Xin Du, Guanwei Shi and Yiting Ren
Remote Sens. 2022, 14(8), 1928; https://doi.org/10.3390/rs14081928 - 15 Apr 2022
Cited by 8 | Viewed by 2835
Abstract
Early crop identification can provide timely and valuable information for agricultural planting management departments to make reasonable and correct decisions. At present, there is still a lack of systematic summary and analysis on how to obtain real-time samples in the early stage, what [...] Read more.
Early crop identification can provide timely and valuable information for agricultural planting management departments to make reasonable and correct decisions. At present, there is still a lack of systematic summary and analysis on how to obtain real-time samples in the early stage, what the optimal feature sets are, and what level of crop identification accuracy can be achieved at different stages. First, this study generated training samples with the help of historical crop maps in 2019 and remote sensing images in 2020. Then, a feature optimization method was used to obtain the optimal features in different stages. Finally, the differences of the four classifiers in identifying crops and the variation characteristics of crop identification accuracy at different stages were analyzed. These experiments were conducted at three sites in Heilongjiang Province to evaluate the reliability of the results. The results showed that the earliest identification time of corn can be obtained in early July (the seven leaves period) with an identification accuracy up to 86%. In the early stages, its accuracy was 40~79%, which was low, and could not reach the satisfied accuracy requirements. In the middle stages, a satisfactory recognition accuracy could be achieved, and its recognition accuracy was 79~100%. The late stage had a higher recognition accuracy, which was 90~100%. The accuracy of soybeans at each stage was similar to that of corn, and the earliest identification time of soybeans could also be obtained in early July (the blooming period) with an identification accuracy up to 87%. Its accuracy in the early growth stage was 35~71%; in the middle stage, it was 69~100%; and in the late stage, it was 92~100%. Unlike corn and soybeans, the earliest identification time of rice could be obtained at the end of April (the flooding period) with an identification accuracy up to 86%. In the early stage, its accuracy was 58~100%; in the middle stage, its accuracy was 93~100%; and in the late stage, its accuracy was 96~100%. In terms of crop identification accuracy in the whole growth stage, GBDT and RF performed better than other classifiers in our three study areas. This study systematically investigated the potential of early crop recognition in Northeast China, and the results are helpful for relevant applications and decision making of crop recognition in different crop growth stages. Full article
Show Figures

Figure 1

18 pages, 14526 KiB  
Project Report
Earth Observation to Investigate Occurrence, Characteristics and Changes of Glaciers, Glacial Lakes and Rock Glaciers in the Poiqu River Basin (Central Himalaya)
by Tobias Bolch, Tandong Yao, Atanu Bhattacharya, Yan Hu, Owen King, Lin Liu, Jan B. Pronk, Philipp Rastner and Guoqing Zhang
Remote Sens. 2022, 14(8), 1927; https://doi.org/10.3390/rs14081927 - 15 Apr 2022
Cited by 9 | Viewed by 2982
Abstract
Meltwater from the cryosphere contributes a significant fraction of the freshwater resources in the countries receiving water from the Third Pole. Within the ESA-MOST Dragon 4 project, we addressed in particular changes of glaciers and proglacial lakes and their interaction. In addition, we [...] Read more.
Meltwater from the cryosphere contributes a significant fraction of the freshwater resources in the countries receiving water from the Third Pole. Within the ESA-MOST Dragon 4 project, we addressed in particular changes of glaciers and proglacial lakes and their interaction. In addition, we investigated rock glaciers in permafrost environments. Here, we focus on the detailed investigations which have been performed in the Poiqu River Basin, central Himalaya. We used in particular multi-temporal stereo satellite imagery, including high-resolution 1960/70s Corona and Hexagon spy images and contemporary Pleiades data. Sentinel-2 data was applied to assess the glacier flow. The results reveal that glacier mass loss continuously increased with a mass budget of −0.42 ± 0.11 m w.e.a−1 for the period 2004–2018. The mass loss has been primarily driven by an increase in summer temperature and is further accelerated by proglacial lakes, which have become abundant. The glacial lake area more than doubled between 1964 and 2017. The termini of glaciers that flow into lakes moved on average twice as fast as glaciers terminating on land, indicating that dynamical thinning plays an important role. Rock glaciers are abundant, covering approximately 21 km2, which was more than 10% of the glacier area (approximately 190 km2) in 2015. With ongoing glacier wastage, rock glaciers can become an increasingly important water resource. Full article
(This article belongs to the Special Issue ESA - NRSCC Cooperation Dragon 4 Final Results)
Show Figures

Figure 1

29 pages, 9691 KiB  
Article
Range-Ambiguous Clutter Suppression via FDA MIMO Planar Array Radar with Compressed Sensing
by Yuzhuo Wang, Shengqi Zhu, Lan Lan, Ximin Li, Zhixin Liu and Zhixia Wu
Remote Sens. 2022, 14(8), 1926; https://doi.org/10.3390/rs14081926 - 15 Apr 2022
Cited by 4 | Viewed by 1593
Abstract
Range-ambiguous clutter is an inevitable issue for airborne forward-looking array radars, especially with the high pulse repetition frequency (PRF). In this paper, a method to suppress the range-ambiguous clutter is proposed in an FDA-MIMO radar with a forward-looking planar array. Compressed sensing FDA [...] Read more.
Range-ambiguous clutter is an inevitable issue for airborne forward-looking array radars, especially with the high pulse repetition frequency (PRF). In this paper, a method to suppress the range-ambiguous clutter is proposed in an FDA-MIMO radar with a forward-looking planar array. Compressed sensing FDA technology is used to suppress the range-ambiguous clutter and the forward-looking non-uniformity short-range clutter of radar. Specifically, first, the range ambiguous clutter in different regions is separated by the characteristics of the planar array radar elevation dimension and FDA radar range coupling. Meanwhile, regarding the issue of the FDA radar main lobe moving between coherent pulses, a main lobe correction (MLC) algorithm proposes a solution for the issue, where the FDA radar cannot coherently accumulate signals in the case of non-full angle illumination. Finally, compressed sensing technology and elevation dimension filtering are utilized to suppress the range ambiguous clutter at the receiver, with the approach alleviating the range dependence of clutter in the observation region. A small number of clutter snapshots can obtain an approximately ideal clutter covariance matrix through compressed sensing sparse recovery. The method not only reduces the number of training samples, but also overcomes the problem of clutter non-uniformity in the forward-looking array. Therefore, the clutter suppression problems faced by the high repetition frequency airborne radar forward-looking array structure are solved. At the analysis stage, a comparison among the conventional MIMO and FDA methods is carried on by analyzing the improvement factor (IF) curves. Numerical results verify the effectiveness of the proposed method in range-ambiguous clutter suppression. Full article
(This article belongs to the Special Issue Radar Techniques for Structures Characterization and Monitoring)
Show Figures

Figure 1

15 pages, 4404 KiB  
Article
Laboratory Heat Flux Estimates of Seawater Foam for Low Wind Speeds
by C. Chris Chickadel, Ruth Branch, William E. Asher and Andrew T. Jessup
Remote Sens. 2022, 14(8), 1925; https://doi.org/10.3390/rs14081925 - 15 Apr 2022
Viewed by 1598
Abstract
Laboratory experiments were conducted to measure the heat flux from seafoam continuously generated in natural seawater. Using a control volume technique, heat flux was calculated from foam and foam-free surfaces as a function of ambient humidity (ranged from 40% to 78%), air–water temperature [...] Read more.
Laboratory experiments were conducted to measure the heat flux from seafoam continuously generated in natural seawater. Using a control volume technique, heat flux was calculated from foam and foam-free surfaces as a function of ambient humidity (ranged from 40% to 78%), air–water temperature difference (ranged from −9 °C to 0 °C), and wind speed (variable up to 3 m s−1). Water-surface skin temperature was imaged with a calibrated thermal infrared camera, and near-surface temperature profiles in the air, water, and foam were recorded. Net heat flux from foam surfaces increased with increasing wind speed and was shown to be up to four times greater than a foam-free surface. The fraction of the total heat flux due to the latent heat flux was observed for foam to be 0.75, with this value being relatively constant with wind speed. In contrast, for a foam-free surface the fraction of the total heat flux due to the latent heat flux decreased at higher wind speeds. Temperature profiles through foam are linear and have larger gradients, which increased with wind speed, while foam free surfaces show the expected logarithmic profile and show no variation with temperature. The radiometric surface temperatures show that foam is cooler and more variable than a foam-free surface, and bubble-resolving thermal images show that radiometrically transparent bubble caps and burst bubbles reveal warm foam below the cool surface layer, contributing to the enhanced variability. Full article
(This article belongs to the Special Issue Passive Remote Sensing of Oceanic Whitecaps)
Show Figures

Figure 1

9 pages, 2356 KiB  
Communication
Low-SNR Doppler Data Processing for the InSight Radio Science Experiment
by Dustin Buccino, James S. Border, William M. Folkner, Daniel Kahan and Sebastien Le Maistre
Remote Sens. 2022, 14(8), 1924; https://doi.org/10.3390/rs14081924 - 15 Apr 2022
Cited by 4 | Viewed by 1559
Abstract
Radio Doppler measurements between the InSight lander and NASA’s Deep Space Network have been acquired for measuring the rotation of Mars. Unlike previous landers used for this purpose that utilized steerable high-gain antennas, InSight uses two fixed medium-gain antennas, which results in a [...] Read more.
Radio Doppler measurements between the InSight lander and NASA’s Deep Space Network have been acquired for measuring the rotation of Mars. Unlike previous landers used for this purpose that utilized steerable high-gain antennas, InSight uses two fixed medium-gain antennas, which results in a lower radio signal-to-noise ratio (SNR). Lower SNR results in additional thermal noise for Doppler measurements using standard processes. Through a combination of phase averaging and traditional data compression, the increased thermal noise due to low SNR can be removed for most of the signal of interest, resulting in more accurate Doppler measurements. During the first 900 days of InSight operations, Doppler measurements were improved by ~25% on average using this method. Full article
Show Figures

Figure 1

Previous Issue
Next Issue
Back to TopTop