Article

Impacts of Land Use Changes on Net Primary Productivity in Urban Agglomerations under Multi-Scenarios Simulation

1
Beijing Key Laboratory of Precision Forestry, Beijing Forestry University, Beijing 100083, China
2
Institute of GIS, RS & GPS, Beijing Forestry University, Beijing 100083, China
*
Author to whom correspondence should be addressed.
Remote Sens. 2022, 14(7), 1755; https://doi.org/10.3390/rs14071755
Submission received: 4 March 2022 / Revised: 2 April 2022 / Accepted: 4 April 2022 / Published: 6 April 2022

Abstract

:
Land use is closely related to the sustainability of ecological development. This paper employed a patch-generating land use simulation (PLUS) model for the multi-scenario simulation of urban agglomerations. In addition, mathematical analysis methods such as Theil-Sen Median trend analysis, R/S analysis, Getis-Ord Gi* index and unary linear regression were used to study the temporal and spatial evolution characteristics of net primary productivity (NPP) for the impact of land use changes on NPP in urban agglomerations from 2000 to 2020 and to forecast the future trend of NPP. The results indicate that urban expansion is obvious in the baseline scenario and in the ecological protection scenario. In the scenario of cropland protection, the urban expansion is consistent with the land use plan of the government for 2035. The NPP in Beijing decreased gradually from northwest to southeast. The hot spot areas are concentrated in the densely forested areas in the mountainous areas of northwest. The cold spot areas are mainly concentrated in the periphery of urban areas and water areas. The NPP will continue to increase in forest and other areas under protection and remain stable in impervious surfaces. The NPP of Beijing showed a strong improvement trend and this trend will continue with the right ecological management and urban planning of the government. The study of land use in urban agglomeration and the development trend of vegetation NPP in the future can help policymakers rationally manage future land use dynamics and maintain the sustainable development of urban regional ecosystems.

1. Introduction

Vegetation changes have recorded the imprint of human activities profoundly [1]. Human activities such as land use transformation directly change the structure, process and function of ecosystems [2,3,4]. In human activity areas, vegetation has been lost or altered for human use (e.g., commercial development and infrastructure construction), and this poses a major threat to biodiversity conservation [5]. Net primary productivity (NPP) is defined as the accumulation rate of organic matter by vegetation, which is equal to the difference between the carbon absorbed by plant photosynthesis and the carbon consumed by plant autotrophic respiration [6,7], and it plays an important role in global carbon balance [8]. Land use changes have had a wide and significant impact on the ecological environment, especially in urban agglomeration where urban expansion is one of the main driving forces of change in NPP [4,9]. So, the temporal and spatial distribution characteristics of dynamic changes of land use and NPP have become an important research content in regional eco-environmental assessment.
The urbanization process in metropolises may offset the positive effects on NPP [3,10]. Vegetation destruction and improper land use caused by human activities have caused serious land degradation and ecological environment problems [11]. However, Li, X. [7] found that the NPP of new urban land in 2019 was better than that of original urban land before 2010. The human activities, mainly ecological restoration projects, made the vegetation coverage on the Loess Plateau show a significant upward trend in the past three decades [12]. As a metropolitan center, Beijing City is the capital of China with great land use transformations which is worthwhile researching. Discussing the land use transformation on the influence of vegetation NPP and whether the future changes are consistent are essential for alleviating the conflicts between sustainable development and environmental protection.
Previous studies of NPP have mainly focused on the two parts. The first part is the establishment, application and optimization of the NPP calculation model [13,14]. The other part is exploring the response mechanism of NPP by taking climate factors and human activities as the main driving factors [15,16]. Meanwhile, the change trend and the future development of NPP are also worth studying. The combination of Theil-Sen Median trend analysis and Mann–Kendall test is used to detect the trend of spatial variation in NPP widely [7,17]. This combination can eliminate the noise of original data and are very robust [17]. Brilli, L. [18] predicted a decrease in net ecosystem exchange and NPP by approaching the most extreme climate conditions. Sun, G. [19] assessed the characteristics of NPP due to future climate change and CO2. These simulation results are realized by predicting the driving factors of NPP instead of the NPP itself. Other scholars simulate NPP in the future through the change trend of NPP in the past [20,21,22]. In addition to analyzing the changing trend of NPP and its driving factors, it is necessary to study the future trend of them during rapid urbanization.
To predict the future land use (one of the driving factors of NPP), many kinds of land use simulation models have been developed, such as cellular automata (CA) [23,24,25,26], conversion of land use and its effects modeling framework (CLUE) model and its improved model [27,28,29], future land use simulation (FLUS) model [30] and patch-generating land use simulation (PLUS) model [31,32]. However, the CA model is weak at revealing the underlying drivers of land use change [33]. CLUE-S model leads to the separation of the macro land use demand projections and the local change allocations [34]. Thus, there is an urgent need for more comprehensive approaches to predict the land use in Beijing. At present, in order to pursue high accuracy, the mainstream of land prediction models has been the coupling model to eliminate the limitations of a single model by carrying out the simulation from two aspects: quantity and spatial distribution. The PLUS model has been proven to be a more effective model, which provides more precise simulation results than the FLUS model [
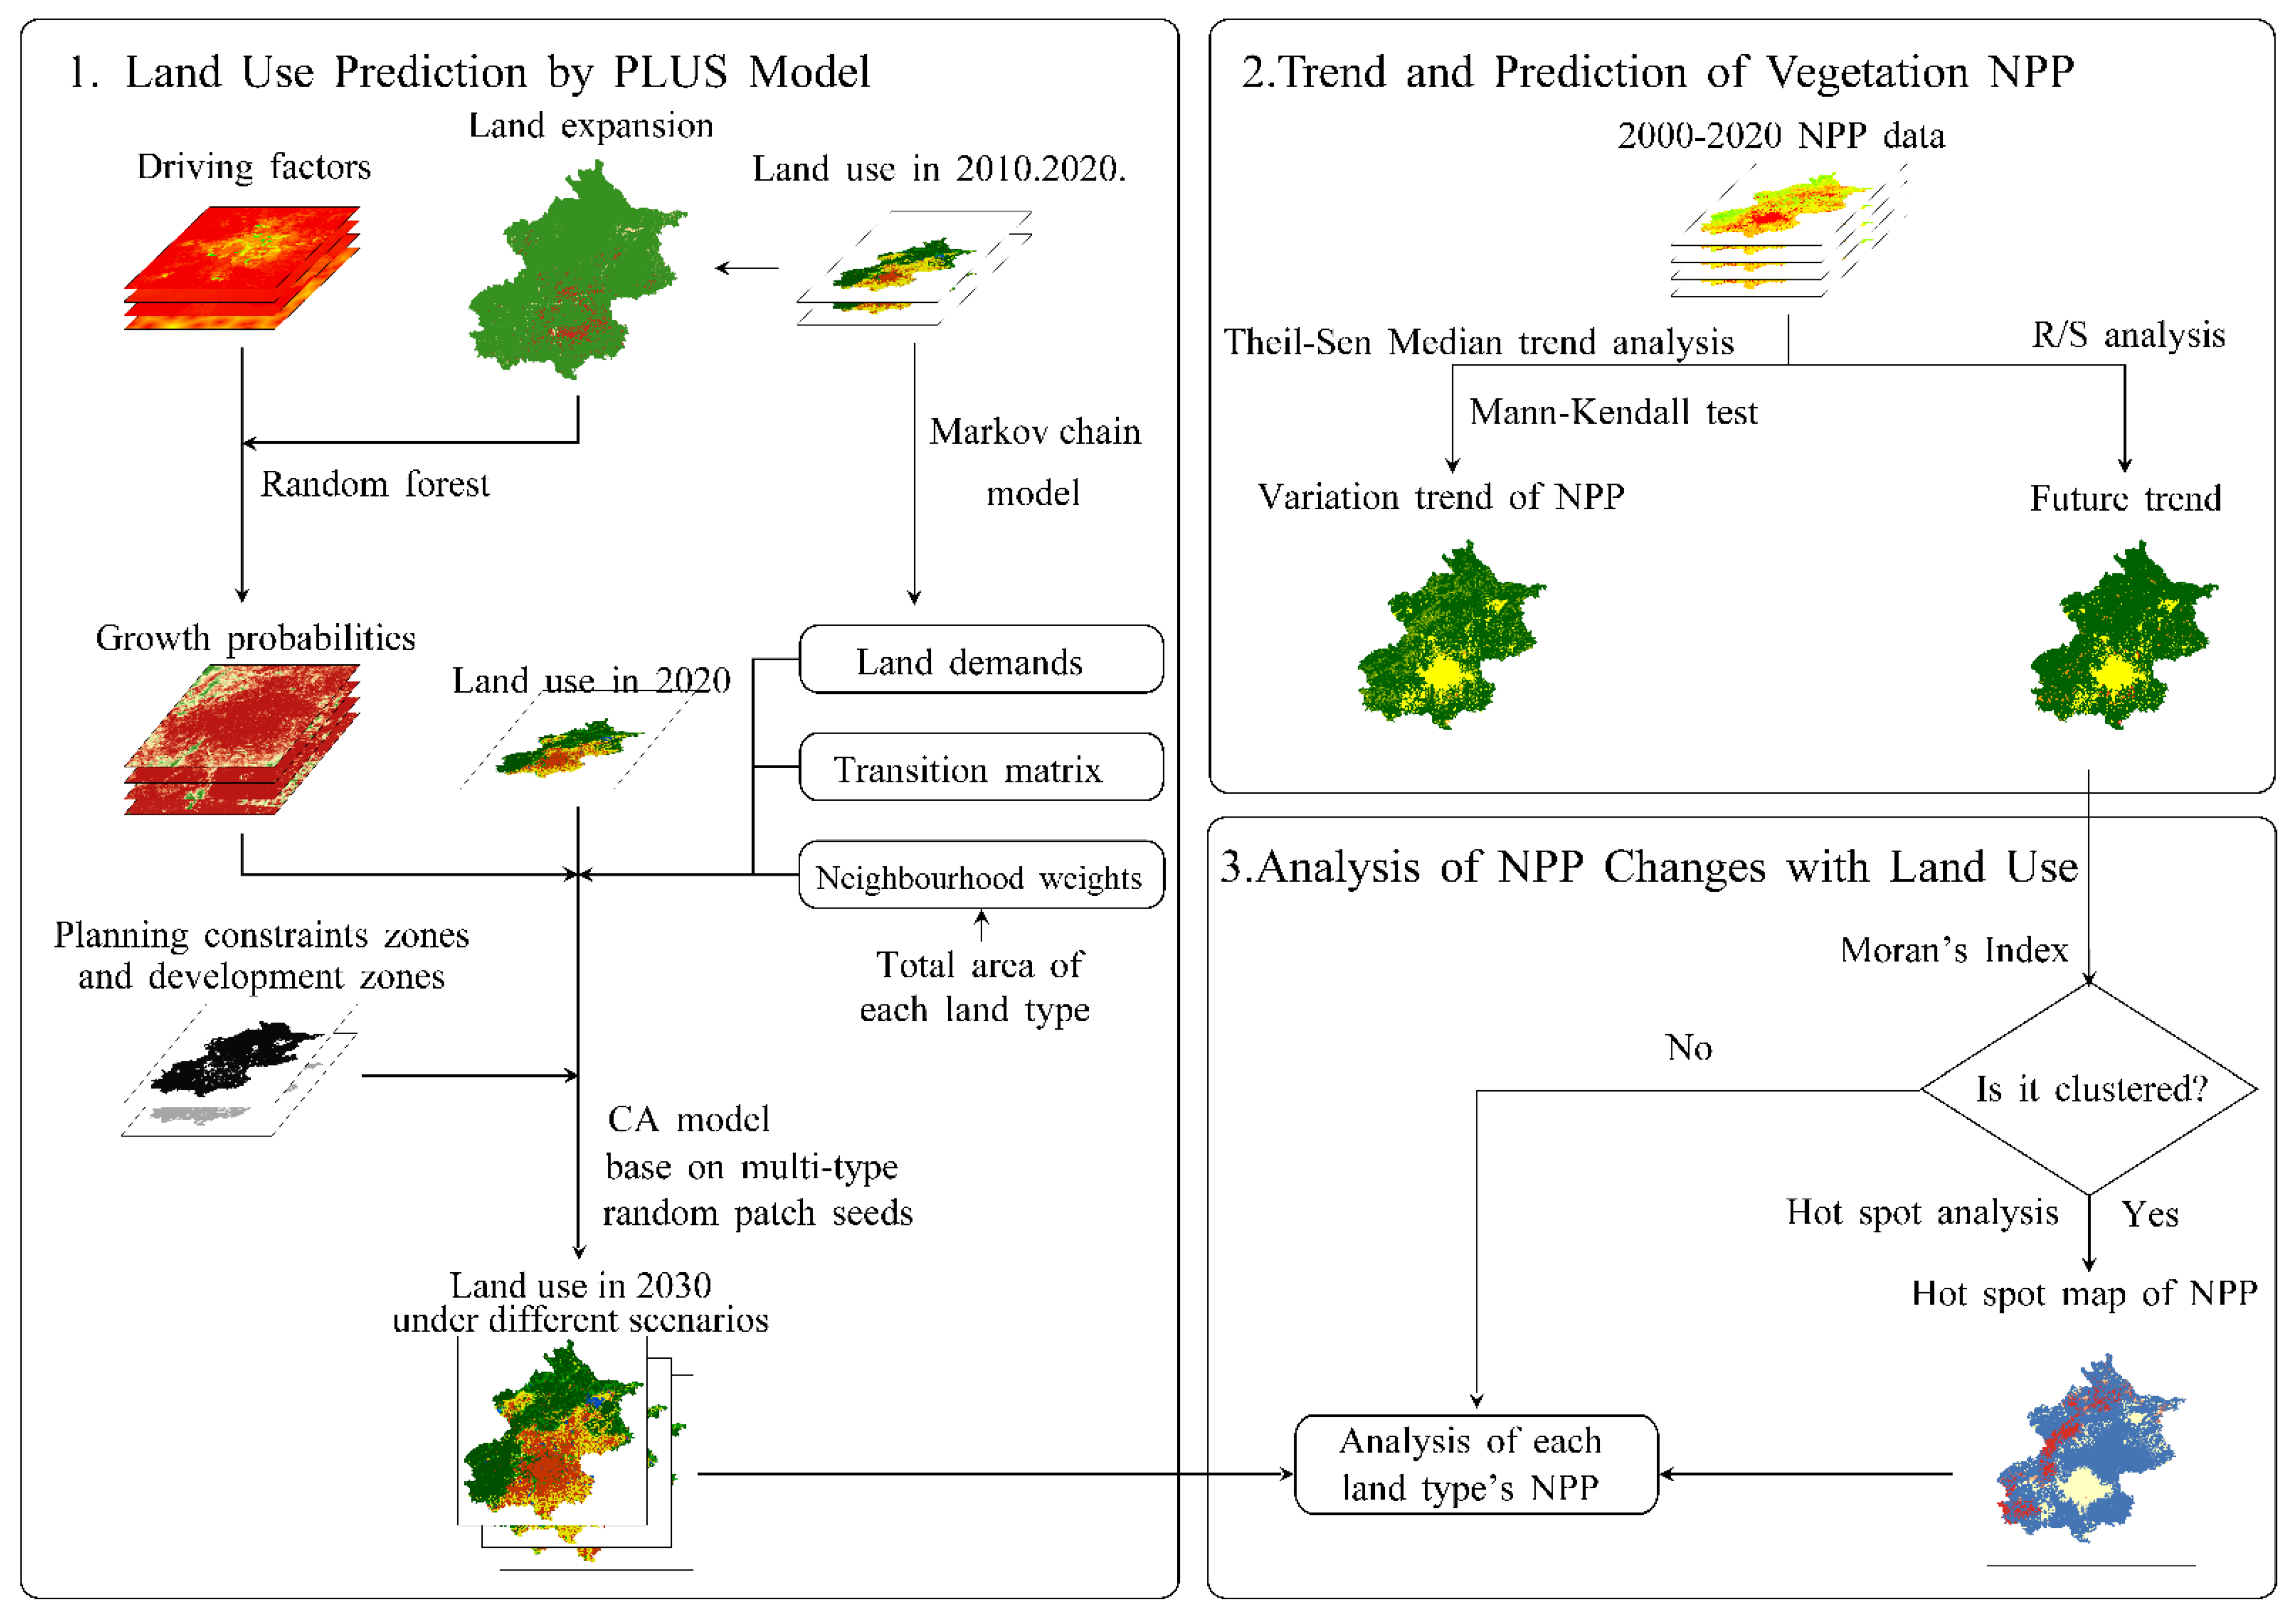
31]. A Markov chain predicts dynamic variation characteristics and is characterized by both high operational precision and high prediction accuracy [30]. This paper used a Markov chain to predict the amount of land use and simulated spatial changes by PLUS model on the basis of physiographic driving factors, transportation driving factors and socioeconomic driving factors. In addition, researchers have evaluated the future spatiotemporal land use under different scenarios combined with simulation models [24,30,31,35]. In this research, different transition matrix restricted different types of land use transformations to obtain different scenarios.
Based on mathematical analysis methods such as unary linear regression, Getis-Ord Gi* index and Hurst index, the objectives of this study were to: (1) explore the spatiotemporal variation trend of vegetation NPP from 2000 to 2020 based on land use; (2) evaluate future land use at 30 m spatial resolution under three different scenarios in 2030; (3) analyze the future trend of NPP. The temporal and spatial variation in land use and NPP were comprehensively analyzed for ecological protection and management in this research. What is more, based on the impact of land use on vegetation NPP, the correctness of NPP change trend in the future can be judged. This research is expected to provide a scientific basis for spatial development plan and represent a valuable reference of the urban agglomeration similar to Beijing.

2. Materials and Methods

2.1. Study Area

Beijing is located at 115°25′–117°30′ E, 39°28′–41°05′ N and has a total area of 16,410 square kilometers approximately. It is located in the northern part of the North China Plain and surrounded by the Taihang Mountains and Yanshan Mountains (Figure 1). Beijing’s terrain is high in the northwest and low in the southeast with an average elevation of 43.5 m above sea level. The mountainous area in this administrative region accounts for 62%, mainly distributed in middle and low mountainous areas. With a typical warm temperate sub-humid semi-arid monsoon climate, Beijing is hot and rainy in summer, cold and dry in winter, and spring and autumn are short. The zonal vegetation type in Beijing is warm temperate deciduous broad-leaved forest with temperate coniferous forest.
As the capital of China, Beijing has strengths in the fields of politics, culture, traffic and science and technology. Impervious surface is one of the land use types which has emerged not only as an indicator of the degree of urbanization, but also a major indicator of environmental quality [36]. The other main land use type in Beijing is forest which covers the largest area and mainly occurs in areas with elevations of 1000–1500 m. The local government is facing a challenge in balancing ecological conservation and local livelihoods under land use change.

2.2. Data

The border location data regarding the geographical limits of the research region were downloaded from the Chinese Academy of Sciences Resource and Environmental Science Data Center (http://www.resdc.cn, accessed on 30 October 2021).
(1)
Land use data. The global LULC (land use/land cover) product (GlobeLand30, with aspatial resolution of 30 m, http://globeland30.org/home_en.html, accessed on 30 October 2021), was developed by China to the United Nations with extensive use. The images for land cover classification of development and update of GlobeLand30 [37] include TM5 ETM+, OLI multispectral images of Landsat 8 (USGS) and HJ-1 (China Environment and Disaster Reduction Satellite). What is more, the 16 m resolution GF-1(China High Resolution Satellite) multispectral image was also used for GlobeLand30 2020. The total accuracy of GlobeLand30 2010 and 2020 is 83.50% and 85.72%, respectively, and the kappa coefficient is 0.78 and 0.82 [38,39,40]. The results were both from the validation of over 150,000 points. The existing data of 2000, 2010 and 2020 effectively reflect the overall changes of global land use and landscape pattern during the past 20 years. The images include 6 first-level categories and 26 s-level categories. After merging and reclassifying the data from 2010 and 2020, the land use was divided into six categories within Beijing: cropland, forest, grassland, wetland, water body, impervious surface and bare area. Planning constraints data used in this study was Open Street Map (OSM, https://www.openstreetmap.org, accessed on 30 October 2021) data in 2020 and based on this data, the natural reserves, scenic spots, historical sites, religious sites, reservoirs, dams, major urban parks and other areas in the region were screened out by ArcMap. The development zone was derived from the centralized construction area in “The Master Plan of Beijing (2016–2035)”.
Physiographic factors, transportation factors and socioeconomic factors were determined to be development potential as spatial driving factors of the future land use changes in Beijing. The driving factors between 2000 to 2010 were used to simulate the land use in 2020 for accuracy verification. Correspondingly, the driving factors between 2010 to 2020 were used to simulate the land use in 2030. Referring to the previous studies [31,41], we selected several forces (Table 1) as driving factors to predict the impacts of natural and socioeconomic conditions on land use changes. Among them, DEM was used as the main data source for more driving forces (slope, aspect). The data set was provided by Geospatial Data Cloud site, Computer Network Information Center, Chinese Academy of Sciences (http://www.gscloud.cn, accessed on 30 October 2021), processed by using the data of the first version (V1) of Aster GDEM in 2009. It is a digital elevation data product with a global spatial resolution of 30 m.
(2)
Vegetation net primary productivity data. The MOD17A3HGF NPP products [42] came from the Terra Moderate Resolution Imaging Spectroradiometer (MODIS) which is a satellite-based sensor used for earth and climate measurements. MODIS data and products acquired through the LP DAAC. The temporal resolution is 1 year, and the spatial resolution is 500 m. The MOD17A3HGF is derived from the sum of all 8-day net photosynthesis (PSN) products (MOD17A2H). The PSN value is the difference of the Gross Primary Productivity (GPP) and the Maintenance Respiration (MR). We cut and mosaicked the band of NPP from 2000 to 2020 and the pixel value is multiplied by the scale factor of 0.0001 to obtain the annual real value of NPP.
The pixel sizes of all data are unified to 30 m, and the applied geographic coordinate system and map projection were the WGS-84 datum and the Universal Transverse Mercator, respectively.

2.3. Methodology

2.3.1. The PLUS Model and Accuracy Verification

The PLUS model contains a land expansion analysis strategy (LEAS) and a CA model that includes a patch-generation mechanism based on multi-type random seeds (CARS). The LEAS transforms the mining of transition rules of each land use type into a binary classification problem (obtain the change and inertia probabilities of each land use type), which can be solved with many data mining methods [31]. The LEAS transform needs land use data of two periods to overlay and extract changing grids from later data, then selected random sampling points. Then the random forest classification (RFC) algorithm analyzes the relationship between the growth of each kind of land use types and various driving factors to obtain the transition rules by calculating the growth probability. In this research, 16 driving factors (Table 1) were chosen to calculate the probability of occurrence for each landscape type among these factors. The CARS module is a Cellular Automata (CA) model base on multi-type random patch seeds. The important property of CA is that they demonstrate the spatial and dynamic process [24]. The CA model in PLUS model has been improve with multi-type random patch seeds and threshold descent rules.
Neighborhood weight represents the expansion intensity of the land type, that is, the expansion ability of each land type driven by external factors. Arnold Jr, C.L. [43] conducted dimensionless processing on the variation of Total Area (one of the landscape metrics, TA) of each land type, making its threshold between 0 and 1. Combined with the requirements of neighborhood weight on data structure, it is concluded that the dimensionless value of TA variation conforms to the requirements of neighborhood weight both in terms of parameter meaning and data structure. Formula is as follows:
X = X i min ( X ) max ( X ) min ( X )
where X = ( X 1 , , X i ); X is the i t h normalized value.
The Markov chain model uses the Markov process method to project future land which has been widely used in the prediction of land demands [30,31,43]. This method is characterized by both high operational precision and high prediction accuracy. It can be presented using the following equation as:
S t + 1 = P i j × S t , P i j [ 0 , 1 )
where S t + 1 and S t are the landscape composition at times t and t + 1 , respectively; P i j is the transition probability that land use type i is converted to land use type j at time t .
Firstly, the PLUS model was used to simulate the land use in 2020 with the land use in 2000 as the starting year and 2010 as the end. The simulation results were compared with the real 2020 land use map via a Kappa test, as follows:
k = p o p e p p p e
where p o represents overall accuracy which is calculated by dividing the sum of the correctly classified samples in each category by the total number of samples; p e represents the correct proportion of the model in the random case; p p represents the proportion of the correct simulation in the case of ideal classification which is 1 normally. The verification results revealed that the overall accuracy and kappa coefficient reached 0.8268 and 0.747233, respectively. This demonstrates that the accuracy of the model is substantial, and the PLUS model can be used for future simulation reliably in Beijing.
Secondly, data from 2010 to 2020 were used to simulate future land use under different scenarios. In this study, different scenarios included the baseline scenario, cropland protection scenario and ecological protection scenario [35]. For the Chinese government’s policy, these scenarios were all simulated over the planning constraints zones and development zones. The baseline scenario is the basis of considering other constraint conditions for simulation of land use change in urban agglomerations. Based on the rule of land use change from 2010 to 2020, no restriction on conversion between different types of land is set. The transition matrix of the baseline scenario is unit matrix. The cropland protection scenario protects the cropland in urban agglomeration and strictly controls the conversion of cropland to other types of land which is set as 0 in the transfer matrix. The ecological protection scenario is similar to the cropland protection scenario. The factors of ecological protection are added into the baseline scenario by setting forest, wetland and water body not to be converted into other types of land use. Neighborhood weights and land demands are reported in Table 2. For other specific input parameters and simulation processes, see reference [31].
The overall framework of scenario-based future land use and NPP is illustrated in Figure 2.

2.3.2. Theil-Sen Median Trend Analysis and Mann–Kendall Test

The combination of Theil–Sen trend analysis method and Mann–Kendall test method is widely used in long time series analysis of vegetation on pixel scale [7,17,44]. Theil-Sen trend analysis does not require data to obey specific distribution characteristics and is less affected by outliers. This method quantifies the change trend by calculating the median slope of n(n − 1)/2 data combinations:
β = m e d i a n ( N P P j N P P i j i ) ,   2000 i < j 2020
where β is the changing trend of NPP, β > 0 indicates an upward trend, while β < 0 indicates a downward trend; N P P i and N P P j represent the NPP values of pixels in year i and year j , respectively.
The Mann–Kendall test method is a nonparametric statistical test used to judge the significance of trends, which does not require samples to follow a certain distribution and is not disturbed by a few outliers [44]. This method is used to evaluate the significance of the NPP trend, and the formula is as follows:
S = j = 1 n 1 i = j + 1 n sgn ( N P P j N P P i ) , 2000 i < j 2020
sgn ( N P P j N P P i ) = { 1 , N P P j N P P i > 0 0 , N P P j N P P i = 0 1 , N P P j N P P i < 0
Z = { S 1 v a r ( S ) ,   S > 0 0 ,   S = 0 S 1 v a r ( S ) , S > 0
v a r ( S ) = n ( n 1 ) ( 2 n + 5 ) 18
where S is the test statistics; sgn is a sign function; n is the length of the time series; Z is the standardized statistics. The trend test method is the null hypothesis. Under a given significance level α , ± Z 1 α / 2 is normalized normal deviation. When | Z | > Z 1 α / 2 , refuse the null hypothesis and it indicates that there are changes at level α . On the contrary, the change is not significant. In this paper, significant change was defined when the trend was significant at α = 0.05. When α = 0.01, it was extremely significant.

2.3.3. Rescaled Rang Analysis (R/S Analysis) and Hurst Index Method

The Hurst index method can predict the future development trend according to the past trend of long time series data. The Hurst index method based on the R/S analysis method was first developed by a British hydrologist [45] in the study of Nile reservoir flow. It is widely used in hydrology, economics and climatology [46,47], and has recently been applied to the study of vegetation cover change [21,44,47]. The calculation steps are as follows:
Δ N P P i = N P P i N P P i 1 ,
Δ N P P ( m ) ¯ = i = 1 m Δ N P P i m ,   m = 1 , 2 , , n
X ( t ) = i = 1 m ( Δ N P P i Δ N P P ( m ) ¯ ) ,   1 t m
R ( m ) = m a x   1 m n X ( t ) m i n 1 m n X ( t )
S ( m ) = i = 1 m ( Δ N P P i Δ N P P ( m ) ¯ ) 2 m
R ( m ) S ( m ) = ( k m ) H
where N P P i is the NPP value in year i ; k is constant; H is the Hurst index which can be calculated by linear fitting with the least squares in double logarithmic coordinate system ( l n m , l n ( r / s ) ). The norm of the Hurst index is 0~1. When 0 < H < 0.5, it indicates that the NPP will reveal a trend that is opposite of that in the past; when H = 0.5, it indicates that the change of NPP is mutually independent which is a random event; when 0.5 < H < 1, it indicates that there are long-term correlations and the NPP will be consistent with the changing trend before.

2.3.4. Hot Spot Analysis

Prior to the implementation of hot spot analysis, the NPP changes of vegetation in Beijing from 2000 to 2020 has used Moran’s Index to analyze spatial autocorrelation (Figure 3). The result shows that it has the characteristics of spatial clustering, which can be carried out for spatial cold hot spot analysis.
Hot spot and cold spot analysis is performed to identify the states having the high or low values of cluster spatially by Getis-Ord Gi* statistic. The local sum for a feature in the neighborhood of a grid cell is compared proportionally to the sum of all features using Getis-Ord Gi* statistic which can obtain the Z-score [48]. For statistically significant, the positive and larger Z-score indicated the more intense the clustering of high values (hot spot) and negative and the smaller the Z-score signified the more intense the clustering of low values (cold spot) [49,50]. The formula is as follows:
G i ( d ) = j = 1 n W i j ( d ) X j j = 1 n X j
Z ( G i ) = G i E ( G i ) V a r ( G i )
where X j is the attribute value for feature j ; W i j ( d ) is the spatial weight between feature i and j ; E ( G i ) and V a r ( G i ) is the mathematical expectation and coefficient of variation of G i , respectively. If Z ( G i ) > 0 and significant, it indicates that the value around the research area is higher than the mean value and the area belongs to the hot zone. On the other hand, the value around the research area is low and the area belongs to the cold spot area.

3. Results

3.1. Future Spatial-Temporal Land Use Changes in Beijing

During 2000–2020, the land use type of urban agglomeration was mainly forest, which accounted for more than 40% of the entire area, followed by cropland and impervious surface. Water body, wetland and bare area accounted for only a small portion of the study area (Figure 4). The total area of grassland and cropland decreased, among which the area of cultivated land decreased by 1764.68 km2 in 20 years, the proportion of grassland decreased by about 2%. The land use of water body first decreased and then rose, because the closer it is to the water, the more suitable it is for production and living, and the easier it is to be exploited and utilized by human beings. The water area of Beijing is mainly distributed in Miyun, and the area around the reservoir was transformed into cropland for planting chestnut, plum and other cash crops in early years. People gradually realized the importance of water body, therefore, the area of water body increased by 87.14 km2 from 2010 to 2020. In 2010, the construction land area of urban agglomeration was 3475.76 km2, increasing by 1885.80 km2 compared with 2000 which tended to show clear changes. The expansion area of impervious surface was mainly concentrated in the urbanization area of urban agglomeration, including Haidian district, Chaoyang District, Daxing District and Tongzhou District.
The mountain terrain in the northwest region is not suitable for large-scale development, except Yanqing district, which is relatively flat and has more cropland and impervious surface with frequent human activities. Additionally, people’s requirements for urban environment have been enhanced with the continuous development of urbanization and the continuous improvement of residents’ living standards, so large amounts of mountainous land and farmland have been listed as northwest ecological conservation area. Similarly, cropland is vital. Therefore, land use simulation is divided into the following three scenarios: the baseline scenario, cropland protection scenario and ecological protection scenario.
Under the baseline scenario in 2030 (Figure 4d), the area of cropland will decrease by 955.04 km2 compared with 2000 and the area of other land use types will increase. The area of impervious surface, water body, grassland and forest will increase by 862.43 km2, 48.67 km2, 23.91 km2 and 19.07 km2, respectively, and the area of bare land and wetland will hardly rise. The baseline scenario is the basis for the simulation of urban agglomeration land use change considering other constraints, while the cropland protection scenario is to add the concept of farmland protection to the baseline scenario to prevent the basic farmland from being occupied by other land in the process of urbanization. As a result, the land use under cropland protection scenario (Figure 4e) has a little change than 2020. Specifically, the area of forest will change the most (from 7388.60 km2 in 2020 to 7382.57 km2 in 2030) and other land use areas will change by less than 3 km2 under cropland protection scenario. The simulation results under the ecological protection scenario (Figure 4f) are similar to that under the baseline scenario. The areas of forest, grassland, wetland, impervious surface and bare land will be 7407.67 km2, 1395.65 km2, 12.04 km2, 4338.19 km2 and 4.89 km2, respectively, under these two scenarios. Under the ecological protection scenario, more of the area will be converted to water body (288.61 km2, accounting for approximately 1.76% of the total inundation area), as compared to the baseline scenario in 2030, the area of cropland will reduce by another 1.61 km2.

3.2. Temporal and Spatial Evolution of Vegetation Net Primary Productivity

3.2.1. Temporal Variation Characteristic

As shown in Figure 5, NPP of vegetation fluctuated and increased from 2000 to 2020, with an annual average of 288.13 gC·m−2·a−2. The maximum value and minimum value of NPP were 358.44 gC·m−2·a−2 and 167.85 gC·m−2·a−2, respectively, appearing in 2020 and 2000. The interannual variation of NPP has obvious valley values in 2007 (275.77 gC·m−2·a−2), 2010 (295.42 gC·m−2·a−2), 2014 (329.69 gC·m−2·a−2) and 2019 (356.98 gC·m−2·a−2), which may be caused by the occurrence of La Nina and El Nino phenomenon, resulting in less rain and drought in Beijing, which is located in the northeast of China [51]. NPP fluctuated greatly from 2000 to 2010. Since 2010, NPP of vegetation covered areas showed an obvious trend of increase, indicating that the overall growth of vegetation was improved.

3.2.2. Spatial Variation Characteristic

As shown in Figure 6a and Table 3, changes of vegetation NPP showed an obvious upward trend from 2000 to 2020 in Beijing. The NPP rising area accounted for 86.77% of the total area, showing a ring shape. The extremely significant increase (p < 0.01) accounted for about 70.62% of the total area, mainly distributed in the west of Fangshan District, Mentougou District, north of Changping District, Yanqing District, Huairou District, Miyun District, Pinggu District, Shunyi District, Tongzhou District, Daxing District. Among the above areas, Shunyi District, Tongzhou District, Daxing District and Pinggu District are flat and far from the urban agglomeration, and the land use type is given priority to cropland and grassland. In other areas, the land use type is mainly forest and grassland with high terrain and less negative human disturbance, however, the changes of vegetation NPP of the mountain ridge area belongs to slightly rise and significantly rise. The main types of land use in the stable area are mainly impervious surface and water body which has no vegetation. The decrease of NPP accounted for 0.4% of the total area, among which, the extremely significant decline (p < 0.01) and significant decline (0.01 ≤ p < 0.05) accounted for about 10.04% of the total area, mainly distributed in the central area of urban agglomeration with flat terrain. Due to the negative influence of social and economic development, human activities and population density, vegetation activity weakened and NPP decreased.

3.2.3. Future Trend

The average Hurst index of NPP of vegetation in Beijing is 0.64, which shows a continuous change on the whole. About 85.12% of the total area show continuous change, which is much higher than the area with anti-continuous change (2.05%).
The results of the R/S analysis and Hurst index method were reclassified and performed spatial overlay analysis in order to reveal the future NPP in Beijing, so the persistence characteristics of future vegetation change trends can be obtained (Figure 6b and Table 4). According to statistical analysis, the vegetation NPP of most of the total area (84.8%) will rise or continuous rise in the future, indicating that the ecological protection of Beijing will achieve certain results on the basis of consolidating the existing protection achievements. The decline and continuous decline areas account for 2.37%, and the areas where the NPP will continue to decline in the future are mainly the areas where the Daxing Airport, Beijing Capital Airport, flyovers and other traffic facilities are located. The areas of NPP decline in the future are not only around the areas of continuous decline, but also at the ridges in the west and north of Beijing where has shown a slowly improvement in the past two decades.

3.3. Analysis of Land Use Change Composition of NPP in Cold and Hot Spot Areas

Figure 7 shows the spatial distribution information of high value (hot spot) and low value (cold spot) of NPP change trend. When p < 0.01, the hot spots of NPP change are mainly distributed in the northwest, and the cold spots are mainly concentrated in the periphery of urban area and water area.
Land use change is one of the important driving factors of NPP. According to the cold hot spot area of vegetation NPP in Beijing as the mask extraction range, the transfer matrix of land use change in cold spot and hot spot area was extracted, so as to understand the impact of land use change on vegetation NPP change. It can be seen from Table 5 that the main land types in the hot spot of vegetation NPP in Beijing are forest and grassland, and the area of wetland and bare area is extremely few (0.019 km2 and 0.022 km2 in 2020, respectively). In terms of land use change, there is little transfer. The area of forest and grassland without land transformation are 1148.492 km2 and 43.427 km2. The transformation of land use types in hot spots mainly occurs in the transformation from grassland to forest about 21.816 km2. Although other lands are still transferred to water body and impervious surface, the change area is small which is only 6.364 km2 after the transformation. The main land use types in this area are still forest land and grassland.
As can be seen from Table 6, the area of impervious surface without land use transformation in cold spot (p < 0.01) area is 708.79 km2, and the area of other land use types transformed into impervious surface is 1532.14 km2 in total, leading to a low level of NPP in this region. Land use transformation in cold spot area mainly occurs between cropland to impervious surface, forest to grassland and grassland to other land use types. In 2000, 1305.30 km2 cropland was converted to impervious surface in 2020, while 37.92 km2 forest land, 183.51 km2 grassland along with 5.26 km2 water body was also turned into impervious surface. With the continuous strengthening of urban development in Beijing, the rapid expansion of construction land areas is the main reason for the cold spot areas of NPP.

4. Discussion

4.1. Spatial Development Plan

In the twenty-first century, preparing cities for urban land use planning is a critical challenge, and the relevant authorities require guidance from the simulation results to define adaptation strategies and policies. In accordance with “The Master Plan of Beijing (2016–2035)” by The People’s Government of Beijing City, natural resources such as green space, water system and wetland are important ecological barriers and great attentions is attached to the protection of this famous historical and cultural city, therefore, these zones are the planning constraints zones in this study. The development area is also obtained from the centralized construction area in the released “planning map of two lines and three districts in the city”. Compared with the current land use situation, areas of the north of Daxing District, areas around Beijing Daxing International Airport and so on will be intensively constructed.
According to “The Master Plan of Beijing (2016–2035)”, the total scale of construction land (including urban and rural construction land, special land, external transportation land and some water conservancy facilities land) should be controlled within 3720 km2 by 2020; the amount of cropland would be no less than 1.66 million mu by 2020; the city’s forest coverage rate would increase from the current 41.6% to 44% by 2020. In the actual land use in 2020, the area of impervious surface was 3475.76 km2; the area of cultivated land was 3902.51 km2 (5.85 million mu); and the area of forest land was 7388.60 km2 (45.07%). The current regional development met the planning requirements, that is to say, the future development guidance of this study can refer to the land development planning.
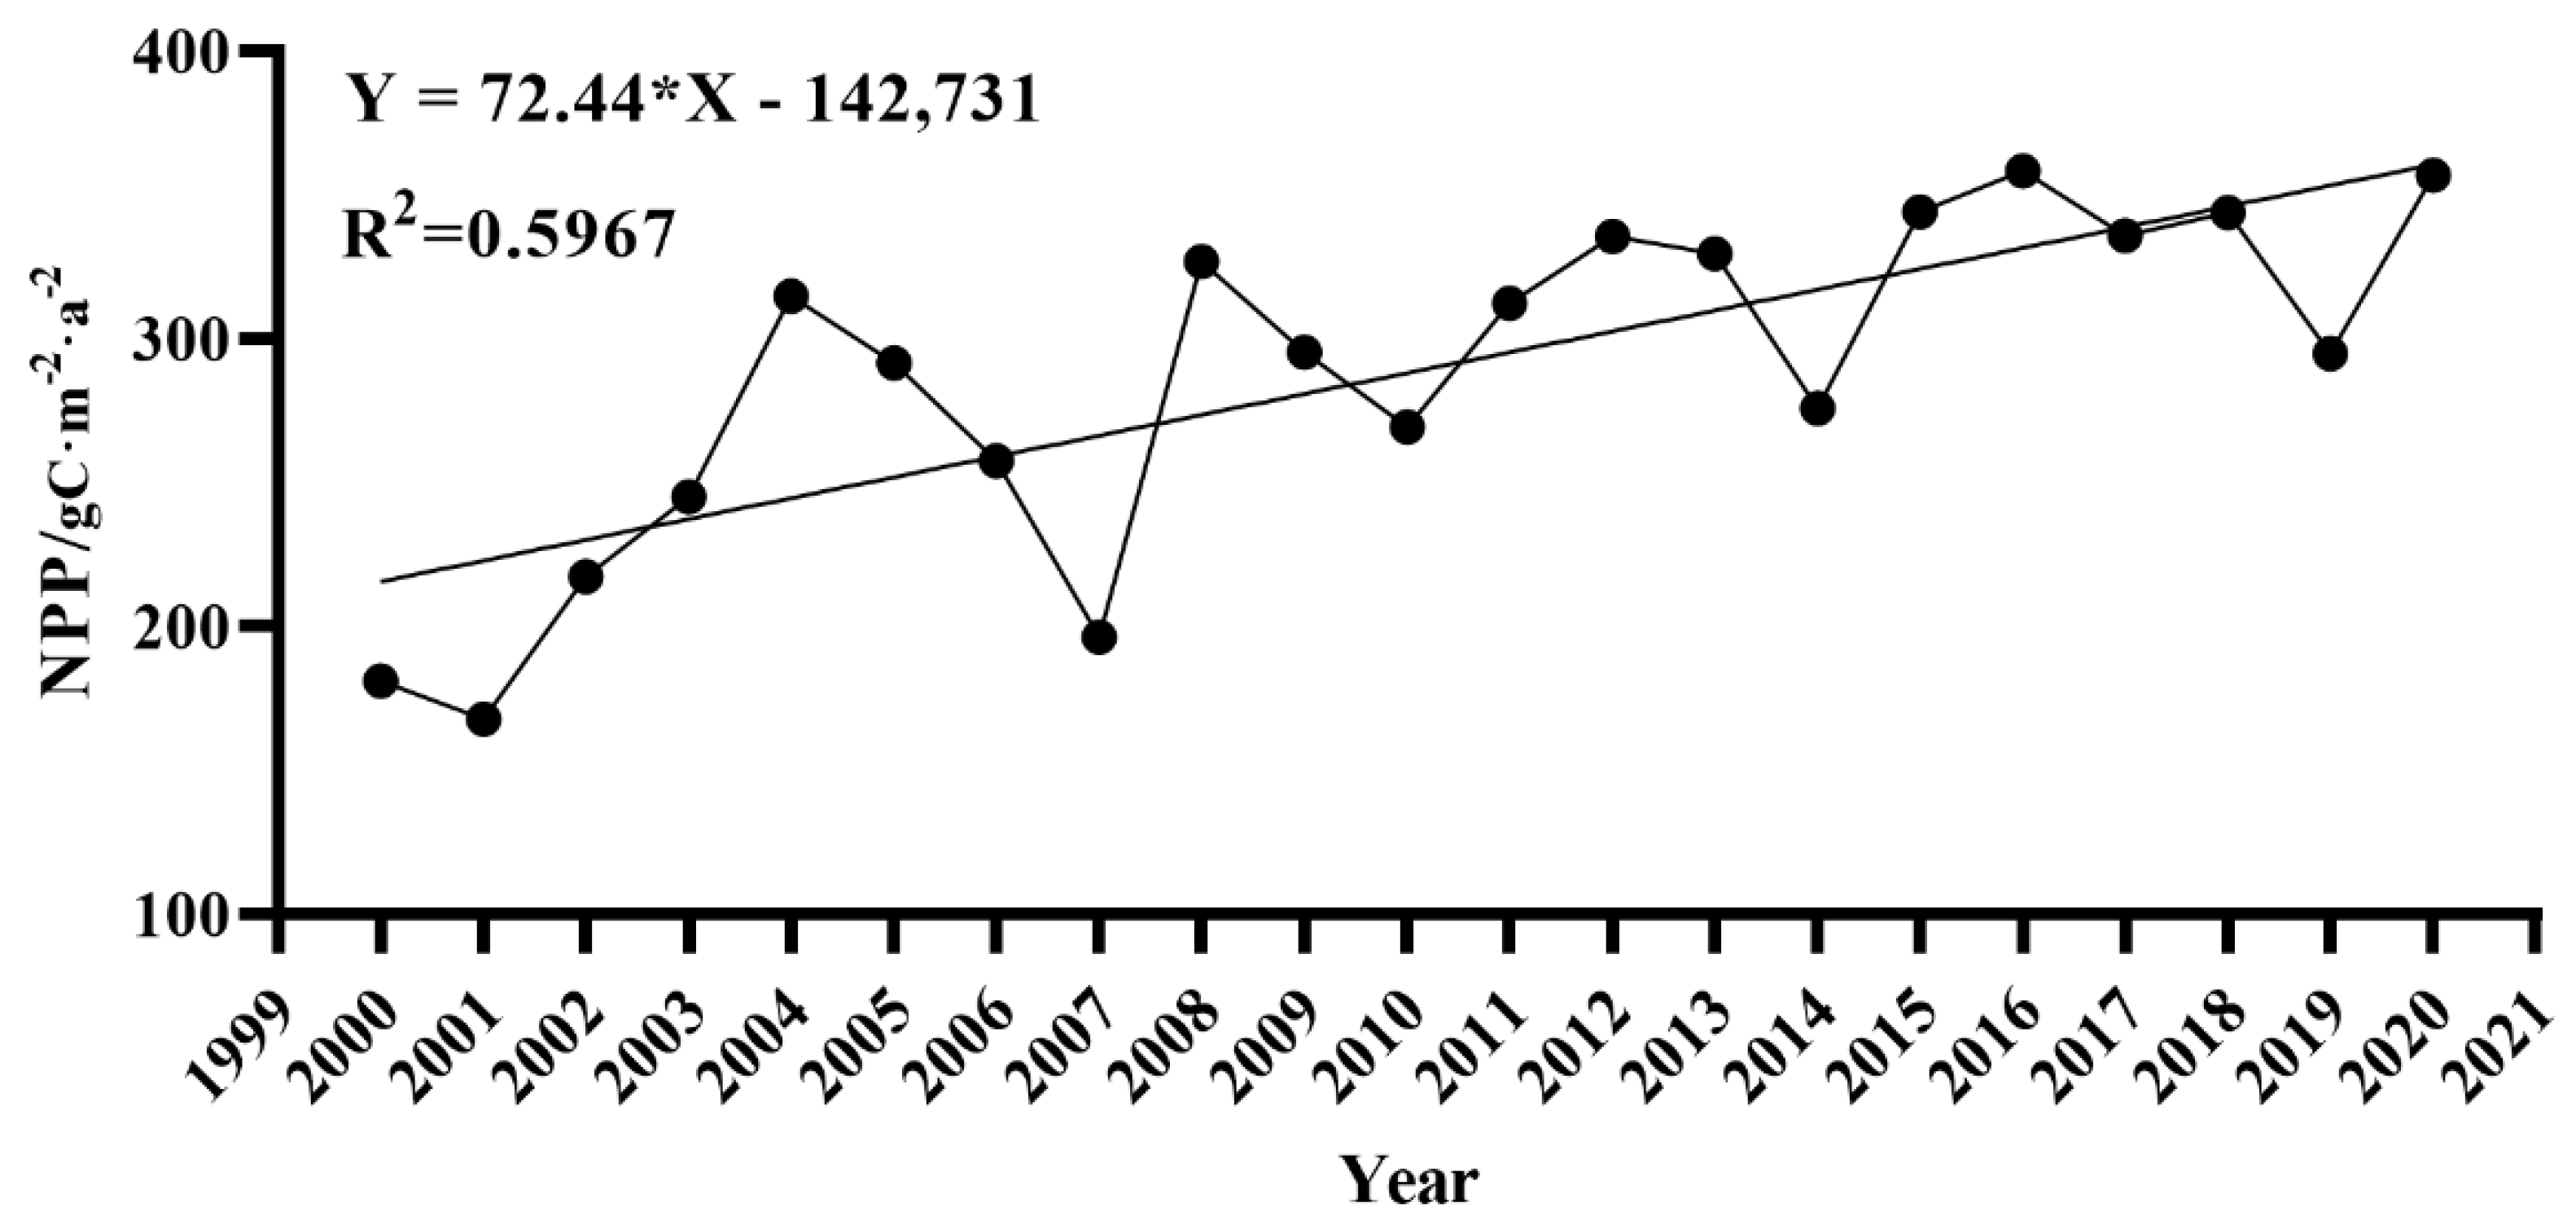
From 2000 to 2010, the NPP value of vegetation in Beijing fluctuated greatly (Figure 5). Then China has implemented a series of ecological forestry projects, such as Grain for Green Program, the Three-North Shelterbelt Project, Wildlife Protection and Nature Reserve Development Program around Beijing which have made remarkable achievements in vegetation restoration and ecological system construction [21,52].The future work plan is to establish an ecological restoration support mechanism by strengthening the ecological restoration of cropland forest network and river lake wetland in plain areas, and go on carrying the ecological forestry projects to continuously improve the quality of ecological space.

4.2. Review of Land-Use Simulation Results

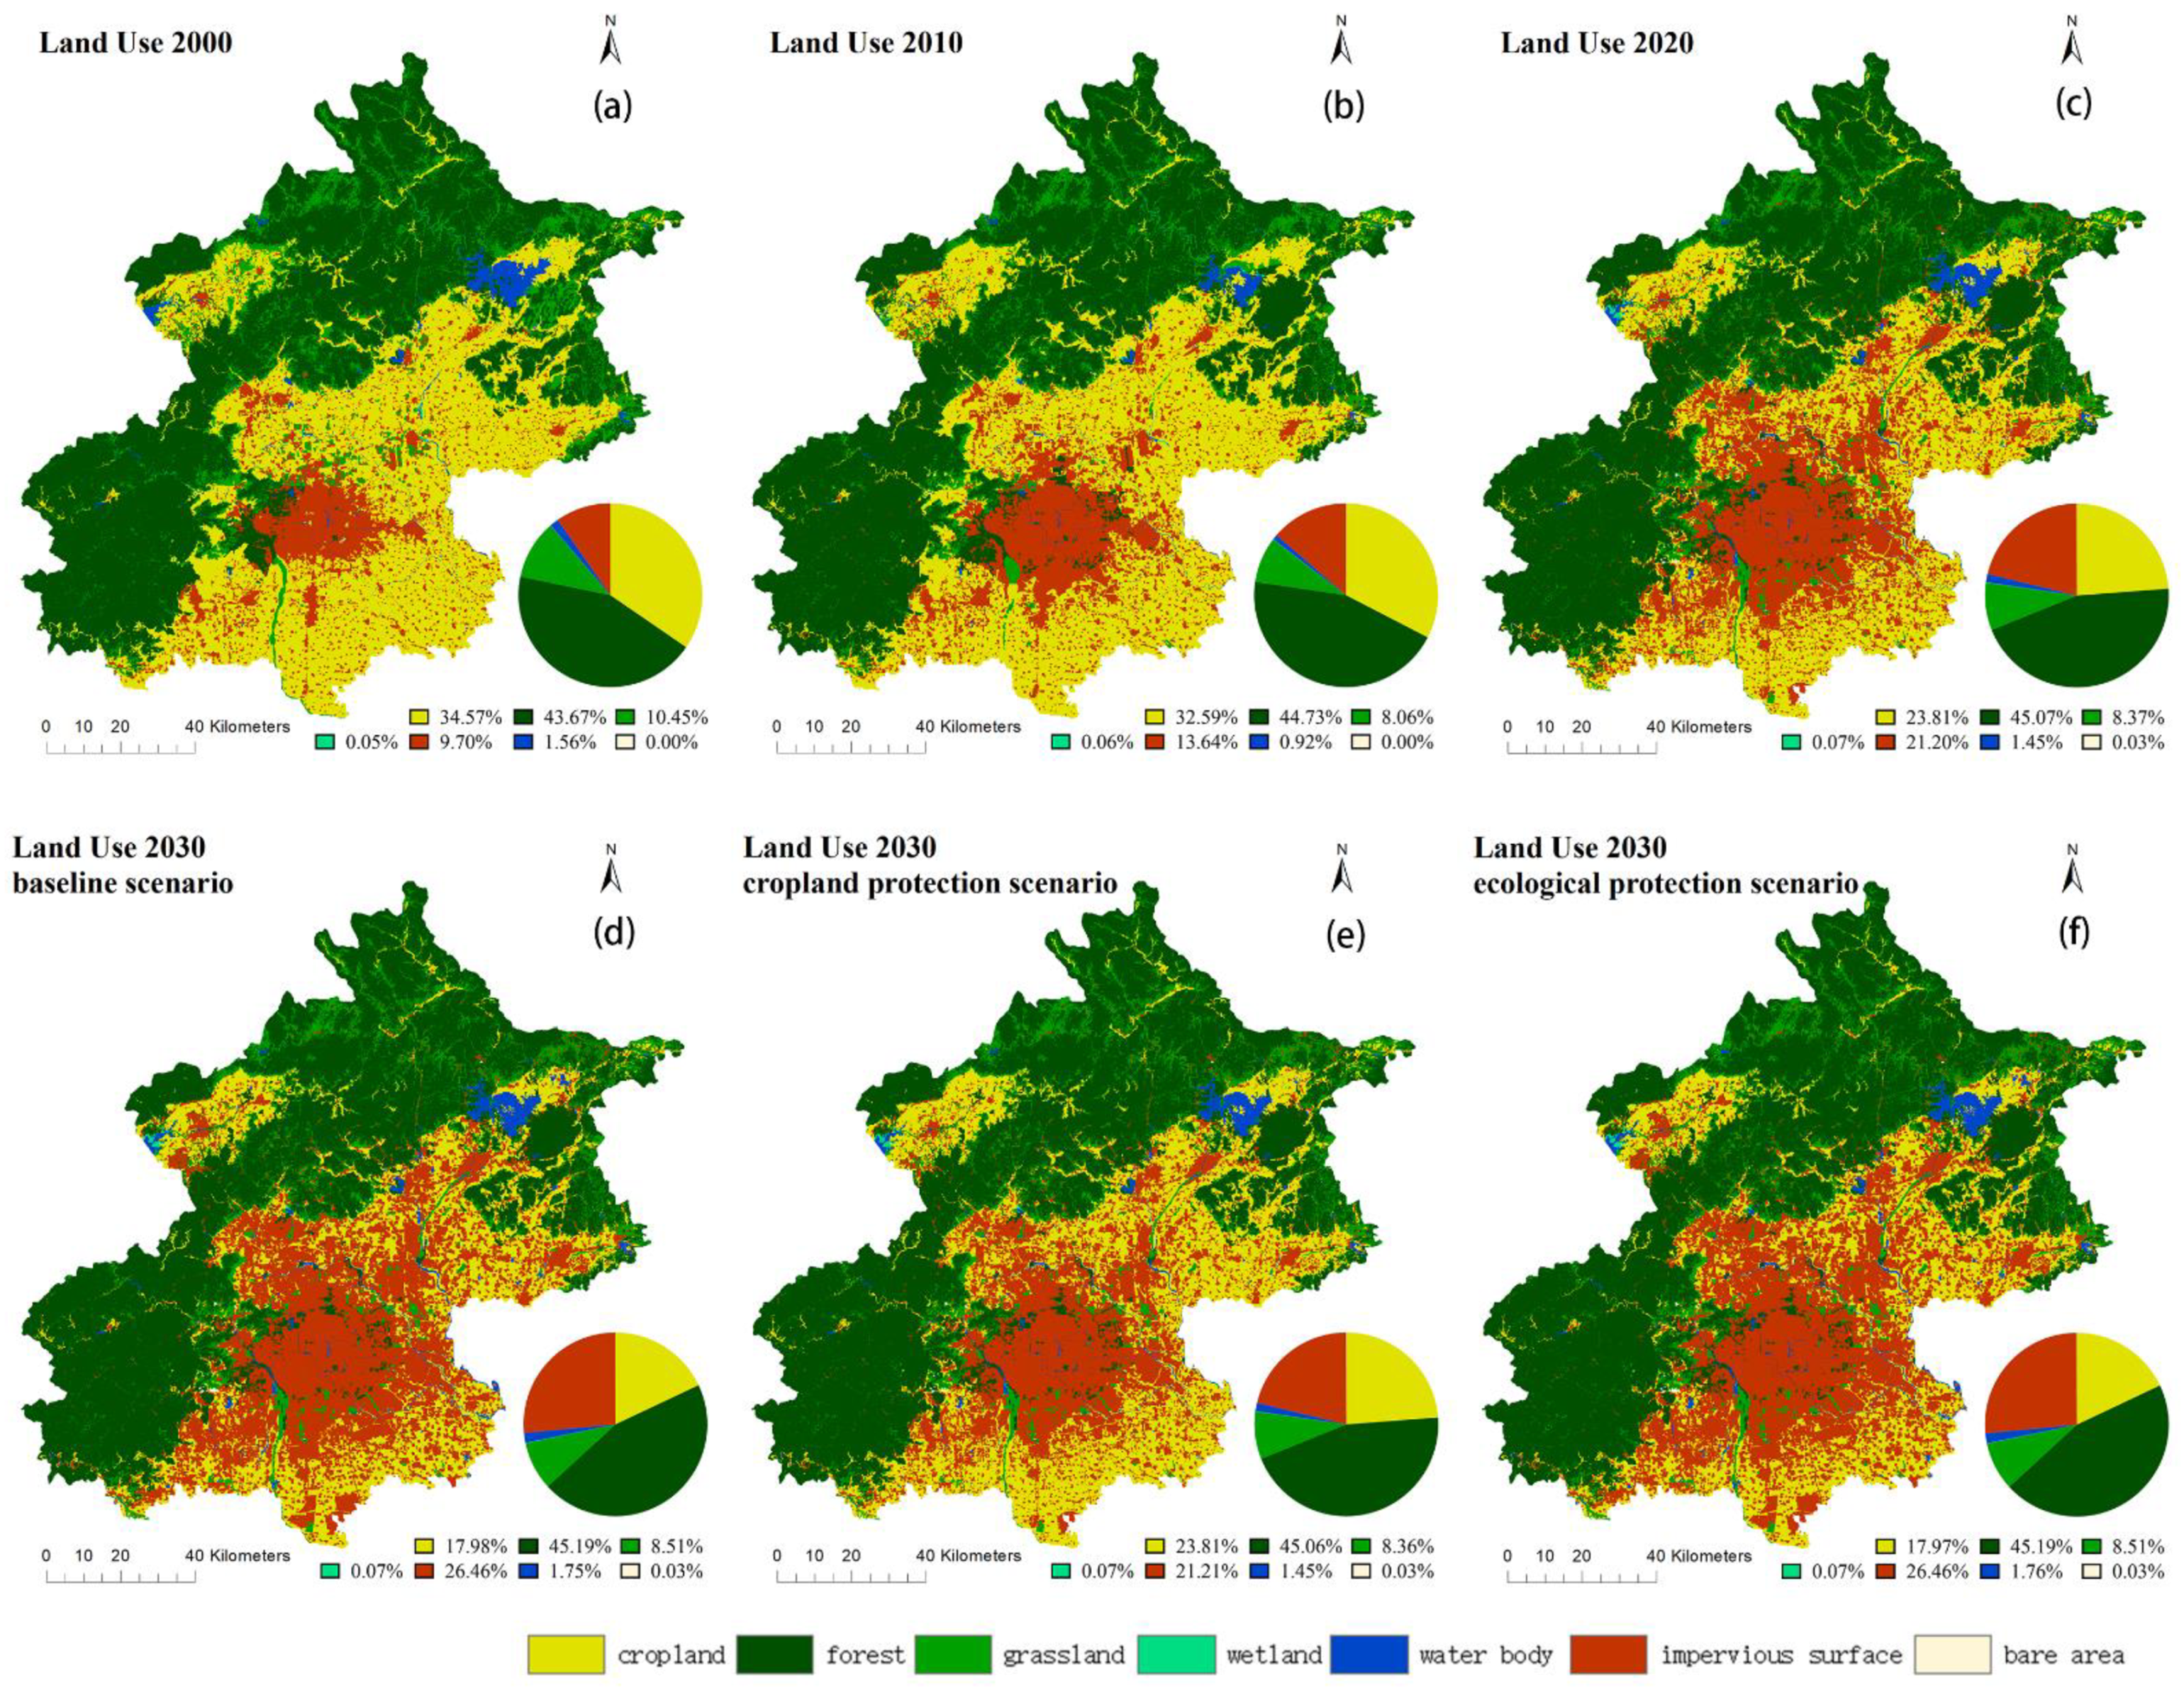
The change of impervious surface area is the most obvious under three different scenarios, which is the main feature of land use change in urban agglomeration in the future and shows the mode of expanding from the existing construction land to the periphery.
“The Master Plan of Beijing (2016–2035)” requires the total scale of the city’s construction land (impervious surface, including urban and rural construction land, special land, external transportation land and some water conservancy facilities) will be controlled about 3670 square kilometers by 2035. The area of impervious surface under cropland protection scenario (Figure 4d) meets the requirements, nevertheless, there is still a certain gap with the centralized construction area planned in the future, such as the northernmost areas around Beijing Daxing International Airport which should be developed and constructed. Comparing the three scenarios, the baseline scenario has the most severe urban expansion and has more negative impact on NPP; cropland protection scenario is the only scenario in which cropland is not transformed into impervious surface in a large area, but all kinds of land basically maintain the current situation, lacking the space for urbanization development; the ecological protection scenario has good protection for forest, wetland and water body, but there is a situation that a number of cropland is turned into impervious surface. Therefore, the land use planning of urban agglomeration should comprehensively consider the scenarios of ecological protection and cropland protection, which can not only ensure regional ecological security, but also improve the quality of cultivated land and protect food security. The change of land use in the process of urbanization in Beijing is representative. The land use transfer in Beijing is similar to that in Europe from 1950 to 1990: the proportion of forest and semi-natural areas increased slightly; artificial surfaces and agricultural areas changed greatly, in which the proportion of artificial surfaces increased and the proportion of agricultural land decreased [53]. The results suggested different processes are taking place in different kinds of land use: the mountains northwest of Beijing are dominated by forest management; intensification and urbanization are mainly encountered on the plain. However, the international community has increasingly recognized the importance of maintaining “sustainable” ecosystems to protect the environment on which we depend. The researchers explored the methods and tools of integrated landscape management for nature conservation, physical/territorial planning, watershed management, land arrangement projecting and forestry planning [54,55].

4.3. Effect on Vegetation Net Primary Productivity (NPP)

On the one hand, the change of land use from one type to another is often accompanied by a large amount of carbon exchange. For example, when forests with high biomass are converted into farmland, grassland or cities with low biomass, large amounts of CO2 will be released into the atmosphere which may cause a decrease in NPP of vegetation. The expansion of global croplands, pastures, plantations, and urban areas in recent decades generated considerable losses of biodiversity and also potentially undermined the capacity of ecosystems to sustain food production [
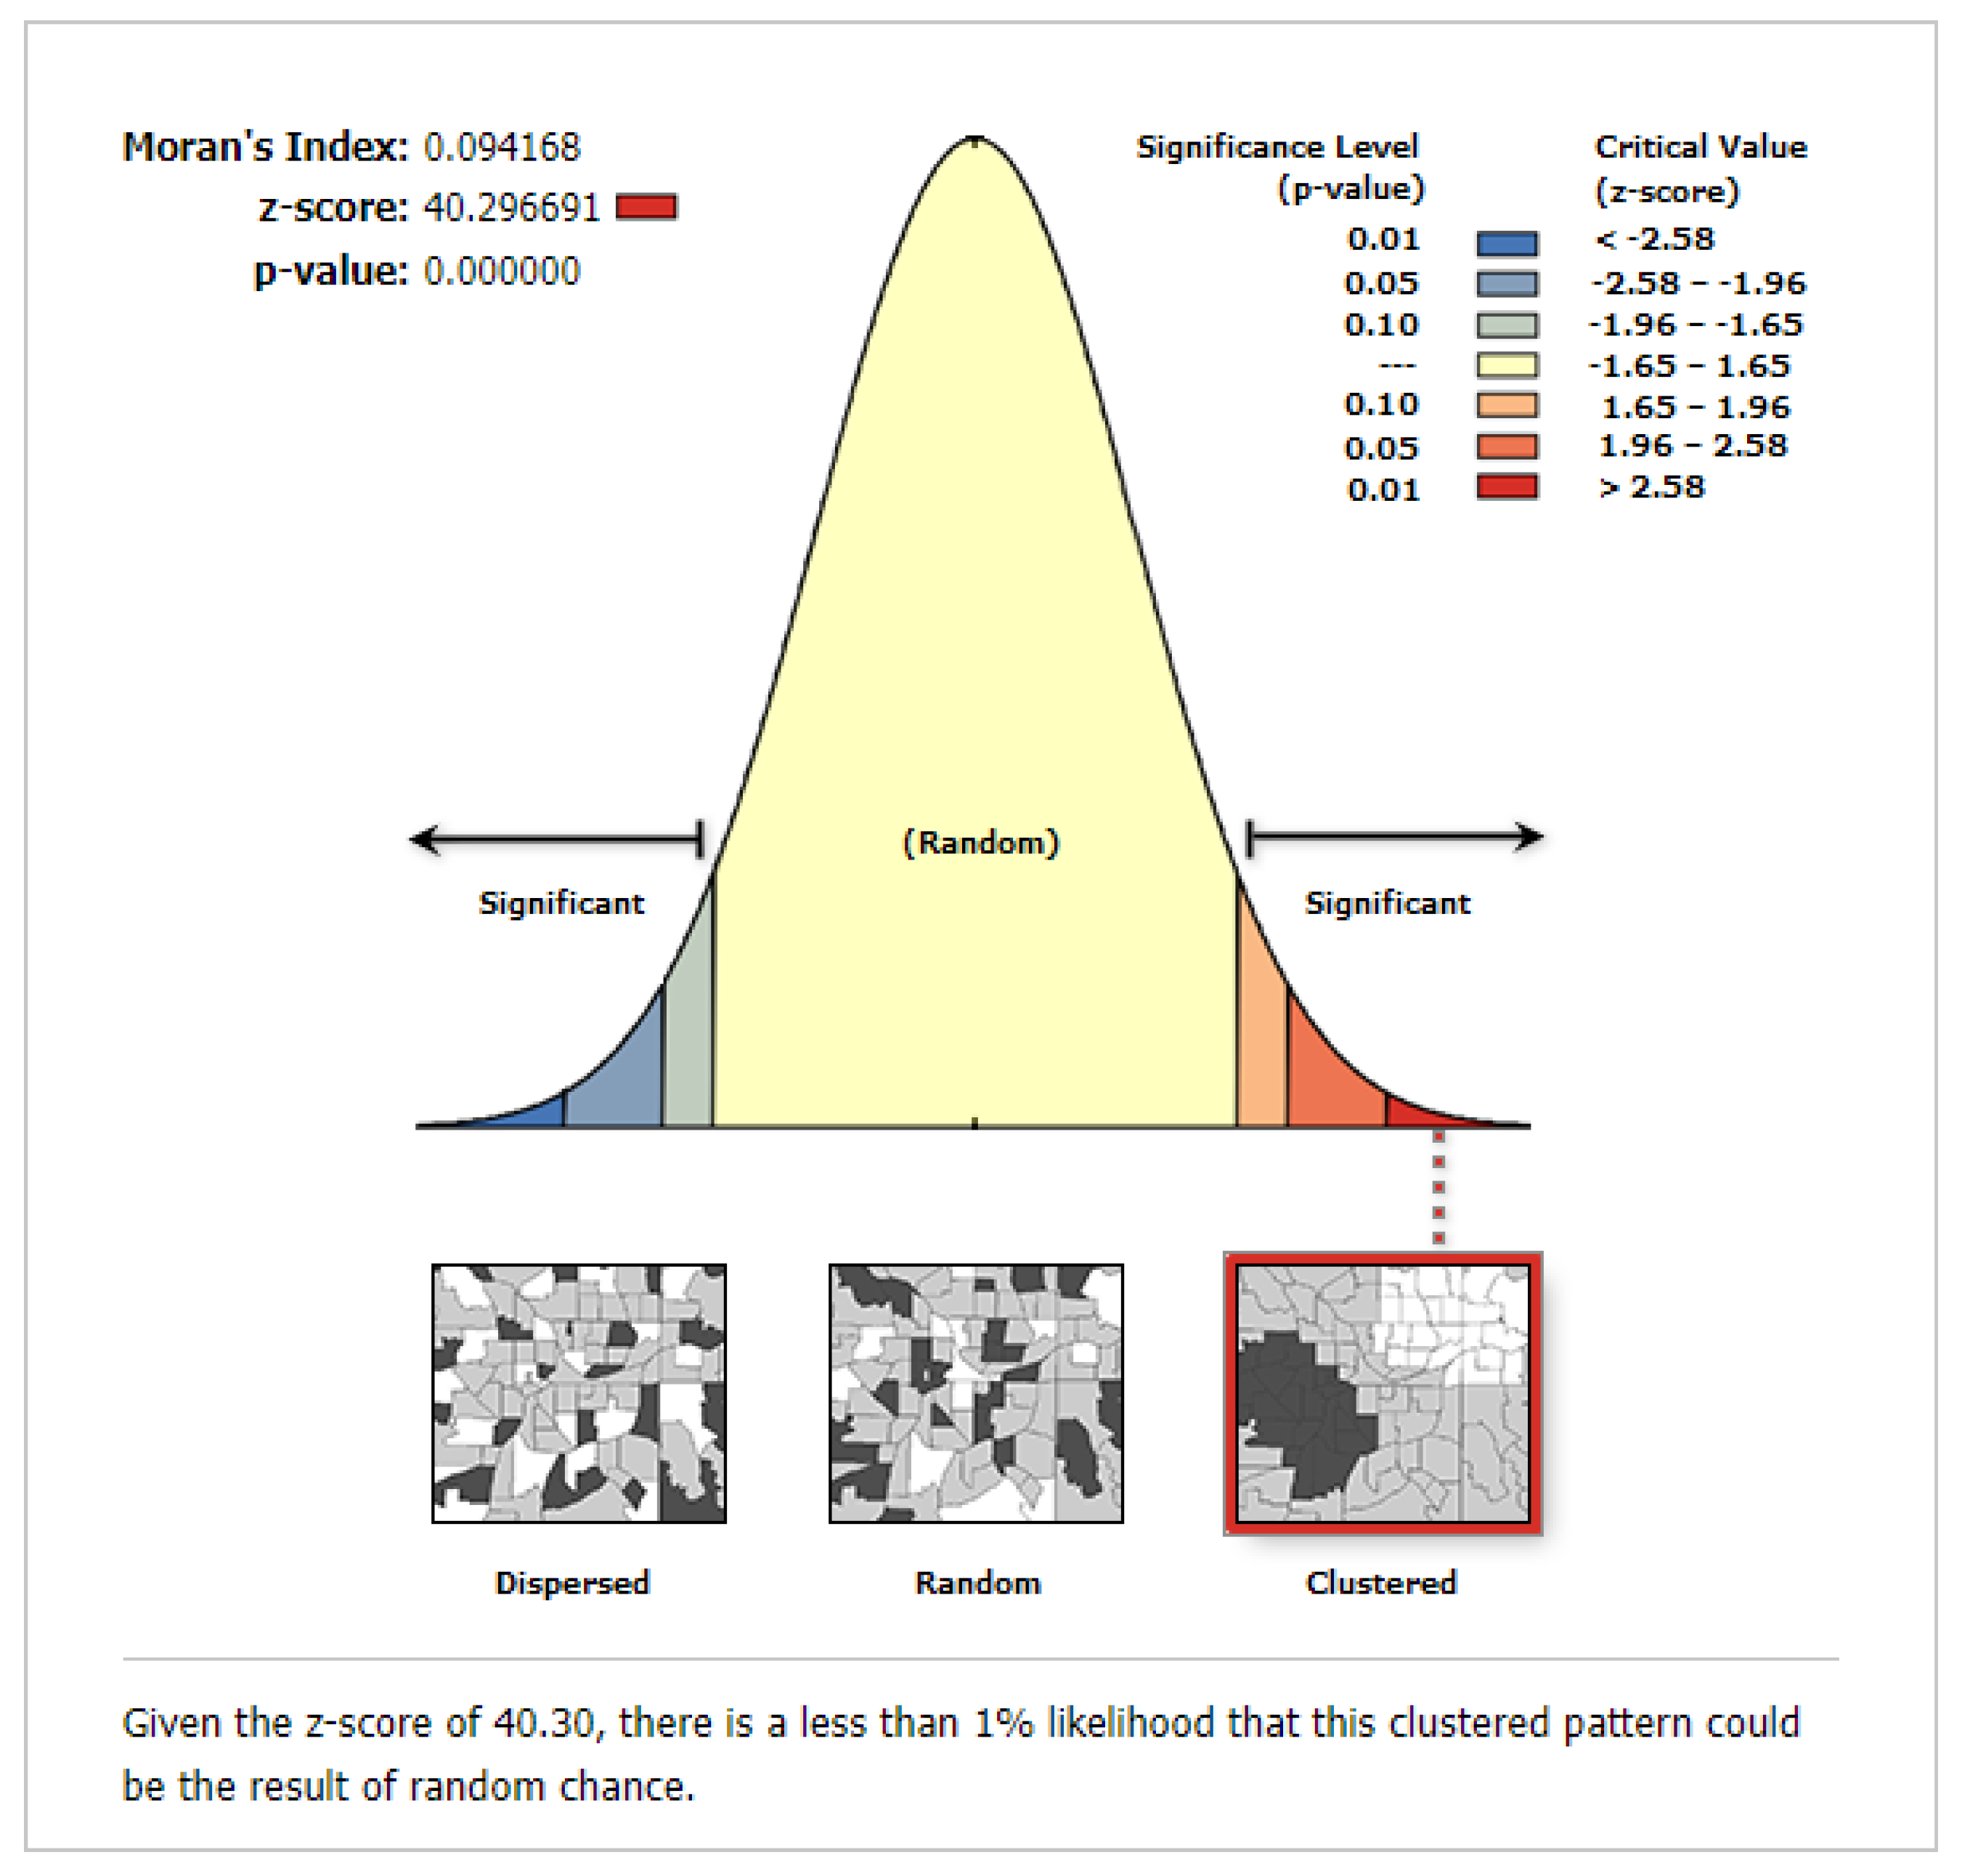
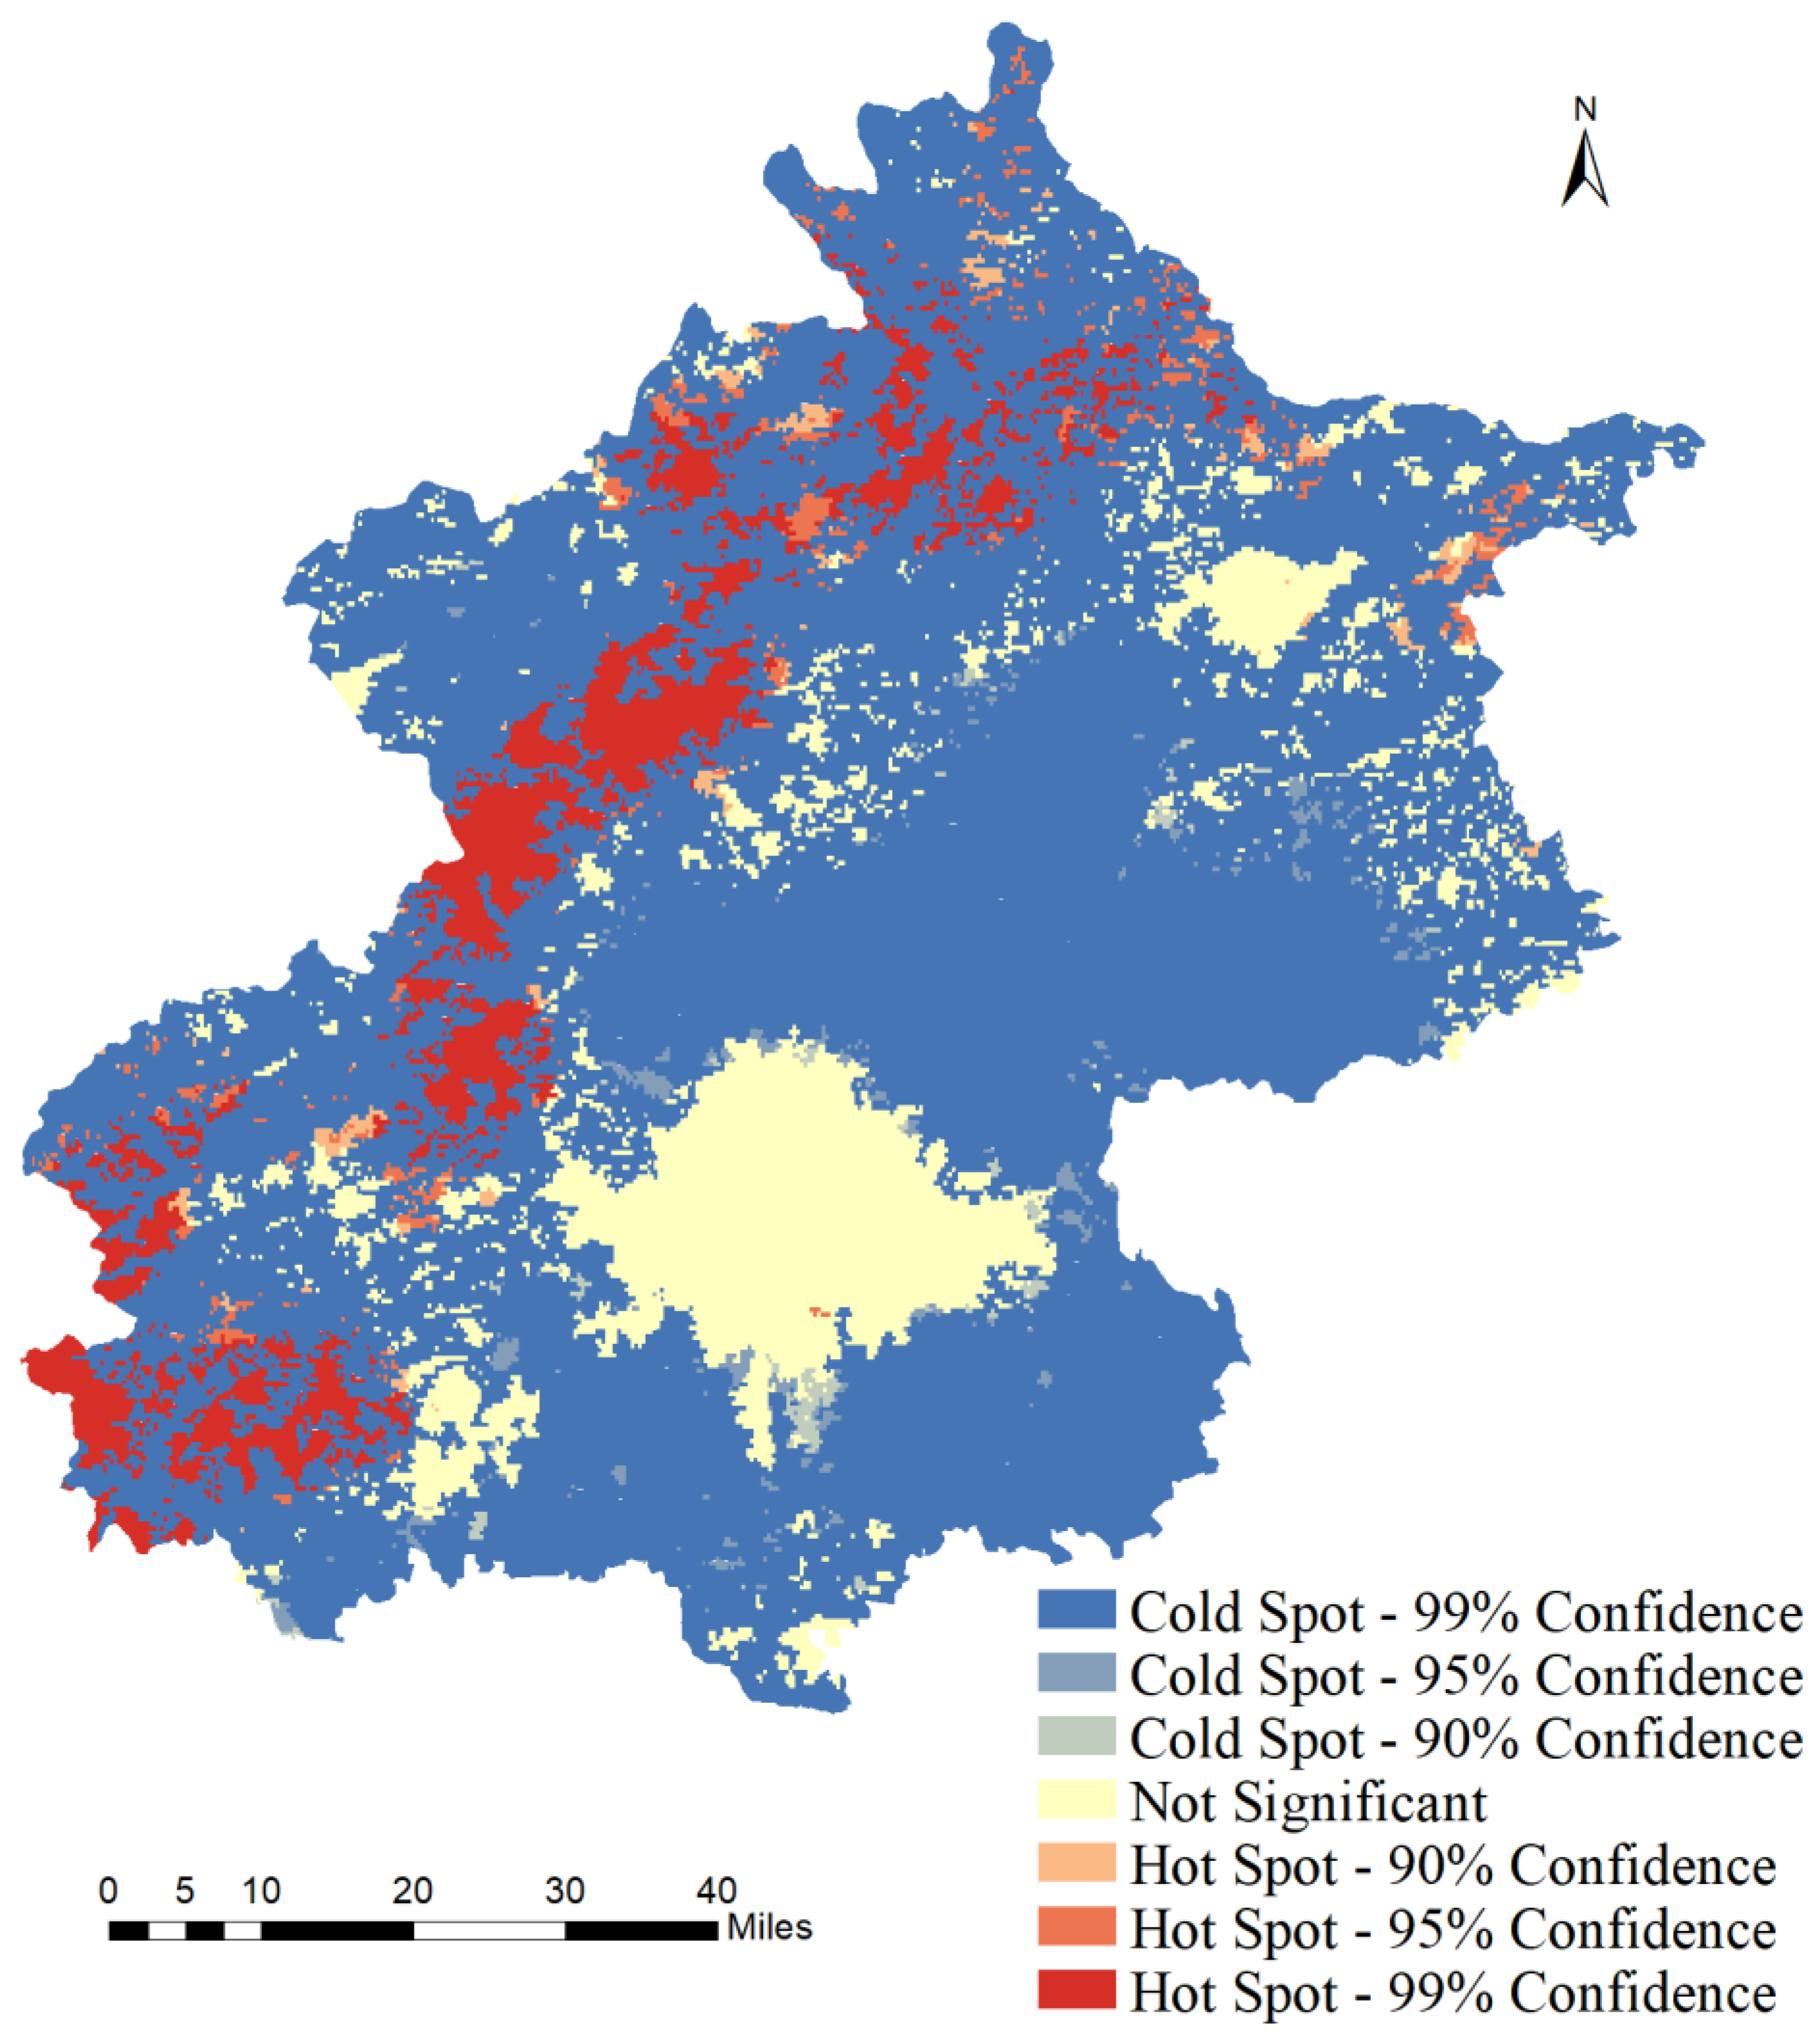
56]. in the process of industrialization in Beijing, a large amount of land is being changed into construction land, resulting in the increase of impermeable water surface. According to the result of hot spot analysis (Figure 7), when p < 0.01, the cold spots are mainly concentrated in the periphery of urban area and water area which may taking negative effects to NPP. On the other hand, in addition to natural factors, policy regulation and economic driving are also important causes of land use change and its spatial and temporal disparities. Typical examples of this are the abandonment of the former republics following the upheaval in Eastern Europe and the collapse of the Post-Soviet Union [57]. With the continuing development of the city, urban planning priorities have gradually changed, the urban greening intensity has increased, and the vegetation condition has steadily improved [58]. It can be seen from Table 5 that the main land types in the hot spot of vegetation NPP are forest and grassland which are mainly distributed in the northwest of Beijing. What is more, the transformation of land use types in hot spot mainly occurs in the transformation from grassland to forest about 21.816 km2. This is also a partial confirmation of the gradual improvement of vegetation cover in China, which may play a role in relieving the two main problems in Beijing: soil erosion and air pollution.
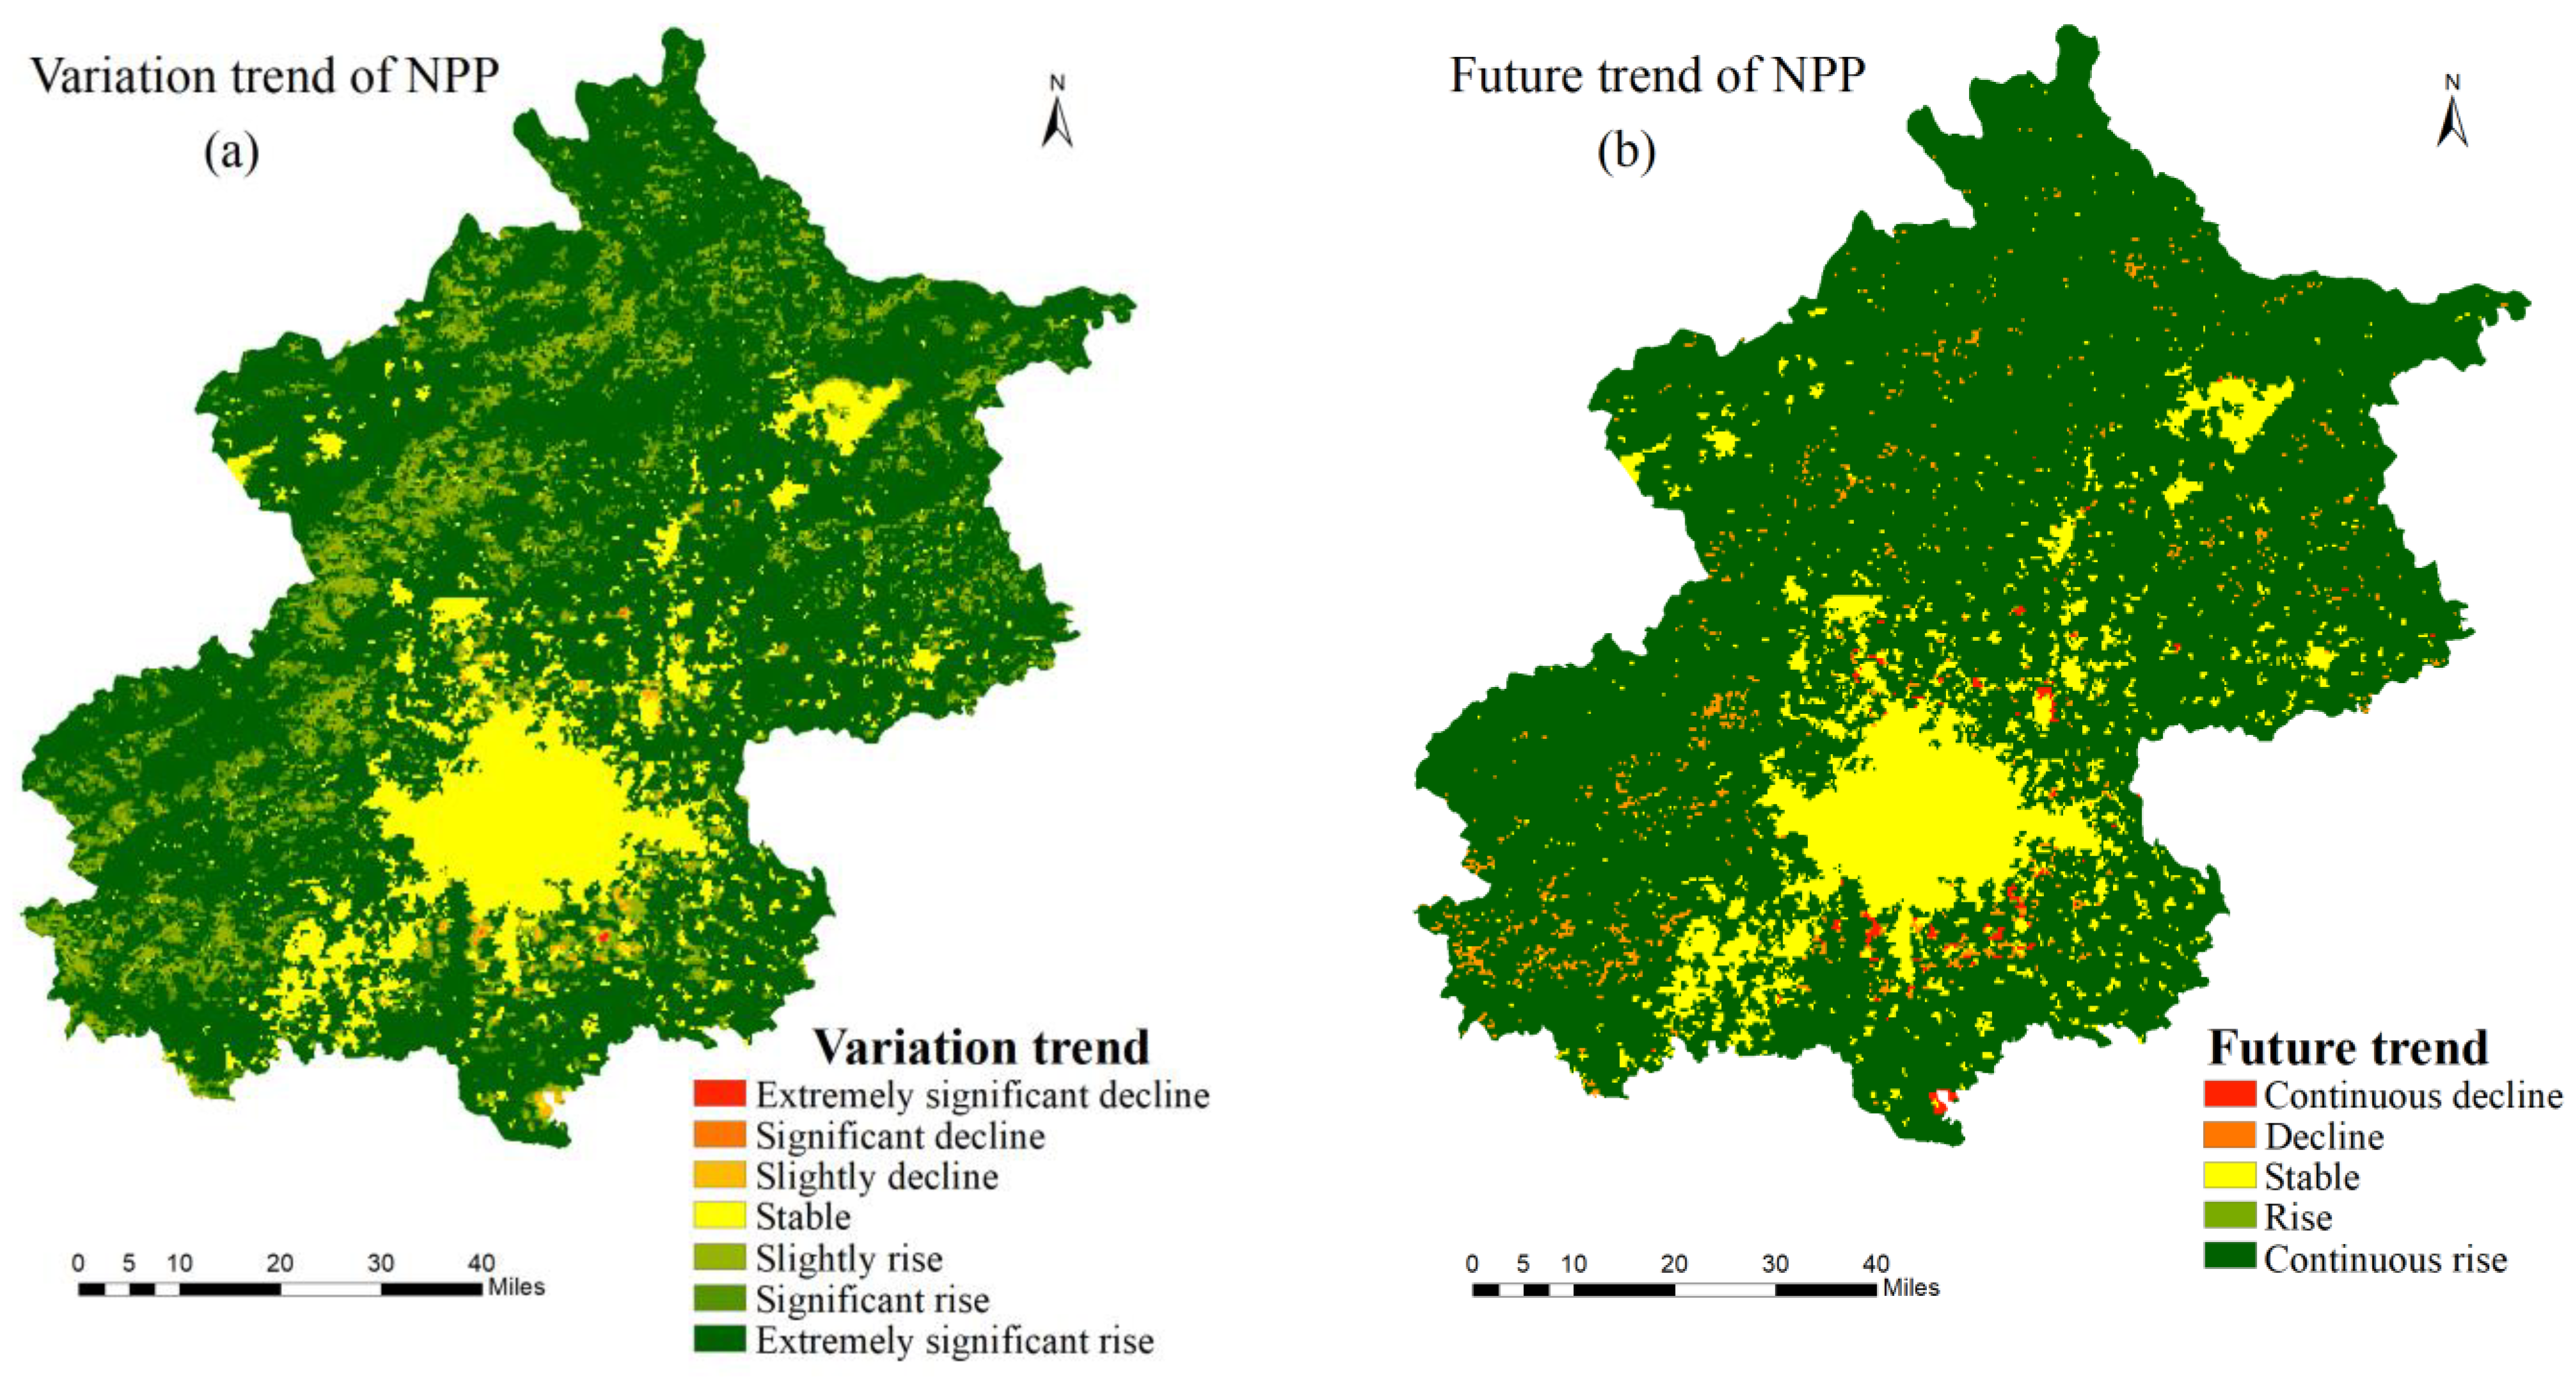
The results of this study (Figure 4 and Figure 5) are similar to those of Peng, J.’s study [59]: from 2001 to 2009, at first, with the expansion of urban areas, ecological land was gradually occupied which led to a decrease in NPP, and finally the NPP increases occurred in highly developed urban zones, which depended to some extent on the growth of green land, local eco-environmental management and urban planning. Therefore, NPP in Beijing showed an obvious upward trend with a series of ecological forestry projects from 2010 to 2020. As Beijing has been highly developed urban zones, the future land use will not change greatly in the next 10 years and the promotion of NPP will exist which is consistent with the predicted results (Figure 6b). In addition, continuous decline areas of the future development of NPP belong to the development area in this study and continuous rise areas account for 84.76%.
However, unlike Beijing, land cover and land use changed in some areas have reduced vegetation coverage and net ecosystem production [60,61]. The reason may be the local inaction to the forest which resulting in the decline of its area under the action of human activities. Therefore, the simulation of future development can provide a new basis for local planning, especially in similar countries and regions in the process of urbanization.
In 2019, Nature [62] released research reports pointing out that China alone accounts for 25% of the global net increase in leaf area with only 6.6% of global vegetated area and China is engineering programs to conserve and expand forests with the goal of mitigating land degradation, air pollution and climate change. Although the area of cold spot of NPP changes in Beijing is large (Figure 7), it has more forest cover and the government attaches importance to the protection of ecological environment. The overall NPP has maintained a stable rising level and will continue to rise (Figure 6).In the process of urbanization, the protection of forests and other natural resources in Beijing made the proportion of vegetation coverage increase, and the vegetation NPP also showed an upward trend, which has a certain reference significance for the future urban planning of developing countries. For example, in the development process of some cities, the proportion of vegetation and net ecosystem production decreased [60,61]. Beijing, which has a relatively rapid urbanization process, can provide important information for land use planning and sustainable urban development in similar urban expansion areas, especially in less developed countries. Enoguanbhor, E.C. and others observed mismatches between past/current land cover and the existing land use plan [61]. The mismatch was also between Beijing’s regional land use plan and unregulated urban expansion (“The Master Plan of Beijing (2004–2020)” requires that the scale of construction land in 2020 be controlled at 1650 square kilometers, but the actual area is 3475.76 square kilometers). Therefore, it is more necessary to carry out multi scenario future land use simulation to provide a scientific basis for urban planning. This paper can provide a way for cities in China and around the world to carry out spatial planning for sustainable development.

4.4. Limitations and Future Work

At present, some achievements have been made in the research of NPP estimation model, but there are a few studies on NPP prediction. Lixia, W. [22] coupled CASA and CA-Markov model, finding that comparing the estimate and predict values of NPP in 2015, the kappa coefficient reaches 0.8776 which indicates that the coupled model has high accuracy and good applicability for NPP prediction. This study also attempted to use the coupled model (CASA and PLUS model) to predict the values of NPP. NPP was divided into 5 types, 7 types and 10 types as land use types, and the kappa coefficients are 0.584571, 0.524487 and 0.508822, respectively, which only achieved the level of moderate consistency. In the next step, we will try to improve the accuracy of the coupling model or study a better model to predict the value of NPP. Moreover, the influencing factors of NPP are relatively complex, such as the combination of water and heat, the physiological and ecological characteristics of vegetation, and there are also interactions among various climate factors. Therefore, it is required in the following study to take multiple driving factors into account predicting spatiotemporal variations of NPP.
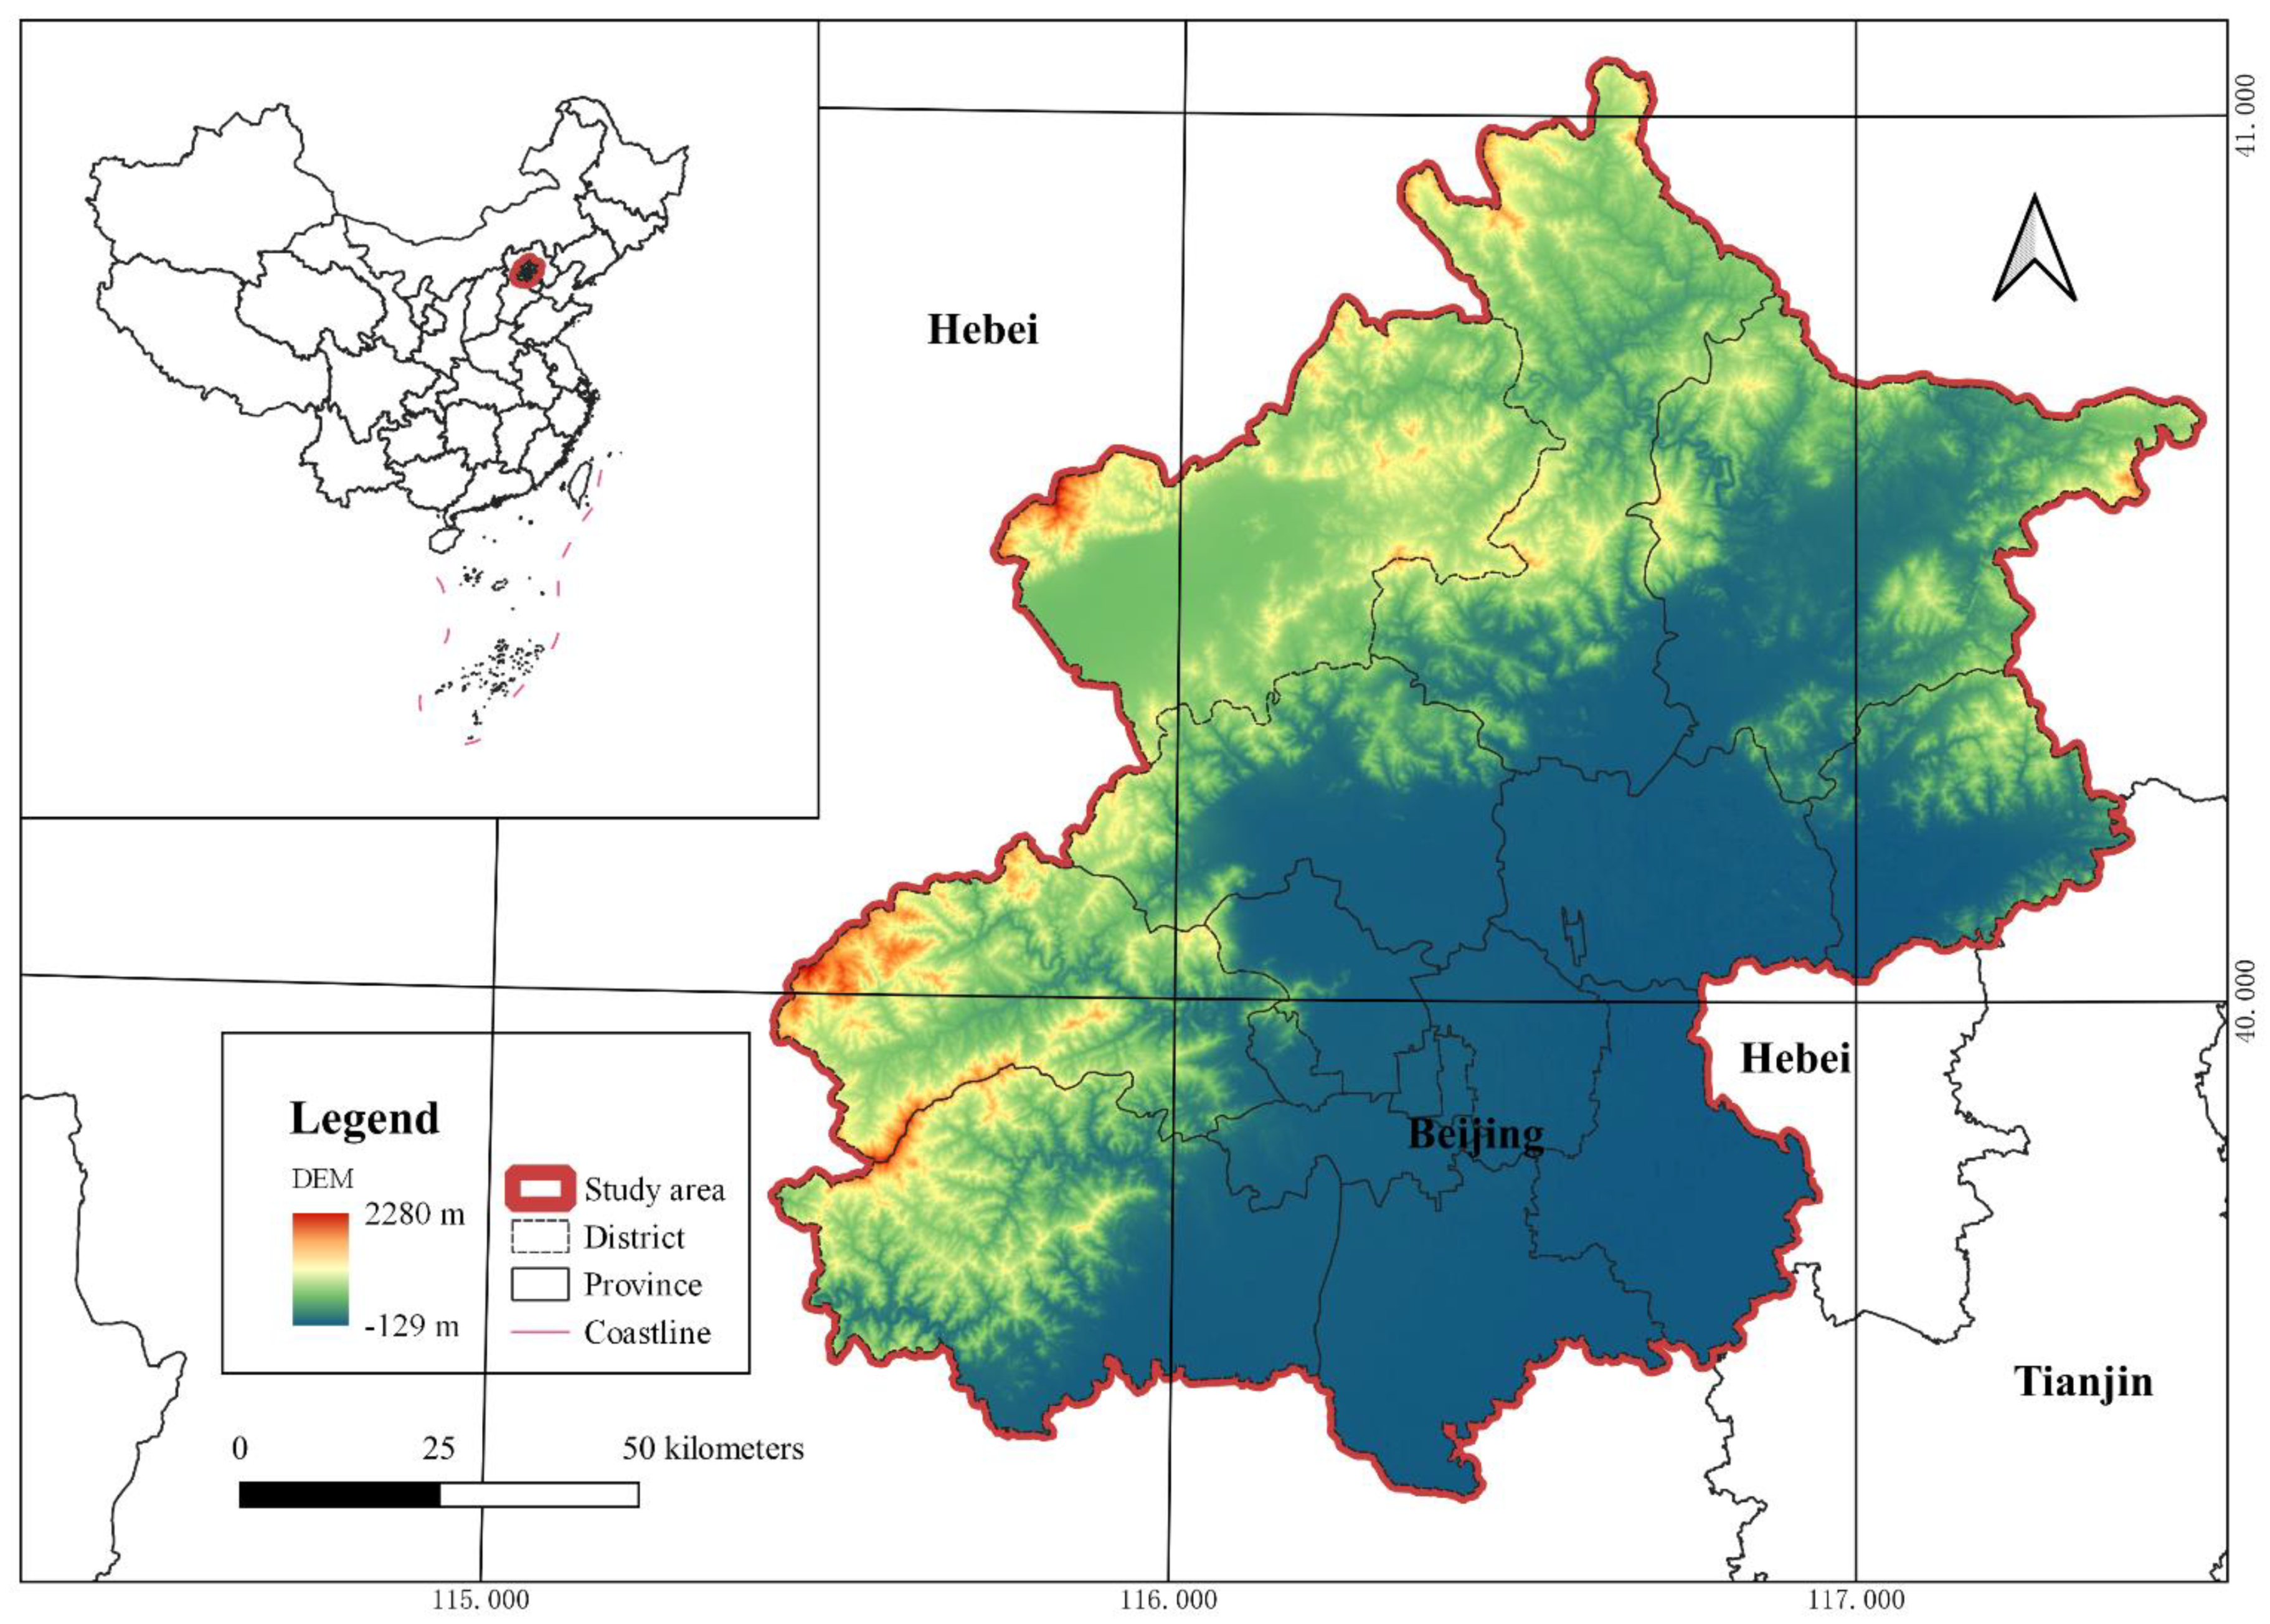
Our future work plan will also appropriately expand the spatial scale of the research. The research will not only be limited to the better developed Beijing area, but also include the areas with large differences in development, such as Hebei Province and Tianjin city, China.

5. Conclusions

Taking Beijing as an example, this research first used the PLUS model and Markov chain model to project the land use for 2030 under three different scenarios based on physiographic driving factors, transportation driving factors and socioeconomic driving factors. These three different scenarios are the baseline scenario, cultivated land protection scenario and ecological protection scenario. Then, the Theil-Sen Median trend analysis and Mann–Kendall test were used to quantify and analyze the spatiotemporal changes in NPP (2000–2020). The R/S analysis and Hurst index method predict the future development trend of NPP according to the past trend of long time series data. Finally study the relationship between the cold and hot spots of land use and the change of NPP and verify whether it is consistent with the simulation results. The conclusions are divided into four specific sections:
(1)
From 2000 to 2030, the main land use type in Beijing is forest whose proportion has been increasing. The future land use change will focus on cropland and impervious surface. Among the three scenarios, the cropland protection scenario is the only scenario in which cropland will not be transformed into impervious surface in a large area; the ecological protection scenario has good protection for forest land, wetland and water body, and the area basically does not change; in the baseline scenario, the land use change is the largest, and the area of impervious surface increases the most.
(2)
NPP of vegetation fluctuated and increased from 2000 to 2020 and the rising area accounted for 86.77% of the total area. The future change of the vegetation NPP showed a rise trend on the whole (rise areas and continuous rise areas account for 0.04% and 84.76%, respectively). The NPP of Beijing showed a strong improvement trend and will maintain.
(3)
The main land types in the hot spot areas of vegetation NPP are forest and grassland, and the main transformation of land use types is from grassland to forest. The cold spot areas are mainly concentrated in the periphery of urban areas and water areas.
(4)
The NPP increases occurred in highly developed urban zones with the growth of green land and the right ecological management and urban planning.

Author Contributions

Conceptualization, Y.C., J.W. and N.X.; methodology, Y.C., L.S. and J.X.; software, Y.C. and J.X.; validation, Y.C.; formal analysis, Y.C., L.S. and J.X.; investigation, Y.C., J.X. and L.S.; resources, Y.C. and L.S.; data curation, Y.C.; writing—original draft preparation, Y.C.; writing—review and editing, L.S. and J.W.; visualization, Y.C.; supervision, J.W.; project administration, J.W.; funding acquisition, J.W. All authors have read and agreed to the published version of the manuscript.

Funding

This research was funded by the National Natural Science Foundation of China (Grant No.42171329, No.42071342, No.31870713) and the Natural Science Foundation of Beijing, China (Grant No.8222069, No 8222052).

Institutional Review Board Statement

Not applicable.

Informed Consent Statement

Not applicable.

Data Availability Statement

Not applicable.

Acknowledgments

We are grateful to the undergraduate students and staff of the Laboratory of Forest Management and “3S” technology, Beijing Forestry University.

Conflicts of Interest

The authors declare no conflict of interest. The funders had no role in the design of the study; in the collection, analyses, or interpretation of data; in the writing of the manuscript; or in the decision to publish the results.

References

  1. Mueller, T.; Dressler, G.; Tucker, C.J.; Pinzon, J.E.; Leimgruber, P.; Dubayah, R.O.; Hurtt, G.C.; Böhning-Gaese, K.; Fagan, W.F. Human land-use practices lead to global long-term increases in photosynthetic capacity. Remote Sens. 2014, 6, 5717–5731. [Google Scholar] [CrossRef] [Green Version]
  2. Imhoff, M.L.; Bounoua, L.; DeFries, R.; Lawrence, W.T.; Stutzer, D.; Tucker, C.J.; Ricketts, T. The consequences of urban land transformation on net primary productivity in the United States. Remote Sens. Environ. 2004, 89, 434–443. [Google Scholar] [CrossRef]
  3. Pei, F.; Li, X.; Liu, X.; Wang, S.; He, Z. Assessing the differences in net primary productivity between pre-and post-urban land development in China. Agric. For. Meteorol. 2013, 171, 174–186. [Google Scholar] [CrossRef]
  4. Yin, L.; Dai, E.; Zheng, D.; Wang, Y.; Ma, L.; Tong, M. What drives the vegetation dynamics in the Hengduan Mountain region, southwest China: Climate change or human activity? Ecol. Indic. 2020, 112, 106013. [Google Scholar] [CrossRef]
  5. Kim, J.H.; Park, S.; Kim, S.H.; Lee, E.J. Long-Term Land Cover Changes in the Western Part of the Korean Demilitarized Zone. Land 2021, 10, 708. [Google Scholar] [CrossRef]
  6. Wang, X.; Li, F.; Gao, R.; Luo, Y.; Liu, T. Predicted NPP spatiotemporal variations in a semiarid steppe watershed for historical and trending climates. J. Arid Environ. 2014, 104, 67–79. [Google Scholar] [CrossRef]
  7. Li, X.; Luo, Y.; Wu, J. Decoupling Relationship between Urbanization and Carbon Sequestration in the Pearl River Delta from 2000 to 2020. Remote Sens. 2022, 14, 526. [Google Scholar] [CrossRef]
  8. Field, C.B.; Behrenfeld, M.J.; Randerson, J.T.; Falkowski, P. Primary production of the biosphere: Integrating terrestrial and oceanic components. Science 1998, 281, 237–240. [Google Scholar] [CrossRef] [PubMed] [Green Version]
  9. He, C.; Liu, Z.; Xu, M.; Ma, Q.; Dou, Y. Urban expansion brought stress to food security in China: Evidence from decreased cropland net primary productivity. Sci. Total Environ. 2017, 576, 660–670. [Google Scholar] [CrossRef] [PubMed]
  10. Liu, X.; Pei, F.; Wen, Y.; Li, X.; Wang, S.; Wu, C.; Cai, Y.; Wu, J.; Chen, J.; Feng, K. Global urban expansion offsets climate-driven increases in terrestrial net primary productivity. Nat. Commun. 2019, 10, 5558. [Google Scholar] [CrossRef] [PubMed] [Green Version]
  11. Nunes, A.N.; De Almeida, A.C.; Coelho, C.O. Impacts of land use and cover type on runoff and soil erosion in a marginal area of Portugal. Appl. Geogr. 2011, 31, 687–699. [Google Scholar] [CrossRef]
  12. Sun, W.; Song, X.; Mu, X.; Gao, P.; Wang, F.; Zhao, G. Spatiotemporal vegetation cover variations associated with climate change and ecological restoration in the Loess Plateau. Agric. For. Meteorol. 2015, 209, 87–99. [Google Scholar] [CrossRef]
  13. Yan, M.; Xue, M.; Zhang, L.; Tian, X.; Chen, B.; Dong, Y. A Decade’s Change in Vegetation Productivity and Its Response to Climate Change over Northeast China. Plants 2021, 10, 821. [Google Scholar] [CrossRef] [PubMed]
  14. Potter, C.S.; Randerson, J.T.; Field, C.B.; Matson, P.A.; Vitousek, P.M.; Mooney, H.A.; Klooster, S.A. Terrestrial ecosystem production: A process model based on global satellite and surface data. Glob. Biogeochem. Cycles 1993, 7, 811–841. [Google Scholar] [CrossRef]
  15. Ichii, K.; Hashimoto, H.; Nemani, R.; White, M. Modeling the interannual variability and trends in gross and net primary productivity of tropical forests from 1982 to 1999. Glob. Planet. Change 2005, 48, 274–286. [Google Scholar] [CrossRef]
  16. Liu, L.; Peng, S.; AghaKouchak, A.; Huang, Y.; Li, Y.; Qin, D.; Xie, A.; Li, S. Broad consistency between satellite and vegetation model estimates of net primary productivity across global and regional scales. J. Geophys. Res. Biogeosci. 2018, 123, 3603–3616. [Google Scholar] [CrossRef]
  17. Rong, T.; Long, L.H. Quantitative Assessment of NPP Changes in the Yellow River Source Area from 2001 to 2017. In Proceedings of the IOP Conference Series: Earth and Environmental Science Surakarta, Surakarta, Indonesia, 24–25 August 2021; p. 012002. [Google Scholar]
  18. Brilli, L.; Lugato, E.; Moriondo, M.; Gioli, B.; Toscano, P.; Zaldei, A.; Leolini, L.; Cantini, C.; Caruso, G.; Gucci, R. Carbon sequestration capacity and productivity responses of Mediterranean olive groves under future climates and management options. Mitig. Adapt. Strateg. Glob. Change 2019, 24, 467–491. [Google Scholar] [CrossRef]
  19. Sun, G.; Mu, M. Assessing the characteristics of net primary production due to future climate change and CO2 under RCP4. 5 in China. Ecol. Complex. 2018, 34, 58–68. [Google Scholar] [CrossRef]
  20. Li, Y.; Qin, Y. The Response of Net Primary Production to Climate Change: A Case Study in the 400 mm Annual Precipitation Fluctuation Zone in China. Int. J. Environ. Res. Public Health 2019, 16, 1497. [Google Scholar] [CrossRef] [Green Version]
  21. Li, Y.; Xie, Z.; Qin, Y.; Zheng, Z. Estimating relations of vegetation, climate change, and human activity: A case study in the 400 mm annual precipitation fluctuation zone, China. Remote Sens. 2019, 11, 1159. [Google Scholar] [CrossRef] [Green Version]
  22. Lixia, W.; Haixu, Z.; Zhao, L.; Shuangcheng, Z.; Jinling, K.; Liqian, G. A Coupling Model of Net Primary Productivity Pattern Simulation and Prediction. Geomat. Inf. Sci. Wuhan Univ. 2021, 1–12. [Google Scholar] [CrossRef]
  23. Saputra, M.H.; Lee, H.S. Prediction of land use and land cover changes for north sumatra, indonesia, using an artificial-neural-network-based cellular automaton. Sustainability 2019, 11, 3024. [Google Scholar] [CrossRef] [Green Version]
  24. Hamad, R.; Balzter, H.; Kolo, K. Predicting land use/land cover changes using a CA-Markov model under two different scenarios. Sustainability 2018, 10, 3421. [Google Scholar] [CrossRef] [Green Version]
  25. Singh, S.K.; Mustak, S.; Srivastava, P.K.; Szabó, S.; Islam, T. Predicting spatial and decadal LULC changes through cellular automata Markov chain models using earth observation datasets and geo-information. Environ. Processes 2015, 2, 61–78. [Google Scholar] [CrossRef] [Green Version]
  26. Kang, J.; Fang, L.; Li, S.; Wang, X. Parallel cellular automata Markov model for land use change prediction over MapReduce framework. ISPRS Int. J. Geo Inf. 2019, 8, 454. [Google Scholar] [CrossRef] [Green Version]
  27. Verburg, P.; Overmars, K. Dynamic Simulation of Land-use Change Trajectories with the CLUE-s Model. In Modelling Land-Use Change; Springer: Dordrecht, The Netherlands, 2007; pp. 321–337. [Google Scholar]
  28. Verburg, P.H.; Soepboer, W.; Veldkamp, A.; Limpiada, R.; Espaldon, V.; Mastura, S.S. Modeling the spatial dynamics of regional land use: The CLUE-S model. Environ. Manag. 2002, 30, 391–405. [Google Scholar] [CrossRef] [PubMed]
  29. Jiang, W.; Chen, Z.; Lei, X.; Jia, K.; Wu, Y. Simulating urban land use change by incorporating an autologistic regression model into a CLUE-S model. J. Geogr. Sci. 2015, 25, 836–850. [Google Scholar] [CrossRef] [Green Version]
  30. Lin, W.; Sun, Y.; Nijhuis, S.; Wang, Z. Scenario-based flood risk assessment for urbanizing deltas using future land-use simulation (FLUS): Guangzhou Metropolitan Area as a case study. Sci Total Env. 2020, 739, 139899. [Google Scholar] [CrossRef] [PubMed]
  31. Liang, X.; Guan, Q.; Clarke, K.C.; Liu, S.; Wang, B.; Yao, Y. Understanding the drivers of sustainable land expansion using a patch-generating land use simulation (PLUS) model: A case study in Wuhan, China. Comput. Environ. Urban Syst. 2021, 85, 101569. [Google Scholar] [CrossRef]
  32. Zhang, S.; Zhong, Q.; Cheng, D.; Xu, C.; Chang, Y.; Lin, Y.; Li, B. Landscape ecological risk projection based on the PLUS model under the localized shared socioeconomic pathways in the Fujian Delta region. Ecol. Indic. 2022, 136, 108642. [Google Scholar] [CrossRef]
  33. Sohl, T.L.; Claggett, P.R. Clarity versus complexity: Land-use modeling as a practical tool for decision-makers. J. Environ. Manag. 2013, 129, 235–243. [Google Scholar] [CrossRef] [PubMed]
  34. Liu, X.; Liang, X.; Li, X.; Xu, X.; Ou, J.; Chen, Y.; Li, S.; Wang, S.; Pei, F. A future land use simulation model (FLUS) for simulating multiple land use scenarios by coupling human and natural effects. Landsc. Urban Plan. 2017, 168, 94–116. [Google Scholar] [CrossRef]
  35. Ouyang, X.; He, Q.; Zhu, X. Simulation of Impacts of Urban Agglomeration Land Use Change on Ecosystem Services Value under Multi-Scenarios: Case Study in Changsha-Zhuzhou-Xiangtan Urban agglomeration. Econ. Geogr 2020, 40, 93–102. [Google Scholar]
  36. Arnold, C.L., Jr.; Gibbons, C.J. Impervious surface coverage: The emergence of a key environmental indicator. J. Am. Plan. Assoc. 1996, 62, 243–258. [Google Scholar] [CrossRef]
  37. Jun, C.; Ban, Y.; Li, S. Open access to Earth land-cover map. Nature 2014, 514, 434. [Google Scholar] [CrossRef] [Green Version]
  38. Chen, F.; Chen, J.; Wu, H.; Hou, D.; Zhang, W.; Zhang, J.; Zhou, X.; Chen, L. A landscape shape index-based sampling approach for land cover accuracy assessment. Sci. China Earth Sci. 2016, 59, 2263–2274. [Google Scholar] [CrossRef]
  39. Chen, J.; Zhu, X.; Imura, H.; Chen, X. Consistency of accuracy assessment indices for soft classification: Simulation analysis. ISPRS J. Photogramm. Remote Sens. 2010, 65, 156–164. [Google Scholar] [CrossRef]
  40. Xie, H.; Tong, X.; Meng, W.; Liang, D.; Wang, Z.; Shi, W. A multilevel stratified spatial sampling approach for the quality assessment of remote-sensing-derived products. IEEE J. Sel. Top. Appl. Earth Obs. Remote Sens. 2015, 8, 4699–4713. [Google Scholar] [CrossRef]
  41. Liao, W.; Liu, X.; Xu, X.; Chen, G.; Liang, X.; Zhang, H.; Li, X. Projections of land use changes under the plant functional type classification in different SSP-RCP scenarios in China. Sci. Bull. 2020, 65, 1935–1947. [Google Scholar] [CrossRef]
  42. Running, S.; Zhao, M. MODIS/Terra Net Primary Production Gap-Filled Yearly L4 Global 500m SIN Grid V006; 2019. V061; 2021. Available online: https://lpdaac.usgs.gov/products/mod17a3hgfv061/ (accessed on 10 January 2021).
  43. Wang, B.; Liao, J.; Zhu, W.; Qiu, Q.; Wang, L.; Tang, L. The weight of neighborhood setting of the FLUS model based on a historical scenario: A case study of land use simulation of urban agglomeration of the Golden Triangle of Southern Fujian in 2030. Acta Ecol. Sin 2019, 39, 4284–4298. [Google Scholar]
  44. Yuan, L.; Jiang, W.; Shen, W.; Liu, Y.; Wang, W.; Tao, L.; Zheng, H.; Liu, X. The spatio-temporal variations of vegetation cover in the Yellow River Basin from 2000 to 2010. Acta Ecol. Sin. 2013, 33, 7798–7806. [Google Scholar]
  45. Hurst, H.E. Long-term storage capacity of reservoirs. Trans. Am. Soc. Civ. Eng. 1951, 116, 770–799. [Google Scholar] [CrossRef]
  46. Rehman, S. Study of Saudi Arabian climatic conditions using Hurst exponent and climatic predictability index. Chaos Solitons Fractals 2009, 39, 499–509. [Google Scholar] [CrossRef]
  47. Ray, R.; Khondekar, M.H.; Ghosh, K.; Bhattacharjee, A.K. Scaling and nonlinear behaviour of daily mean temperature time series across India. Chaos Solitons Fractals 2016, 84, 9–14. [Google Scholar] [CrossRef]
  48. Noce, S.; Collalti, A.; Valentini, R.; Santini, M. Hot spot maps of forest presence in the Mediterranean basin. Iforest Biogeosci. For. 2016, 9, 766. [Google Scholar] [CrossRef] [Green Version]
  49. Jana, M.; Sar, N. Modeling of hotspot detection using cluster outlier analysis and Getis-Ord Gi* statistic of educational development in upper-primary level, India. Modeling Earth Syst. Environ. 2016, 2, 1–10. [Google Scholar] [CrossRef] [Green Version]
  50. Shariati, M.; Mesgari, T.; Kasraee, M.; Jahangiri-Rad, M. Spatiotemporal analysis and hotspots detection of COVID-19 using geographic information system (March and April, 2020). J. Environ. Health Sci. Eng. 2020, 18, 1499–1507. [Google Scholar] [CrossRef]
  51. Zhang, R.; Min, Q.; Su, J. Impact of El Niño on atmospheric circulations over East Asia and rainfall in China: Role of the anomalous western North Pacific anticyclone. Sci. China Earth Sci. 2017, 60, 1124–1132. [Google Scholar] [CrossRef]
  52. Zhang, P.; Shao, G.; Zhao, G.; Le Master, D.C.; Parker, G.R.; Dunning, J.B., Jr.; Li, Q. China’s forest policy for the 21st century. Science 2000, 288, 2135–2136. [Google Scholar] [CrossRef] [PubMed] [Green Version]
  53. Gerard, F.; Petit, S.; Smith, G.; Thomson, A.; Brown, N.; Manchester, S.; Wadsworth, R.; Bugar, G.; Halada, L.; Bezak, P. Land cover change in Europe between 1950 and 2000 determined employing aerial photography. Prog. Phys. Geogr. 2010, 34, 183–205. [Google Scholar] [CrossRef] [Green Version]
  54. Izakovičová, Z.; Miklós, L.; Miklósová, V.; Petrovič, F. The integrated approach to landscape management—Experience from Slovakia. Sustainability 2019, 11, 4554. [Google Scholar] [CrossRef] [Green Version]
  55. Machar, I.; Simon, J.; Brus, J.; Pechanec, V.; Kiliánová, H.; Filippovová, J.; Vrublová, K.; Mackovcin, P. A growth simulation model as a support tool for conservation management strategy in a mountain protected area. J. Prot. Mt. Areas Res. Manag. 2018, 10, 61–69. [Google Scholar] [CrossRef] [Green Version]
  56. Foley, J.A.; DeFries, R.; Asner, G.P.; Barford, C.; Bonan, G.; Carpenter, S.R.; Chapin, F.S.; Coe, M.T.; Daily, G.C.; Gibbs, H.K. Global consequences of land use. Science 2005, 309, 570–574. [Google Scholar] [CrossRef] [Green Version]
  57. Baumann, M.; Kuemmerle, T.; Elbakidze, M.; Ozdogan, M.; Radeloff, V.C.; Keuler, N.S.; Prishchepov, A.V.; Kruhlov, I.; Hostert, P. Patterns and drivers of post-socialist farmland abandonment in Western Ukraine. Land Use Policy 2011, 28, 552–562. [Google Scholar] [CrossRef]
  58. Chang, S.; Wang, J.; Zhang, F.; Niu, L.; Wang, Y. A study of the impacts of urban expansion on vegetation primary productivity levels in the Jing-Jin-Ji region, based on nighttime light data. J. Clean. Prod. 2020, 263, 121490. [Google Scholar] [CrossRef]
  59. Peng, J.; Shen, H.; Wu, W.; Liu, Y.; Wang, Y. Net primary productivity (NPP) dynamics and associated urbanization driving forces in metropolitan areas: A case study in Beijing City, China. Landsc. Ecol. 2016, 31, 1077–1092. [Google Scholar] [CrossRef]
  60. Basuki, I.; Kauffman, J.B.; Peterson, J.T.; Anshari, G.Z.; Murdiyarso, D. Land Cover and Land Use Change Decreases Net Ecosystem Production in Tropical Peatlands of West Kalimantan, Indonesia. Forests 2021, 12, 1587. [Google Scholar] [CrossRef]
  61. Enoguanbhor, E.C.; Gollnow, F.; Nielsen, J.O.; Lakes, T.; Walker, B.B. Land cover change in the Abuja City-Region, Nigeria: Integrating GIS and remotely sensed data to support land use planning. Sustainability 2019, 11, 1313. [Google Scholar] [CrossRef] [Green Version]
  62. Chen, C.; Park, T.; Wang, X.; Piao, S.; Xu, B.; Chaturvedi, R.K.; Fuchs, R.; Brovkin, V.; Ciais, P.; Fensholt, R. China and India lead in greening of the world through land-use management. Nat. Sustain. 2019, 2, 122–129. [Google Scholar] [CrossRef] [PubMed]
Figure 1. Location of the study area.
Remotesensing 14 01755 g001
Figure 2. Technical flow chart.
Remotesensing 14 01755 g002
Figure 3. Spatial autocorrelation of vegetation NPP in Beijing from 2000 to 2020.
Remotesensing 14 01755 g003
Figure 4. Land use: (a) year 2000; (b) year 2010; (c) year 2020 and simulation results in 2030: (d) baseline scenario; (e) cropland protection scenario; (f) ecological protection scenario.
Remotesensing 14 01755 g004
Figure 5. Temporal variation of vegetation NPP in Beijing.
Remotesensing 14 01755 g005
Figure 6. (a) Variation trend of vegetation NPP in Beijing from 2000 to 2020; (b) Future trend of vegetation NPP in Beijing.
Remotesensing 14 01755 g006
Figure 7. Hot spot and cold spot of vegetation NPP in Beijing from 2000 to 2020.
Remotesensing 14 01755 g007
Table 1. Driving forces for implementing the PLUS model in this study.
DriversDescriptionSourceResolution
Physiographic factorsDEMASTER GDEMhttp://www.gscloud.cn, accessed on 30 October 202130 m
SlopeRatio of the vertical height of the slope to the horizontal distanceRetrieved from DEM30 m
AspectDirection of the projection of a slope normal onto a horizontal planeRetrieved from DEM30 m
Nutrient availabilitySoil texture, soil organic carbon, soil pH, total exchangeable baseshttp://webarchive.iiasa.ac.at/Research, accessed on 30 October 20211 km
Oxygen availability to rootsSoil drainage and soil phases affecting soil drainagehttp://webarchive.iiasa.ac.at/Research, accessed on 30 October 20211 km
Excess saltsSoil salinity, soil sodicity and soil phases influencing salt conditionshttp://webarchive.iiasa.ac.at/Research, accessed on 30 October 20211 km
ToxicityCalcium carbonate and gypsumhttp://webarchive.iiasa.ac.at/Research, accessed on 30 October 20211 km
WorkabilitySoil texture, effective soil depth/volume, and soil phases constraining soil management (soil depth, rock outcrop, stoniness, gravel/concretions and hardpans)http://webarchive.iiasa.ac.at/Research, accessed on 30 October 20211 km
TemperatureInterpolation from the monthly data set of surface climatic data in Chinahttp://data.cma.cn, accessed on 30 October 2021250 m
PrecipitationInterpolation from the monthly data set of surface climatic data in Chinahttp://data.cma.cn, accessed on 30 October 2021250 m
Transportation factorsDistance to waterEuclidean distance from the location to the water body in LULC typeshttp://data.casearth.cn, accessed on 30 October 202130 m
Distance to main roadEuclidean distance from the location to the main roadshttp://www.ngcc.cn, accessed on 30 October 202130 m
Distance to railroadEuclidean distance from the location to the railroadshttp://www.ngcc.cn, accessed on 30 October 202130 m
Distance to settlementEuclidean distance from the location to the settlementshttp://www.ngcc.cn, accessed on 30 October 202130 m
Socioeconomic factorsPopulation densityThe number of people per unit of land areahttp://www.worldpop.org, accessed on 30 October 2021100 m
GDPGross Domestic Producthttp://www.resdc.cn, accessed on 30 October 20211 km
Table 2. Total area, Neighborhood weights and land demands of land use in Beijing.
YearCroplandForestGrasslandWetlandWater BodyImpervious SurfaceBare Area
Total area20005667.197158.441712.978.18255.931589.960.23
20105342.047332.591321.459.50151.192235.850.30
20203902.517388.601371.7411.87238.333475.764.11
Neighborhood weights0.060.5400.380.2810.38
Land demands20302927.057407.671395.6512.04307.424338.194.89
Note: Unit of land use type unit: km2; neighborhood weights have no unit.
Table 3. Statistics of variation trend of vegetation NPP in Beijing from 2000 to 2020.
Change TrendSignificance LevelCategoryArea Proportion
<0p < 0.01Extremely significant decline2.14 0.01%
<00.01 ≤ p < 0.05Significant decline4.57 0.03%
<0p ≥ 0.05Slightly decline59.59 0.36%
=0 Stable2102.27 12.82%
>0p ≥ 0.05Slightly rise1092.03 6.66%
>00.01 ≤ p < 0.05Significant rise1555.27 9.49%
>0p < 0.01Extremely significant rise11,577.04 70.62%
Note: Unit of area: km2.
Table 4. Statistics of future change trend of vegetation NPP in Beijing.
Change TrendHurstFuture TrendsArea Proportion
<00 < H < 0.5Rise6.650.04%
<00.5 < H < 1Continuous decline59.640.36%
=0 Stable2102.68 12.83%
>00 < H < 0.5Decline329.77 2.01%
>00.5 < H < 1Continuous rise13,894.17 84.76%
Note: Unit of area: km2.
Table 5. Land use transfer matrix in hot spot (p < 0.01) areas of the change of NPP from 2000 to 2020.
Hot Spot (p < 0.01)
/km2CroplandForestGrasslandWater BodyImpervious SurfaceTotal
Cropland4.5280.8601.9590.0290.0107.387
Forest1.1581148.49221.8160.196 1171.661
Grassland0.84220.72143.4270.2170.00265.209
Wetland0.0080.0020.0050.004 0.019
Water body0.0410.1040.0081.864 2.017
Impervious surface1.1531.6871.4080.0040.0944.347
Bare area 0.0020.020 0.022
Total7.7311171.86868.6432.3150.1061250.662
Table 6. Land use transfer matrix in cold spot (p < 0.01) areas of the change of NPP from 2000 to 2020.
Cold Spot (p < 0.01)
/km2CroplandForestGrasslandWater BodyWetlandImpervious SurfaceBare AreaTotal
Cropland3396.1434.68166.7814.931.4651.280.003665.27
Forest170.654707.03316.926.770.151.470.005202.99
Grassland146.83202.45765.2614.671.8210.740.071141.84
Water body30.122.229.0548.432.912.670.0295.42
Wetland1.581.181.320.830.130.23 5.29
Impervious surface1305.3037.92183.515.260.13708.790.012240.93
Bare area2.080.111.500.09 0.063.85
Total5052.714985.601444.3590.986.60775.180.1612,355.59
Publisher’s Note: MDPI stays neutral with regard to jurisdictional claims in published maps and institutional affiliations.

