Article

Spatial and Temporal Variation, Simulation and Prediction of Land Use in Ecological Conservation Area of Western Beijing

1
Beijing Key Laboratory of Precise Forestry, Beijing Forestry University, Beijing 100083, China
2
Institute of GIS, RS&GNSS, Beijing Forestry University, Beijing 100083, China
3
Management Research Department, Beijing Municipal Institute of City Management, Beijing 100028, China
4
Beijing Key Laboratory of Municipal Solid Wastes Testing Analysis and Evaluation, Beijing Research Institute of City Management, Beijing 100028, China
5
Department of Geography, College of Life & Environmental Sciences, University of Exeter, Exeter EX4 4RJ, UK
*
Author to whom correspondence should be addressed.
These authors contributed equally to this work.
Remote Sens. 2022, 14(6), 1452; https://doi.org/10.3390/rs14061452
Submission received: 16 February 2022 / Revised: 15 March 2022 / Accepted: 15 March 2022 / Published: 17 March 2022

Abstract

:
Exploring land use change is crucial to planning land space scientifically in a region. Taking the ecological conservation area (ECA) in western Beijing as the study area, we employ ArcGIS 10.2, landscape pattern index and multiple mathematical statistics to explore the temporal and spatial variation of land use from 2000 to 2020. Patch-generating Land Use Simulation (PLUS), Future Land Use Simulation (FLUS) and Markov models were used to simulate and predict the current land use in 2020. The models were evaluated for accuracy, and the more accurate PLUS model was selected and used to simulate and predict the potential land use in the study area in 2030 under two management scenarios. The main findings of this research are: (1) From 2000 to 2020, the construction land increased constantly, and the area of cultivated land and grassland decreased significantly. (2) For predicting the spatial distribution of land use in the study area, the PLUS model was more accurate than the FLUS model. (3) The land-use prediction of the study area in 2030 shows that the area of grassland, forest and water is approximately equal to their corresponding value in 2020, but the construction land increased constantly by occupying the surrounding cultivated land. According to this research, the continuous decrease of cultivated land in favor of increasing construction land will cause losses to the ecological service function of the ECA, which is not beneficial to the sustainable development of the region. Relevant departments should take corresponding measures to reduce this practice and promote sustainable development, particularly in the southern and western areas of the ECA where there is less construction land.

Graphical Abstract

1. Introduction

Land resources are an indispensable factor for all human activities and economic societal development. Due to limited land resources and the lack of rational land-use planning, the paradox between human activities and natural resources has become prominent in recent years due to the expansion of urbanized land, which has led to a series of ecological security problems. For example, the land productivity was seriously damaged [1], the quality of land resources decreased [2], the ecological service function of land degraded [3] and the primary forest was developed, resulting in habitat and species loss [4]. The nature of land use is the most direct driving factor for the change in overall landscape pattern [5], and relatively subtle land cover and land-use change can have a significant impact on future landscapes [6]. The ecological conservation area (ECA) of Beijing was established to protect and conserve natural resources while also enabling societal development. Therefore, it is of great significance to carry out a multi-model comparison of regional land-use models and to select the optimal model to simulate and predict future land-use development, thereby providing a tool to guide the expansion and optimization of green ecological space, promoting ecological security and sustainable development in the region.
In recent years, many scholars have utilized remote sensing to undertake land-use change studies [7,8,9]. Zhao DY et al. [10] and Chen ZZ et al. [11] simulated future land-use changes in different scenarios based on different land-use needs and policies. Some scholars have conducted more in-depth research on land-use change from a micro perspective. For example, Tadesse et al. [12] studied the temporal and spatial changes of land use and soil erosion in river basins, and Debnath et al. [13] concluded that river channel migration had a direct impact on land-use change through their study. Studies have shown that land-use change is of great significance to urban development [14,15], and ecosystem service value [16].
Researchers have developed many land use and land cover change models to better understand, evaluate and predict land-use change, including the Cellular Automata (CA) model, CLUE-S model and FLUS model. Among them, the cellular automata model is the earliest model applied to the prediction of future land-use spatial distribution, and other models have further developed and improved on the cellular automata model. The concept of the cellular automata model was initially developed in the mid-twentieth century, by Von Neumann J and Stanislaw M. Ulam as a discrete dynamic model in time, space and state [17]. Basse et al. [18] further developed cellular automata and artificial neural networks to model land-use changes in 2014. Ku [19] also incorporated a spatial regression model into the cellular automata to simulate land-use changes, which improved the performance of the land-use model in his study area. However, the simulation accuracy of the traditional cellular automata model for land-use change is insufficient [20]. In order to improve the accuracy of land-use simulation and reduce errors, scholars have improved the original cellular automata model from different perspectives. For example, Verburg et al. [21] proposed the CLUE-S model based on the systems theory, and the FLUS model proposed by Liu et al. [22] transformed and upgraded the original cellular automata model by establishing self-adaptive inertia and a competition mechanism to process the complex competitions and interactions between the different land-use types. Liang et al. [23], taking Wuhan as an example, compared the simulation accuracy of the PLUS model with other land-use models and found that the PLUS model can obtain a higher simulation accuracy. The PLUS model is a patch-generating land-use simulation model that integrates a land expansion analysis strategy and a CA model based on multi-type random patch seeds. Compared with other models, the PLUS model can better reveal the relationships underlying land-use change.
At present, land-use change scholars utilizing these models have mainly concentrated on urban areas [24,25,26,27,28,29] and rarely in the ECA [30,31]. Moreover, as a newly proposed land-use model, there are few studies incorporating the PLUS model. The ECA in western Beijing is a key resource to protect the ecological environment of Beijing and act as an important barrier to protect the ecological security and well-being of the residents in Beijing [32]. The aim of this paper is to explore the characteristics of land-use change using a geographic information system (GIS) and mathematical statistics, by selecting the environmental and population driving factors that may cause this change and taking these driving factors into the simulation of PLUS and FLUS models in the ECA in western Beijing. To perform this, we compared the observed current land use in 2020 with the land-use prediction result from the PLUS and FLUS models in the study area in 2020. We subsequently selected the most accurate model to predict the future spatial distribution of land use in the ECA of western Beijing in 2030. The results and conclusions of this study area can be used as a framework for policymakers and stakeholders, so as to alleviate the conflicts of land development, promote the enhancement of the capital’s ecosystem service value and aid in the sustainable development of land resources.

2. Materials and Methods
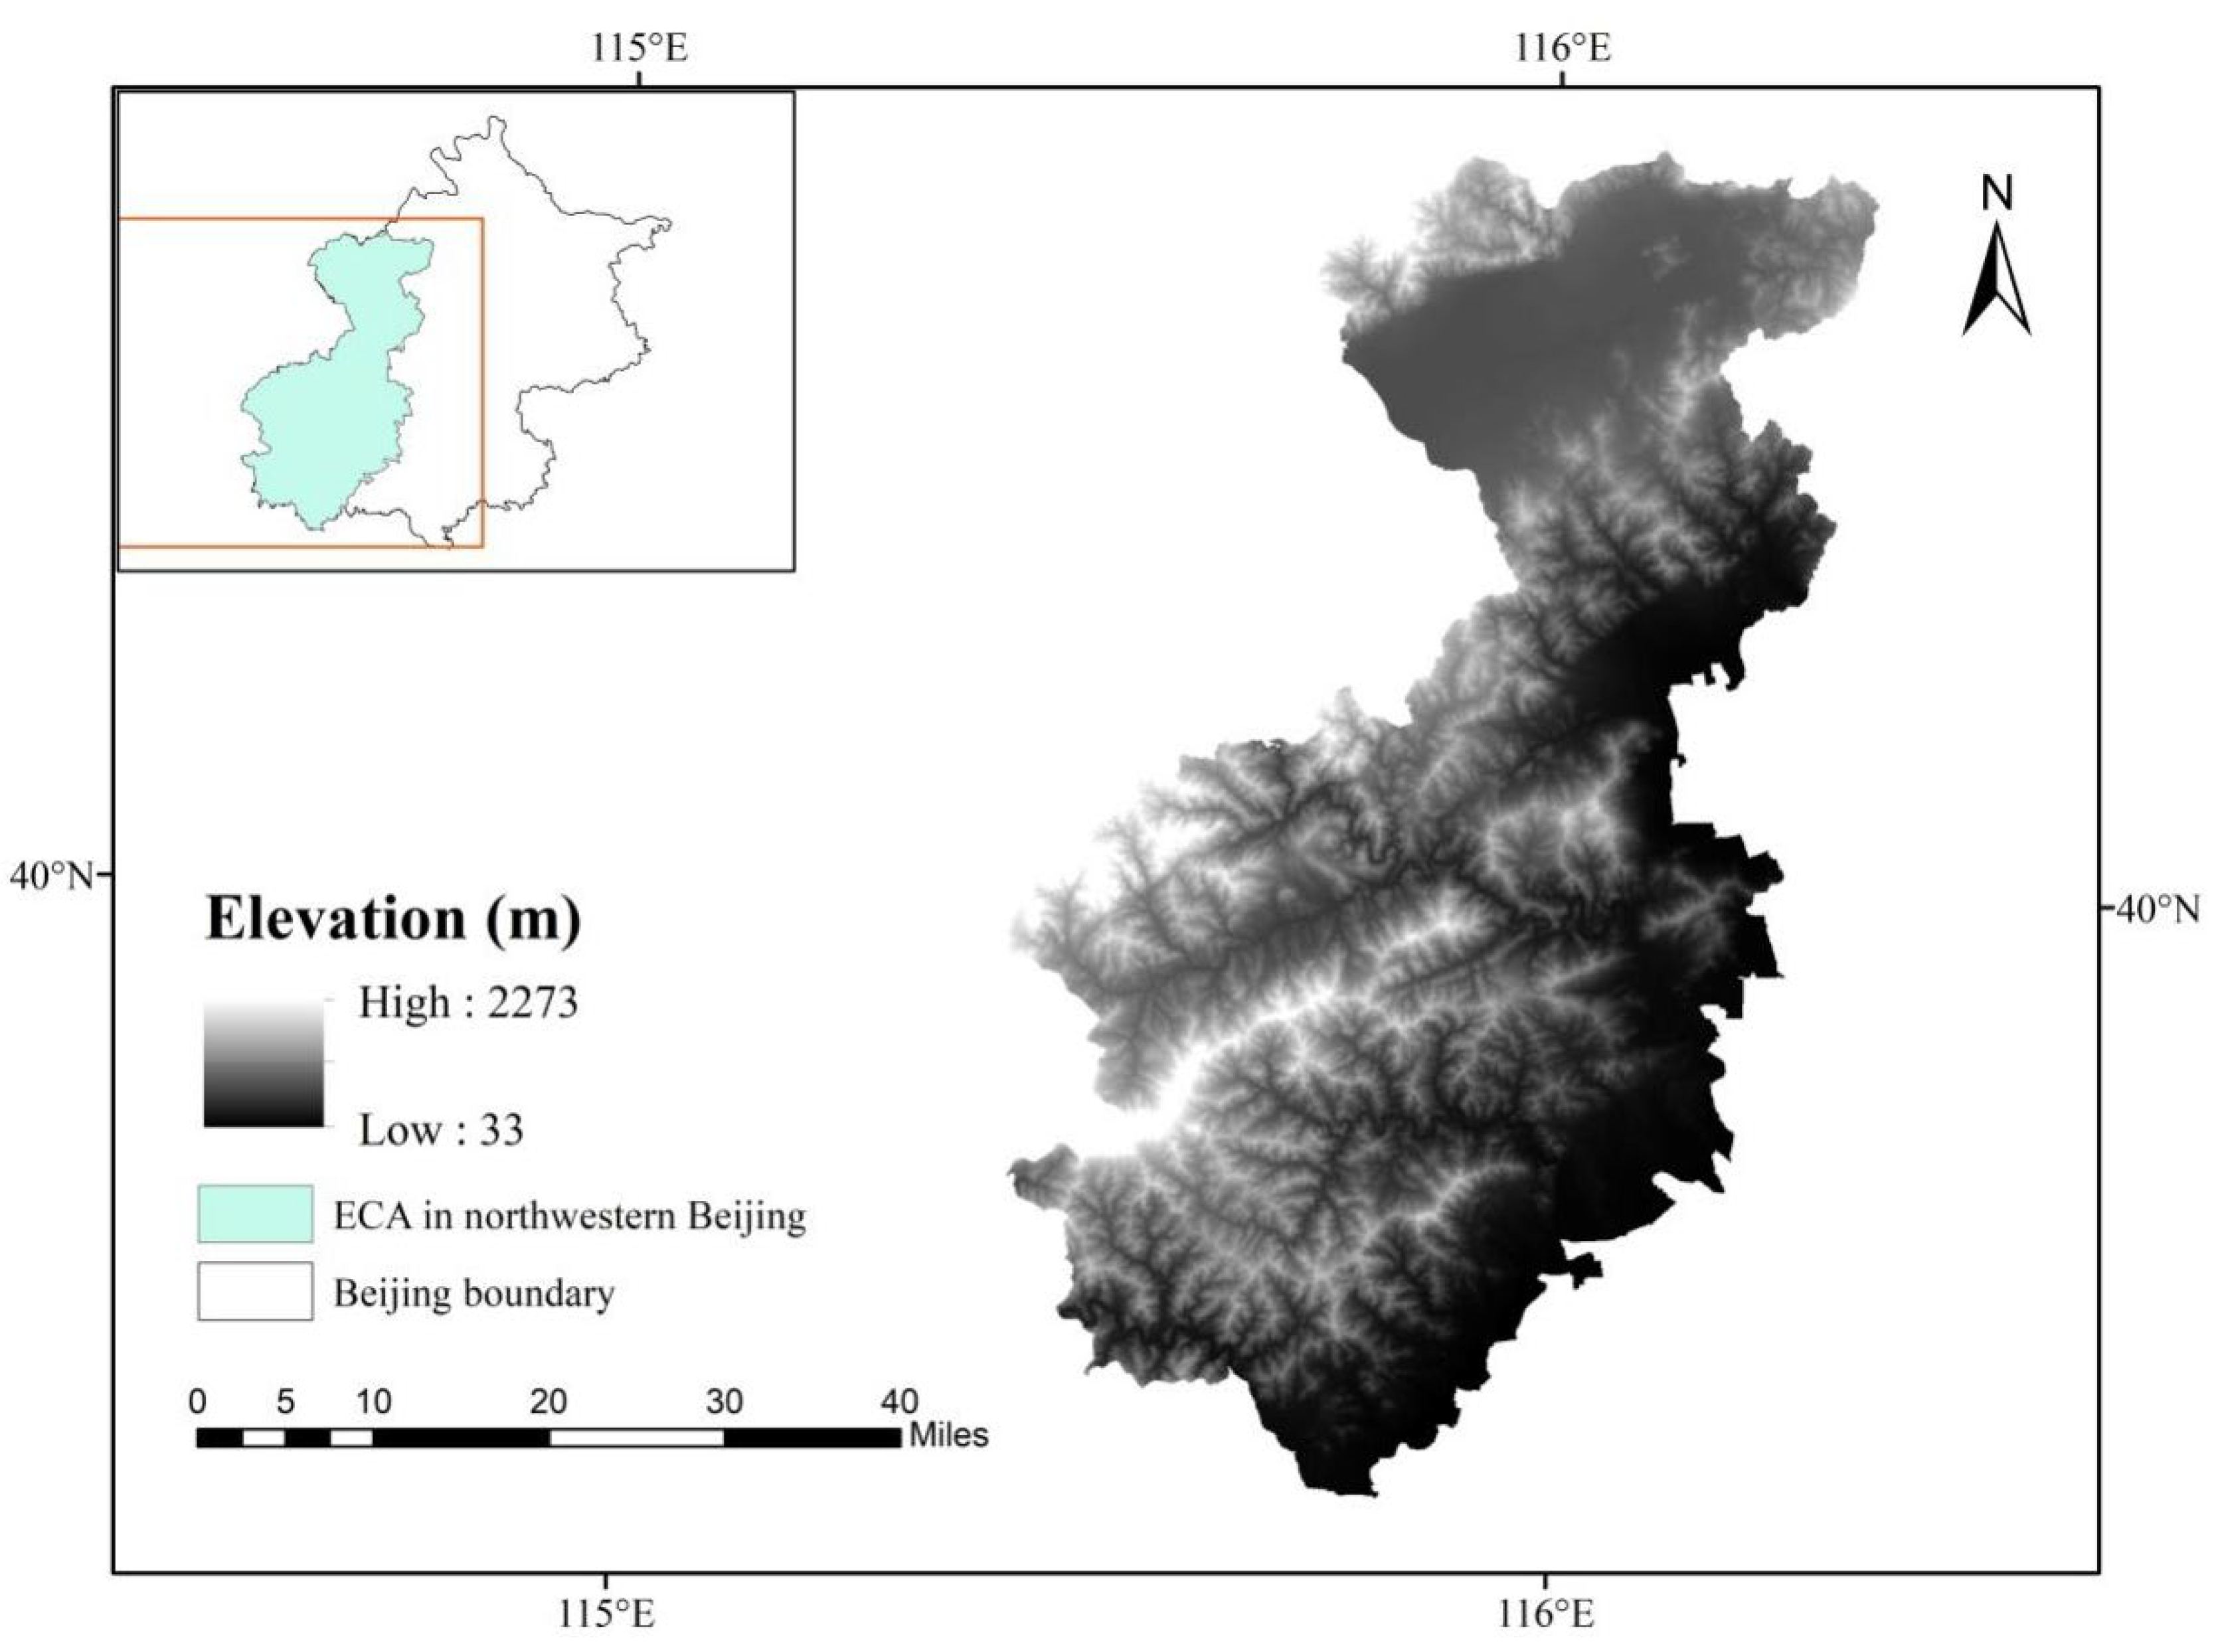
2.1. Study Area

The ECA study area (115°24′57″ E–116°20′42″ E, 39°30′20″ N–40°37′44″ N) is located in western Beijing (Figure 1). It is located between the North China Plain and the Mongolian Plateau, and plays a transitional role between the two terrains, covering an area of approximately 11,140 km2 [33]. The study area is mostly covered by mountains, with the lowest elevation of 33 m and the highest elevation of 2273 m. The area belongs to the mid-latitude continental monsoon climate; the average annual temperature range is between 8–19 °C, and the average annual rainfall is about 555 mm. The region is rich in water resources and is of great significance in regulating water flow, improving water quality and protecting the natural environment of the capital. In the past 20 years, with the rapid economic development and population growth of the capital, the land use of the ECA in western Beijing has been through great changes, including the accelerating process of urbanization, increasing construction land, decreasing cultivated land and grassland and the reduction of ecological function.

2.2. Data Source and Processing

The data used in this research include land-use data and data for eight quantifiable driving factors in the study area from 2000 to 2020. Global land cover data (http://globeland30.org, accessed on 10 March 2021) from 2000, 2010 and 2020 were downloaded to calculate land use. The land-use data of the study area were reclassified into the five dominant land-use types including: grassland, forest, water, construction land and cultivated land based on the initial data from 2000 (Table 1). By studying relevant data and the actual development of the study area, and by considering the principles of data availability, consistency, quantification, spatial difference and comprehensiveness, this paper selected eight driving factors. The eight driving variables include three environment variables of elevation, slope and aspect and five population-driven variables of population density, gross domestic productivity (GDP) and accessibility—i.e., the Euclidean distance from road, rail and water. The elevation data were calculated from the national DEM data (spatial resolution is 250 m) and downloaded from the Resource and Environment Science and Data Center (http://www.resdc.cn, accessed on 10 March 2021). Slope and aspect data were calculated in ArcGIS 10.2. The national population density (people/km2) and GDP spatial distribution (yuan/km2) data-set was provided by the Resource and Environmental Science and Data Center. The value of each pixel represents the GDP or population within 1 km2. The Euclidean distance between the main roads, high-speed rail and other influencing factors were calculated using the spatial processing tool in ArcGIS 10.2 (ESRI, Redlands, California, USA).
In order to simulate land-use change using PLUS and FLUS models (models detailed below in Section 2.3), the following reprocessing of the raw land use and driving factor data were conducted: (1) reclassify the land-use data and assign continuous numbering (Table 1), (2) unify the coordinate system and column number of all land-use data and driving factor data, (3) convert data in tiff format to unsigned char format using the conversion module in PLUS, and (4) normalize all data values for all driving factors. Do all steps for the PLUS model and only steps 1, 2 and 4 for the FLUS model.

2.3. Methods

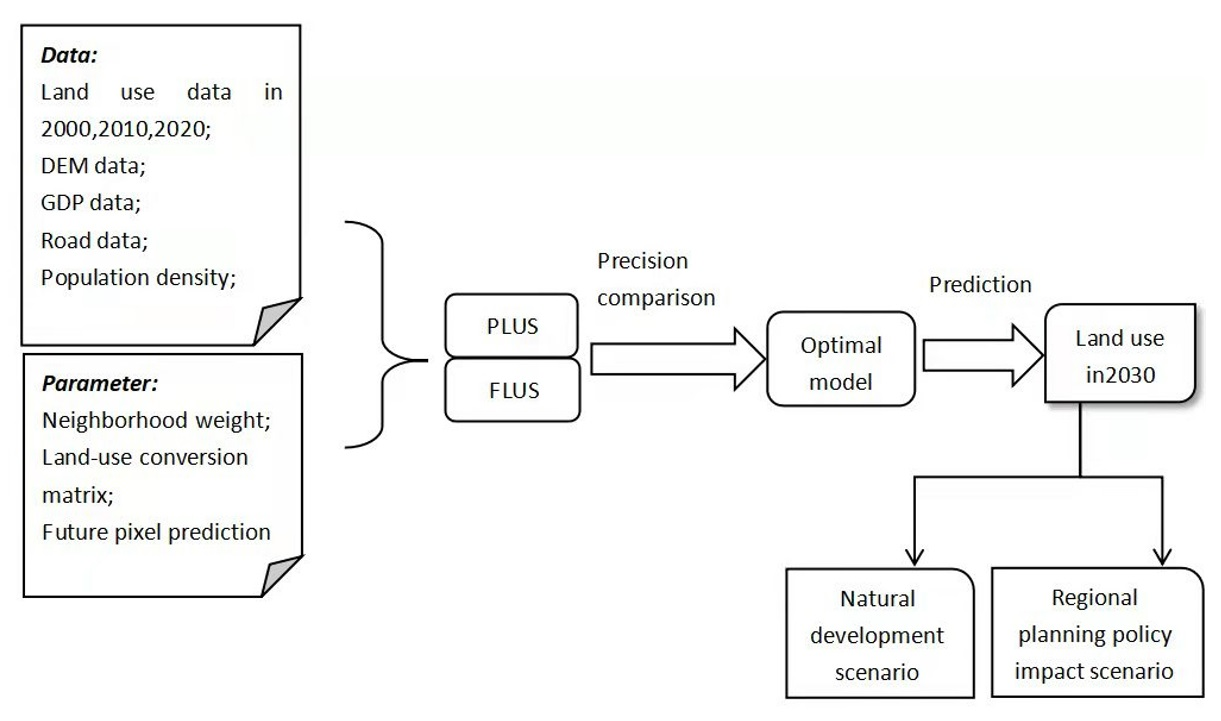
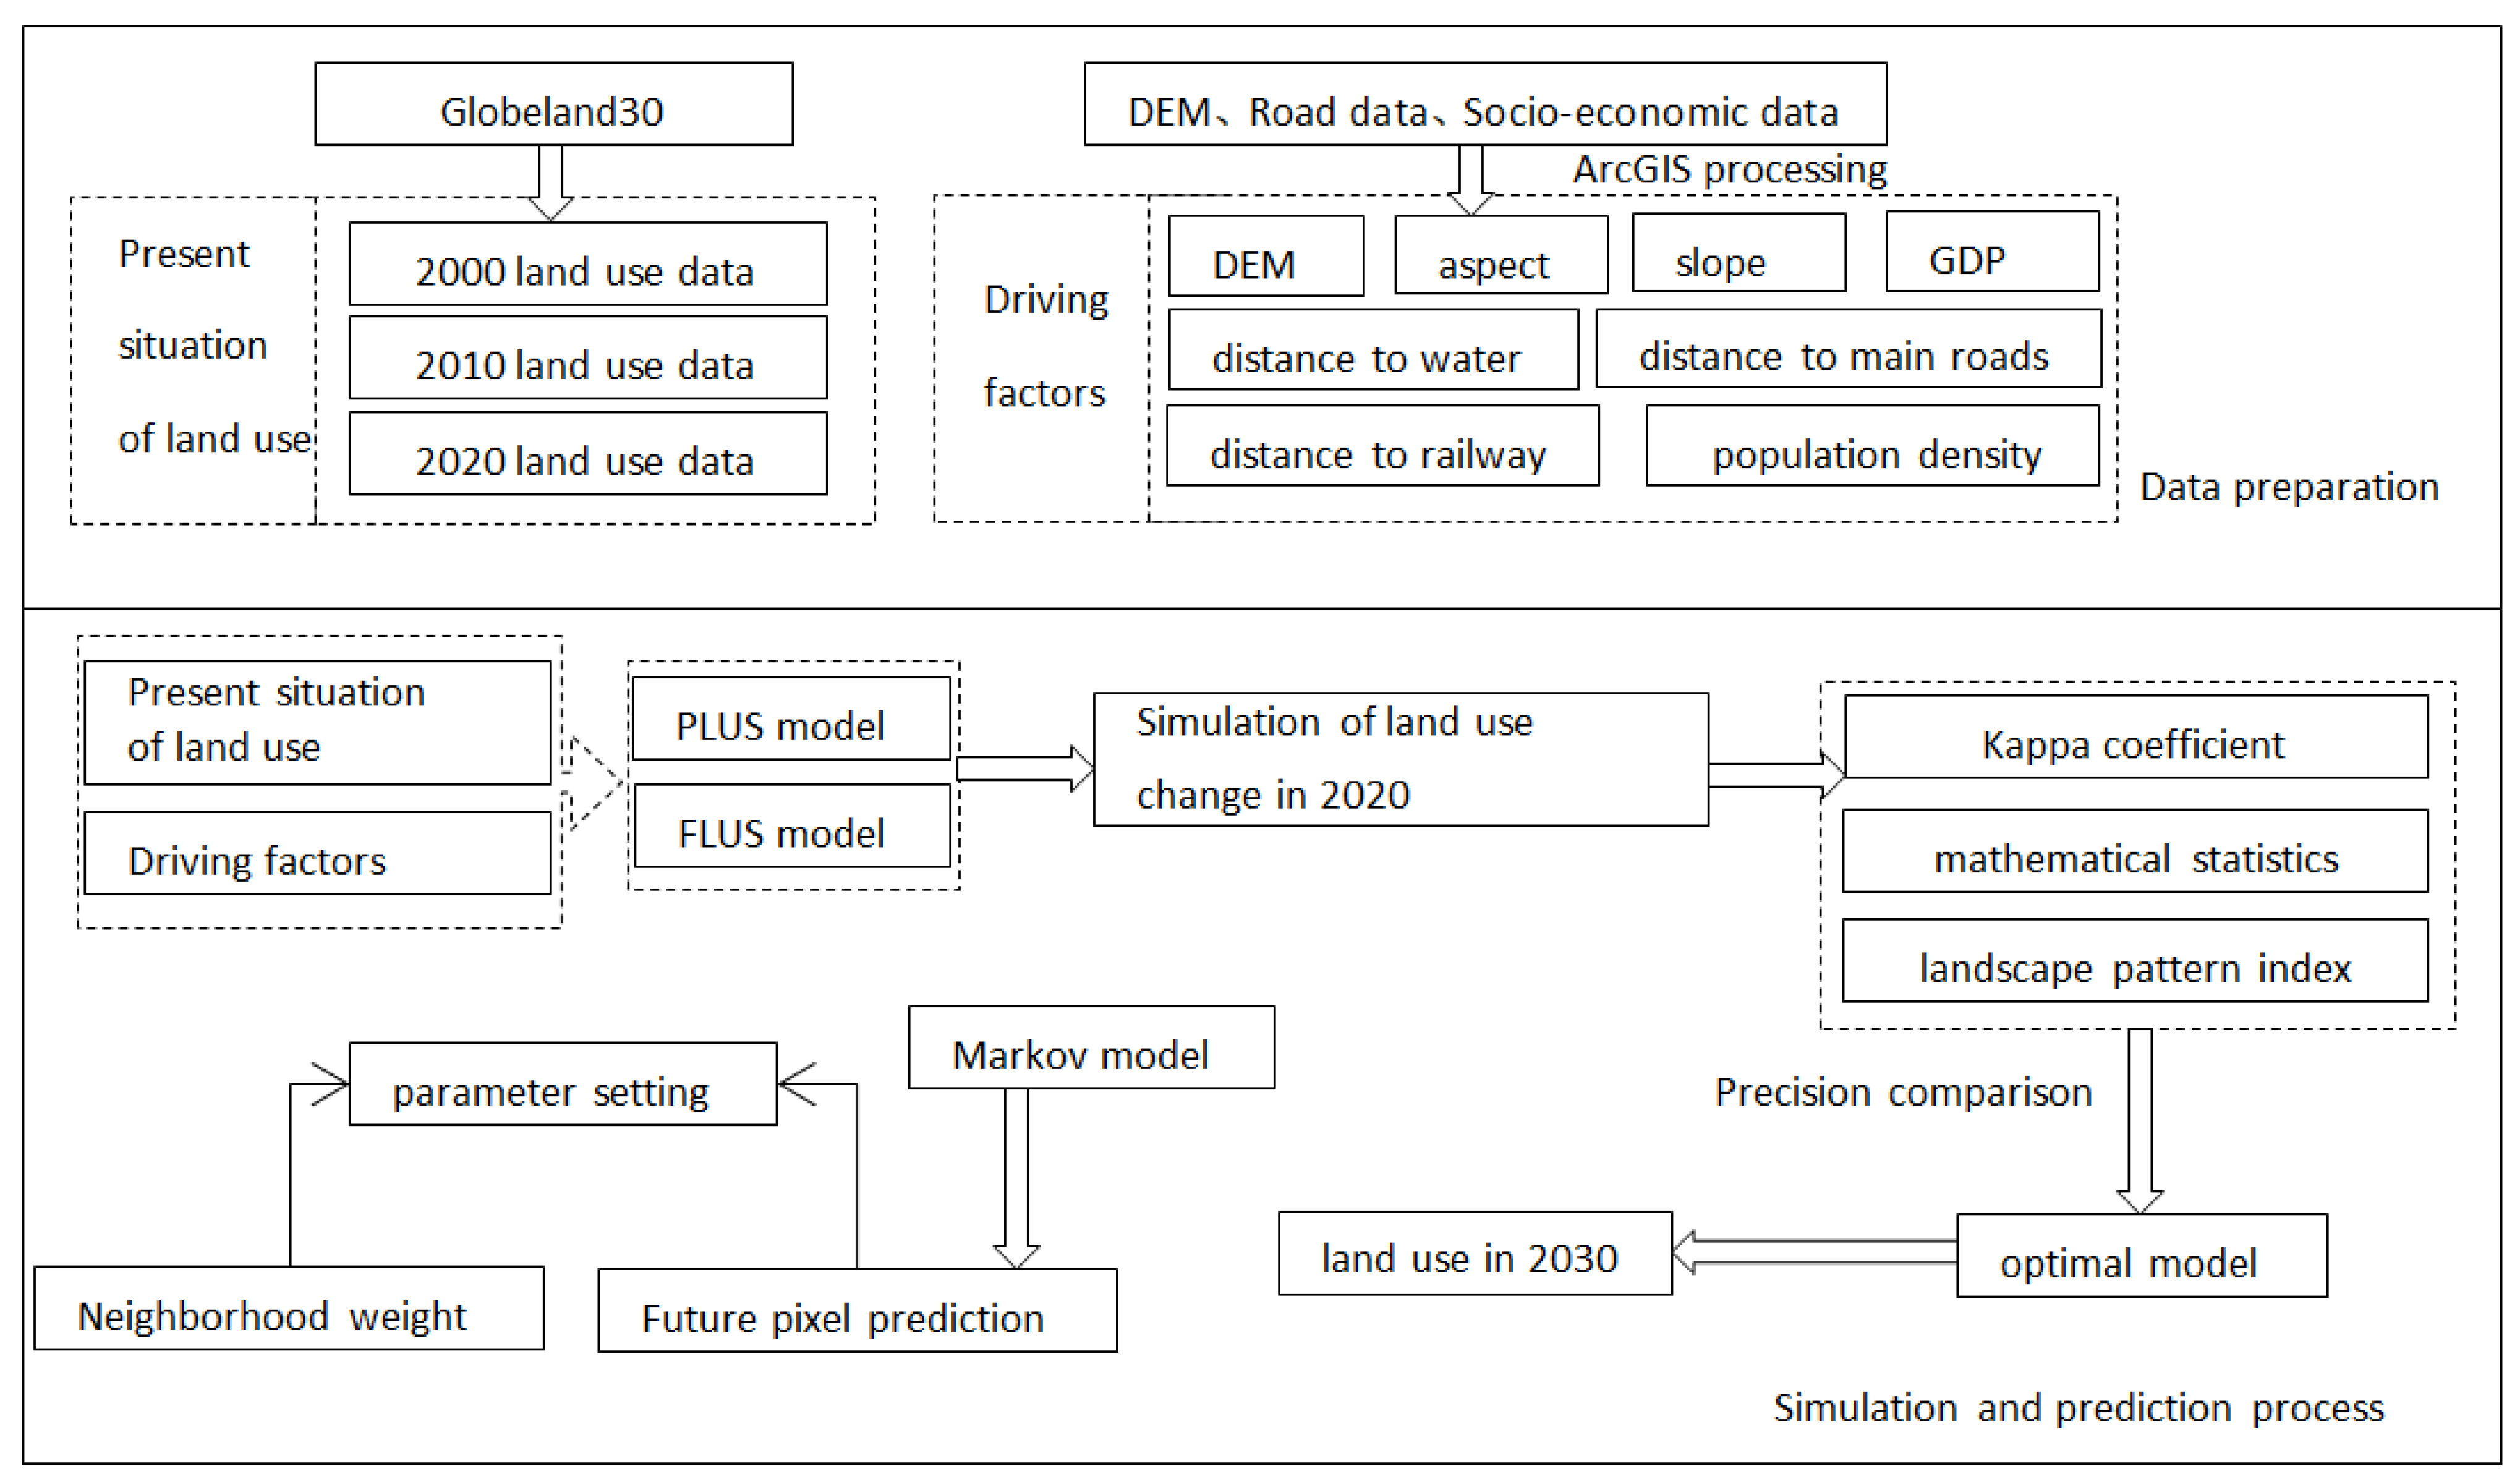
2.3.1. Technical Pathway

The technical pathway (Figure 2) mainly includes data preparation (as detailed above in Section 2.2) and simulation and prediction processes. In the prediction simulation process, the present land-use data and driving factors, the simulation parameters including neighborhood weights (as detailed below in Section 2.3.4) and the number of future pixels of each land-use type were entered into the PLUS and FLUS models to simulate the land use in 2020. The predicted acreage of the various land uses was obtained by the Markov model (as detailed below in Section 2.3.6). The mathematical statistics method, Kappa coefficient and landscape pattern index were used to compare the simulation results in 2020 of the PLUS and FLUS models and to select the optimal model for the study area, which was then used to simulate and predict the land use in 2030.

2.3.2. Driving Factors

In order to clarify the relationship between the various land types and the selected driving factors in the northwest ECA of Beijing, this study used the logistics regression method. The land-use raster data of the study area in 2010 with a pixel spatial resolution of 100 m × 100 m (1 hm2) were used to produce the binary image of the year. One indicates that there is a set type of land use, and 0 indicates another land-use type, except the set type. The binary image of five land-use types was used as the dependent variable, and the independent variable was the data for the eight selected driving factors. Logistic regression equations with the regression coefficient for the different driving factors were determined to evaluate the probability of the different driving factors. We verified the accuracy of the logistic regression model analysis results through the relative operating characteristic (ROC). The closer the ROC value was to 1, the more similar the results calculated by the regression equation were to the observed situation. The closer the ROC value was to 0.5, the more inconsistent the calculation results were with the actual situation. When the ROC value was greater than 0.7, representing the logistic regression equation was effective. The ROC values calculated by the regression of the different land types were greater than 0.75, indicating that the selected eight driving factors had good correlation with each land-use type in the ECA, which met the requirements and could subsequently be applied to the following model.

2.3.3. Landscape Pattern Indices

The landscape pattern index is a series of indices describing the spatial structure of a landscape. The landscape pattern index reflects the spatial structure characteristics of patches with different sizes and shapes and quantitatively describes the evolution of regional landscape patterns and ecological environment change. Analysis of landscape pattern change is a deeper measurement of land-use change and an important means to study landscape characteristics [34,35]. The spatial and temporal evolution of landscape pattern has a direct impact on the realization of ecological function in the ECA of western Beijing. Based on ArcGIS 10.2 (ESRI, Redlands, California, USA) and Fragstats 4.2 software (Oregon State University, Covallis, Oregon, USA), the landscape pattern index with a high sensitivity to land-use change was selected to study the landscape pattern of the study area in terms of both the landscape type scale and overall landscape scale. At the overall landscape level, Shannon’s Diversity Index (SHDI), Shannon’s Evenness Index (SHEI) and CONTAG were selected for analysis. Land cover diversity can reflect the complexity of the landscape and whether the landscape distribution is balanced in spatial and temporal levels, that is, the heterogeneity of landscape. This paper selected SHDI and SHEI to study land cover diversity. SHDI can sensitively detect the uneven spatial distribution of different plaque types, and SHEI represents the complexity of the landscape in the region, which can reflect whether the study area is dominated by one or several plaque types [36]. CONTAG can reflect the spatial distribution of patches in the landscape. On the scale of the landscape type, number of patches (NP), patch density (PD), largest patch index (LPI), aggregation index (AI) and SPLIT were selected to analyze the changes of every land-use type in the ECA area of northwest Beijing from 2000 to 2020. NP reveals the spatial distribution pattern of the landscape, and PD represents the number of patches per unit area. Both of them are important references for landscape fragmentation. According to the LPI, the dominance of each landscape type can be determined, which is obtained by dividing the area of type patches by the total area of the landscape. AI can explain the connectivity between various types of patches in the landscape. SPILT can reflect landscape fragmentation.
In the validation period, a total of landscape pattern indices were selected to quantitatively analyze the similarity between the simulation results and the observed landscape in 2020. This study selected NP, LPI and perimeter area ratio indicators including: mean (PARA_MN), weighted mean (PARA_AM), median (PARA_MD), extreme (PARA_RA), standard deviation (PARA_SD), coefficient of variation (PARA_CV), Euclidean nearest neighbor distance indicators including: mean (ENN _ MN), weighted mean (ENN_AM), median (ENN_MD), extreme (ENN_RA), standard deviation (ENN_SD), coefficient of variation (ENN_CV) and similar adjacent proportion (PLADJ) for a total of 15 landscape pattern indices.

2.3.4. PLUS Model

The PLUS model integrated a rule-mining framework based on the land expansion analysis strategy (LEAS) and a cellular automata model based on multi-type random seeds (CARS), which can illustrate the drivers of land expansion and project future landscape dynamics [23].
The random forest parameters in the LEAS module were set as follows: uniform sampling method was used, the number of decision trees was 20, the sampling rate was 0.01 and the number of features used to training random forests was eight, which was the same as the number of driving factors. The constraint map is a binary image in which 1 represents that this land-use type can convert to other land-use types, and 0 represents that this land-use type cannot convert to other land-use types. In the constraint map in this research, we set that water and construction land cannot convert to other land-use types and that grassland, forest and cultivated land can convert to other land-use types. The land-use transfer matrix is detailed in Table 2, and the neighborhood weights for land-use types are detailed in Table 3. Table 2 and Table 3 are set according to the article of Liang et al. [22] and the situation of the study area.
The land-use transfer matrix indicates whether conversion can occur between different land types. Theoretically, conversion between different land types is free and unrestricted. One represents that the land class is allowed to be converted to other land classes, and 0 represents that the land class is not allowed to be converted to other land classes. In this paper, according to the actual situation of land change and land transfer matrix in the ECA of western Beijing from 2010 to 2020, the water and construction land were not converted to other land, and the conversion between the other three types was not limited.
The range for the neighborhood weight parameter was 0–1, where the larger value means a stronger expansion ability of the land type and a lower probability for the land to be occupied by another land type (Table 3). According to the transfer matrix of the study area from 2010 to 2020, the neighborhood weights were constantly adjusted, and the simulation accuracy under different parameters was compared. The factor parameters with the highest accuracy were selected.

2.3.5. FLUS Model

The FLUS model is a model developed by Professor Liu Xiaoping of Sun Yat-sen University to simulate future land-use change considering natural and human factors. It includes an artificial neural network (ANN)-based probability calculation module and adaptive inertia mechanism cellular automata module based on roulette wheel selection. Firstly, the ANN algorithm was used to integrate various driving factors such as natural and social economy to obtain the adaptive probability of each land-use type. Then, combined with the base period land-use classification data, the final results were obtained by an adaptive inertia competition mechanism [22]. In this study, both natural and human factors were taken into account in the simulation process, and eight driving factors of natural geography, traffic location and social economy were selected.
In the ANN-based probability estimation module of the FLUS model, the sampling ratio of random sampling was set to 2%, that is, the sampling parameter was set to 20 (unit is one thousandth). In the cellular automata module, the setting of the land-use transfer matrix and neighborhood weights is consistent with the PLUS model.

2.3.6. Markov Model

In the last century, Russian scholar Markov proposed a model based on pixel scale with strong quantitative prediction ability, which is called the Markov model. In order to predict the future number of pixels of each land type in the study area, the Markov model was applied in the simulation of land-use change. The use of the Markov model enables quantity prediction, which is deficient in ordinary spatial models and plays an auxiliary role in the prediction process of the PLUS model. The Markov model calculates the probability matrix of land-use transfer through the initial and end periods of land-use data. On the basis of this data, the number of pixels in the future is predicted using the mathematical expression as follows:
S t = S t + 1 × P i j
P i j = P 11 P 1 n P n 1 P m n
P i j 0 , 1   and   n = 1 n P i j = 1 i , j = 1 , 2 , , n
where   S t represents the condition of a certain land-use type at time   t ; S t + 1 represents the status of this type of land use at t + 1 . The probability matrix of land-use transfer is obtained from the   P i j value, which is calculated from the land-use status of the previous two periods in the predicted period representing the probability of conversion from land type i to land type j , and n is the number of land-use types.

3. Results

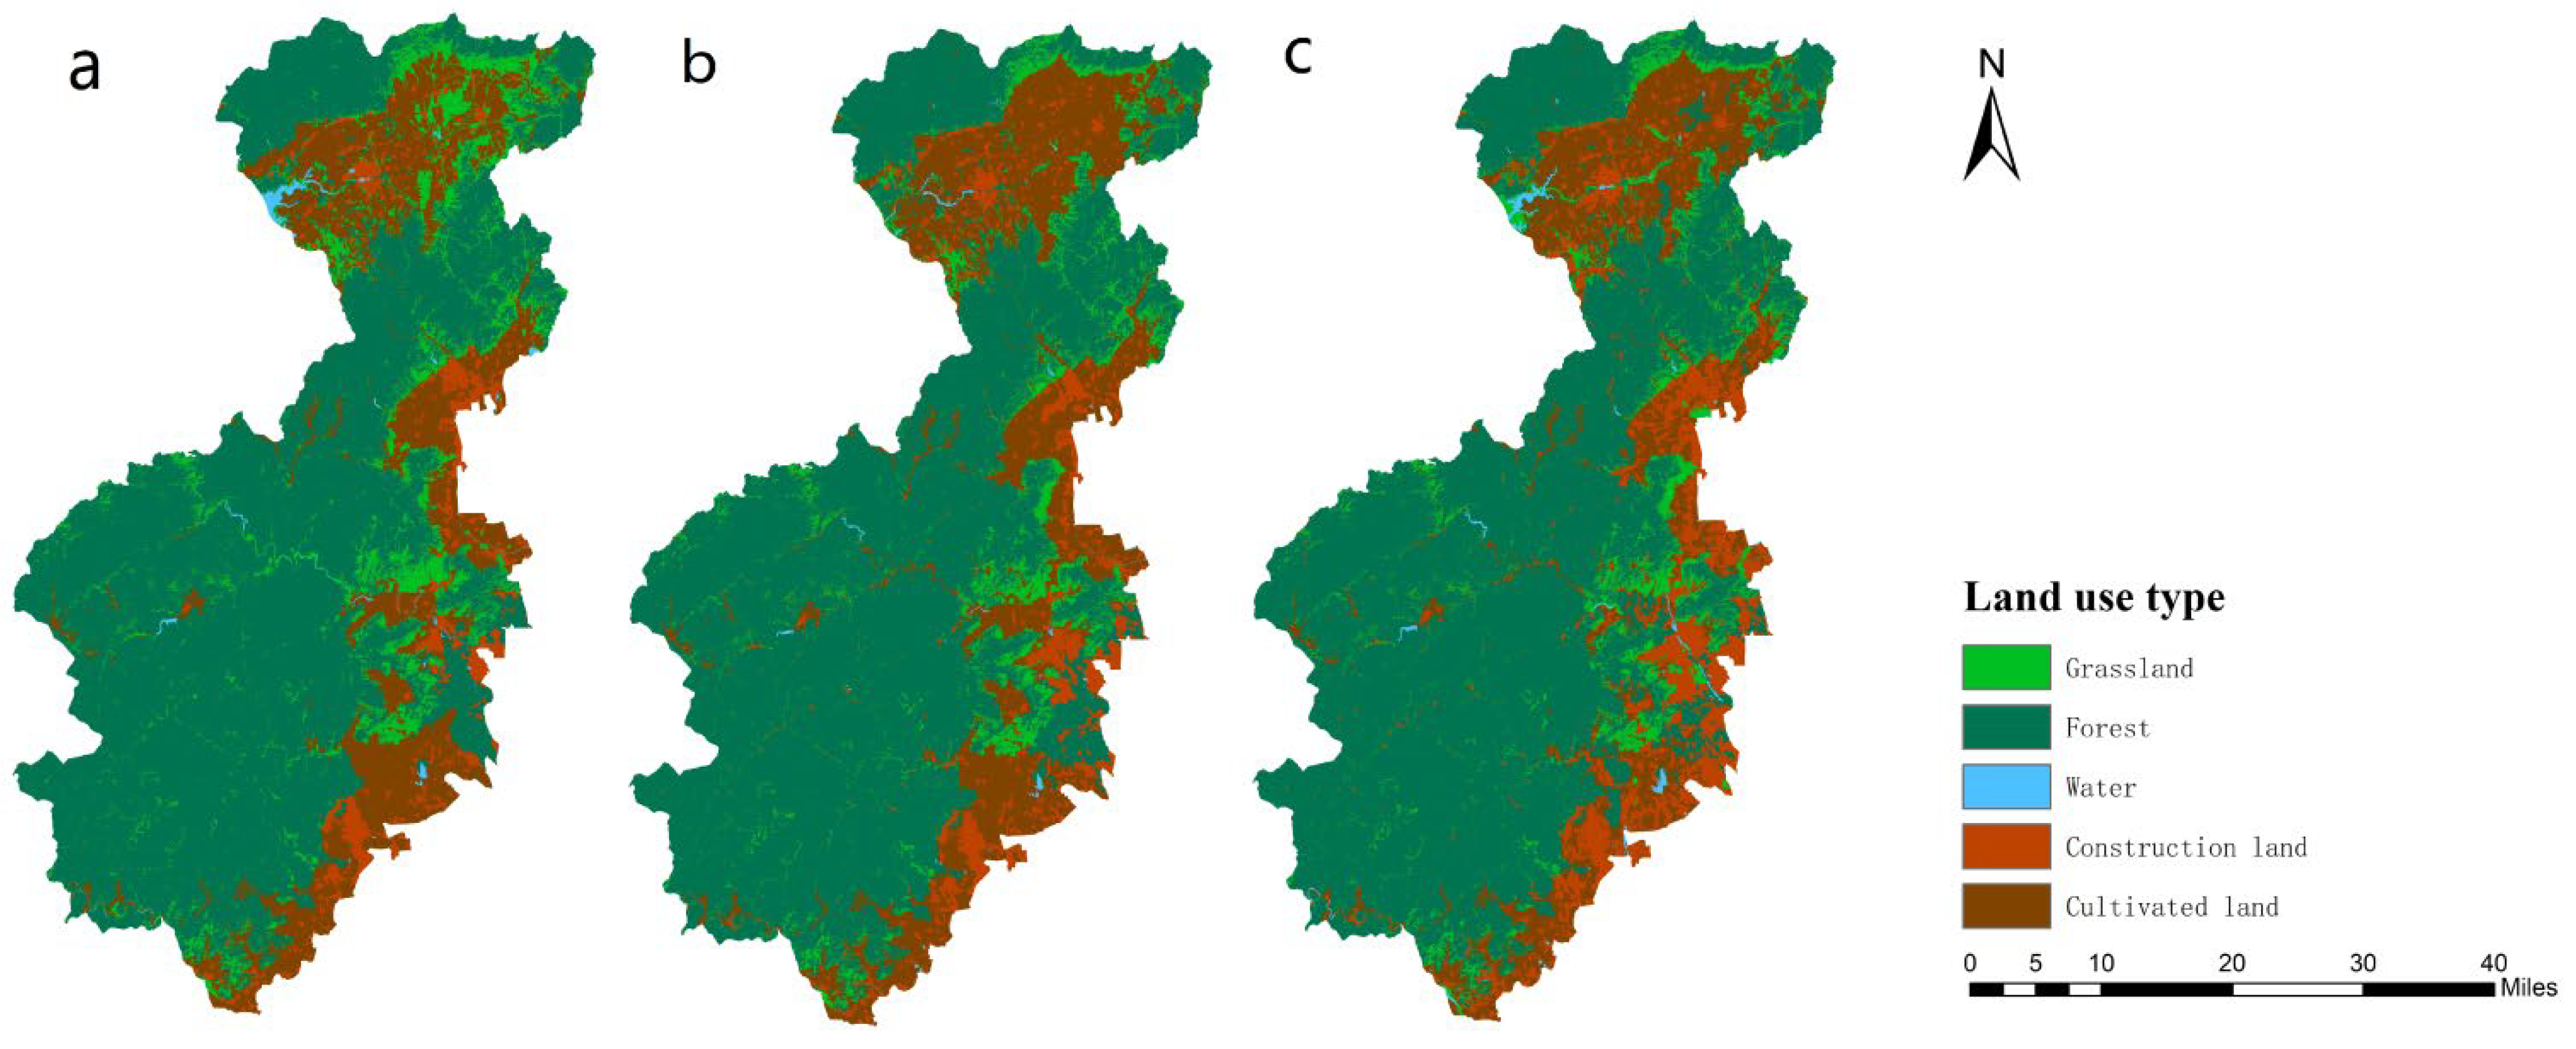
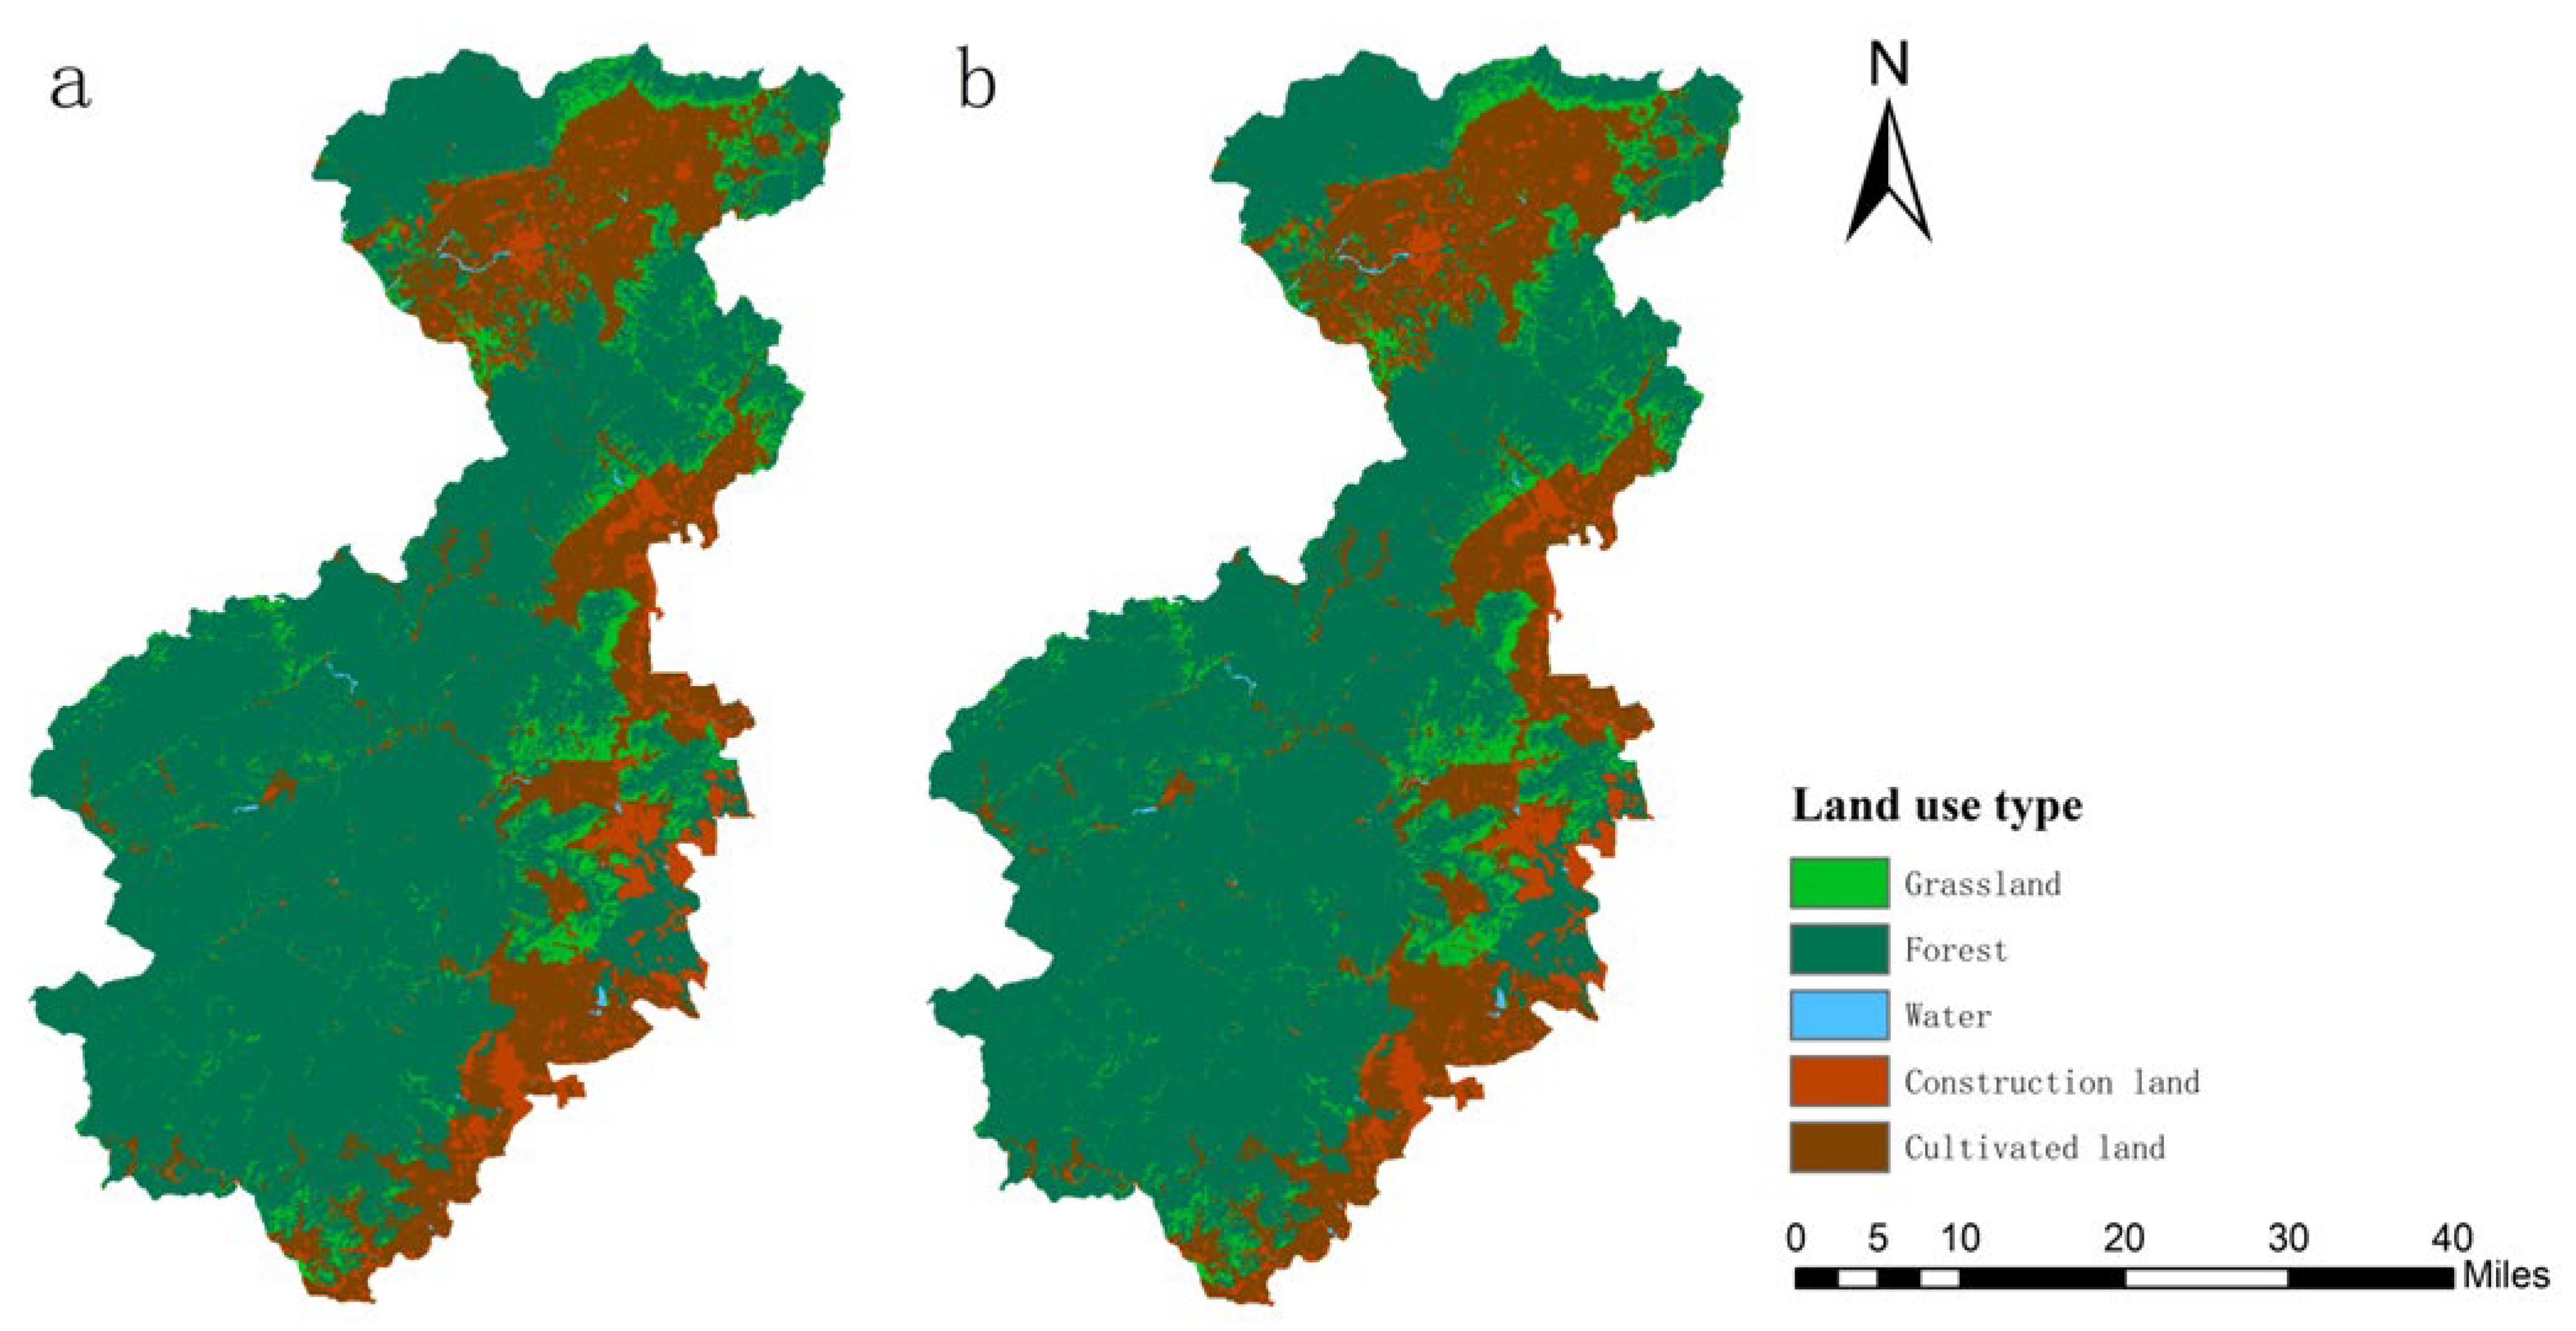
3.1. The Overall Characteristics of Land Use in Western ECA of Beijing

The spatial structure of land use can reflect the land-use situation in the study area that has been developed by human beings. Scientific spatial structure of land use is conducive to the protection and construction of the ECA. With the support of ArcGIS 10.2, the land-use type maps of the western ecological conservation area of Beijing in 2000, 2010 and 2020 were classified and summarized. The total area and the proportion of each land-use type from 2000 to 2020 were obtained, as shown in Table 4.
As shown in Table 4 and Figure 3, there was no significant change in the spatial distribution of land-use types in the ECA of western Beijing from 2000 to 2020. Forest is always the land-use type with the largest area and the widest distribution in the whole western ECA. In 2000, 2010 and 2020, the proportion of forest area is 67.26%, 67.23% and 67.58%, respectively, and it is mainly distributed in the central and southern of the western ECA of Beijing, which is mainly mountainous, and there is very little forest in the northeast. The second is cultivated land. The cultivated land area fluctuated between 75,394 hm2 and 101,316.78 hm2 in the three periods, and the proportion of cultivated land and forest can reach more than 80% of the total area of the ECA in the west. Cultivated land, construction land and grassland are mainly distributed in the eastern and northern parts of the study area, and grassland is widely distributed around cultivated land and construction land. In the past 20 years, the area of water was the smallest in the study area, and it was extremely small in the whole study area. Most of the water was distributed in the northwestern part of the study area, and there was cultivated land near the water source.

3.2. Temporal and Spatial Variation of Land Use

The dynamic degree of land-use change reveals the temporal and spatial trend of land-use change in the study area through mathematical quantitative calculation, which plays an important role in predicting the dynamic change of land use in the region in the future [37].
The overall dynamic of land use in the study area from 2000 to 2010 and from 2010 to 2020 were 0.266% and 0.505%, respectively, indicating that the change in land-use type in the ECA was more active from 2010 to 2020. From 2000 to 2020, the dynamic degrees of change for the water land-use type was the largest and most varied, showing a significant decreasing trend in 2000–2010 (−5.516%); however, from 2010 to 2020, the trend was a significant increase (11.589%). The dynamic of forest change was the smallest in both periods, indicating that forest land cover is relatively stable (Table 4).
The land-use transfer matrix describes the transition from one land type to other types in the study area during the study period. Using the spatial analysis tool of ArcGIS 10.2 software, the land-use transfer matrix table of 2000–2020 was obtained by using the land-use data of three periods of ECA in western Beijing (Table 5).
Compared with the other land types, grassland, cultivated land and construction land had the greatest degree of change, with construction land having the most significant change. In contrast, the total area of forest land and water was relatively stable. From 2000 to 2020, the reduction of cultivated land area was the greatest, decreasing by 19,098 hm2, with the majority of this land converted to construction. The total area of grassland decreased by 12,053.52 hm2 by 2020, with 8888.13 hm2 and 5375.07 hm2 converted to cultivated land and forest, respectively. Construction land area increased by 29,568.15 hm2, mainly from grassland, forest and cultivated land.

3.3. Land-Use Landscape Pattern Change Analysis

From 2000 to 2020, the value of SHDI varied, first decreasing by 2010 and then increasing by 2020, with a small upward trend in overall change, indicating that the land cover types in the study area have become more diverse in the past 20 years. The value of SHEI gradually decreased between 2000 and 2020, with a faster decrease in 2010–2020 in terms of the magnitude of the change, indicating an increasingly uneven spatial distribution of landscape patches in the study area (Table 6).
During 2000–2020, the value of CONTAG showed a continuous upward trend, and the trend in 2010–2020 was larger than that in 2000–2010, indicating that the connectivity of patches in the study area was increasing during this period, especially during the last decade (Figure 4).
Between 2000 and 2020, the indices of patch diversity (through the metrics of patch number, density, size and aggregation) varied across land cover types (Table 7). NP and PD values for grassland were the largest of all land-use types, indicating that grassland landscape patches were the most fragmented, while the NP and PD values of water were the smallest. The PD value of forest decreased slightly, and the NP of construction land and cultivated land increased significantly. The majority of LPI was forest land, followed by cultivated land. The LPI for grassland, water and construction land suggests that these land-use types form smaller patches in the landscape. The LPI value of construction land gradually increased in the first decade, but it doubled in the second decade, indicating that human impact was becoming more concentrated during this period, and construction land was given more priority in the overall landscape. The LPI value of grassland gradually decreased, whereas forest LPI halved in the last decade. The AI value of grassland changed little and was the lowest in all kinds of land types, indicating that grassland aggregation was the worst. The AI values of forest and construction land did not change significantly, whereas the trend of AI for water and cultivated land varied during the study periods, with no consistent trend (Table 7).
From 2000 to 2020, the SPLIT of forest was the lowest among all types of land use, indicating that the spatial distribution of forest in the study area was relatively concentrated and the degree of landscape fragmentation was the lowest. The landscape fragmentation of water and grassland was the greatest, which is related to the scattered distribution of water and grassland in the study area. Conversely, the degree of landscape fragmentation of construction land had been eased in the past 20 years, showing that the construction land and, therefore, the living area of residents was becoming increasingly concentrated, and the degree of landscape fragmentation was reducing (Table 8).

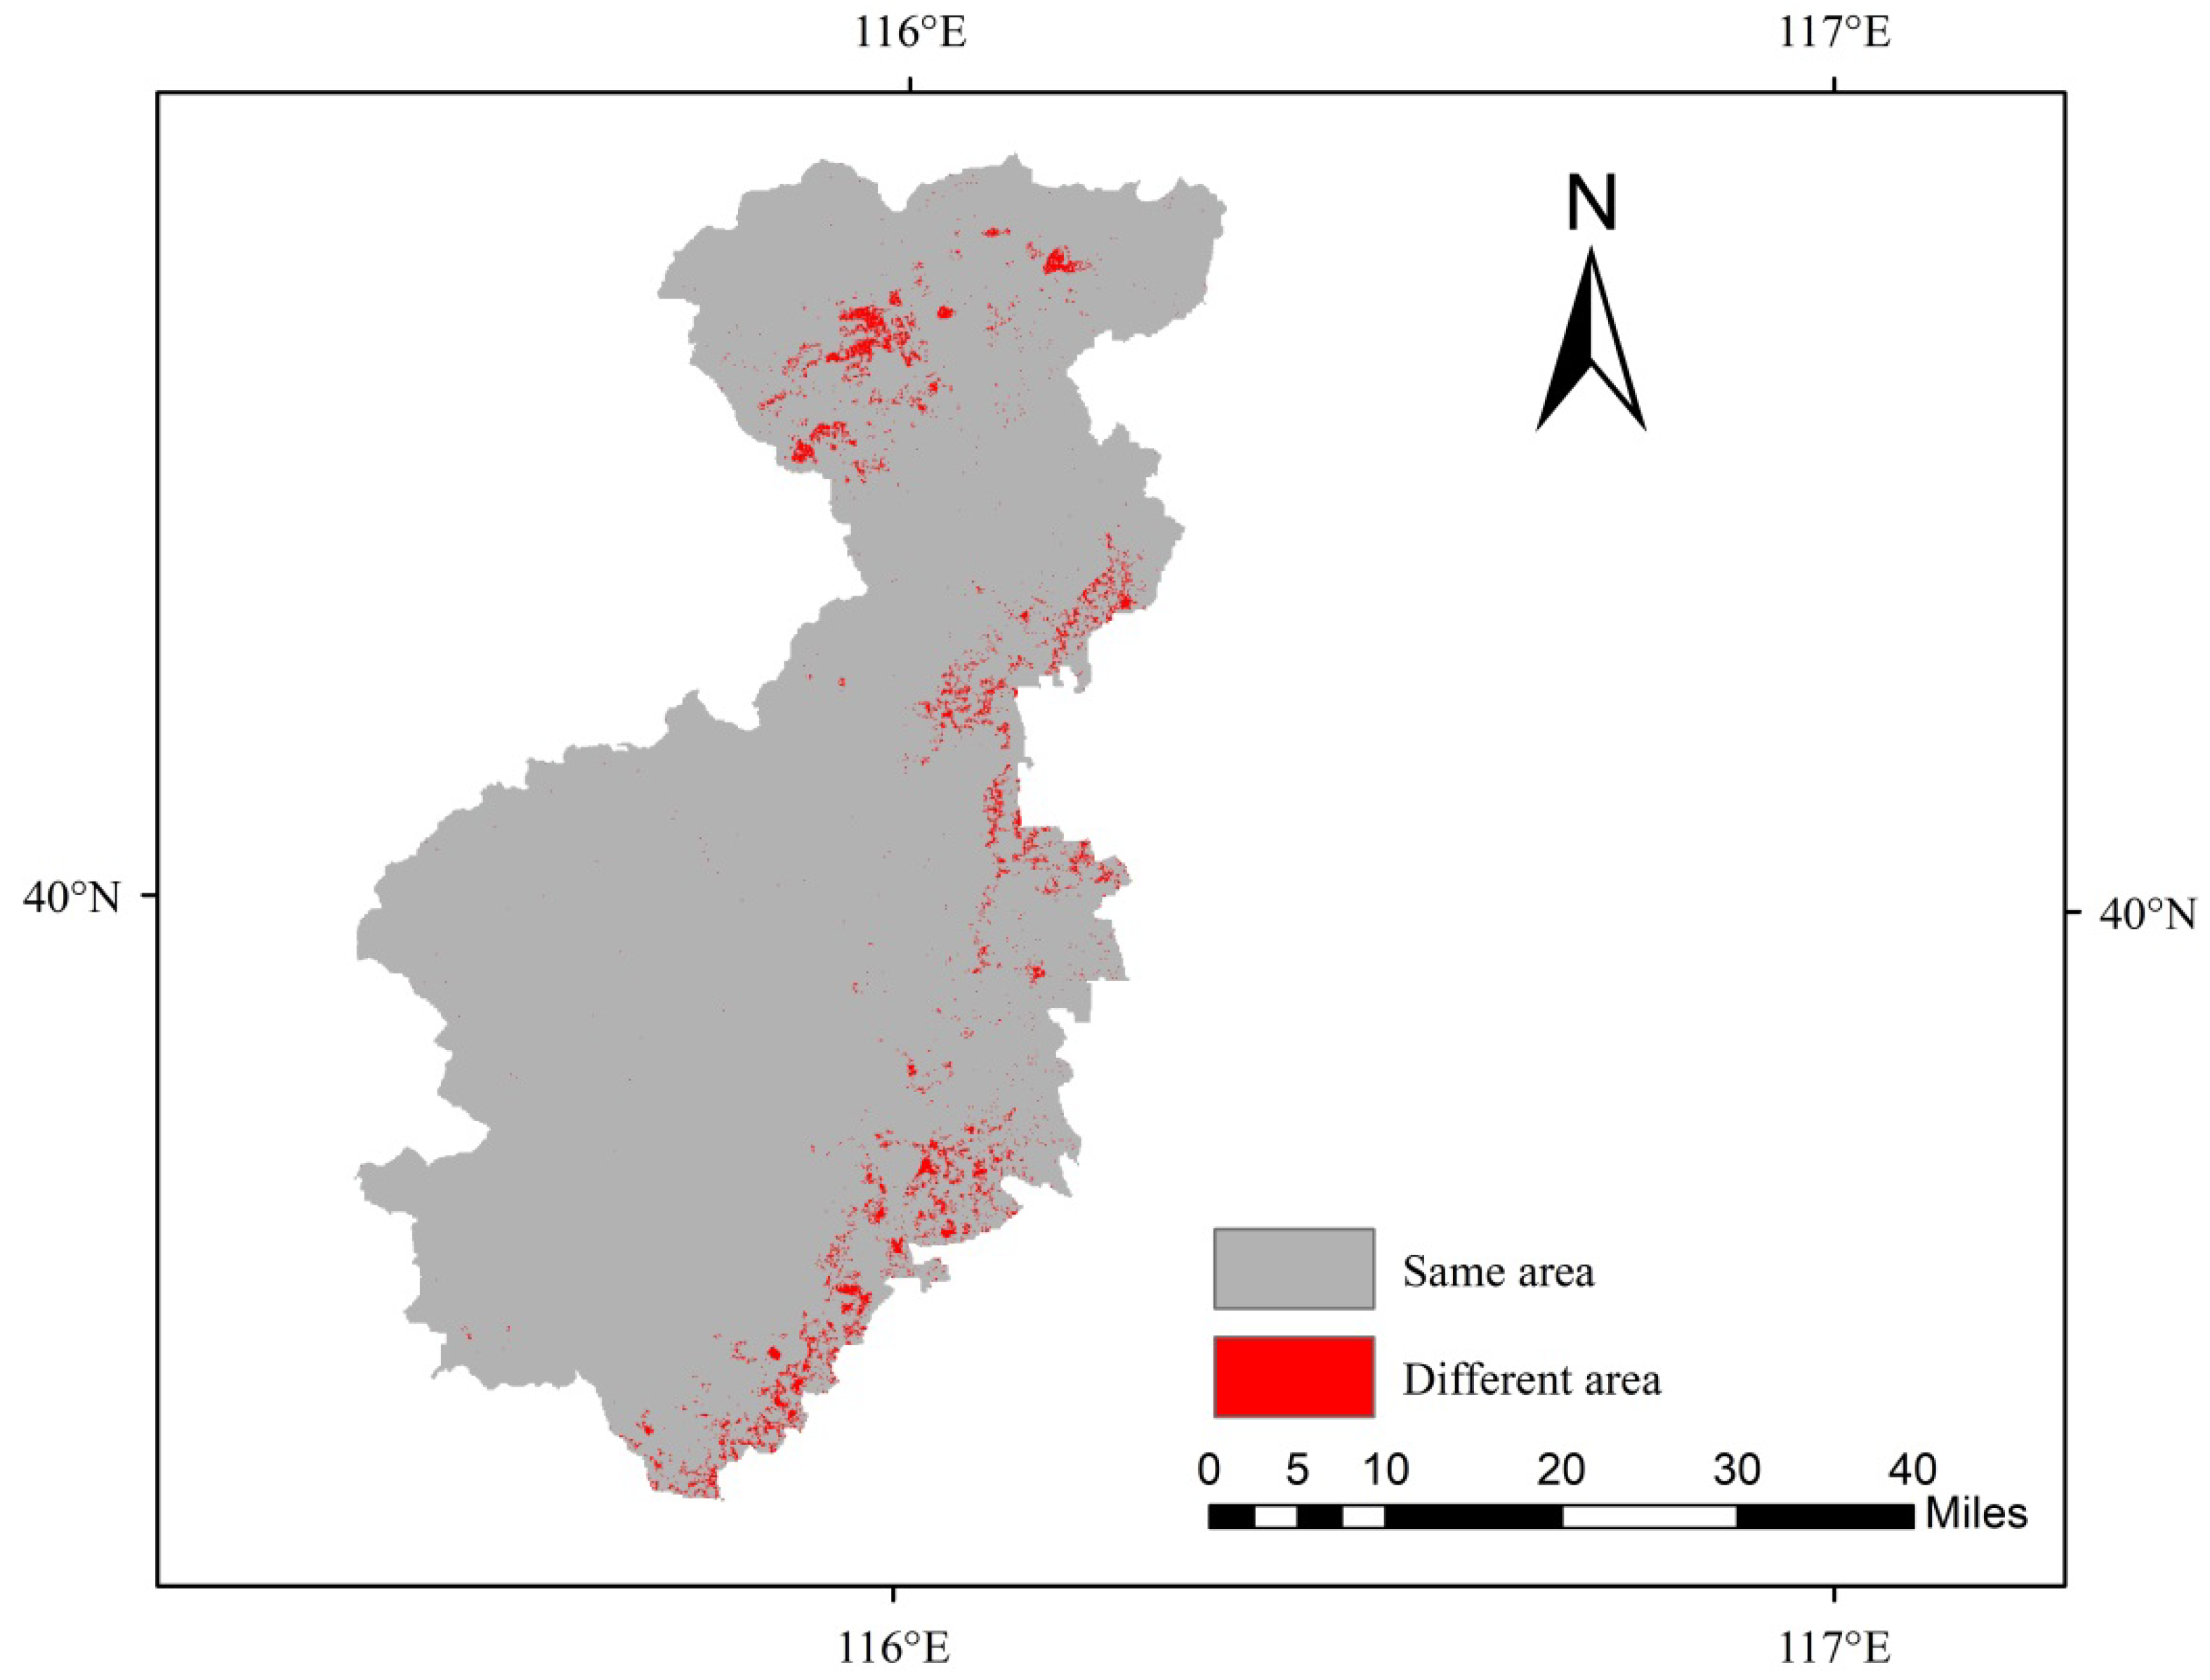
3.4. Comparison and Accuracy Evaluation of Simulation Results
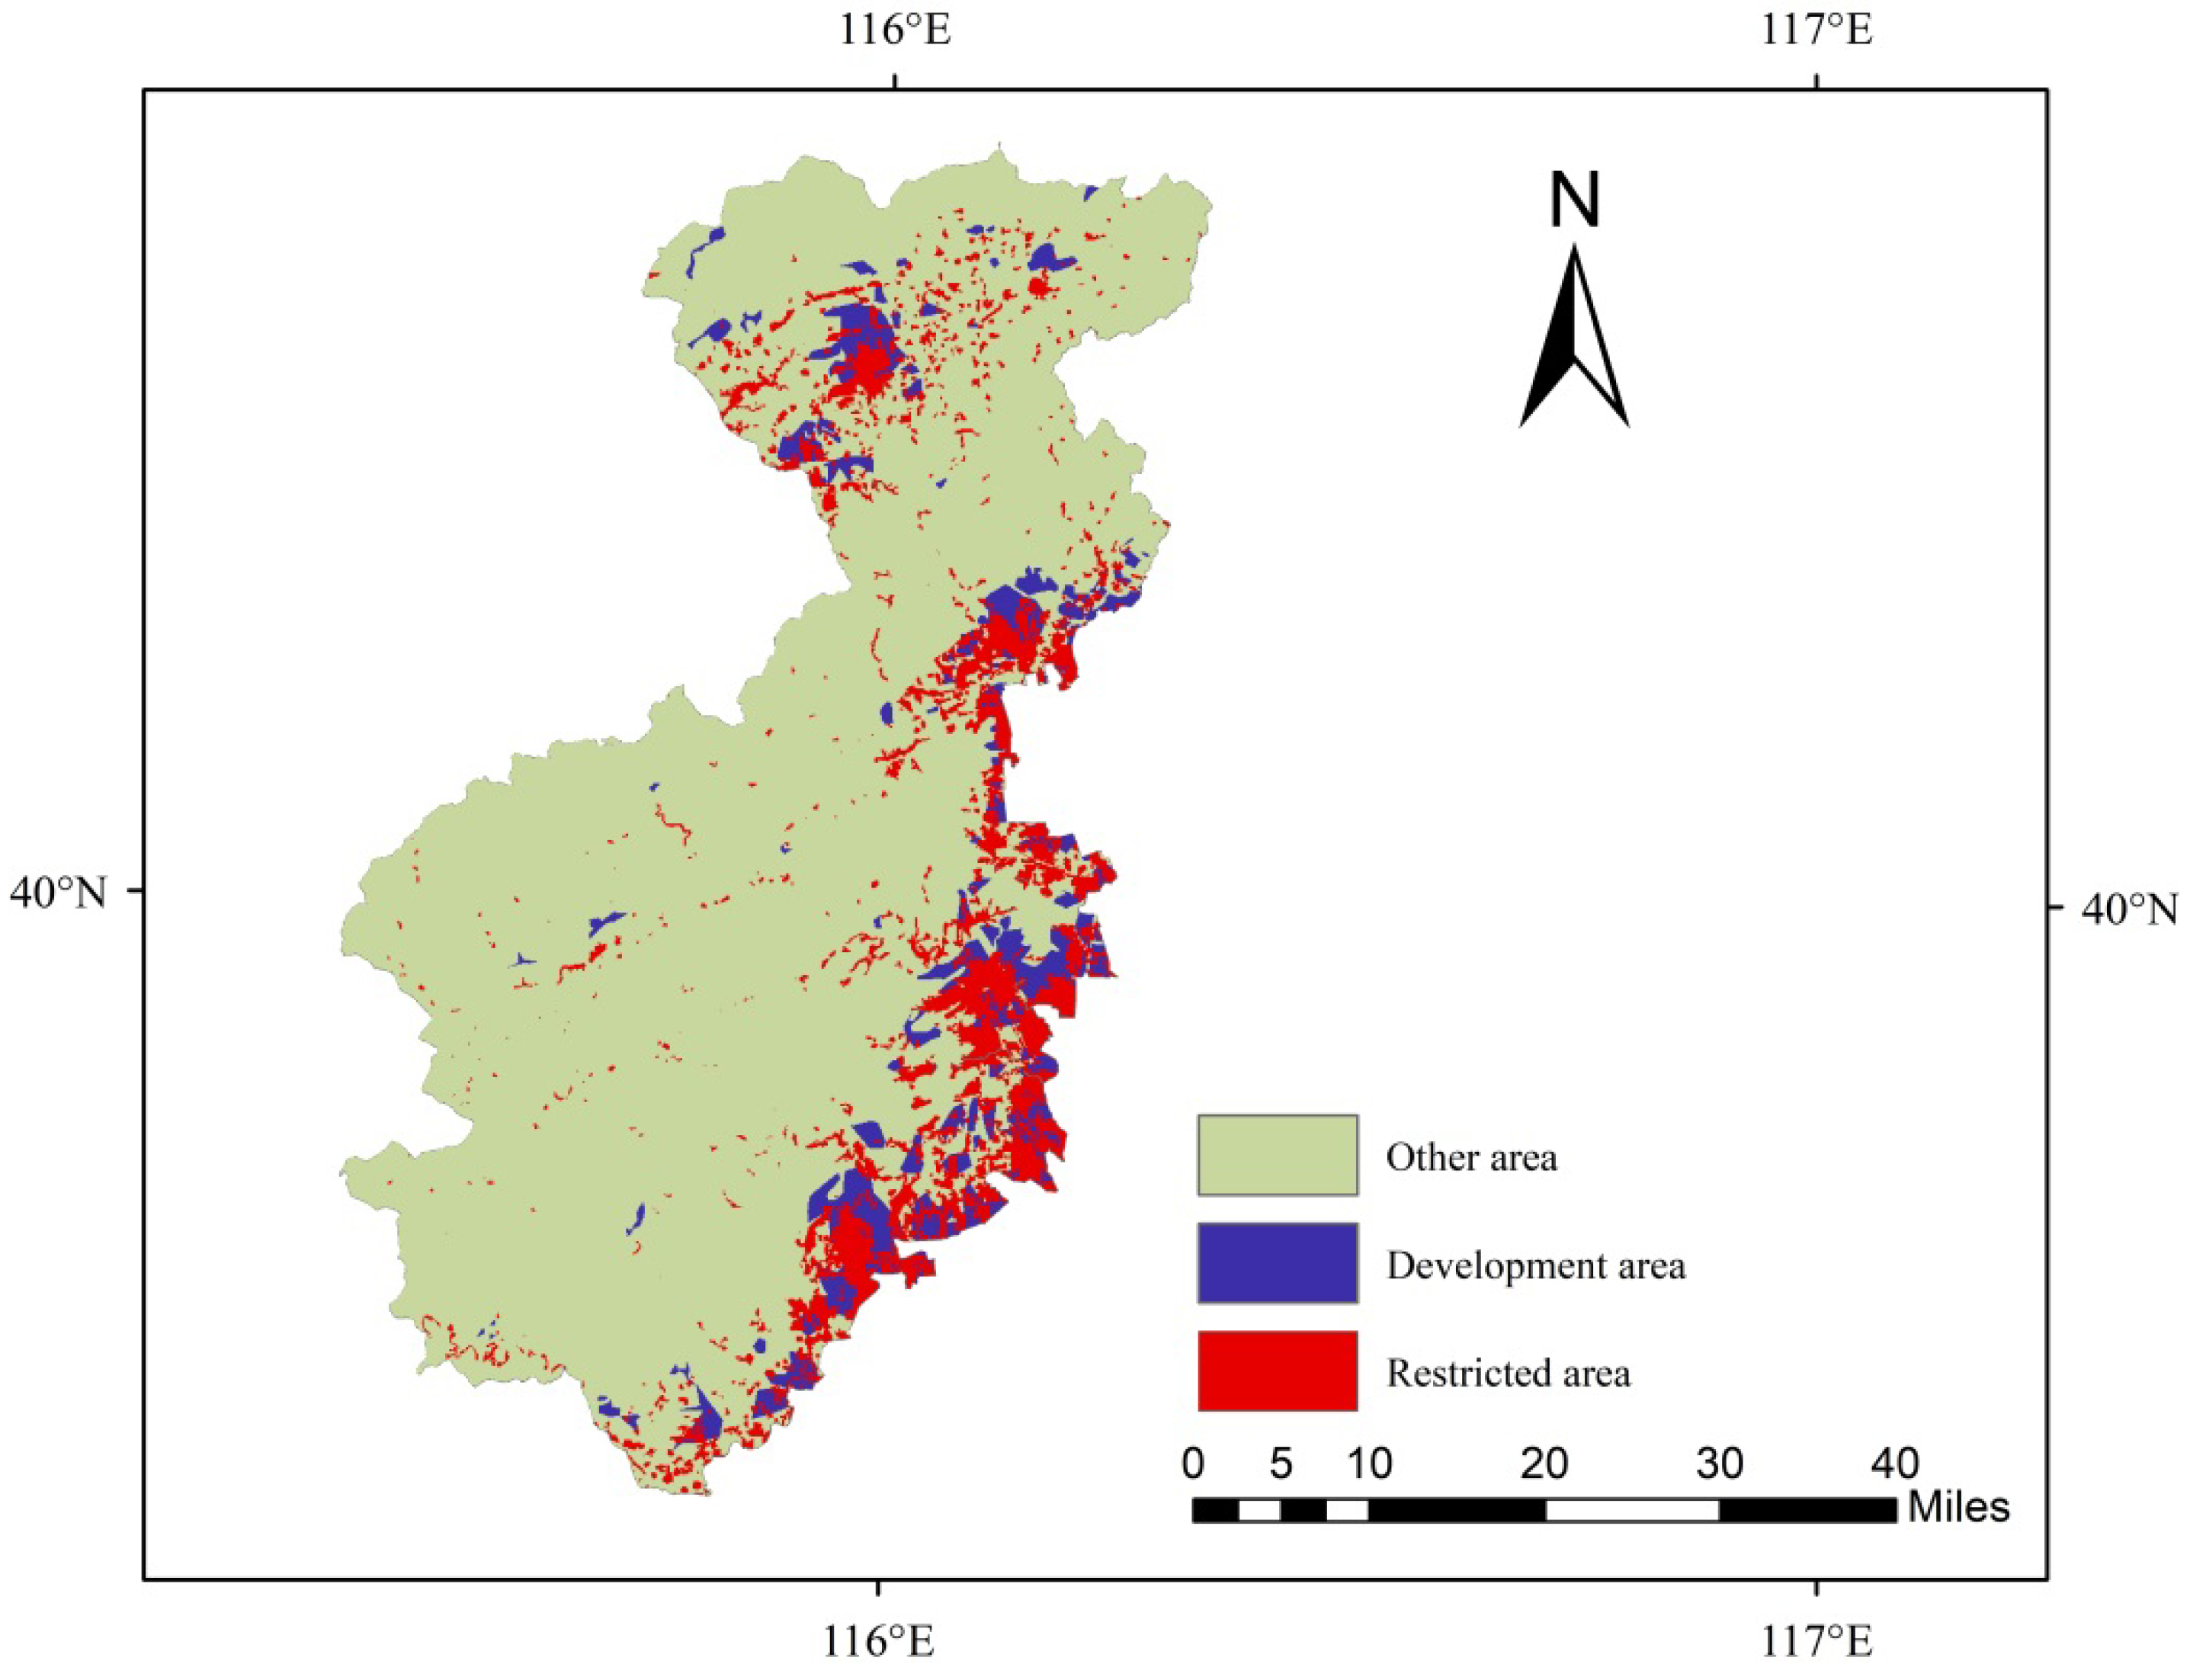
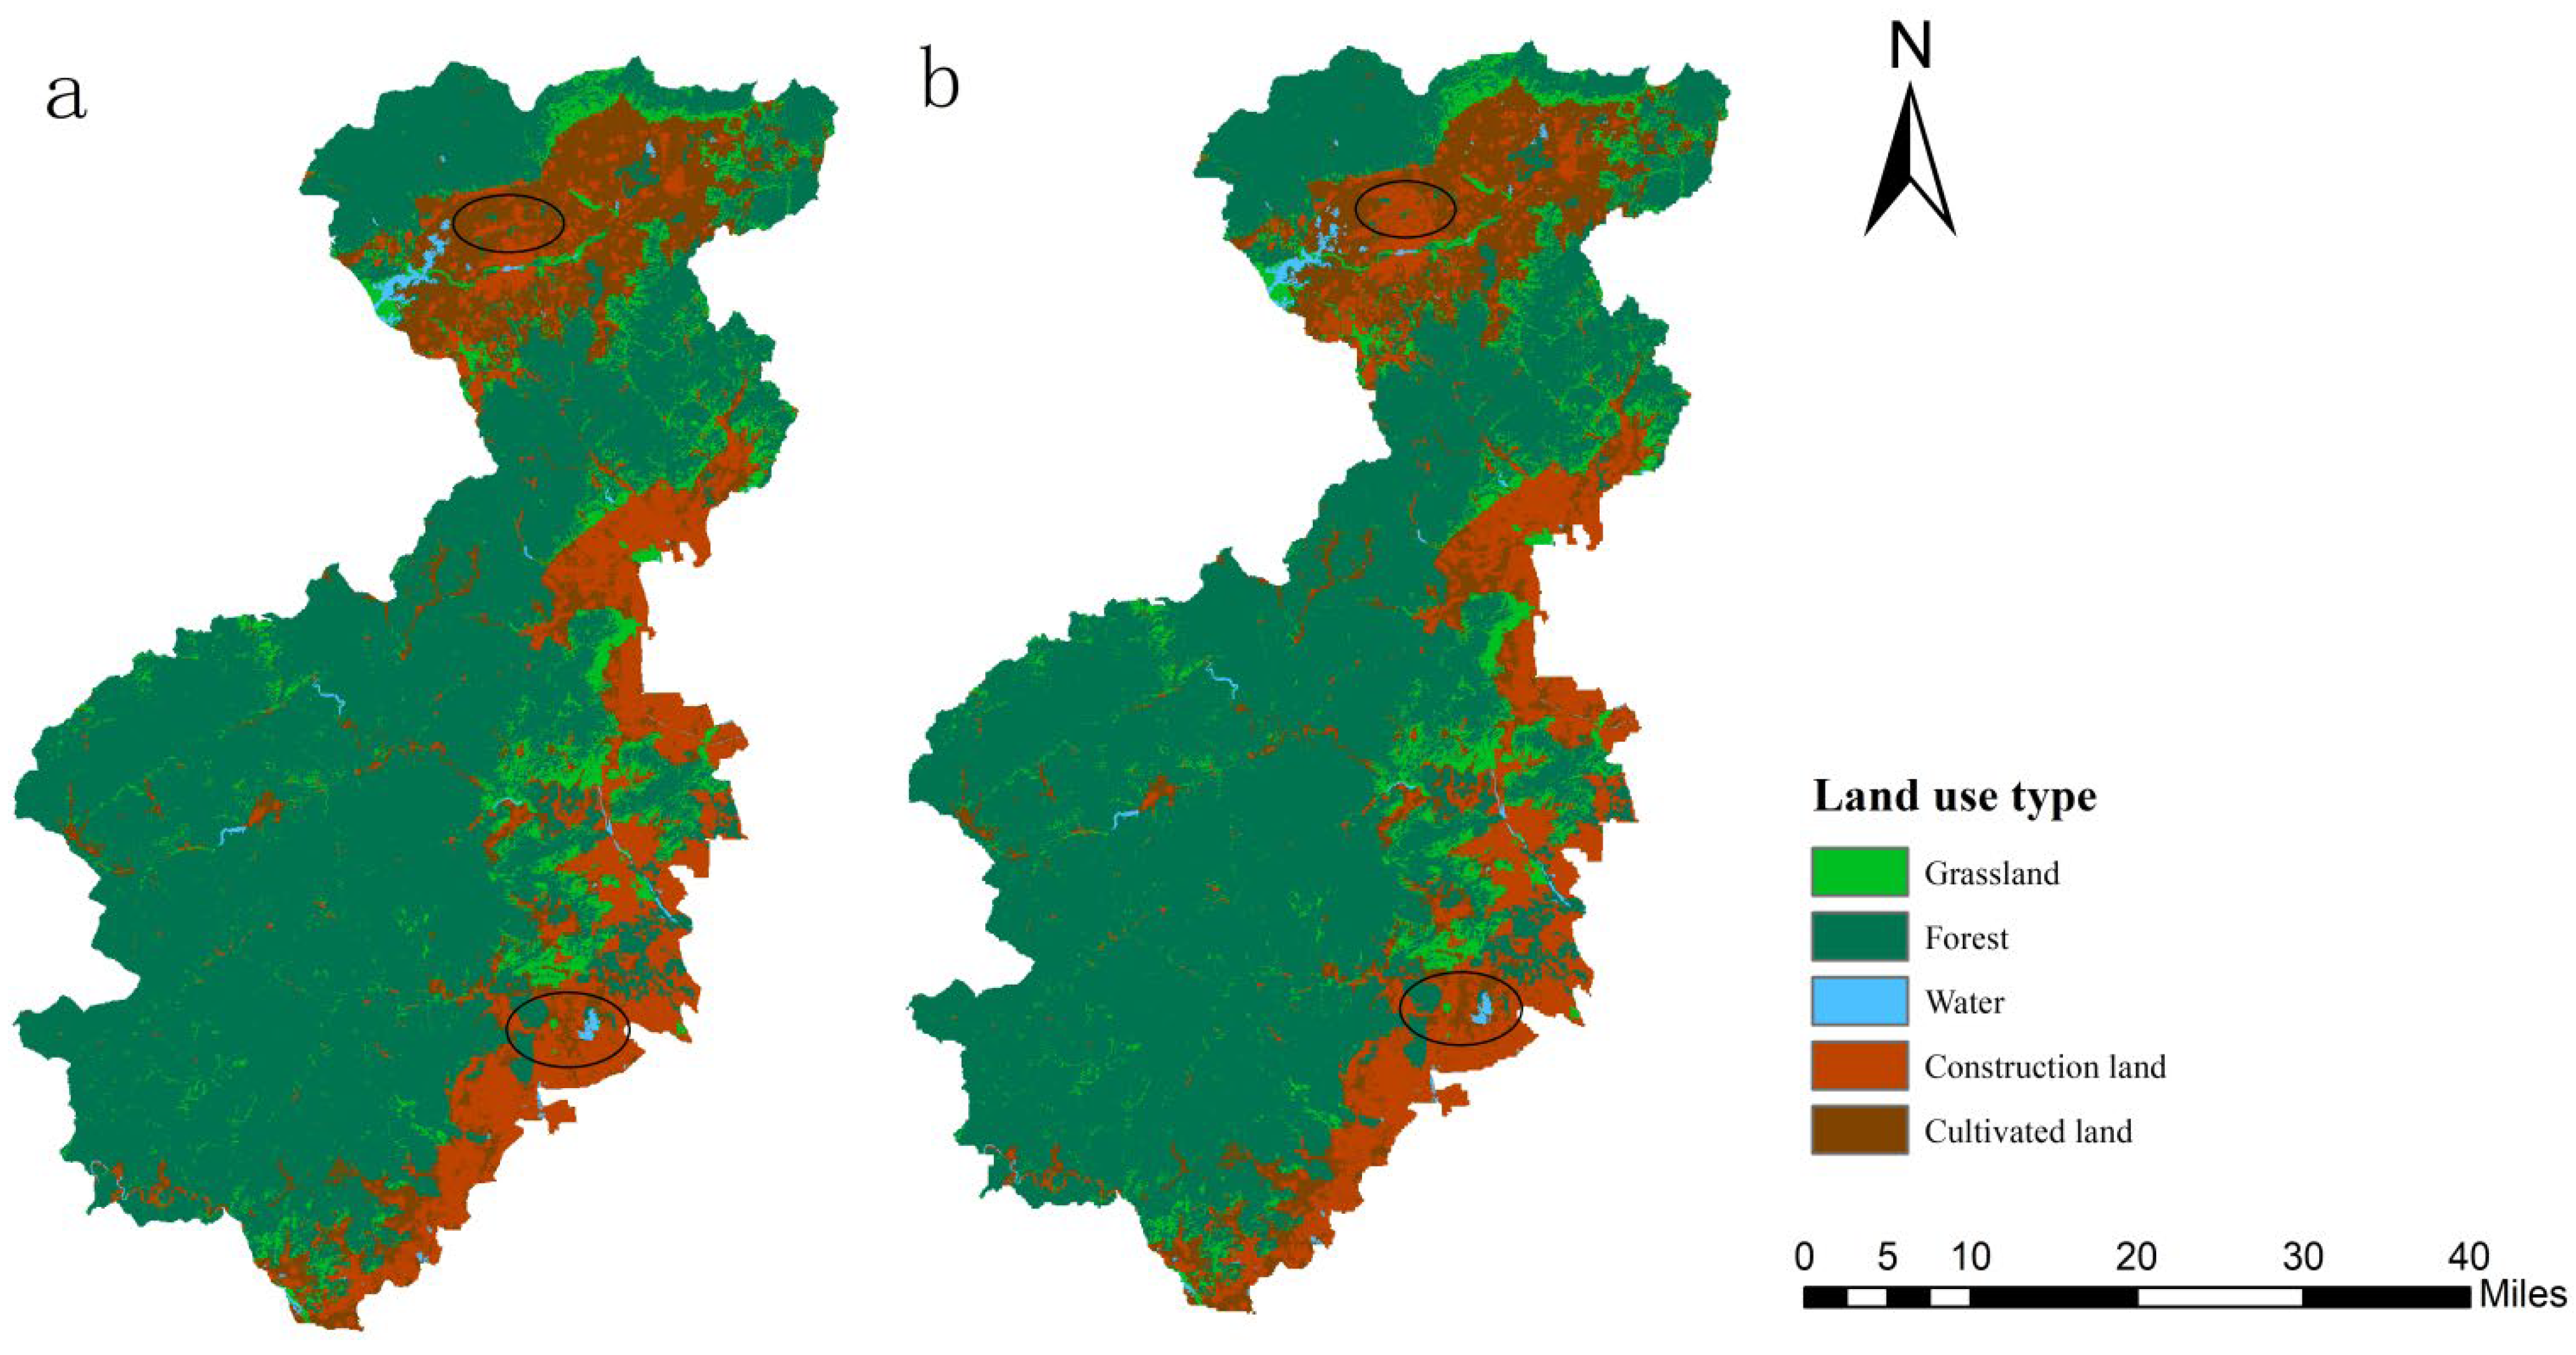
The parameters (pixel number of future land type, constraint matrix and neighborhood weight), constraint map and land-use data of the ECA in western Beijing in 2010 were imported into PLUS and FLUS models, respectively, and the land-use simulation results from 2020 were obtained (Figure 5).
We used mathematical statistics, the landscape pattern index and the Kappa coefficient to test the quantitative accuracy of the PLUS and FLUS models, the landscape similarity and spatial accuracy, respectively.
It can be concluded that the overall quantitative accuracy of the land-use maps simulated by the two models in the ECA in 2020 were above 75% on average, indicating a good simulation. The simulation effect of grassland, water and construction land in 2020 simulated by the PLUS model was slightly better than that of the FLUS model in quantitative accuracy (Table 9).
The land-use landscape indices in 2020 simulated by the PLUS model had greater similarity to the observed landscape pattern indices in 2020. Compared with the FLUS model, the PLUS model had eight landscape pattern indices (PARA_MN, PARA_AM, PARA_SD, PARA_CV, ENN_MN, ENN_AM, ENN_CV, PLADJ), which were closest to the observed data in 2020, suggesting that the simulation results of the PLUS model were generally more similar to the real landscape (Table 10).
The Kappa coefficient was used to test the reliability of the two models and evaluate the spatial similarity between the simulation results and the actual land-use classification. In this verification, the sampling rate was set to 0.01. The Kappa coefficient of the PLUS model was 0.7647, and that of the FLUS model was 0.7579. It can be seen that both models have high accuracy; however, the Kappa coefficient of the PLUS model is slightly higher than that of the FLUS model.
We can conclude that the accuracy of the PLUS and FLUS models to simulate the land use of the study area was high, but the simulation results of the PLUS model were more accurate in terms of quantitative accuracy, landscape quantitative comparison or spatial accuracy, indicating that this model is more suitable for the future prediction of land-use spatial structure simulation in this area. Therefore, we utilized the PLUS model to simulate the spatial distribution of future land-use types in the ECA in western Beijing.

3.5. Prediction

The PLUS model provides both linear regression and the Markov chain method to predict the categorization of land-use demand in the future. In this study, we utilized the output from the Markov chain. To reduce the potential for errors, due to the lack of elastic space in the Markov model, this study only predicted the number of land use in the next 10 years under the natural development situation of the region.
The PLUS model was used to predict the land-use status of the ECA in western Beijing in 2030 under two scenarios. Firstly, the natural development scenario and, secondly, including the influence of planning policy (Figure 6). In the first scenario of natural development, land change was not affected by other external factors and was only related to the characteristics of historical land change. Natural and geographical factors and economic and social conditions were consistent with the current situation, that is, setting the same pattern and speed of land-use change in 2020–2030 as in 2010–2020. In the second scenario, the planning policy mainly refers to the regional planning. Regional planning not only focuses on large-scale planning policies, which explicitly prohibit some construction areas, but also delineates areas that encourage development, such as the planning of development zones [38]. For our study, the planning development zone of the study area was taken as the planning policy. The data of the planning development zone comes from the General Plan of Beijing (2016–2035) issued by the Beijing Municipal People’s Government in 2017 [39] (Figure 7). Supported by ArcGIS 10.2, we made a restricted development zone and development zone map and added this to the PLUS (v1.3.5) CARS module, so that policy intensity had the development weight of 0.5 for development type 4 (construction land).
In both scenarios, the area of forest and cultivated land decreased by 188 hm2 and 17,220 hm2, respectively, and the area of grassland, water and construction land increased by 99 hm2, 689 hm2 and 16,620 hm2, respectively. Among them, more than 99% of the increased construction land came from cultivated land, and the increased areas of grassland, water and construction land mainly came from surrounding forest and cultivated land (Table 11 and Table 12).
The inconsistent areas predicted under the two scenarios can be seen in the diversity map (Figure 8). Compared with Figure 6 and Figure 7 and Table 11 and Table 12, it can be found that the inconsistent areas are mostly construction and cultivated land. There was 10 hm2 cultivated land converted to construction land under the natural development scenarios, which were converted to grassland and water under the influence of the regional planning policy. Compared with the natural scenario, in the regional planning policy impact scenario, the development area had more construction land. However, in the restricted area, the construction land was reduced. This demonstrates that the government’s planning policy can play a key role in the future land-use change.

4. Discussion

In our study of the land-use types of the ECA in western Beijing, forest land was dominant, accounting for about 67% of the total, and the proportion of water was smallest. Land-use dynamics suggested that the evolution of the quantitative structure of the study area is characterized by the continuous growth of construction land. Between 2000 and 2020, the single dynamic value of cultivated land and grassland was negative, indicating that cultivated land and grassland were decreasing. The land transfer matrix confirmed that the construction land had increased significantly from 2000 to 2020, with an increase of 29,568 hm2, coinciding with the large decrease in cultivated land of 19098 hm2, which was mainly converted into construction land. The result of the reduction of rural cultivated land in China was mainly related to the increase of construction land, which was consistent with the findings of Zhao et al. [40]. The change of land use in the study area inevitably leads to the change of landscape patterns in the region. At the overall landscape level, the degree of landscape fragmentation in the study area is reduced. On the scale of the landscape type, the LPI value of construction land increased significantly in the past 20 years. The fragmentation index of construction land is getting smaller and smaller, indicating that its distribution is more and more concentrated, and the residents’ lives are more concentrated. Furthermore, we found that incorporating the regional planning policy to protect the ECA using the planning development zone into our 2030 model prediction did result in a partial restriction in the conversion of cultivated land to construction land, highlighting the importance of planning policy in future land-use change.
Urbanization caused by the increase of construction land has the potential to bring a series of negative effects to human life and the environment. Shi et al. [41] indicated that urbanization can change the pattern of heavy rainfall in China. The research of Brend et al. [42] indicated that urbanization can endanger food security, thereby endangering human survival [40]. Yan et al. [43] revealed that urbanization can exacerbate daytime warming effects. Wei et al. [44] indicated that urbanization causes the change of PM2.5 concentration. Wu et al. [45] revealed that urbanization has inevitably caused environmental pollution. Lepeška et al. [46] found that urbanization in the Prądnik river basin had a direct impact on the water retention losses of this region. The research results of Wang et al. [47] showed that urbanization had a significant impact on the maximum temperature in Beijing in the past 10 years.
As our study has highlighted a rapid expansion of construction land in recent decades, it may be necessary to adopt a series of land policies to limit the increase of construction land and prevent the land-use pattern from developing in a negative direction in terms of environmental and societal ecosystem services. Hu et al. [48] believe that it is necessary to adopt a local-based policy to solve the problem of urban encroachment on farmland from the perspective of landscape sustainability. Our study highlighted that regional planning policies can impact on the degree of urbanization. Regional planning policies that were used in this article are issued by local governments. This policy has become a legal blueprint for urban development in Beijing after its approval by legal procedures. However, further work looking into the impact of planning policies is needed. In the study of Gong et al. [49], where the impact of six land-use policies on the future LUCC (land use and land cover) and the environmental sustainability of the landscape were assessed, they demonstrated that land-use policies did increase ecosystem services, but they also caused further water shortages. Zhang et al. [50] also explored multiple scenarios of urban expansion simulation under the multiple ecosystem services (MESs) constraint, and they found that, compared with the strong MESs constraint strategy, the “moderate MESs” (one scenario when β = 0.3, β is a power exponent that reflects the subjective preferences of decision makers) strategy was identified as providing the best outcome. Ma B. [51] and others proposed a policy of linking urban and rural construction land to prevent the continued decline of cultivated land, and this policy will affect the rural landscape pattern. Land price can also be an effective regulator of consistent urban expansion [25]. Based on this, we could also consider controlling land prices in the region to encourage sustainable development.
According to our research results, construction land in the study area has increased sharply in the past 20 years. The cost is the reduction of grassland, forest and cultivated land, which is not conducive to the sustainable development of the study area. We think that many other regions are also experiencing this. Therefore, combined with the peer studies in the last paragraph on land-use policy, this study made the following suggestions for the ECA of western Beijing:
  • Restrict new construction land and enhance land use economically. The expansion of construction land in the ECA in western Beijing is potentially insufficiently regulated, resulting in a chaotic spatial distribution that can have greater negative implications on the landscape. Therefore, in the next development plan, controls may be needed to limit the increase in construction land and improve the utilization rate of land resources. At the same time, existing construction land resources in the western suburbs of Beijing could be optimized to reduce damage caused by new construction to the environment.
  • Stick to the red line of cultivated land (a cultivated land protection system in China) and protect cultivated land resources. While urbanization is developing and building area is increasing, it also decreases the area of cultivated land around the city. Cultivated land is an important land resource that satisfies people’s most basic food, clothing, housing and transportation needs. The loss of cultivated land will hinder social and economic development. When planning the future land use in the ECA of western Beijing, we must pay attention to protecting the basic status of cultivated land and strictly control the further reduction of cultivated land.
  • Increase stakeholder knowledge and innovate suitable sustainable local land-use patterns.
  • Control land prices reasonably.
The analysis of landscape pattern change is a deeper measure of land-use change [34], and it is also an important means of studying landscape characteristics. In addition to using the land-transfer matrix and the land-use dynamic to analyze the spatial and temporal changes of land use, this study also increased the analysis of landscape pattern changes. In addition to the conventional quantitative and spatial accuracy verification, the landscape pattern index is added to compare and analyze the results of land-use simulation, so that the accuracy assessment is more nuanced.
When using the PLUS model to predict land use in the ECA of western Beijing, the demand of each area is predicted by the Markov model, and then the spatial pattern is allocated. However, the model only refers to historical data when predicting the quantity and does not take other factors into consideration. The accuracy of such simulation results can meet the basic needs, but there is still some gap with the observed land use. This is the main limitation of this study. Based on this, we can consider adding some parameters on the basis of the original model to improve accuracy. Due to the difficulty of obtaining data and the limitations of simulation, many factors have not been added to the model at this time, which will inevitably have an impact on the accuracy of future land prediction results. Therefore, increasing the way to obtain data and improving the model are very important to improve the similarity with observed data. The setting of model parameters is very important to the quality of the simulation effect. When setting the parameters, it is greatly affected by human subjective factors, which can produce large errors in the results. In future research, attention should be paid to the improvement of the model and adaptive tuning to achieve better simulation results. The PLUS model has recently been developed, and it is still in the initial stage of understanding, and therefore there is great potential for further work using this model.

5. Conclusions

This study used the land transfer matrix, land-use dynamics and landscape pattern index to analyze the temporal and spatial changes of land use in the study area from 2000 to 2020. We then evaluated the use of PLUS and FLUS models to simulate the land-use status in 2020 based on the real land-use change from 2010 to 2020, and by using the more accurate PLUS model, we were subsequently able to simulate and predict the probable land-use conditions of the study area in 2030 under the natural development scenario and assess the impact of the regional planning policy, enabling us to draw the following conclusions:
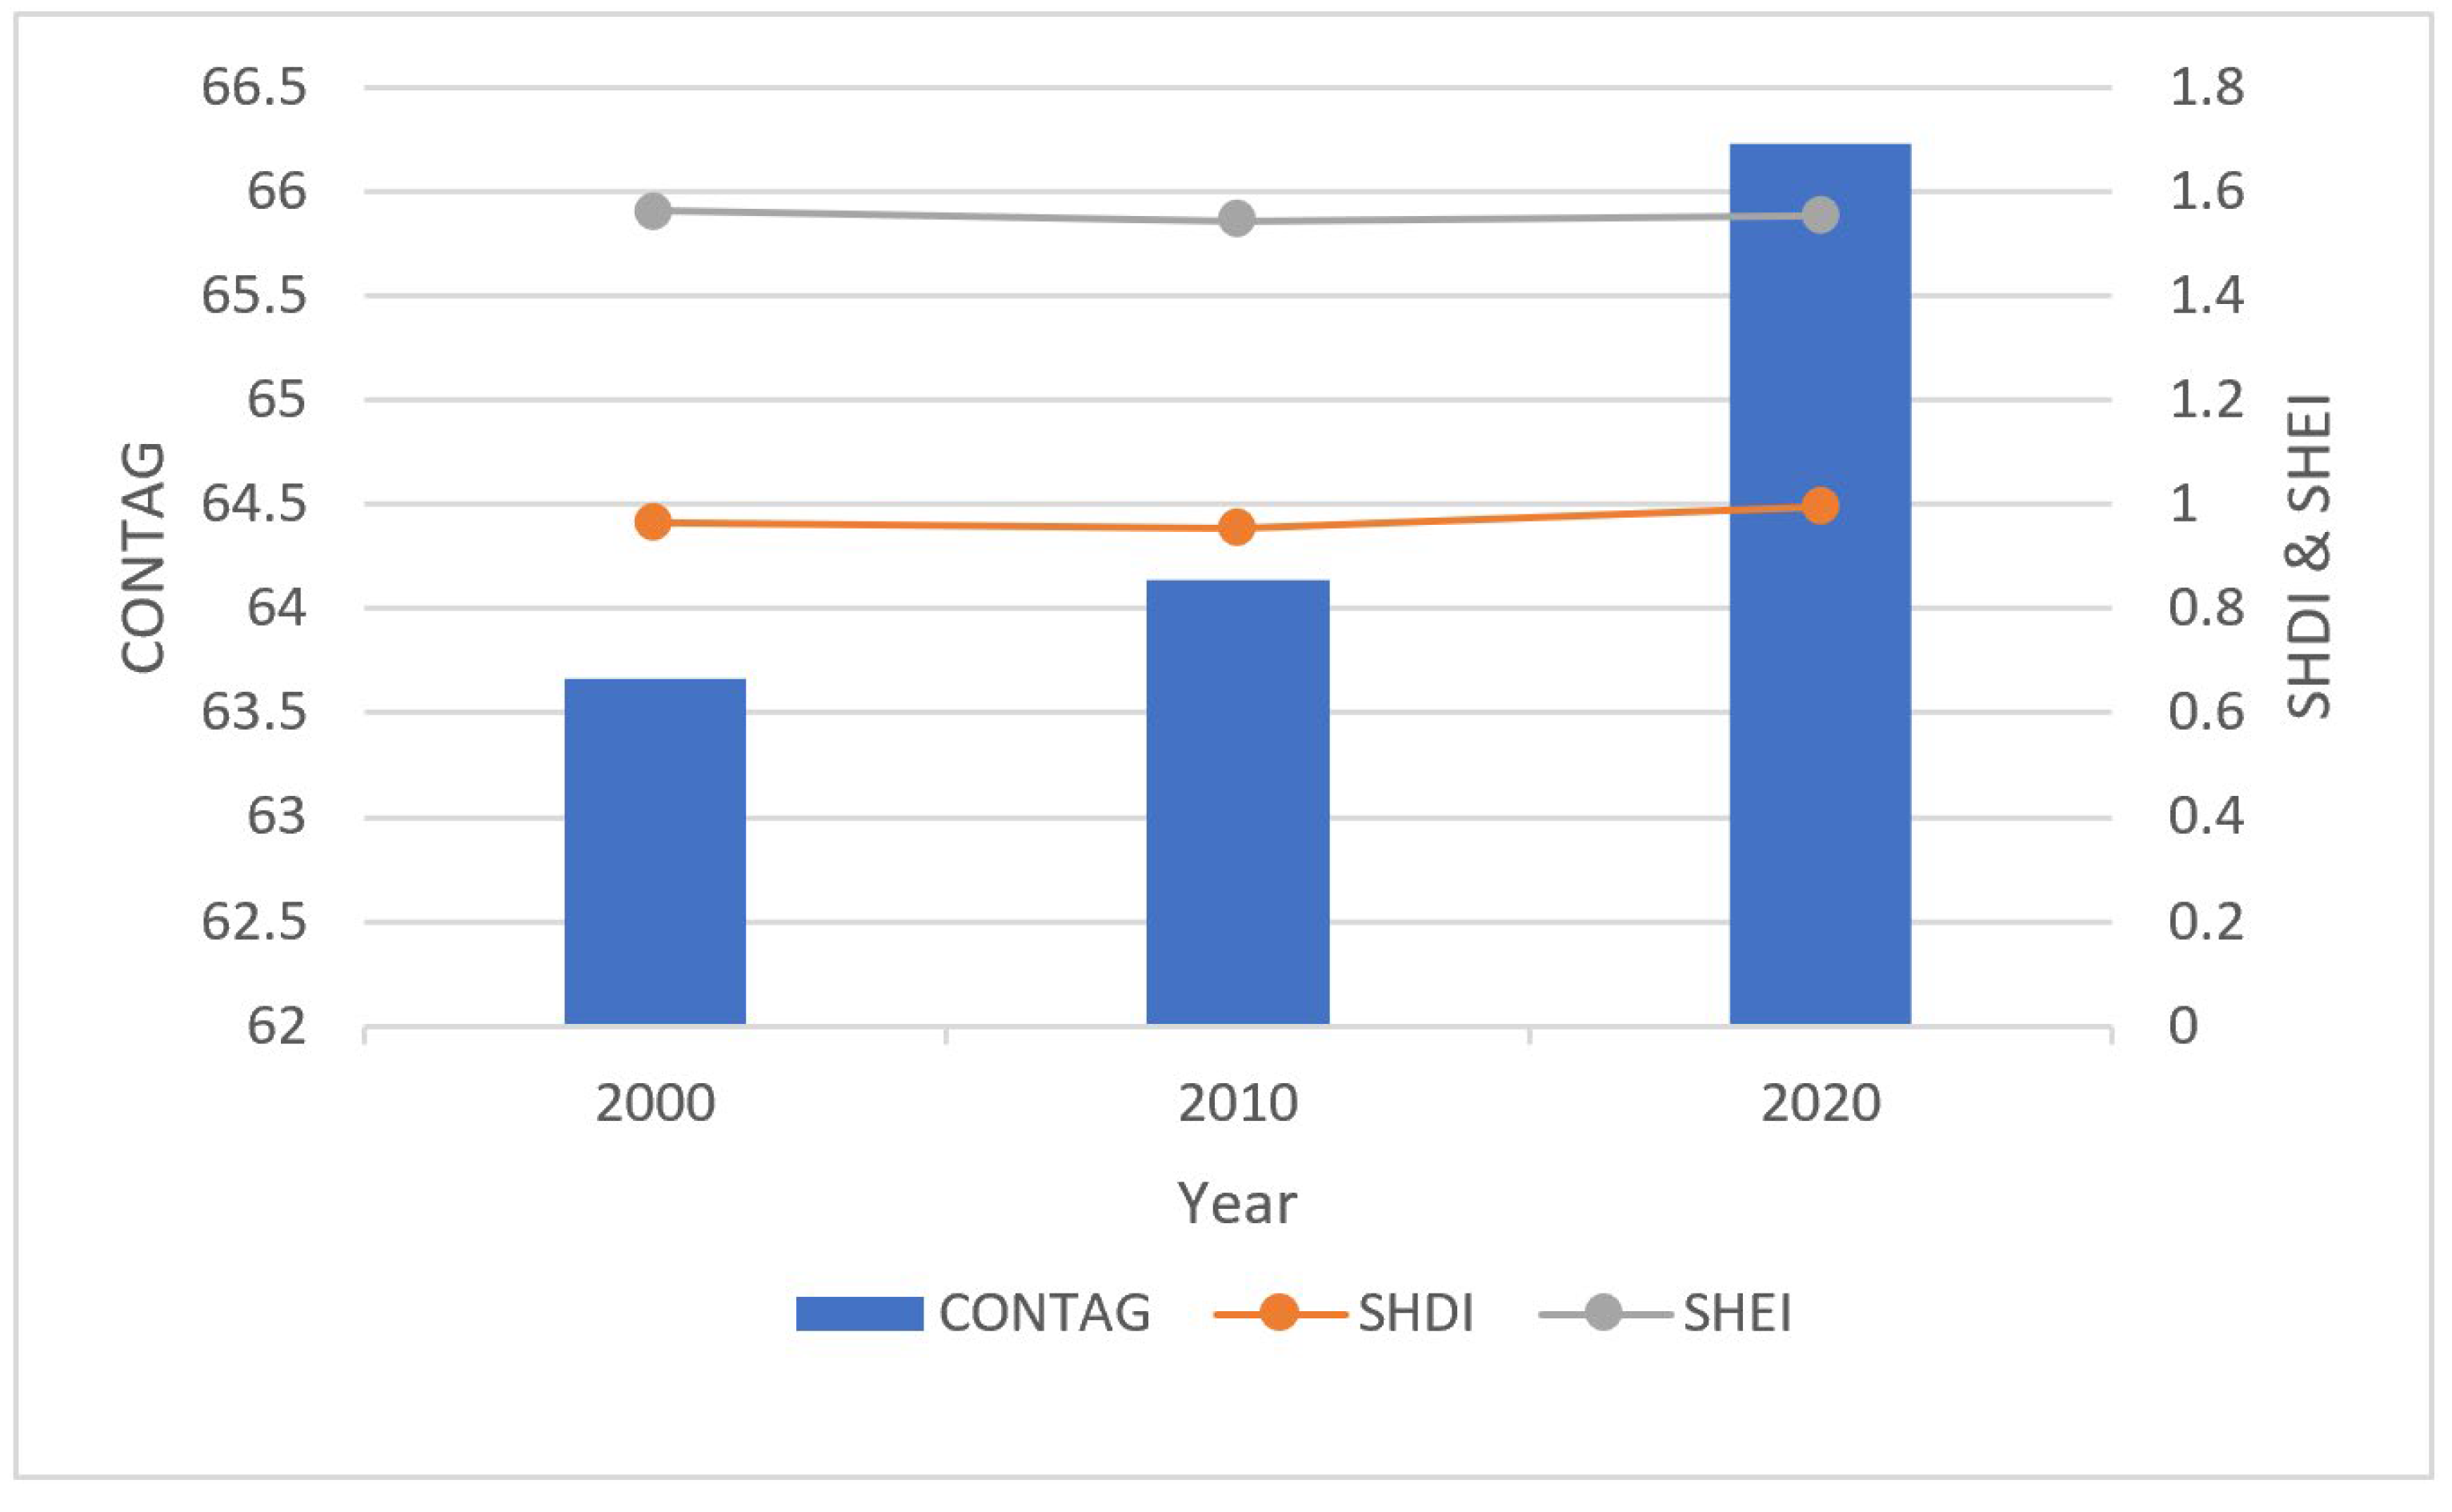
  • Forest is the main land-use type in this area, accounting for more than half of the area. In contrast, the proportion of water is the smallest. The area of construction land in the study area continued to increase from 2000 to 2020. The landscape is becoming more and more diversified; however, patch connectivity is good, but the landscape fragmentation of water and grassland is increasing from 2000 to 2020.
  • When simulating the land-use conditions in the study area, the PLUS model is better than the FLUS model in terms of the numerical accuracy of the simulation results, the quantitative comparison of landscapes and the spatial accuracy.
  • The prediction results show that construction land will continue to increase in 2030, forest and cultivated land will continue to decrease and government policies can play a role in land-use changes.
  • There is an unsustainable land-use pattern in the ECA of western Beijing, which needs to be adjusted as soon as possible, otherwise it will affect the ecological environment.

Author Contributions

Conceptualization, J.W., B.L. and Z.W.; methodology, J.W., B.L., Z.W. and J.Z.; software, B.L., Z.W. and E.L.C.; validation, J.Z., B.L., Z.W. and E.L.C.; formal analysis, J.Z., B.L., Z.W. and E.L.C.; investigation, J.Z., B.L., Z.W. and E.L.C.; resources, N.X. and J.W.; data curation, B.L., Z.W. and E.L.C.; writing—original draft preparation, J.Z.; writing—review and editing, J.Z., J.W., B.L., Z.W., E.L.C. and N.X.; visualization, J.Z., J.W., B.L., Z.W., E.L.C. and N.X.; supervision, N.X and J.W.; project administration, J.W., N.X. and J.Z.; funding acquisition, N.X and J.W. All authors have read and agreed to the published version of the manuscript.

Funding

This research was funded by the Fundamental Research Funds for the Natural Science Foundation of China (42101473, 42071342, 42171329) and the Beijing Natural Science Foundation Program (8222052, 8222069).

Data Availability Statement

Global land cover data were downloaded from http://globeland30.org (accessed on 10 March 2021). The elevation data were calculated from the national DEM data (spatial resolution is 250 m) and downloaded from the Resource and Environment Science and Data Center (http://www.resdc.cn, accessed on 10 March 2021) The national population density (people/km2) and GDP spatial distribution (yuan/km2) data-set was provided by the Resource and Environmental Science and Data Center.

Acknowledgments

We are grateful to the undergraduate students and staff of the Laboratory of Forest Management and “3S” technology, Beijing Forestry University.

Conflicts of Interest

The authors declare no conflict of interest.

References

  1. Zhu, A.X.; Chen, L.J.; Qin, C.Z.; Wang, P.; Liu, J.Z.; Li, R.K.; Cai, Q.G. New paradigm for soil and water conservation: A method based on watershed process modeling and scenario analysis. Chin. J. Appl. Ecol. 2012, 23, 1883–1890. [Google Scholar]
  2. Hu, Y.F.; Zhang, Y.Z.; Han, Y.Q. Identification and monitoring of desertification lands in China from 2000–2015. Arid. Land Geogr. 2018, 41, 1321–1332. [Google Scholar]
  3. Jin, G.; Chen, K.; Liao, T.; Zhang, L. Measuring ecosystem services based on government intentions for future land use in Hubei Province: Implications for sustainable landscape management. Landsc. Ecol. 2021, 36, 2025–2042. [Google Scholar] [CrossRef]
  4. Pekin, B.K.; Pijanowski, B.C. Global land use intensity and the endangerment status of mammal species. Divers. Distrib. 2012, 18, 909–918. [Google Scholar] [CrossRef]
  5. Shen, G.; Yang, X.C.; Jin, Y.X.; Luo, S.; Xu, B.; Zhou, Q.B. Land use changes in the Zoige Plateau based on the object-oriented method and their effects on landscape patterns. Remote Sens. 2020, 12, 14. [Google Scholar] [CrossRef] [Green Version]
  6. Thomas, H.; Thomas, R.L.; Laurence, H.M.; Cédric, G.; Darrell, N.; Christopher, A.B.; Kristi, S. Exploring subtle land use and land cover changes: A framework for future landscape studies. Landsc. Ecol. 2010, 25, 249–266. [Google Scholar] [CrossRef] [Green Version]
  7. Kolios, S.; Stylios, C.D. Identification of land cover/land use changes in the greater area of the Preveza peninsula in Greece using Landsat satellite data. Appl. Geogr. 2013, 40, 150–160. [Google Scholar] [CrossRef]
  8. Wondrade, N.; Dick, Ø.B.; Tveite, H. GIS based mapping of land cover changes utilizing multi-temporal remotely sensed image data in Lake Hawassa Watershed, Ethiopia. Environ. Monit. Assess. 2014, 186, 1765–1780. [Google Scholar] [CrossRef]
  9. Wu, T.S.; Feng, F.; Lin, Q.; Bai, H.M. A spatio-temporal prediction of NDVI based on precipitation: An application for grazing management in the arid and semi-arid grasslands. Int. J. Remote Sens. 2020, 41, 2359–2373. [Google Scholar] [CrossRef]
  10. Zhao, D.Y.; Xiao, M.Z.; Huang, C.B.; Liang, Y.; Yang, Z.T. Land use scenario simulation and ecosystem service management for different regional development models of the Beibu Gulf Area. China. Remote Sens. 2021, 13, 3161. [Google Scholar] [CrossRef]
  11. Chen, Z.Z.; Huang, M.; Zhu, D.Y.; Altan, O. Integrating remote sensing and a Markov-FLUS model to simulate future land use changes in Hokkaido, Japan. Remote Sens. 2021, 13, 2621. [Google Scholar] [CrossRef]
  12. Tadesse, L.; Suryabhagavan, K.V.; Sridhar, G.; Legesse, G. Landuse and landcover changes and Soil erosion in Yezat Watershed, North Western Ethiopia. Int. Soil Water Conserv. Res. 2017, 5, 85–94. [Google Scholar] [CrossRef] [Green Version]
  13. Debnath, J.; Das, N.; Ahmed, I.; Bhowmik, M. Channel migration and its impact on land use/land cover using RS and GIS: A study on Khowai River of Tripura, North-East India. Egypt. J. Remote Sens. Space Sci. 2017, 20, 197–210. [Google Scholar] [CrossRef]
  14. Tran, D.X.; Pla, F.; Latorre, C.P.; Myint, S.W.; Caetano, M.; Kieu, H.V. Characterizing the relationship between land use land cover change and land surface temperature. ISPRS J. Photogramm. Remote Sens. 2017, 124, 119–132. [Google Scholar] [CrossRef] [Green Version]
  15. Saifullah, K.; Barus, B.; Rustiadi, E. Spatial modelling of land use/cover change (LUCC) in South Tangerang City, Banten. In IOP Conference Series: Earth and Environmental Science; IOP Publishing: Bristol, UK, 2017; Volume 54, pp. 012–018. [Google Scholar] [CrossRef]
  16. Wu, M.; Ren, X.Y.; Che, Y.; Yang, K. A Coupled SD and CLUE-S Model for Exploring the Impact of Land Use Change on Ecosystem Service Value: A Case Study in Baoshan District, Shanghai, China. Environ. Manag. 2015, 56, 402–419. [Google Scholar] [CrossRef] [PubMed]
  17. Schiff, J.L. Cellular Automata: A Discrete View of the World; John Wiley & Sons: Hoboken, NJ, USA, 2007. [Google Scholar] [CrossRef]
  18. Basse, R.M.; Omrani, H.; Charif, O.; Gerber, P.; Bódis, K. Land use changes modelling using advanced methods: Cellular automata and artificial neural networks. The spatial and explicit representation of land cover dynamics at the cross-border region scale. Appl. Geogr. 2014, 53, 160–171. [Google Scholar] [CrossRef]
  19. Ku, C.A. Incorporating spatial regression model into cellular automata for simulating land use change. Appl. Geogr. 2016, 69, 1–9. [Google Scholar] [CrossRef]
  20. Gharaibeh, A.; Shaamala, A.; Obeidat, R.; Al-Kofahi, S. Improving land-use change modeling by integrating ANN with Cellular Automata-Markov Chain model. Heliyon 2020, 6, e05092. [Google Scholar] [CrossRef]
  21. Verburg, P.H.; Soepboer, W.; Veldkamp, A.; Limpiada, R.; Espaldon, V.; Mastura, S.S. Modeling the spatial dynamics of regional land use: The CLUE-S model. Environ. Manag. 2002, 30, 391–405. [Google Scholar] [CrossRef]
  22. Liu, X.P.; Liang, X.; Li, X.; Xu, X.; Ou, J.P.; Chen, Y.M.; Li, S.Y.; Wang, S.J.; Pei, F.S. A future land use simulation model (FLUS) for simulating multiple land use scenarios by coupling human and natural effects. Landsc. Urban Plan. 2017, 168, 94–116. [Google Scholar] [CrossRef]
  23. Liang, X.; Guan, Q.; Clarke, K.C.; Liu, S.S.; Wang, B.Y. Understanding the drivers of sustainable land expansion using a patch-generating simulation (PLUS) model: A case study in Wuhan, China. Comput. Environ. Urban Syst. 2021, 85, 101569. [Google Scholar] [CrossRef]
  24. Wu, Q.; Li, H.Q.; Wang, R.S.; Juergen, P.; He, Y.; Wang, M.; Wang, B.H.; Wang, Z. Monitoring and predicting land use change in Beijing using remote sensing and GIS. Landsc. Urban Plan. 2006, 78, 322–333. [Google Scholar] [CrossRef]
  25. Du, J.F.; Thill, J.C.; Peiser, R.B.; Feng, C.; Chun, C.C. Urban land market and land-use changes in post-reform China: A case study of Beijing. Landsc. Urban Plan. 2014, 124, 118–128. [Google Scholar] [CrossRef]
  26. Zheng, X.Q.; Zhao, L.; Xiang, W.N.; Li, N.; Lv, L.N.; Yang, X. A coupled model for simulating spatio-temporal dynamics of land-use change: A case study in Changqing, Jinan, China. Landsc Urban Plan. 2012, 106, 51–61. [Google Scholar] [CrossRef]
  27. Liu, T.; Yang, X.J. Monitoring land changes in an urban area using satellite imagery, GIS and landscape metrics. Appl. Geogr. 2015, 56, 42–54. [Google Scholar] [CrossRef]
  28. Hu, W.P.; He, J.B. Built-up land-cover change monitoring by remote sensing of urban area in the Pearl River Delta based on GIS. J. Remote Sens. 2003, 7, 201–206. [Google Scholar]
  29. Li, J.L.; Xu, J.Q.; Li, W.F.; Liu, C. Spatio-temporal characteristics of urbanization area growth in the Yangtze River Delta. Acta Geogr. Sin. 2007, 62, 437–447. [Google Scholar]
  30. Li, Z.Z.; Cheng, X.Q.; Han, H.R. Analyzing Land-Use Change Scenarios for Ecosystem Services and their Trade-Offs in the Ecological Conservation Area in Beijing, China. Int. J. Environ. Res. Public Health 2020, 17, 8632. [Google Scholar] [CrossRef]
  31. Gao, B.P.; Li, C.; Wu, Y.M.; Zheng, K.J.; Wu, Y. Landscape ecological risk assessment and influencing factors in ecological conservation area in Sichuan-Yunnan provinces, China. Ying Yong Sheng Tai Xue Bao 2021, 32, 1603–1613. [Google Scholar] [CrossRef]
  32. The People’s Government of Beijing Municipality. Notice of the Beijing Municipal People’ s Government on the Issuance of the Planning of the Main Functional Areas in Beijing. Available online: http://www.beijing.gov.cn/gongkai/guihua/lswj/yw/201907/t20190701_100164.html (accessed on 17 September 2012).
  33. Zhu, T.F. Land Use/Cover Change and Their Impact on Water Resource in North China Mountain region: A Case Study in Mentougou District, Beijing. Master’s Thesis, China Agricultural University, Beijing, China, 2014. [Google Scholar]
  34. Feng, Y.X.; Luo, G.P.; Zhou, D.C.; Han, Q.F.; Lu, L.; Xu, W.Q.; Zhu, L.; Yin, C.Y.; Dai, L.; Li, Y.Z. Effects of land use change on landscape pattern of a typical arid watershed in the recent 50 years: A case study on Manas River Watershed in Xinjiang. Acta Ecol. Sin. 2010, 30, 4295–4305. [Google Scholar]
  35. Hong, D.C. Analysis of Land Use and Landscape Pattern Change and Its Driving Factors in Kazakhstan. Master’s Thesis, Zhejiang University, Zhejiang, China, 2015. [Google Scholar]
  36. Pang, G.W. Quantitative Characterization of Human Factors Effecting the Soil Erosion Environmental. Master’s Thesis, Graduate University of Chinese Academy of Sciences, Beijing, China, 2012. [Google Scholar]
  37. Wang, X.L.; Bao, Y.H. Research methods of land use dynamic change. Prog. Geogr. 1999, 18, 81–87. [Google Scholar]
  38. Liang, X.; Liu, X.P.; Li, D.; Zhao, H.; Chen, G.Z. Urban growth simulation by incorporating planning policies into a CA-based future land-use simulation model. Int. J. Geogr. Inf. Sci. 2018, 32, 2294–2316. [Google Scholar] [CrossRef]
  39. The People’s Government of Beijing Municipality. Beijing Urban Master Plan (2016–2035). Available online: http://www.beijing.gov.cn/gongkai/guihua/wngh/cqgh/201907/t20190701_100008.html (accessed on 29 September 2017).
  40. Zhao, X.L.; Zhang, Z.; Wang, X.; Zuo, L.; Liu, B.; Yi, L.; Xu, J.; Wen, Q. Analysis of Chinese cultivated land’s spatial-temporal changes and causes in recent 30 years. Trans. Chin. Soc. Agric. Eng. 2014, 30, 1–11. [Google Scholar]
  41. Shi, P.J.; Bai, X.M.; Kong, F.; Fang, J.Y.; Gong, D.Y.; Zhou, T.; Guo, Y.; Liu, Y.S.; Dong, W.J.; Wei, Z.G.; et al. Urbanization and air quality as major drivers of altered spatiotemporal patterns of heavy rainfall in China. Landsc. Ecol. 2017, 32, 1723–1738. [Google Scholar] [CrossRef] [Green Version]
  42. Brend, A.C.; Reitsma, F.; Baiocchi, G.; Barthel, S.; Güneralp, B.; Erb, K.H.; Haberl, H.; Creutzig, F.; Seto, K.C. Future urban land expansion and implications for global croplands. Proc. Natl. Acad. Sci. USA 2017, 114, 8939–8944. [Google Scholar] [CrossRef] [Green Version]
  43. Yan, Z.M.; Zhou, D.C.; Li, Y.; Zhang, L.X. An integrated assessment on the warming effects of urbanization and agriculture in highly developed urban agglomerations of China. Sci. Total Environ. 2021, 804, 150119. [Google Scholar] [CrossRef]
  44. Wei, G.E.; Sun, P.J.; Jiang, S.N.; Shen, Y.; Liu, B.L.; Zhang, Z.K.; Ouyang, X. The Driving Influence of Multi-Dimensional Urbanization on PM2.5 Concentrations in Africa: New Evidence from Multi-Source Remote Sensing Data, 2000–2018. Int. J. Environ. Res. Public Health 2021, 18, 9389. [Google Scholar] [CrossRef] [PubMed]
  45. Wu, J.G.; Xiang, W.N.; Zhao, J.Z. Urban ecology in China: Historical developments and future directions. Landsc. Urban Plan. 2014, 125, 222–233. [Google Scholar] [CrossRef]
  46. Lepeška, T.; Wojkowski, J.; Wałęga, A.; Młyński, D.; Radecki-Pawlik, A.; Olah, B. Urbanization—Its Hidden Impact on Water Losses: Prądnik River Basin, Lesser Poland. Water 2020, 12, 1958. [Google Scholar] [CrossRef]
  47. Wang, Y.J.; Ren, Y.Y.; Song, L.C.; Xiang, Y. Responses of extreme high temperatures to urbanization in the Beijing–Tianjin–Hebei urban agglomeration in the context of a changing climate. Meteorol. Appl. 2021, 28, 2024. [Google Scholar] [CrossRef]
  48. Hu, G.H.; Li, X.; Zhou, B.B.; Xing, M.; Ma, Q.; Liu, Y.L.; Chen, Y.M.; Liu, X.P. How to minimize the impacts of urban expansion on farmland loss: Developing a few large or many small cities? Landsc. Ecol. 2020, 35, 2487–2499. [Google Scholar] [CrossRef]
  49. Gong, B.H.; Liu, Z.F. Assessing impacts of land use policies on environmental sustainability of oasis landscapes with scenario analysis: The case of northern China. Landsc. Ecol. 2020, 36, 1913–1932. [Google Scholar] [CrossRef]
  50. Zhang, Y.; Chang, X.; Liu, Y.F.; Lu, Y.C.; Wang, Y.H.; Liu, Y.L. Urban expansion simulation under constraint of multiple ecosystem services (MESs) based on cellular automata (CA)-Markov model: Scenario analysis and policy implications. Land Use Policy 2021, 108, 105667. [Google Scholar] [CrossRef]
  51. Ma, B.; Tian, G.; Kong, L.; Liu, X.J. How China’s linked urban-rural construction land policy impacts rural landscape patterns: A simulation study in Tianjin, China. Landsc. Ecol. 2018, 33, 1417–1434. [Google Scholar] [CrossRef]
Figure 1. Location of the ECA study area within the Beijing boundary.
Remotesensing 14 01452 g001
Figure 2. Technical analysis pathway for data preparation, simulation, analysis and prediction processes.
Remotesensing 14 01452 g002
Figure 3. Spatial distribution of land-use types in the ECA in western Beijing in: (a) 2000; (b) 2010; (c) 2020.
Remotesensing 14 01452 g003
Figure 4. The change of SHDI, SHEI and CONTAG in the ECA of western Beijing during 2000–2020.
Remotesensing 14 01452 g004
Figure 5. Land-use simulation maps of: (a) PLUS model; (b) FLUS model in the ECA of western Beijing in 2020.
Remotesensing 14 01452 g005
Figure 6. Planning development zones map of the ECA in western Beijing.
Remotesensing 14 01452 g006
Figure 7. Land-use simulation maps under the: (a) natural development scenario, and (b) regional planning policy impact scenario in the ECA of western Beijing in 2030. The black circles in this figure are different places between the two scenarios.
Remotesensing 14 01452 g007
Figure 8. The areas of diversity between the two scenarios of natural development and the implementation of regional planning of the ECA in western Beijing in 2030.
Remotesensing 14 01452 g008
Table 1. Land-use type classification for the ECA in western Beijing.
Land Type NumberLand Type NameDescription
1GrasslandLand types with surface coverage above 10% are mainly natural herbaceous vegetation, such as grassland, meadow and artificial grassland constructed by urban greening.
2ForestForest land mainly refers to the land surface covered by trees and shrubs. In the ECA of western Beijing, the coverage of tree crown and shrub is more than 30%. Common tree types include deciduous broad-leaved forest, deciduous coniferous forest, evergreen coniferous forest and mixed forest. Shrub types include mountain shrub, deciduous and evergreen shrub.
3WaterThe area covered by liquid water as is displayed on satellite images, such as rivers and lakes.
4Construction landHuman beings need to build artificial surfaces to meet the needs of living space and economic development. Common urban residential areas, villages, industrial and mining production land, traffic land, etc.
5Cultivated landLand used by rural residents to farm a variety of food crops and cash crops, such as irrigated drylands, vegetable greenhouses and land that grows fruit trees or other economically valuable trees.
Table 2. Land-use conversion matrix, where the horizontal land use describes the initial land-use state, and the vertical land use is the possible conversion pathways.
Land-Use TypeGrasslandForestWaterConstruction LandCultivated Land
Grassland11001
Forest11001
Water11101
Construction land11011
Cultivated land11001
Table 3. Neighborhood weights for land-use types.
Land-Use TypeGrasslandForestWaterConstruction LandCultivated Land
Neighborhood weight0.50.70.10.10.1
Table 4. The area of land-use type in the ECA in western Beijing from 2000 to 2020 (unit: hm2).
Land-Use Type200020102020
Area/hm2Proportion/%Area/hm2Proportion/%Area/hm2Proportion/%
Grassland49,913.559.6937,644.307.3037,845.817.35
Forest346,655.2567.26346,481.0167.23348,170.0467.58
Water2426.850.471088.190.212349.270.46
Construction land21,870.274.2428,844.015.6051,410.979.98
Cultivated land94,508.3718.34101,316.7819.6675,394.8914.63
Total area (hm2)515,374.29515,374.29515,374.29
Table 5. Land-use dynamic in the ECA of western Beijing from 2000 to 2020 for each land-use type and for the overall landscape dynamic.
Land-Use Type2000–2010
(% Change)
2010–2020
(% Change)
2000–2020
(% Change)
Grassland−2.4580.054−1.209
Forest−0.0050.0490.022
Water−5.51611.589−0.160
Construction land3.1897.8246.754
Cultivated land0.721−2.590−1.028
Overall dynamic0.2660.5050.304
Table 6. Land-use area transfer matrix from 2000 to 2020 (unit: hm2).
2000
2020
GrasslandForestWaterConstruction LandCultivated LandTotal 2020
Grassland30,191.943267.09509.58441.273450.1537,860.03
Forest5375.07335,275.02114.387.127463.52348,315.03
Water215.19243.991415.4399.45376.382350.44
Construction land5243.226361.11117.1820,001.1519,715.7651,438.42
Cultivated land8888.131508.04270.361241.2863,502.5675,410.37
Total 200049,913.55346,655.252426.8521,870.2794,508.37515,374.29
Table 7. Landscape class-level index change in the ECA of western Beijing from 2000 to 2000.
Landscape IndexYearGrasslandForestWaterConstruction LandCultivated Land
NP200019,7214240255397504
201021,2174279166716639
202020,1484032998331266
PD20003.82650.82270.04950.0770.0978
20104.11680.83030.03220.13890.124
20203.91090.78270.01920.16170.2457
LPI20000.456258.4130.21880.47585.5887
20100.346958.3500.02950.61347.7833
20200.33128.8040.1371.25816.7998
AI200079.21197.13887.06494.90696.156
201074.129797.11083.63294.33996.403
202075.451797.14290.70494.91994.778
Table 8. The index of landscape fragmentation from 2000 to 2020.
Land-Use Type2000
SPLIT
2010
SPLIT
2020
SPLIT
Grassland8900.7120,823.1020,747.92
Forest2.912.926.15
Water197,097.684,145,895.14409,223.17
Construction land16,916.419909.912720.01
Cultivated land197.68101.39204.30
Table 9. Comparison of the pixel number of simulated and observed land use in the ECA of western Beijing in 2020.
Land-Use TypeReality 2020PLUS Simulation Correct NumberAccuracy (%)FLUS Simulation Correct NumberAccuracy (%)
Grassland37,86525,84468.25%2495265.90%
Forest348,365331,69795.22%33178795.24%
Water2338169872.63%168171.90%
Construction land51,42726,45351.44%25,90050.36%
Cultivated land75,38968,28790.57%68,35890.67%
Table 10. Landscape similarity of the simulation results in the ECA of western Beijing in 2020.
Landscape IndicesObserved 2020PLUSFLUS
NP797384638402
LPI57.6459.1559.12
PARA_MN320.29331.41333.67
PARA_AM45.5544.2443.72
PARA_MD400400400
PARA_RA380.54379.57380.54
PARA_SD99.9390.4589.29
PARA_CV31.227.2926.76
ENN_MN342.06327.27326.37
ENN_AM225.53216.69214.14
ENN_MD223.61223.61223.61
ENN_RA15,599.0515,466.8415,466.84
ENN_SD467.65447.15446.76
ENN_CV136.71136.63136.89
PLADJ88.6188.9489.07
Table 11. Land-use area transfer matrix under the natural development scenario of the ECA in western Beijing from 2020 to 2030 (unit: hm2).
2020
2030
GrasslandForestWaterConstruction LandCultivated LandTotal 2030
Grassland37,86582 1737,964
Forest 348,177 348,177
Water 62338 6833027
Construction land 100 51,42716,52068,047
Cultivated land 58,16958,169
Total 202037,865348,365233851,42775,389515,384
Table 12. Land-use area transfer matrix under the regional planning policy impact of the ECA in western Beijing from 2020 to 2030 (unit: hm2).
2020
2030
GrasslandForestWaterConstruction LandCultivated LandTotal 2030
Grassland37,86577 2237,964
Forest 348,177 348,177
Water 12338 6883027
Construction land 110 51,42716,51068,047
Cultivated land 58,16958,169
Total 202037,865348,365233851,42775,389515,384
Publisher’s Note: MDPI stays neutral with regard to jurisdictional claims in published maps and institutional affiliations.

