Article

Land Use and Land Cover Changes and Prediction Based on Multi-Scenario Simulation: A Case Study of Qishan County, China

1
Beijing Key Laboratory of Precise Forestry, Beijing Forestry University, No. 35, Qinghua East Road, Haidian District, Beijing 100083, China
2
Forestry Institute, Beijing Forestry University, No. 35, Qinghua East Road, Haidian District, Beijing 100083, China
3
Management Research Department, Beijing Municipal Institute of City Management, Jia 48# Shangjialou, Chaoyang District, Beijing 100028, China
4
Beijing Key Laboratory of Municipal Solid Wastes Testing Analysis and Evaluation, Beijing Municipal Institute of City Management, Jia 48# Shangjialou, Chaoyang District, Beijing 100028, China
*
Author to whom correspondence should be addressed.
Remote Sens. 2022, 14(16), 4041; https://doi.org/10.3390/rs14164041
Submission received: 5 July 2022 / Revised: 9 August 2022 / Accepted: 16 August 2022 / Published: 19 August 2022

Abstract

:
Research on land use change is helpful to better understand the processes and mechanisms of land use changes and provide a decision base for reasonable land development. However, studies on LUCC were mainly conducted for megalopolises and urban agglomerations in China, but there is a gap in the scholarly community when it comes to shrinking small cities where the population decreased sharply under the influence of the urban expansion of megacities. Hence, it is necessary to investigate the evolution rule of land use in these regions. This study takes Qishan County in Shanxi Province as the research subject and analyzes the land use change over the last 20 years with remote sensing technology. Comparing the two LUCC models of the CA-Markov Model and the LCM Model, an optimal model is used to predict and simulate land use change under three potential scenarios in 2030. The conclusions are stated as follows: (1) From 2000 to 2020, the cultivated land area increased originally and subsequently decreased, and forest land continued to decrease at a progressively slower speed. In contrast, the urban land area expanded significantly. (2) The comprehensive dynamic change in water land is the most significant, indicating that this is an unstable land resource in the region and more attention should be given to this matter. (3) The scenario of water area protection indicates that the inhibition of the transition of water areas can protect their vulnerable ecological environment without negatively impacting economic development. Furthermore, the ongoing focus on economic development in the region is related to the rapid disappearance of cultivated land, which is not an optimistic perspective for the area’s ecosystem. The results of this study implied land transition features and mechanisms in Qishan County, providing novel insights for decision support for county-level land use planning.

Graphical Abstract

1. Introduction

Along with the continuous expansion of the urban scale, the contradiction between the global population, resources, and environmental protection has become increasingly prominent in the 21st century, leading to a series of issues regarding urban land use, which have directly affected the ecological environment and security of cities [1]. For example, land productivity has been seriously damaged, the quality of land resources decreased, and the ecological service function of land degraded, resulting in habitat and species loss [2]. Land use/land cover change (LUCC) is of great significance to regional and global environmental change, so it has become a frontier and hotspot of international research, attracting the attention of scholars worldwide [3,4].
Many scholars have recently utilized remote sensing to undertake land-use change studies [5]. For instance, Zhao et al. [6] and Chen et al. [7] simulated future land-use changes in different scenarios based on different land-use needs and policies. Some scholars have conducted more in-depth research on sustainable land use planning. Liu [8], for example, studied the ecosystem services of various types of green roofs, which were demonstrated as an urban ecological tool in sustainable land use planning. Furthermore, researchers have developed many land use and land cover change models to better understand, evaluate and predict land-use change, such as the Cellular Automaton (CA), Gray Prediction Model, SD Model, Markov Model, CA-Markov Model, and Land Change Modeler (LCM) [9,10]. Due to the different simulation mechanisms of LUCC models, they have their advantages and limitations and can lead to various simulation results. Therefore, to accurately predict the spatial pattern of regional LUCC, it is extremely important to select the most suitable LUCC model by comparing different LUCC simulation models. It has been proved by previous studies that the CA-Markov and the LCM models are advantageous when it comes to simulating the location, quantifying land use change, and predicting the future land-use spatial distribution, and these methods have been widely used in the field of urban studies [11,12].
However, studies on LUCC have mainly been conducted for megalopolises and urban agglomerations in China, while issues related to land-use structure in shrinking cities are seldom discussed. With the polarized development of cities and urban agglomerations [13], the loss of urban population, land abandonment and high housing vacancy rate, and vitality decrease to different degrees became common issues in many small and medium-sized cities and less developed areas [14]. Qishan County is located in the transitional area between the Weihe River Plain and Loess Plateau and is considered a representative of a shrinking city. The area has been handling severe environmental issues, including fragile ecology, drought, and soil erosion, and urban development problems involving population loss, which are common in the Loess Region [15]. More research on the evolution of the land use structure of shrinking cities is necessary to comprehensively investigate the evolution rule of urban land use, especially considering the transformational development of a country like China.
This study takes Qishan County, Shanxi Province, as the main subject and analyzes the dynamic evolution and future trend of land use change with remote sensing technology based on the CA-Markov and LCM models. Furthermore, three scenarios were added to compare and analyze land use planning. The results of this study implied land transition features and mechanisms in Qishan County, providing novel insights for decision support for county-level land use planning.

2. Material & Method

2.1. Study Area

The geographical coordinates of Qishan County are in the range of 107°33′–107°55′E and 34°07′–34°37′N, and its elevation ranges from 495 to 2160 m. The area is part of the Shanxi Province, and the county is located in northeastern Baoji city, 136 km from Xi’an city, the provincial capital to the east. The county covers an area of 856.45 square kilometers with a subhumid continental monsoon climate of the warm temperate zone. In this county, the average temperature is 12 °C, the percentage of sunshine is 47%, and the average annual rainfall is 623.8 mm.
Containing nine towns, 101 administrative villages, and 15 communities in its jurisdiction, Qishan County is a city that emphasizes the development of agriculture and tourism. In 2020, the region’s economic index GDP reached 16,910 million and had been increasing considerably over the past 20 years. As indicated by the seventh national population census in China, the permanent population of Qishan County was 365,200 thousand in 2020, but it has been decreasing continuously over the past 15 years. Especially in the past five years, there has been a reduction of nearly 100,000. Qishan County is a water resource shortage area, and the per capita water resources are 1/5 of the national average. The geographical location of Qishan County is illustrated below in Figure 1.

2.2. Data Source

Global land cover data from 2000, 2010, and 2020 were downloaded from GlobalLand30 (http://globeland30.org (accessed on 10 October 2021)) to calculate land use. Based on results from existing research [16,17], the natural factor and accessibility factor data were prepared to be the driving factors in the model building. Natural factor data included altitude and slope, and were downloaded from public platforms. The accessibility factor data include road distance, water distance, and residential area distance, and it needed to be processed using ArcGIS software based on the original platform data. The spatial resolution of the factor data in this study is 30 m, and the details are listed in Table 1.

2.3. Methodology

2.3.1. Technical Pathway

The technical pathway (Figure 2) mainly includes data preparation and simulation and prediction processes. The land use change over the past 20 years was analyzed based on the land use data from 2000, 2010, 2020. In the simulation process, the present land-use data and driving factors were entered into the CA-Markov and LCM models to simulate the land use in 2020. The Kappa coefficient was used to compare the simulation results in 2020 of the CA-Markov and LCM models and to select the optimal model for the study area, which was then used to predict the land use under three scenarios in 2030.

2.3.2. Present Situation Analysis

(1) Reclassification of Land Use
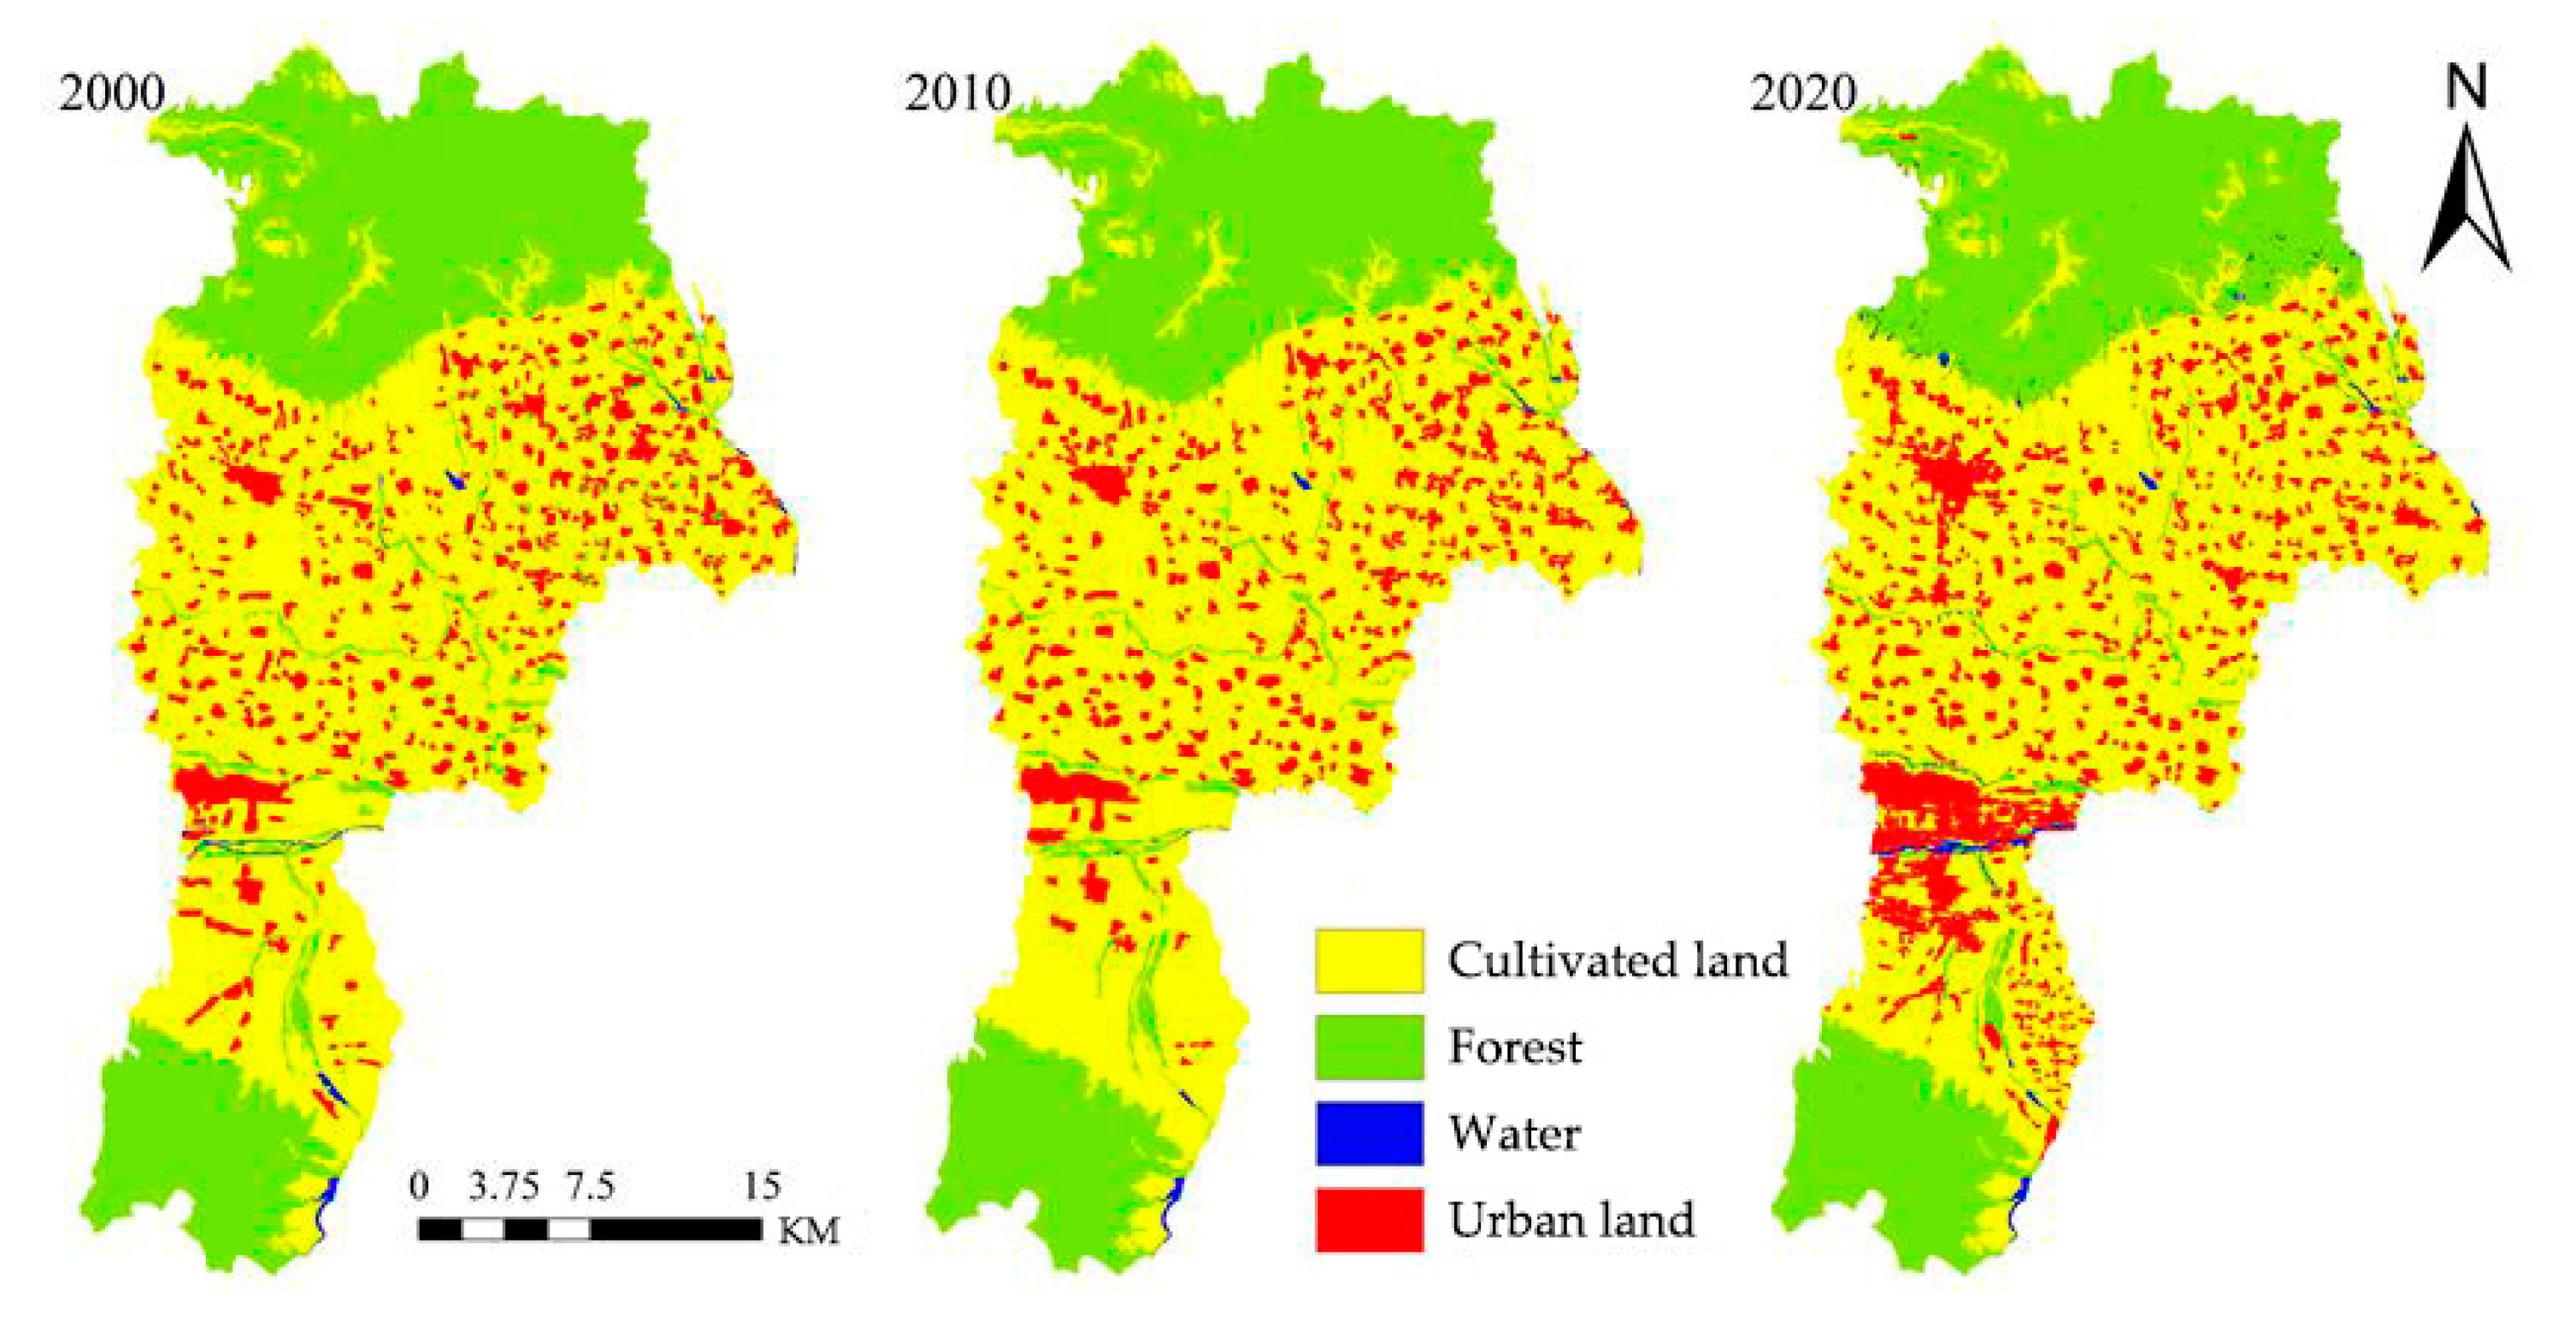
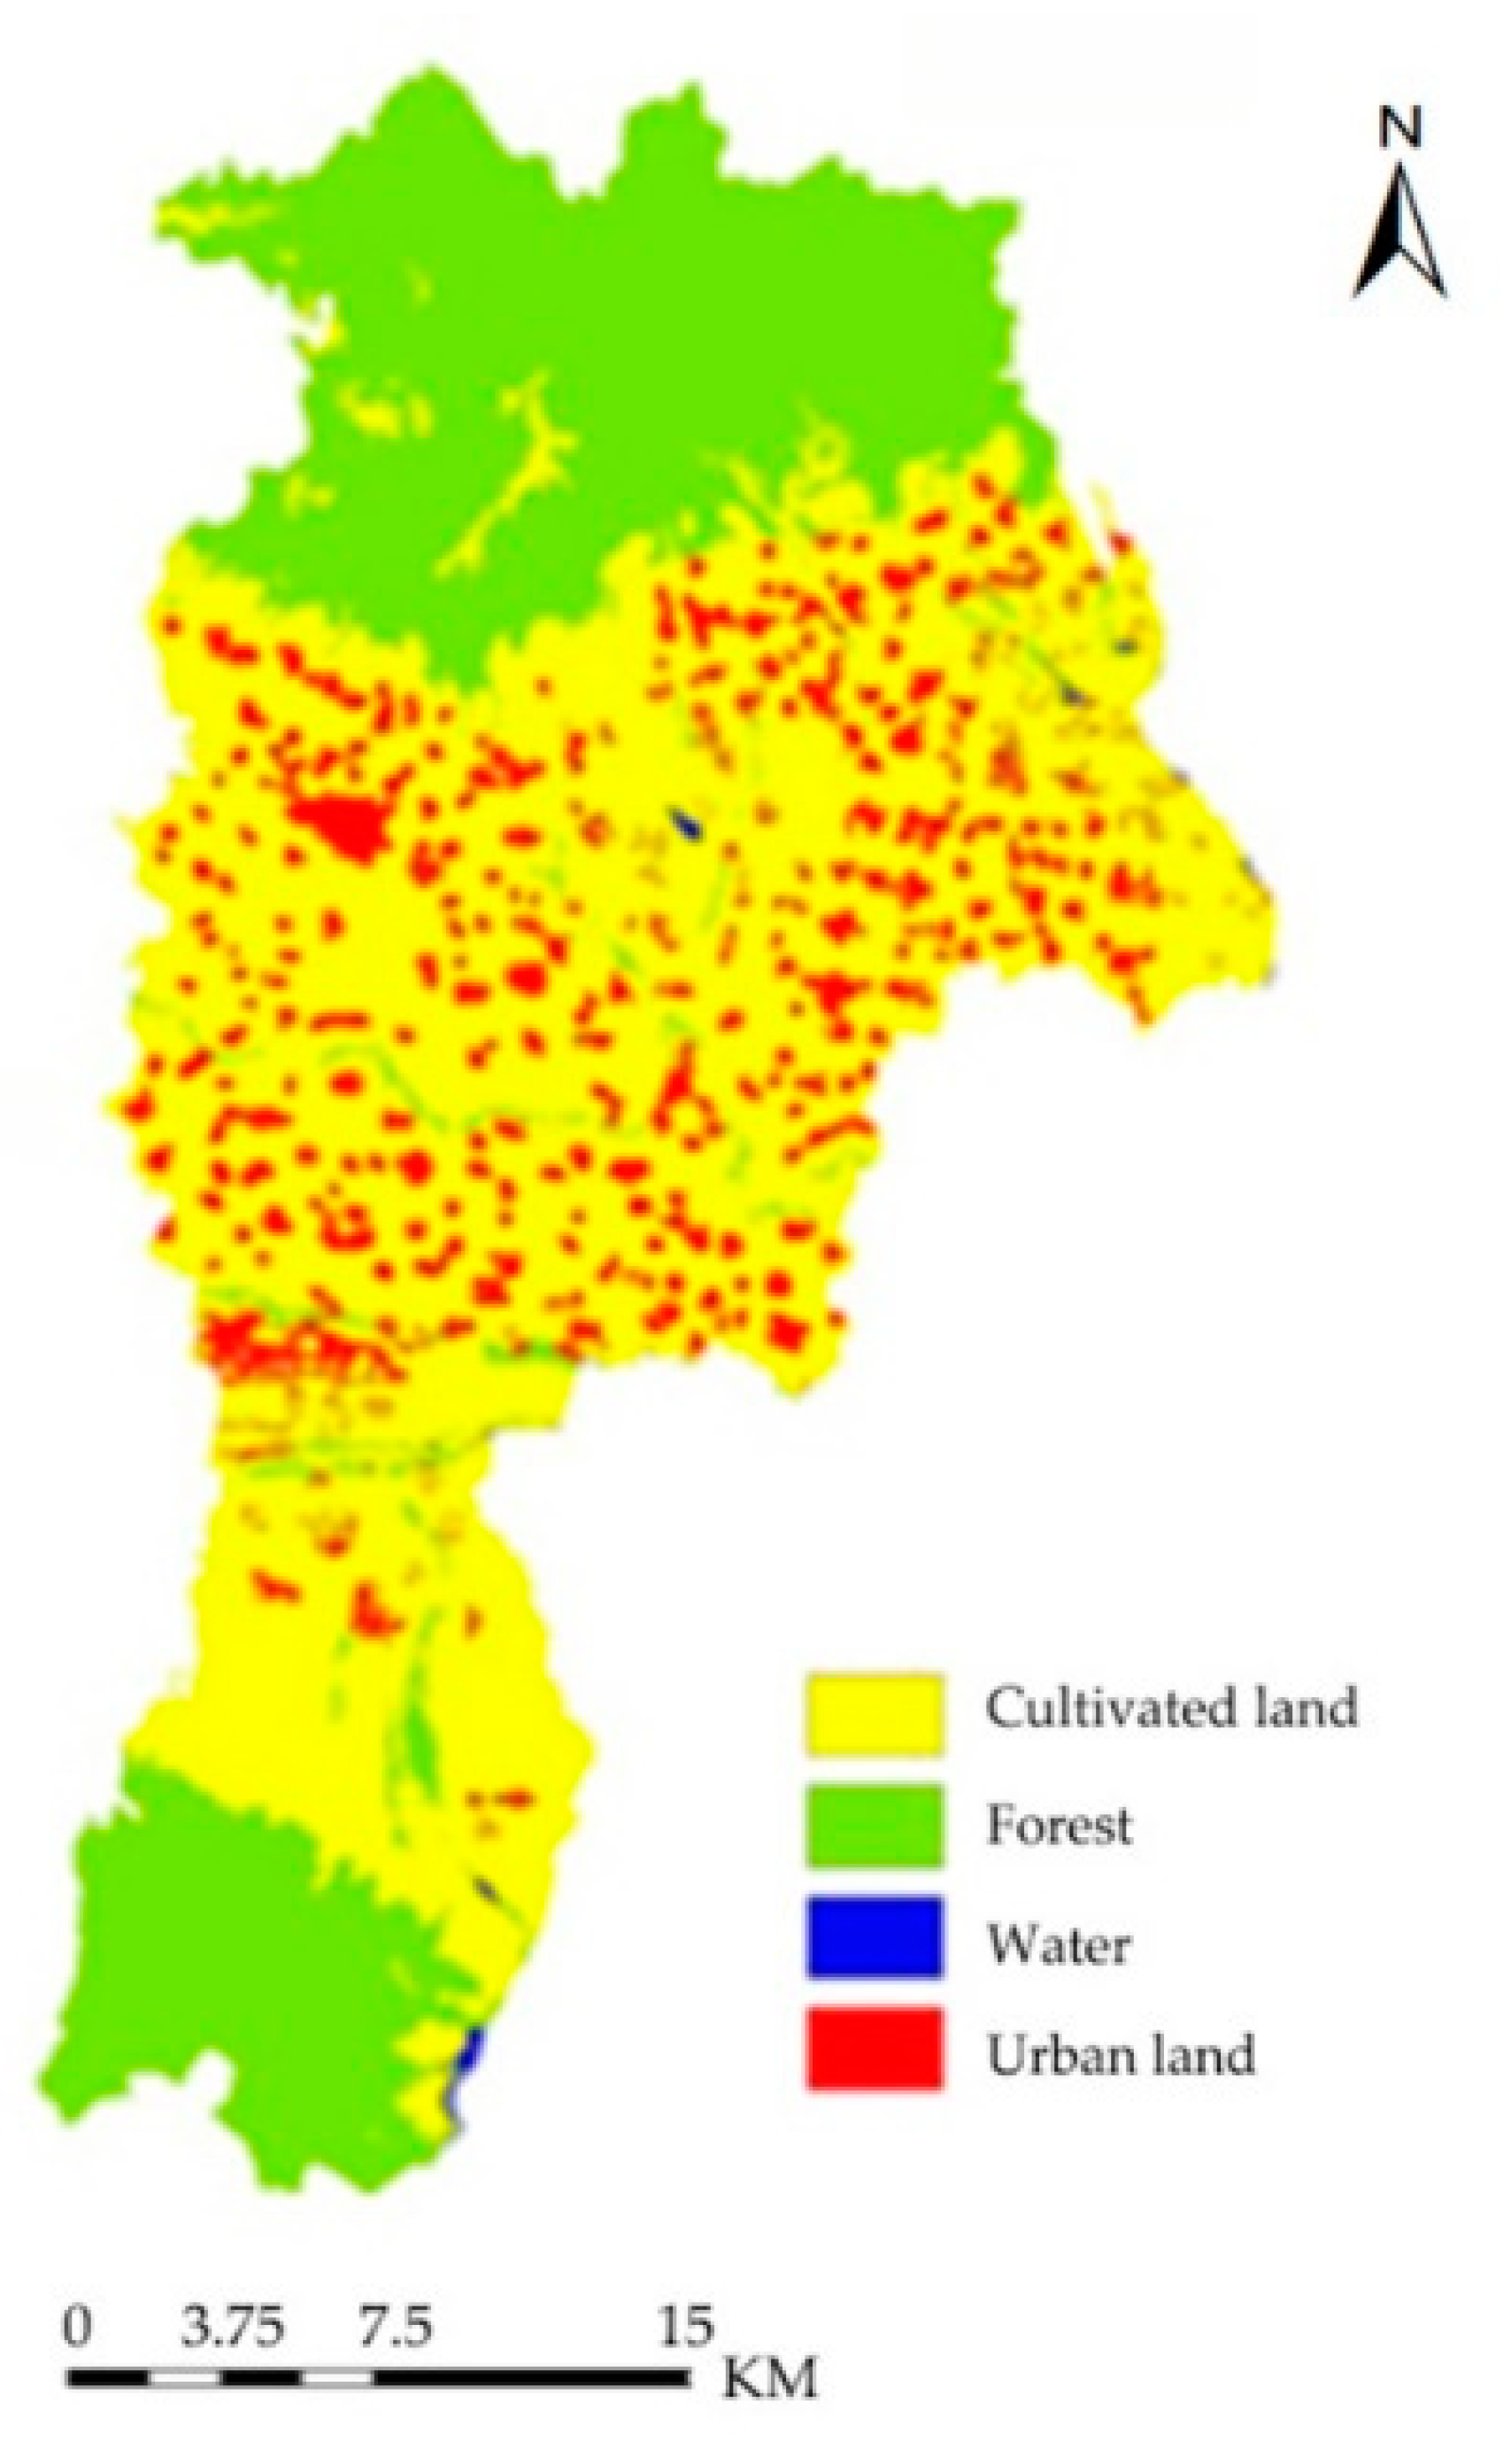
The original land use maps include seven types of land: cultivated land, woodland, grassland, shrubland, river, urban land, and wetland. Similar land types were combined to conduct an in-depth study on the land types with important characteristics in land use change in Qishan County. Among them, the grassland area is small, which is not a typical land type in Qishan County. Since these areas are mainly scattered sparse forest grassland and shrub grassland, we combined grassland into forest for analysis. The reclassification included four land types, i.e., cultivated land, forest, water, and urban land, as a foundation for subsequent analyses on the area change of land use and transitional type. Refer to Table 2 for details of the reclassification system of land use:
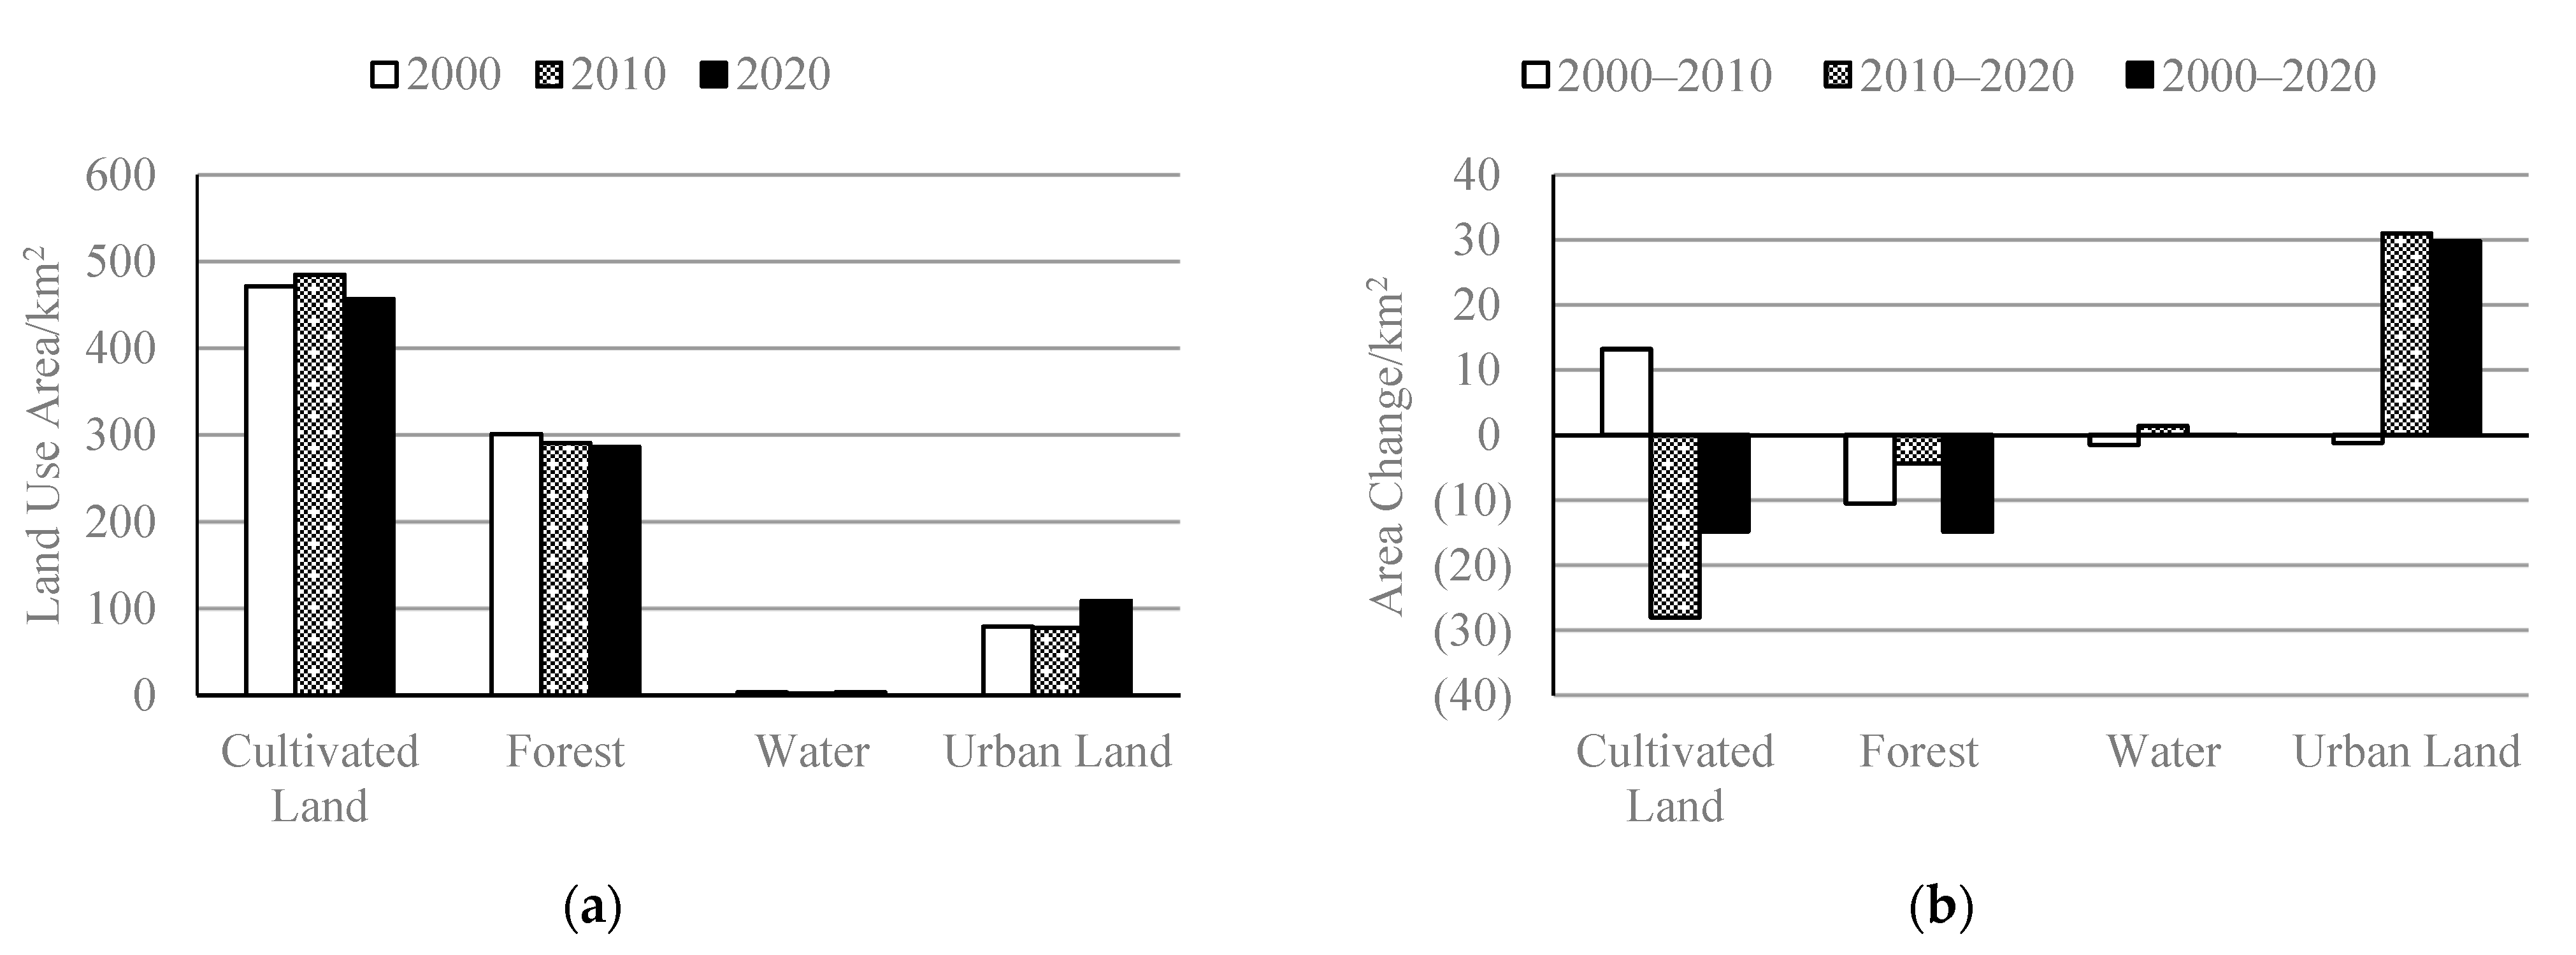
(2) Dynamics of Land Use
The dynamics of land use can reflect its temporal and spatial variation, and an individual dynamic stands for the quantity change of a specific land use type of the research subject within a certain period [18]. A positive value represents an increase in area, whereas a negative value represents a decrease in area. The greater its absolute value is, the greater the net change in land. The formula of the individual dynamic index is:
K = U a   U b U a × 1 T × 100 %
where K is the dynamic of a specific land use type during the study period, U a and U b represent the areas of certain land use types at the beginning and the end of the study, respectively. T is the study interval set as ten years, and K is the annual change rate of the land use type researched.
Compared with the individual dynamics, the integrated dynamic index focuses on the processes rather than the results of the change, which solves the problem that the final area of land types barely changes when the transfer in and transfer out of local classes are quite similar because it calculates the absolute value of the conversion area between land types [11]. The formula of the integrated dynamic index is:
L C = i = 1 n Δ L U a b 2 i = 1 n L U a × 1 T × 100 %
where L U a is the area of land use type “a” at the beginning of the study, Δ L U a b is the absolute value of the area of a land use type (except for “ a ”) transferred from the land use type “ a ”. T is the study interval defined as 10 years in this study, and LC is the annual change rate (absolute value) of land use change of the research subject during the interval.
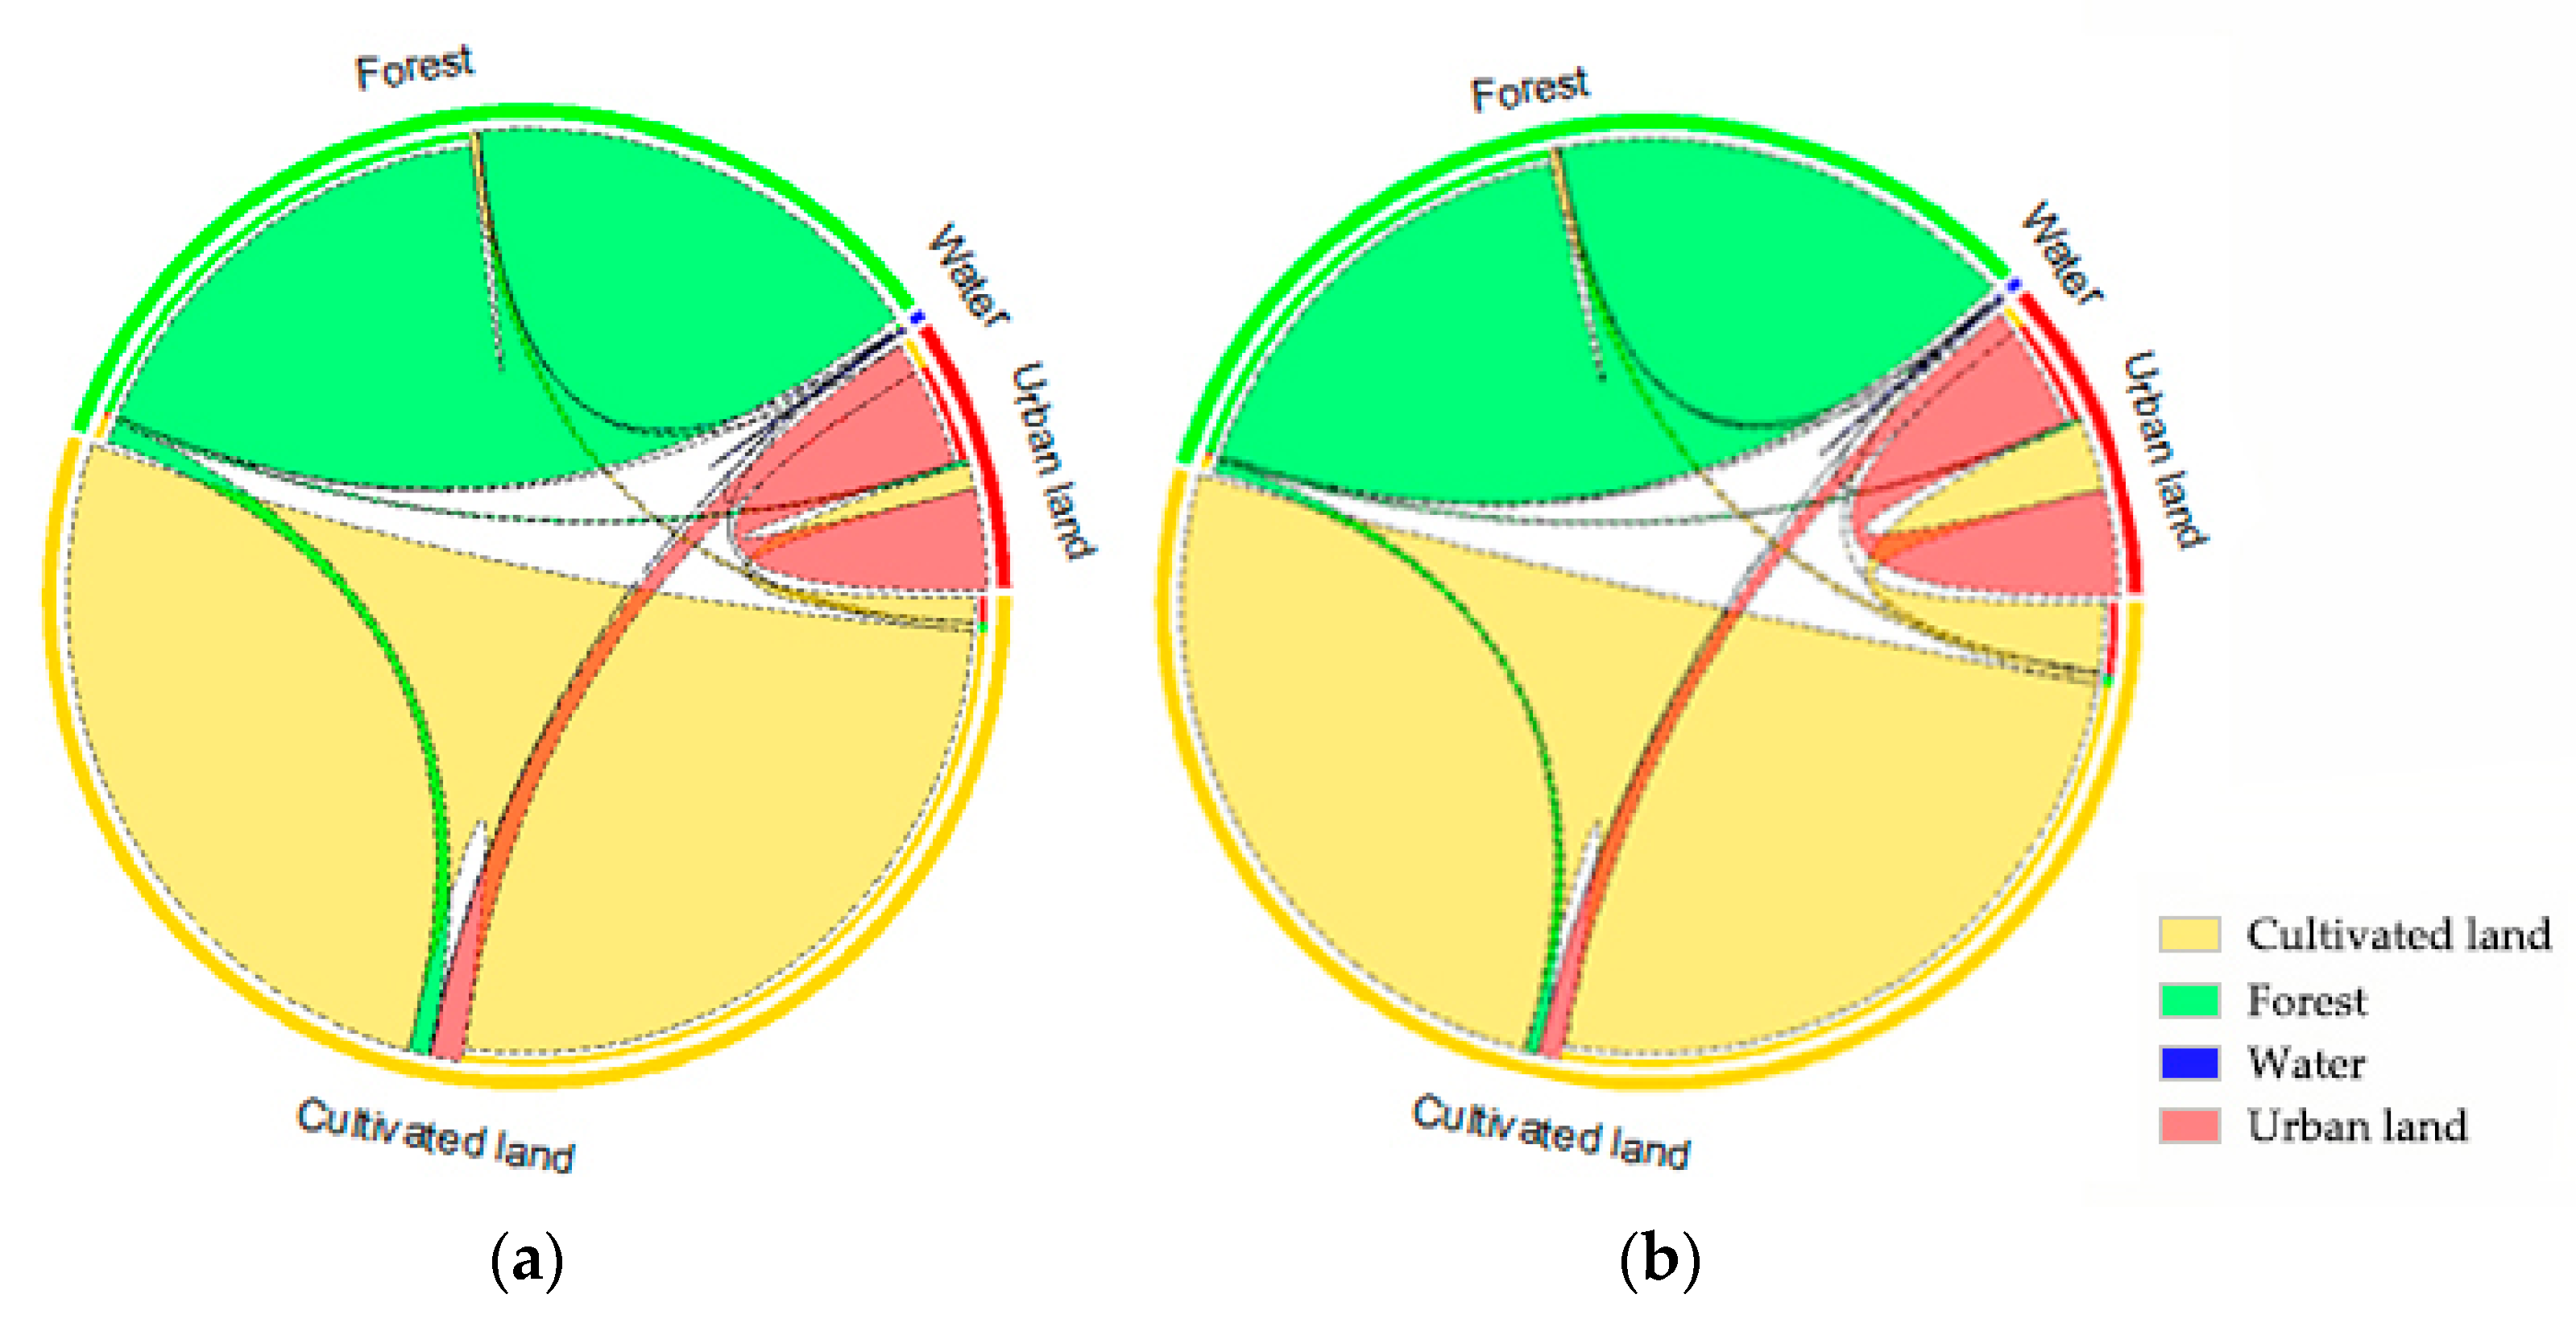
(3) Transition Matrix of Land Use
The land use matrix is crucial for analyzing the land type change in a region, as it describes the transition among various land use types at the beginning and the end of a certain period of time [19,20,21]. This is the basis for the subsequent analyses on land use change and the establishment of LUCC models.

2.3.3. Model Establishment

(1) CA-Markov Model
The CA-Markov Model is used to predict the land-use transition quantity in the future according to the history of transition probability and follows the spatial distribution principle that land with high suitability will be transferred preferentially in land use prediction. It is a combination of the spatial operation of the cellular automata (CA) model and the quantity prediction of the Markov chain (Markov) model. The CA model is advantageous in generating the potential transition maps by taking the spatial structure and neighborhood state into consideration, and the Markov model can provide an LUCC transitional area matrix based on the time variation [11].
CA-Markov is used to determine the trend of each state at each future moment according to the initial probability of different states of a system and the transition probability between the states [22]. The simulation process of CA-Markov based on Terrset software is described as follows:
a. Transition Analysis with Markov Chain. The matrices of land use transitions, including the probability matrix and area matrix from 2000 to 2010 and 2010 to 2020, were obtained after 2000 and 2010 and were set as the reference years, respectively. The land use data were input into the Markov model, and the interval and prediction period were defined as ten years;
b. Creation of a multi-criteria evaluation model. The five driving forces, i.e., altitude, slope, road distance, residential area distance, and water distance, were selected, and upon determination of their weight, a multi-criteria evaluation model (MCE, Multi-Criteria Evaluation) was created [11,12];
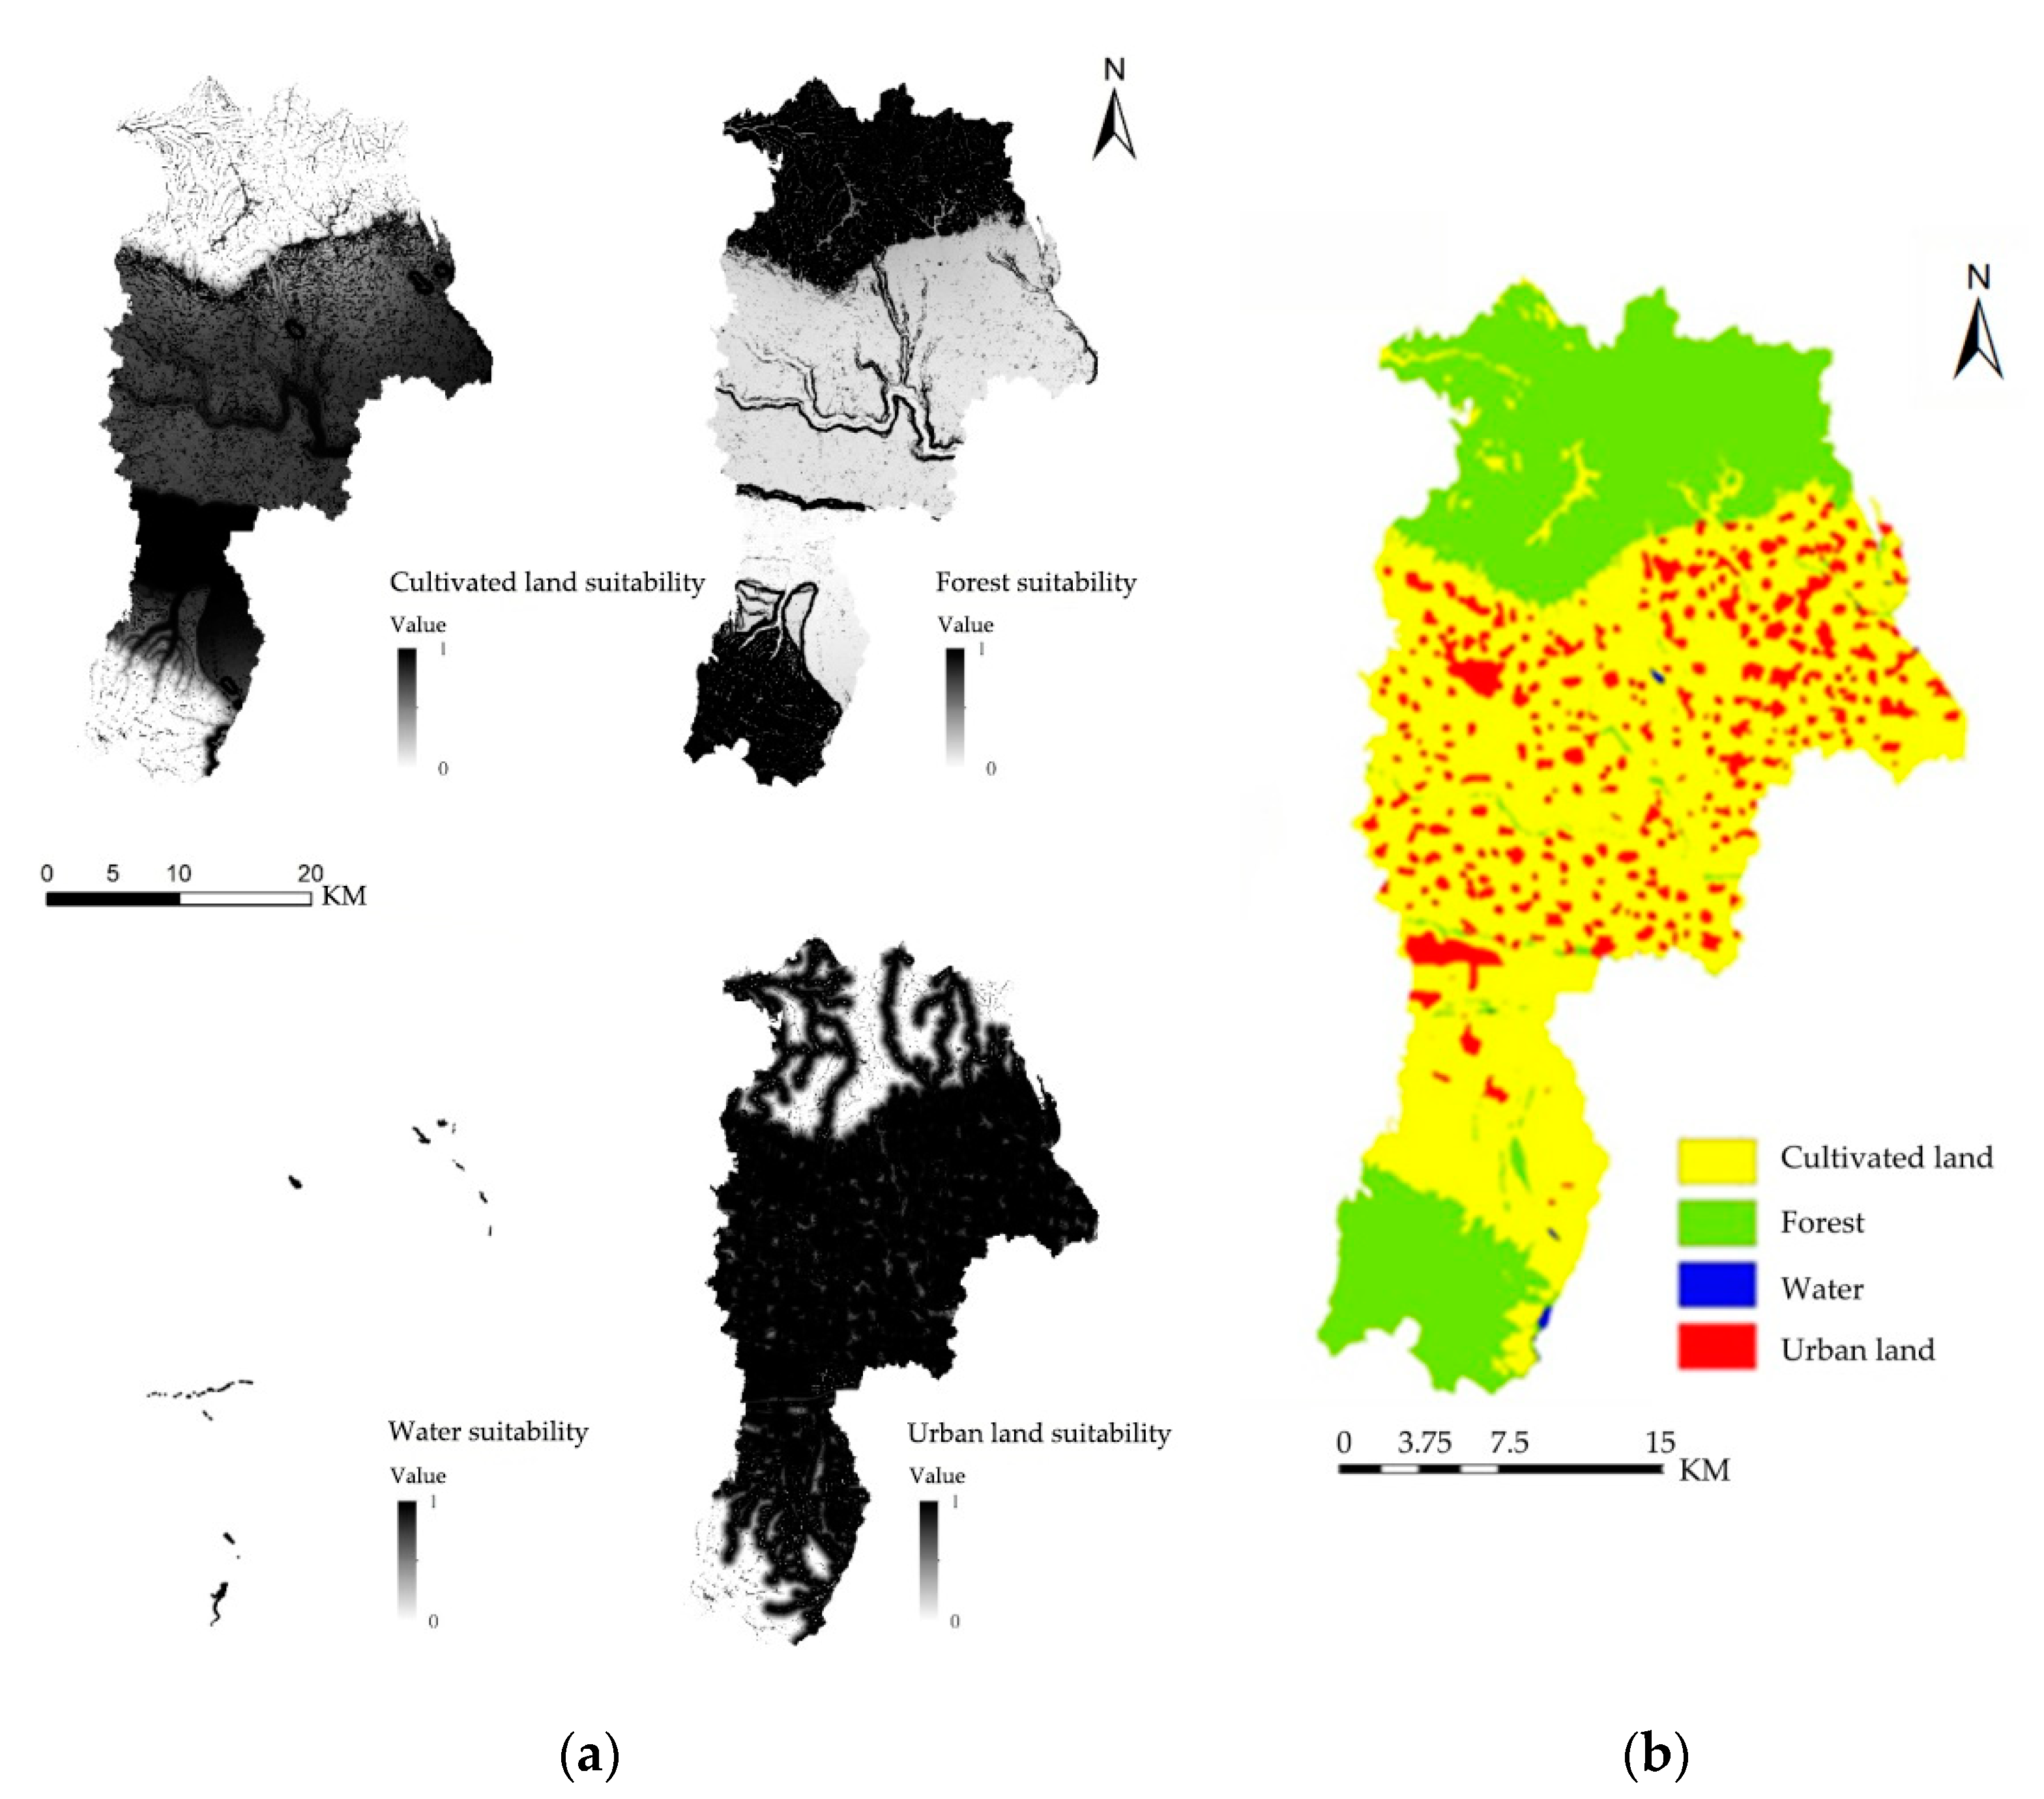
c. Establishment of a suitability atlas. The suitability atlas is a key file for predicting land use distribution and the basis for the cellular evolution of the CA model. In this paper, the suitability images of each land use type were generated upon running the created MCE model and finally synthesized into a raster group file to establish the final suitability atlas; and
d. Establishment of the model. The land use classification map was selected as the starting point of prediction and inserted into the CA-Markov model. Then, the model was run to predict the land use status after the input of the historical transition matrix and the suitability atlas of land use types.
(2) LCM model
Similar to the CA-Markov model, the Land Change Modeler (LCM) predicts the change in the number of land types based on the Markov transition matrix, but its spatial distribution is based on the transition probability. Here, multi-Layer perceptron (MLP) was used to generate a transition probability atlas. The MLP model is a kind of artificial neural network model with empirical learning and decision-making driven by algorithms [23]. It can randomly generate and verify the operational relationship between the driving force and transition probability. The same number of training samples and verification samples are selected in each iteration, with their root mean square error and prediction accuracy updated simultaneously. When the number of iterations or prediction accuracy reaches the threshold value, the training is immediately stopped, and the transition probability image is the output [24,25].
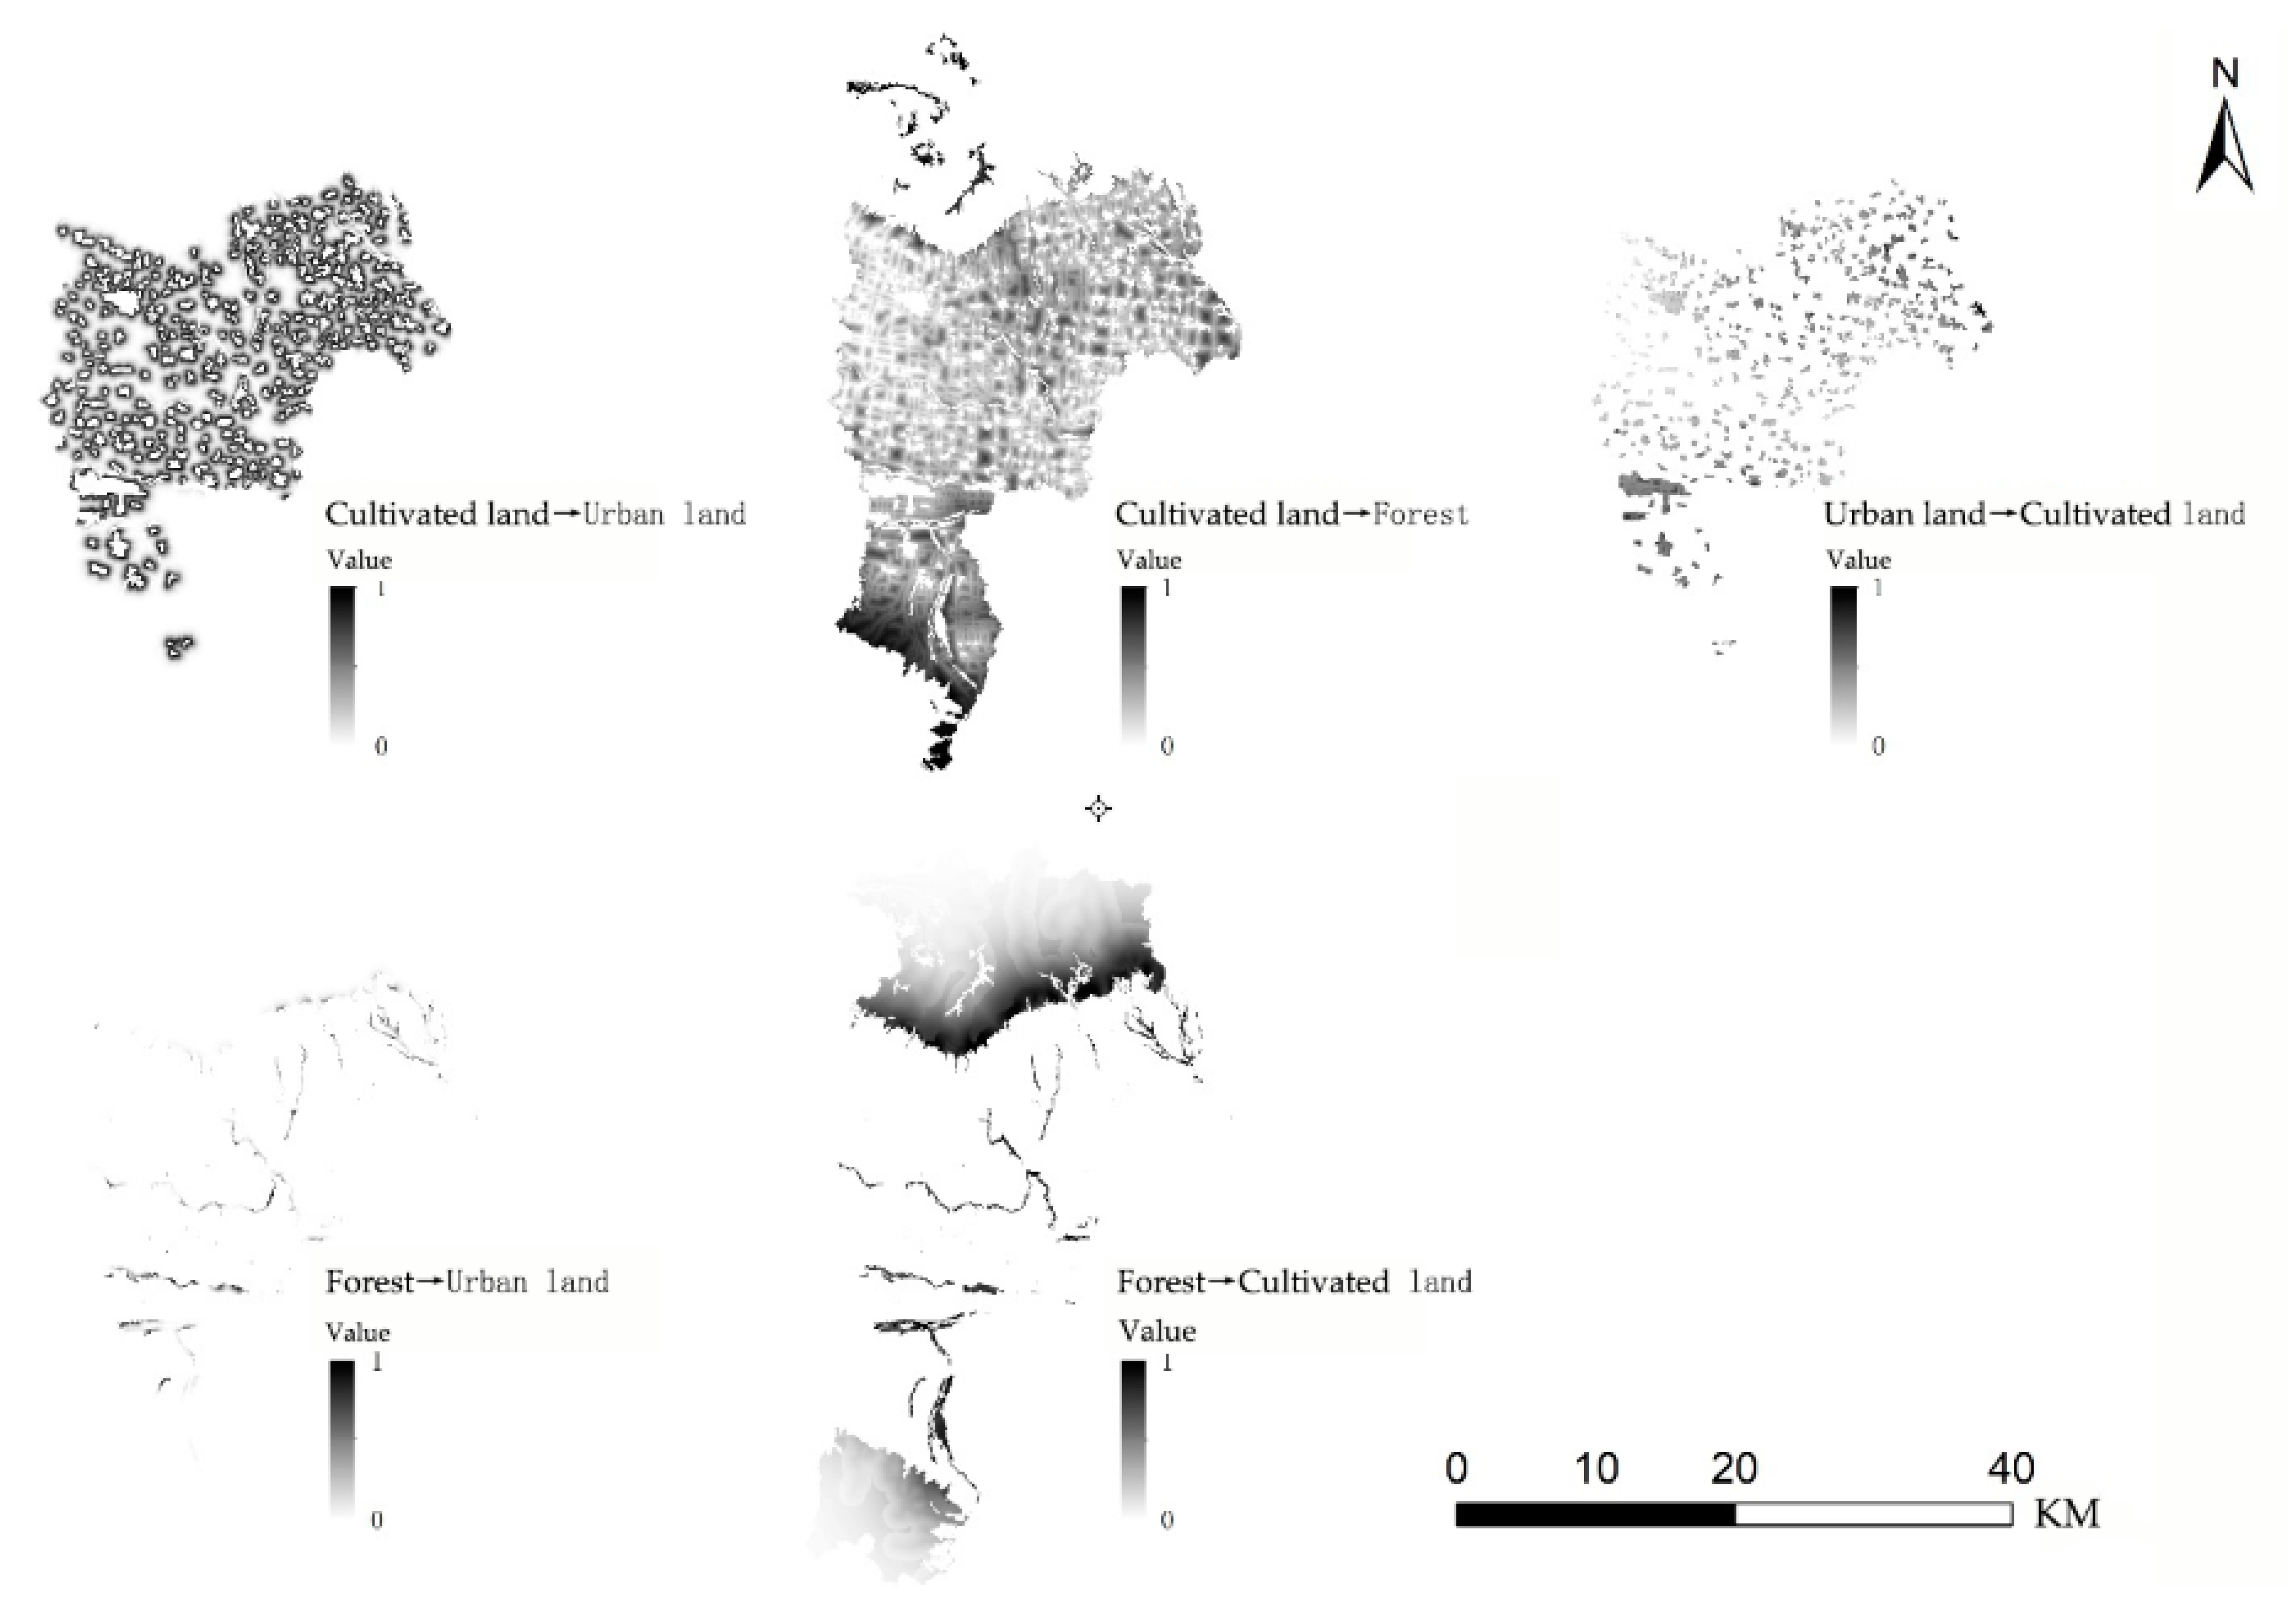
Similar to the suitability atlas, the transition probability atlas is the key data for predicting the spatial distribution of land use change. In this paper, a transition probability atlas was created using the MLP module based on Terrset software, and then a predicted map of land use classification could be generated based on the transition matrix and transition probability atlas.
(3) Model accuracy verification
The accuracy of the LUCC model was measured by the Kappa coefficient, which can be calculated using the CROSSTAB tool in GIS Analysis under IDRISI. Under the same operational rules, if the Kappa coefficient calculated as per the actual annual land use data and the simulated predicted data is less than 0.4, the simulation is unsuccessful; if it is between 0.4 and 0.75, the simulation result is average; and if it is greater than 0.75, the simulation result is good and consistent with the actual situation. The equation used in this process is [26].
k = x p , i x r , i x r , i × 100 %
where k is the error precision; x p is the predicted area of type i land; and x r is the actual area of type i area.

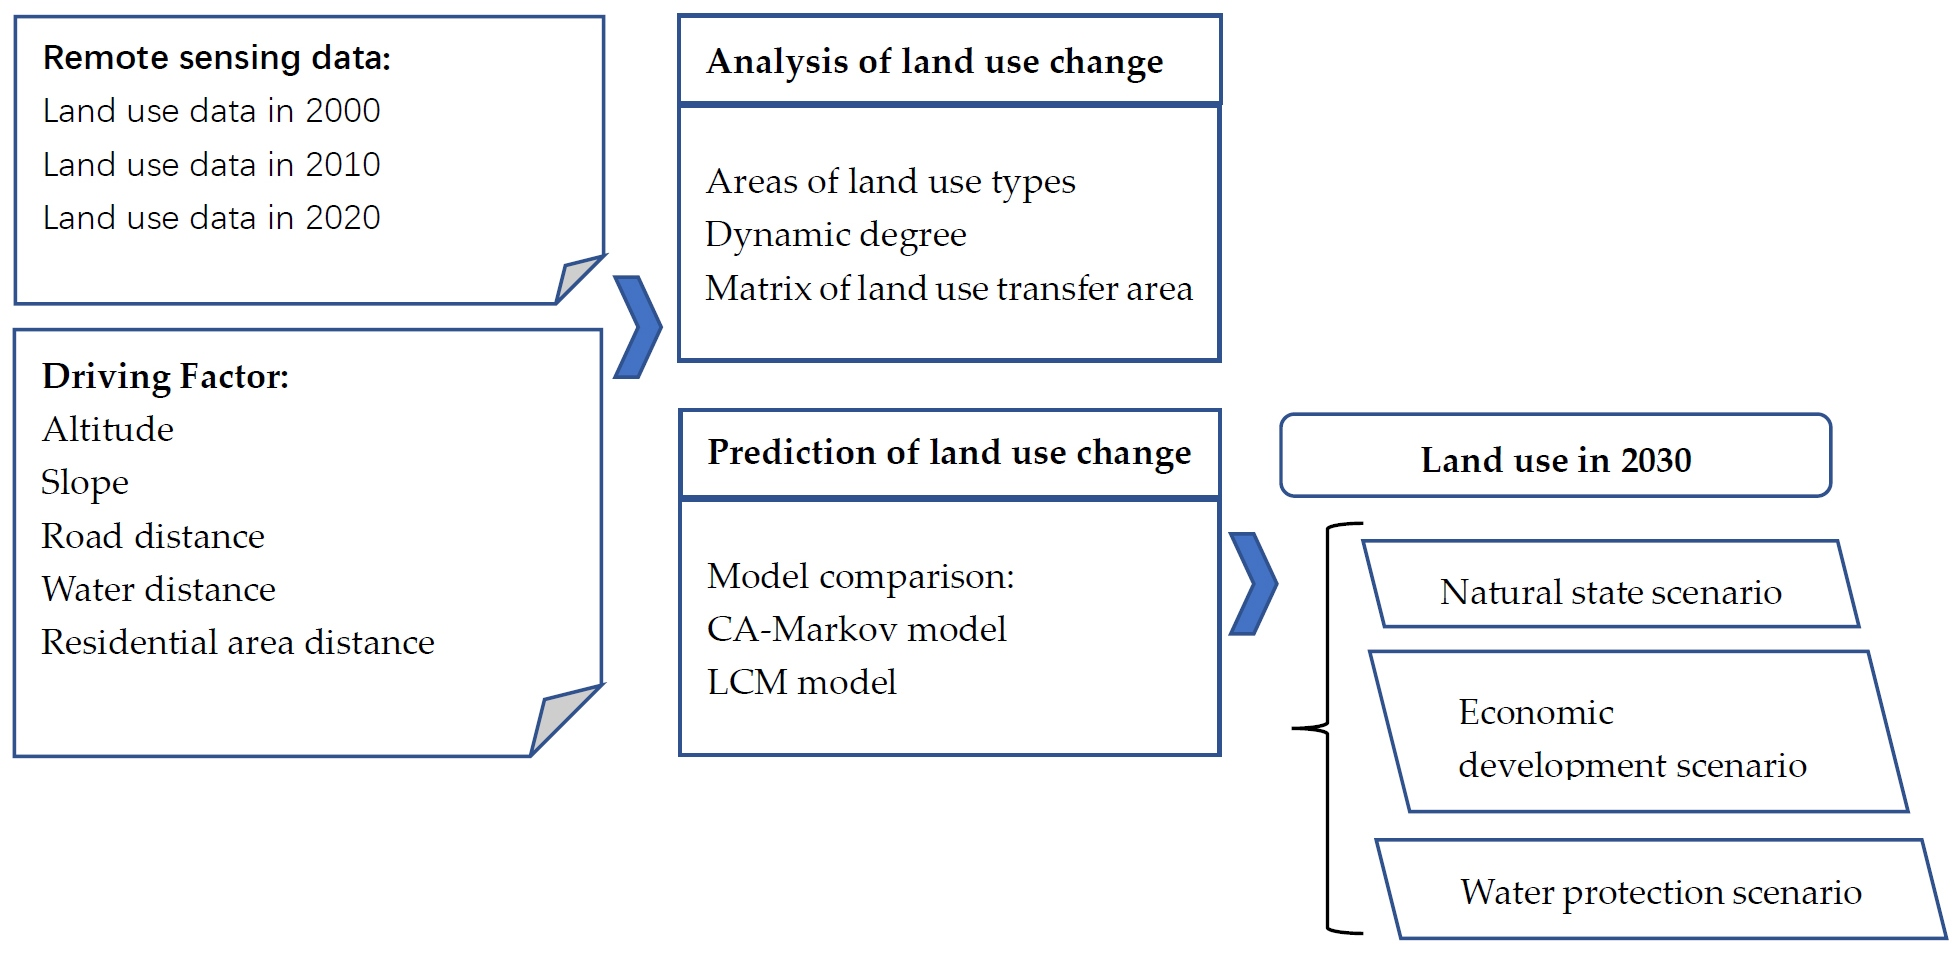
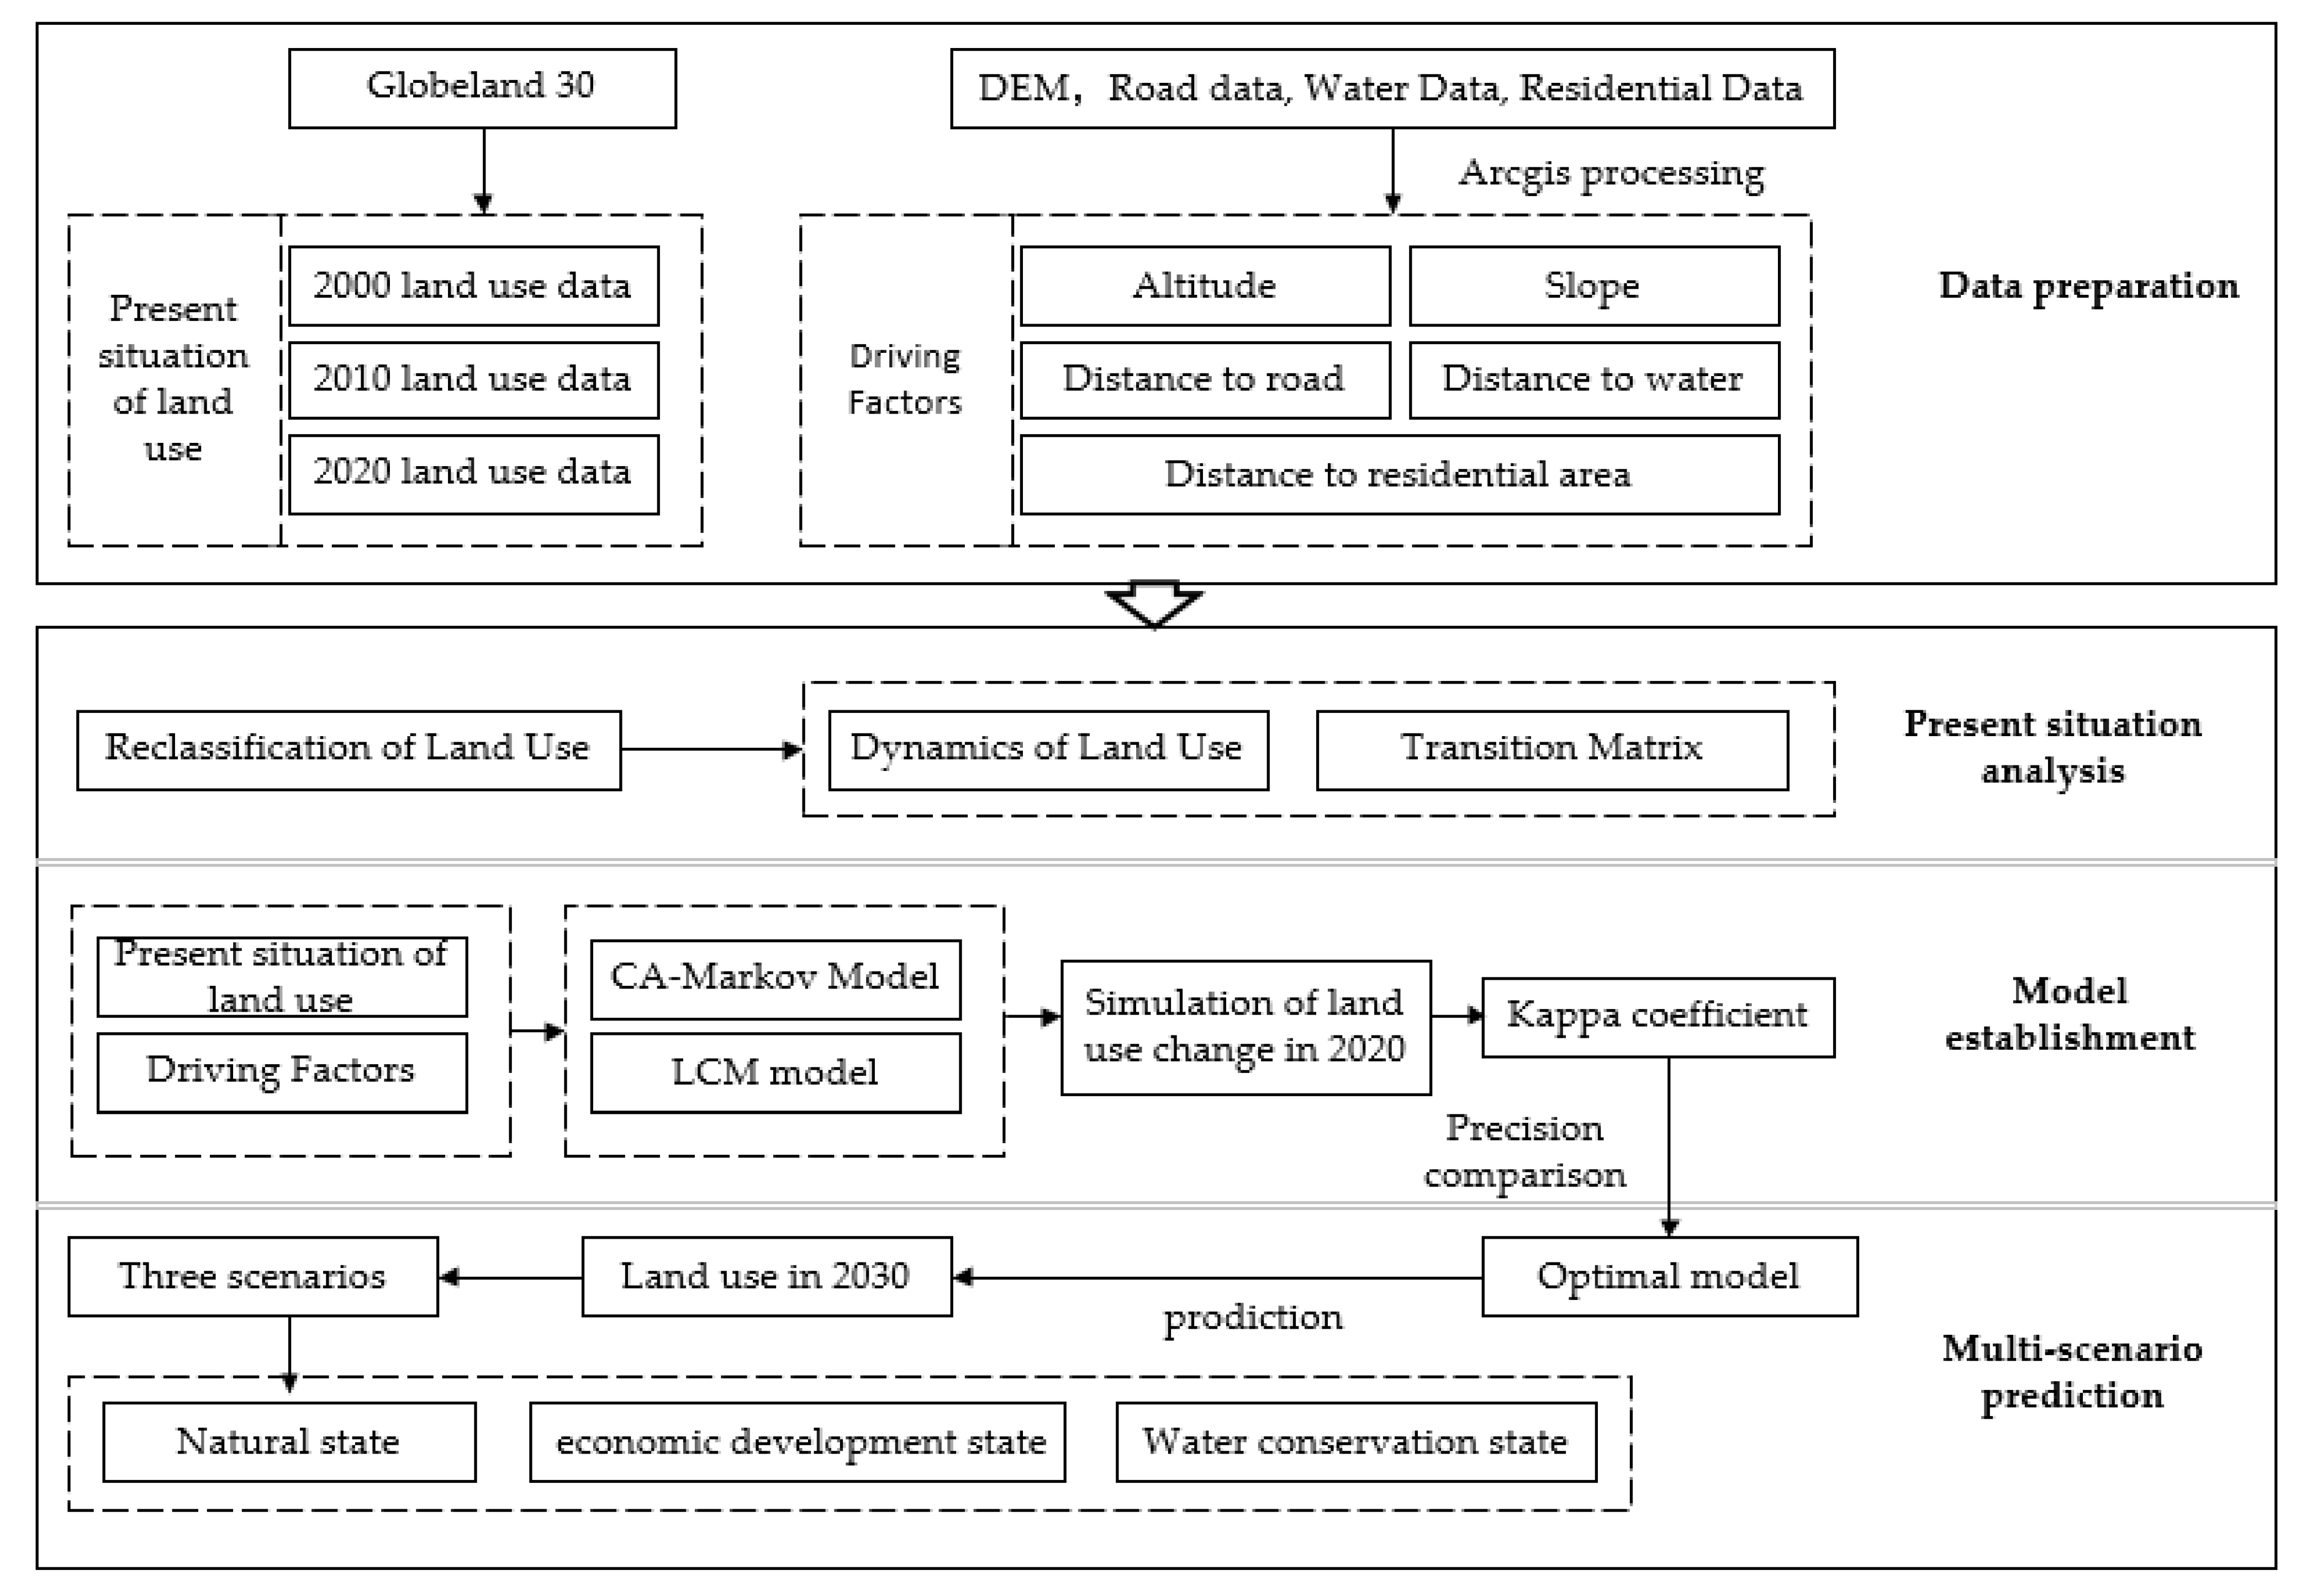
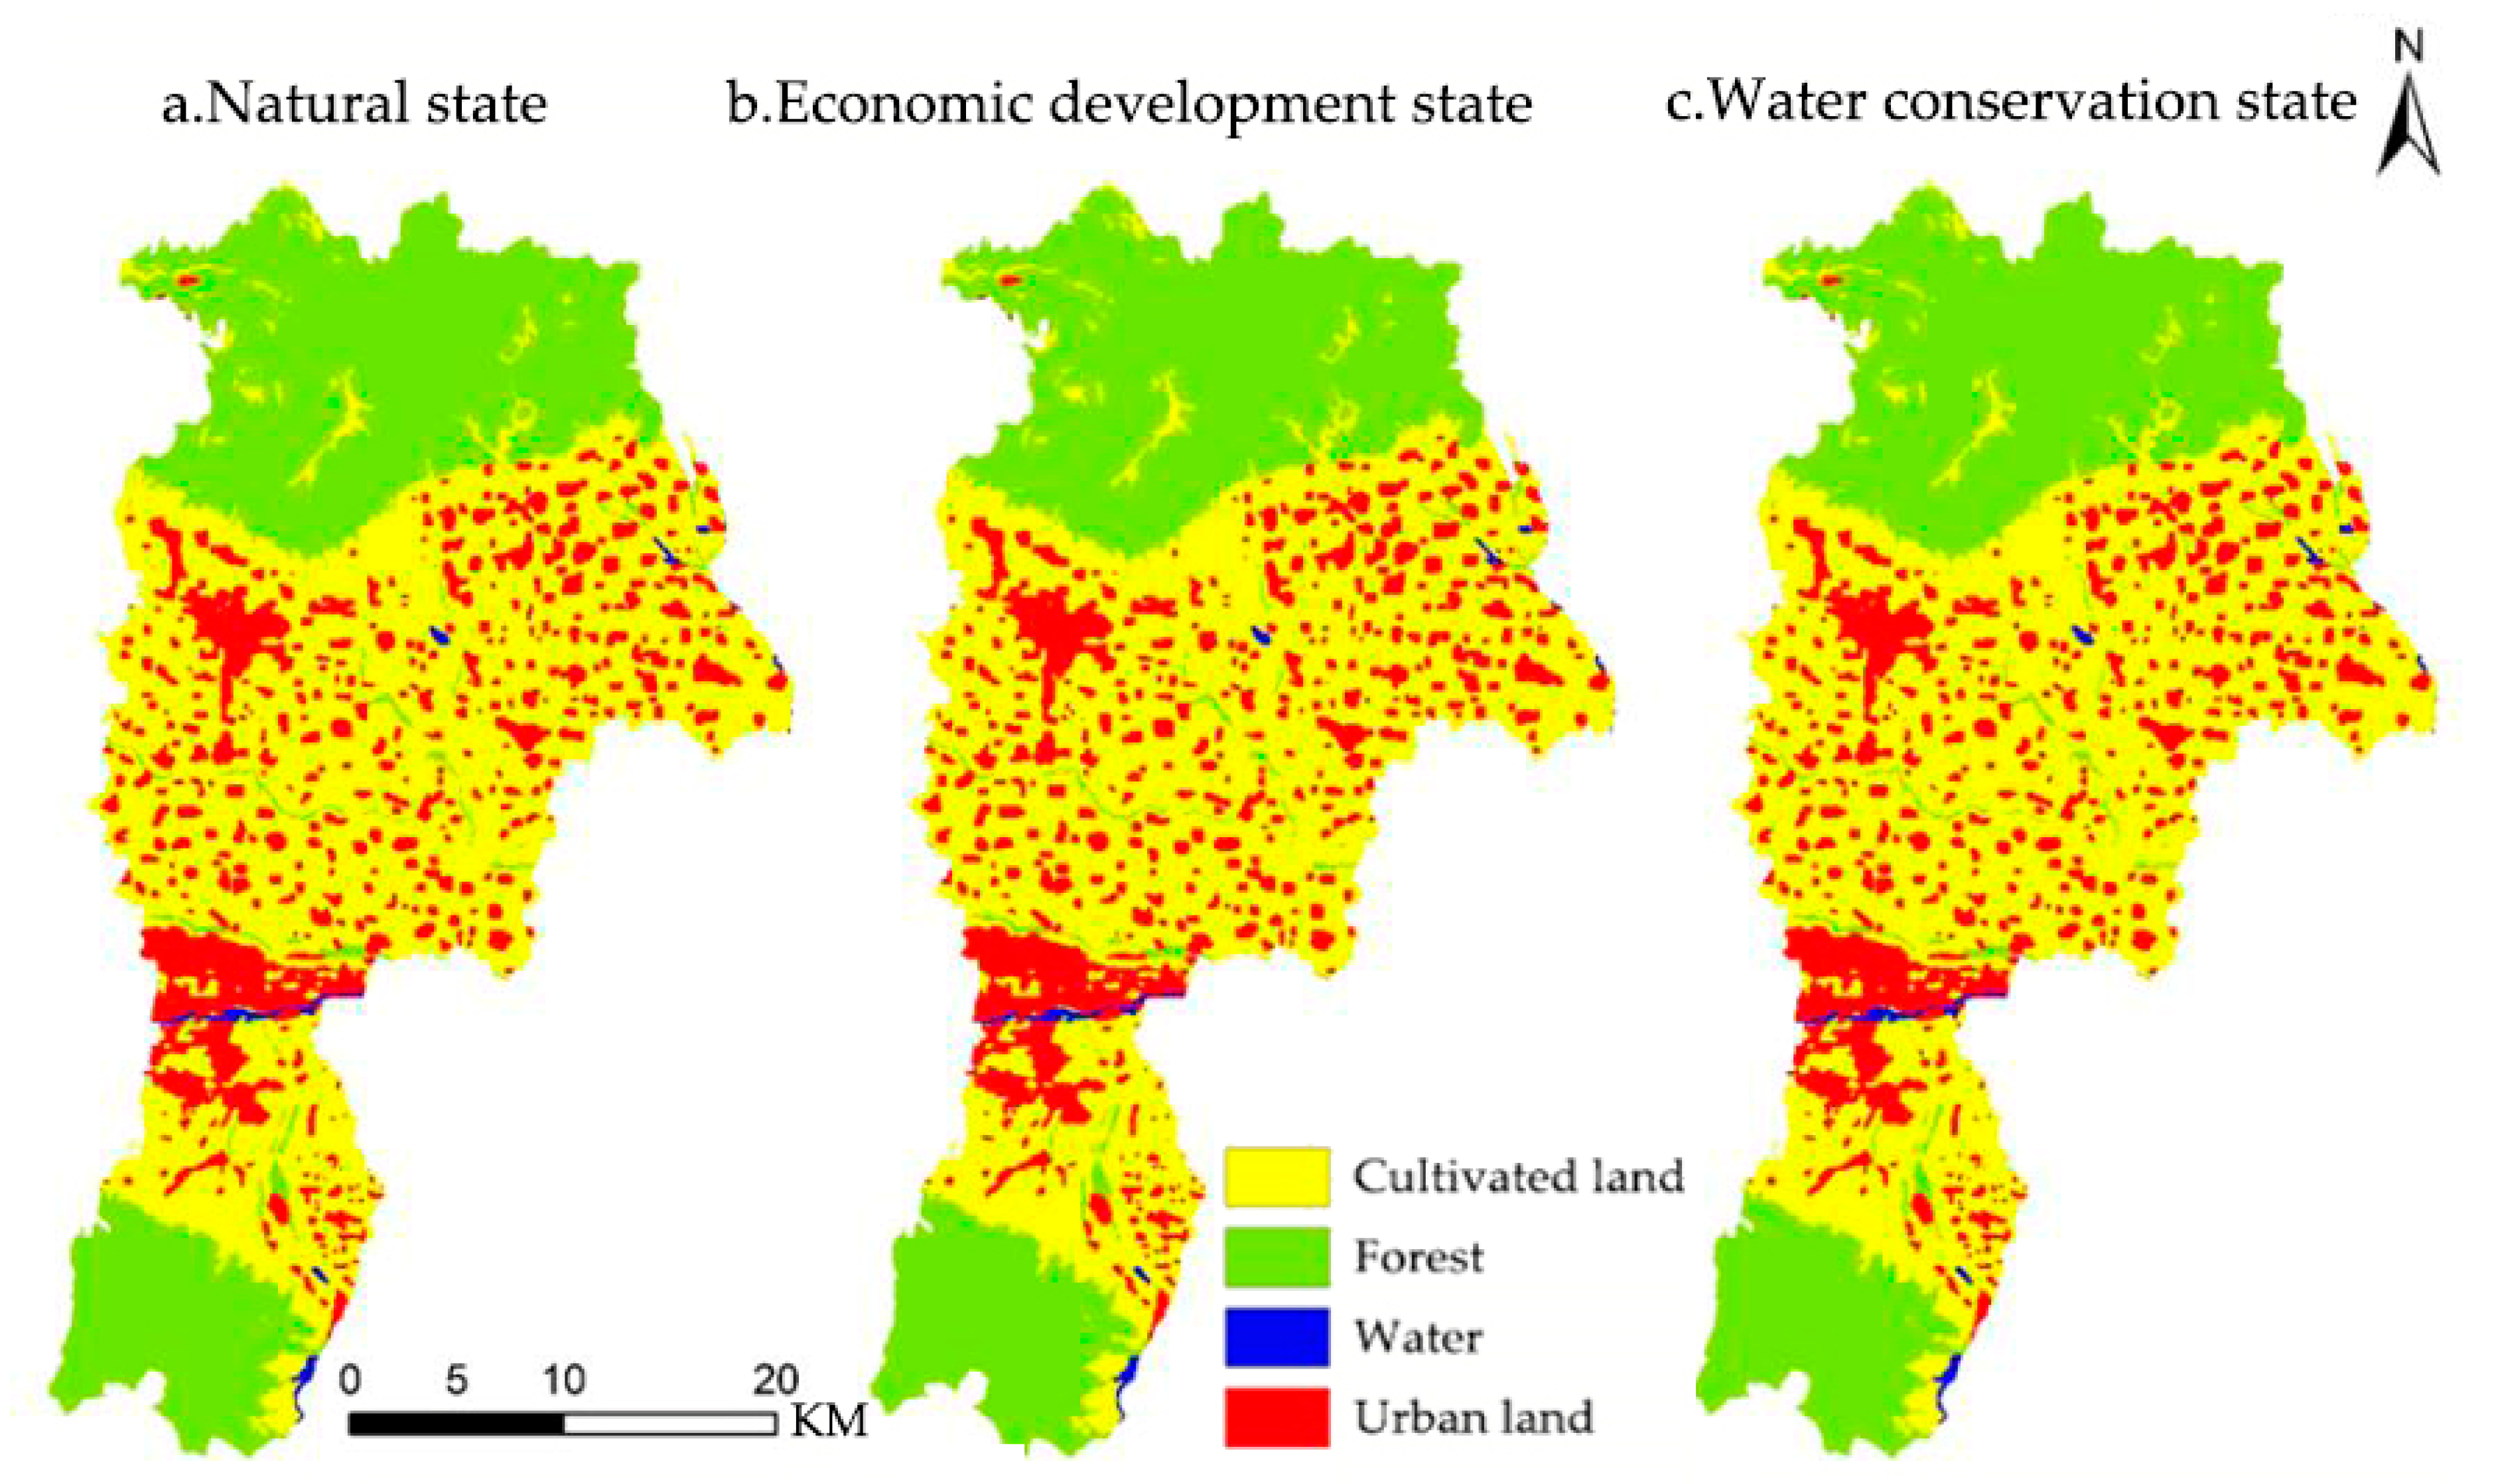
2.3.4. Multi-Scenario Prediction

In this paper, the land use change in Qishan County in 2030 was predicted using the LUCC model with a better simulation effect. However, given that future land planning interventions, incentives, and restrictions may also change the process of land development, three specific scenarios were set in the in-depth analysis based on its historical land use changes: “natural state” with the status quo unchanged, “economic development state” with the accelerated expansion of urban land, and “water conservation state”. The specific scenarios are as follows:
Scenario 1: Natural state. The present evolutionary trend will continue in Qishan County without any human intervention. The historical transition area matrix from 2000 to 2020 is used for this state.
Scenario 2: With a policy prioritizing economic development, urban land would further expand continuously. In this scenario, based on the historical matrix from 2000 to 2020, the grids of other types of land converted to urban land increased to 110%.
Scenario 3: Water conservation state. Qishan County is short in water resources and has serious soil erosion. In recent years, local governments have strengthened the comprehensive treatment of water pollution and implemented water resource protection policies. In this state, the conversion of water to other types of land is prohibited, and the area of water converted to other types of land is reset to zero.

3. Results and Analysis

3.1. Land Use Change Analysis

3.1.1. Characteristics of Dynamic Changes in Land Use

After reclassification of the original land cover data with ArcGIS software, Terrset software was used to analyze the current land use map of Qishan in 2000, 2010, and 2020 (Figure 3) and the dynamic area changes in land use types (Figure 4).
According to Figure 4, the main land use types in Qishan County were cultivated land and forest, accounting for approximately 55% and 34% of the total area, respectively. Between 2000 and 2020, the dominance of cultivated land and forest did not change, but there was a negative trend. The specific changes are as follows: (1) The area of cultivated land first increased and then decreased. It increased by 13.21 km2 from 2010 to 2020 but decreased by 28.05 km2 from 2010 to 2020. (2) The forest has been decreasing in the past 20 years, with its proportion dropping from 35.24% in 2000 to 33.13% in 2020. (3) The urban land first decreased slightly but then rebounded with a total increase of 29.79 km2, and its proportion increased from 9.24% in 2000 to 12.72% in 2020. This expansion was the greatest among all land types. (4) The change in the water area was small, at just 0.1 km2. However, the water area underwent a substantial decrease of 1.5 km2 in the first ten years from 2000–2010 and a substantial increase of 1.4 km2 in the latter 10 years from 2010–2020. Because the water area itself is relatively small and was only 3.25 km2 in 2000, its changes were more evident.
According to the single and comprehensive dynamic change of each land use type presented in Table 3, the dynamic change of forest and cultivated land was relatively small and less than 1%, mainly because their area base was relatively large. The dynamic change in water was the most significant one. From 2000 to 2010, the single dynamic change was 4.63%, and the comprehensive dynamic change was 5.08%, indicating a significant reduction in water in this period. From 2010–2020, the single dynamic change was 8.02%, and the comprehensive dynamic change was 1.62%, indicating a significant increase in the water area and a declining intensity of its outward transition. Hence, it can be said that the water area in Qishan is small and unstable, and the water ecosystem in the region requires further attention.

3.1.2. Changes in Land Use Types

The transition matrices of land use area and probability in Qishan from 2000 to 2010 and from 2010 to 2020 were established to analyze the land use transfer in Qishan from 2000 to 2020, (Figure 5).
Figure 5 shows that the transfer scale during 2000–2010 from large to small is as follows: 19.18 km2 of urban land was converted into cultivated land; 15.12 km2 of cultivated land was converted into urban land; and 13.18 km2 of forest was converted into cultivated land. It can be seen that cultivated land and urban land were converted into each other. The results show that urban land conversion to cultivated land was greater by 4.06 km2. Given the changes and transfer of the comprehensive land use area, the net increase in cultivated land from 2000 to 2010 was 13.21 km2, and the main sources were urban land and forest, with 19.18 and 13.18 km2 in area, respectively. The cultivated land was also mainly converted into urban land and forest, with 15.12 and 4.87 km2 in area, respectively. The net increase in cultivated land mainly came from forest and urban land, with areas of 8.31 and 4.06 km2, respectively. The net conversion of forest to cultivated land and residential land was 8.31 and 2.78 km2, respectively. The net conversion of urban land and water was small; there was a certain mutual transformation between urban land and cultivated land; and water was mainly converted into cultivated land and forest.
Furthermore, we observed mainly two types of large-scale conversion from 2010 to 2020: the conversion of 42.68 km2 of cultivated land into urban land and the conversion of 14.10 km2 of urban land into cultivated land. Compared with the first ten years, there are three main differences in the change in land area and land transition matrix in the last ten years. First, the status of urban land was reversed in the mutual transformation with cultivated land, where a large amount of cultivated land was converted into urban land. In the second set of 10 years, 42.68 km2 of cultivated land was converted into urban land, which was much greater than that in the first ten years. Second, the reduction in forest land slowed, also slowing down the conversion of forest to cultivated land from 13.18 to 5.85 km2. Third, water was restored, and the main conversion was from cultivated land and forest. In contrast to the changes in the first ten years, 0.9 km2 of cultivated land and 0.7 km2 of forest were restored to water.

3.2. Establishment of the LUCC Model

3.2.1. Construction of the CA-Markov Model

First, the land use transition matrix from 2000 to 2010 was established based on the Markov module. Then, the suitability image of each land use type was generated using the MCE module based on the comprehensive driving forces. The weight of the driving forces of each land use is shown in Table 4 below.
The suitability image of each land type is shown in Figure 6a. Darker colors represent higher suitability and possibility of conversion into the underlying land type within the grid. The CA-Markov model was used to obtain the land use simulation in 2020 (Figure 6b) based on the obtained transition matrix and the suitability atlas of land use types.

3.2.2. Construction of the LCM Model

Similarly, the transfer model was trained using the multi-layer perceptron (MLP) neural network, based on the five driving forces, i.e., altitude, slope, road distance, urban land distance, and water distance. Because it can be challenging to generate a complex transfer model that simultaneously satisfies the prediction accuracy of all five types of transfer [27], forest→cultivated land and forest→urban land were combined into one transfer model. The four transfer types were generated with the accuracy shown in Table 5.
Five transition probability images were further generated based on MLP, as shown in Figure 7. Then, based on the obtained transition matrix and the land use transition probability images, the LCM model was used to obtain the land use simulation in 2020 (Figure 8).

3.2.3. Comparison of Model Accuracy

We used the CROSSTAB tool in GIS Analysis under IDRISI to calculate the Kappa coefficient, which was then used to test the reliability of the two LUCC models. The Kappa coefficient of the CA-Markov model was estimated to be 81.08% based on the confusion matrix of its prediction map and actual land use classification map. Similarly, the Kappa coefficient of the LCM model was estimated to be 78.1% based on the confusion matrix of its predication map and actual land use classification map. Since the Kappa coefficient of both models was greater than 75%, we concluded that both have strong consistency between the simulation result and the actual situation. However, the Kappa coefficient of the CA-Markov Model was greater than that of the LCM model, so the simulation results of the former model were more accurate in terms of quantitative accuracy and spatial accuracy, indicating that CA-Markov Model is more suitable for the future prediction of land-use spatial structure simulation in this area. Therefore, the CA-Markov model was adopted in the prediction of land use distribution in Qishan in 2030.

3.3. Multi-Scenario Prediction of Land Use

With 2020 as the starting point, the verified CA-Markov model was used to predict the land use in Qishan in 2030. Given the possibility that future land planning interventions, incentives and restrictions will change the land development process, we outlined three scenarios to simulate the land use classification in 2030 (Figure 9). The statistics of land use area and changes under the three scenarios are shown in Table 6 below:
Table 6 shows that the common trends under the three scenarios from 2020 to 2030 are shrinking areas of cultivated land and forest and increased areas of urban land and water. The results show that cultivated land will decrease by 19.57 km2, and the forest will decrease by 4.38 km2 within 10 years. Although the area base of forest and cultivated land in Qishan is extensive, the reduction year by year is a potential threat to Qishan.
Compared with the land use area in the natural state scenario, in the economic development scenario, the cultivated land decreased by 4.02 km2, and the urban land increased by 4.28 km2. It can be concluded that if the national authorities continue to give priority to economic development, considerable cultivated land will be converted into urban land, and forest will also be affected, which may threaten food security and local ecology. Therefore, it is necessary to adopt appropriate planning restrictions on the expansion of urban land.
Under the scenario of water protection, as the conversion of water into other land uses is prohibited, the water area increased significantly by 45% compared with that in the natural state. However, other land types did not change significantly, indicating that under the premise of not impeding economic development, the prevention of water area reduction has a certain effect on protecting the region’s fragile water ecosystem.

4. Discussion

Between 2000 and 2020, the water area of Qishan County underwent a substantial decrease in the first ten years and a substantial increase in the latter 10 years. This is related to the implementation of large-scale remediation of soil erosion and water resource occupation by the local government in recent years. However, the urban land area increased most significantly in the last 20 years. These phenomena shed light on a paradox regarding the coexistence of population loss and residential spatial expansion in shrinking cities, which is consistent with Song [28] and Xu [29]’s conclusion that urban land expanded blindly in some shrinking cities in China. This scenario may lead to secondary issues such as vacant industrial land and residential buildings [30], which may be explained by policies focused on economic development being the mains targe of China’s national authorities, since urban land expansion is associated with economic improvement. Especially in the last ten years, the urban area in China has largely increased, and the economic index GDP of Qishan County has doubled.
In this study, the land use classification of Qishan County in 2030 is predicted under three scenarios: natural state, economic development with expansion of urban land, and water conservation with restricted conversion. The results show that both cultivated land and forest are decreasing in any scenario and, especially considering the strong background of economic development, the area of cultivated land decreases more sharply and the urban land increases more rapidly compared with the area in the natural state. This urbanization process is related to the government’s long-term priority and focus on economic development and may have a series of negative impacts on human life and the environment [31,32]. Considering potential measures to restrict the encroachment of water, the water area increased by 45%, while other land use types were not affected, indicating that under the premise of not hampering economic development, restricting the conversion of water into other land use types can somehow protect the fragile water ecology.
Based on the outcomes of our research results above, we make the following suggestions for the local governments of Qishan County. First, in urban planning, priority should be given to avoiding the blind expansion of residential land and construction land, improving the utilization efficiency of urban space, and handling the contradiction between the expansion of residential land and population loss. Second, land policies should be implemented to prevent the occupation of water and cultivated land and the negative orientation of land use in terms of environmental and social ecosystem services. Furthermore, it is necessary to adopt certain planning restrictions to achieve rational economic development. In addition, existing construction land resources in Qishan County could be optimized to reduce damage caused by new construction to the environment. Finally, when planning future land use in a county, stakeholder knowledge and innovation of suitable sustainable local land-use patterns should be increased.

5. Conclusions

This study provides an analysis of land use change in Qishan from 2000 to 2020. Upon comparison of two LUCC models, the CA-Markov model was used to predict and analyze land use under three scenarios in 2030. The conclusions are as follows:
(1) From 2000 to 2020, the area of cultivated land first increased and then decreased; the area of forest continued to shrink but at a slower rate; and the water area first decreased and then increased. In contrast, the urban land expanded considerably, especially in the latter ten years from 2010 to 2020. This chaotic spatial distribution has severe negative implications for the landscape. Certain controlling measures are needed to limit the increase in construction land and improve the utilization rate of land resources;
(2) The comprehensive dynamic change in water is the most significant, indicating that due to its original small area, water land type is an unstable resource in Qishan County. Even though large-scale remediation of soil and water resources has been implemented by the local government in recent years, more attention should be given to protecting water ecosystems; and
(3) Results from the CA-Markov model used for the simulation and prediction of land use change under three different scenarios in 2030 pointed out some relevant possibilities. First, the scenario of water conservation shows that prohibiting the conversion of water can better protect the fragile water ecological environment without hampering the region’s development. The rapid disappearance of cultivated land under the scenario of economic development may threaten food security, and reasonable planning is needed for rational economic development.

Author Contributions

Conceptualization, J.W. and Z.F.; methodology, N.X., R.Y. and F.Y.; formal analysis, N.X., R.Y. and F.Y.; investigation, N.X., R.Y. and F.Y.; writing—original draft preparation, N.X.; writing—review and editing, N.X., N.X., R.Y., F.Y., J.W. and Z.F.; visualization, N.X., R.Y., F.Y., J.W. and Z.F.; supervision, J.W. and Z.F.; funding acquisition, N.X. and J.W. All authors have read and agreed to the published version of the manuscript.

Funding

This research was funded by the Fundamental Research Funds for the Natural Science Foundation of China (grant numbers 42071342, 42101473, 42171329) and the Beijing Natural Science Foundation Program (grant numbers 8222052, 8222069).

Data Availability Statement

Global land cover data were downloaded from http://globeland30.org (accessed on 10 October 2021). The altitude data were downloaded from https://earthexplorer.usgs.gov/ (accessed on 10 October 2021). The Road, Water, Resident data-set were provided by National Catalogue Service for Geographic Information.

Acknowledgments

We are grateful to the staff of Beijing City Management Municipal Institute and the teachers of the Laboratory of Forest Management and “3S” Technology, Beijing Forestry University.

Conflicts of Interest

The authors declare no conflict of interest.

References

  1. Jin, G.; Chen, K.; Liao, T.; Zhang, L.; Najmuddin, O. Measuring ecosystem services based on government intentions for future land use in Hubei Province: Implications for sustainable landscape management. Landsc. Ecol. 2021, 36, 2025–2042. [Google Scholar] [CrossRef]
  2. Hu, Y.F.; Zhang, Y.Z.; Han, Y.Q. Identification and monitoring of desertification lands in China from 2000–2015. Arid. Land Geogr. 2018, 41, 1321–1332. [Google Scholar]
  3. Kolios, S.; Stylios, C.D. Identification of land cover/land use changes in the greater area of the Preveza peninsula in Greece using Landsat satellite data. Appl. Geogr. 2013, 40, 150–160. [Google Scholar] [CrossRef]
  4. Shen, G.; Yang, X.C.; Jin, Y.X.; Luo, S.; Xu, B.; Zhou, Q.B. Land use changes in the Zoige Plateau based on the object-oriented method and their effects on landscape patterns. Remote Sens. 2020, 12, 14. [Google Scholar] [CrossRef]
  5. Wu, T.S.; Feng, F.; Lin, Q.; Bai, H.M. A spatio-temporal prediction of NDVI based on precipitation: An application for grazing management in the arid and semi-arid grasslands. Int. J. Remote Sens. 2020, 41, 2359–2373. [Google Scholar] [CrossRef]
  6. Zhao, D.Y.; Xiao, M.Z.; Huang, C.B.; Liang, Y.; Yang, Z.T. Land use scenario simulation and ecosystem service management for different regional development models of the Beibu Gulf Area, China. Remote Sens. 2021, 13, 3161. [Google Scholar] [CrossRef]
  7. Chen, Z.Z.; Huang, M.; Zhu, D.Y.; Altan, O. Integrating remote sensing and a Markov-FLUS model to simulate future land use changes in Hokkaido, Japan. Remote Sens. 2021, 13, 2621. [Google Scholar] [CrossRef]
  8. Liu, X.Q.; Liu, L. Ecological Function of Urban Green Roof and Analysis of Its Influencing Factors. Agric. Sci. Technol. 2017, 18, 2583–2586. [Google Scholar]
  9. Chi, Z.Y. Study on Land Use Change in Upper Nenjiang River Basin Based on Logistic-Ca-Markov Model; Harbin Normal University: Harbin, China, 2020. [Google Scholar]
  10. Wu, J.J. Simulation of Land Use Change and Evaluation of Eco-Environmental Effects in the Lower Reaches of Wujiang River Based on GIS and CA-Markov Model; Southwest University: El Paso, TX, USA, 2017. [Google Scholar]
  11. Xiao, L. Scenario Simulation of Land Use Change in the Basin of Fuxian Lake Based on Ca-Markov Model; Kunming University of Science and Technology: Kunming, China, 2017. [Google Scholar]
  12. Xu, X.J.; Liu, H.Y.; Lin, Z.S.; Liu, J.X.; Li, L.H. Scenario Analysis of Land Use Change in Jiangsu Coast Based on CA-Markov Model. Res. Soil Water Conserv. 2017, 24, 213–218, 225. [Google Scholar]
  13. Wu, K.; Li, Y.C. Research progress of urban land use and its ecosystem services in the context of urban shrinkage. J. Nat. Resour. 2019, 34, 1121–1134. [Google Scholar] [CrossRef]
  14. Wu, K.; Qi, W. Shrinking cities: Misunderstandings, identifications and reflections. Geogr. Res. 2021, 40, 213–229. [Google Scholar]
  15. Yang, F. Exploration and thinking on the carrying capacity of water resources in Qishan County. Shaanxi Water Resour. 2020, 10, 27–28, 33. [Google Scholar]
  16. Rong, Y.J.; Zhang, H.; Zhao, X.F. Evaluation of ecological sensitivity of land use in Jiaxing city based on MCE-CA model. J. Agric. Resour. Environ. 2015, 32, 343–353. [Google Scholar]
  17. Wang, Q.; Meng, J.J.; Mao, X.Y. Scenario simulation and landscape pattern assessment of land use change based on neighborhood analysis and auto-logistic model: A case study of Lijiang River Basin. Geogr. Res. 2014, 33, 1073–1084. [Google Scholar]
  18. Zhang, H.Y. Fan Jiangwen, Shao Quanqin. Land use/land cover change in the grassland restoration program areasin China, 2000–2010. Prog. Geogr. 2015, 34, 840–853. [Google Scholar]
  19. Huang, D.; Li, R.D.; Qiu, J. Analysis on spatio-temporal variation of land use and its policy-driven factors in Wuhan metropolitan area. J. Geo-Inf. Sci. 2017, 19, 80–90. [Google Scholar]
  20. Feng, R.; Xu, L.L.; Zhang, L.; Liu, X. Spatio-temporal Analysis of Land Use Change in Mudanjiang City Based on Geographical National Conditions Monitoring. Geomat. Spat. Inf. Technol. 2022, 45, 150–154. [Google Scholar]
  21. Wu, R.; Wang, Y.; Zhang, X.D.; Li, X.M.; Wang, G.L. Study on dynamic change and driving mechanism of land use types in Hebei province. J. Liaoning Norm. Univ. (Nat. Sci. Ed.) 2022, 45, 252–259. [Google Scholar]
  22. Yang, X.; Zheng, X.; Chen, R. A Land Use Change Model: Integrating Landscape Pattern Indexes and Markov-ca. Ecol. Model. 2014, 283, 1–7. [Google Scholar] [CrossRef]
  23. Han, L. The classification model of RS images based on artificial neural network—MLP. Bull. Surv. Mapp. 2004, 9, 29–42. [Google Scholar]
  24. Lin, J. Study on Land Use Change and Its Simulation Based on the MLP-CA-Markov Model in Jinjiang City; Fujian Nomal University: Fujian, China, 2014. [Google Scholar]
  25. Jamali, A. Land use land cover mapping using advanced machine learning classifiers: A case study of Shiraz city, Iran. Earth Sci. Inform. 2020, 13, 1015–1030. [Google Scholar] [CrossRef]
  26. Wei, L.L. Land Use Change Prediction Based on IDRISILCM Model-Case Study of the Zhuanghe City; Liaoning Normal University: Dalian, China, 2015. [Google Scholar]
  27. Nourqolipour, R.; Shariff, A.R.B.M.; Balasundram, S.K.; Ahmad, N.B.; Sood, A.M.; Buyong, T.; Amiri, F. A Gis-based model to analyze the spatial and temporal development of oil palm land use in Kuala Langat District, Malaysia. Environ. Earth Sci. 2015, 73, 1687–1700. [Google Scholar] [CrossRef]
  28. Song, Y.; Zhu, D.L.; Yeung, G.; Xu, Y.; Zhang, L.X. Spatio-temporal evolution and driving mechanism of urban land use structure with the context of urban shrinkage:Evidence from Northeast China. Geogr. Res. 2021, 40, 1387–1403. [Google Scholar]
  29. Xu, H.X.; Liu, Y.J. Spatiotemporal differentiation and influencing mechanism of construction land use efficiency of shrinking cities: A case study of Yichun city of Heilongjiang province. J. Environ. Manag. 2021, 40, 937–947. [Google Scholar] [CrossRef]
  30. Pang, G.W. Quantitative Characterization of Human Factors Effecting the Soil Erosion Environmental. Master’s Thesis, Graduate University of Chinese Academy of Sciences, Beijing, China, 2012. [Google Scholar]
  31. Shi, P.J.; Bai, X.M.; Kong, F.; Fang, J.Y.; Gong, D.Y.; Zhou, T.; Guo, Y.; Liu, Y.S.; Dong, W.J.; Wei, Z.G.; et al. Urbanization and air quality as major drivers of altered spatiotemporal patterns of heavy rainfall in China. Landsc. Ecol. 2017, 32, 1723–1738. [Google Scholar] [CrossRef]
  32. Gong, B.H.; Liu, Z.F. Assessing impacts of land use policies on environmental sustainability of oasis landscapes with scenario analysis: The case of northern China. Landsc. Ecol. 2020, 36, 1913–1932. [Google Scholar] [CrossRef]
Figure 1. Geographical Location of Qishan County (2020).
Remotesensing 14 04041 g001
Figure 2. Technical analysis pathway and modeling framework.
Remotesensing 14 04041 g002
Figure 3. Land use maps of Qishan in 2000, 2010 and 2020.
Remotesensing 14 04041 g003
Figure 4. Situation analysis of Qishan. (a) Land use area in Qishan from 2000 to 2020; (b) land use area change in Qishan from 2000 to 2020.
Remotesensing 14 04041 g004
Figure 5. Changes in land use types of Qishan from 2000 to 2020. (a) Changes in land use types of Qishan from 2000 to 2010; (b) Changes in land use types of Qishan from 2010 to 2020.
Remotesensing 14 04041 g005
Figure 6. CA-Markov model establishment. (a) Suitability map for each land use type; (b) Simulation of land use map in 2020.
Remotesensing 14 04041 g006
Figure 7. Transition probability for each land use type in LCM model establishment.
Remotesensing 14 04041 g007
Figure 8. Simulation of land use map in 2020 based on the LCM model.
Remotesensing 14 04041 g008
Figure 9. Prediction of land use in Qishan under three scenarios in 2030. “natural state” with the status quo unchanged, “economic development state” with accelerated expansion of urban land, and “water conservation state” without water output.
Remotesensing 14 04041 g009
Table 1. The resource of land use data and driving factor data.
Data TypeData NameData Resource
Land cover dataLand cover data in 2000, 2010, 2020http://globeland30.org/ (accessed on 10 October 2021).
Natural factorAltitudehttps://earthexplorer.usgs.gov/ (accessed on 10 October 2021).
SlopeExtracted from altitude image
Accessibility factorRoad distanceEuclidean distance from roads which deserved form National Catalogue Service for Geographic Information
Water distanceEuclidean distance from water areas which deserved form National Catalogue Service for Geographic Information
Residential area distanceEuclidean distance from residential areas which deserved form National Catalogue Service for Geographic Information
Table 2. Land use classification system in this paper.
ClassificationOriginal Land Use Type
1Cultivated landCultivated land
2ForestWoodland, grassland, shrub land
3WaterRiver, wetland
4Urban landUrban land
Table 3. Dynamic degree of land use change in Qishan from 2000 to 2020.
Land Use TypeSingle Dynamic DegreeComprehensive Dynamic Degree
2000–2010 (%)2010–2020 (%)2000–2010 (%)2000–2010 (%)2010–2020 (%)2000–2020 (%)
Cultivated land0.28−0.580.430.431.020.59
Forest−0.35−0.150.540.540.360.40
Water−4.638.025.085.081.622.52
Urban land−0.153.982.462.461.821.46
Table 4. Weight of driving forces for each land use type in the CA-Markov model establishment.
Land Use TypeDriving Force 1Driving Force 2Driving Force 3
Cultivated landSlope 0.6Altitude 0.2Water distance 0.2
ForestAltitude 0.6Slope 0.4-
WaterWater distance 1--
Urban landSlope 0.43Road distance 0.42Residential area distance 0.15
Table 5. The MLP accuracy of transition submodels in LCM model establishment.
NumAccuracy (%)Transfer Type
176.39Forest→Cultivated land
Forest→Urban land
266.48Cultivated land→Forest
390.23Cultivated land→Urban land
479.24Urban land→Cultivated land
Table 6. Prediction of land use change in Qishan under different scenarios from 2020 to 2030.
Land Use TypeReferenceNatural State (km2)Economic Development (km2)Water Area Protection (km2)
Cultivated landArea437.13433.11436.88
Change−19.57−23.59−19.82
ForestArea282.12281.88281.89
Change−4.38−4.63−4.62
WaterArea4.264.254.77
Change1.121.111.62
Urban landArea131.62135.90131.60
Change22.8327.1122.82
Publisher’s Note: MDPI stays neutral with regard to jurisdictional claims in published maps and institutional affiliations.

