
Impacts of Urban Green Space on Land Surface Temperature from Urban Block Perspectives

Abstract
:
1. Introduction
2. Materials and Methods
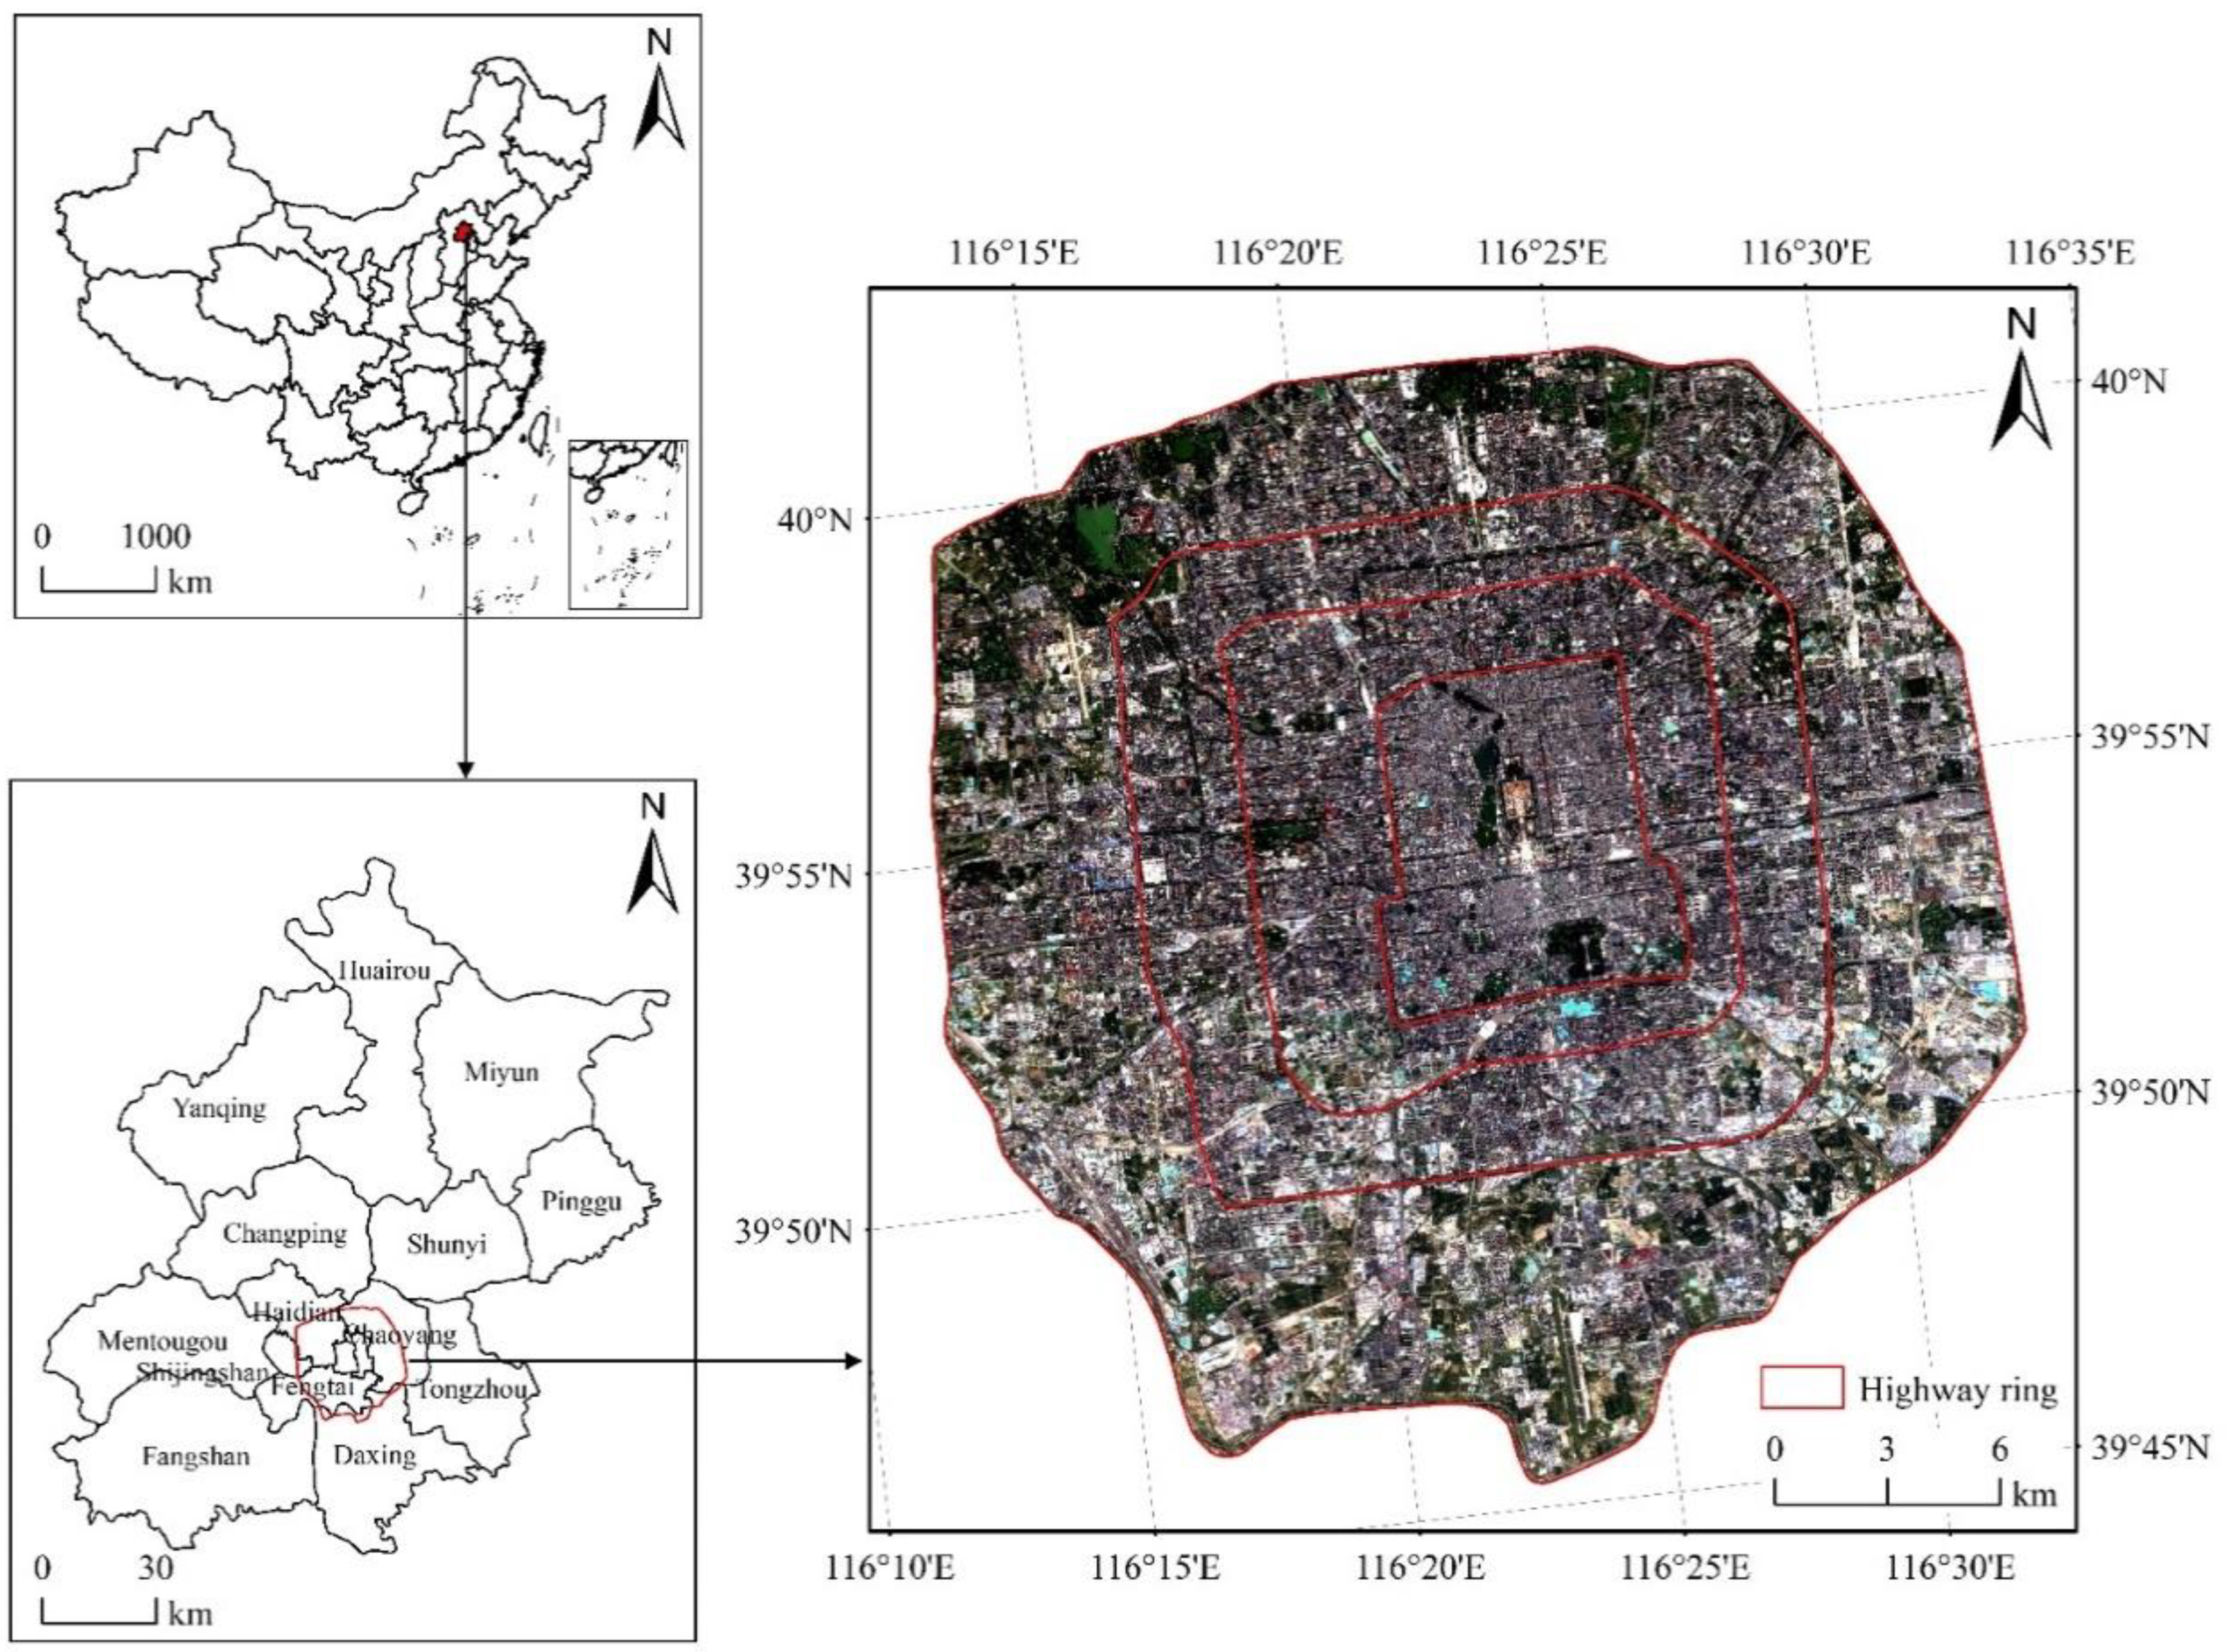
2.1. Study Area
2.2. Data Sources
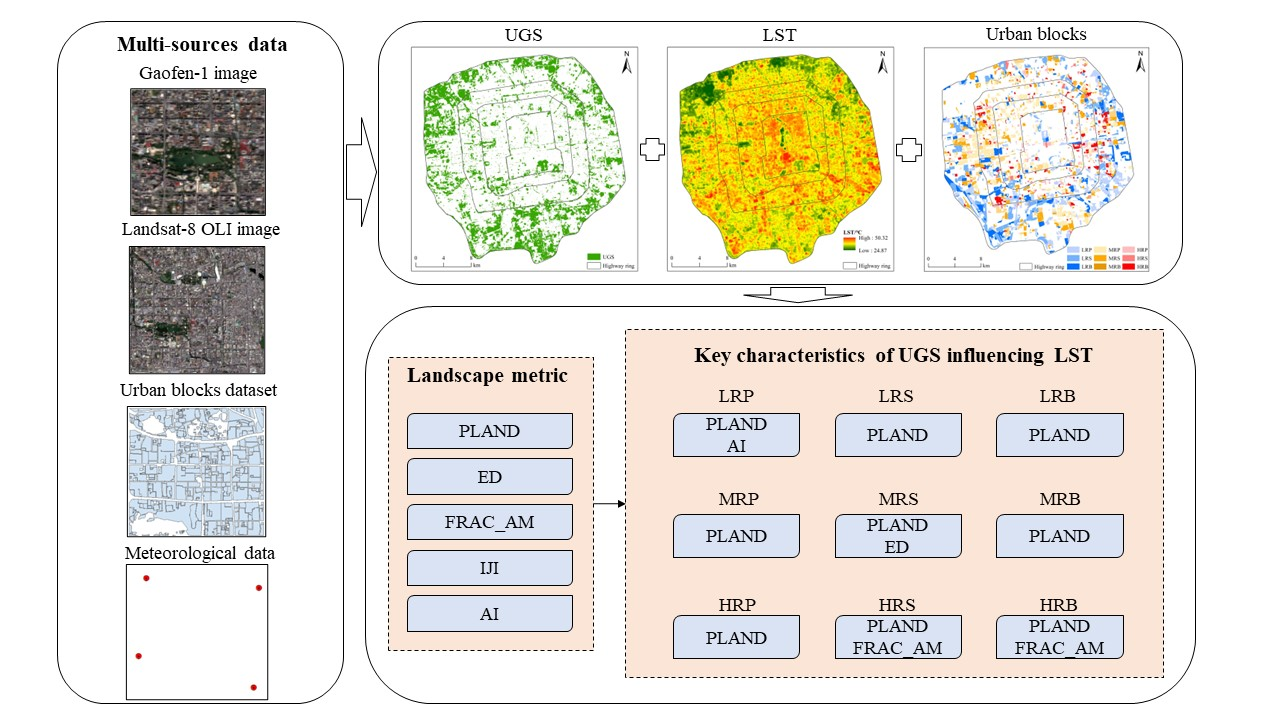
2.3. Methods
2.3.1. Extraction of UGS
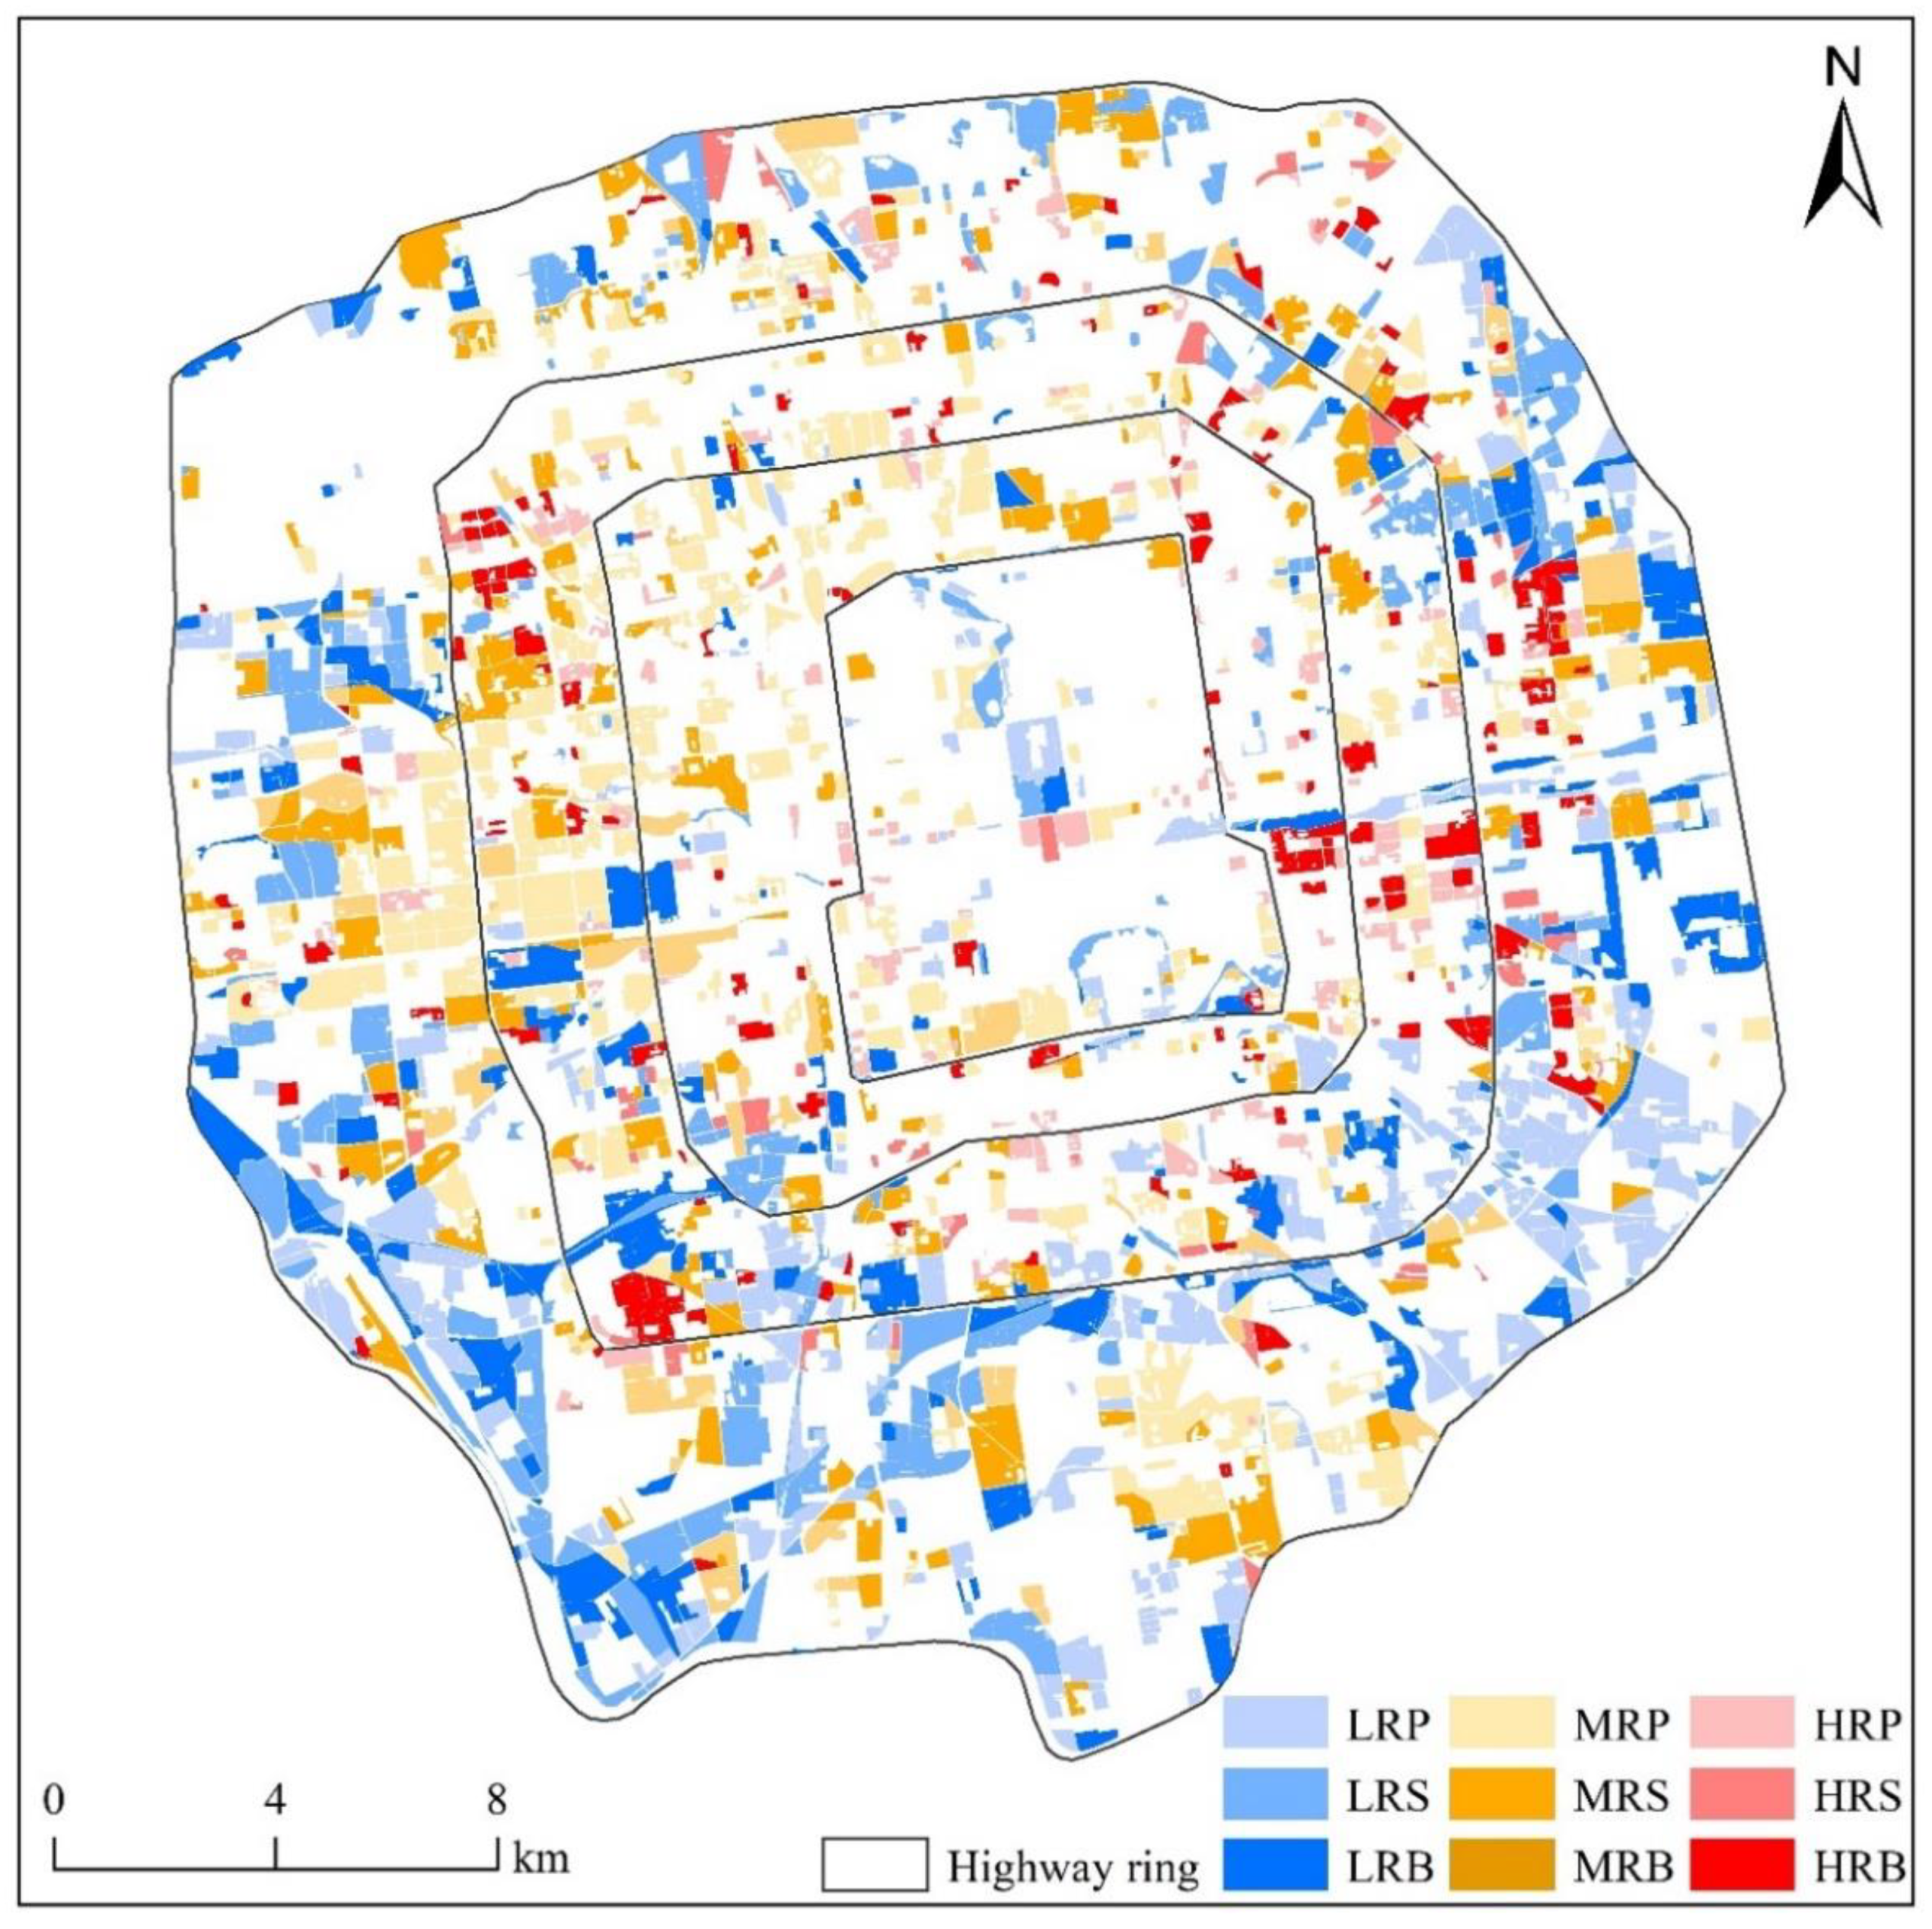
2.3.2. Selection of Urban Block Samples
2.3.3. Retrieval of LST
2.3.4. Analytical Methods
3. Results
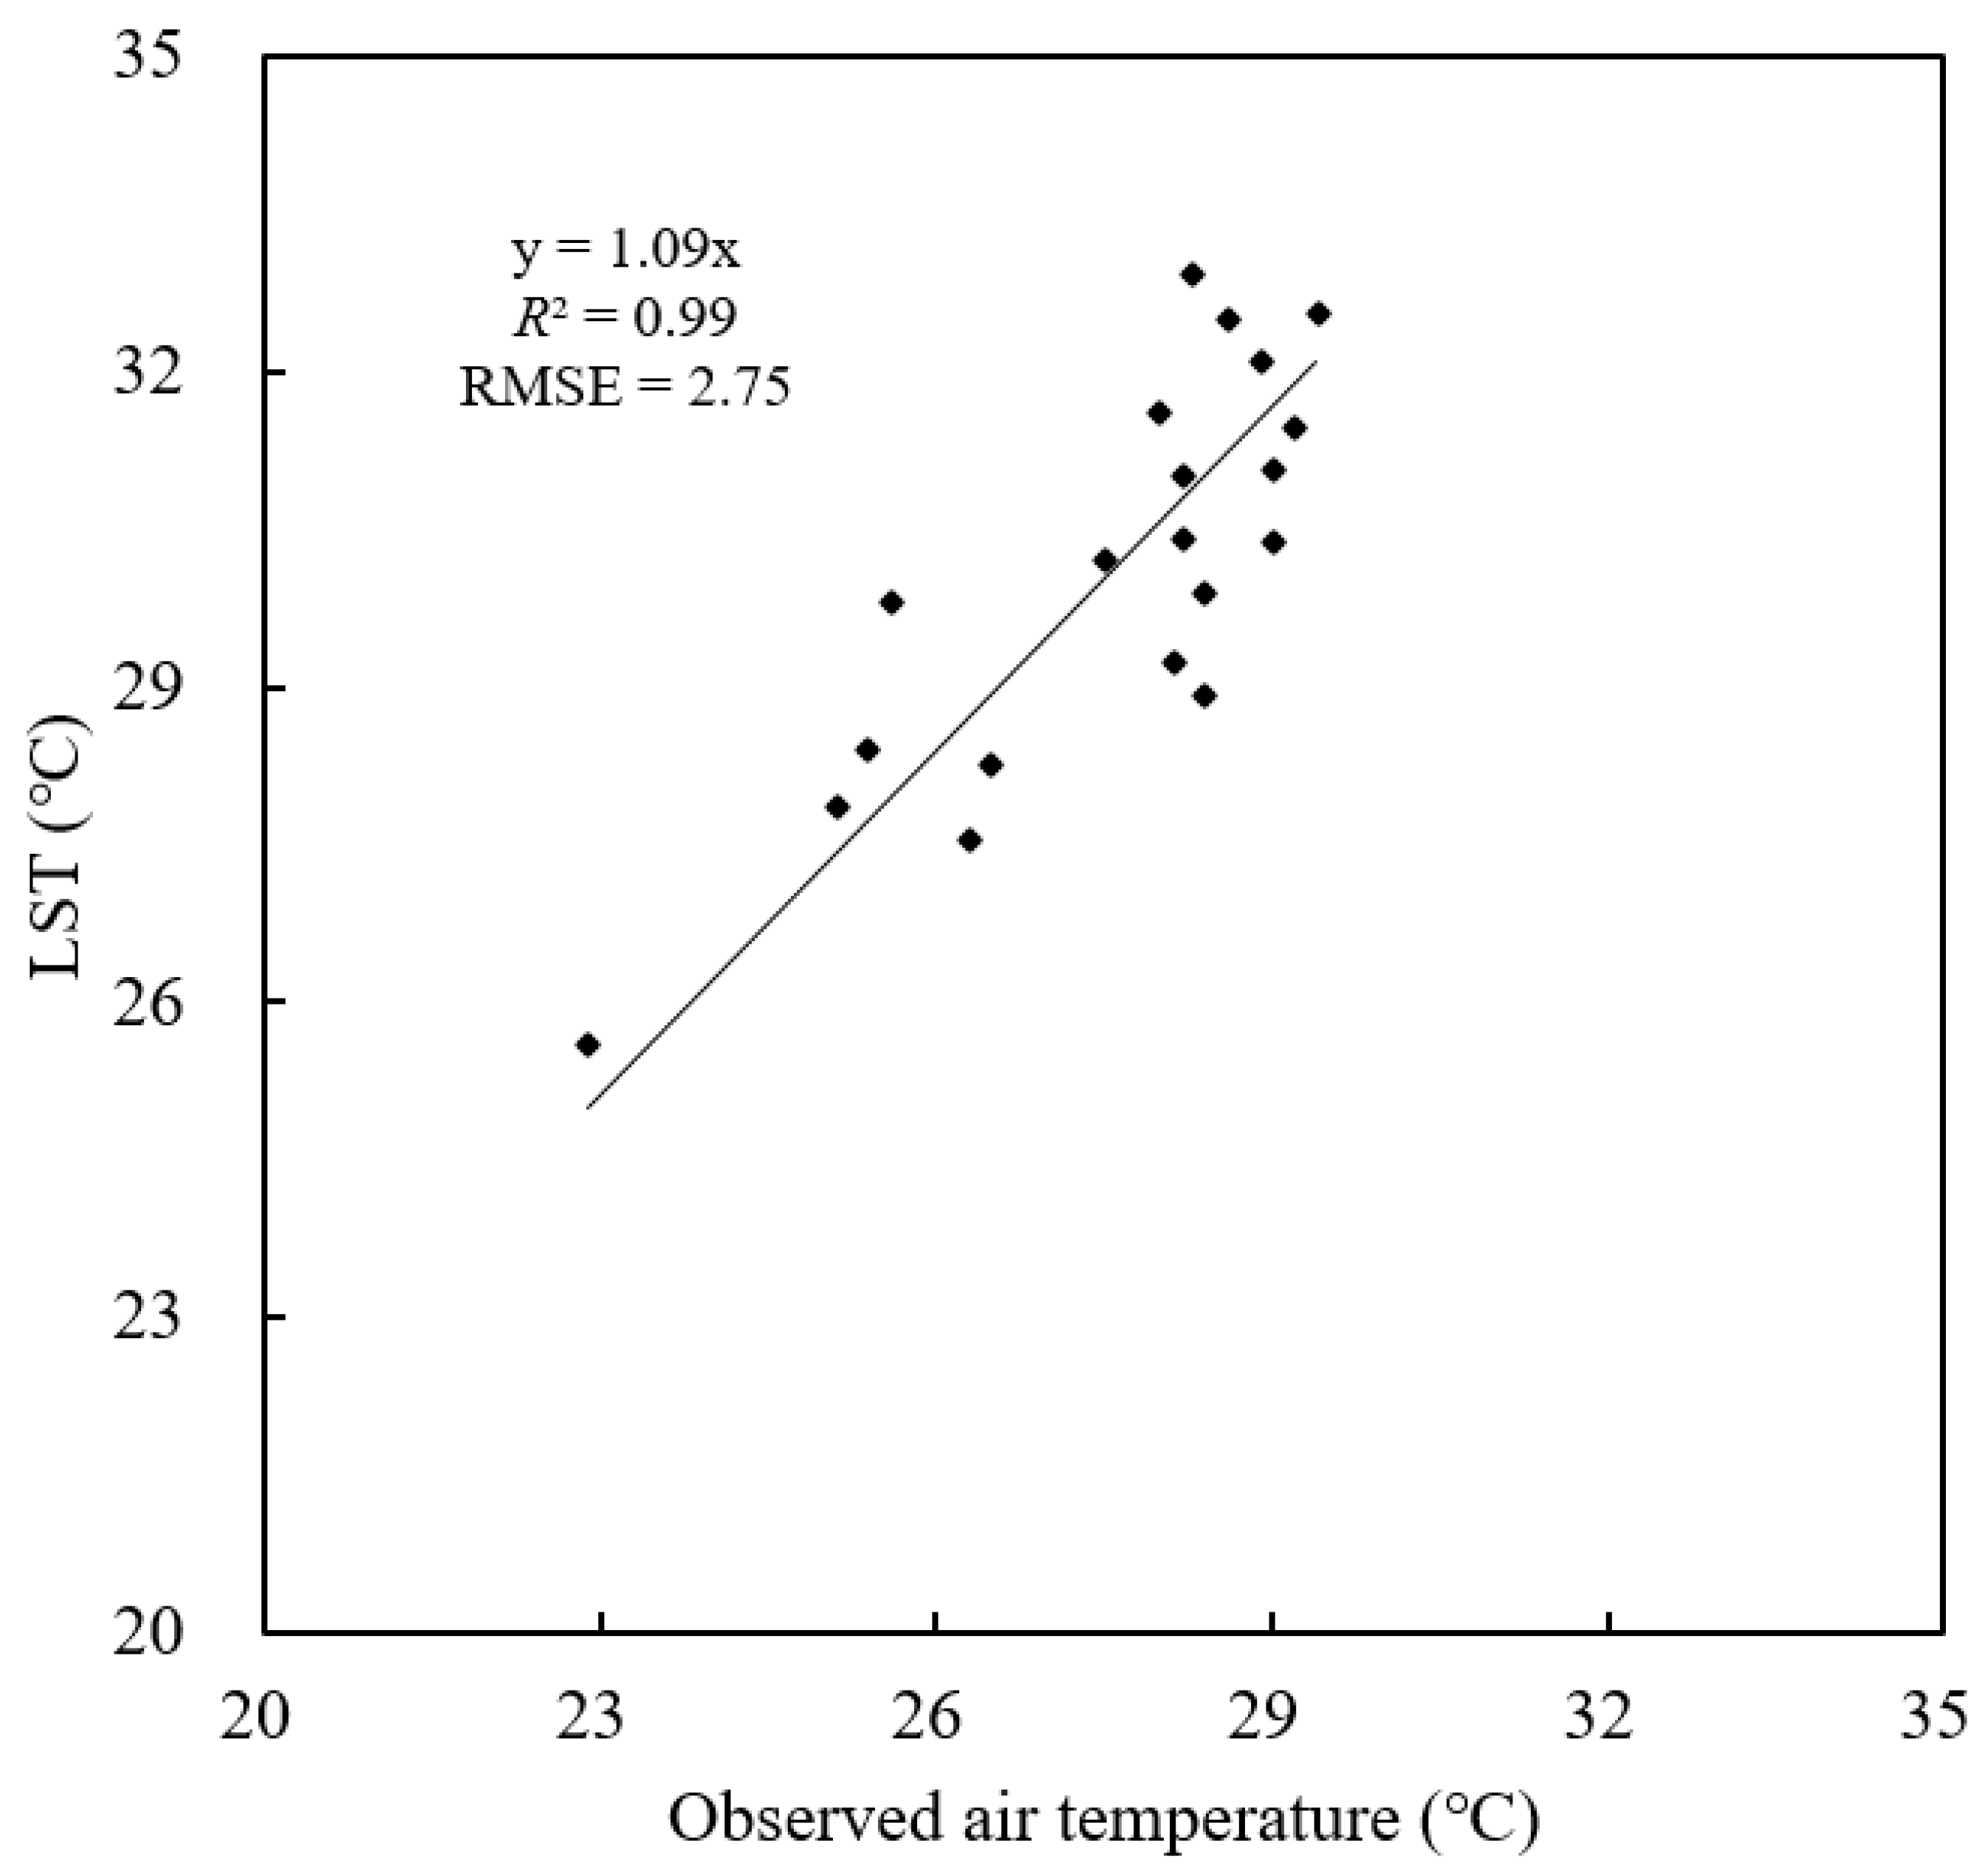
3.1. Validation of LST
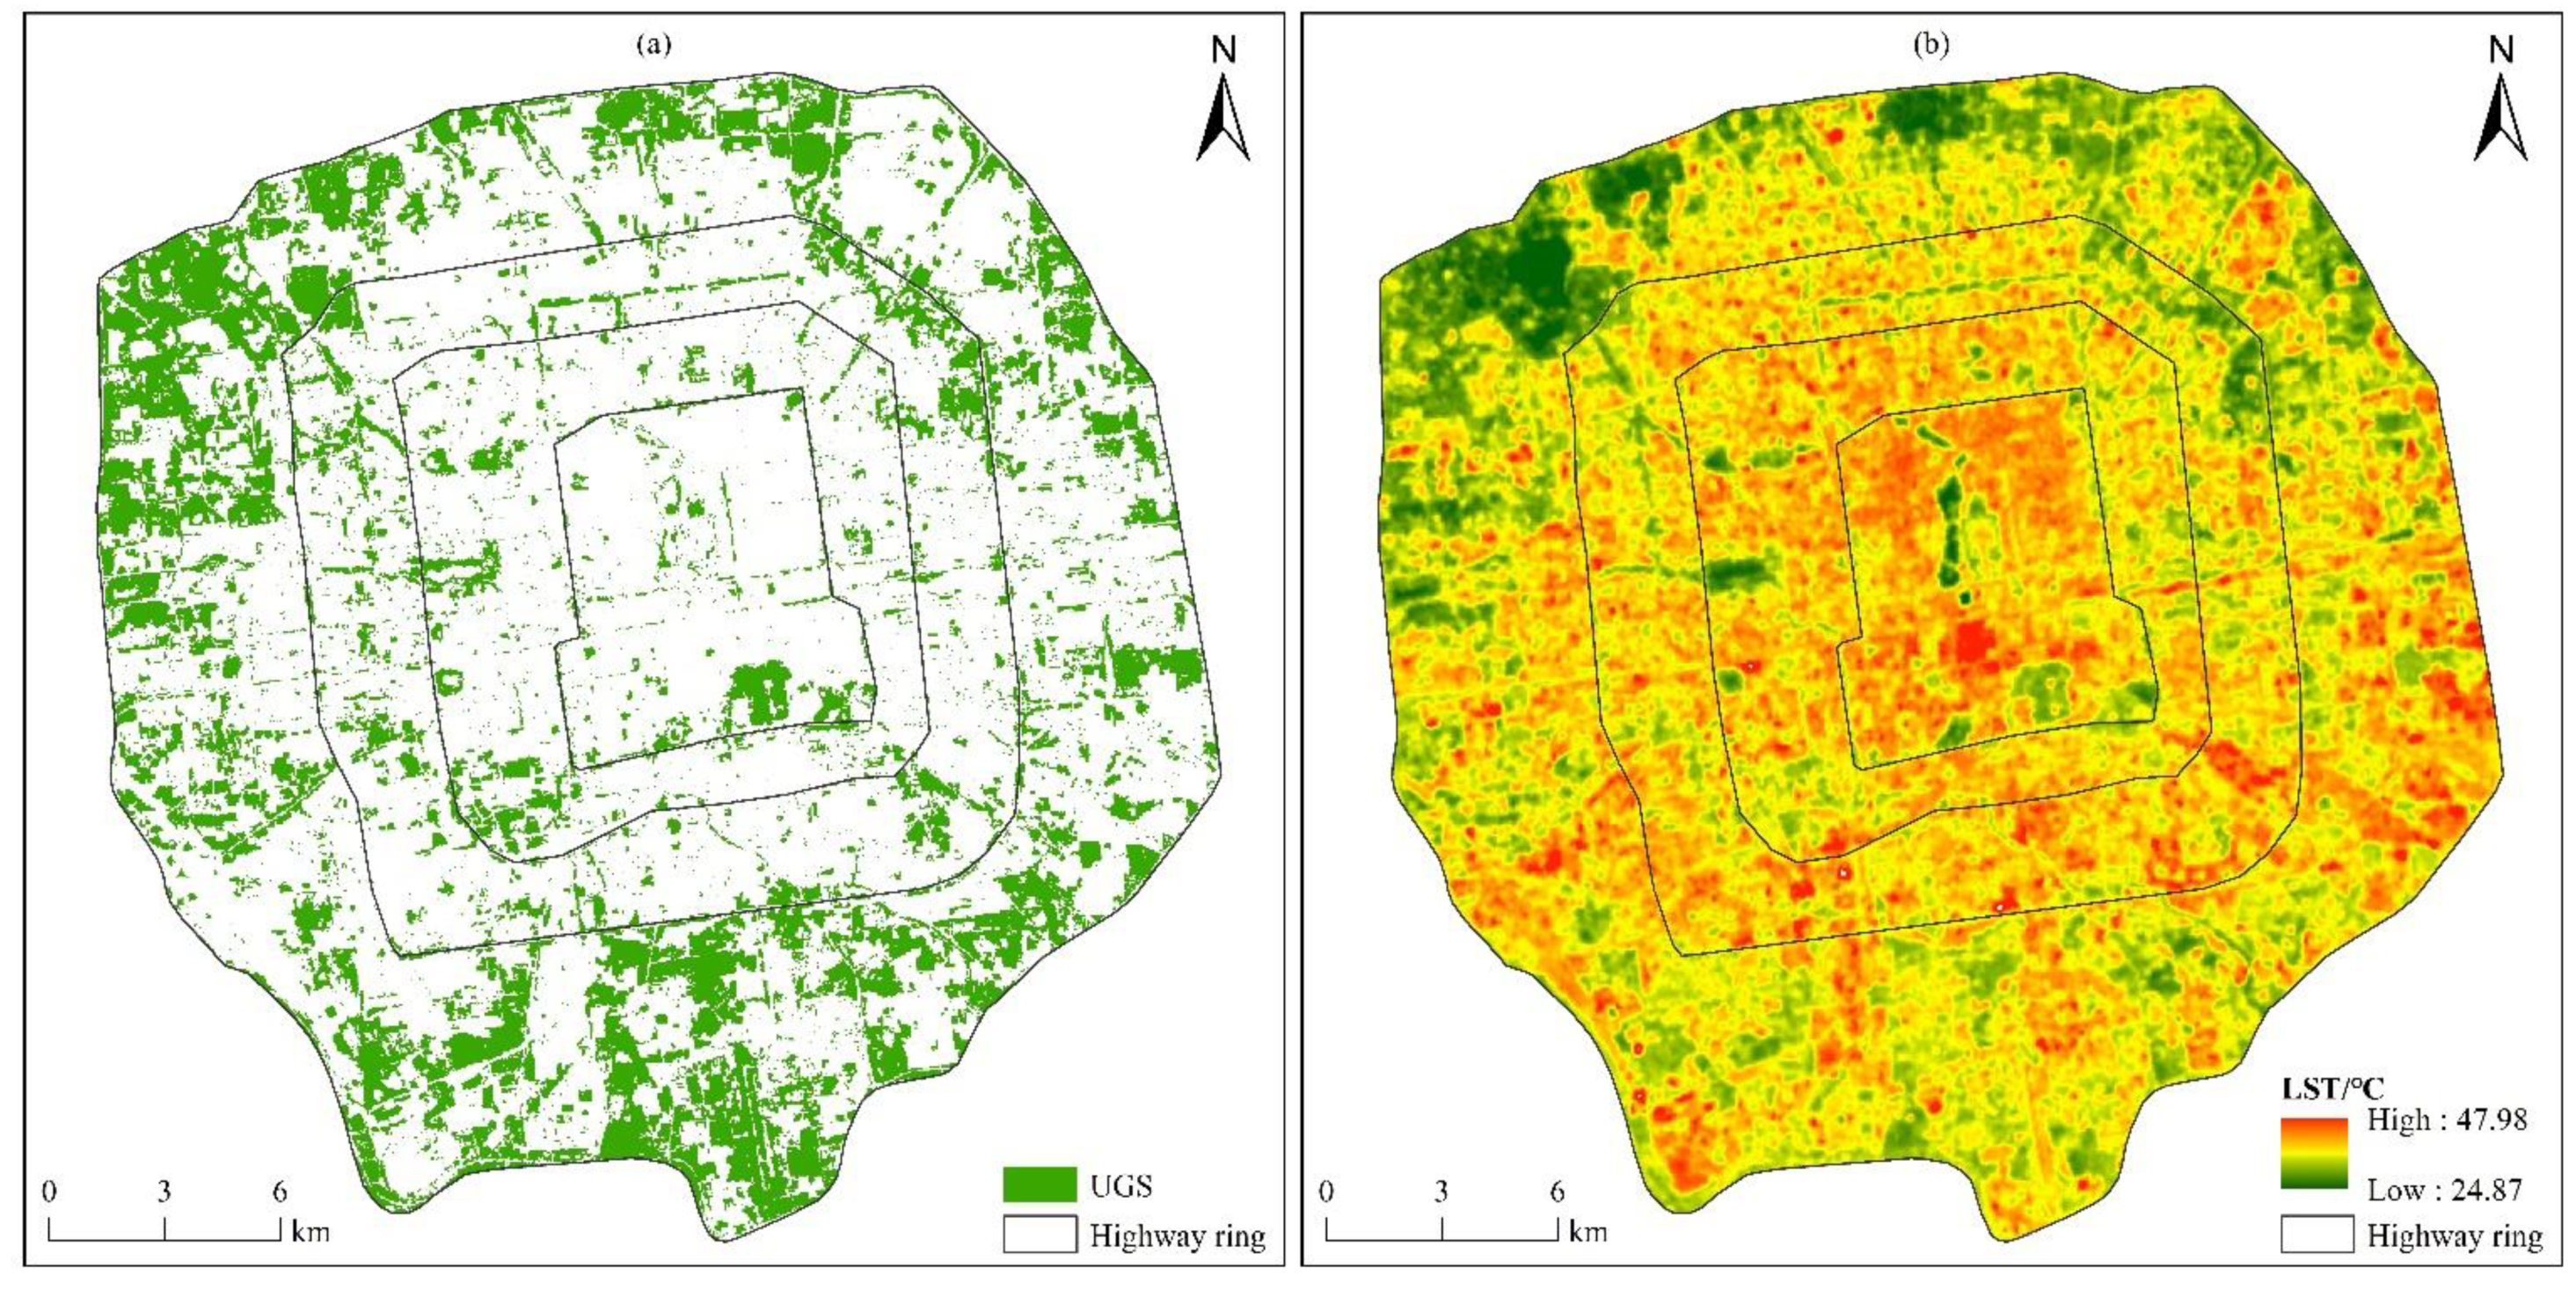
3.2. Spatial Distribution of UGS and LST
3.3. Composition of UGS among Different Urban Blocks
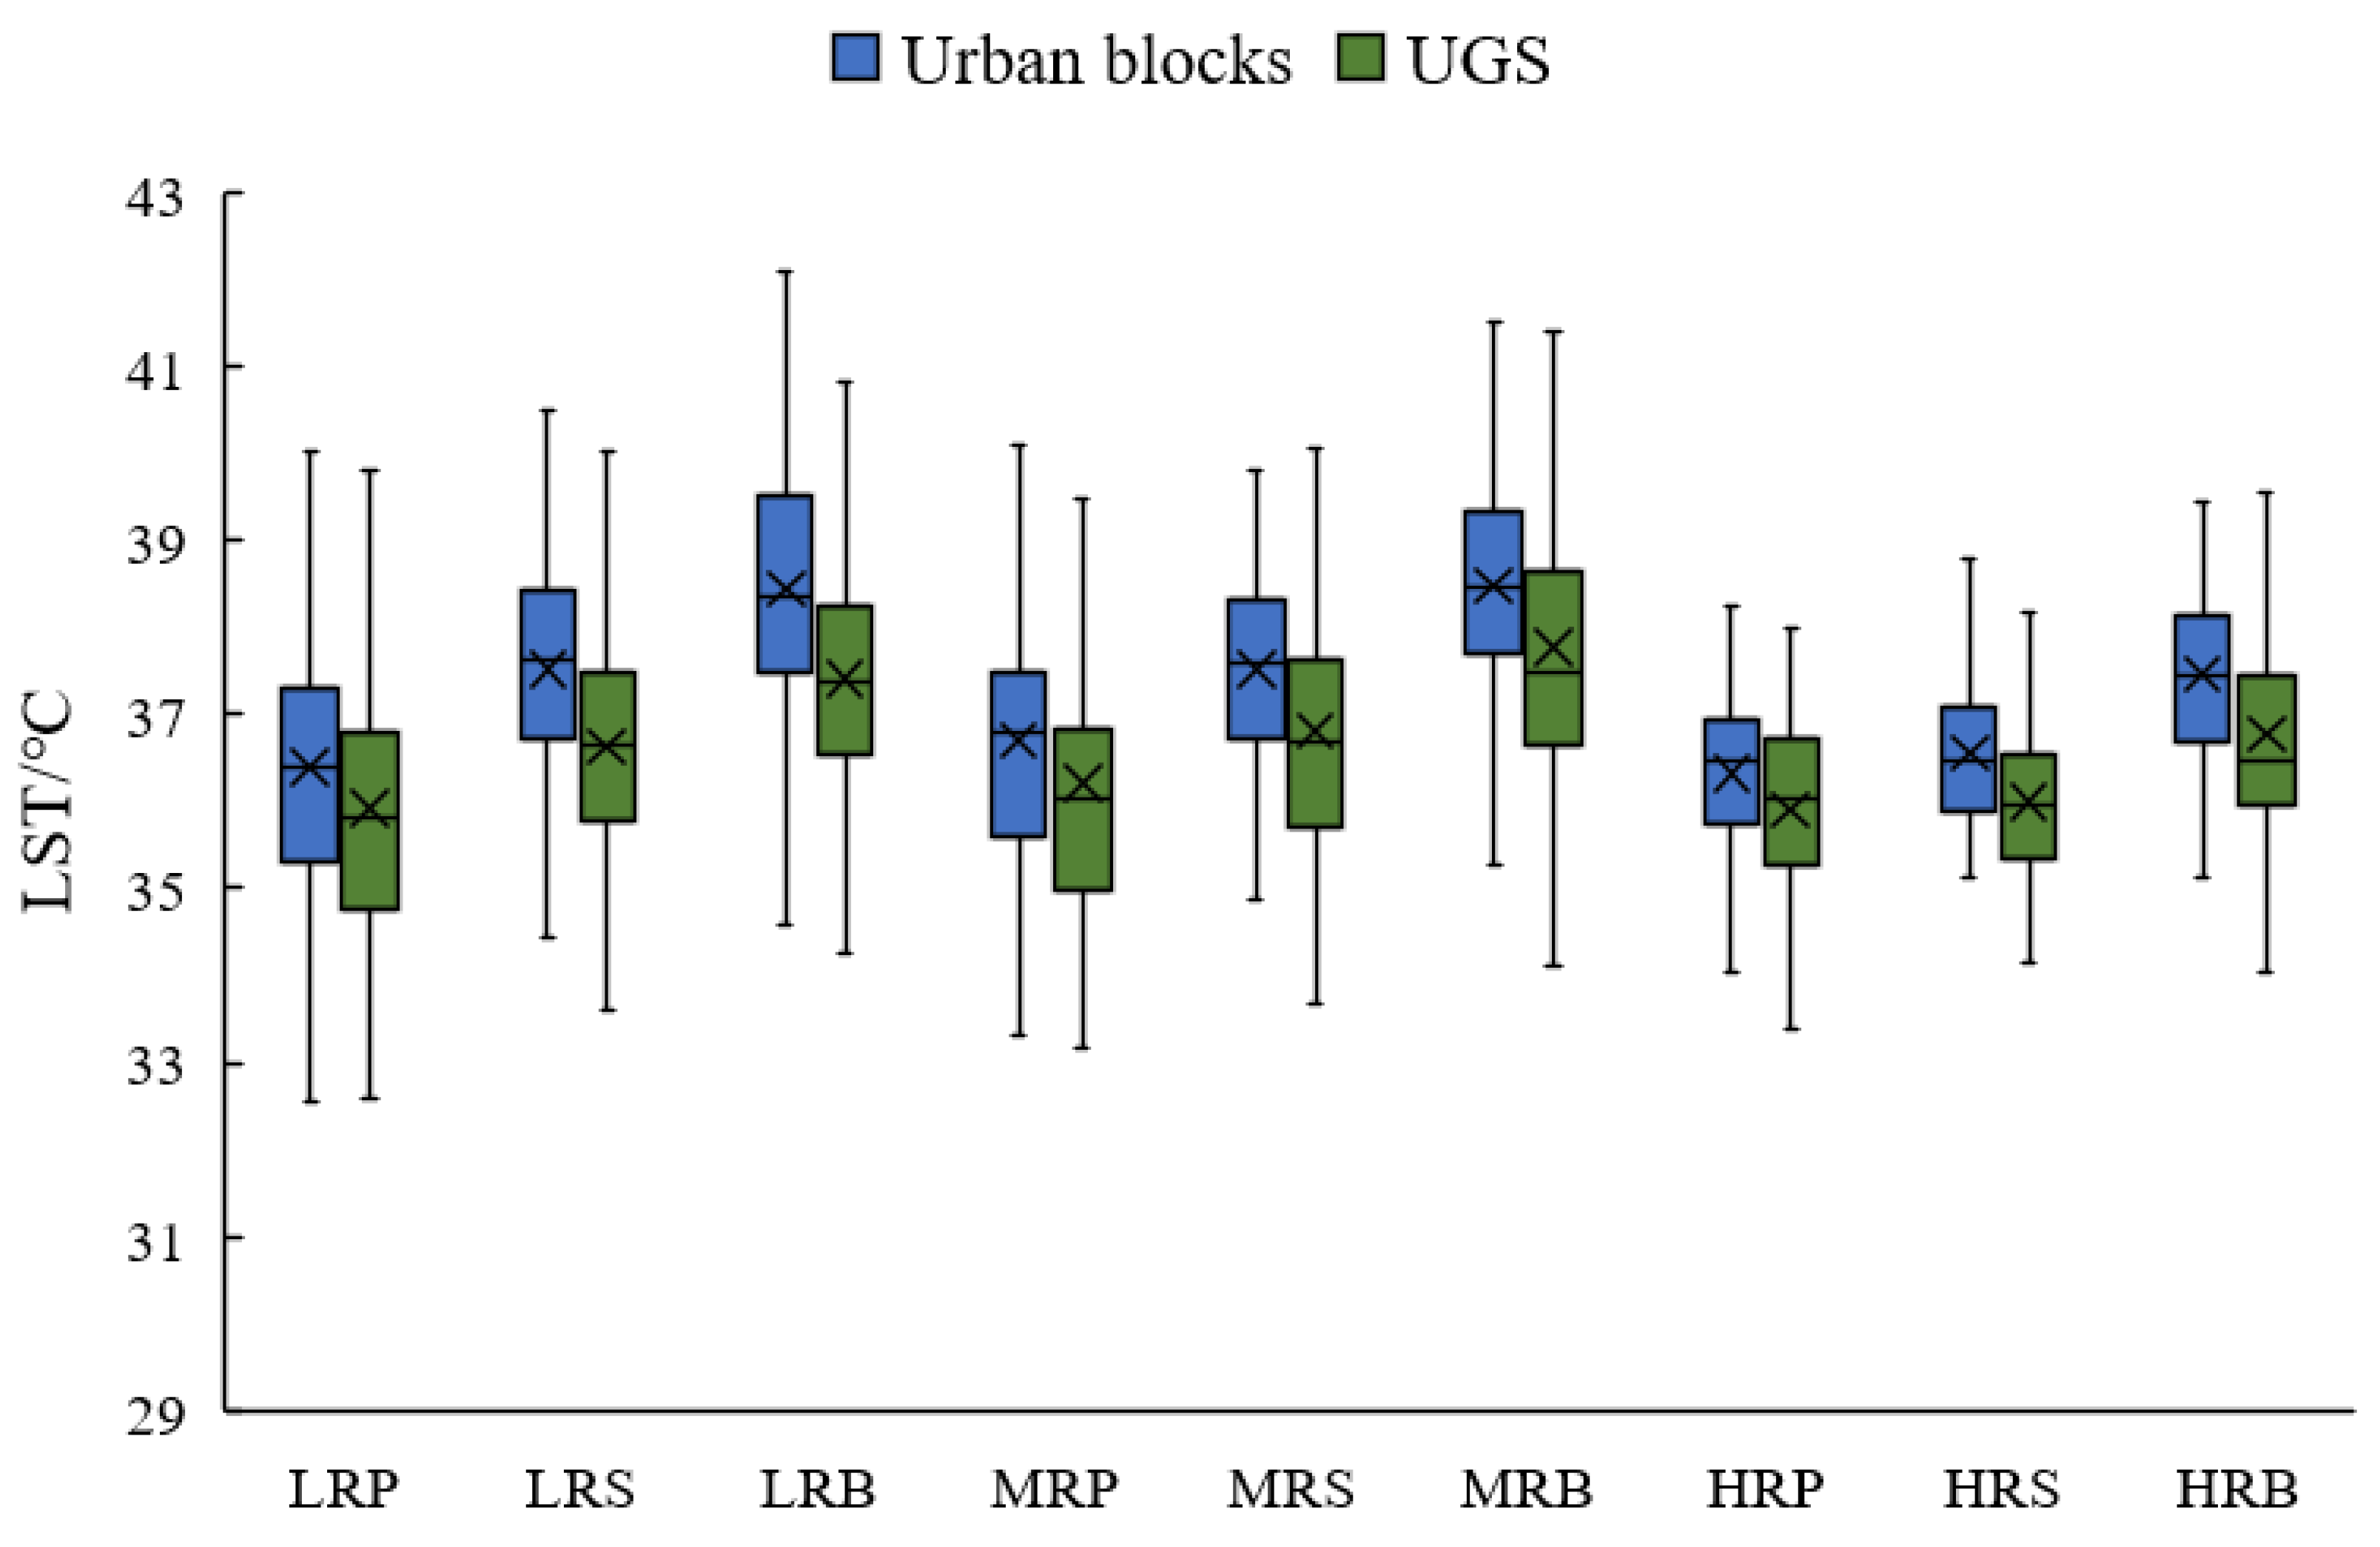
3.4. LST Difference between Urban Blocks and UGS
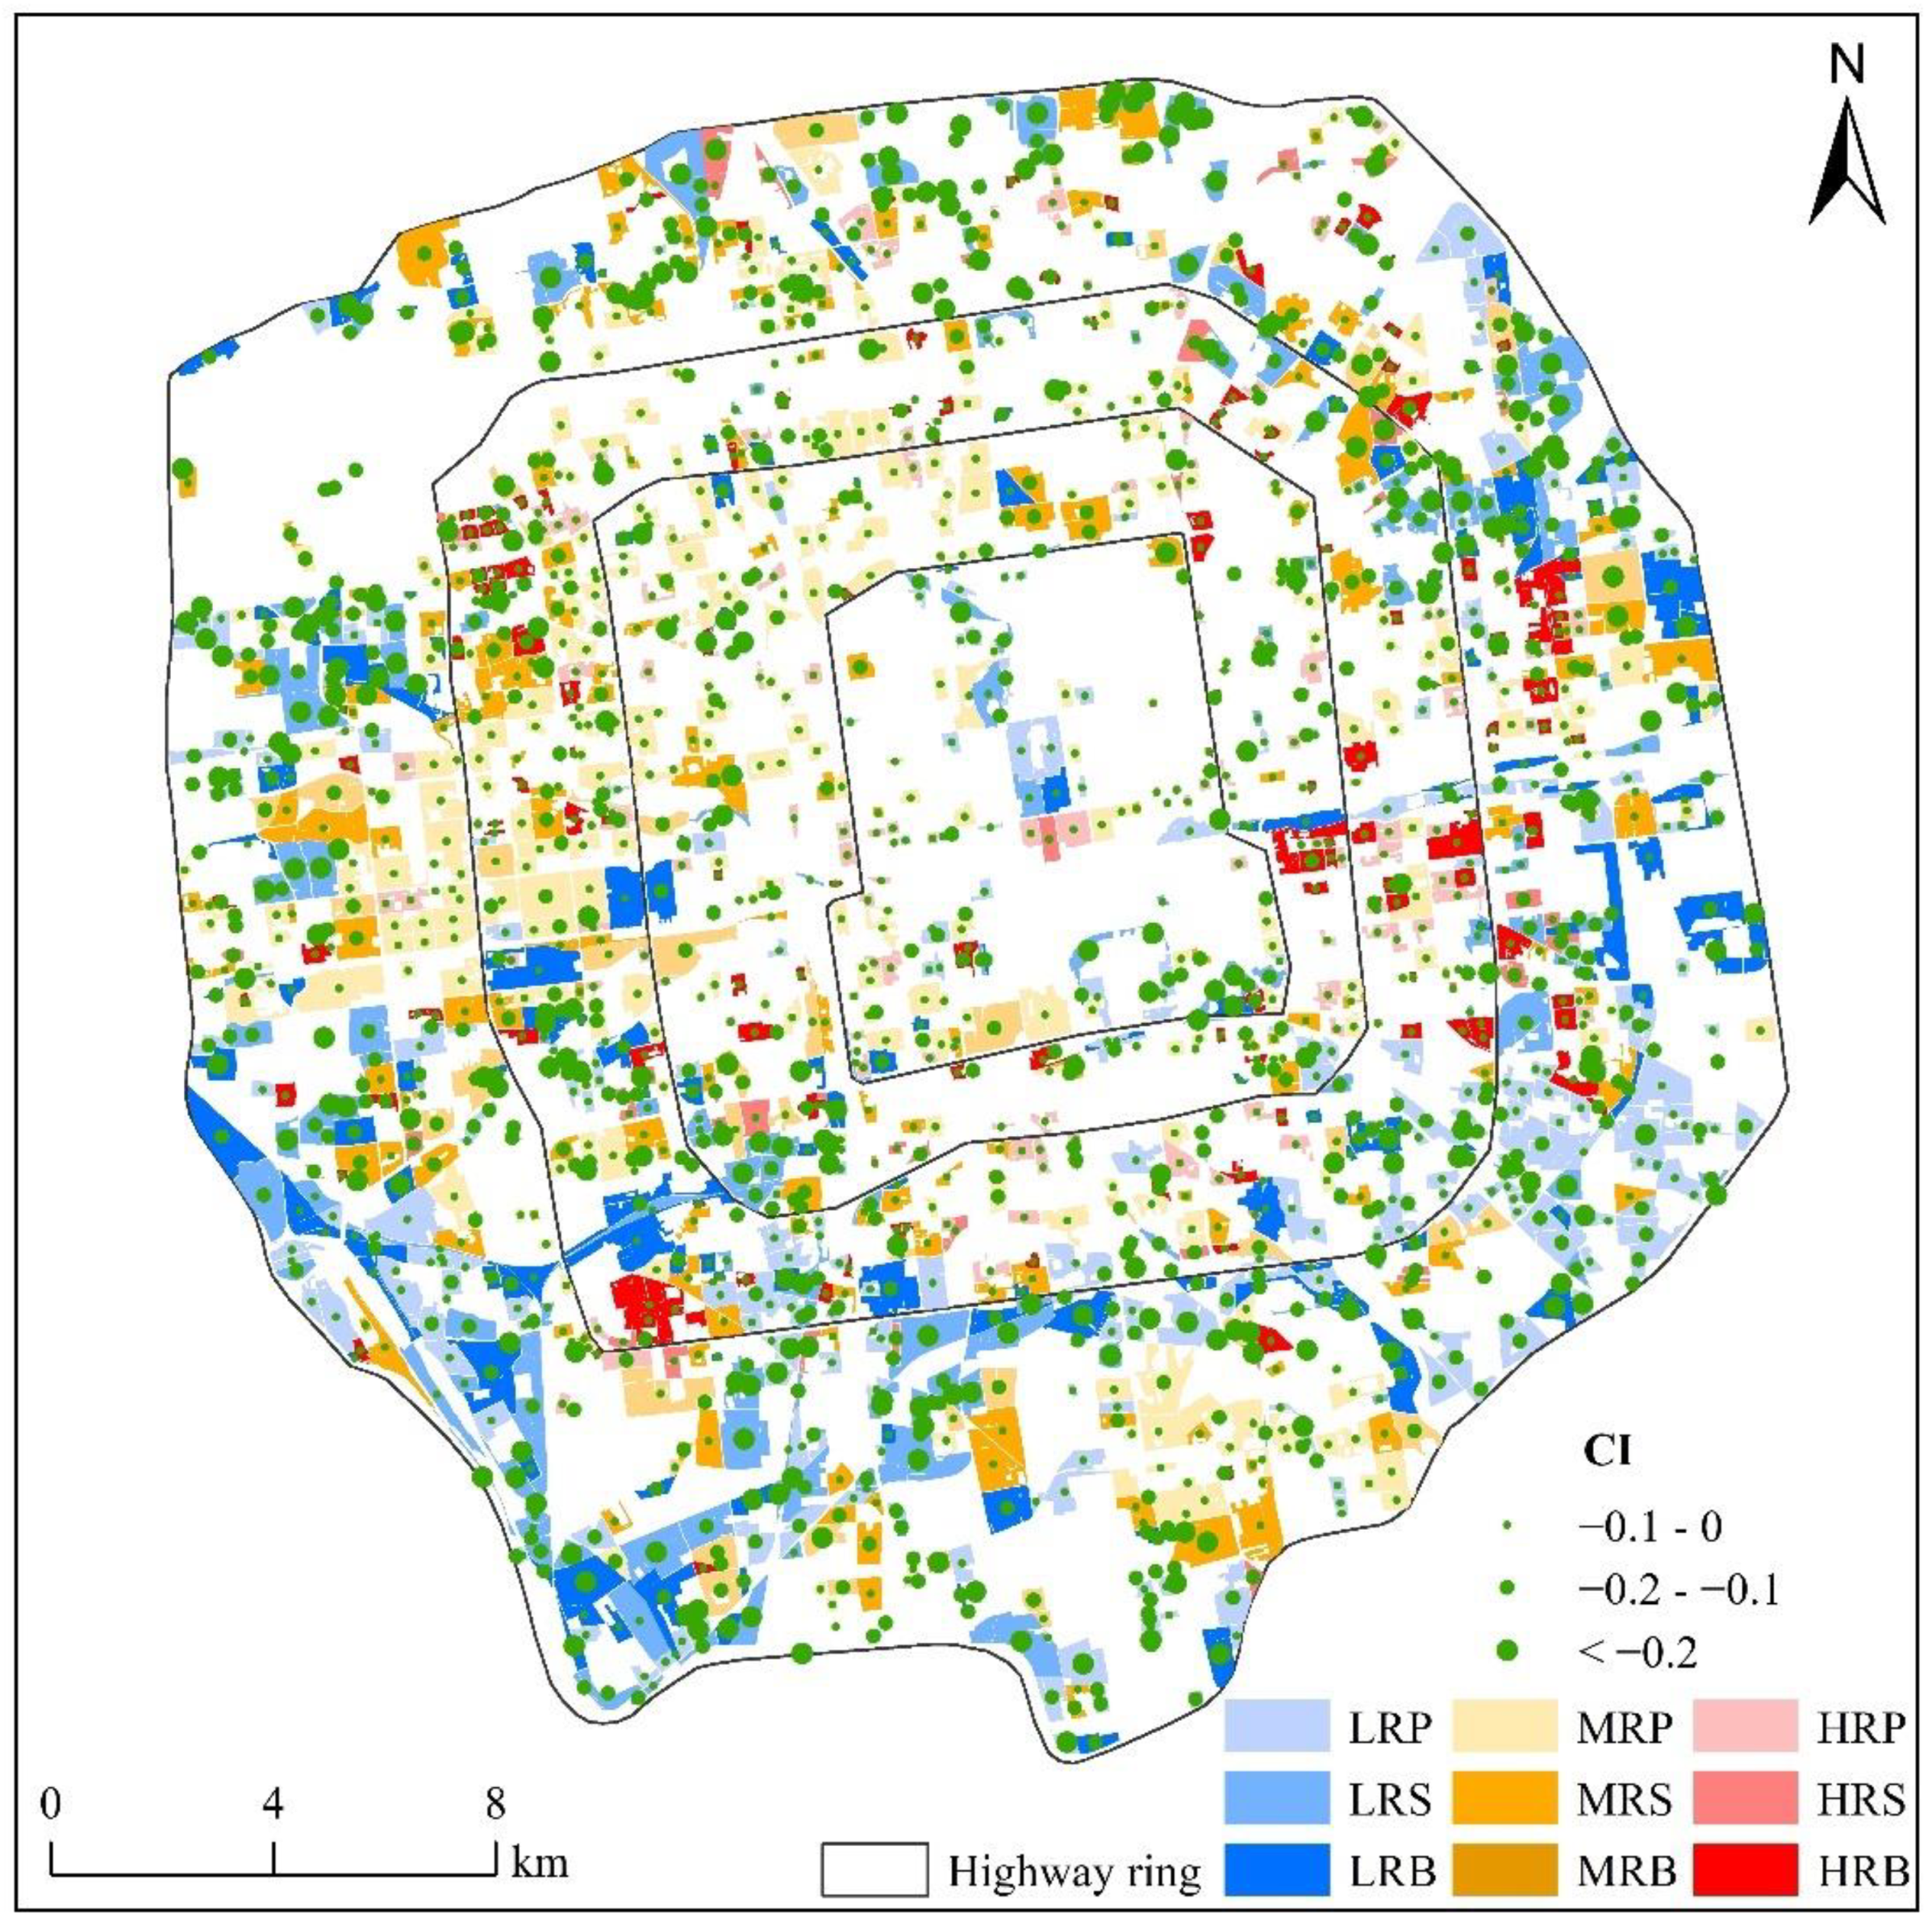
3.5. Impacts of UGS on LST among Different Urban Blocks
4. Discussion
4.1. Contribution of UGS to LST
4.2. Comparisons with Other Studies
4.3. Implications for UGS Planning and UHI Mitigation
4.4. Limitations
5. Conclusions
Author Contributions
Funding
Data Availability Statement
Acknowledgments
Conflicts of Interest
References
- Oke, T.R. The energetic basis of the urban heat island. Q. J. R. Meteorol. Soc. 1982, 108, 1–24. [Google Scholar] [CrossRef]
- Yao, R.; Wang, L.; Huang, X.; Niu, Z.; Liu, F.; Wang, Q. Temporal trends of surface urban heat islands and associated determinants in major Chinese cities. Sci. Total Environ. 2017, 609, 742–754. [Google Scholar] [CrossRef] [PubMed]
- Dai, Z.X.; Guldmann, J.M.; Hu, Y.F. Spatial regression models of park and land-use impacts on the urban heat island in central Beijing. Sci. Total Environ. 2018, 626, 1136–1147. [Google Scholar] [CrossRef]
- Yang, J.; Sun, J.; Ge, Q.; Li, X. Assessing the impacts of urbanization-associated green space on urban land surface temperature: A case study of Dalian, China. Urban For. Urban Green. 2017, 22, 1–10. [Google Scholar] [CrossRef]
- Qiao, Z.; Xu, X.; Luo, W.; Wang, F.; Luo, L.; Sun, Z. Urban ventilation network model: A case study of the core zone of capital function in Beijing metropolitan area. J. Clean. Prod. 2017, 168, 526–535. [Google Scholar] [CrossRef]
- Ma, Q.; Wu, J.; He, C. A hierarchical analysis of the relationship between urban impervious surfaces and land surface temperatures: Spatial scale dependence, temporal variations, and bioclimatic modulation. Landsc. Ecol. 2016, 31, 1139–1153. [Google Scholar] [CrossRef]
- Yang, J.; Wang, Y.; Xue, B.; Li, Y.; Xiao, X.; Xia, J.; He, B. Contribution of urban ventilation to the thermal environment and urban energy demand: Different climate background perspectives. Sci. Total Environ. 2021, 795, 148791. [Google Scholar] [CrossRef]
- Veena, K.; Parammasivam, K.M.; Venkatesh, T.N. Urban Heat Island studies: Current status in India and a comparison with the International studies. J. Earth Syst. Sci. 2020, 129, 85. [Google Scholar] [CrossRef]
- Rizwan, A.M.; Dennis, L.Y.C.; Liu, C. A review on the generation, determination and mitigation of Urban Heat Island. J. Environ. Sci. 2008, 20, 120–128. [Google Scholar] [CrossRef]
- Kuang, W.; Yang, T.; Liu, A.; Zhang, C.; Lu, D.; Chi, W. An EcoCity model for regulating urban land cover structure and thermal environment: Taking Beijing as an example. Sci. China Earth Sci. 2017, 60, 1098–1109. [Google Scholar] [CrossRef]
- Wang, Y.; Akbari, H. Analysis of urban heat island phenomenon and mitigation solutions evaluation for Montreal. Sustain. Cities Soc. 2016, 26, 438–446. [Google Scholar] [CrossRef]
- Chakraborty, T.; Hsu, A.; Manya, D.; Sheriff, G. A spatially explicit surface urban heat island database for the United States: Characterization, uncertainties, and possible applications. ISPRS J. Photogramm. Remote Sens. 2020, 168, 74–88. [Google Scholar] [CrossRef]
- Botje, D.; Dewan, A.; Chakraborty, T.C. Comparing Coarse-Resolution Land Surface Temperature Products over Western Australia. Remote Sens. 2022, 14, 2296. [Google Scholar] [CrossRef]
- Sobrino, J.A.; Jiménez-Muñoz, J.C.; Paolini, L. Land surface temperature retrieval from LANDSAT TM 5. Remote Sens. Environ. 2004, 90, 434–440. [Google Scholar] [CrossRef]
- Chang, Y.; Xiao, J.; Li, X.; Middel, A.; Zhang, Y.; Gu, Z.; Wu, Y.; He, S. Exploring diurnal thermal variations in urban local climate zones with ECOSTRESS land surface temperature data. Remote Sens. Environ. 2021, 263, 112544. [Google Scholar] [CrossRef]
- Yao, L.; Xu, Y.; Zhang, B. Effect of urban function and landscape structure on the urban heat island phenomenon in Beijing, China. Landsc. Ecol. Eng. 2019, 15, 379–390. [Google Scholar] [CrossRef]
- Meng, Q.; Zhang, L.; Sun, Z.; Meng, F.; Wang, L.; Sun, Y. Characterizing spatial and temporal trends of surface urban heat island effect in an urban main built-up area: A 12-year case study in Beijing, China. Remote Sens. Environ. 2018, 204, 826–837. [Google Scholar] [CrossRef]
- Zhao, L.; Lee, X.; Smith, R.B.; Oleson, K. Strong contributions of local background climate to urban heat islands. Nature 2014, 511, 216–219. [Google Scholar] [CrossRef]
- Chakraborty, T.C.; Lee, X.; Ermida, S.; Zhan, W. On the land emissivity assumption and Landsat-derived surface urban heat islands: A global analysis. Remote Sens. Environ. 2021, 265, 112682. [Google Scholar] [CrossRef]
- Guo, L.; Liu, R.; Men, C.; Wang, Q.; Miao, Y.; Zhang, Y. Quantifying and simulating landscape composition and pattern impacts on land surface temperature: A decadal study of the rapidly urbanizing city of Beijing, China. Sci. Total Environ. 2019, 654, 430–440. [Google Scholar] [CrossRef]
- Zhou, X.; Chen, H. Impact of urbanization-related land use land cover changes and urban morphology changes on the urban heat island phenomenon. Sci. Total Environ. 2018, 635, 1467–1476. [Google Scholar] [CrossRef] [PubMed]
- Qiao, Z.; Tian, G.; Xiao, L. Diurnal and seasonal impacts of urbanization on the urban thermal environment: A case study of Beijing using MODIS data. ISPRS J. Photogramm. Remote Sens. 2013, 85, 93–101. [Google Scholar] [CrossRef]
- Estoque, R.C.; Murayama, Y.; Myint, S.W. Effects of landscape composition and pattern on land surface temperature: An urban heat island study in the megacities of Southeast Asia. Sci. Total Environ. 2017, 577, 349–359. [Google Scholar] [CrossRef] [PubMed]
- Yao, N.; Huang, C.; Yang, J.; Konijnendijk van den Bosch, C.C.; Ma, L.; Jia, Z. Combined Effects of Impervious Surface Change and Large-Scale Afforestation on the Surface Urban Heat Island Intensity of Beijing, China Based on Remote Sensing Analysis. Remote Sens. 2020, 12, 3906. [Google Scholar] [CrossRef]
- Dai, Z.; Guldmann, J.-M.; Hu, Y. Thermal impacts of greenery, water, and impervious structures in Beijing’s Olympic area: A spatial regression approach. Ecol. Indic. 2019, 97, 77–88. [Google Scholar] [CrossRef]
- Yang, J.; Zhan, Y.; Xiao, X.; Xia, J.C.; Sun, W.; Li, X. Investigating the diversity of land surface temperature characteristics in different scale cities based on local climate zones. Urban Clim. 2020, 34, 100700. [Google Scholar] [CrossRef]
- Hu, Y.; Dai, Z.; Guldmann, J.-M. Greenspace configuration impact on the urban heat island in the Olympic Area of Beijing. Environ. Sci. Pollut. Res. 2021, 28, 33096–33107. [Google Scholar] [CrossRef]
- Norton, B.A.; Coutts, A.M.; Livesley, S.J.; Harris, R.J.; Hunter, A.M.; Williams, N.S.G. Planning for cooler cities: A framework to prioritise green infrastructure to mitigate high temperatures in urban landscapes. Landsc. Urban Plan. 2015, 134, 127–138. [Google Scholar] [CrossRef]
- Kowe, P.; Mutanga, O.; Odindi, J. Effect of landscape pattern and spatial configuration of vegetation patches on urban warming and cooling in Harare metropolitan city, Zimbabwe. GIScience Remote Sens. 2021, 58, 261–280. [Google Scholar] [CrossRef]
- Qian, Y.; Zhou, W.; Hu, X.; Fu, F. The Heterogeneity of Air Temperature in Urban Residential Neighborhoods and Its Relationship with the Surrounding Greenspace. Remote Sens. 2018, 10, 965. [Google Scholar] [CrossRef] [Green Version]
- O’Malley, C.; Piroozfar, P.; Farr, E.R.P.; Pomponi, F. Urban Heat Island (UHI) mitigating strategies: A case-based comparative analysis. Sustain. Cities Soc. 2015, 19, 222–235. [Google Scholar] [CrossRef]
- Masoudi, M.; Tan, P.Y. Multi-year comparison of the effects of spatial pattern of urban green spaces on urban land surface temperature. Landsc. Urban Plan. 2019, 184, 44–58. [Google Scholar] [CrossRef]
- Peng, J.; Dan, Y.; Qiao, R.; Liu, Y.; Dong, J.; Wu, J. How to quantify the cooling effect of urban parks? Linking maximum and accumulation perspectives. Remote Sens. Environ. 2021, 252, 112135. [Google Scholar] [CrossRef]
- Wu, S.; Yang, H.; Luo, P.; Chuan, L.; Li, H.; Liu, M.; Ruan, Y.; Zhang, S.; Xiang, P.; Jia, H.; et al. The effects of the cooling efficiency of urban wetlands in an inland megacity: A case study of Chengdu, Southwest China. Build. Environ. 2021, 204, 108128. [Google Scholar] [CrossRef]
- Xu, X.L.; Cai, H.Y.; Qiao, Z.; Wang, L.; Jin, C.; Ge, Y.N.; Wang, L.Y.; Xu, F.J. Impacts of park landscape structure on thermal environment using QuickBird and Landsat images. Chin. Geogr. Sci. 2017, 27, 818–826. [Google Scholar] [CrossRef]
- Feng, X.; Myint, S.W. Exploring the effect of neighboring land cover pattern on land surface temperature of central building objects. Build. Environ. 2016, 95, 346–354. [Google Scholar] [CrossRef]
- Xiao, X.D.; Dong, L.; Yan, H.N.; Yang, N.; Xiong, Y.M. The influence of the spatial characteristics of urban green space on the urban heat island effect in Suzhou Industrial Park. Sustain. Cities Soc. 2018, 40, 428–439. [Google Scholar] [CrossRef]
- Boussetta, S.; Balsamo, G.; Dutra, E.; Beljaars, A.; Albergel, C. Assimilation of surface albedo and vegetation states from satellite observations and their impact on numerical weather prediction. Remote Sens. Environ. 2015, 163, 111–126. [Google Scholar] [CrossRef]
- Weng, Q.; Lu, D.; Schubring, J. Estimation of land surface temperature–vegetation abundance relationship for urban heat island studies. Remote Sens. Environ. 2004, 89, 467–483. [Google Scholar] [CrossRef]
- Cai, Y.; Chen, Y.; Tong, C. Spatiotemporal evolution of urban green space and its impact on the urban thermal environment based on remote sensing data: A case study of Fuzhou City, China. Urban For. Urban Green. 2019, 41, 333–343. [Google Scholar] [CrossRef]
- Ke, X.; Men, H.; Zhou, T.; Li, Z.; Zhu, F. Variance of the impact of urban green space on the urban heat island effect among different urban functional zones: A case study in Wuhan. Urban For. Urban Green. 2021, 62, 127159. [Google Scholar] [CrossRef]
- Zhou, W.; Cao, F. Effects of changing spatial extent on the relationship between urban forest patterns and land surface temperature. Ecol. Indic. 2020, 109, 105778. [Google Scholar] [CrossRef]
- Li, X.; Zhou, W.; Ouyang, Z. Relationship between land surface temperature and spatial pattern of greenspace: What are the effects of spatial resolution? Landsc. Urban Plan. 2013, 114, 1–8. [Google Scholar] [CrossRef]
- Zhang, X.; Zhong, T.; Feng, X.; Wang, K.E. Estimation of the relationship between vegetation patches and urban land surface temperature with remote sensing. Int. J. Remote Sens. 2009, 30, 2105–2118. [Google Scholar] [CrossRef]
- Kong, F.; Yin, H.; James, P.; Hutyra, L.R.; He, H.S. Effects of spatial pattern of greenspace on urban cooling in a large metropolitan area of eastern China. Landsc. Urban Plan. 2014, 128, 35–47. [Google Scholar] [CrossRef]
- Asgarian, A.; Amiri, B.J.; Sakieh, Y. Assessing the effect of green cover spatial patterns on urban land surface temperature using landscape metrics approach. Urban Ecosyst. 2015, 18, 209–222. [Google Scholar] [CrossRef]
- Chen, A.; Yao, L.; Sun, R.; Chen, L. How many metrics are required to identify the effects of the landscape pattern on land surface temperature? Ecol. Indic. 2014, 45, 424–433. [Google Scholar] [CrossRef]
- Zhou, W.; Huang, G.; Cadenasso, M.L. Does spatial configuration matter? Understanding the effects of land cover pattern on land surface temperature in urban landscapes. Landsc. Urban Plan. 2011, 102, 54–63. [Google Scholar] [CrossRef]
- Xu, C.; Chen, G.D.; Huang, Q.Y.; Su, M.R.; Rong, Q.Q.; Yue, W.C.; Haase, D. Can improving the spatial equity of urban green space mitigate the effect of urban heat islands? An empirical study. Sci. Total Environ. 2022, 841, 156687. [Google Scholar] [CrossRef]
- Rahaman, Z.A.; Kafy, A.A.; Saha, M.; Rahim, A.A.; Almulhim, A.I.; Rahaman, S.N.; Fattah, M.A.; Rahman, M.T.; Kalaivani, S.; Faisal, A.-A.; et al. Assessing the impacts of vegetation cover loss on surface temperature, urban heat island and carbon emission in Penang city, Malaysia. Build. Environ. 2022, 222, 109335. [Google Scholar] [CrossRef]
- Yao, L.; Li, T.; Xu, M.; Xu, Y. How the landscape features of urban green space impact seasonal land surface temperatures at a city-block-scale: An urban heat island study in Beijing, China. Urban For. Urban Green. 2020, 52, 126704. [Google Scholar] [CrossRef]
- Maimaitiyiming, M.; Ghulam, A.; Tiyip, T.; Pla, F.; Latorre-Carmona, P.; Halik, Ü.; Sawut, M.; Caetano, M. Effects of green space spatial pattern on land surface temperature: Implications for sustainable urban planning and climate change adaptation. ISPRS J. Photogramm. Remote Sens. 2014, 89, 59–66. [Google Scholar] [CrossRef]
- Han, D.; Yang, X.; Cai, H.; Xu, X. Impacts of Neighboring Buildings on the Cold Island Effect of Central Parks: A Case Study of Beijing, China. Sustainability 2020, 12, 9499. [Google Scholar]
- Yang, J.; Wang, Y.; Xiao, X.; Jin, C.; Xia, J.; Li, X. Spatial differentiation of urban wind and thermal environment in different grid sizes. Urban Clim. 2019, 28, 100458. [Google Scholar] [CrossRef]
- Yang, J.; Yang, Y.; Sun, D.; Jin, C.; Xiao, X. Influence of urban morphological characteristics on thermal environment. Sustain. Cities Soc. 2021, 72, 103045. [Google Scholar] [CrossRef]
- Qiao, Z.; Wu, C.; Zhao, D.; Xu, X.; Yang, J.; Feng, L.; Sun, Z.; Liu, L. Determining the Boundary and Probability of Surface Urban Heat Island Footprint Based on a Logistic Model. Remote Sens. 2019, 11, 1368. [Google Scholar] [CrossRef]
- Di, S.; Li, Z.L.; Tang, R.; Pan, X.; Liu, H.; Niu, Y. Urban green space classification and water consumption analysis with remote-sensing technology: A case study in Beijing, China. Int. J. Remote Sens. 2019, 40, 1909–1929. [Google Scholar] [CrossRef]
- Hirata, Y.; Takahashi, T. Image segmentation and classification of Landsat Thematic Mapper data using a sampling approach for forest cover assessment. Can. J. For. Res. 2011, 41, 35–43. [Google Scholar] [CrossRef]
- Qin, Z.; Li, W.; Xu, B.; Chen, Z.; Liu, J. The Estimation of Land Surface Emissivity for Landsat TM6. Remote Sens. Land Resour. 2004, 16, 28–32. [Google Scholar] [CrossRef]
- Park, C.Y.; Park, Y.; Kim, H.; Yun, S.; Kim, C.-K. Quantifying and Mapping Cooling Services of Multiple Ecosystems. Sustain. Cities Soc. 2021, 73, 103123. [Google Scholar] [CrossRef]
- Park, J.; Kim, J.-H.; Lee, D.K.; Park, C.Y.; Jeong, S. The influence of small green space type and structure at the street level on urban heat island mitigation. Urban For. Urban Green. 2017, 21, 203–212. [Google Scholar] [CrossRef]
- Chen, X.-L.; Zhao, H.-M.; Li, P.-X.; Yin, Z.-Y. Remote sensing image-based analysis of the relationship between urban heat island and land use/cover changes. Remote Sens. Environ. 2006, 104, 133–146. [Google Scholar] [CrossRef]
- Zhao, M.Y.; Cai, H.Y.; Qiao, Z.; Xu, X.L. Influence of urban expansion on the urban heat island effect in Shanghai. Int. J. Geogr. Inf. Sci. 2016, 30, 2421–2441. [Google Scholar] [CrossRef]
- Jamei, Y.; Rajagopalan, P.; Sun, Q. Spatial structure of surface urban heat island and its relationship with vegetation and built-up areas in Melbourne, Australia. Sci. Total Environ. 2019, 659, 1335–1351. [Google Scholar] [CrossRef] [PubMed]
- Chapman, S.; Thatcher, M.; Salazar, A.; Watson, J.E.M.; McAlpine, C.A. The Effect of Urban Density and Vegetation Cover on the Heat Island of a Subtropical City. J. Appl. Meteorol. Climatol. 2018, 57, 2531–2550. [Google Scholar] [CrossRef]
- Li, X.; Zhou, W. Optimizing urban greenspace spatial pattern to mitigate urban heat island effects: Extending understanding from local to the city scale. Urban For. Urban Green. 2019, 41, 255–263. [Google Scholar] [CrossRef]
- Takayama, N.; Yamamoto, H.; Iwaya, K.; Fei, W.; Harada, Y.; Higashiyama, M.; Tsuchiya, Y.; Kaneishi, A.; Shirozu, T. Quantitative Evaluation of Urban Heat Island Mitigation Effect and Reduction Human Heat Stress by Large Greening of Roof. J. Agric. Meteorol. 2008, 64, 257–270. [Google Scholar] [CrossRef]
- Rupasinghe, H.T.; Halwatura, R.U. Benefits of implementing vertical greening in tropical climates. Urban For. Urban Green. 2020, 53, 126708. [Google Scholar] [CrossRef]
- Peng, L.; Jim, C. Green-Roof Effects on Neighborhood Microclimate and Human Thermal Sensation. Energies 2013, 6, 598–618. [Google Scholar]
- Maheng, D.; Ducton, I.; Lauwaet, D.; Zevenbergen, C.; Pathirana, A. The Sensitivity of Urban Heat Island to Urban Green Space—A Model-Based Study of City of Colombo, Sri Lanka. Atmosphere 2019, 10, 151. [Google Scholar] [CrossRef]
- Song, J.; Du, S.; Feng, X.; Guo, L. The relationships between landscape compositions and land surface temperature: Quantifying their resolution sensitivity with spatial regression models. Landsc. Urban Plan. 2014, 123, 145–157. [Google Scholar] [CrossRef]
- He, B.-J.; Ding, L.; Prasad, D. Wind-sensitive urban planning and design: Precinct ventilation performance and its potential for local warming mitigation in an open midrise gridiron precinct. J. Build. Eng. 2019, 29, 101145. [Google Scholar] [CrossRef]
- He, B.-J.; Ding, L.; Prasad, D. Enhancing urban ventilation performance through the development of precinct ventilation zones: A case study based on the Greater Sydney, Australia. Sustain. Cities Soc. 2019, 47, 101472. [Google Scholar] [CrossRef]
- Yang, J.; Wang, Y.; Xiu, C.; Xiao, X.; Xia, J.; Jin, C. Optimizing local climate zones to mitigate urban heat island effect in human settlements. J. Clean. Prod. 2020, 275, 123767. [Google Scholar] [CrossRef]
- Yang, P.; Ren, G.; Yan, P. Evidence for a Strong Association of Short-Duration Intense Rainfall with Urbanization in the Beijing Urban Area. J. Clim. 2017, 30, 5851–5870. [Google Scholar] [CrossRef]
- Kedia, S.; Bhakare, S.P.; Dwivedi, A.K.; Islam, S.; Kaginalkar, A. Estimates of change in surface meteorology and urban heat island over northwest India: Impact of urbanization. Urban Clim. 2021, 36, 100782. [Google Scholar] [CrossRef]


| Types | Building Floors | Building Density |
|---|---|---|
| LRP | 1–3 | 0–0.15 |
| LRS | 1–3 | 0.15–0.25 |
| LRB | 1–3 | >0.25 |
| MRP | 4–7 | 0–0.15 |
| MRS | 4–7 | 0.15–0.25 |
| MRB | 4–7 | >0.25 |
| HRP | ≥8 | 0–0.15 |
| HRS | ≥8 | 0.15–0.25 |
| HRB | ≥8 | >0.25 |
| Types | Number | Proportion |
|---|---|---|
| LRP | 289 | 15.75% |
| LRS | 193 | 10.52% |
| LRB | 339 | 18.47% |
| MRP | 84 | 4.58% |
| MRS | 226 | 12.32% |
| MRB | 333 | 18.15% |
| HRP | 62 | 3.38% |
| HRS | 161 | 8.77% |
| HRB | 148 | 8.07% |
| Landscape Metrics | Description |
|---|---|
| PLAND | The proportion of a landscape occupied by patches of a given type, a measure of dominance. |
| ED | The total edge length of a given patch type per unit area (hectare), a measure of overall shape complexity. |
| FRAC_AM | The patch fractal dimension weighted by relative patch area, a measure of shape complexity of individual patches. |
| IJI | A measure of the degree to which the corresponding patch type is equally adjacent to all other patch types. |
| AI | The number of joins divided by the maximum possible number of joins involving a given patch type, multiplied by 100, a measure of the level of lumpiness of patches in a landscape. |
| Types | Proportion of UGS | ||
|---|---|---|---|
| Minimum | Maximun | Average | |
| LRP | 3.41% | 99.97% | 48.98% |
| LRS | 1.00% | 79.40% | 39.36% |
| LRB | 0.66% | 73.59% | 26.85% |
| MRP | 5.40% | 96.87% | 42.07% |
| MRS | 1.56% | 80.42% | 27.21% |
| MRB | 1.41% | 72.77% | 14.43% |
| HRP | 1.55% | 81.26% | 36.26% |
| HRS | 1.91% | 81.94% | 22.47% |
| HRB | 1.41% | 96.87% | 14.79% |
| Types | Variables | Standardized Cofficient | R2 |
|---|---|---|---|
| LRP | PLAND | −0.55 ** | 0.22 |
| AI | 0.23 ** | ||
| LRS | PLAND | −0.43 ** | 0.18 |
| LRB | PLAND | −0.48 ** | 0.23 |
| MRP | PLAND | −0.46 ** | 0.20 |
| MRS | PLAND | −0.39 ** | 0.24 |
| ED | −0.20 ** | ||
| MRB | PLAND | −0.41 ** | 0.17 |
| HRP | PLAND | −0.46 ** | 0.20 |
| HRS | PLAND | −0.29 ** | 0.13 |
| FRAC_AM | −0.19 * | ||
| HRB | PLAND | −0.41 ** | 0.15 |
| FRAC_AM | −0.16 * |
Publisher’s Note: MDPI stays neutral with regard to jurisdictional claims in published maps and institutional affiliations. |
© 2022 by the authors. Licensee MDPI, Basel, Switzerland. This article is an open access article distributed under the terms and conditions of the Creative Commons Attribution (CC BY) license (https://creativecommons.org/licenses/by/4.0/).
Share and Cite
An, H.; Cai, H.; Xu, X.; Qiao, Z.; Han, D. Impacts of Urban Green Space on Land Surface Temperature from Urban Block Perspectives. Remote Sens. 2022, 14, 4580. https://doi.org/10.3390/rs14184580
An H, Cai H, Xu X, Qiao Z, Han D. Impacts of Urban Green Space on Land Surface Temperature from Urban Block Perspectives. Remote Sensing. 2022; 14(18):4580. https://doi.org/10.3390/rs14184580
Chicago/Turabian StyleAn, Hongmin, Hongyan Cai, Xinliang Xu, Zhi Qiao, and Dongrui Han. 2022. "Impacts of Urban Green Space on Land Surface Temperature from Urban Block Perspectives" Remote Sensing 14, no. 18: 4580. https://doi.org/10.3390/rs14184580