1. Introduction
Synthetic aperture radar (SAR) is an active imaging radar that has the advantages of all-weather operation and a robust anti-jamming ability. It can effectively identify camouflage and penetrate masking objects, and is an essential means of ground monitoring [
1]. Due to its imaging mechanism and characteristics, SAR has been widely used in marine monitoring, especially in detecting nearshore and ocean ships. SAR ship detection has high application value in both military and civil fields. For example, cruise counting and ocean rescue in the civil field [
2] and battlefield detective and intelligence acquisition in the military field are inseparable from this technology. The traditional SAR ship detection usually adopts the constant false alarm rate (CFAR) [
3] algorithm, which directly calculates the detection threshold adaptively according to the local clutter statistical characteristics, and judges whether it is a target according to the threshold. The advantage of the CFAR algorithm lies in its simple structure, a small amount of computation, and fast detection speed, but it is sensitive to the selection of clutter distribution. The breakthrough of deep learning makes convolutional neural network (CNN) shine in the field of computer vision. CNN has achieved outstanding results in the field of image classification. The object-detection algorithm based on deep learning usually takes a classification network as the backbone network to extract the features of the image and then sends it to the detection network for classification and regression after feature fusion. At present, they are often divided into two-stage networks represented by the RCNN series [
4] and one-stage networks represented by Yolo [
5], SSD [
6] and retinanet [
7]. The above RCNN series, Yolo, SSD and RetinaNet are anchor-based detectors. Since the emergence of CornerNet [
8] in 2018, a large number of detection algorithms without anchor design have emerged in the field of object detection, such as FASF [
9], CenterNet [
10], and FCOS [
11]. These algorithms further promote the transition from object detection to the end-to-end system.
At the same time, researchers in the field of SAR also try to migrate CNN in natural images to the field of SAR ship detection. However, due to the significant field differences between natural images and SAR images, the following characteristics deserve attention in algorithm design.
SAR image is a top view taken by airborne or space-borne satellites. The direction of objects is often arbitrary. Therefore, the rotation invariance of feature extraction should be considered when designing the network. In addition, the image used for SAR ship object detection is often a single-channel gray image preprocessed by geometric correction. In contrast, the natural image is often a three-channel color image. Limited by the demand of SAR long-range imaging, the object being detected occupies a small image area. It can be regarded as a small target with low resolution and insufficient detailed information.
As shown in
Table 1, small objects are generally defined as objects that are less than 32 × 32 pixels in area or less than 1% of the image size. However, the current object detection algorithms are not ideal for detecting small targets. On general visual data sets such as Ms coco [
12], the detection accuracy of small targets is about half that of large targets, while in SAR images with more small targets and sparse targets, the problem is more serious.
One of the problems of small ship detector is that small targets occupy fewer pixels and lack detailed information, resulting in insufficient available feature information. To extract the deep-seated features of the target, the object-detection algorithm based on deep learning often needs to improve the semantics through continuous convolution and downsampling. If only the last layer feature map of the backbone network is used for detection, for small targets with an area of fewer than 32 × 32 pixels, there may be less than 1 pixel mapped to the feature map. This will undoubtedly lead to a smaller problem of information.
Unlike the classification task, in the training process of the detection task, the predicted samples need to be allocated to the actual target by manually designing rules to divide the positive and negative samples. This division process is called sampling. The quality of the sampling strategy directly affects the effect of training. If the target cannot be effectively sampled in the training process, the learning of that category cannot be well, resulting in the difficulty of detection. Due to the sparsity of small ship targets in SAR images, the imbalance between positive and negative samples often occurs, resulting in poor training effects.
Therefore, aiming at the two difficulties of small-target detection in SAR image, this paper first proposes an adaptive feature encoding method, which can directly learn the spatial weighting coefficient of deep feature fusion as to filter the deep useless information and enhance the useful information. Secondly, a target existence measure gauss-ness based on Gaussian distribution modeling is proposed. The weighted sampling method based on gauss-ness is used to recalibrate the weights of positive samples at different locations in the boundary box.
1.1. Problem Description and Motivations
Although object detection has achieved good results on public data sets such as MS coco [
13] and pascal-VOC [
14], the detection accuracy of small targets is still very low.
One problem of small target detection is that the detailed information is not rich, and the available feature information is too little [
15]. Object-detection algorithms based on deep learning usually use a classification network as the backbone network for feature extraction. Compared with detection tasks, classification requires higher semantics. Therefore, in the classification network, multiple downsampling will be carried out in convolution to improve semantics, which is unfavorable for detecting small targets. Although introducing a feature pyramid network (FPN) greatly alleviates this problem, for small targets, although the receptive field of shallow features is small and the detailed features are retained, its semantic information representation ability is weak. For SAR images, this problem is more serious. For example, on public SAR datasets such as HRSID [
16] and SSDD [
17], the proportion of small targets exceeds 50%. In addition, due to the sparsity of targets in SAR image, the proportion of pixel area of small targets in SAR image is also smaller than that in the optical image. These problems have brought great challenges to detecting small targets in SAR images.
Another problem is that positive and negative samples are uneven in SAR ship detection, and the sampling quantity and quality of positive samples in a common sampling strategy are poor [
18]. For the anchor-based detection algorithm, the anchor is difficult to design, and the sampling strategy based on IOU matching is easy to lead the absence of positive samples, and some targets with small area are ignored. For the anchor-free design method, the division of positive and negative samples is based on whether the pixels are in the actual boundary box. There will be pixel confusion at the edge of the boundary box, resulting in the reduction of the quality of positive samples.
1.2. Contributions and Structure
This paper has carried out a series of research on the SAR ship’s small target problems. The main contents and innovations are as follows:
- (1)
Aiming at the problem of insufficient detail information and difficult feature extraction of small targets, an adaptive feature encoding method (AFE) is proposed. This method effectively integrates the deep high semantic features into the shallow layer to enhance the feature representation of small targets, so as to improve the detection performance of small targets. AFE first calculates the spatial weight of each deep feature map in the multi-scale feature pyramid by introducing a spatial attention mechanism, then weights the deep features in the way of pixel-by-pixel multiplication and fuses them into the shallow feature map. After normalization, the fused feature map with detailed information and high-level semantics is obtained. Experiments on HRSID and SSDD data sets show that the AFE method has a significant improvement in the problem of feature reuse conflict compared with other variants of FPN.
- (2)
Aiming at the sampling problem of small targets, this paper first determines the sampling method without anchor design and analyzes the quality problem of edge positive samples. Then a Gaussian-guided detection head (GDH) is introduced. It proposes a target existence measure Gauss-ness which is more suitable for SAR ships, and a Gauss-ness weighted sampling strategy. Experiments show that the sampling optimization method can achieve good improvement in small target detection.
- (3)
A detector suitable for small-target detection is constructed by combining the adaptive feature method and the sampling optimization method proposed above. The proposed AFE is embedded in the basic feature extraction module, while GDH plays a role in the object location. The effect of the detector has also been verified experimentally.
This article is organized as follows:
Section 3 briefly introduces some existing methods that have inspired our work. Next,
Section 3.2 describes the principle and significance of the two proposed modules. The description of datasets and experimental results are shown in
Section 4, and a final conclusion is stated in
Section 5.
3. Methods
3.1. Explanation of Center-Ness in FCOS
This section summarizes the centrality measurement based on the center priori in FCOS, analyzes its shortcomings in SAR ship object detection.
In the field of object detection, the boundary box is usually used to label the target, and the shape of most targets is often irregular, so there is a certain gap between the representation of the target and the true value. Especially in ship detection in SAR imaging, due to the multi-directionality of the ship target, the marked boundary box of target contains a large number of background pixels, and these background pixels will be indiscriminately marked as positive samples when sampling in anchor-free methods. These low-quality samples will affect the training optimization of the model.
Approaches such as FCOS, Noisy Anchor [
40] and Auto Assign [
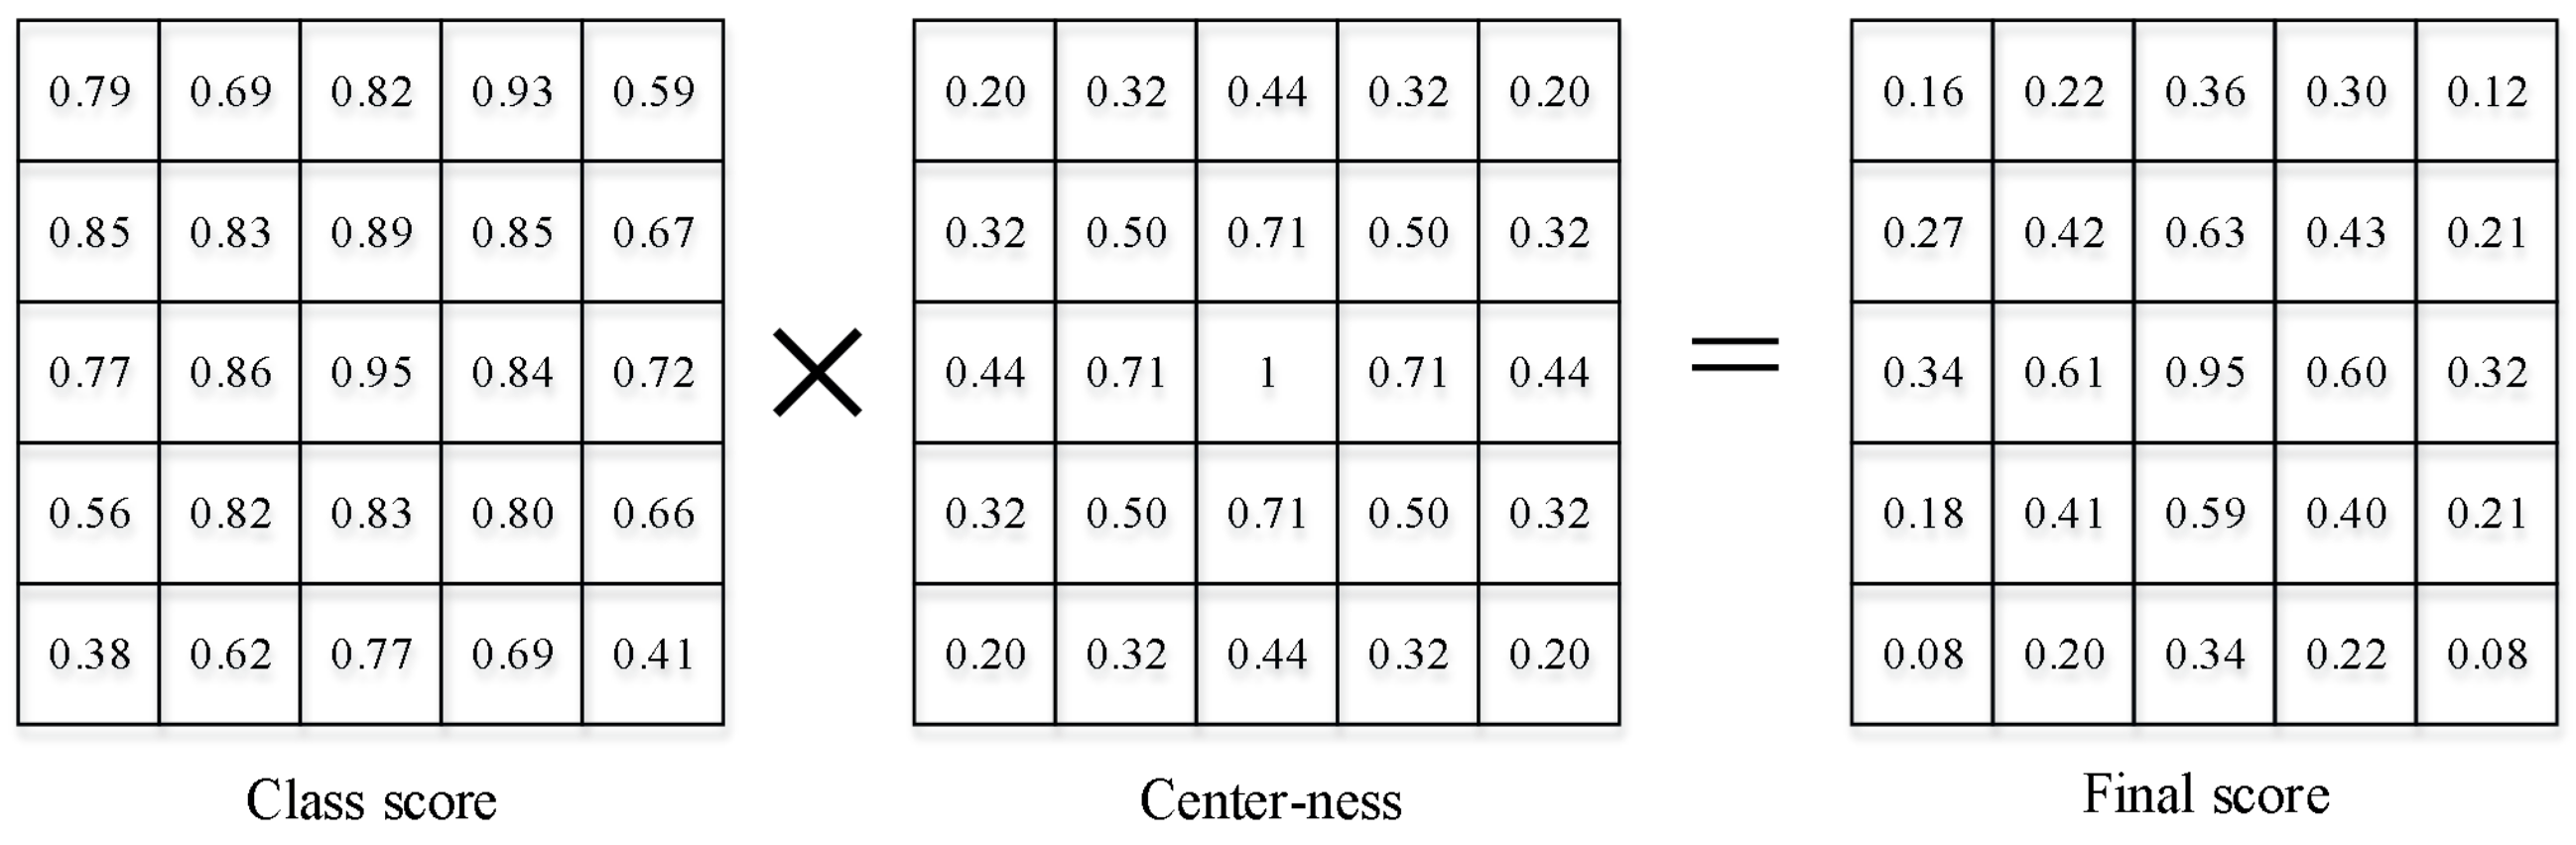
41] that attempt to solve this problem are all based on an assumption: the central prior, that is, the sampling point located near the center of the boundary box, is usually the most effective, and the validity of the sampling point gradually decreases from the center to the surrounding. In order to quantitatively analyze the effectiveness of different positions in the bounding box, FCOS uses the ratio between the sample position and the distance from the boundary as the centrality of the position and takes it as the measurement of the existence of the target, adds a center-ness branch in the detection head to learn the centrality of the target position, and multiplies the predicted centrality with the classification score when testing. Center-ness suppresses the low-quality samples at the edge of the bounding box, and the suppression process of Gauss-ness is described in
Figure 1.
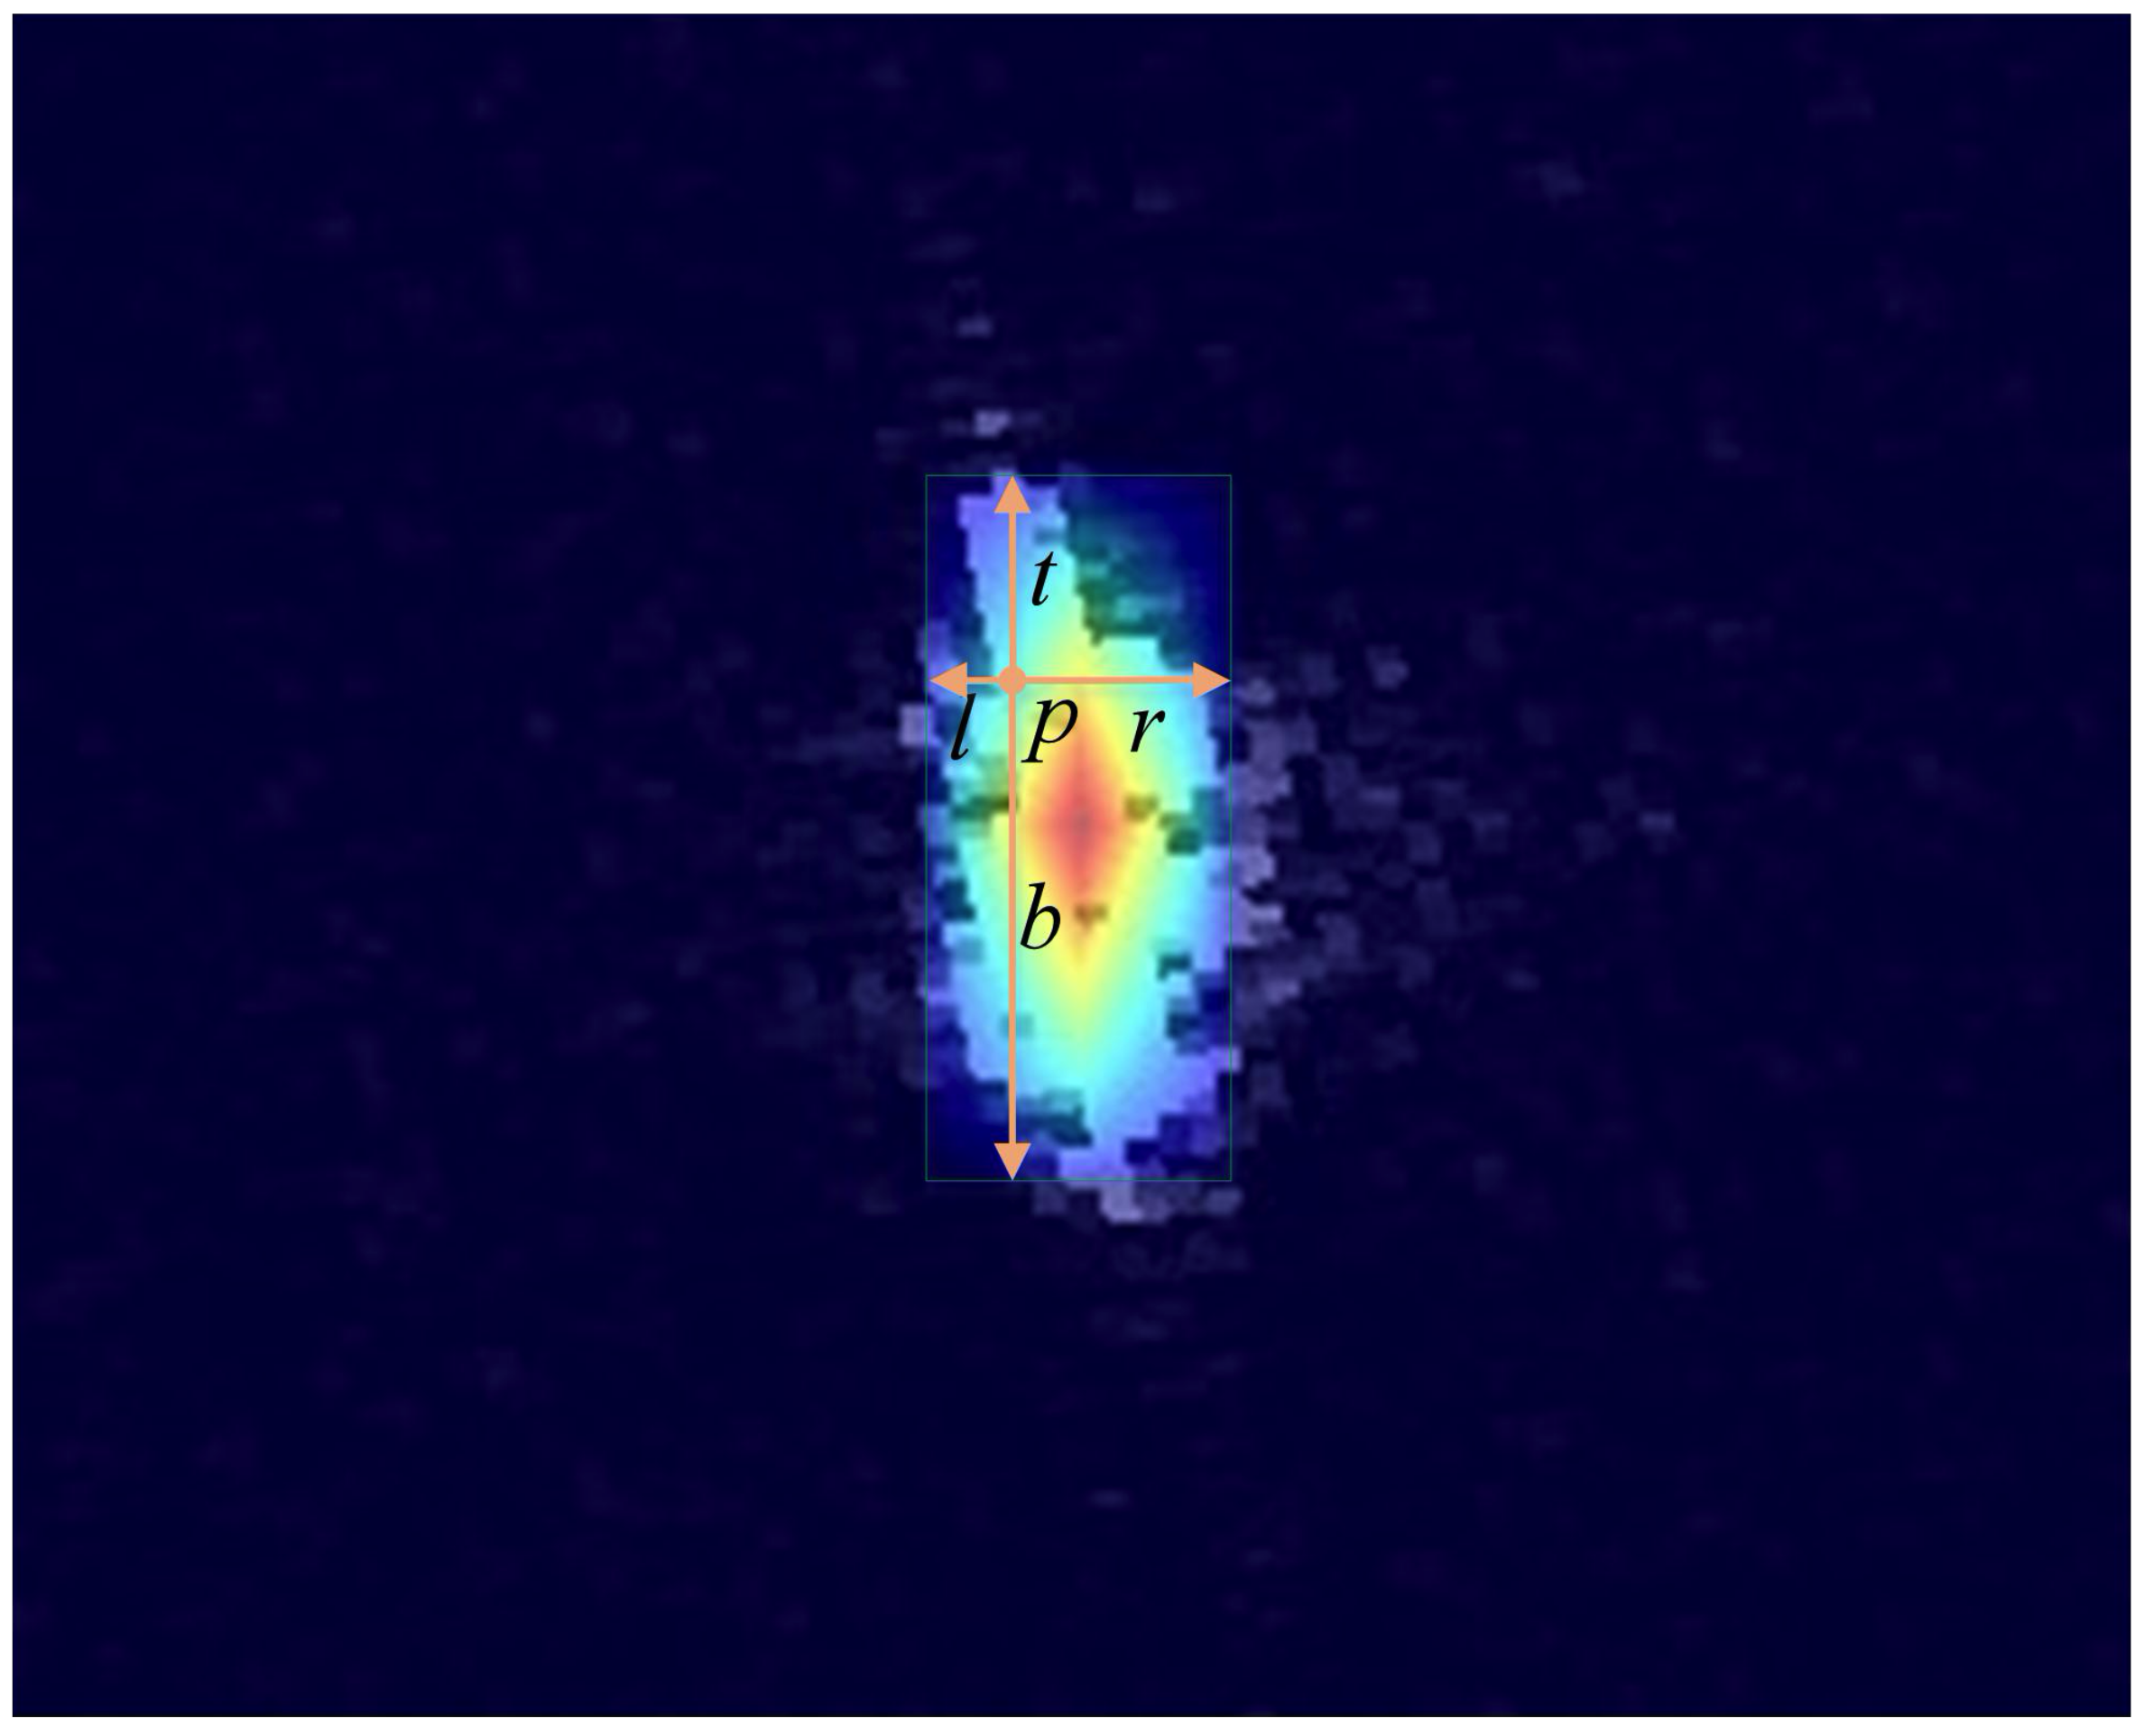
P refers to the position in the bounding box,
l,
r,
t and
b are the distance from
P to the left boundary, right boundary, upper boundary, and lower boundary. The centrality of
P in [
11] can be described by:
Figure 2 shows the distribution of centrality in the bounding box represented by Equation (
1). Red represents the area with centrality of 1, blue represents the area with centrality of 0, and other colors represent the change process of centrality from 1 to 0.
We show more center-ness visualization results in the following
Section 3.4.1. It is observed that although the centrality calculation method can meet the aforementioned central prior, it can not well fit the pixel distribution of ships due to the multi-directional problem of SAR ships.
3.2. The Overall Framework of the Proposed Method
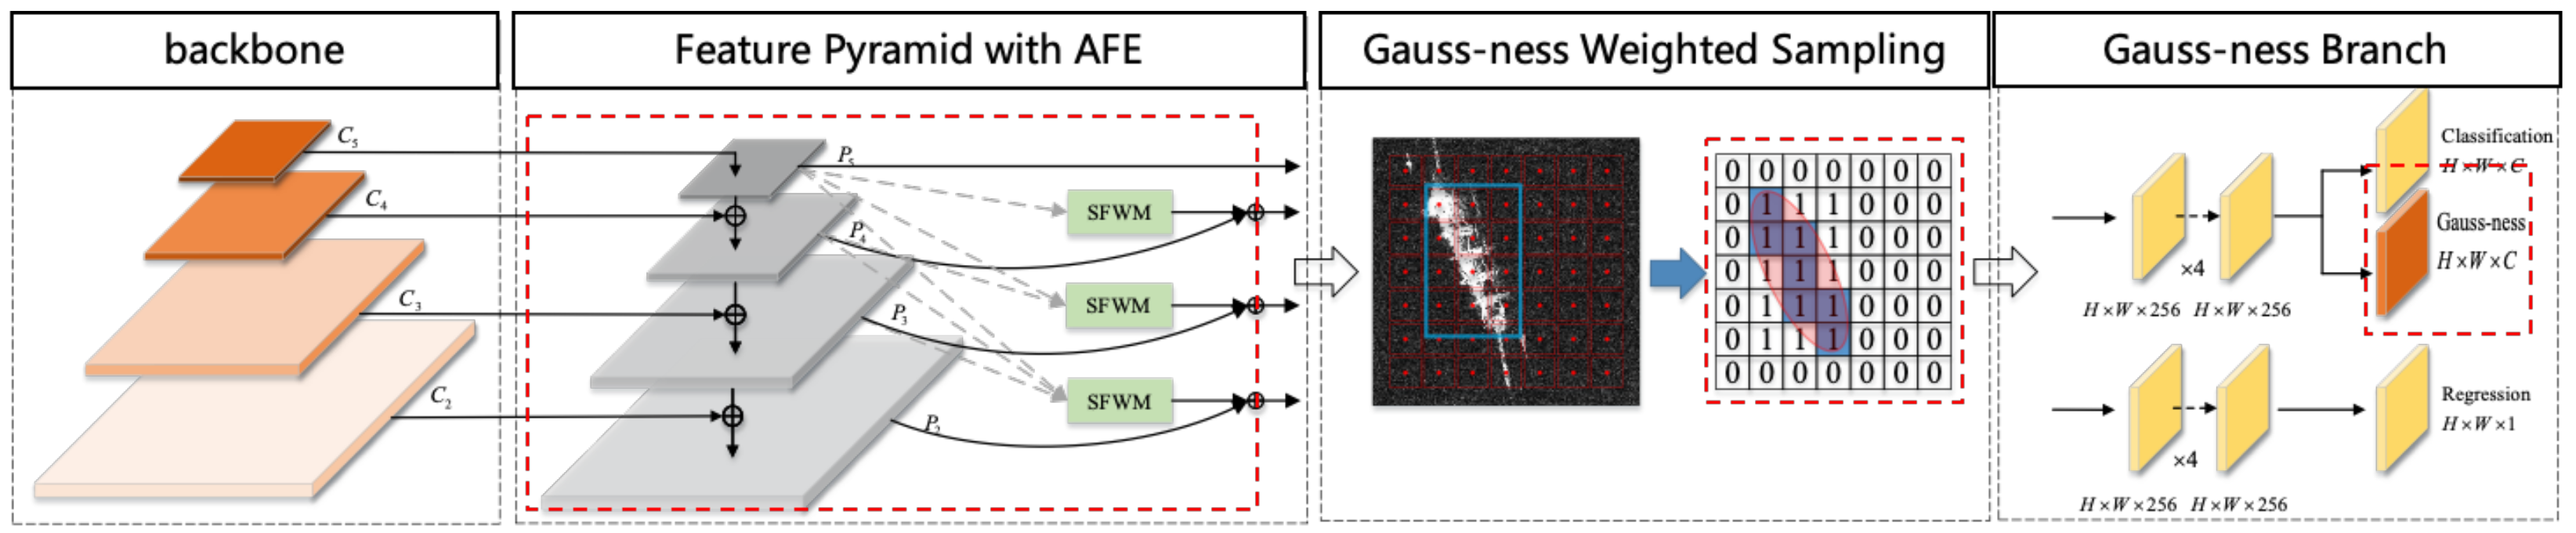
How to design more efficient networks has been a hot topic in the field of deep learning research. Our proposed ship object-detection method is considered from feature extraction and sampling scheme aspects, and then two modules are designed to be combined with the basic network to improve the overall performance of SAR image ship detection, and
Figure 3 is the overall process description of the proposed method.
First of all, our method eliminates the effect of anchors by adopting a general anchor-free strategy that directly learns the encoded bounding boxes. Multiple convolutional layers constitute a backbone to extract image basic features, and then the obtained features are fed into FPN to form multi-scale features. Subsequently, the AFE proposed in this paper adaptively fuses these features and obtains several new feature maps with refined detailed information and semantic information. When it comes to box prediction and positioning, Gauss-ness designed in GDH can be used to calculate the classification score of detected targets in the test process. Meanwhile, in the training process, loss function can be optimized by taking advantage of the characteristics that predicted bounding boxes at different locations have different Gauss-ness values.
Our method is an end-to-end convolutional neural network, which is the same as general detection networks, including a backbone for extracting features and a detection head for target localization. The proposed AFE and GDH have been improved in these two parts respectively.
3.3. Refined Feature Pyramid with Adaptive Feature Encoding
FPN is a mainstream solution to small target detection. Previously, SSDS detected targets on multiple scale feature maps. It is based on a rule: a deep feature map has a larger receptive field and stronger semantics that are suitable for large-target detection; while a shallow feature map has higher resolution and keeps enough detail, so it is suitable for small-target detection. Although SSD adopts a shallow feature map to improve the small-target detection ability to a certain extent, the method of directly extracting the lower layer of the backbone network as shallow feature map will lead to insufficient shallow semantic information. FPN combines a deep semantic feature map with a shallow feature map by top-down method, aiming to retain high-resolution detail/information while integrating deep semantic information. The appearance of FPN greatly improves the detection effect of small targets, but it still has some problems. FPN uses heuristic feature selection, which associates objects at different scales to feature maps at different levels through hand-designed scale partitioning strategies. After the target is assigned to a certain level of the feature map, the corresponding areas of the other levels of the feature map are treated as background and suppressed. When the network trains targets of different scales, the direct fusion of FPN will cause feature reuse conflicts among different levels and reduce the effectiveness of feature pyramid. In order to solve this problem, the Guided Anchoring technique [
42] attempted to adopt predicted anchor-guided features, but only a single deformable convolution could not solve the problem perfectly. TridentNet [
43] builds multiple specific scale branches with different receptors to avoid conflicts among feature pyramids. However, it does not make good use of shallow feature maps with high-resolution, so its detection of small targets is limited. Therefore, this paper proposes an adaptive feature coding method to further solve this problem.
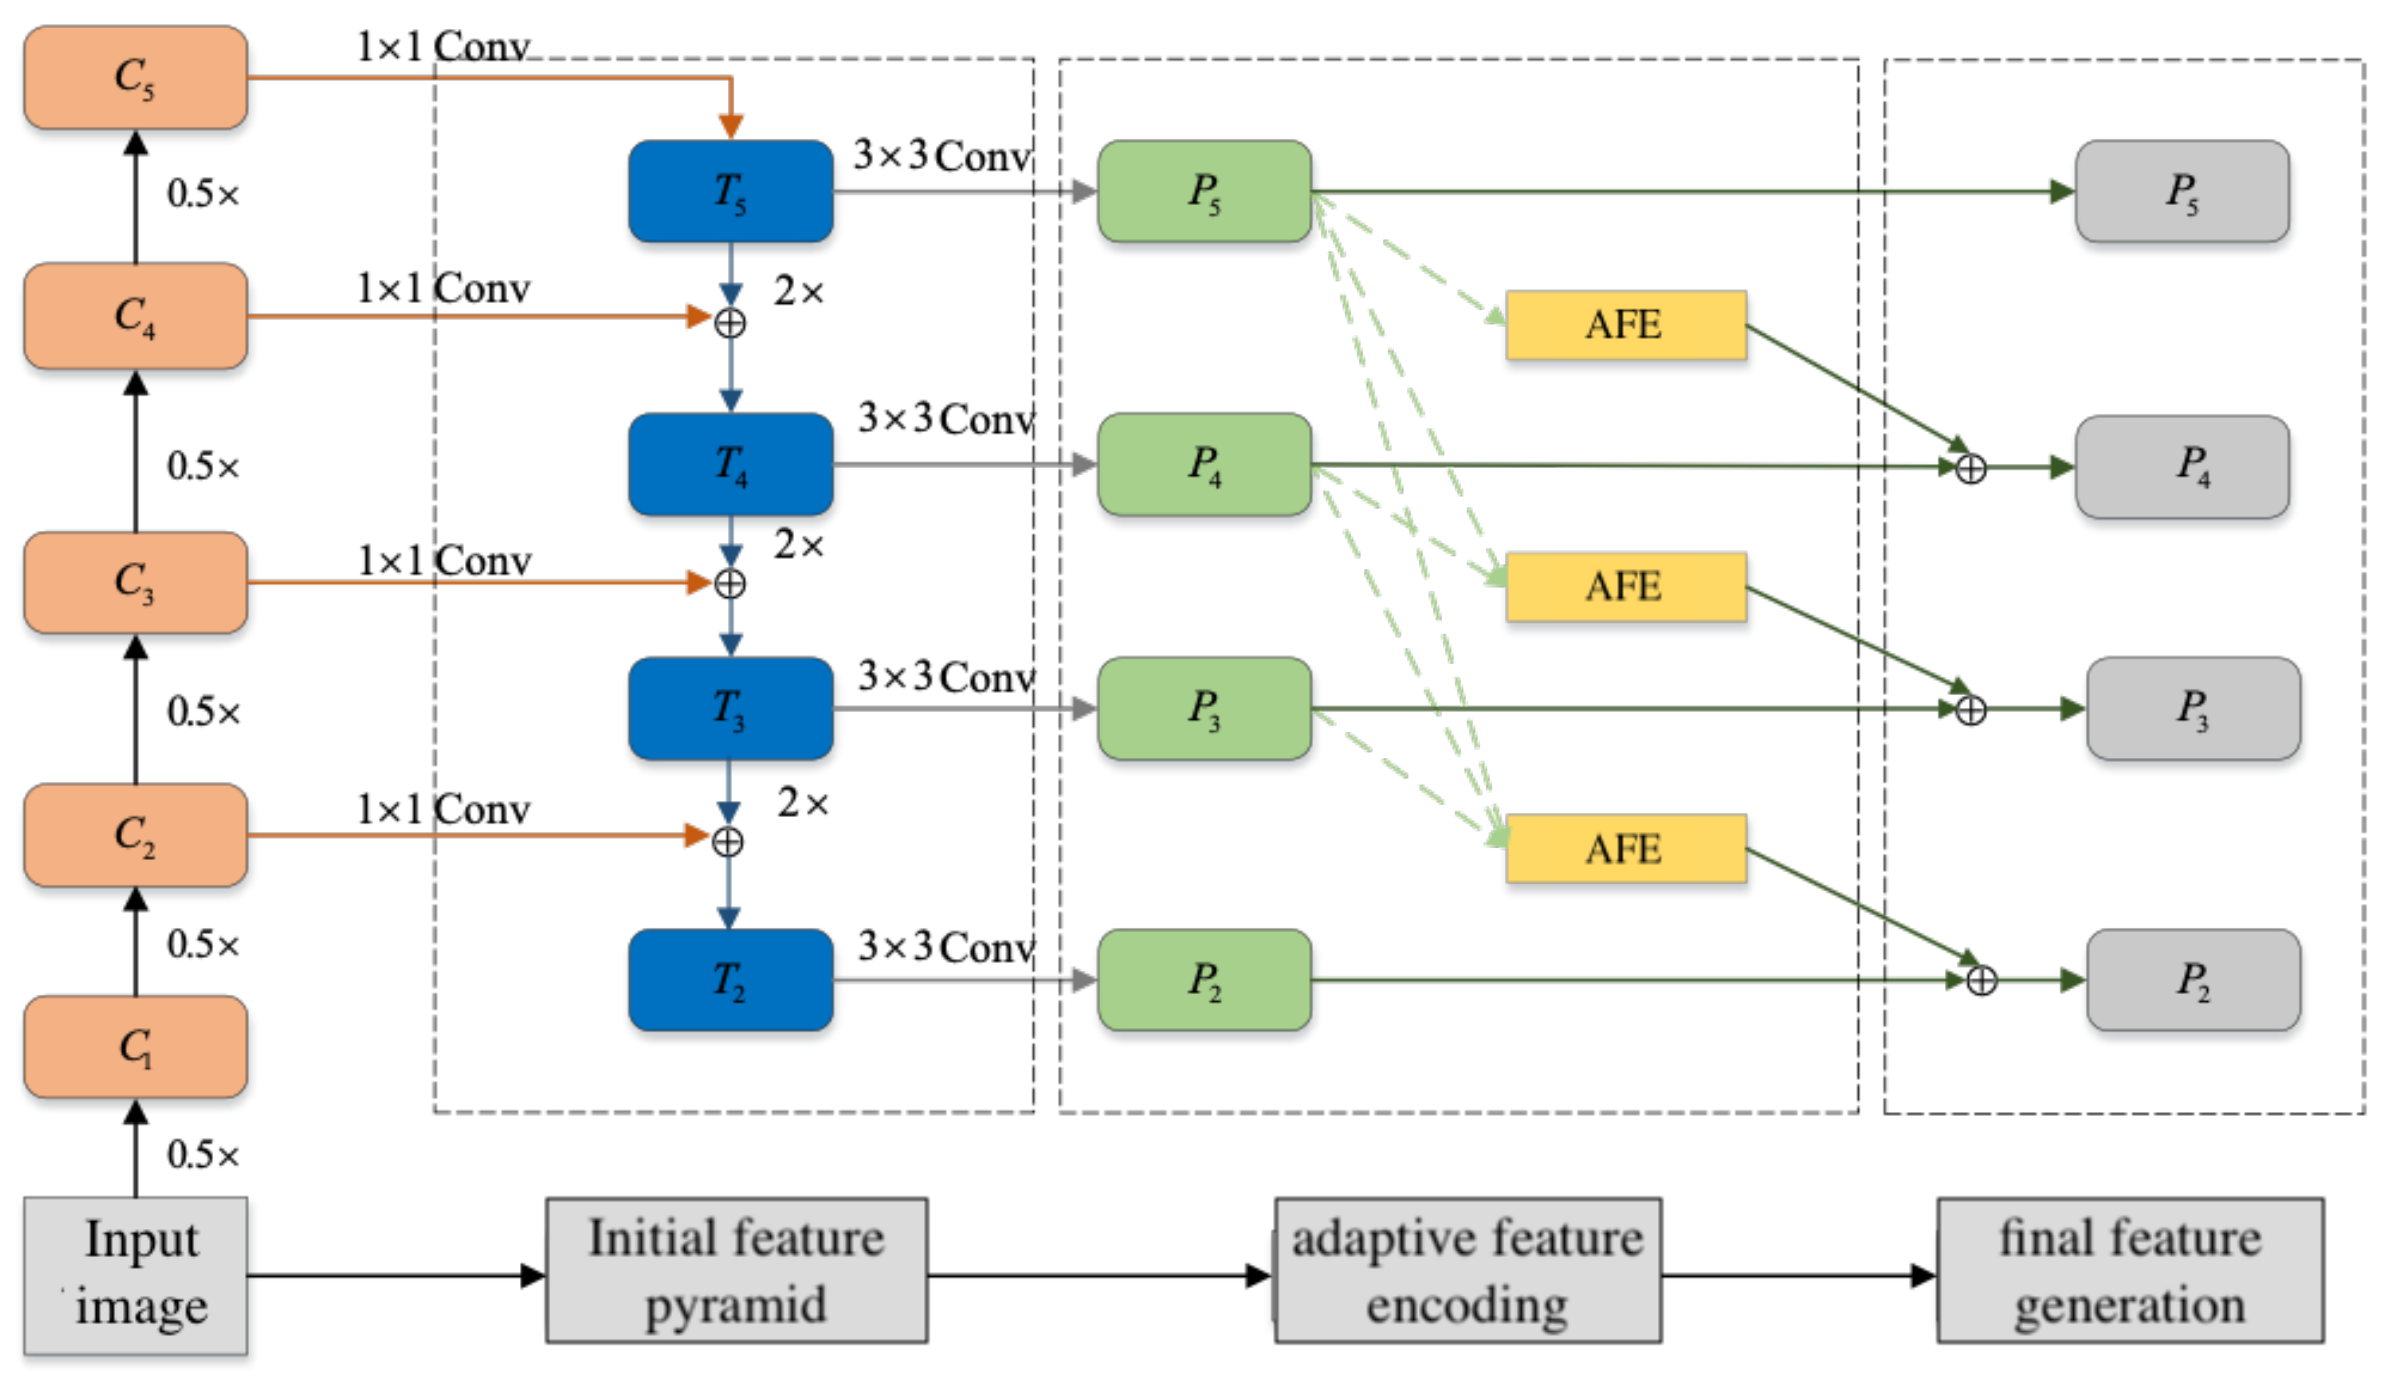
3.3.1. Initial Feature Pyramid Generation
The input SAR image
x is first sent to the backbone network (RESNET, Darknet, etc.), and a series of feature maps
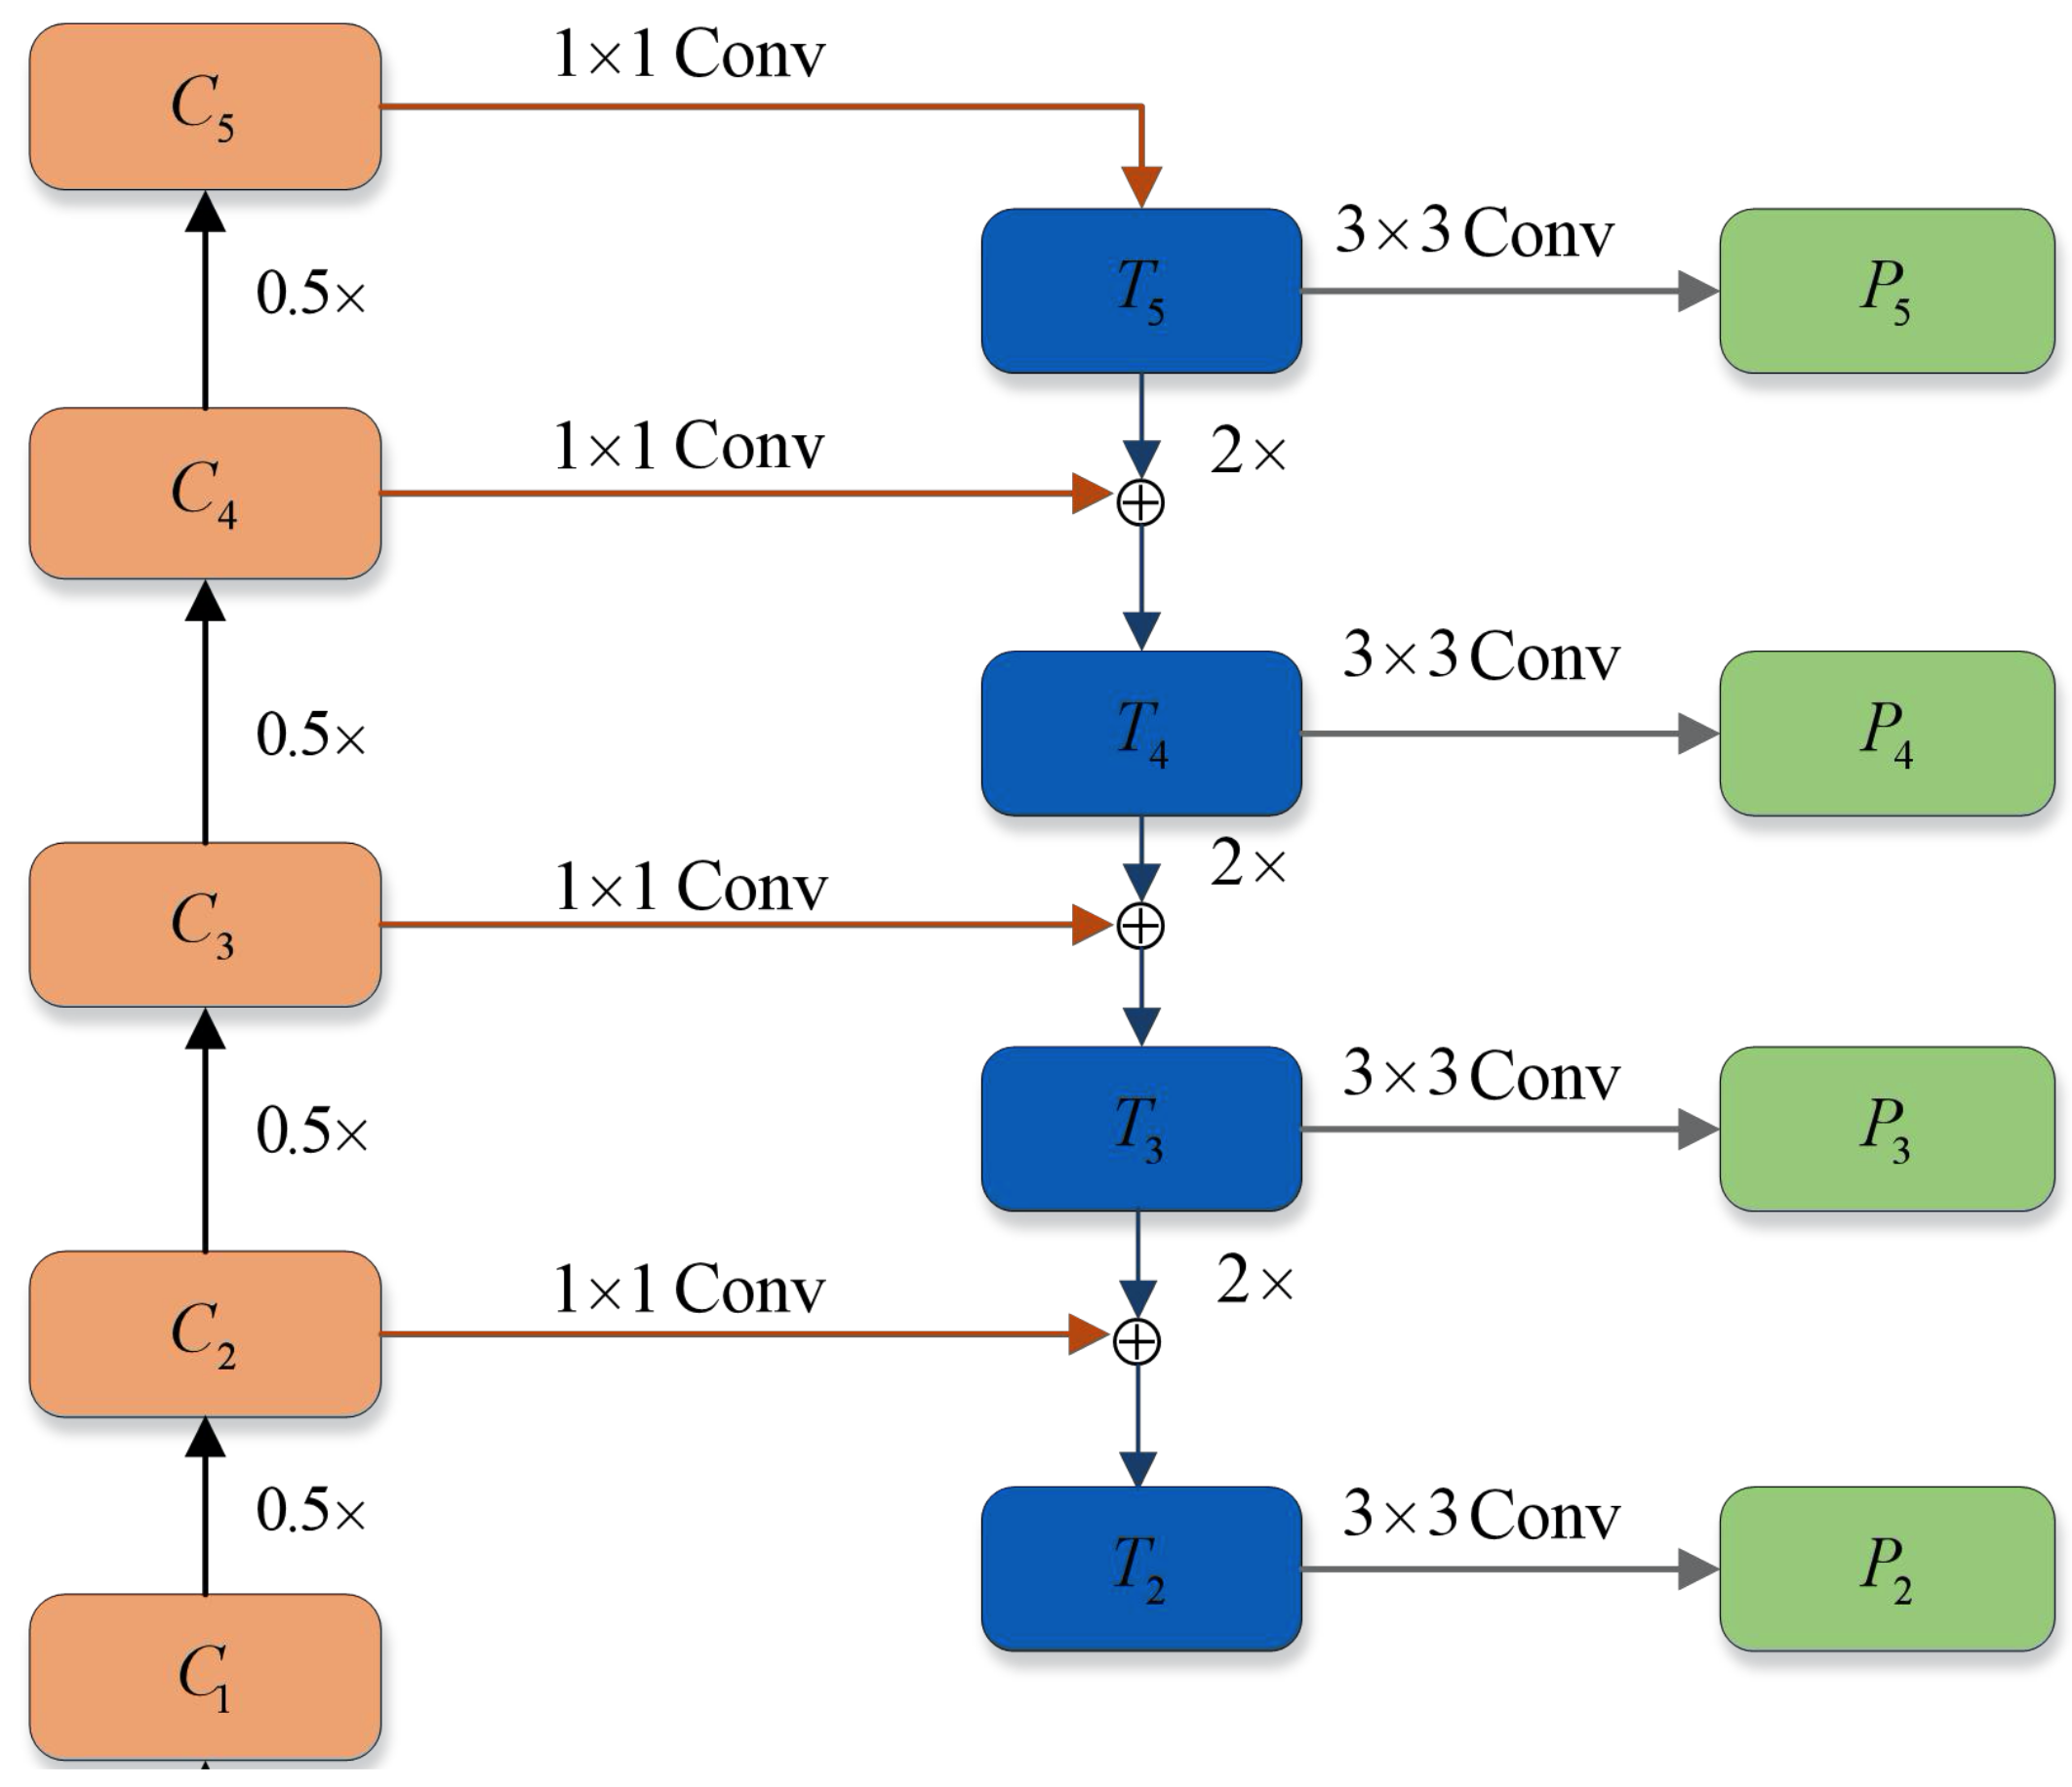
with different scales can be obtained and after a series of convolution layers. The shallow feature map has high resolution and the detailed features are intact, making it suitable for detecting small targets. The deep feature map has low resolution, but has a larger receptive field and higher semantics, meaning it is suitable for large-object detection. These feature maps are combined as a top-down connection to form a feature pyramid for multi-scale detection. The specific connection process is shown in
Figure 4. Firstly, the low-resolution feature map was up-sampled, and then it was added pixel-by-pixel to the shallow feature map with lateral connection. The initial pyramid feature map are obtained subsequently through a 3 × 3 convolution, and the 1 × 1 convolution of lateral connection was used to change the number of channels.
With the increase of
i, the resolution of the feature map gradually decreases, which can be expressed by:
where
W and
H are the width and height of the image. In order to reduce the amount of calculation,
is usually not used when constructing the feature pyramid. The initial feature pyramid constructed in this paper is
.
3.3.2. Adaptive Feature Encoding
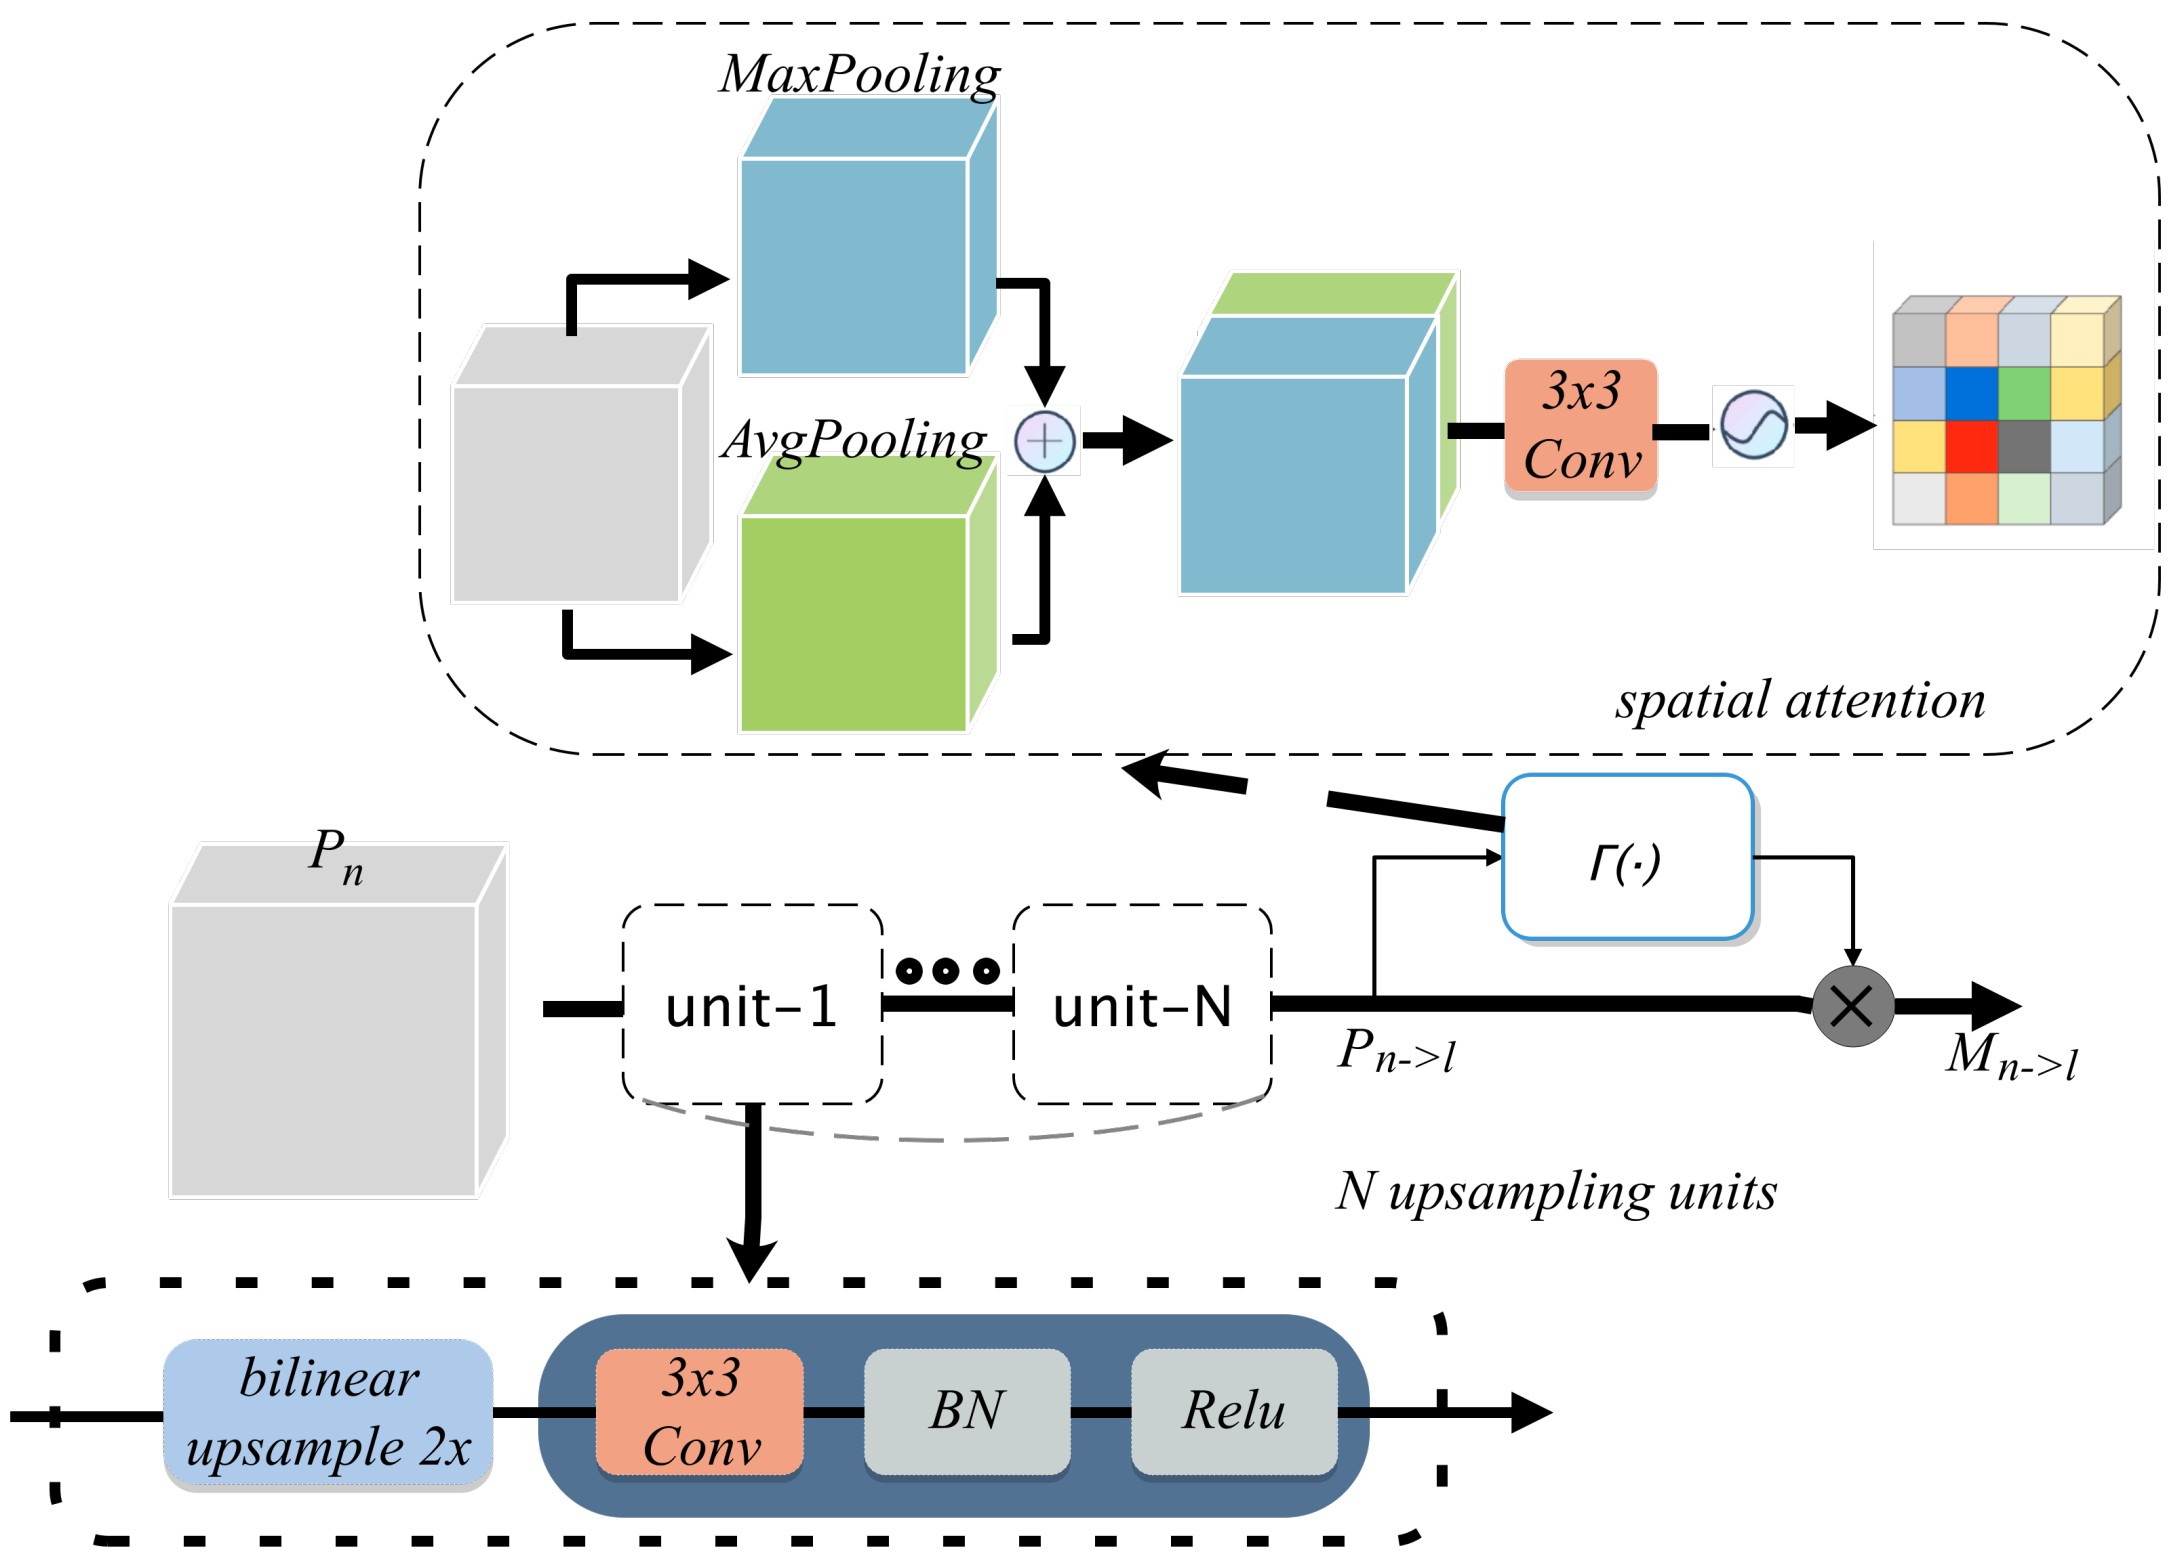
Adaptive feature encoding is mainly divided into two steps: the first step is to up-sampling the deep feature map to realize the resolution matching between deep and shallow feature maps; the second step is to calculate the spatial weight of the matched deep feature map and encode the spatial features.
For a layer
in the initial feature pyramid,
scale to
size in turn. Specifically, as shown in
Figure 5, for
, bilinear interpolation is used for up-sampling, and 3 × 3 convolution is used for feature modification. For
, the operation of convolution after upsampling is adopted twice, and so on for other feature maps.
The
means that
is scaled to the feature map with the same resolution as
, and the number of channels is
C,
represents the weighted feature map. The process of spatial feature weighting can be described as:
where ⊗ represents the pixel-by-pixel multiplication with broadcasting attached, and
represents the two-dimensional weight tensor with the same size as
generated by the gating module
.
The structure of spatial attention mechanism is used for
. As shown in
Figure 5, the maximum pooling and average pooling of
are performed in the channel dimension firstly. After the two are spliced together, they are input into the sigmoid function through a 3 × 3 convolution to obtain the normalized weight tensor.
is to obtain the spatial weight, and then conduct pixel-by-pixel multiplication with
to obtain the weighted
.
In the specific process, we also normalize the spatial weight of each layer by Softmax. The reason for using Softmax is to keep the accumulation of multi-layer characteristic values in a reasonable range and not cause excessive influence on optimization. Compared with the concatenate operation, the method of per-pixel accumulation is more in line with the idea of weighting and has less computation. The final generation process of feature pyramid is shown in
Figure 6.
3.4. Gaussian-Guided Detection Head
Different from the classification task, in the training process of the detection task, the predicted samples need to be allocated to divide into positive and negative samples by manually designing rules; this division process is called sampling. The quality of the sampling strategy directly affects the effect of training. The sampling strategies in current detection tasks can be roughly divided into IoU matching sampling, based on predefined anchors, and densely points sampling, without anchors. The IoU matching sampling strategy needs to calculate the IoU between the anchor and the real boundary box of the target to divide positive and negative samples. The problem of this strategy is that it is sensitive to the super-parameter setting of the anchor. The detector without anchor design can avoid this limitation. It usually adopts the method of densely points sampling that directly maps the real boundary box of objects to the final feature map. The points inside the boundary box region are selected as the center point of the positive samples, and the remaining positions are divided as negative samples. Although this method is not affected by hyper-parameters, it cannot effectively judge the quality of samples. The positions on the edge of the boundary box are usually the background center rather than the target, while the samples of different positions are not distinguished in network training. Although FCOS introduces the center-ness branch to suppress the low-quality samples at the edge, there are still some problems in applying it to SAR ship object detection: (1) center-ness cannot fit ships with changeable direction well; (2) FCOS only uses center-ness to restrict the classification score of targets in the test stage, and does not distinguish the contribution of samples from different positions in the bounding box in the training stage.
In view of the above problems in small target detection, we use Gaussian distribution to model the pixel distribution of targets in the horizontal boundary box, and obtain a new target existence measure Gauss-ness. A weighted sampling method based on Gauss-ness is also proposed from the perspective of soft sampling. Compared with the truncated sampling based on Gauss-ness, our method does not directly discard the prediction results of the edge of the bounding box, but reduces its weight when calculating the total classification loss.
3.4.1. Gauss-Ness Branch for Inference Process
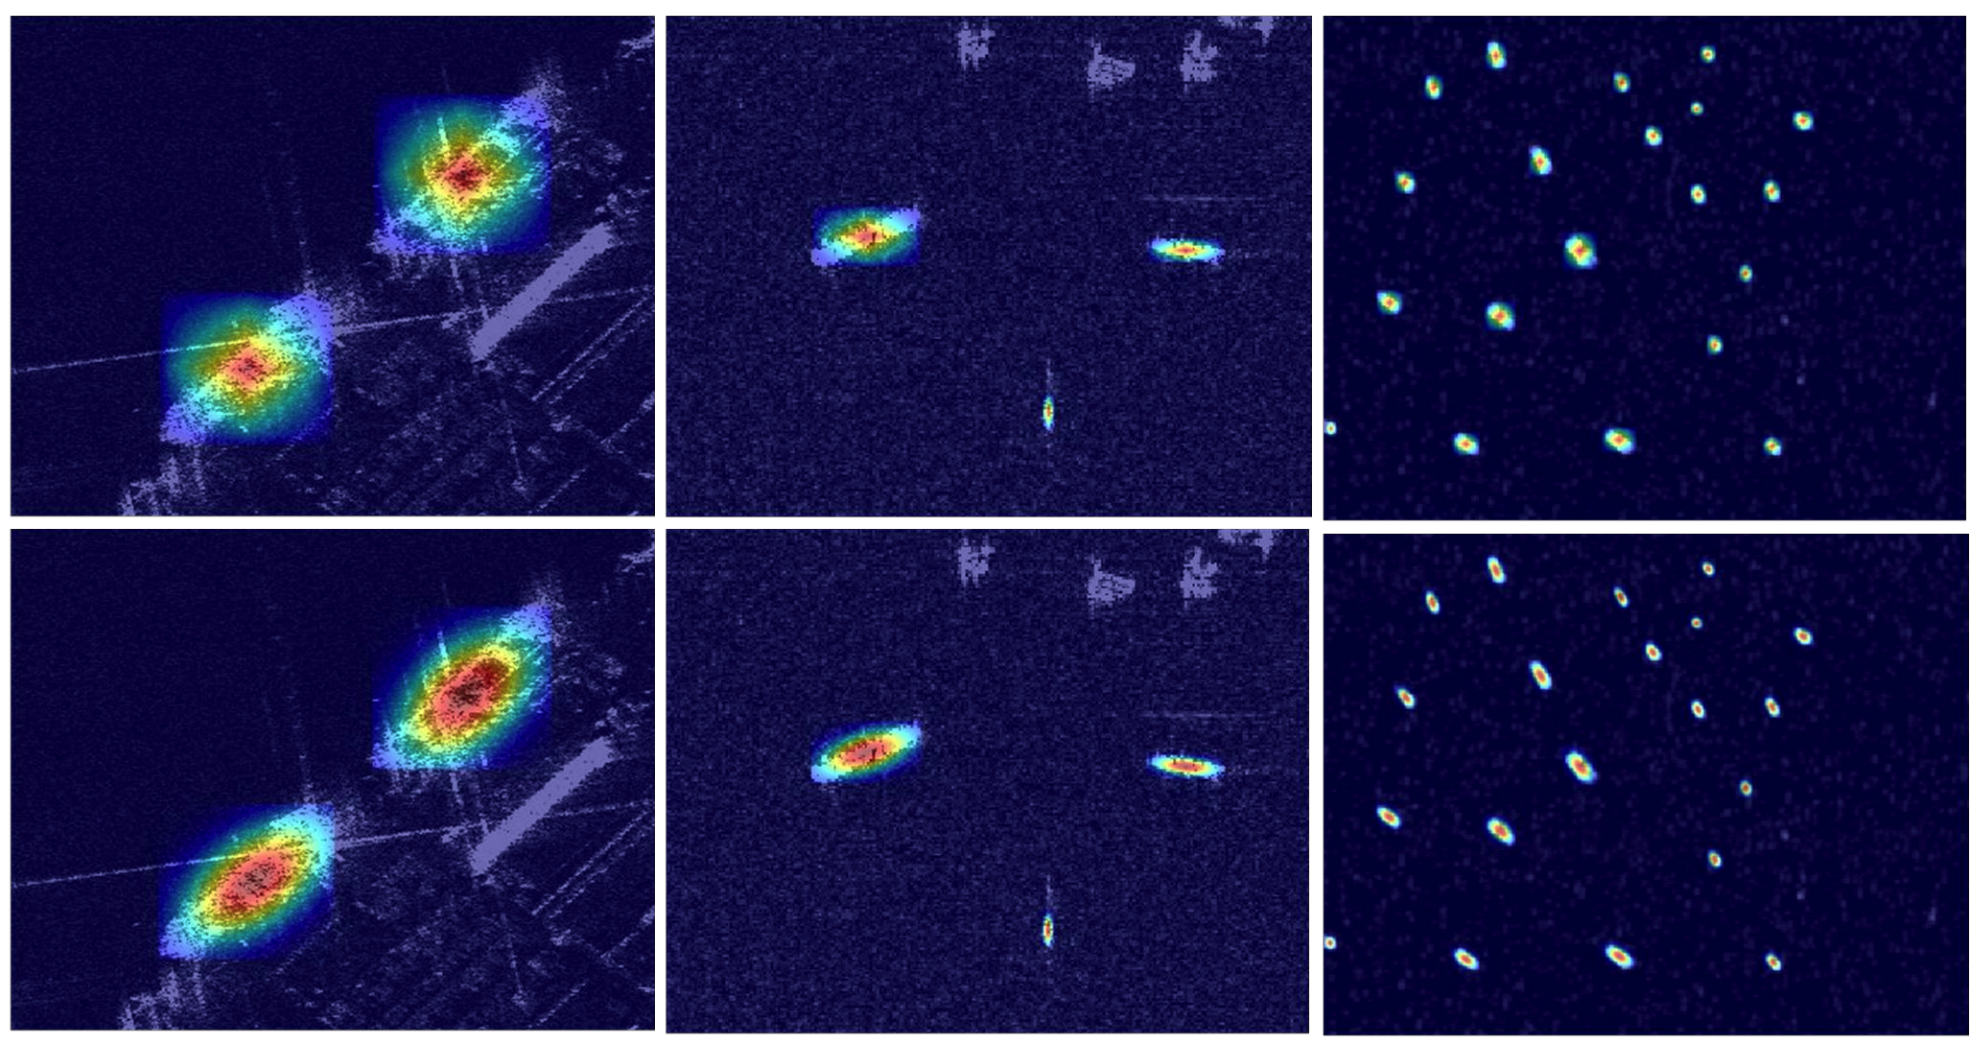
It is observed that although the center-ness method can meet the priori of object, it can not well fit the pixel distribution of ship targets due to the multi-direction of SAR ships.
In order to judge the target existence of the location more accurately, a new measurement method needs to meet the following properties:
(1) The center prior is satisfied. The weight of the position closer to the center is larger, and the value closer to the edge is smaller. There is a gradual decay process from the center to the edge. (2) Center symmetry is satisfied. Since the direction of ships in SAR images are uncertain, this metric should not be simply symmetrical in horizontal and vertical directions. (3) To meet the normalization, the centrality of the center of the boundary box is 1, and the edge position should be attenuated to 0 as far as possible.
Through analysis, the bivariate Gaussian distribution is suitable for modeling the horizontal bounding box:
As shown in Equation (
5), the Gauss-ness is obtained by normalizing it, where
is the vector of position coordinates
,
is the mean vector of Gaussian distribution,
is the covariance matrix of Gaussian distribution, and
is the determinant of covariance matrix.
Due to the obvious contrast between the gray value of the SAR ship and the surrounding sea area, the gray value of the pixels in the boundary box can be used as the sample weight for maximum likelihood estimation of and .
The second line in
Figure 7 shows the fitting effect of Gauss-ness on the target in the bounding box. It can be observed that Gauss-ness can better fit the shape of ships, especially the ship direction, which has great advantages over the center-ness in the first line.
3.4.2. Gauss-Ness Weighted Sampling in Training Process
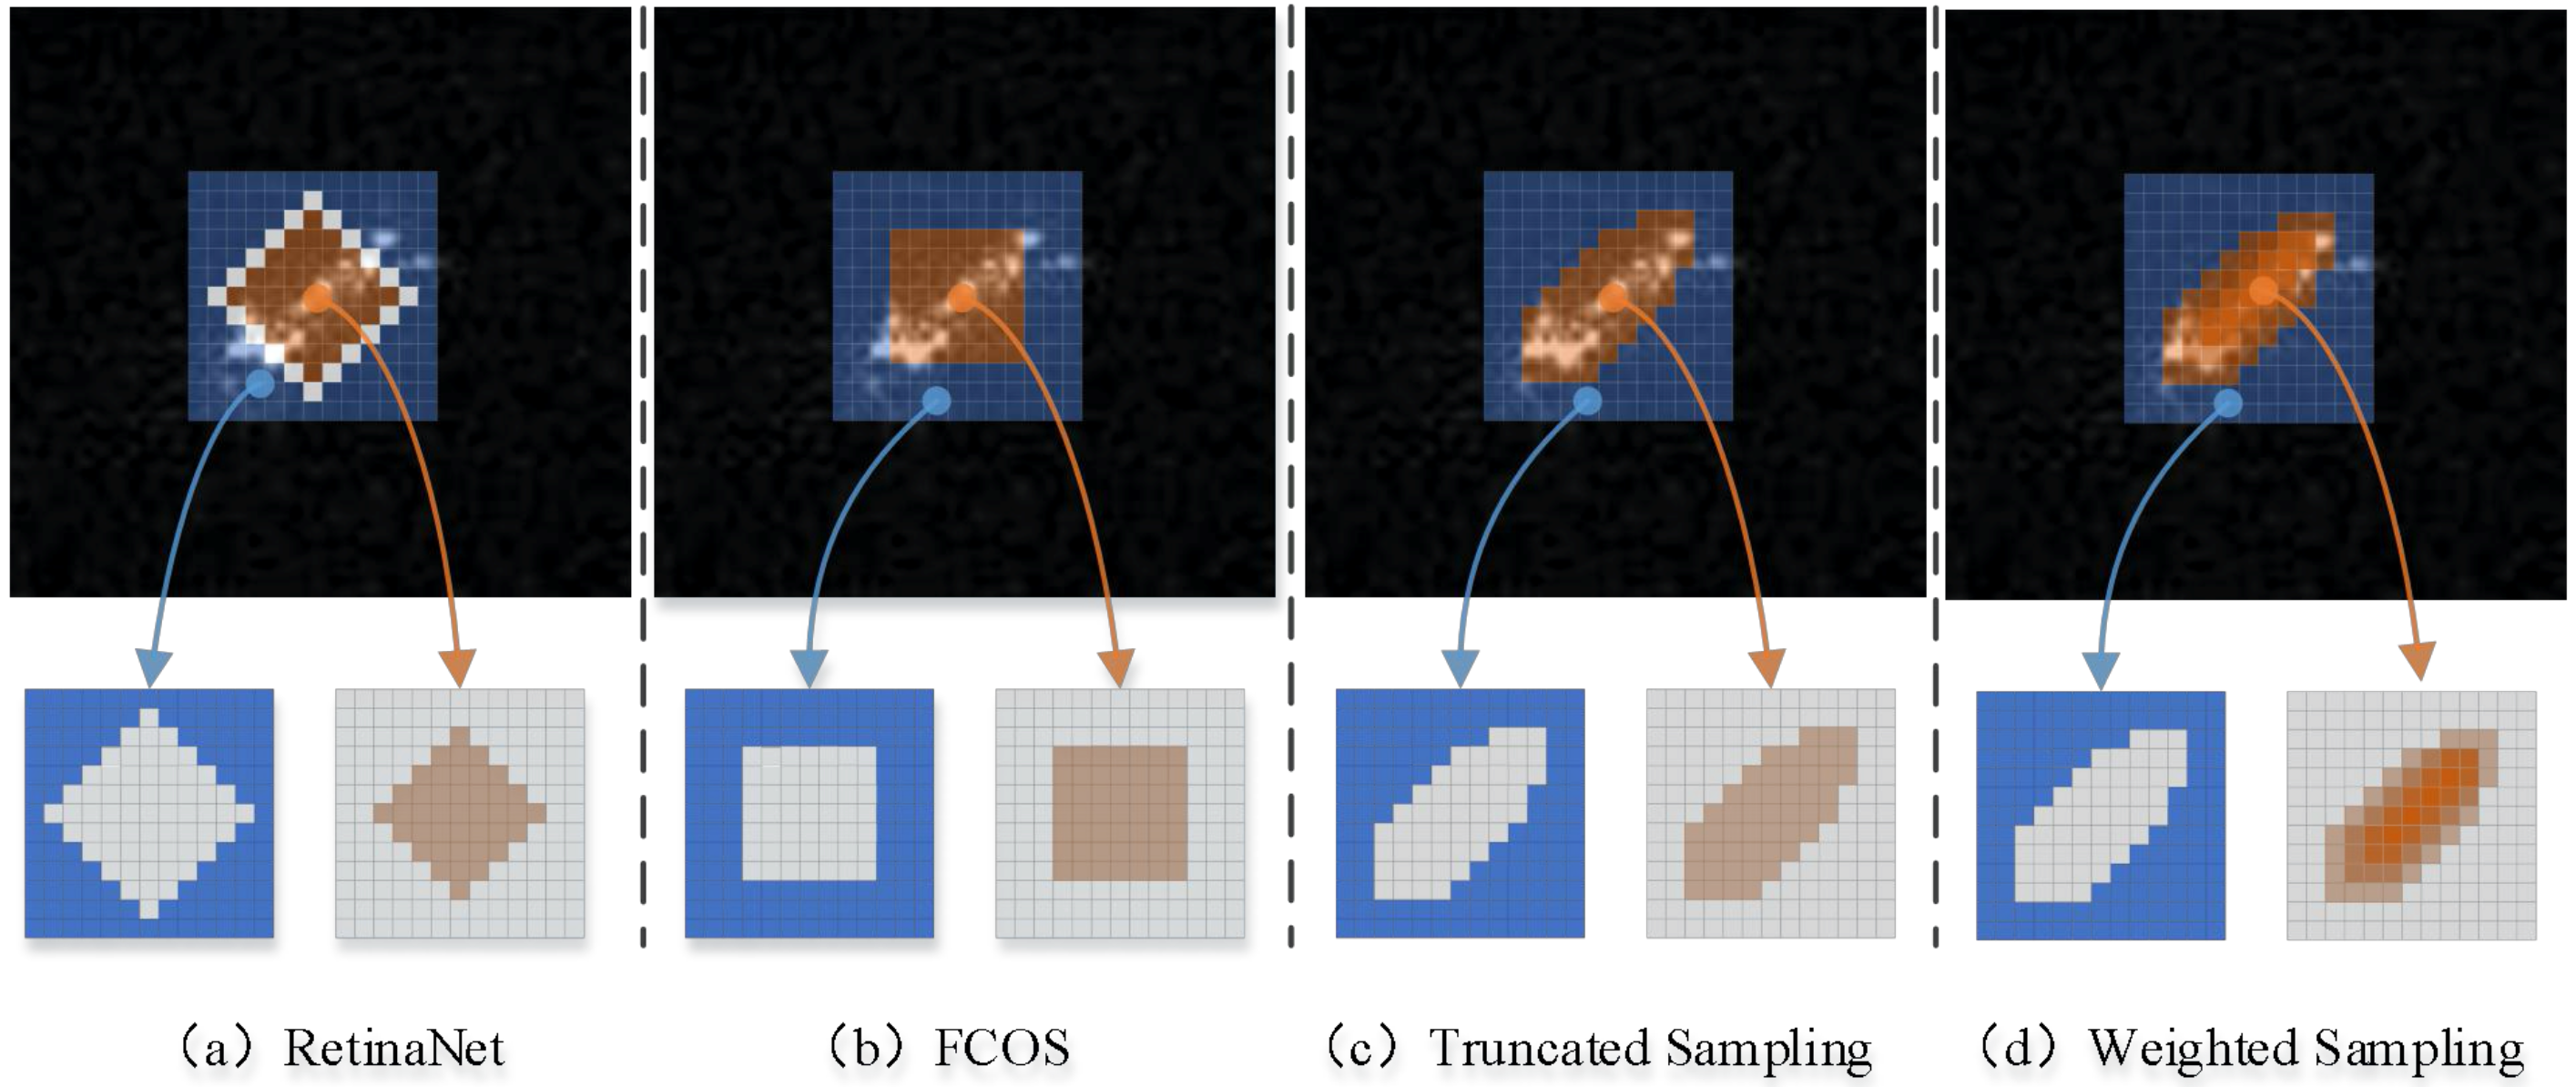
The anchor-based detector screens positive samples through IoU value.
Figure 8a shows the distribution of positive samples in anchor-based detectors, and the number of positive samples depends on the setting of IoU threshold. The threshold of RetinaNet in MS COCO detection task is 0.5 and approximately 25% of the locations in the boundary box will be classified as positive samples.
Figure 8b is the positive sample distribution diagram of FCOS, which divides all samples with center points in the boundary box into positive samples without considering the influence of low-quality samples at the edge.
Since FCOS does not consider the low-quality samples, Gauss-ness is proposed. Specifically, we first calculate the sampling threshold by dividing 25% positions into positive samples, which is the quartile of the Gaussian distribution. The position where Gaussian value is greater than the threshold in the boundary box is divided into positive samples.
Figure 8c shows the distribution of the Gaussian truncated sampling.
The low-quality samples generated at the edge of the bounding box are often hard samples in training. The existence of these samples brings noise to the training of the target detector. To reduce the influence of low-quality samples on the training process, we consider weighting the samples based on Gauss-ness, and introduce the adjustment factor
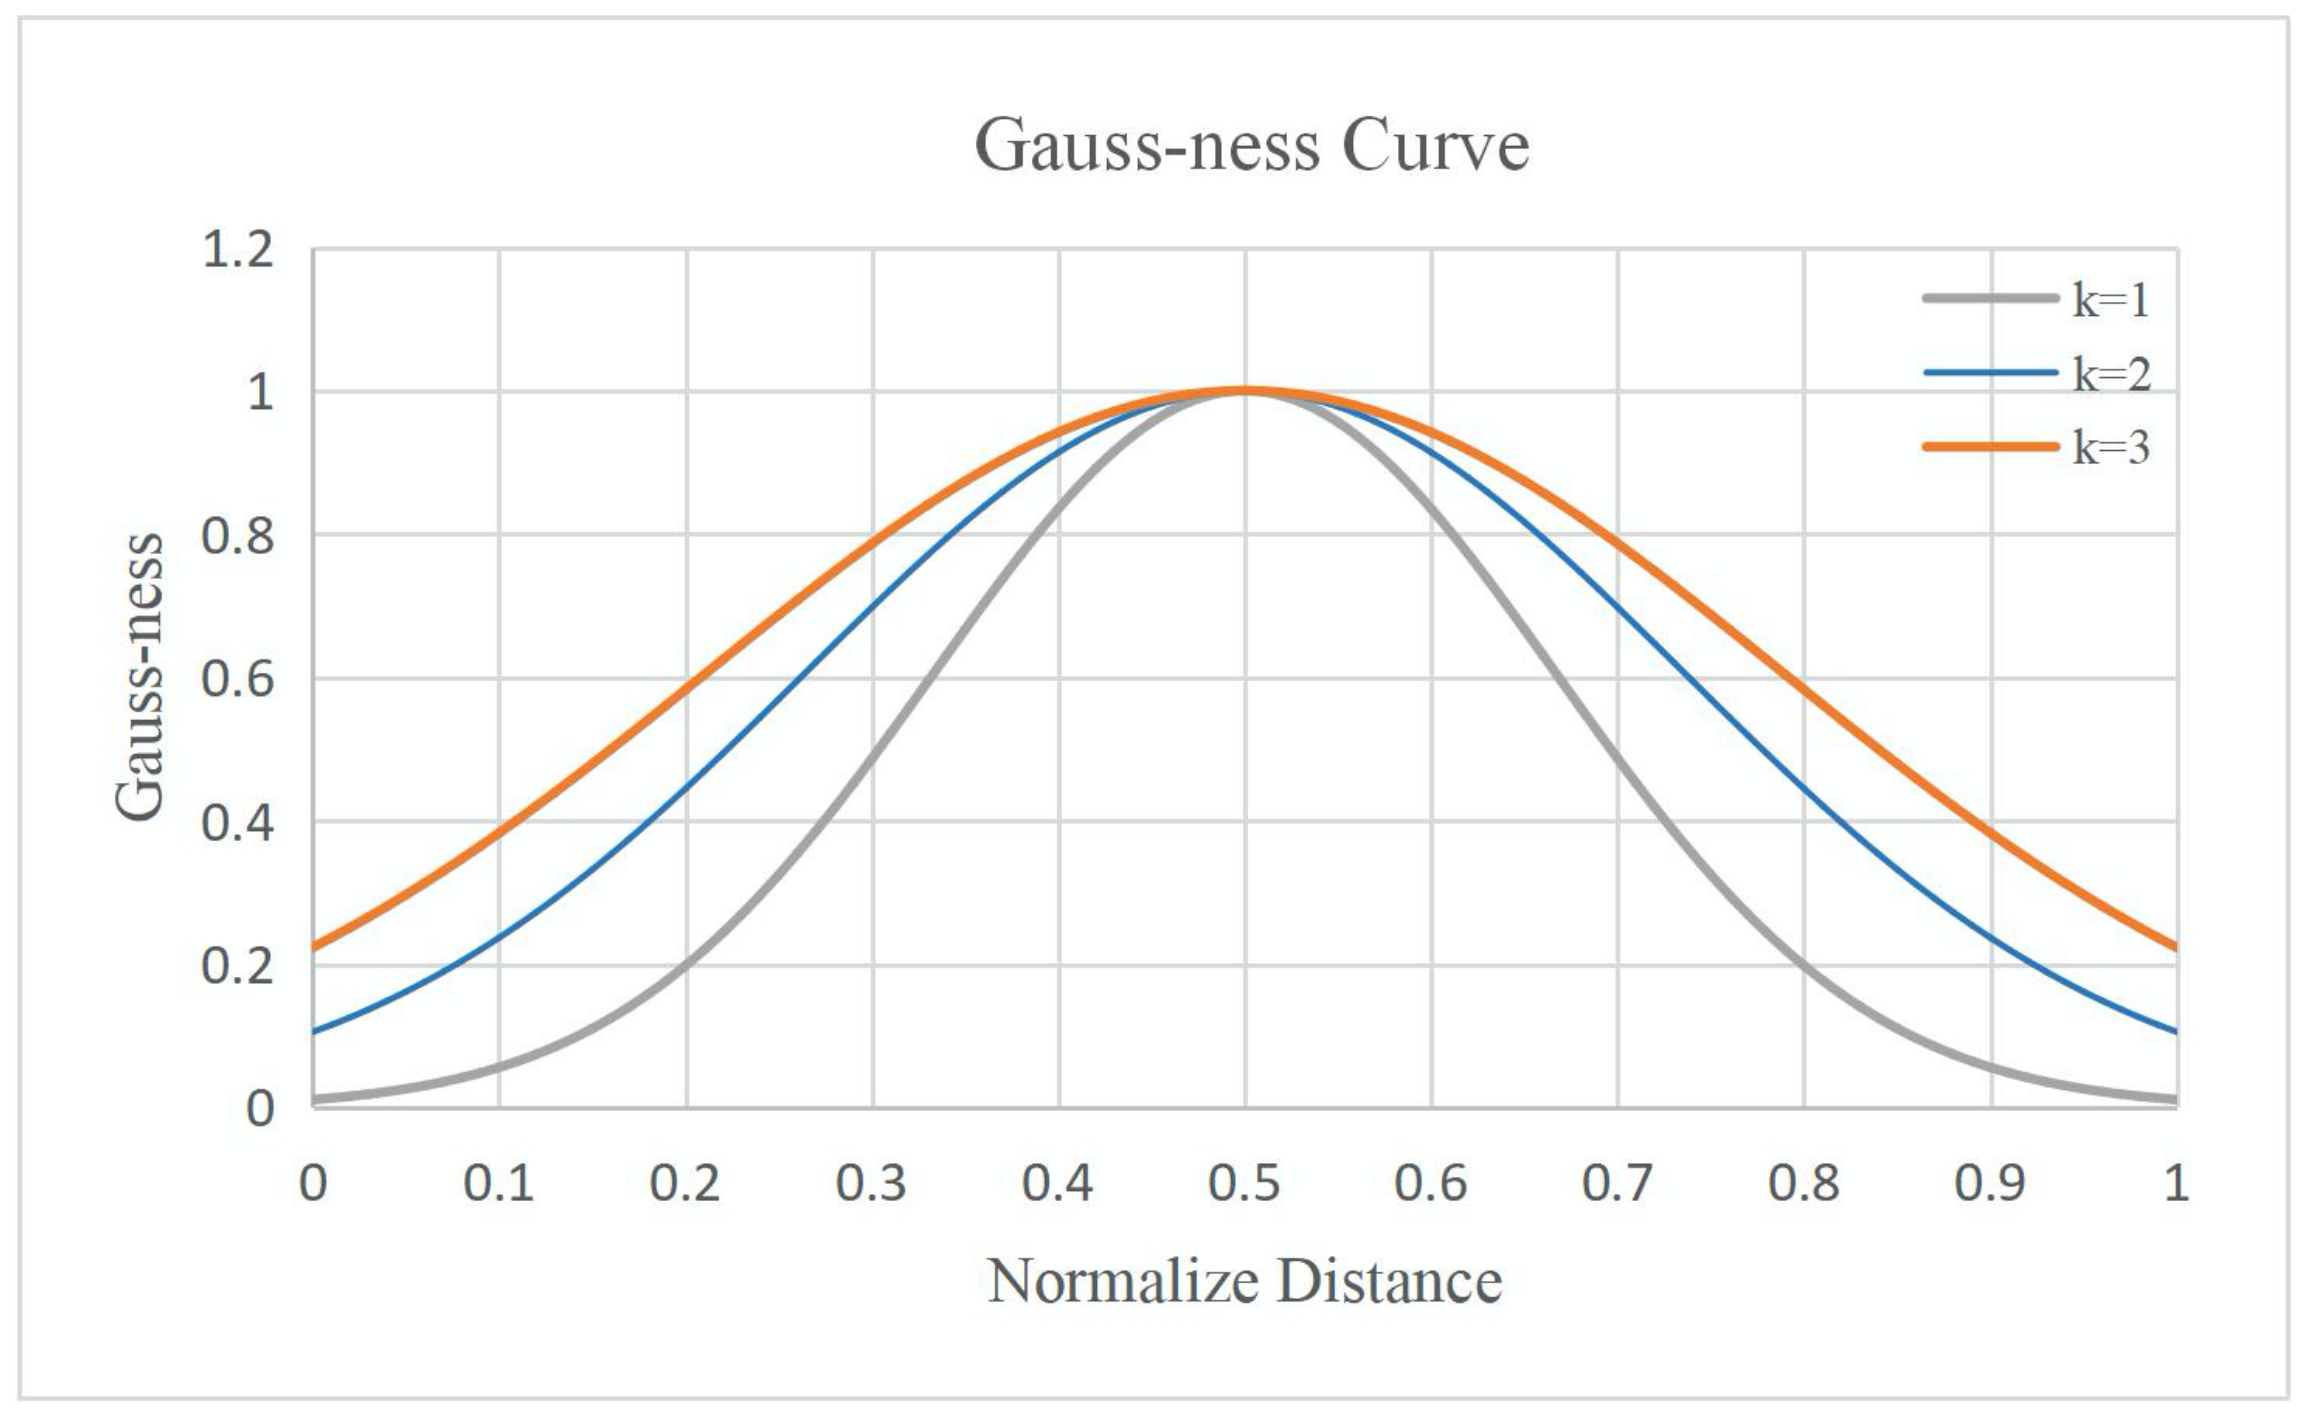
k to regulate the degree of variance:
k can adjust the variance of Gauss-ness between the center of the bounding box and the edge, and control the speed of edge attenuation.
Figure 9 shows the change curve of Gauss-ness along the horizontal direction when
k takes
respectively. The abscissa adopts the distance after normalization. With the increase of
k value, the attenuation velocity will gradually decrease. The experiment in
Section 4.3.2 explores the impact of different
k values on the detection performance. In the benchmark experiment, we take the
k value as 2.
In addition, considering that weighted sampling is a redistribution of the original samples and should not change the overall weight, normalization factor
is introduced to normalize the Gauss-ness in the boundary box of a single target so that its mean value remains to 1. The final sample weight can be described by the formula:
w is the sample weight,
represents the normalization factor, and is the average weight of positive samples in the bounding box.
s represents the current sample and
represents the set of positive samples.
Figure 8d describes the distribution of positive samples with weighted sampling strategy. Orange represents positive samples and light to deep represents different weights. The final weighted loss function is described as follows:
where
is the focal loss [
7] for classification,
is the IoU-loss [
44] for regression. Focal loss is proposed to solve the problem of severe imbalance in the proportion of positive and negative samples in end-to-end object detection. For regression loss, the commonly used
needs to optimize four independent variables of the bounding box at the same time, and leads to the model optimization focuses more on larger objects and ignores smaller ones. In order to solve this problem, we use
function to optimizes the bounding box as a whole.
,
and
separately represent the sampling weight, category score and real category at
.
stands for the predicted coordinates of
, while
is the ground truth value at
.
represents the number of positive samples,
is set to 1 as the balance weight of
.
is an indication function, when
, its value is 1, otherwise it is 0. Re-weighting the positive samples in the above way not only weakens the influence of noise samples that cannot be well modeled, but also helps to re-examine the central samples that are considered to be correctly classified, thus promoting the classification performance of detection.
4. Experiments and Analysis
4.1. Introduction to SAR Ship Dataset
To verify the effectiveness of the model in this paper, experiments on large-scale datasets are required. Due to the limitation of SAR imaging conditions, its related datasets are not as common as optical datasets. This paper conducts multiple experiments on two public SAR ship datasets. The statistics of these datasets are listed in
Table 3. Detailed information, including the resolution, image size, number of images in the dataset, labeling method, is given for comparison. Each dataset is described in detail below.
HRSID : HRSID is a -detection dataset of SAR images released by the University of Electronic Science and technology of China [
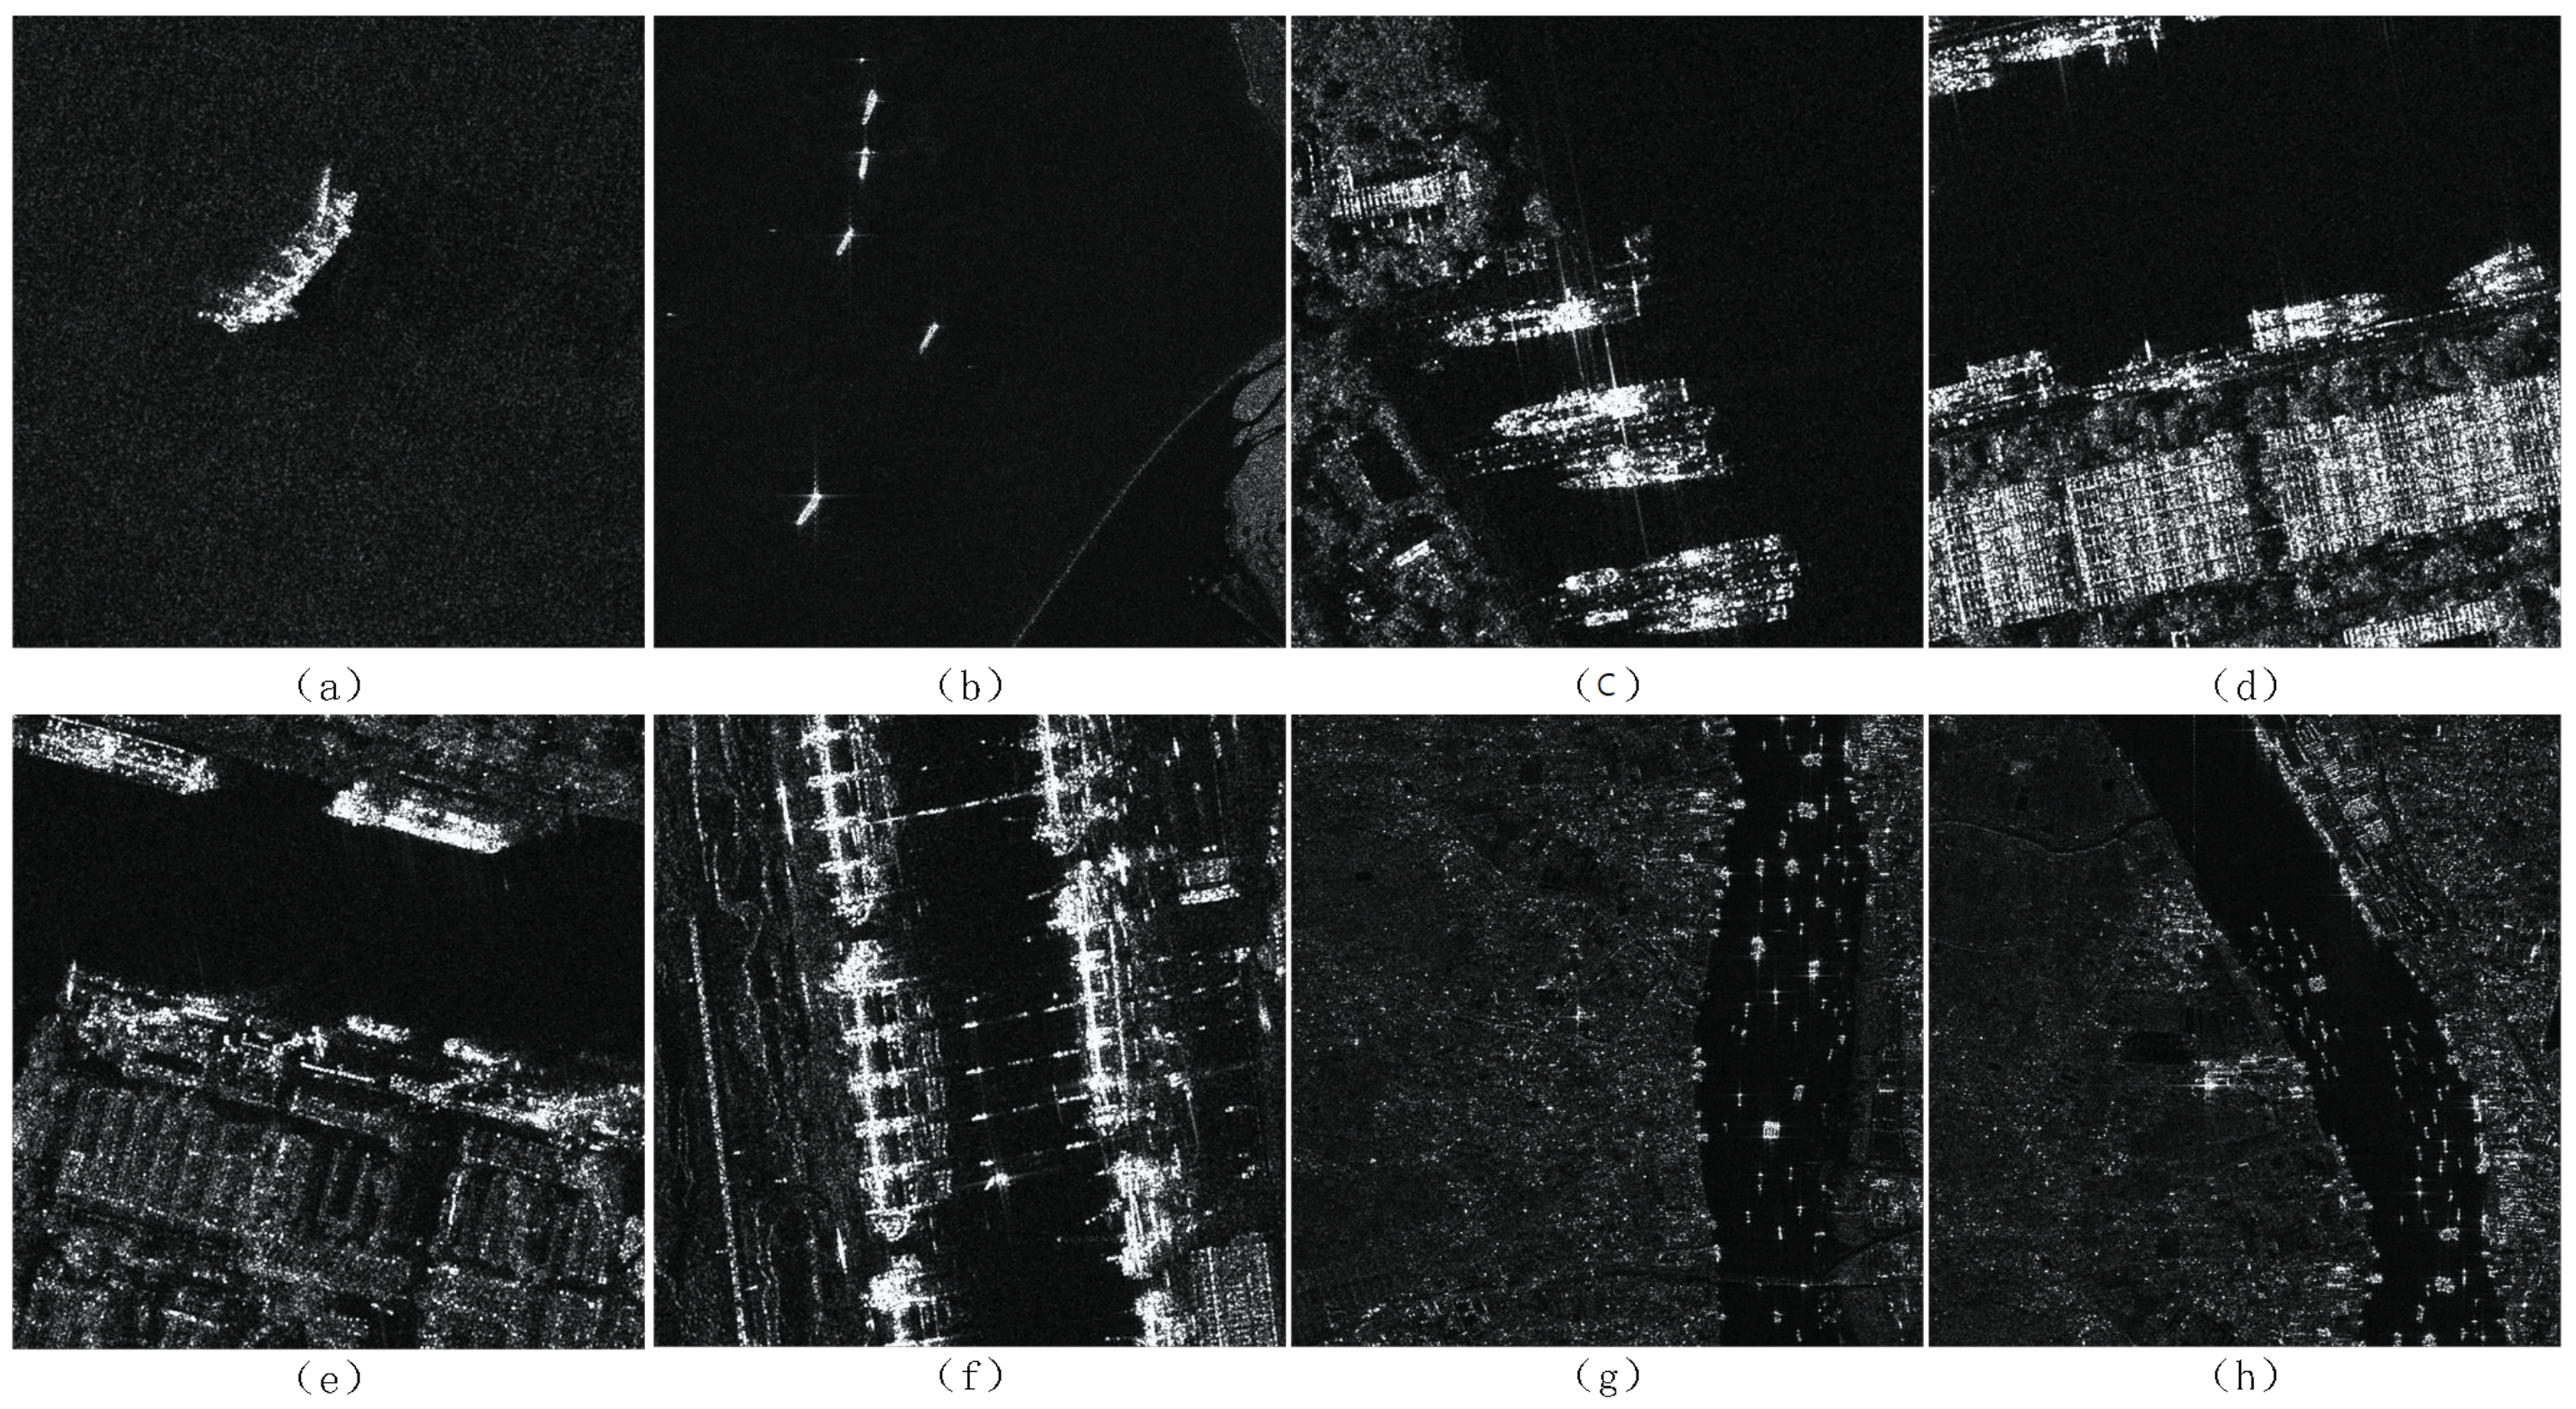
16]. It adopts MS coco annotation format. The image sources are mainly sentinel-1b, TerraSAR-X and TanDEM-X, and the resolution is less than 3 m. The imaging area of the whole dataset includes the ocean surface with broad field of vision and simple background, and the offshore scene with more ships berthing and complex background. The offshore scenes are mainly ports, in which the ships are greatly affected by artificial facilities or buildings. In addition, the dense arrangement of ships is also a challenge. The ocean surface background is relatively simple, but its resolution is usually low and is greatly affected by wave clutter. The dataset cuts the target area to 800 × 800 size slices with resolutions ranging from 0.5 m to 3 m.
Figure 10 shows some typical scenarios in the HRSID dataset.
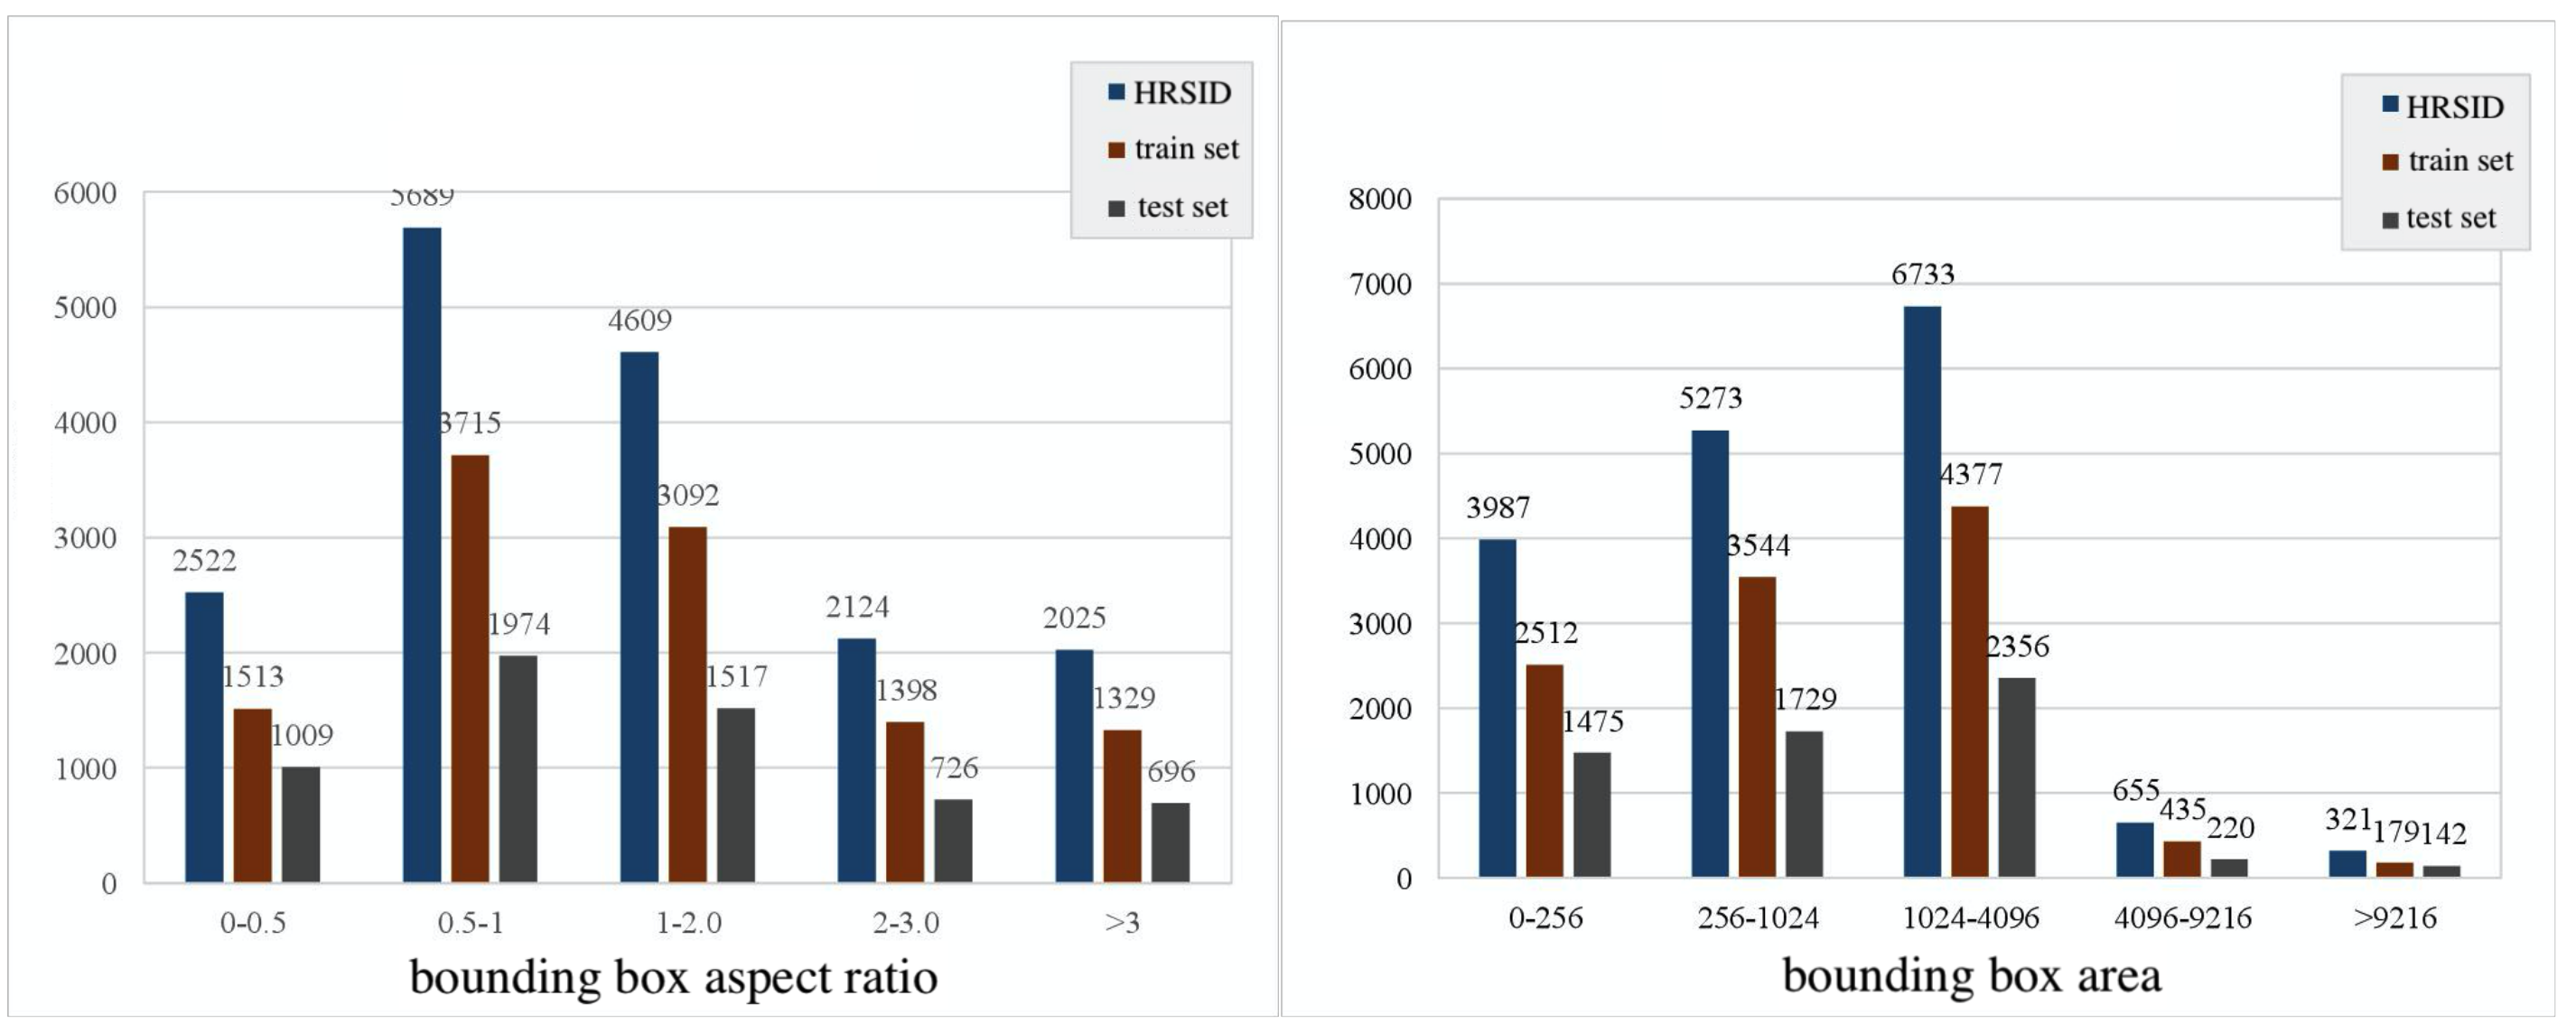
HRSID contains 5604 high-resolution SAR images, providing detection and instance segmentation task annotation respectively, 65% of the images are divided into training sets and the remaining 35% are used as test sets. In
Figure 11, the distribution of the area and width–height ratio of the bounding box in the training set and the test set is summarized, respectively. According to statistics, the percentages of small targets, medium targets and large targets in HRSID are 54.5%, 43.5%, and 2%, respectively, and small targets account for more than half. Therefore, HRSID has the characteristics of small targets but large detection scene.
SSDD : SSDD is the first public SAR ship detection dataset constructed based on publicly downloaded SAR images [
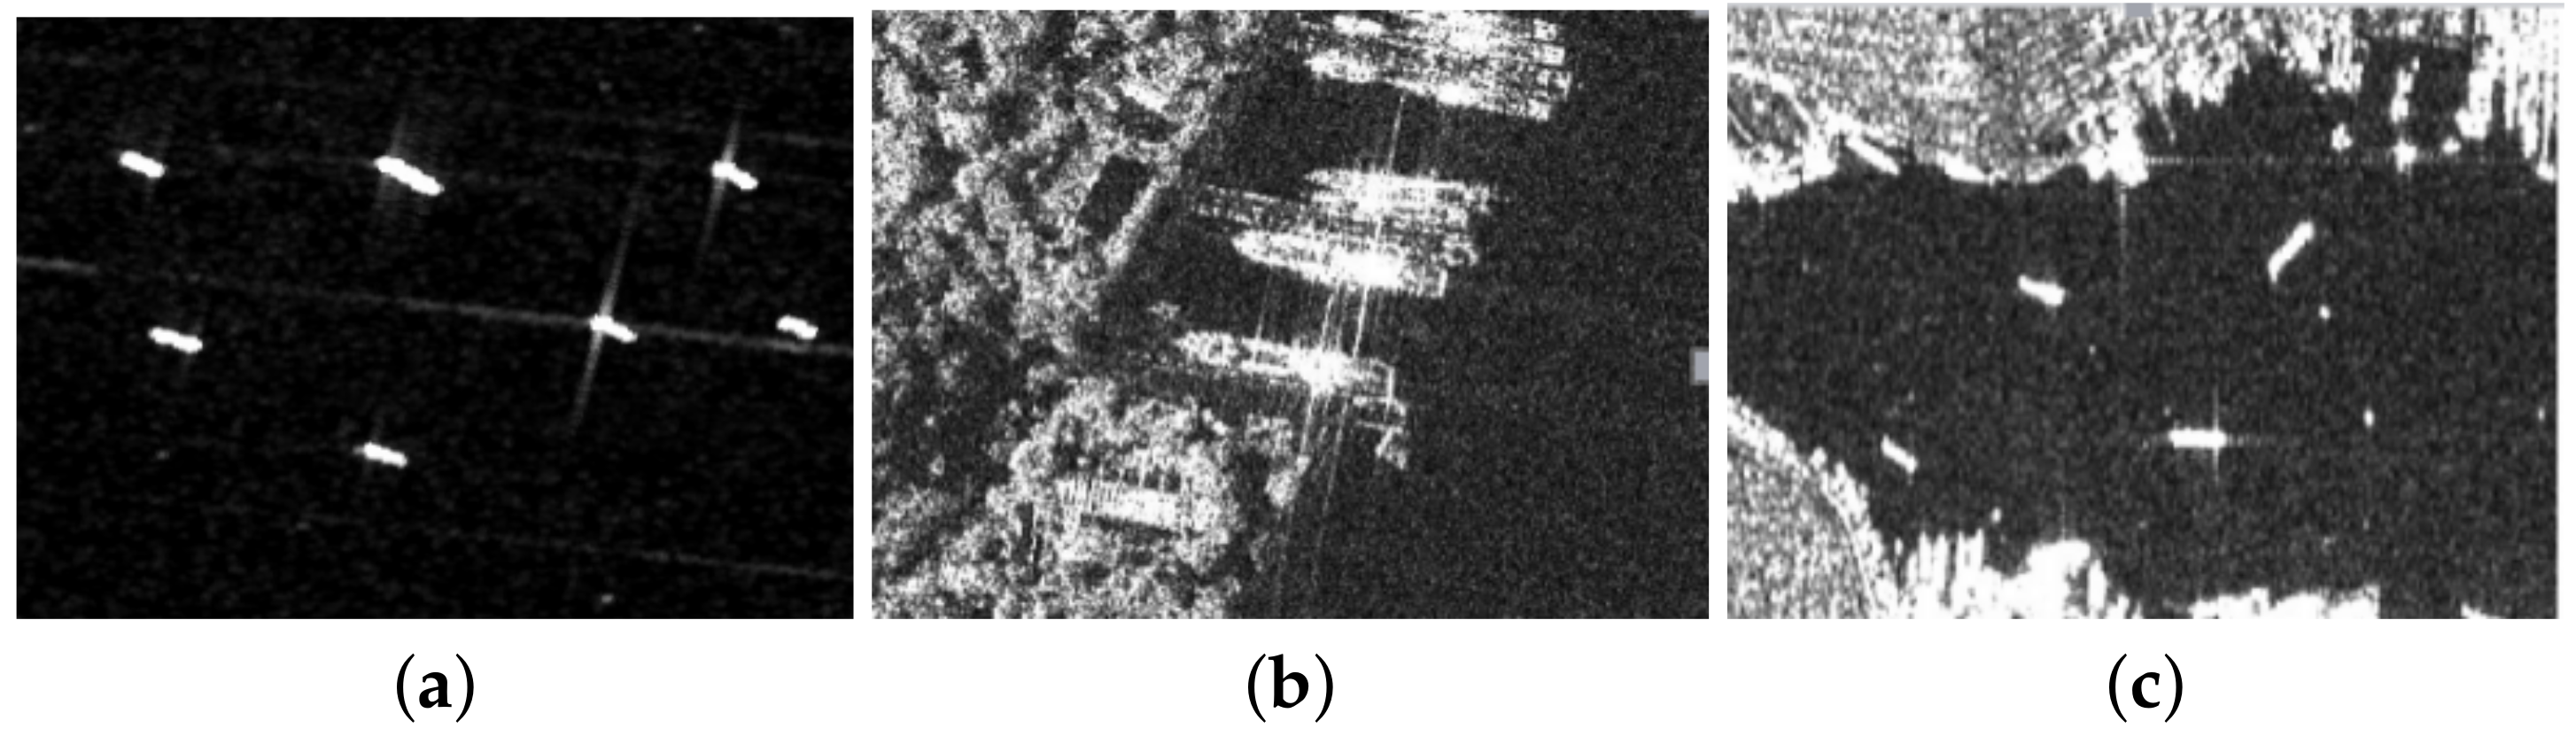
17]. It adopts PASCAL VOC annotation format. Images in the SSDD dataset were collected by radarSat-2, TerrasAR-X and Sentinel-1 sensors, including HH, HV, VV, and VH polarization modes, with resolutions ranging from 1 to 15 m. The image range includes the open sea area with relatively simple background and the nearshore port with complex background.
Figure 12 shows typical scenarios in the SSDD dataset: (a) multiple ships in a simple background; (b) a multi-objective scenario against a complex near-shore background; (c) the scene of a dense array of ships close to shore. SSDD cuts the target area into 500 × 500 pieces, with a total of 1160 images, including 2456 ship targets. In this paper, the dataset are divided into training sets and test sets according to the ratio of 9:1, of which 930 are training sets and 230 are test sets. Compared with the HRSID, the size distribution of ship targets in SSDD is relatively concentrated and the average size is slightly larger.
4.2. Experimental Parameter Setting
In the adaptive feature encoding experiment, this paper added feature map to construct a new feature pyramid, and divided it into pyramid . The target size range on feature maps are set as (−1, 32), (32, 64), (64, 128), (128, 256), (256, 512), (512, INF). is selected as the normalization method, bilinear interpolation is selected as the up-sampling method in the adaptive feature encoding module.
In the experiment of optimized sampling method, the threshold of truncated sampling is set as the quartile of Gaussian distribution of corresponding boundary box, and the value of regulating factor k is 2.
For the setting of training parameters, the SGD optimizer was used, the initial learning rate was set to 0.005, and the attenuation rate of 0.1 was performed after the 16th and 22nd epochs, with a total of 24 epochs trained. To improve the stability of the mini-batch training, a linear Warmup of 500 iterations was used and the pre-training weight of ImageNet was used to initiate the backbone network. was used for regularization processing, and the batch size was set to 4, training on NVIDIA Titan Xp GPU. During the test, the IoU threshold of the NMS is set to 0.5.
4.3. Experimental Results and Analysis
4.3.1. Experiment Evaluation of AFE
To evaluate the effect of the proposed adaptive feature encoding module, this section will analyze the experimental results from both qualitative and quantitative perspectives.
First of all, in order to verify the contribution of different configurations in AFE, this section uses FCOS as the baseline model to conduct ablation experiments on the HRSID. The experiments mainly include whether to construct the initial feature pyramid with high resolution feature map
and whether to use
in AFE. The test results under different conditions are listed in
Table 4. FCOS obtained AP of 62.0% and
of 63.6% on HRSID, and AP and
increased to 64.7% and 66.2%, respectively, after the initial feature pyramid was reconstructed by
. After weight calculation by embedding the AFE module, AP and
increased to 65.8% and 67.2%, respectively. After
was added, the AP and
of FCOS-AFE were further improved to 66.2% and 67.5%, respectively. Among them, the use of a high-resolution feature map showed the most obvious improvement in detection effect, and its AP and
increased by 2.7% and 2.6%, respectively, while our AFE could continue to generate 1.5% and 1.3% improvement in AP and
, respectively. This indicates that AFE can effectively enhance the semantic meaning of the introduced
high-resolution feature map and enhance the detection ability of small objects.
Then, the AP of AFE on HRSID and SSDD are evaluated.
Table 5 shows the evaluation results on the HRSID dataset. AFE achieved the best performance at all IoU thresholds, with a 4.2% increase in AP relative to FCOS and a 3.9% increase in
for small-target detection results. To compare the fairness, we try to use the parameters in MS COCO data set, without tuning the anchor parameters.
The AP of two-stage Faster RCNN is lower than that of single-stage RetinaNet, which is the worst because the advantage of two-stage Faster RCNN is the accuracy of location detection, while the more dense anchor setting is adopted in RetinaNet that are more suitable for HRSID with smaller target size on average, so the RetinaNet is 5.2% higher in than in Faster RCNN and 0.6% lower in , which is more accurate.
Evaluation results on SSDD are shown in
Table 6. Our AFE still achieved the best detection effect, and compared with FCOS, AP and
increased by 1.7%. In contrast to the HRSID dataset, AP detected by Faster RCNN was only 0.1% lower than AFE, almost the same as AFE, and 1.6% higher than FCOS. According to the aforementioned analysis of target sizes in SSDD and HRSID, the average size of small targets in SSDD data sets is relatively large, which is more suitable for precise detection of Faster RCNN.
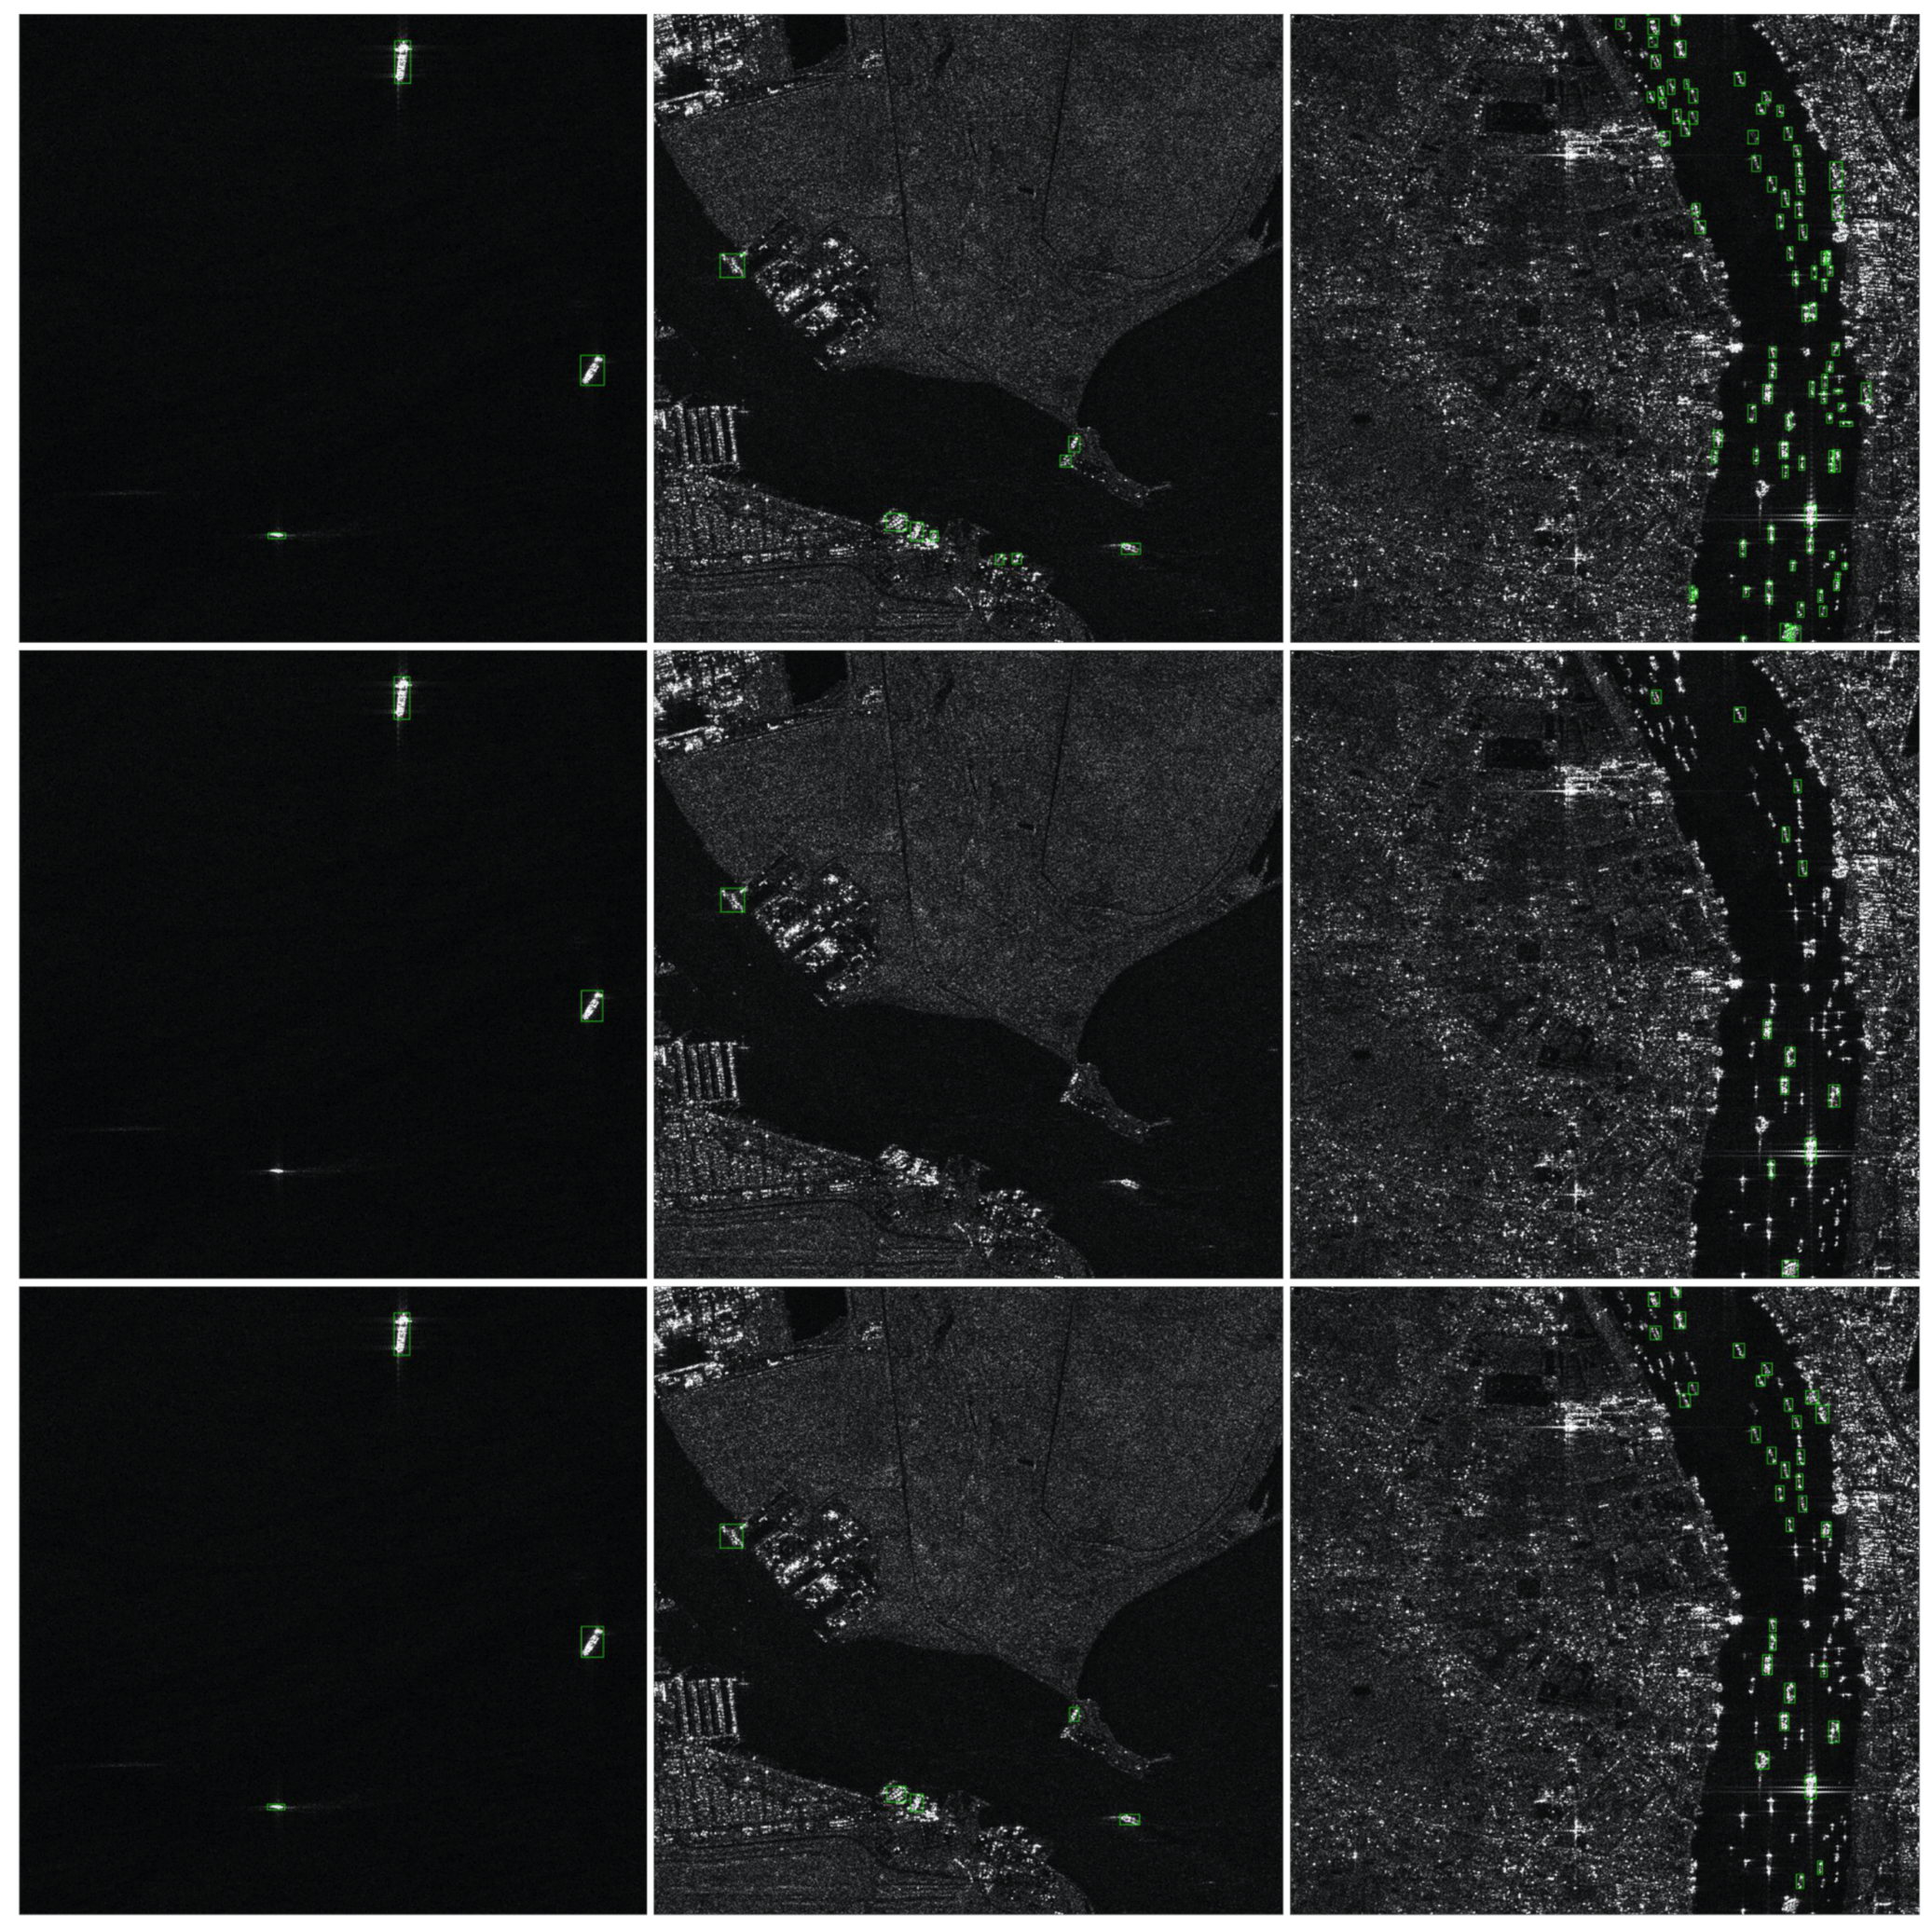
Figure 13 shows the partial visualization results of our proposed AFE on the HRSID dataset. The first line of the figure shows the real annotation of the image, and the second and third lines show the detection results of FCOS and FCOS-AFE respectively. In the first column, FCOS has missed detection of small targets with extreme scales. However, our improved algorithm significantly improves the recall rate of small targets because it adopts a higher-resolution feature graph to construct a feature pyramid. The detection results of the second column show that the method based on adaptive feature encoding has high robustness for small-target detection in complex scenes, and has a good ability to distinguish objects easily confused with ships, such as land-based buildings and docks. The third section is the detection scenario of dense small and weak targets, which further proves the ability of our improved algorithm to detect small targets. The comparison of FCOS-AFE and FCOS detection results proves the effectiveness of our proposed adaptive feature encoding method for small-target detection.
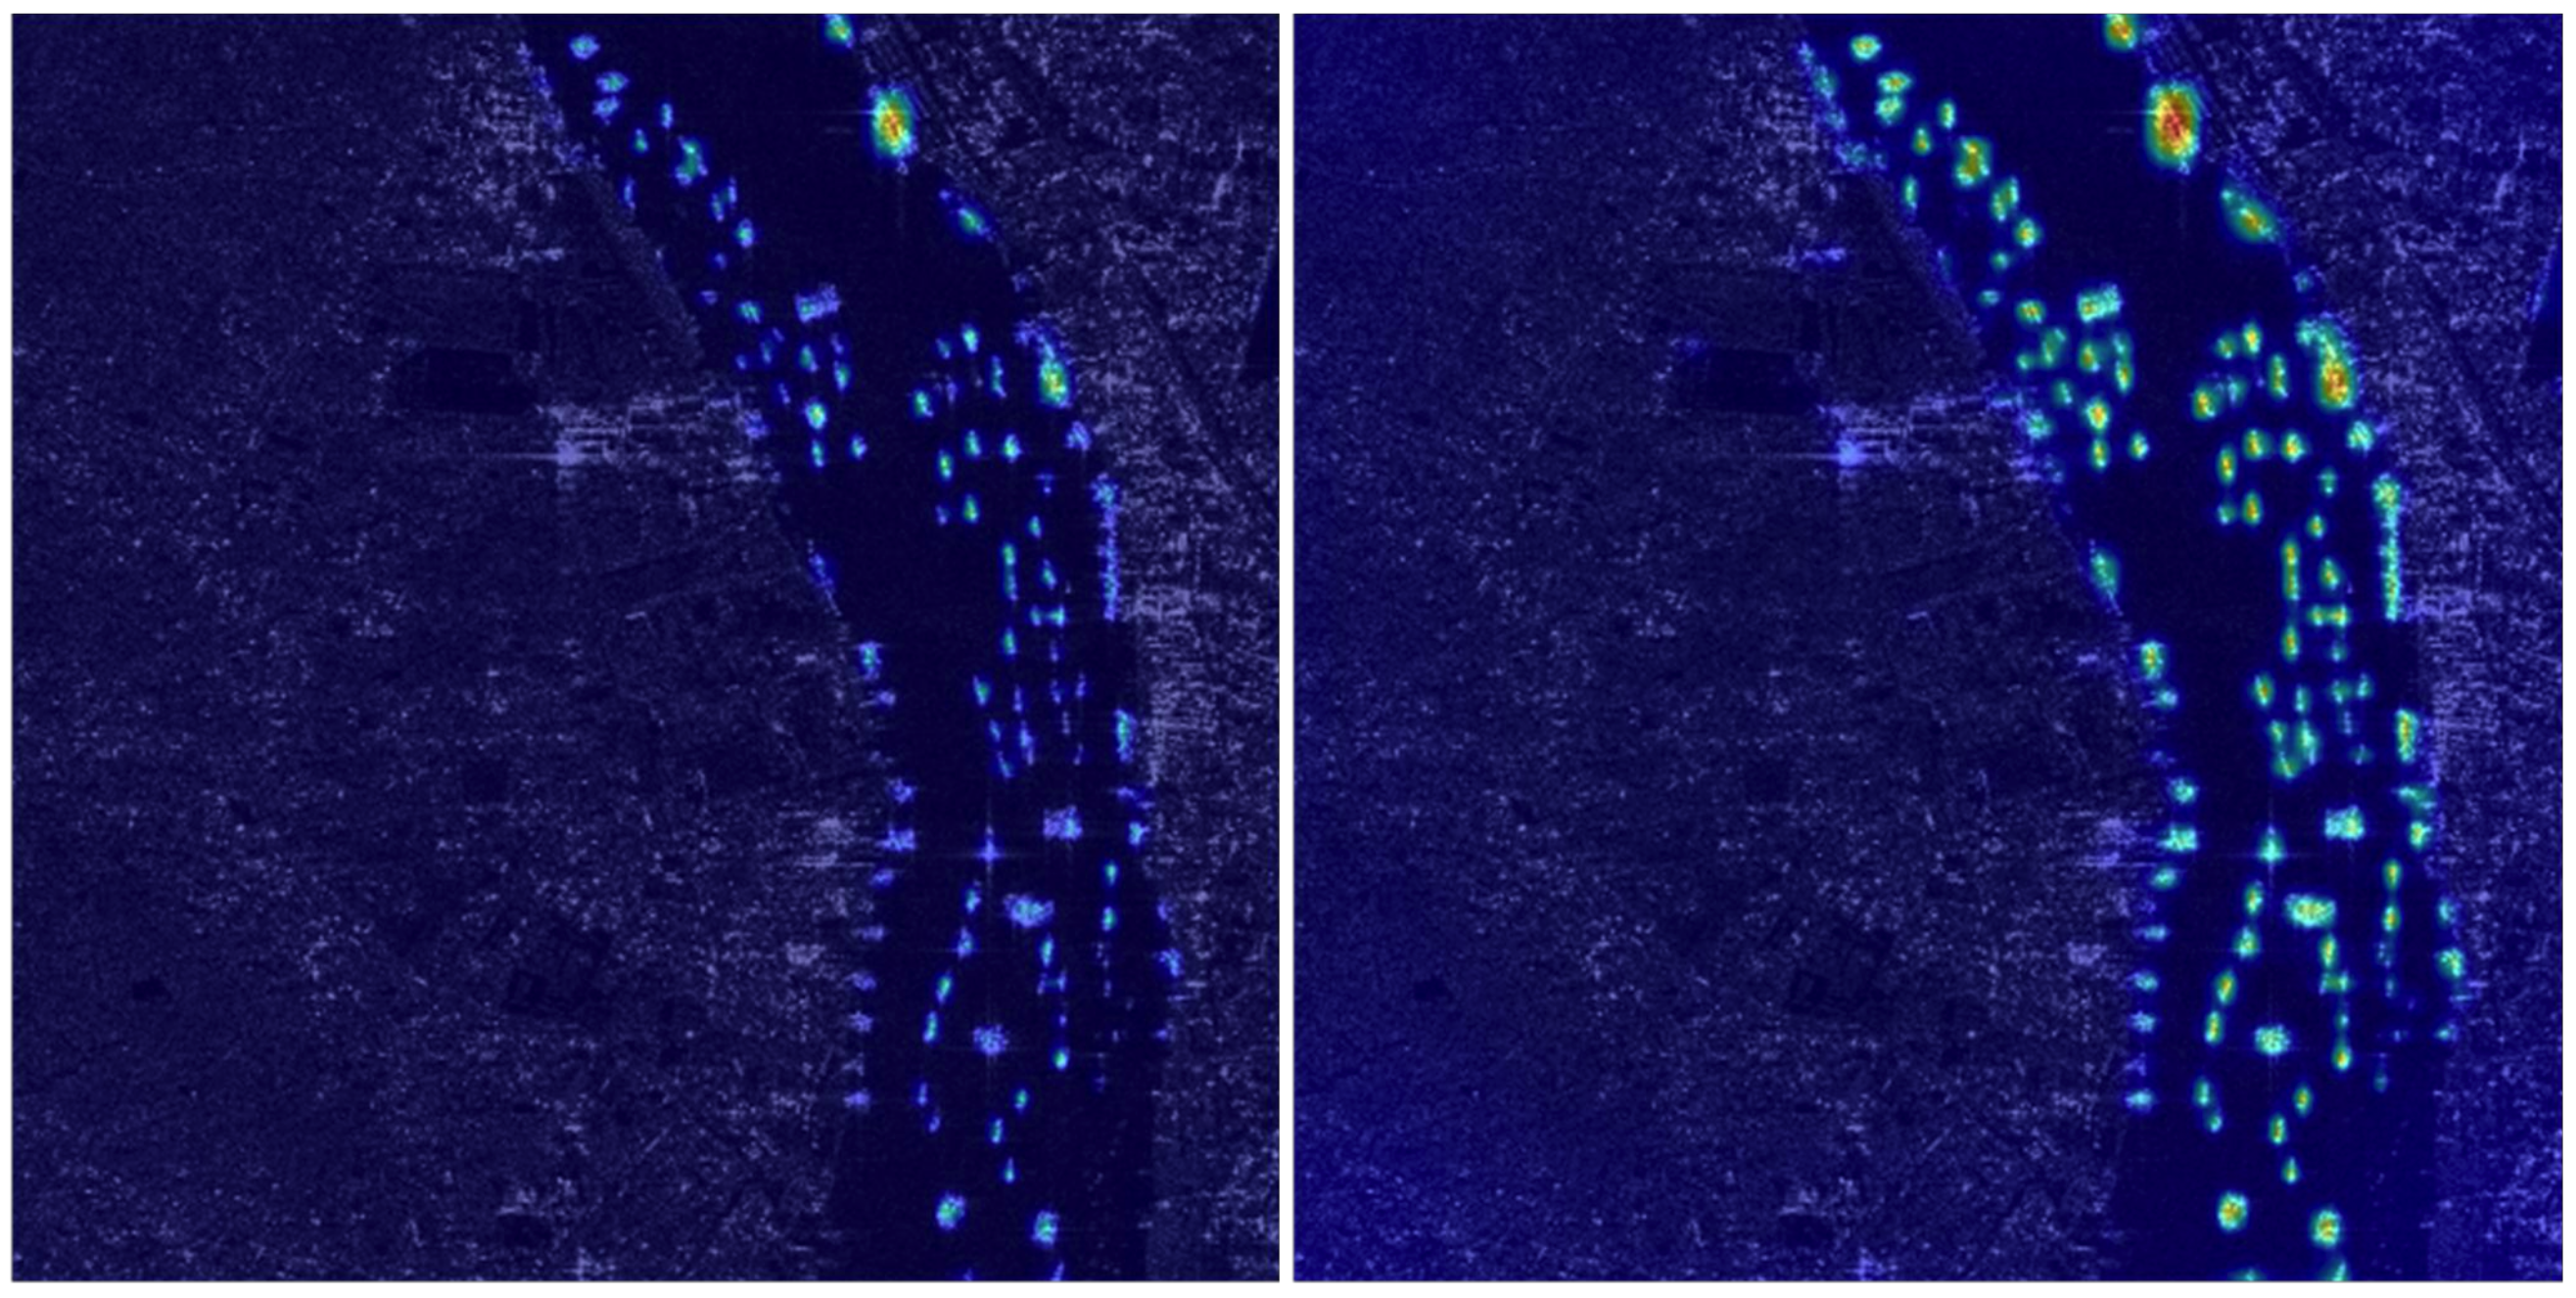
In addition, we also selected
from the feature pyramid and corresponding P2 feature map after feature encoding for visual analysis.
and
are both at the bottom of the feature pyramid and are responsible for detecting small targets with target area less than 32 × 32 pixels. The left side of
Figure 14 is the visualization result of
. On the right is the visualization result of
. It can be seen that
with adaptive feature encoding has a more obvious activation effect on small targets, confirming the effectiveness of AFE.
4.3.2. Experiment Evaluation of Gaussian-Guided Detection Head
This section mainly carries on the quantitative experimental analysis to the sampling optimization method proposed in
Section 3. In addition, the value of the regulator
k of weighted sampling is also investigated experimentally.
To achieve a better detection effect, we conducted an experimental study on the value of the regulating factor
k. The detection results of Gauss-FCOS with weighted sampling in
Table 7 are obtained when
k is set to 1, 2, 3 respectively. It can be seen that, as the value of
k increases, the detection effect
when IoU threshold is 0.5 gradually improves. However,
with a more strict IoU threshold of 0.75 gradually decreases, indicating that with the gradual relaxation of the weight (that is, assuming that the pixel distribution of the target is more dispersed), the recall rate of the algorithm increases, but the location accuracy decreases. As AP and
of all IoU thresholds are mainly used as evaluation indexes,
k is 2 in the preceding experiment.
The evaluation results on the HRSID are shown in
Table 8. The network replacing center-ness in FCOS with Gauss-ness is named Gauss-FCOS, which improved by 0.9% and 1.1% in AP and
, respectively. Although the improvement is not much, its advantage is that it will not cause any burden to the network computation and detection speed. After soft sampling with Gauss-ness weighted sampling strategy (GWS is short for Gauss-ness weighted sampling), the
and
achieved improvements of 1.6% and 1.1%, respectively, and the detected AP and
reached their best results: 63.4% and 66.1%, respectively.
As in
Table 8, after introducing the Gauss-ness branch, SSDD results of Gauss-FCOS on AP and
increased by 1.4% and 1.1%, from 52.1% and 46.3% to 53.5% and 47.4%, respectively. The AP in SSDD is improved greatly. Based on the weighted sampling strategy, AP and
increased to 54.0% and 48.8%, respectively, and increased by 1.9% and 2.5% compared with FCOS. Experiments on SSDD show that, compared with truncation sampling (TS), weighted sampling can distinguish samples of different qualities more effectively, and improve the detection ability of the algorithm.
4.3.3. Ablation Experiment of the Overall Framework
We combined the proposed adaptive feature coding (AFE) with Gaussian-guided detection head (GDH), and constructed a detector suitable for small target detection based on the anchor-free idea. Experiments were conducted on HRSID and SSDD data sets, respectively.
Table 9 shows the ablation analysis of detector on HRSID. After AFE is embedded, AP and
are increased from 62.0% and 63.6% to 66.2% and 67.5%, respectively. Finally, AP and
are increased by 5.4% and 5.3%, respectively, after adding the proposed Gaussian-guided detection head, which verifies the effectiveness of the detector in detection accuracy. By analyzing its detection speed, it can be seen that the decrease of detection speed of our method is mainly caused by AFE, while GWS has almost no influence on its detection speed. Analysis of the reasons for the speed decline caused by AFE is as follows: first, by introducing
, the computation of feature map and positive sampling will be improved; second, the process of adaptive feature encoding increases the process of network.
Table 10 shows the ablation analysis of detector on SSDD. After AFE is embedded, the AP and
are improved from 52.1% and 46.3% to 53.8% and 48.0%, respectively. And with the GDH method, AP increased by 1.9% and
increased by 2.1%, reaching 54.0% and 48.4%, respectively. Combining the two methods results in up to a 4.1% AP boost and a 4.5%
boost. The detector still achieves excellent detection effect on SSDD. Similarly, the decrease of its FPS was mainly caused by AFE, and GDH had almost no effect on it.
Table 9 shows the overall evaluation of the detector on the two dateset. Compared with other detector,
of our method on HRSID improved from 87.3% to 92.0% and
improved from 63.6% to 68.9%. By comparing the prediction speed of these algorithms, we can see that FCOS has the highest frame number, reaching 18.9, while the frame number of our proposed detector drops obviously to only 15.2, which is also the biggest defect of our proposed algorithm.
As for SSDD dataset, our method achieves the best performance in all indicators, in which improves by 2.7%, from 93.8% to 96.5%, and improves by 4.5%, from 46.3% to 50.8%. However, the frame number of the detector also produces a drop on SSDD, which is only 28.5.
4.3.4. Comparison of Performance between the Proposed Overall Framework and the State-of-the-Art
In this section, the proposed detection framework is compared to several other detectors. Our method outperforms all other comparison methods on these data sets.
First, we conduct experiments to compare the performance with the commonly used two-parameter CFAR detector. The quantitative detection results are shown in
Table 11. Traditional CFAR typically does not use
to measure accuracy, so precision and recall are used to evaluate performance. Furthermore, CFAR typically runs on the CPU, while modern CNN-based approaches always run on the GPU. To ensure a reasonable comparison, we chose CPU time for speed comparison (
). It can be seen from
Table 11 that our method is much better than CFAR in detection precision, which is nearly 30% higher than CFAR. The difference in recall is not so obvious, and the recall of our method is 13.26% higher than CFAR. It can be explained that the traditional CFAR algorithm cannot adapt to complex scenes and small targets, and many false alarms are detected, resulting in a significant decrease in precision. In terms of detection speed, our method is also much better than CFAR. In other words, the running time of our method on CPU is 0.356 s, which is far less than that of CFAR.
The comparison CNN-based methods in the experiments can be divided into two categories, namely anchor-based methods, such as YOLOv3-tiny, YOLOV3, RetinaNet, Faster R-CNN, Cascade R-CNN, Mask-RCNN, and anchor-free methods such as CornerNet and FCOS. Moreover, two SAR ship detection methods, DCMSNN and FBR-Net, are compared with our proposed detector. Note that some of these methods employ different backbones than our method, and the experimental settings on training of them are taken from the original articles. As shown in
Table 12, the anchor-free method FCOS achieves a leading performance among all the compared methods. Our method used to improve FCOS achieves the best performance, demonstrating the effectiveness of the method for ship detection in remote sensing images. Furthermore, thanks to the complementary effect of the proposed components, the
of our method is 5.3% higher than that of the FCOS method. It can be seen from the experiments on SSDD that the method proposed in this paper achieves an AP value of 96.5% and shows the best performance. In particular, our method significantly outperforms the baseline methods. Furthermore, the experimental results on these two datasets further demonstrate the robustness of our method in adapting to different datasets. Although the method proposed in this paper has outstanding performance on small targets, it also has the ability to detect medium and large targets (scale > 64 × 64 & scale > 128 × 128).
Table 12 shows that
is also improved while
increases, which proves that the network does not lose the ability to detect larger-scale targets.
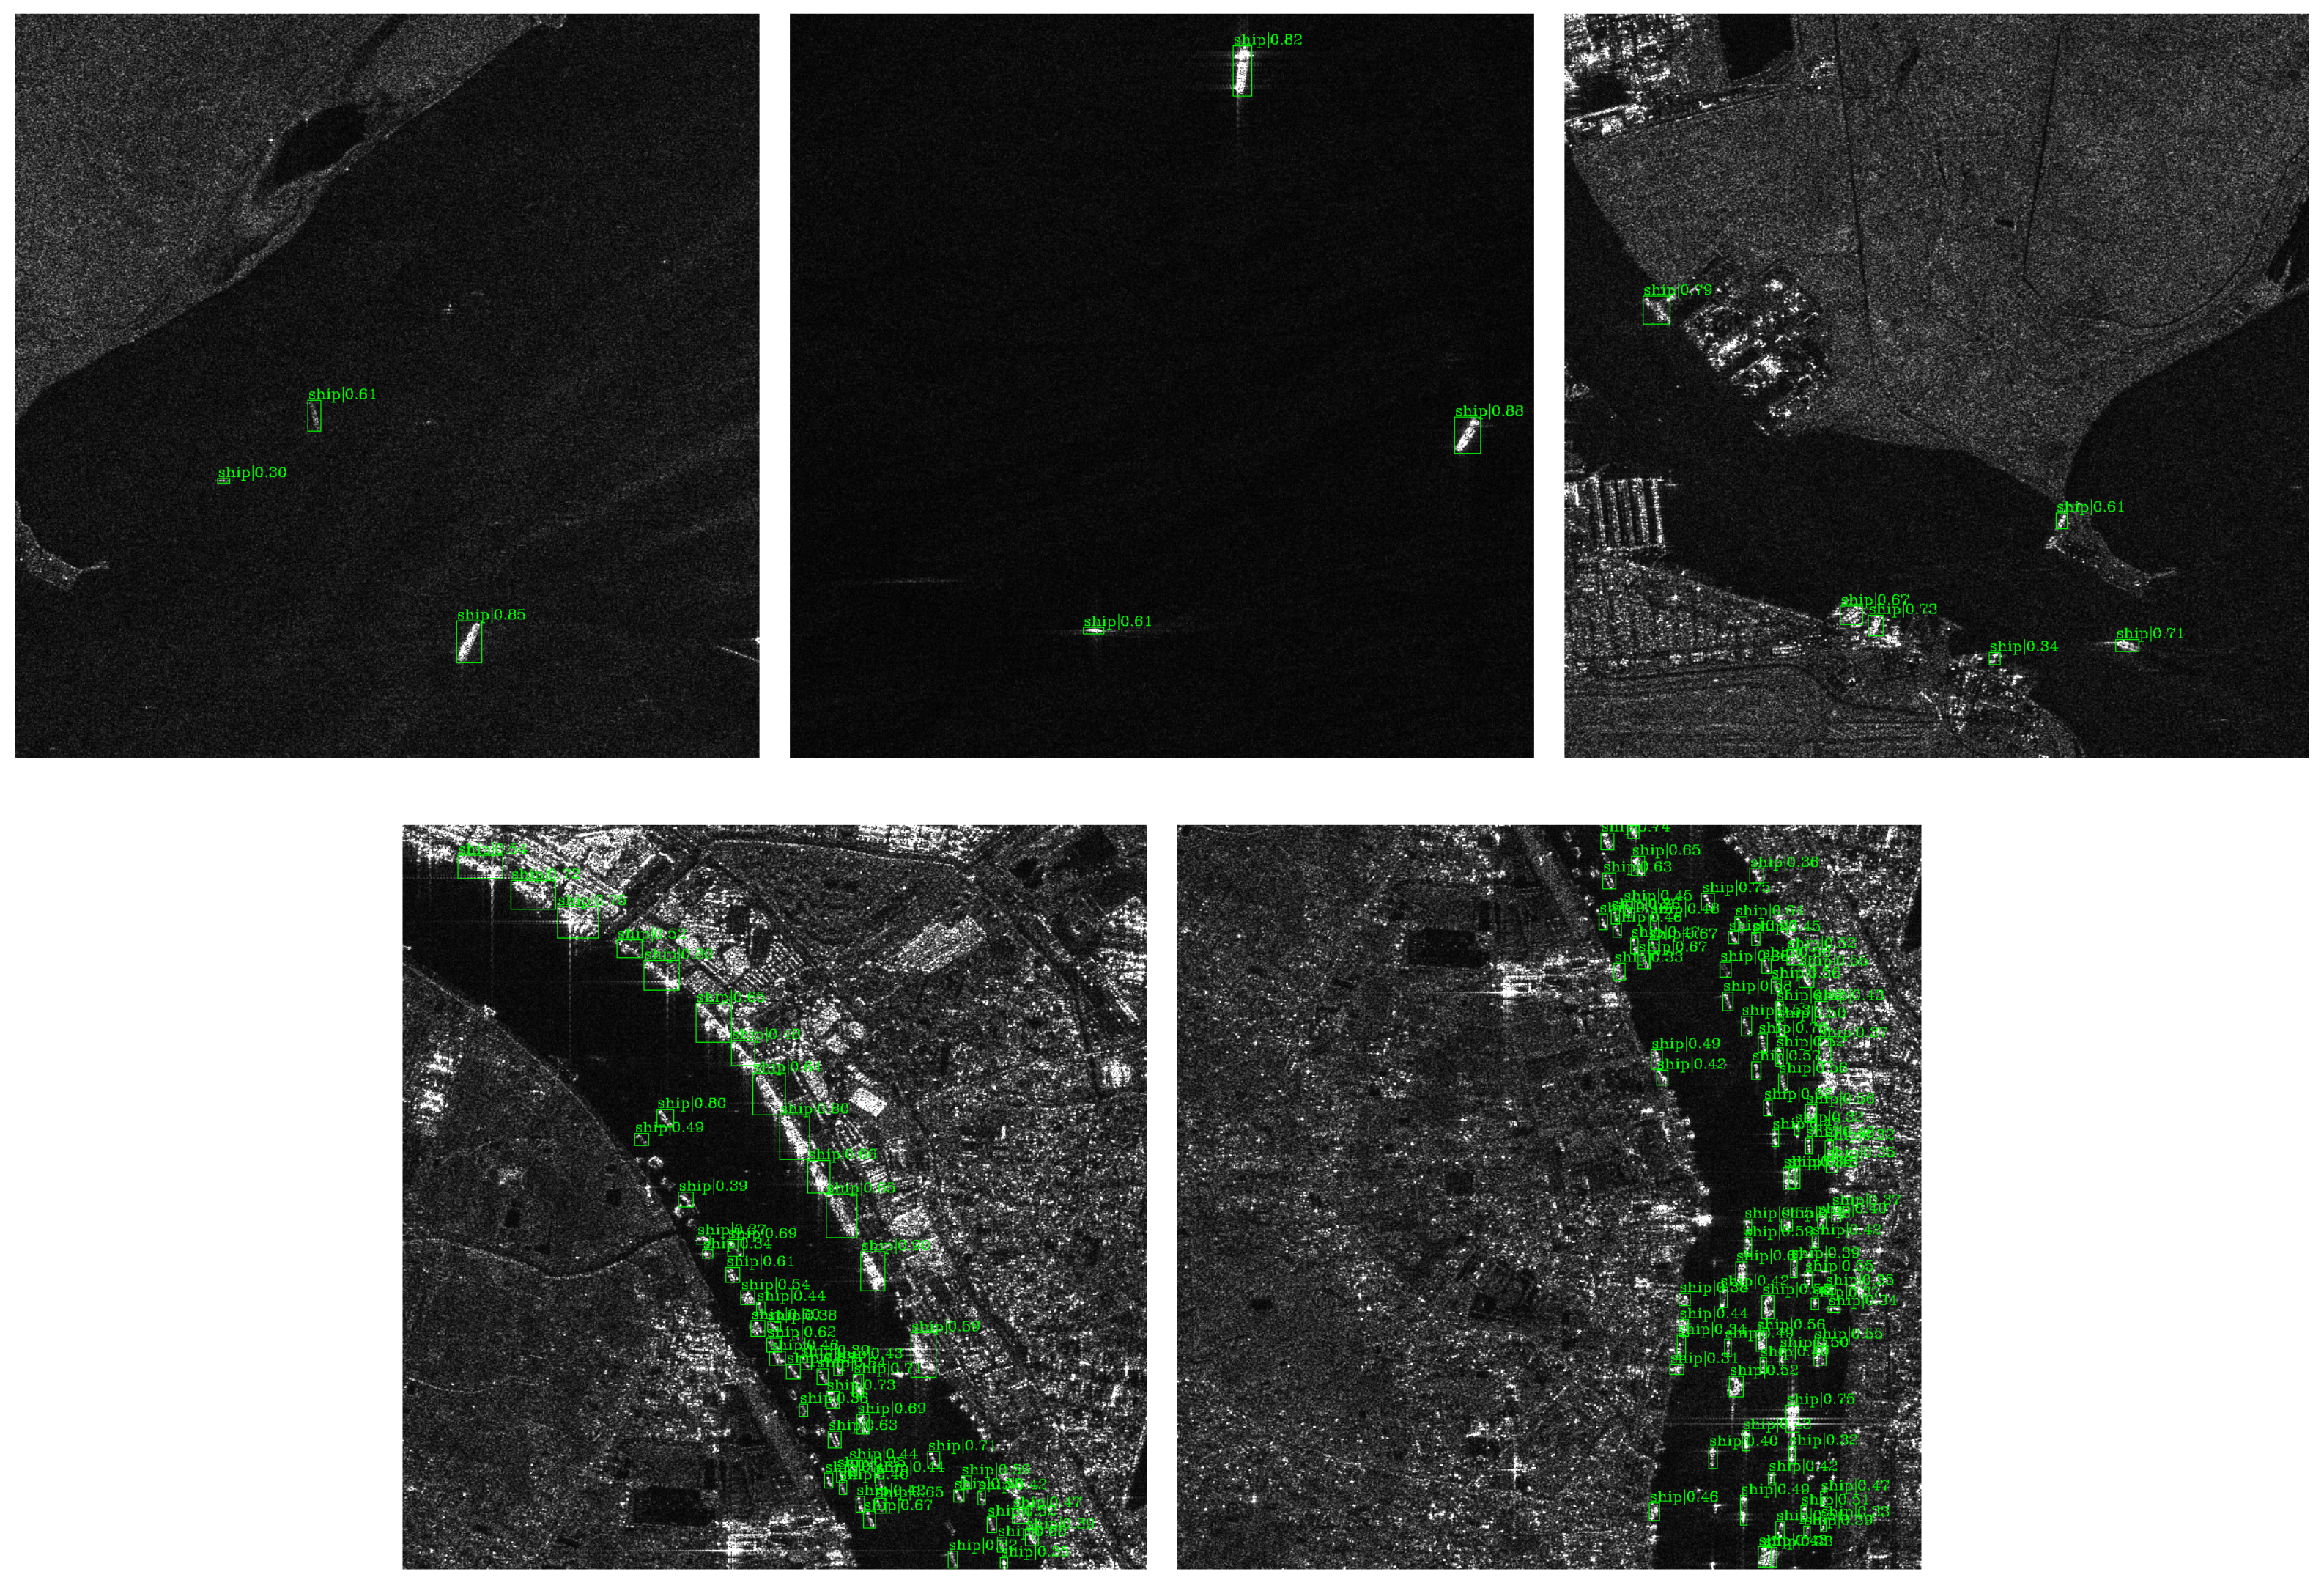
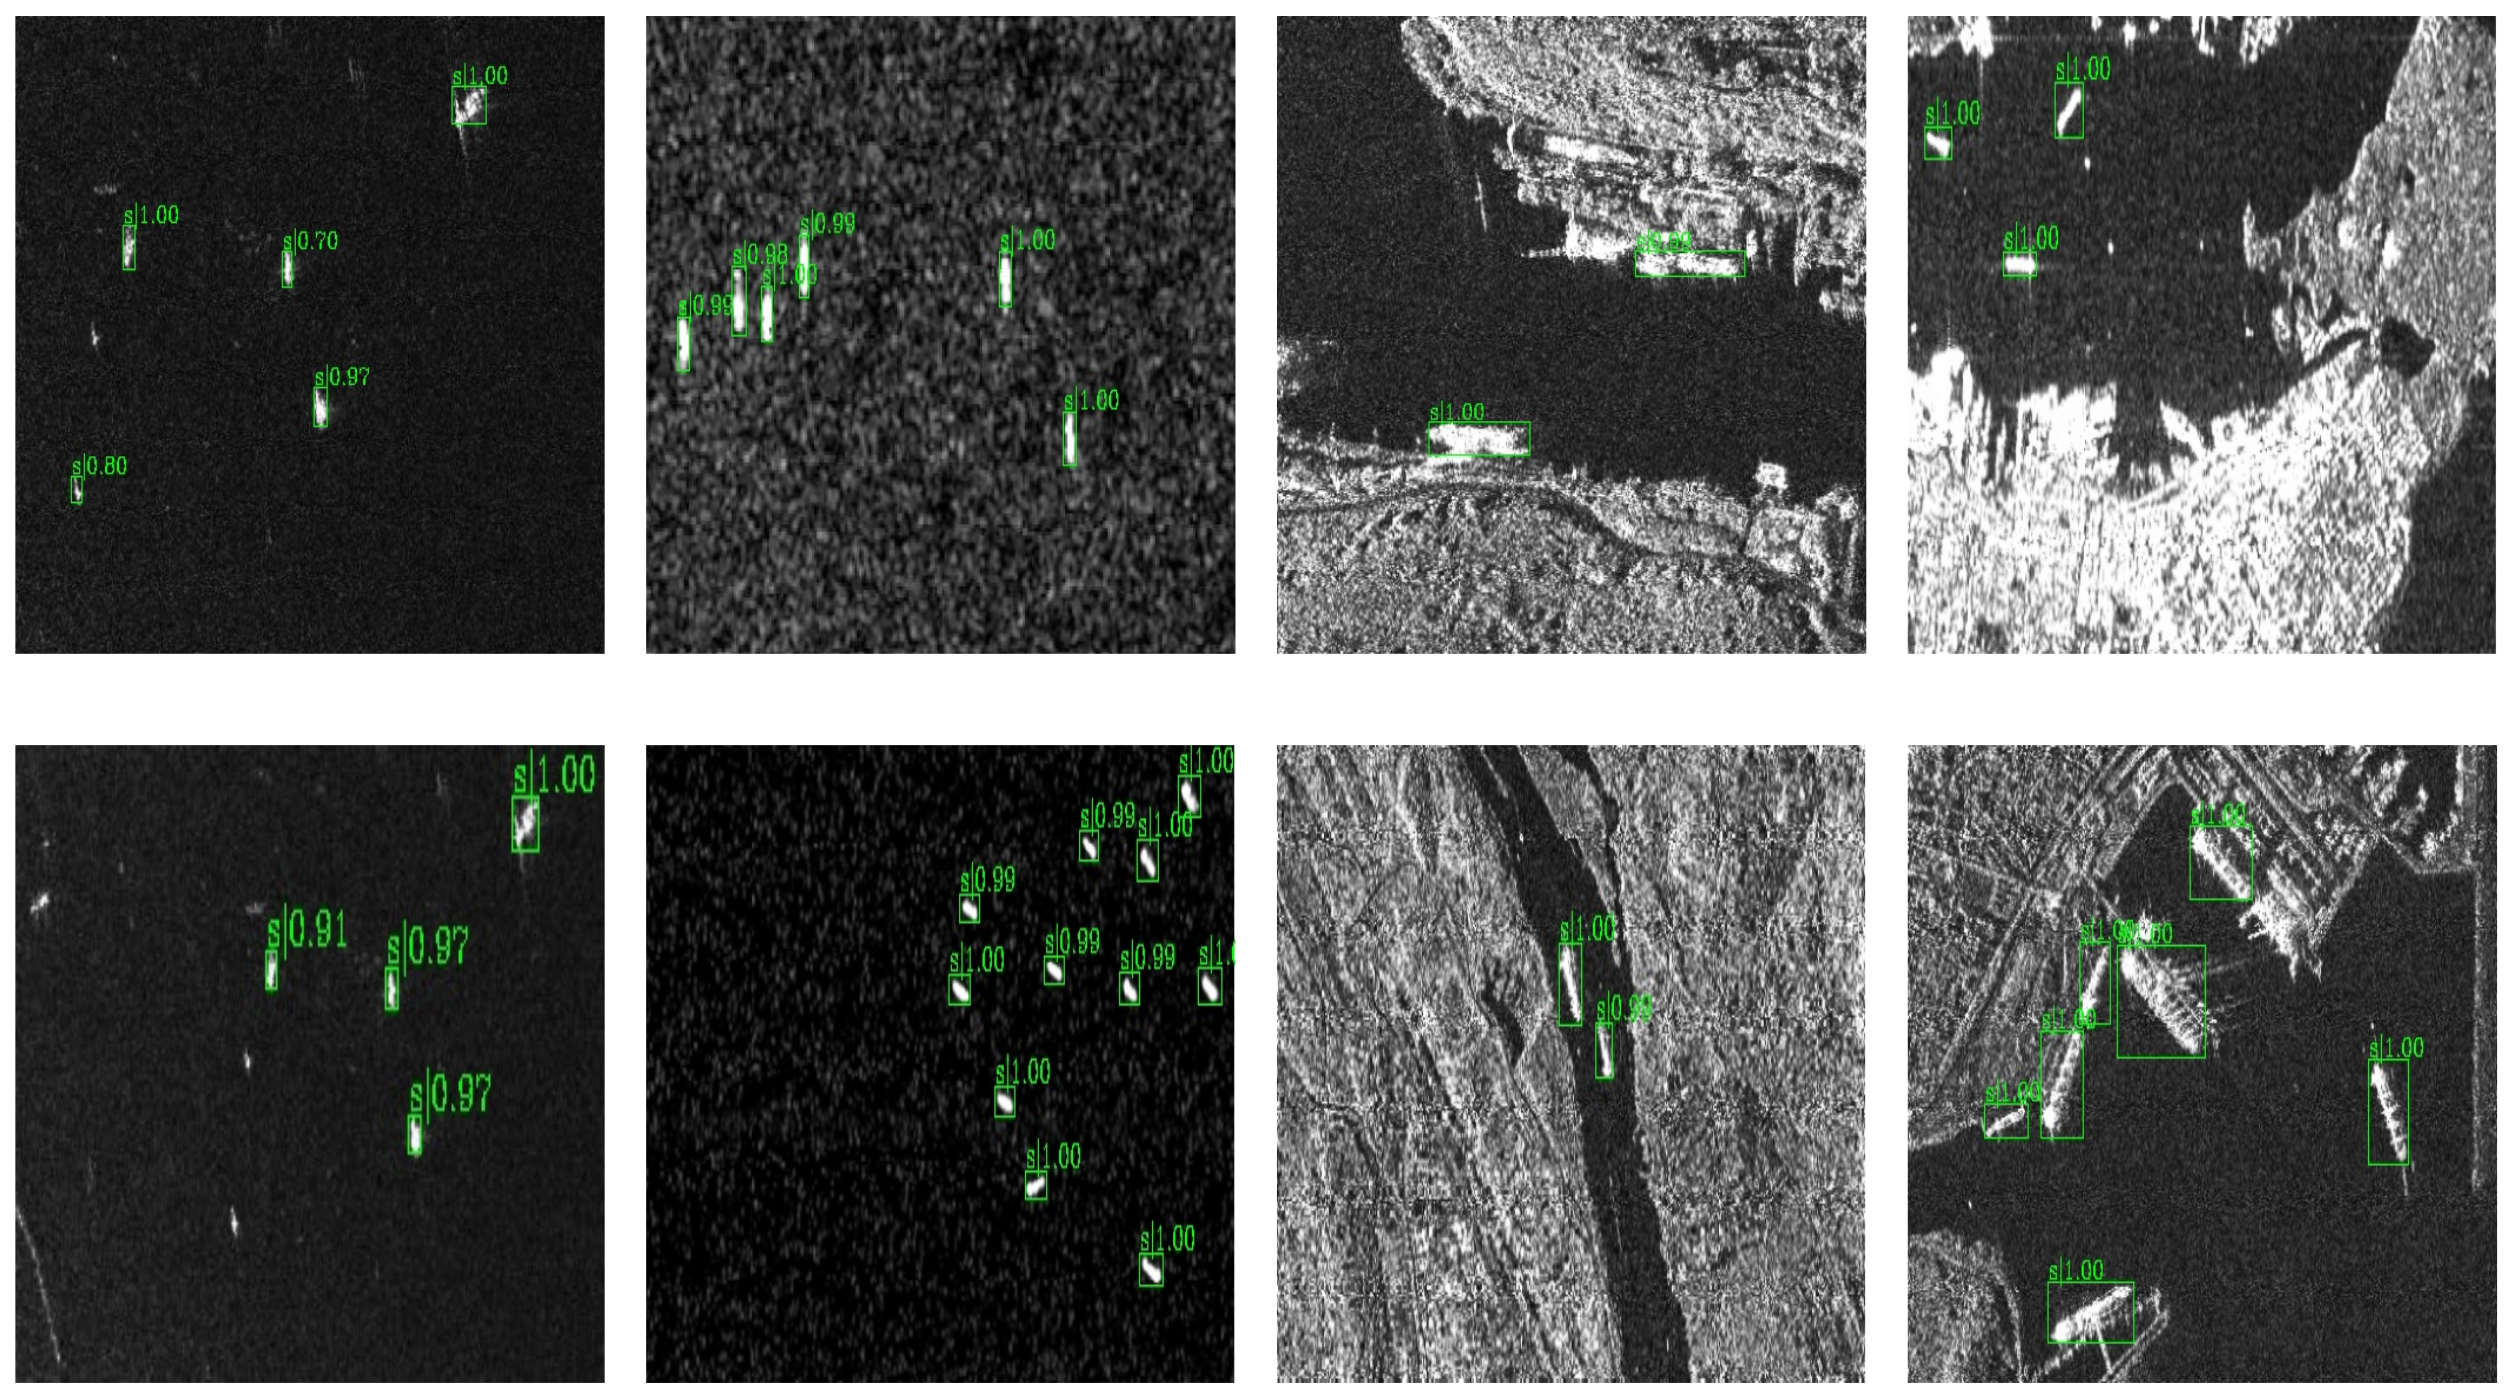
To demonstrate the advantages of our method over previous methods, we show some visual results.
Figure 15 and
Figure 16 are the detection results of the overall detection framework on the two datasets, respectively. The numbers above the detected bounding boxes in the figure represent the confidence of it, the confidence of the detected boxes is high as can be seen in the figure. For the densely distributed ships in HRSID and the near-shore ships in SSDD, our method can achieve good results, indicating that our network has strong robustness to different scenes, and the quality of detected boxes is higher.
It is worth mentioning that our method still has deficiencies in some aspects. Specifically, AFE will lead to a certain decrease in detection speed. The comparison results of speed and accuracy are shown in
Table 9 and
Table 10. Note that NMS post-processing is included at runtime for each image. The results in the table show that after adding the AFM module, the test speed will drop by about 20%. This drop is mainly due to the increase in operations caused by feature fusion. This problem is a focus of follow-up work.


