Article

Remote Sensing Products Validated by Flux Tower Data in Amazon Rain Forest

by
Victor Hugo da Motta Paca
1,*,
Gonzalo E. Espinoza-Dávalos
2,
Rodrigo da Silva
3,
Raphael Tapajós
3 and
Avner Brasileiro dos Santos Gaspar
3
1
Geological Survey of Brazil (CPRM), Belém 66095-904, PA, Brazil
2
Environmental Systems Research Institute (ESRI), Redlands, CA 92373, USA
3
Faculdade de Geociências, Universidade Federal do Oeste do Pará (UFOPA), Santarém 68040-470, PA, Brazil
*
Author to whom correspondence should be addressed.
Remote Sens. 2022, 14(5), 1259; https://doi.org/10.3390/rs14051259
Submission received: 13 January 2022 / Revised: 24 February 2022 / Accepted: 25 February 2022 / Published: 4 March 2022
(This article belongs to the Special Issue Estimating Meteorological Variables by Remote Sensing Data)

Abstract

:
This work compares methods of climate measurements, such as those used to measure evapotranspiration, precipitation, net radiation, and temperature. The satellite products used were compared and evaluated against flux tower data. Evapotranspiration was validated against the SSEBop monthly and GLEAM daily and monthly products, respectively, and the results were RMSE = 24.144 mm/month, NRMSE = 0.223, r2 = 0.163, slope = 0.411; RMSE = 1.781 mm/day, NRMSE = 0.599, r2 = 0.000, slope = 0.006; RMSE = 36.17 mm/month, NRMSE = 0.401, r2 = 0.002, and slope = 0.026. Precipitation was compared with the CHIRPS data, K67 was not part of the CHIRPS station correction. The results for both the daily and monthly comparisons were RMSE = 18.777 mm/day, NRMSE = 1.027, r2 = 0.086, slope = 0.238 and RMSE = 130.713 mm/month, NRMSE = 0.706, r2 = 0.402, and slope = 0.818. The net radiation validated monthly with CERES was RMSE = 75.357 W/m2, NRMSE = 0.383, r2 = 0.422, and slope = 0.867. The temperature results, as compared to MOD11C3, were RMSE = 2.829 °C, NRMSE = 0.116, r2 = 0.153, and slope = 0.580. Comparisons between the remote sensing products and validation against the ground data were performed on a monthly basis. GLEAM and CHIRPS daily were the data sets with considerable discrepancy.

1. Introduction

The Amazon River Basin is one of the world’s unique ecosystems (~6,000,000 km2) [1]. Since the 1960s and 1970s, this ecosystem has faced increasing challenges of deforestation, large dam projects, and roads, which create settlements that expand logging [2,3,4,5]. Recently, as alerted by Gomes et al. (2019) [6], climate change has also played a role in deforestation.
The Amazon’s climate is influenced by four major driving forces: El Niño/La Niña, the Intertropical Convergence Zone, the temperature of the Atlantic, and the winds that transport air moisture until they encounter a barrier in Andes. The forest recycles the air moisture transported by the winds. The driving force of the whole system is the incoming net radiation. Evapotranspiration in humid and tropical areas can account for almost 50% of the hydrological cycle due to the high incoming net radiation [5,6].
The Amazon River Basin plays a major role in South America’s weather and climate. The air moisture reaches the south-east and central-west of Brazil, Paraguay, and Argentina. Advances in evapotranspiration (ET) estimation by remote sensing have refined the knowledge of the water balance in the region [7].
Flux towers measure carbon fluxes, methane, precipitation, water vapor, and other components. Evapotranspiration is computed from the latent heat flux estimate. However, flux towers can be considered single points with an area of influence ranging from tens to hundreds of meters. In contrast, remote sensing products cover larger areas, displaying spatial variation throughout the landscape, and more homogeneous results. In this research, we validated and carried out an inter-comparison between the main components of the water and energy balance from remote sensing products and flux tower measurements. The flux tower measurements were considered the ground truth in this study. Remote sensing products can be used to provide insightful results for continuous areas and check for possible problems in the flux tower measurements.
Despite the scientific community’s interest in analyzing and studying the Amazon region, long-term studies and measurement networks are difficult to implement and maintain due to the extensive distances between places, and scarce means of transportation. The existing roads become muddy during the rainy season, and it is very difficult to travel by these roads during a period of 4 to 6 months [7,8] each year. Travelling by rivers or small aircrafts is preferred, but this adds complexity to the establishment of long-term studies or measurement networks.
Actual evapotranspiration (ET) is important for estimations of the water balance (Equation (1)) in the Amazon region. ET also plays a large role for crops and forested areas [9,10]. ET is estimated as the residual of the energy balance (Equation (2)) by converting the latent heat flux (Equation (3)).
P = ET + Q + Δ S
Rn =   λ E + H + G
In Equation (1), the components of the water balance are precipitation (P), evapotranspiration (ET), discharge (Q), and water storage (∆S). In Equation (2), the energy balance components are net radiation (Rn), latent heat flux (λE) proportional to ET as in Equation (3), sensible heat flux (H), and soil heat flux (G).
ET is one of the main components of the water balance. The estimation of ET in continuous surfaces is necessary to understand continental hydrology, especially because the output of water from the basin as ET is larger than the output as discharge (Q). ET has been traditionally measured in the Amazon region for a few points in irrigation projects in the states of Mato Grosso, Rondônia, and Pará in the Brazilian Legal Amazon using class A evaporimetric pans (potential ET), lysimeters, and from in situ meteorological stations [11,12]. Flux towers have advantages over these traditional methods, with multi-parameters that measure various hydrological components, carbon fluxes, and meteorological parameters. Nevertheless, a flux tower is only representative of a single point with a limited area of influence dictated by wind direction, fetch, and type of land cover. The validation of satellite products by the measurements of the flux towers in different locations is essential for the expansion of ET measurements to global areas covered by satellites [13,14,15].
The installation of flux towers in the Amazon from The Large-Scale Biosphere–Atmosphere Experiment in Amazonia (LBA) [16] propelled the understanding of the different variables used to calculated ET by empirical formulas [17,18]. Although stations K77 and K83 were dismantled in December 2005 and March 2004, respectively, their records provide insightful information of the hydrological fluxes, especially in untouched primary forest. The flux tower K67 [19,20,21] is located in a primary forest. There are not many sites around the globe with a flux tower with a considerable time record, related to the same operation provided by the satellite products.
Cohen [14] used the Moderate Resolution Imaging Spectrometer (MODIS) to validate the flux tower footprint, linking in situ measurements with satellite products and realizing the potential of the instrumentation and validation. Baldocchi [21] had already stated that, depending on the canopy, land cover, and vegetation, the footprint of a flux tower could range between 1 km and 2.5 km but was usually 1 km. This is representative, but on a very small scale.
Nagler [22] estimated the ET using Enhanced Vegetation Index (EVI) from MODIS, Bowen ratio flux towers, and data from eddy covariance. The study obtained a reasonable correlation between the flux towers sites and the method used.
In addition to these previous studies, recently, the likelihood of obtaining ET has increased. After a previous study, when six remote sensing products were used, an ensemble product was formed: ET-Amazon [23]. Some of the products are not in current use anymore or are no longer available. Instead, we opted to use a single product that had a very good performance in the Amazon River Basin and in Brazil in general [24]. We used Operational Simplified Surface Energy Balance (SSEBop) [25] with a monthly resolution and 0.01° (~1 km).
ET relies on the energy balance. Variables such as net radiation and temperature are useful to analyze ET. The health of the vegetation shows in other variables that it can also be measured with remote sensing, such as by using the Leaf Area Index (LAI) [26,27]. The LAI is defined as the projected area of leaves over a unit of land (m2 m−2). The analysis of the LAI for the area is based upon the index level for the forest region. This determines the type of trees, vegetation, and land use in a conservation unity area.
The main objective of this research was to evaluate, validate, and compare the in situ data provided by the flux tower station K67 against remote sensing products.

2. Material and Methods

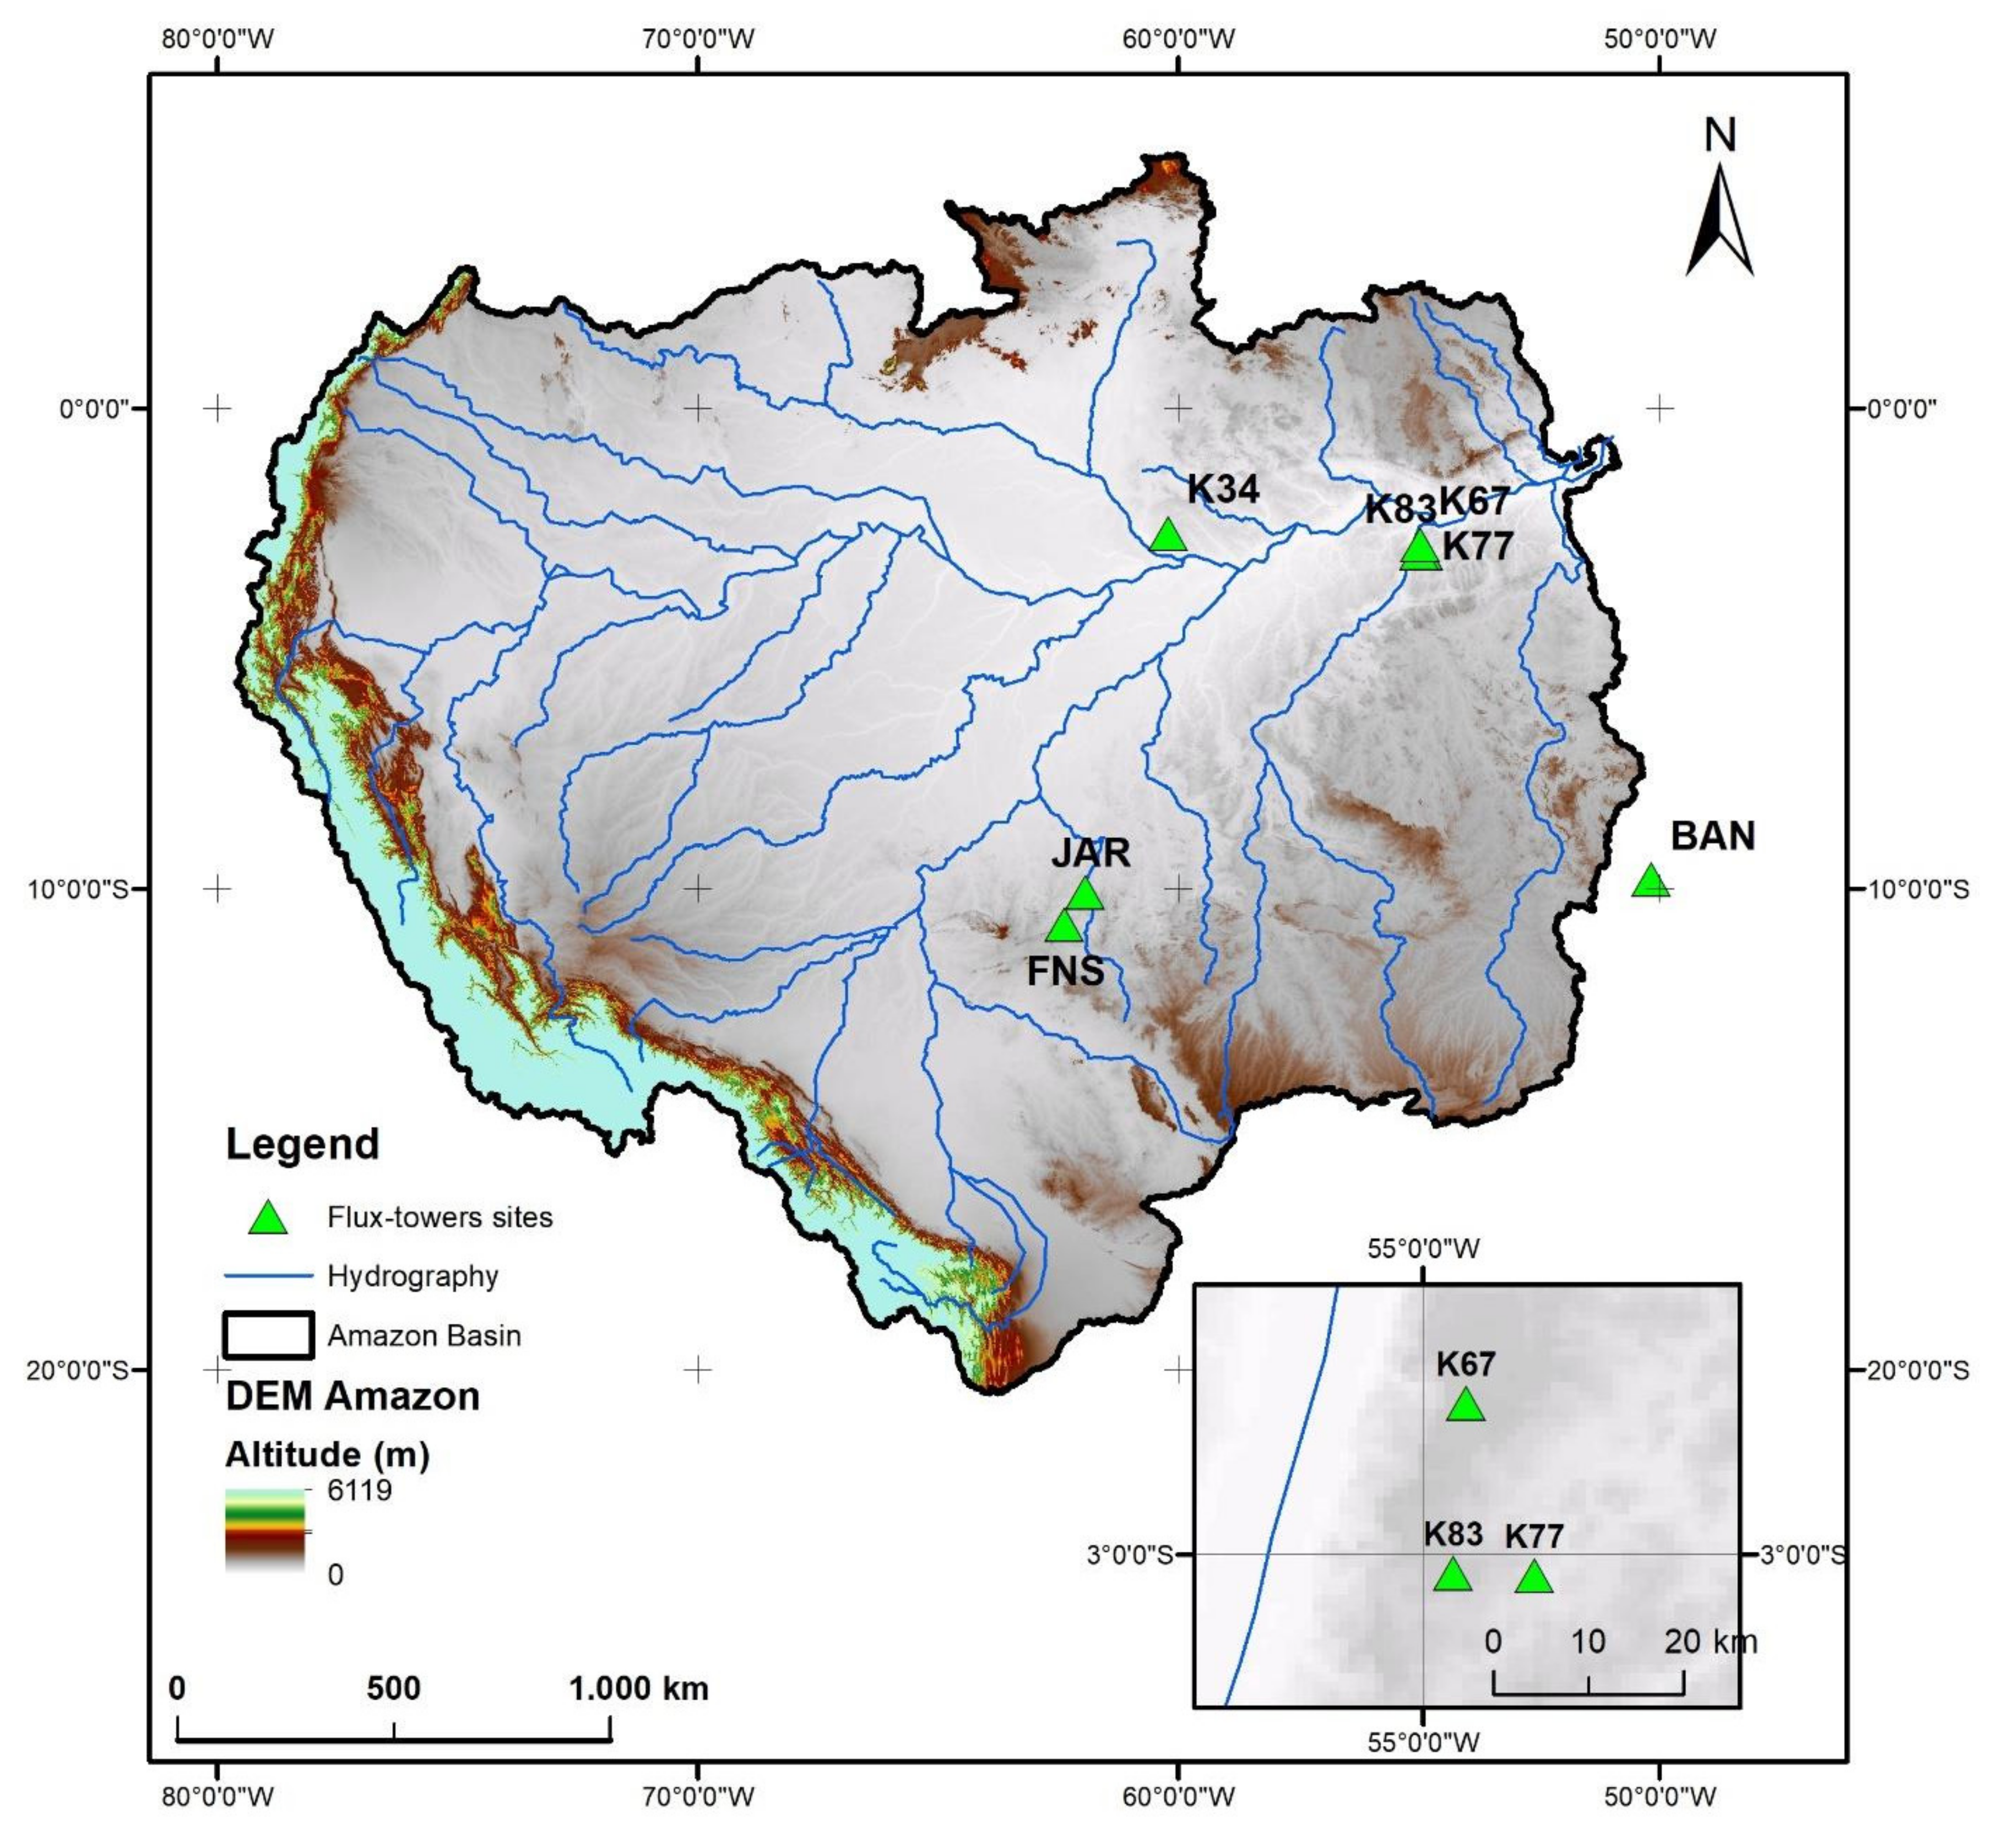
2.1. Description of the Area

The ET measurements were obtained directly from the K67 flux tower, which has eddy covariance system measurements. The site is located in Tapajós National Forest (Flona Tapajós). The K67 station is still in operation. Close to the K67 flux tower, there were two sites that had been dismantled: K77 and K83 (Figure 1). The stations are located near the confluence of the mouth of the Tapajós and Amazon Rivers.
The K67 data record (Table 1) for the analysis was from 2002 to 2019. The data obtained were ET, net radiation, temperature, and precipitation. To obtain the ET, we used Equation (3) to convert latent heat flux (λE) into ET.
ET = λ E λ ρ ω
where λ (MJ/kg) is the latent heat of vaporization (2.45 MJ/kg at 25 °C) and ρω (kg/m3) is the density of water; the values of λE flux densities (W/m2) were converted into ET rates (depth per unit time) [28].

2.2. Description of the Flux Tower

The K67 experimental site is located in the Tapajós National Forest (54°58′W, 2°51′S) in the Municipality of Belterra, PA, Brazil; a summary of the flux tower in shown in Table 1. This site is part of the Large-Scale Biosphere–Atmosphere Program in the Amazon (LBA Program) conducted in Brazil. A 64 m tower was installed and instrumented at the site, located approximately 7 km west of the BR-163 highway and 7 km east of the Tapajós River in an area of continuous forest that extends for dozens of kilometers to the north and south. This tower has been in operation since 2002 and monitors energy and mass exchanges between the forest and the lower atmosphere [29].
Around the tower, in a radius of approximately 3 km (Figure 2), the forest is on flat ground and has a closed canopy with an average height of approximately 40–45 m and emerging trees that reach up to 60 m. This area can be considered to be primary forest with an uneven age distribution, large trees, and numerous and emergent epiphytes [30].
According to [31], the soils under the K67 site are predominantly nutrient-poor oxisols with sandy clayey lens, with both low organic content and cation exchange capacity.
The tower at the K67 site was instrumented with sensors and equipment to perform eddy covariance (EC) measurements at different heights [32], as well as wind, temperature, water vapor, and CO2 profile measurements. The tower began its measurement operation in April 2001 and has been in operation until present (2021). In these 20 years of operation, there have been some interruptions in the measurements caused by falling trees and lightening.
EC measurements were taken at a height of 57.8 m with a sampling rate of 8 Hz. A 3-axis sonic anemometer (CSAT-3, Campbell Scientific, Logan, UT, USA) was mounted with the air sample inlet located 20 cm from the anemometer. The EC system extracts the air samples through a 9.5 mm (inner diameter) Teflon PFA tubing to a closed path infrared gas analyzer (IRGA, LI-6262, Licor, Lincoln, NE, USA).
The complete detail of the instrumentation installed in the tower as well as the processing of measured data are described in Hutyra et al. (2007).
The K67 flux tower site is influenced by the climatological and land-surface conditions of its immediate surroundings. The K67 is one of the remaining sites from the LBA project still in current operation. The site also has the following characteristics: elevation (m), 88; Vegetation IGBP (International Geosphere–Biosphere Programme); EBF (Evergreen Broadleaf Forests); and lands dominated by woody vegetation with a percent cover of >60% and height exceeding 2 m. Almost all trees and shrubs remain green year-round, with forest covering much of the highlands region. Canopy is never without green foliage. Koeppen climate classification: Am (tropical monsoon); mean annual temp (°C): 26.13; mean annual precipitation: 2074.7 mm [33].

2.3. The Eddy Covariance (EC) System

According to Saleska [33], “the eddy fluxes of CO2 and H2O are measured at two levels (58 m and 47 m) using tower-mounted closed-path Licor 6262 analyzers and Campbell CSAT3 sonic anemometers. A third Licor gas analyzer measures (a) the CO2/H2O concentration profile (1 of 8 levels every 2 min) and (b) the instantaneous integrated canopy storage of CO2/H2O, using a design pulling air simultaneously through 8 inlets (once every 20 min). Comprehensive meteorological data (air temperature, PAR, net radiation) are also included. Pressure and temperature of the Licor cells are controlled to 500 torr and 48 degrees C. Eddy licors are automatically zeroed every 2 h, and the profile licor every 20 min. All Licors are automatically calibrated with span gases (at 325, 400, and 475 ppm) every 6 h”.
To measure evapotranspiration (ET), the Eddy Covariance Method (ECM) was used to measure mass and energy exchanges between the ecosystem and atmosphere [34,35]. ECM uses decomposition [36] of high-frequency sensor measurements of the vertical component of wind and a scalar such as carbon dioxide, water, or temperature. The water mass flow is determined by the correlation between the high frequency temporal deviations of the vertical wind speed (w′) and the scalar concentration (ρ′), as shown in Equations (3)–(5):
F = w ρ ¯
Through the ECM, we can determine the ET evapotranspiration values through the latent heat flux (LE):
LE = ρ w   λ w q ¯
where λ (MJ/kg) is the latent heat of vaporization (2.45 MJ/kg at 25 °C), ρw (kg/m3) is the density of water, and q’ is the water concentration fluctuation in (kg/kg), and the values of the LE flux densities (W/m2) were converted into ET rates (millimeters per unit time) [28].

2.4. Remote Sensing Products

The remote sensing products are described in Table 2, where each product is shown with its main components: resolution, spatial and temporal resolution, and the producer.
For precipitation measurements, we opted to use Climate Hazards Group InfraRed Precipitation with Stations (CHIRPS) [37] due to its resolution 0.05° (~5 km). We chose CHIRPS due to its resolution, and this flux tower was not part of the stations used in this product. CHIRPS has also been used in many parts of the world with good results and correlation compared to other similar products. As a state-of-the-art precipitation product, many authors have used CHIRPS in their research, such as that conducted by Paredes Trejo et al. (2016) in Venezuela [38] and the north east of Brazil [39]; Toté et al. (2015) [40] in Africa; Bai et al. (2018) in China [41], in areas where the measurements are sparse or scarce (Le et al., 2017) [42], Luo et al., (2019) [43]; and Funk (2007) [44], who focused mainly on Africa.
The SSEBop model is implemented using five underlying remote sensing products or global models: (1) the NDVI (Normalized Difference Vegetation Index), (2) SRTM (Shuttle Radar Topography Mission), (3) PRISM (Parameter-elevation Regressions on Independent Slopes Model), (4) MODIS (Moderate Resolution Imaging Spectroradiometer), and (5) GDAS (Global Data Assimilation System). The output from SSEBop is available at: https://earlywarning.usgs.gov/fews/product/460 (accessed on 1 February 2022).
The GLEAM is produced by Vrije Universiteit Amsterdam (VU), Ghent University, European Space Agency (ESA), available at: https://www.gleam.eu (accessed on 1 February 2022).
The Clouds and the Earth’s Radiant Energy Systems (CERES) are sensors installed in the TERRA and Aqua satellites, available at: https://ceres.larc.nasa.gov/data (accessed on 1 February 2022).
The LAI product was obtained from MOD15A2 [45]. It is available at: https://lpdaac.usgs.gov/products/mod15a2hv006/#tools (accessed on 1 February 2022).
On board the TERRA and AQUA platforms are the main sensors used for this study. The MODIS and Clouds and the Earth’s Radiant Energy System CERES [45,46] sensors on NASA’s Terra and Aqua satellites (https://ceres.larc.nasa.gov accessed on 1 February 2022) validated the net radiation. The CERES product was obtained on a monthly basis, and we analyzed the daily data for extreme conditions. These data were validated globally for local measurements by Jia et al. (2016) [23] and Kratz et al. (2009) [47] using two algorithms to derive surface radiative fluxes. The net radiation has a closer relationship with the ET seasonality [48]. The MODIS sensor was also used to obtain Rn at a daily resolution in the Amazon [49].
For surface temperature, we analyzed the daily and monthly products from MODIS; MOD11A1 products were used for daily purposes, and MOD11C3 for monthly purposes. MOD11A1 and MOD11C3 daily and monthly per-pixel measurements provided Land Surface Temperature and Emissivity (LST&E) values, with a 0.01° spatial resolution. They are part of the NASA program, which is one of the few sources of currently available for Earth Radiation Budget data.

2.5. Statistical Metrics

A linear fit between the K67 flux tower measurement and remote sensing products was performed using ordinary least squares (OLS). The metrics obtained were the coefficient of determination (r2) in Equation (6), slope in Equation (7), the root mean square error (RMSE) in Equation (8), the normalized root mean square error (NRMSE) in Equation (9), and Mean Bias Error (MBE) in Equation (10). The metrics were determined using a linear fit
R 2 = 1 - i = 1 n f l u x t o w e r i s l o p e · s a t e l l i t e i + i n t e r c e p t 2 i = 1 n f l u x t o w e r i f l u x t o w e r ¯ 2
s l o p e = i = 1 n f l u x t o w e r i · s a t e l l i t e i i = 1 n s a t e l l i t e i 2
R M S E = i = 1 n f l u x t o w e r i s a t e l l i t e i 2 n
R M S E = R M S E f l u x t o w e r ¯
M B E = 1 n i = i n s a t e l l i t e i f l u x t o w e r i
A quality assurance and control process was applied to the data. For the K67 flux tower records, there were data points that were excluded due inconsistencies or erroneous values. None of the remote sensing products data were excluded from the analysis in the quality assurance and quality control process.

2.6. Flux Measurements

The K67 flux tower is located in a primary forest protected from anthropogenic impact, which makes the flux measurements representative of the natural water and energy balance processes [50]. Nevertheless, the Tapajós River runs close to the east side of the station, and on the west side is the Santarém–Cuiabá road, which transports agricultural products from central-west Brazil. The flux measurements analyzed are not influenced by these different environments, as shown in Figure 2.
In Santarém, where the K67 flux tower is located, there was a time-zone adjustment (GMT-3). The sun rose around 06:30 local time, and sunset was at 19:00. The variation in the sunrise and sunset times across the year is low due to its latitude close to the equator.
ET was high between 14:00 and 16:00 h, with its peak at 15:00 local time. The mean peak was 0.4 mm/h, and the maximum ET was 0.9 mm/h. The maximum ET value recorded per day was 9.7 mm/day, with an average value of 2.9 mm/day.
The median value 0.43 mm/h at 14:00, shown in Figure 3, is in accordance with what is expected for this type of land cover. The maximum of 0.9 mm/h at the same time is within the range for a primary forest [51]. The median daily values were 2.85 mm/day (1040.3 mm/year), which is slightly below what was expected. However, upon closer inspection of the third quartile, 75% and 25% of the values, a quarter of the values, were 4.2 mm/day [23,52] (1533 mm/year), which are indeed medium higher values for a well-watered, high-density foliage with 45° inclination, high canopies, and no human impact. The average value could be considered approximately 1400 mm/year [23].
This information about the daily ET behavior is of huge value because it has been recorded over a long period of 20 years. Even though there are some gaps in the average rates, they are important for the understanding of ET in a primary forest and for the consequences if the land cover changes in the future, or in similar areas.
The monthly box plots (Figure 4) show the inter-annual variation and seasonality of ET. Evapotranspiration is lower between December and May and higher between June and November. In contrast, the rainy season starts at the end of November or the beginning of December, depending on the Intertropical Convergence Zone (ITZC). The vegetation creates a buffer for the dry season. During the rainy season, the ET rate slows down due the high rainfall in this region. Moreover, La Niña events usually provide higher precipitation, and El Niño events cause a drier rainy season [52].
It is worth noting that during the rainy season, the median evapotranspiration remains at an average of 90 mm/month over the first five months. The lowest variation occurs in February, one of the rainiest months, and in May, which marks the start of the shift to the dry season.
The highest ET median is in August, September, and October, with the average of 102.5 mm/month, with these months having the lowest records of rain.
The range of 75 mm/month up to 130 mm/month is also in accordance with the type of land cover and landscape [53,54].
The net radiation (Rn) is intrinsically related to the daily ET (Figure 3, Figure 4 and Figure 5). High values of Rn result in high ET at the same time period. The Rn is not highly influenced by seasonality due to the proximity to the equator, at just −2.8° latitude. There is minor variation in incoming radiation over the year. A major impact is the level of cloudiness in the wet and dry season because there are only two seasons in this region: the rainy season and the dry season.
Similar to ET, the maximum Rn was recorded between 14:00 and 16:00, with its peak at 15:00. The maximum Rn recorded hourly was 1014.2 W/m2, also at 15:00, in March 2015.
The median values for 15:00 and 16:00 were between 520 and 550 W/m2. At 15:00, 25% of the values were above approximately 660 W/m2. The range of 25% to 75% was in between 400 W/m2 and 660 W/m2. These values are in accordance with equatorial regions of incoming solar radiation and variations [19,55,56] as shown on Figure 5.
Seasonality also influences the records of ET and Rn because at midday and 19:00, there is a variation in both observations; a variation of an average of 30% is shown by the hourly boxplots.
Despite the time of sunset and sunrise in the Santarém and Belterra region, the Brazilian State of Pará is in fact GMT-4; however, due to practical, political, business, and economical reasons, the time zone of the state has to be the same. For comparison, the State of Pará is approximately the same size as France, and its longitude, which is located in the western part of the state, has a time lag between the rotation of the Earth and local time. The Rn and ET start to increase between 9:00 and 10:00 until 19:00 and 20:00. In fact, this lag should be considered to be between 08:00, after the dew point, and 19:00 over the course of the day.
The air temperature (T) data show warm temperatures typical of tropical regions (Figure 6). In no record was a temperature below 20 °C detected. The median ranged from 24 °C at 09:00 to 30 °C at 17:00/18:00. Between T and Rn, there is an expected time lag in response to each other. When Rn reaches its highest levels, the T has its peak two hours later, keeping it warmer for around 1 h, and then it starts to decrease.
It is worth noting that the nights are warmer than the supposed chilly mornings. However, similar to what happens between ET and Rn, T and Relative Humidity (RH) have, in this case, inverse and opposite contrasts. Subsequently, the air refreshes during the night. As shown in Figure 7, the lowest RH is at 16:00, with 63%.
The RH does not reach the peak of 100% in four hours, from 13:00 until 16:00. The RH has a daily average of 72%, with its peak around 09:00 and a median of 90%.
The Leaf Area Index (LAI) is shown in Figure 8 to explain the dense foliage and the elevated median values of around 5.7 m2/m2, excluding February and March, for which the MOD15 product probably had interference from cloud cover due to the extreme rainy season. The main type of foliage, its density, and the 45° of inclination of most of the leaves capture more photosynthetic process [57].

3. Results

Validation of the Products

The actual evapotranspiration (ET) provided by the K67 had a correlation of r2 = 0.163 with SSEBop on a monthly scale (Figure 9). The Root Mean Square Error (RMSE) had low displacement between the two results, RMSE = 24.1 mm/month. Overall, SSEBop was underestimating the values obtained by the K67 station, noted by the position of the records with respect to the 1:1 and a negative MBE of −18.3 mm/month. Dispersion occurred in only one main cluster with few points as outliers. The maximum value difference was 80.5 mm/month among the five underestimated values for January 2005. In contrast, the maximum of the overestimated values was 71.8 mm/month for May 2009, among 23 values.
The SSEBop followed a pattern similar to that of the data from the K67, as shown in Figure 4, which had a lower ET in the rainy season and a higher ET in dry season. Even the size of the file obviously respected this pattern, although it was smoother than that of the flux tower.
The daily ET validation between K67 and the GLEAM product was more disperse, showing a lack of correlation. The flux tower provided higher values that could be considered outliers. When the data were inspected, three values above 10 mm/day were acceptable. In GLEAM, this occurred only once (Figure 10).
The large majority of the values fall within the cluster between 1 mm/day and 6 mm/day (Figure 10). This range of daily ET is in accordance with the hourly values shown in Figure 3. The RMSE = 1.781 mm/day and NRMSE = 0.599 are slightly high for daily values. This could be a result of the new algorithm for daily ET in GLEAM, such as new products that provide the ET values per day or the large pixel size of 0.25°. The problem was comparing a single point with maximum 1 km footprint [35] with a product with approximately 250 km.
For most monthly records, GLEAM is overestimating ET (Figure 11) with an MBE = 24.3 mm/month. RMSE = 36.17 mm/month could be considered a medium value due to the dispersion of the points in the plot. The r2 = 0.002 shows a lack of correlation between GLEAM and K67 records.
Precipitation is the component for which the K67 measurements were less related to the satellite products. This demonstrates the importance of the inter-comparison between the ground flux tower data and satellites products, as shown in Figure 12. The CHIRPS product has been validated in the region [58]. The main purpose of this study is to evaluate the flux tower and the remote sensing products. The pluviometer in the flux tower should be verified and calibrated, or checked to determine if there is other climate influence on it, such as being closer to the mouth of the Tapajós River. The evaporation of the large area of the river could interfere in the captured precipitation from the pluviometer installed in the flux tower [59]. Precipitation data analysis in the region performed by [60] showed that the tipping bucket, like K67 tower, is underestimated by 15% when compared to manual observations.
Precipitation was the variable that had a larger disagreement between the K67 station and the remote sensing products. Overall, the pluviometer (tipping bucket type) installed at the K67 site underestimated precipitation on a daily basis (Figure 12) with a slope of 0.697 and overestimated precipitation on a monthly basis (Figure 13) with a slope of 1.319. The mismatch suggests that the K67 pluviometer records higher precipitation during dry days due to factors such as leaves, birds, insects, or wind and misses larger precipitation events on a daily basis due a lack of maintenance of the tipping bucket. The uncertainty and inadequate maintenance of in situ stations in remote areas, such as the case of the K67 pluviometer, suggest that remote sensing product measurements can replace in situ records as the best available data.
The K67 precipitation data are not used as part of the CHIRPS algorithm for correction of the satellite products with in situ measurements. CHIRPS uses stations in Brazil mainly from the network of stations of the Brazilian National Water Agency (ANA)/Geological Survey of Brazil (CPRM).
The correlation of the monthly precipitation (r2 = 0.406) is better than that of the daily scale (r2 = 0.086), which is expected due the temporal aggregation. For the period of analysis, 19 months registered 0 mm/month in the rain gauge, and these were not considered in the analysis. Precipitation is unlikely to occur in this region, which strongly reaffirms possible problems with the K67 pluviometer.
The monthly net radiation using the CERES equipment on monthly basis has a correlation of r2 = 0.422 with the incoming net radiation from the K67 station (Figure 14). The results show high RMSE = 75 W/m2 and NRMSE = 0.382.
The air temperature was aggregated to a monthly mean to be compared with the MOD11C3 product. The temperature recorded by the equipment was never below 20 °C or above 35 °C. The metrics are r2 = 0.15, slope = 0.58, and RMSE = 2.829 °C (Figure 15).

4. Summary and Conclusions

The analysis and comparison of hydrologic variables from remote sensing products against in situ stations, such as the K67 flux tower, are vital for improving the water balance in the Amazon Basin, especially due its large extent and sparse network of in situ stations. It is also important to check the consistency and agreement of both data sources (i.e., in situ stations and remote sensing) to consolidate and adjust the information about each hydrologic variable, refining the water and energy fluxes and therefore improving the estimates for water management applications.
The K67 station measurements of temperature and net radiation were consistent with the remote sensing products of MOD11C3 and CERES, respectively. This suggests that even though the validation was on a monthly scale, the sensors in the Terra, Aqua, and NOAA satellites provide a homogeneous and constant time-series. If the equipment fails, it is necessary to recognize the area and have a good idea of the region, the type of land cover, and the seasonality of the climate.
Evapotranspiration (ET) from the flux tower showed the best agreement with SSEBop. The metrics showed a lack of correlation to GLEAM, possibly due to its coarse the spatial resolution. The distribution and variation from SSEBop were more congruent, and the results were more appropriate for a primary forest. GLEAM has the advantage of providing daily estimates with acceptable results. The spatial resolution of SSEBop (0.01°) and GLEAM (0.25°) differ greatly; SSEBop’s finer spatial resolution has a closer match with the area of influence of the K67 flux tower. Overall, GLEAM overestimated the ET for the period of analysis, and SSEBop underestimated it. This suggests that an ET ensemble of remote sensing products might reduce errors, as previous studies have shown [23].
Precipitation from the K67 station is not included in the CHIRPS algorithm for correction of its product. The K67 pluviometer had a recording problem, which might explain the difference between the in situ records and CHIRPS. This suggests that further studies should consider the limitations of in situ stations, not only from remote sensing products. As remote sensing products are continuously improving, uncertainty, bias, and error are reduced.
Net Radiation (Rn) from the K67 station was in agreement with CERES in a monthly scale. As Rn is the main input of the energy balance, it suggests confidence for the estimation and comparison of ET. The energy balance closure for the station K67 was reported by [23] at 97%. Air temperature recorded at 61 cm above ground was compared daily and monthly with MOD11, which measures surface temperature. The temperature differences between air temperature at 61 cm and surface temperature are minimal in a dense forest area, and K67 shows good fit with MOD11 data.
Another aspect of the limitations of in situ measurements is time-series gaps. The K67 flux tower has time gaps due to climate factors such as local weather conditions, wind speed, periods of intense precipitation, leaves, birds, insects, and other influencing factors. Despite the regular maintenance of the of the flux tower by experts, the equipment is subject to problems, and data are compromised until replacements and fixes are completed, which can take considerable time due the remoteness of the area.
Gaps in station records could be filled by remote sensing and consolidating the information, by including bias correction methods.
This study shows that records of environmental variables such as evapotranspiration, precipitation, net radiation, and air temperature from remote sensing can be used in the estimation of variables in engineering applications. Satellite products agree with station records for primary forest areas in the Amazon Basin. The differences between station records and satellite products are due the inherent nature of the measurements; part of the difference could be due to biases or resolution of satellite products, but another part of the difference is due the limitations, lack of maintenance, or deficiencies in the station measurements. The added value of satellite products is to have consistent spatial-temporal continuous and uniform data sets, instead of scatter point measurements with temporal gaps. Station records can be used to validate or bias-correct satellite products, enhancing the scope of the measurements to spatial applications. However, the estimates from remote sensing have to be compared to local measurements.
Further studies are suggested in additional regions to validate flux tower measurements and for comparison with satellite products because remote sensing algorithms and satellite products are being improved, and additional flux towers are being constructed. Furthermore, the bias of different spatial scales should be considered in comparing point estimates from in situ measurements against remote sensing products with different spatial resolutions. In addition, we suggest similar studies in other types of land cover.

Author Contributions

All authors have contributed directly to this research. Conceptualization, V.H.d.M.P., G.E.E.-D. and R.d.S.; methodology, V.H.d.M.P.; software, G.E.E.-D. and R.d.S.; formal analysis and investigation, V.H.d.M.P.; writing—original draft preparation, V.H.d.M.P.; review and editing, G.E.E.-D., R.T. and A.B.d.S.G. All authors have read and agreed to the published version of the manuscript.

Funding

V.H.d.M.P. was funded by CPRM—Geological Survey of Brazil. Part of this research was carried out in IHE-Delft facilities, Delft, Netherlands, where all the conditions were provided to conduct this research.

Institutional Review Board Statement

Not applicable.

Informed Consent Statement

Not applicable.

Data Availability Statement

All data was freely available from the providers mentioned above.

Acknowledgments

The authors acknowledge the Large-Scale Biosphere–Atmosphere Experiment (LBA-ECO); the Climate Hazards Center at UC Santa Barbara, for providing the CHIRPS product and the availability of the time series; CPRM, ANA, INMET, and SSEBop from the Geological Survey of United Sates USGS; and MODIS from National Aeronautics and Space Administration NASA. We also especially acknowledge IHE-Delft for providing the installations for this study. The help and support from IHE-Delft was fundamental to accomplishing this research, with special thanks to Michael McClain and Eddy Moors for the earlier ideas.

Conflicts of Interest

The authors declare no conflict of interest.

References

  1. Lehner, B.; Grill, G. Global river hydrography and network routing: Baseline data and new approaches to study the world’s large river systems. Hydrol. Process. 2013, 2186, 2171–2186. [Google Scholar] [CrossRef]
  2. Nobre, C.A.; Borma, L.D.S. “Tipping points” for the Amazon forest. Curr. Opin. Environ. Sustain. 2009, 1, 28–36. [Google Scholar] [CrossRef]
  3. Gash, J.H.C.; Nobre, C.A.; Roberts, J.M. Amazonian Deforestation and Climate; John Wiley and Sons Ltd.: Wallingford, UK, 1996. [Google Scholar]
  4. Gomes, V.H.F.; Vieira, I.C.G.; Salomão, R.P.; ter Steege, H. Amazonian tree species threatened by deforestation and climate change. Nat. Clim. Chang. 2019, 9, 547–553. [Google Scholar] [CrossRef]
  5. Costa, M.H.; Foley, J.A. Trends in the hydrologic cycle of the Amazon basin. J. Geophys. Res. Atmos. 1999, 104, 14189–14198. [Google Scholar] [CrossRef]
  6. Marengo, J.A. Characteristics and spatio-temporal variability of the Amazon river basin water budget. Clim. Dyn. 2005, 24, 11–22. [Google Scholar] [CrossRef]
  7. Getirana, A.C.V.; Dutra, E.; Guimberteau, M.; Kam, J.; Li, H.-Y.; Decharme, B.; Zhang, Z.; Ducharne, A.; Boone, A.; Balsamo, G.; et al. Water Balance in the Amazon Basin from a Land Surface Model Ensemble. J. Hydrometeorol. 2014, 15, 2586–2614. [Google Scholar] [CrossRef] [Green Version]
  8. Costa, M.H.; Foley, J.A. A comparison of precipitation datasets for the Amazon basin. Geophys. Res. Lett. 1998, 25, 155–158. [Google Scholar] [CrossRef]
  9. Zubieta, R.; Saavedra, M.; Espinoza, J.C.; Ronchail, J.; Sulca, J.; Drapeau, G.; Martin-Vide, J. Assessing precipitation concentration in the Amazon basin from different satellite-based data sets. Int. J. Climatol. 2019, 39, 3171–3187. [Google Scholar] [CrossRef]
  10. Da Rocha, H.R.; Manzi, A.O.; Shuttleworth, J. Evapotranspiration. In Amazonia and Global Change; Keller, M., Bustamante, M., Eds.; American Geophysical Union: Washington, DC, USA, 2009; pp. 261–272. [Google Scholar]
  11. Tobergte, D.R.; Curtis, S.; Shumway, R.H.; Stoffer, D.S.; Fisher, J.B.; Melton, F.; Middleton, E.; Hain, C.; Anderson, M.; Allen, R.; et al. The Amazon River Basin. Water Resour. Res. 2017, 481, 1–20. [Google Scholar]
  12. Maidment, D.R.; Mays, L.W. Applied Hydrology; McGraw-Hill: New York, NY, USA, 1968; Volume 6, ISBN 0070108102. [Google Scholar]
  13. WMO. Guide to Meterological Instruments and Methods of Observation; WMO: Geneva, Switzerland, 2008; ISBN 9789263100085. [Google Scholar]
  14. Cohen, W.B.; Justice, C.O. Validating MODIS Terrestrial Ecology Products: Linking In Situ and Satellite Measurements. Remote Sens. Environ. 1999, 3, 1–3. [Google Scholar] [CrossRef]
  15. Xiao, J.; Zhuang, Q.; Law, B.E.; Baldocchi, D.D.; Chen, J.; Richardson, A.D.; Melillo, J.M.; Davis, K.J.; Hollinger, D.Y.; Wharton, S.; et al. Agricultural and Forest Meteorology Assessing net ecosystem carbon exchange of US terrestrial ecosystems by integrating eddy covariance flux measurements and satellite observations. Agric. For. Meteorol. 2011, 151, 60–69. [Google Scholar] [CrossRef] [Green Version]
  16. Avissar, R.; Nobre, C.A. Preface to special issue on the Large-Scale Biosphere-Atmosphere Experiment in Amazonia (LBA). J. Geophys. Res. D Atmos. 2002, 107, 20. [Google Scholar] [CrossRef]
  17. Yan, H.; Shugart, H.H.; Shi, T.T.; Guan, D.X.; Wu, J.B.; Wang, A.Z.; Jin, C.J.; Han, S.J.; Vizy, E.K.; Cook, K.H.; et al. Pan Evaporation, Potential and Actual Evapotranspiration. Hydrol. Earth Syst. Sci. 2017, 18, 1–14. [Google Scholar]
  18. Beven, K. A sensitivity analysis of the penman—Monteith actual evapotranspiration estimates. J. Hydrol. 1979, 44, 169–190. [Google Scholar] [CrossRef]
  19. Restrepo-Coupe, N.; da Rocha, H.R.; Hutyra, L.R.; da Araujo, A.C.; Borma, L.S.; Christoffersen, B.; Cabral, O.M.R.; de Camargo, P.B.; Cardoso, F.L.; da Costa, A.C.L.; et al. What drives the seasonality of photosynthesis across the Amazon basin? A cross-site analysis of eddy flux tower measurements from the Brasil flux network. Agric. For. Meteorol. 2013, 182–183, 128–144. [Google Scholar] [CrossRef] [Green Version]
  20. Flux Tower K67. Available online: https://ameriflux.lbl.gov/sites/siteinfo/BR-Sa1 (accessed on 1 February 2022).
  21. Baldocchi, D.; Valentini, R.; Running, S.; Oechel, W.; Dahlman, R. Strategies for measuring and modelling carbon dioxide and water vapour fluxes over terrestrial ecosystems. Glob. Chang. Biol. 1996, 2, 159–168. [Google Scholar] [CrossRef]
  22. Nagler, P.L.; Wolf, A.; Saliendra, N.; Akshalov, K.; Johnson, D.A.; Laca, E.; Scott, R.L.; Westenburg, C.; Cleverly, J.R.; Glenn, E.P.; et al. Evapotranspiration on western U.S. rivers estimated using the Enhanced Vegetation Index from MODIS and data from eddy covariance and Bowen ratio flux towers. J. Hydrol. 2005, 8, 1123–1129. [Google Scholar] [CrossRef]
  23. Paca, V.H.M.; Espinoza-Dávalos, G.E.; Hessels, T.M.; Moreira, D.M.; Comair, G.F.; Bastiaanssen, W.G.M. The spatial variability of actual evapotranspiration across the Amazon River Basin based on remote sensing products validated with flux towers. Ecol. Process. 2019, 8, 1. [Google Scholar] [CrossRef] [Green Version]
  24. Medeiros, M.J. Atlas Irrigação. “Polos Nacionais de Agricultura Irrigada: Mapeamento de Áreas Irrigadas com Imagens de Satélite”, Brasilia, Brazil. 2020. Available online: https://cdn.agenciapeixevivo.org.br/media/2020/03/polos-nacionais-irriga%C3%A7%C3%A3o.pdf (accessed on 1 February 2022).
  25. Senay, G.B.; Bohms, S.; Singh, R.K.; Gowda, P.H.; Velpuri, N.M.; Alemu, H.; Verdin, J.P. Operational Evapotranspiration Mapping Using Remote Sensing and Weather Datasets: A New Parameterization for the SSEB Approach. J. Am. Water Resour. Assoc. 2013, 49, 577–591. [Google Scholar] [CrossRef] [Green Version]
  26. Watson, D.J. Comparative Physiological Studies on the Growth of Field Crops. Ann. Bot. 1947, XI, 41. [Google Scholar] [CrossRef]
  27. Chen, J.M.; Black, T.A. Defining leaf area index for non-flat leaves. Plant Cell Environ. 1991, 15, 421–429. [Google Scholar] [CrossRef]
  28. Allen, R.G.; Pereira, L.S.; Raes, D.; Smith, M. Crop Evapotranspiration—Guidelines for Computing Crop Water Requirements—FAO Irrigation and Drainage Paper 56; FAO: Rome, Italy, 1998; ISBN 9251042195. [Google Scholar]
  29. Hutyra, L.R.; Munger, J.W.; Saleska, S.R.; Gottlieb, E.; Daube, B.C.; Dunn, A.L.; Amaral, D.F.; De Camargo, P.B.; Wofsy, S.C. Seasonal controls on the exchange of carbon and water in an Amazonian rain forest. J. Geophys. Res. Biogeosci. 2007, 112, G03008. [Google Scholar] [CrossRef]
  30. Clark, D.B.; Clark, D.A.; Rich, P.M.; Weiss, S.; Oberbauer, S.F. Landscape-scale evaluation of understory light and canopy structure: Methods for application in a neotropical lowland rain forest. Can. J. For. Res. 1996, 26, 747–757. [Google Scholar] [CrossRef]
  31. Oliveira Júnior, R.C.; Correa, J.R.V. Aptidão Agrícola dos Solos do Município de Belterra, Estado do Pará; Embrapa: Belém, PA, Brazil, 2001. [Google Scholar]
  32. Twine, T.E.; Kustas, W.P.; Norman, J.M.; Cook, D.R.; Houser, P.R.; Meyers, T.P.; Prueger, J.H.; Starks, P.J.; Wesely, M.L. Correcting eddy-covariance flux underestimates over a grassland. Agric. For. Meteorol. 2000, 103, 279–300. [Google Scholar] [CrossRef] [Green Version]
  33. Saleska, S. FLUXNET2015 BR-Sa1 Santarem-Km67-Primary Forest. Available online: https://doi.org/10.18140/FLX/1440032 (accessed on 1 February 2022).
  34. Baldocchi, D.; Penuelas, J. The physics and ecology of mining carbon dioxide from the atmosphere by ecosystems. Glob. Chang. Biol. 2019, 25, 1191–1197. [Google Scholar] [CrossRef] [PubMed] [Green Version]
  35. Baldocchi, D.D. How eddy covariance flux measurements have contributed to our understanding of Global Change Biology. Glob. Chang. Biol. 2020, 26, 242–260. [Google Scholar] [CrossRef] [PubMed]
  36. Reynolds, O. IV. On the dynamical theory of incompressible viscous fluids and the determination of the criterion. Philos. Trans. R. Soc. Lond. 1895, 186, 123–164. [Google Scholar]
  37. Funk, C.; Peterson, P.; Landsfeld, M.; Pedreros, D.; Verdin, J.; Shukla, S.; Husak, G.; Rowland, J.; Harrison, L.; Hoell, A.; et al. The climate hazards infrared precipitation with stations - A new environmental record for monitoring extremes. Sci. Data 2015, 2, 150066. [Google Scholar] [CrossRef] [PubMed] [Green Version]
  38. Paredes Trejo, F.J.; Barbosa, H.A.; Peñaloza-Murillo, M.A.; Alejandra Moreno, M.; Farías, A. Intercomparison of improved satellite rainfall estimation with CHIRPS gridded product and rain gauge data over Venezuela. Atmosfera 2016, 29, 323–342. [Google Scholar] [CrossRef] [Green Version]
  39. Paredes-Trejo, F.J.; Barbosa, H.A.; Lakshmi Kumar, T.V. Validating CHIRPS-based satellite precipitation estimates in Northeast Brazil. J. Arid Environ. 2017, 139, 26–40. [Google Scholar] [CrossRef]
  40. Toté, C.; Patricio, D.; Boogaard, H.; van der Wijngaart, R.; Tarnavsky, E.; Funk, C. Evaluation of satellite rainfall estimates for drought and flood monitoring in Mozambique. Remote Sens. 2015, 7, 1758–1776. [Google Scholar] [CrossRef] [Green Version]
  41. Bai, L.; Shi, C.; Li, L.; Yang, Y.; Wu, J. Accuracy of CHIRPS satellite-rainfall products over mainland China. Remote Sens. 2018, 10, 362. [Google Scholar] [CrossRef] [Green Version]
  42. Le, A.M.; Pricope, N.G. Increasing the Accuracy of Runoff and Streamflow Simulation in the Nzoia Basin, Western Kenya, through the Incorporation of Satellite-Derived CHIRPS Data. Water 2017, 9, 114. [Google Scholar] [CrossRef]
  43. Luo, X.; Wu, W.; He, D.; Li, Y.; Ji, X. Hydrological simulation using TRMM and CHIRPS precipitation estimates in the lower Lancang-Mekong River basin. Chin. Geogr. Sci. 2019, 29, 13–25. [Google Scholar] [CrossRef] [Green Version]
  44. Husak, G.J.; Michaelsen, J.; Funk, C. Use of the gamma distribution to represent monthly rainfall in Africa for drought monitoring applications. Int. J. Climatol. 2007, 27, 935–944. [Google Scholar] [CrossRef]
  45. Yuan, H.; Dai, Y.; Xiao, Z.; Ji, D.; Shangguan, W. Reprocessing the MODIS Leaf Area Index products for land surface and climate modelling. Remote Sens. Environ. 2011, 115, 1171–1187. [Google Scholar] [CrossRef]
  46. Jia, A.; Jiang, B.; Liang, S.; Zhang, X.; Ma, H. Validation and Spatiotemporal Analysis of CERES Surface Net Radiation Product. Remote Sens. 2016, 8, 90. [Google Scholar] [CrossRef] [Green Version]
  47. Directorate, S.; Applications, S.S. Validation of the CERES Edition 2B Surface-Only Flux Algorithms. J. Appl. Meteorol. Climatol. 2009, 49, 164–180. [Google Scholar]
  48. Hasler, N.; Avissar, R. What Controls Evapotranspiration in the Amazon Basin? J. Hydrometeorol. 2007, 8, 380–395. [Google Scholar] [CrossRef]
  49. De Oliveira, G.; Brunsell, N.A.; Moraes, E.C.; Bertani, G.; dos Santos, T.V.; Shimabukuro, Y.E.; Aragão, L.E.O.C. Use of MODIS sensor images combined with reanalysis products to retrieve net radiation in Amazonia. Sensors 2016, 16, 956. [Google Scholar] [CrossRef] [Green Version]
  50. Chakraborty, T.; Sarangi, C.; Krishnan, M.; Tripathi, S.N.; Morrison, R.; Evans, J. Biases in Model-Simulated Surface Energy Fluxes During the Indian Monsoon Onset Period. Bound.-Layer Meteorol. 2019, 170, 323–348. [Google Scholar] [CrossRef] [Green Version]
  51. Machado, W.B.; Fluxo De Energia, E. Evapotranspiração Regional Na Área De Influência Da Br-163, Oeste Do Pará, Universidade Federal do Oeste do Pará. 2017. Available online: https://repositorio.ufopa.edu.br/jspui/handle/123456789/91 (accessed on 1 February 2022).
  52. Marengo, J.A.; Tomasella, J.; Soares, W.R.; Alves, L.M.; Nobre, C.A. Extreme climatic events in the Amazon basin. Theor. Appl. Climatol. 2012, 107, 73–85. [Google Scholar] [CrossRef]
  53. Wu, J.; Lakshmi, V.; Wang, D.; Lin, P.; Pan, M.; Cai, X.; Wood, E.F.; Zeng, Z. The Reliability of Global Remote Sensing Evapotranspiration Products over Amazon. Remote Sens. 2020, 12, 2211. [Google Scholar] [CrossRef]
  54. Xu, D.; Agee, E.; Wang, J.; Ivanov, V.Y. Estimation of Evapotranspiration of Amazon Rainforest Using the Maximum Entropy Production Method. Geophys. Res. Lett. 2019, 46, 1402–1412. [Google Scholar] [CrossRef]
  55. Von Randow, C.; Manzi, A.O.; Kruijt, B.; de Oliveira, P.J.; Zanchi, F.B.; Silva, R.L.; Hodnett, M.G.; Gash, J.H.C.; Elbers, J.A.; Waterloo, M.J.; et al. Comparative measurements and seasonal variations in energy and carbon exchange over forest and pasture in South West Amazonia. Theor. Appl. Climatol. 2004, 78, 5–26. [Google Scholar] [CrossRef]
  56. Dos Santos, C.A.C.; Do Nascimiento, R.L.; Rao, T.V.R.; Manzi, A.O. Net radiation estimation under pasture and forest in Rondônia, Brazil, with TM Landsat 5 images. Atmósfera 2011, 24, 435–446. [Google Scholar]
  57. Costa, M.H.; Nunes, E.L.; Carneiro, M.; Senna, A.; Imbuzeiro, H.M.A. Estado-Da-Arte Da Simulação Da Taxa De Fixação De Carbono. Rev. Bras. Meteorol. 2009, 24, 179–187. [Google Scholar] [CrossRef]
  58. Da Paca, V.H.M.; Espinoza-Dávalos, G.E.; Moreira, D.M.; Comair, G. Variability of Trends in Precipitation across the Amazon River Basin Determined from the CHIRPS Precipitation Product and from Station Records. Water 2020, 12, 1244. [Google Scholar] [CrossRef]
  59. Silva Dias, M.A.F.; Silva Dias, P.L.; Longo, M.; Fitzjarrald, D.R.; Denning, A.S. River breeze circulation in eastern Amazonia: Observations and modelling results. Theor. Appl. Climatol. 2004, 78, 111–121. [Google Scholar] [CrossRef]
  60. Fitzjarrald, D.R.; Sakai, R.K.; Moraes, O.L.L.; Cosme de Oliveira, R.; Acevedo, O.C.; Czikowsky, M.J.; Beldini, T. Spatial and temporal rainfall variability near the Amazon-Tapajós confluence. J. Geophys. Res. Biogeosci. 2008, 113, G00B11. [Google Scholar] [CrossRef]
Figure 1. Overall view of the location of the flux tower from the LBA project and K67.
Remotesensing 14 01259 g001
Figure 2. Specific location of the K67 flux tower in the National Tapajós Forest.
Remotesensing 14 01259 g002
Figure 3. Boxplot of hourly evapotranspiration from flux tower K67.
Remotesensing 14 01259 g003
Figure 4. Monthly evapotranspiration from flux tower K67.
Remotesensing 14 01259 g004
Figure 5. Hourly net radiation from flux tower K67.
Remotesensing 14 01259 g005
Figure 6. Hourly air temperature from flux tower K67.
Remotesensing 14 01259 g006
Figure 7. Hourly relative humidity from flux tower K67.
Remotesensing 14 01259 g007
Figure 8. Leaf Area Index from MOD15.
Remotesensing 14 01259 g008
Figure 9. Monthly ET from K67 station records versus SSEBop satellite product.
Remotesensing 14 01259 g009
Figure 10. Daily ET from K67 station records versus GLEAM satellite product.
Remotesensing 14 01259 g010
Figure 11. Monthly ET from K67 station records versus GLEAM satellite product.
Remotesensing 14 01259 g011
Figure 12. Daily precipitation from K67 station records versus CHIRPS satellite product.
Remotesensing 14 01259 g012
Figure 13. Monthly precipitation from K67 station records versus CHIRPS satellite product.
Remotesensing 14 01259 g013
Figure 14. Monthly net radiation from K67 station records versus CERES.
Remotesensing 14 01259 g014
Figure 15. Monthly air temperature at 61 cm from K67 station records versus MOD11C3.
Remotesensing 14 01259 g015
Table 1. Flux tower sites in the Amazon River Basin and the period of available data for the present study.
Tower CodeLocationVegetation TypeLat, LonTower Height (m)Period of Available Data for This StudyEffective Months Available
K67Pará, SantarémPrimary forest−2.857, −54.959632002/201969
Table 2. Description on satellite products, spatial resolution, spatial coverage, and time interval.
ProductMain Principal ProductsResolutionSpatial
Coverage
Minimum Time Steps IntervalProducer
CHIRPS v.2TMPA, TRMM 3B42-RT/3B42/2B31, CMORPH, and ground stations (P)0.05°50°N–SdailyCHG
SSEBop v.4MODIS thermal imagery, GDAS, and NDVI (ET)0.01°90°N–SmonthlyUSGS
GLEAM v.3.5bMSWEP, ESA-CCI, CERES, AIRS, and MOD44B (ET)0.25°90°N–Sdaily and monthlyVU, GHENT, ESA
MOD15A2LAI0.005°90°N–SmonthlyEOS
MOD11C3TAIR monthly0.005°90°N–SmonthlyEOS
CERESNet radiation90°N–SmonthlyEOS
K67 Flux towerDirect observations (raw data)Locally basedIn situ measurementshourlyLBA
Publisher’s Note: MDPI stays neutral with regard to jurisdictional claims in published maps and institutional affiliations.

