
Robust Multimodal Remote Sensing Image Registration Based on Local Statistical Frequency Information

 , ,
, ,  , , and
Abstract
:1. Introduction
- Differences in imaging mechanisms or different weather capture conditions cause non-linear radiation changes between images, which leads to significant contrast differences, rendering traditional feature representation methods based on grayscale or gradient less effective or even invalid.
- Large geometric deformations occur between images acquired from different azimuths (viewpoints) or different platforms (airborne camera, space camera), which makes it extremely difficult to extract invariant features.
- Images acquired at different times or by different sensors contain some structural changes, resulting in poor consistency of the feature representation for the same target, making it difficult to achieve accurate registration.
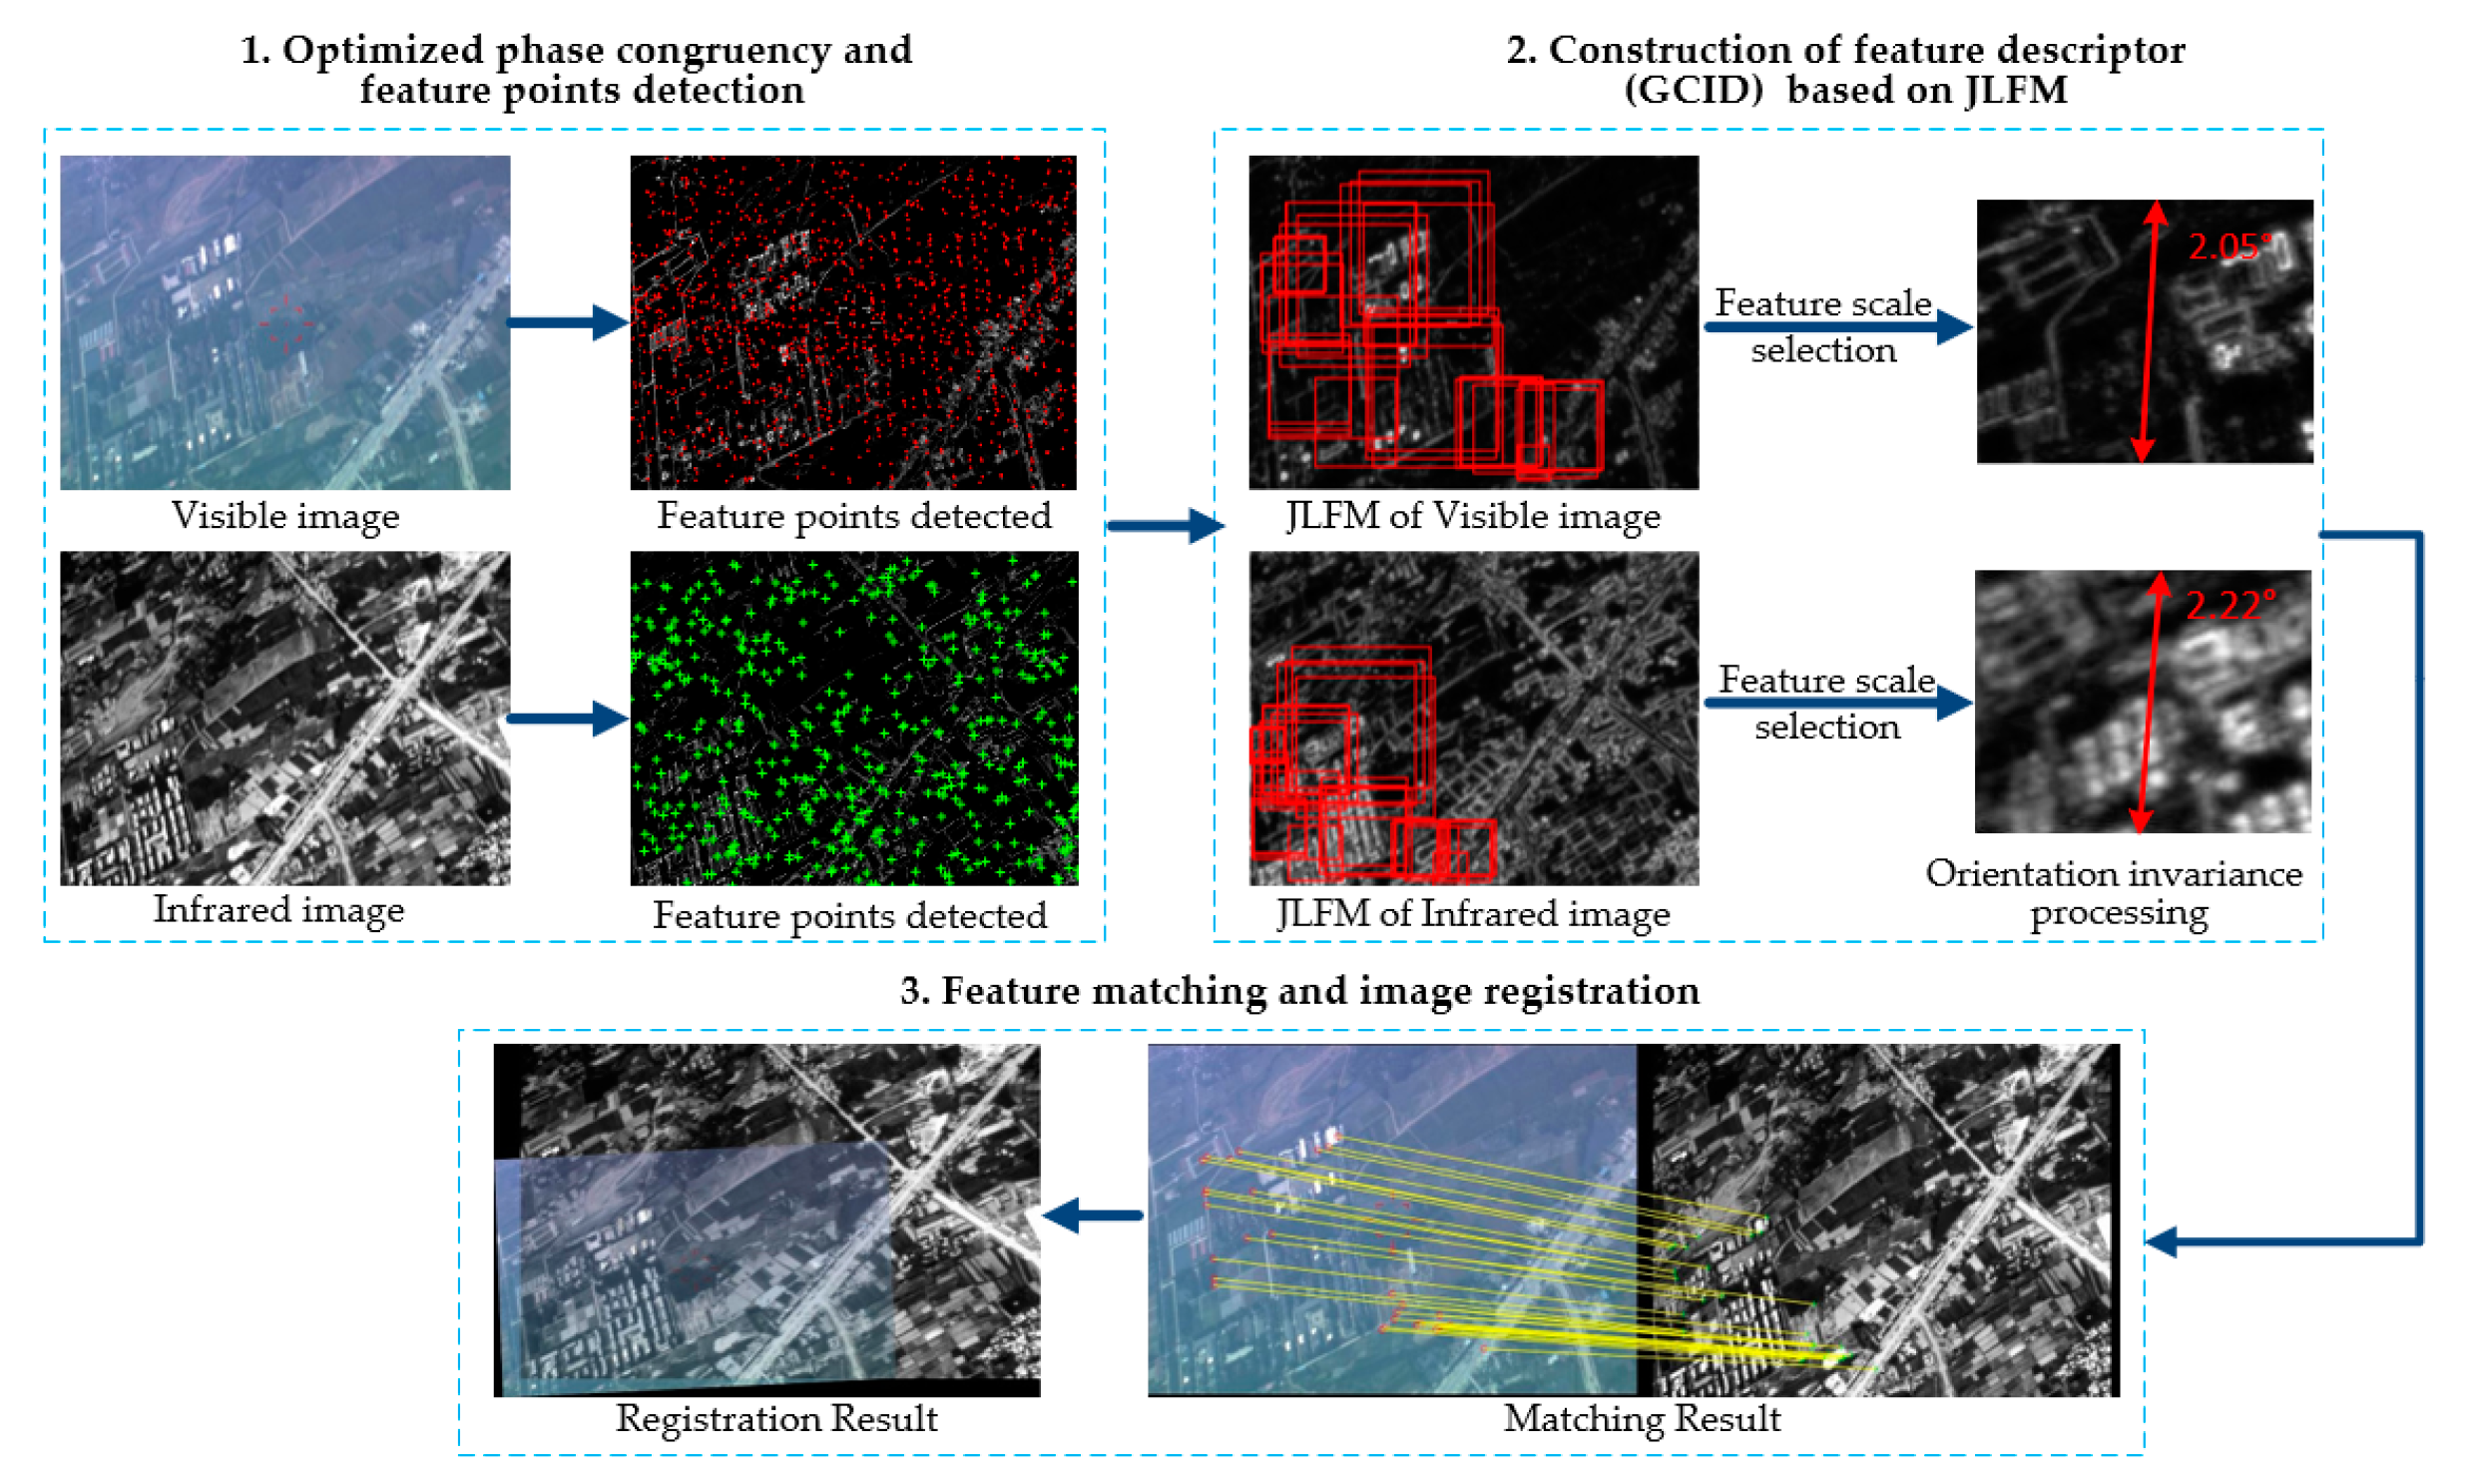
- The maximum phase congruency optimization method is proposed, which is a guarantee for stable structural feature localization in multimodal remote sensing images and determines the center of the feature description regions.
- To make full use of the frequency information and dig out structural features in image better, a joint local frequency information map that combines Log-Gabor filter responses over scales and orientations was constructed, which offers the main information to the feature descriptors.
- The geometric and contrast invariant descriptors were generated through the selection of feature scales and the orientation statistics of the region to be described on the joint feature map, which is critical to achieve accurate registration.
2. Related Works
3. Methodology
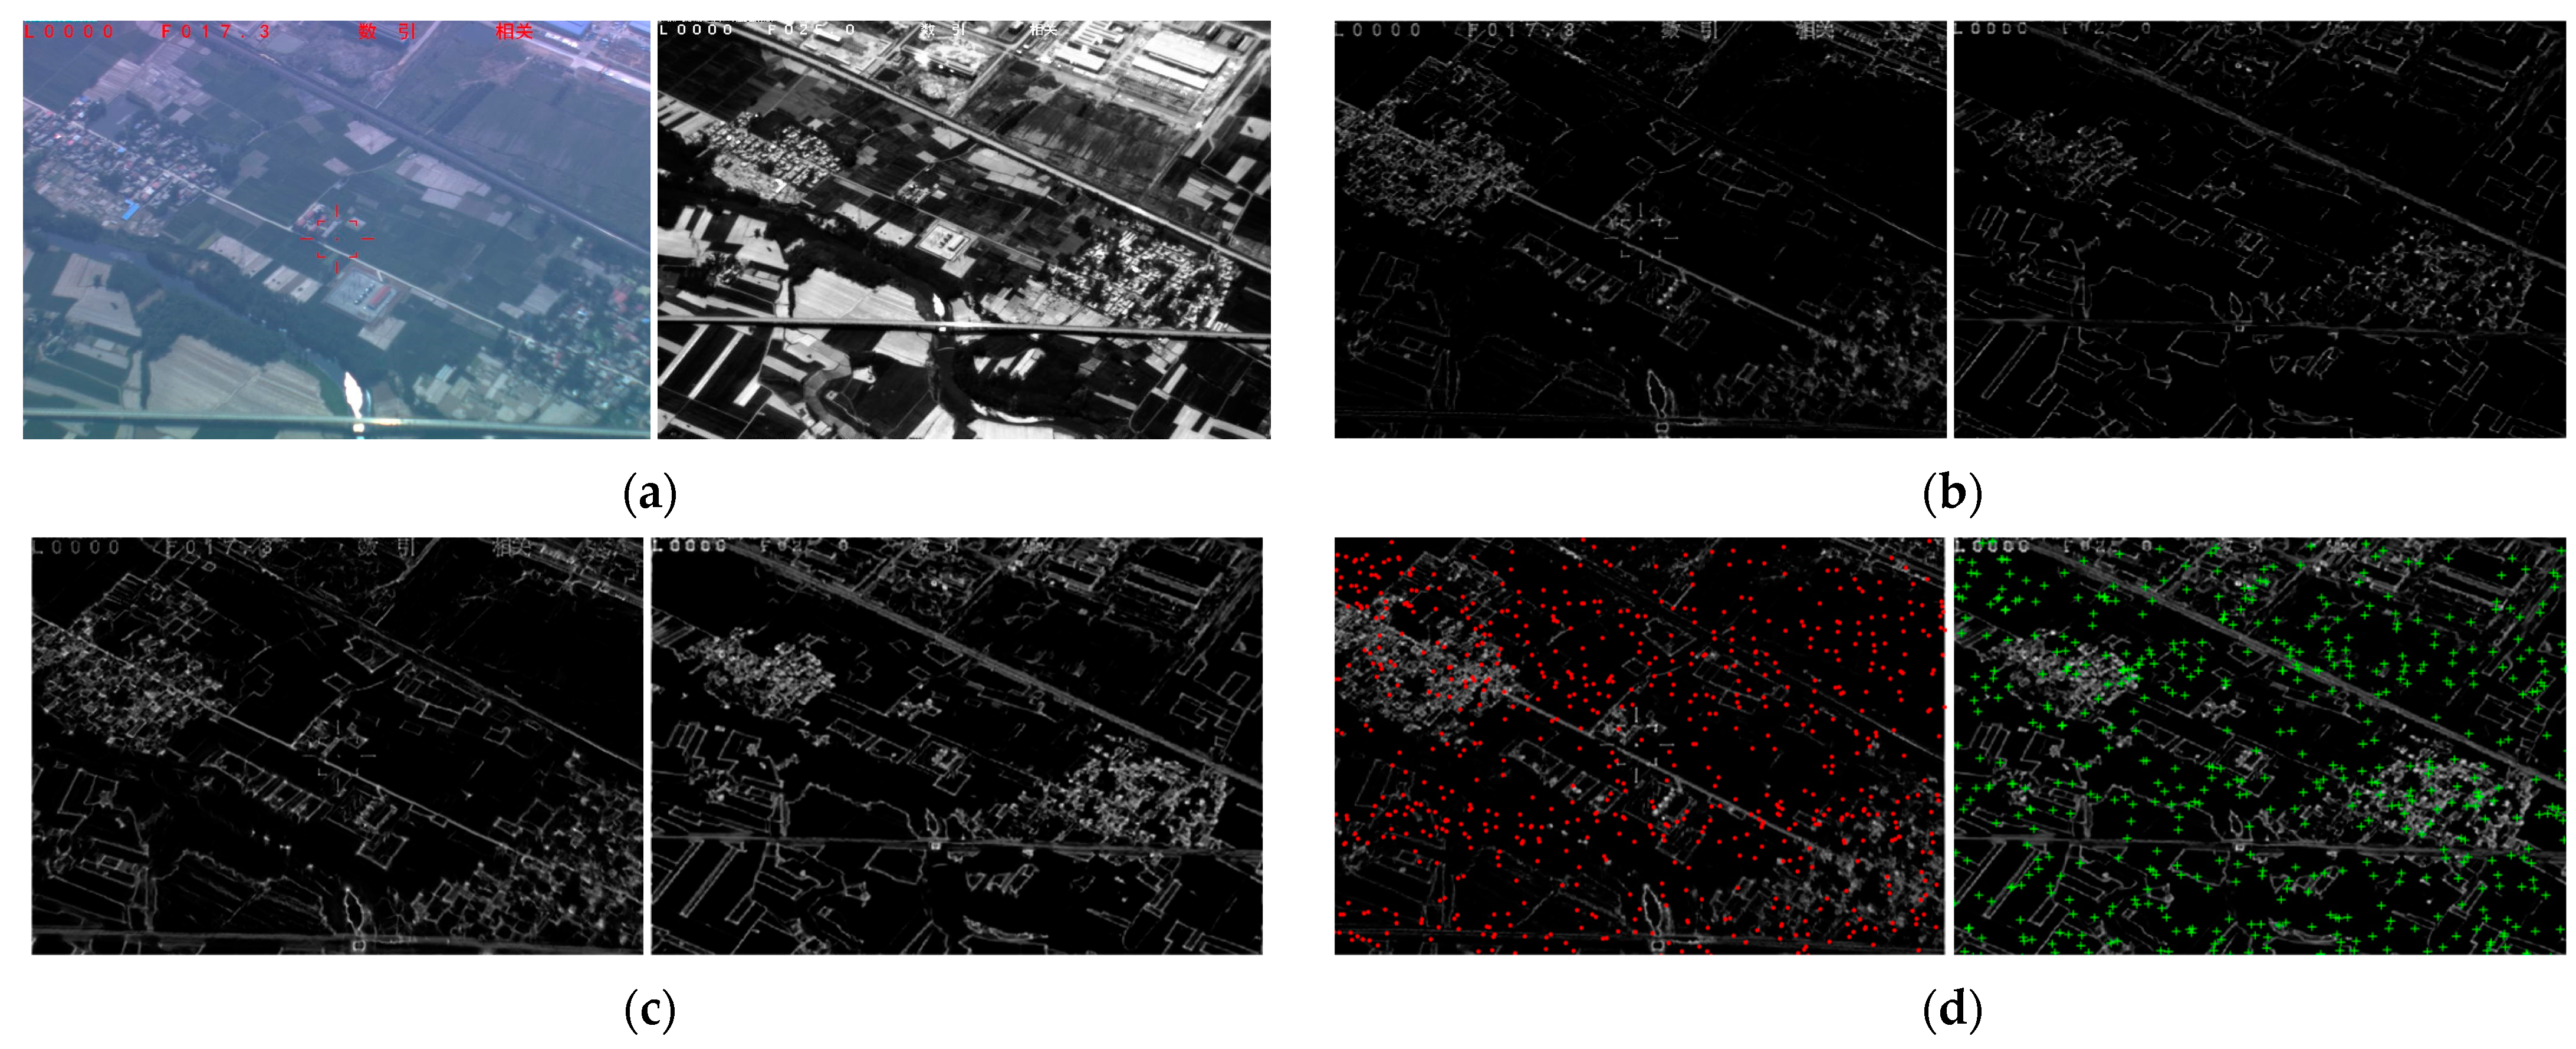
3.1. Maximum Phase Congruency and Feature Detection
- (1)
- The moment analysis equations at each point are calculated as following:
- (2)
- The maximum moment and minimum moment are given by,
- (1)
- CFMs are produced from the input images through changing the values of and , and keeping default values for other parameters.
- (2)
- Compute the cosine similarity of CFMs by the following formula:where and are the corresponding CFMs of reference image and sensed image respectively. and are their histogram statistical vectors.
- (3)
- The average cosine similarity of different CFMs for a group parameter is computed, and the optimal parameters can be determined according to the maximum cosine similarity of CFMs obtained by different parameter combinations.
- (1)
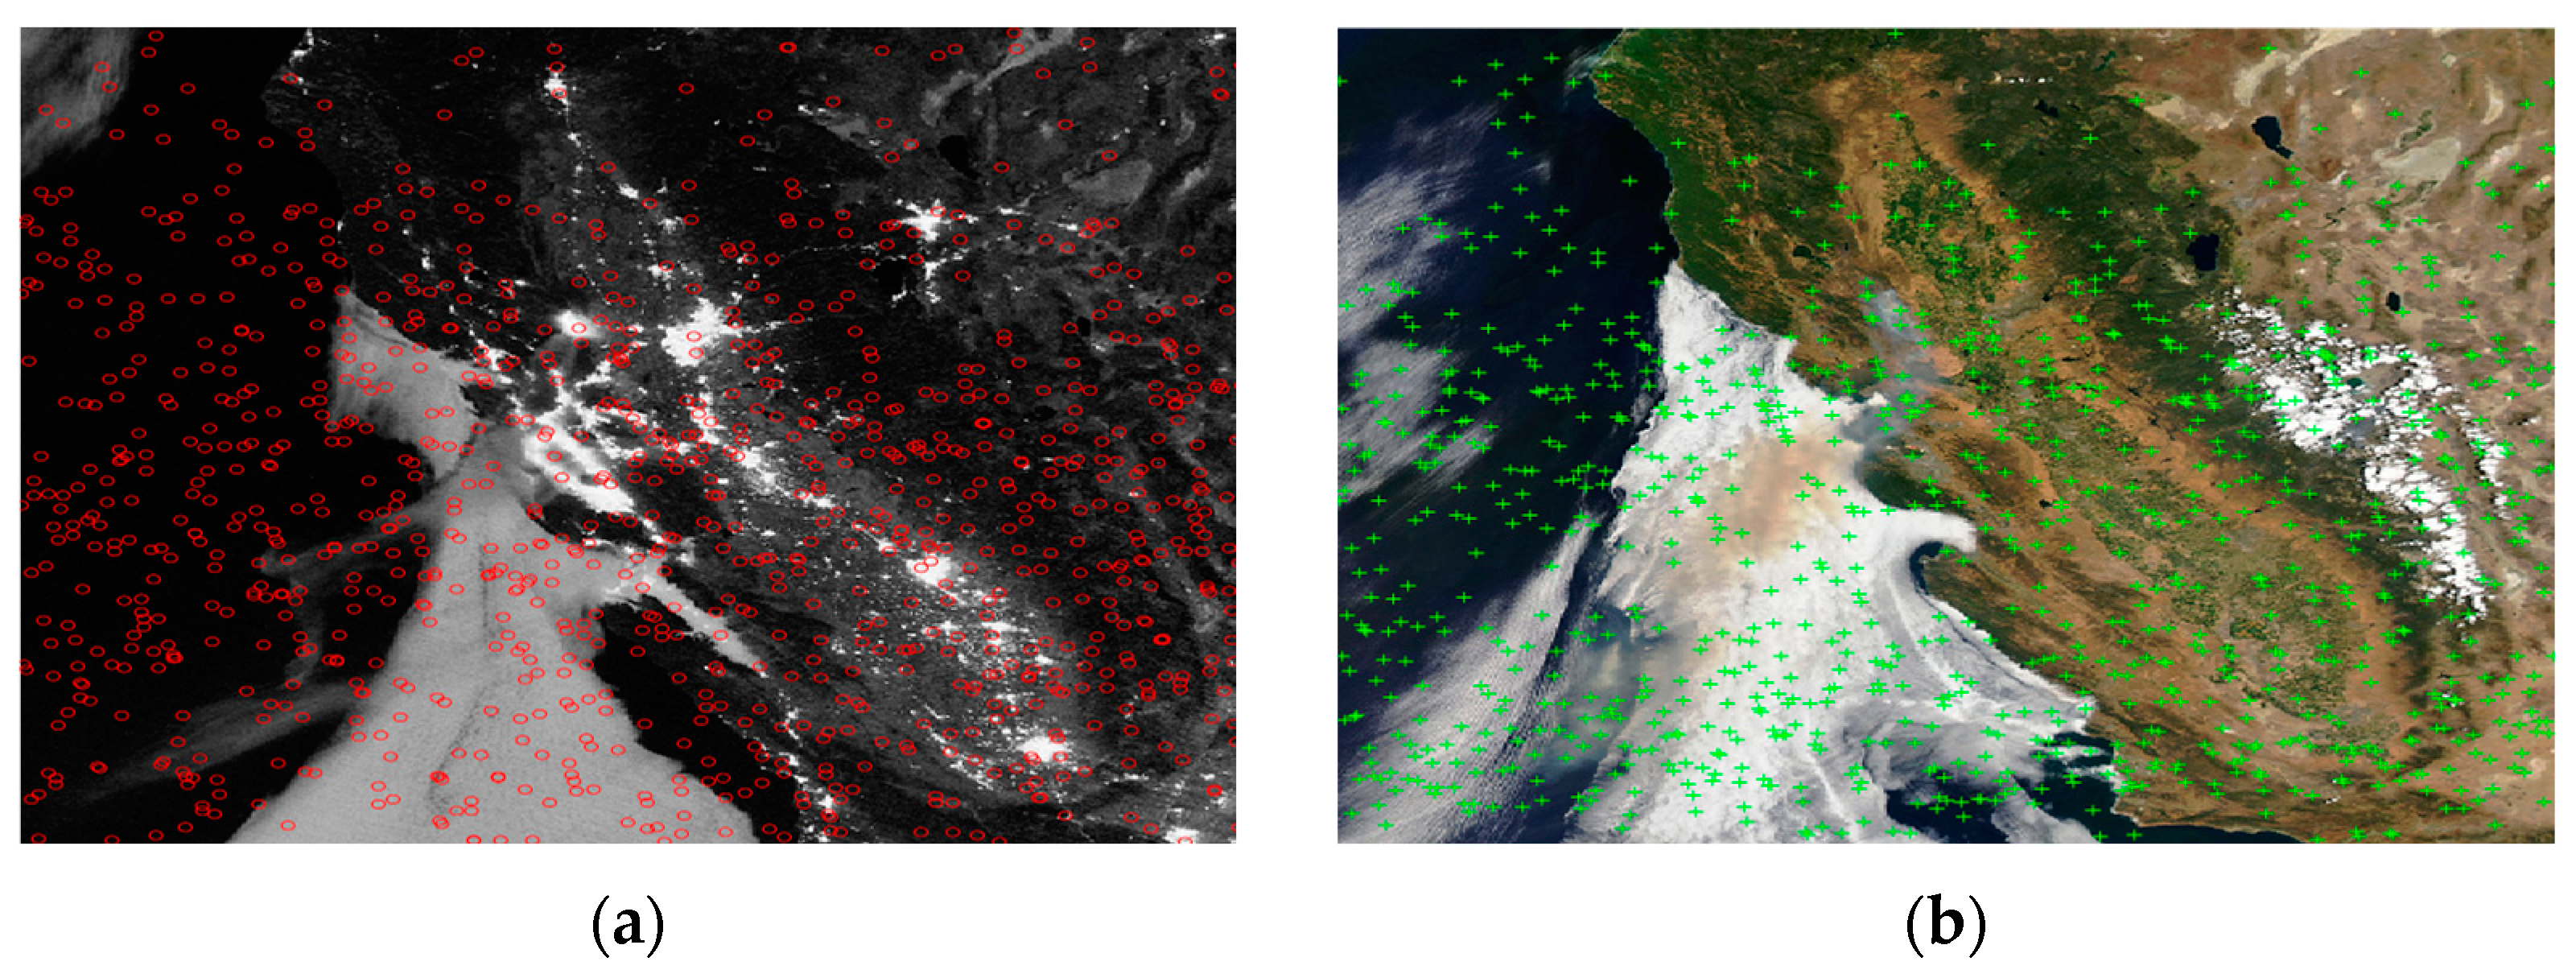
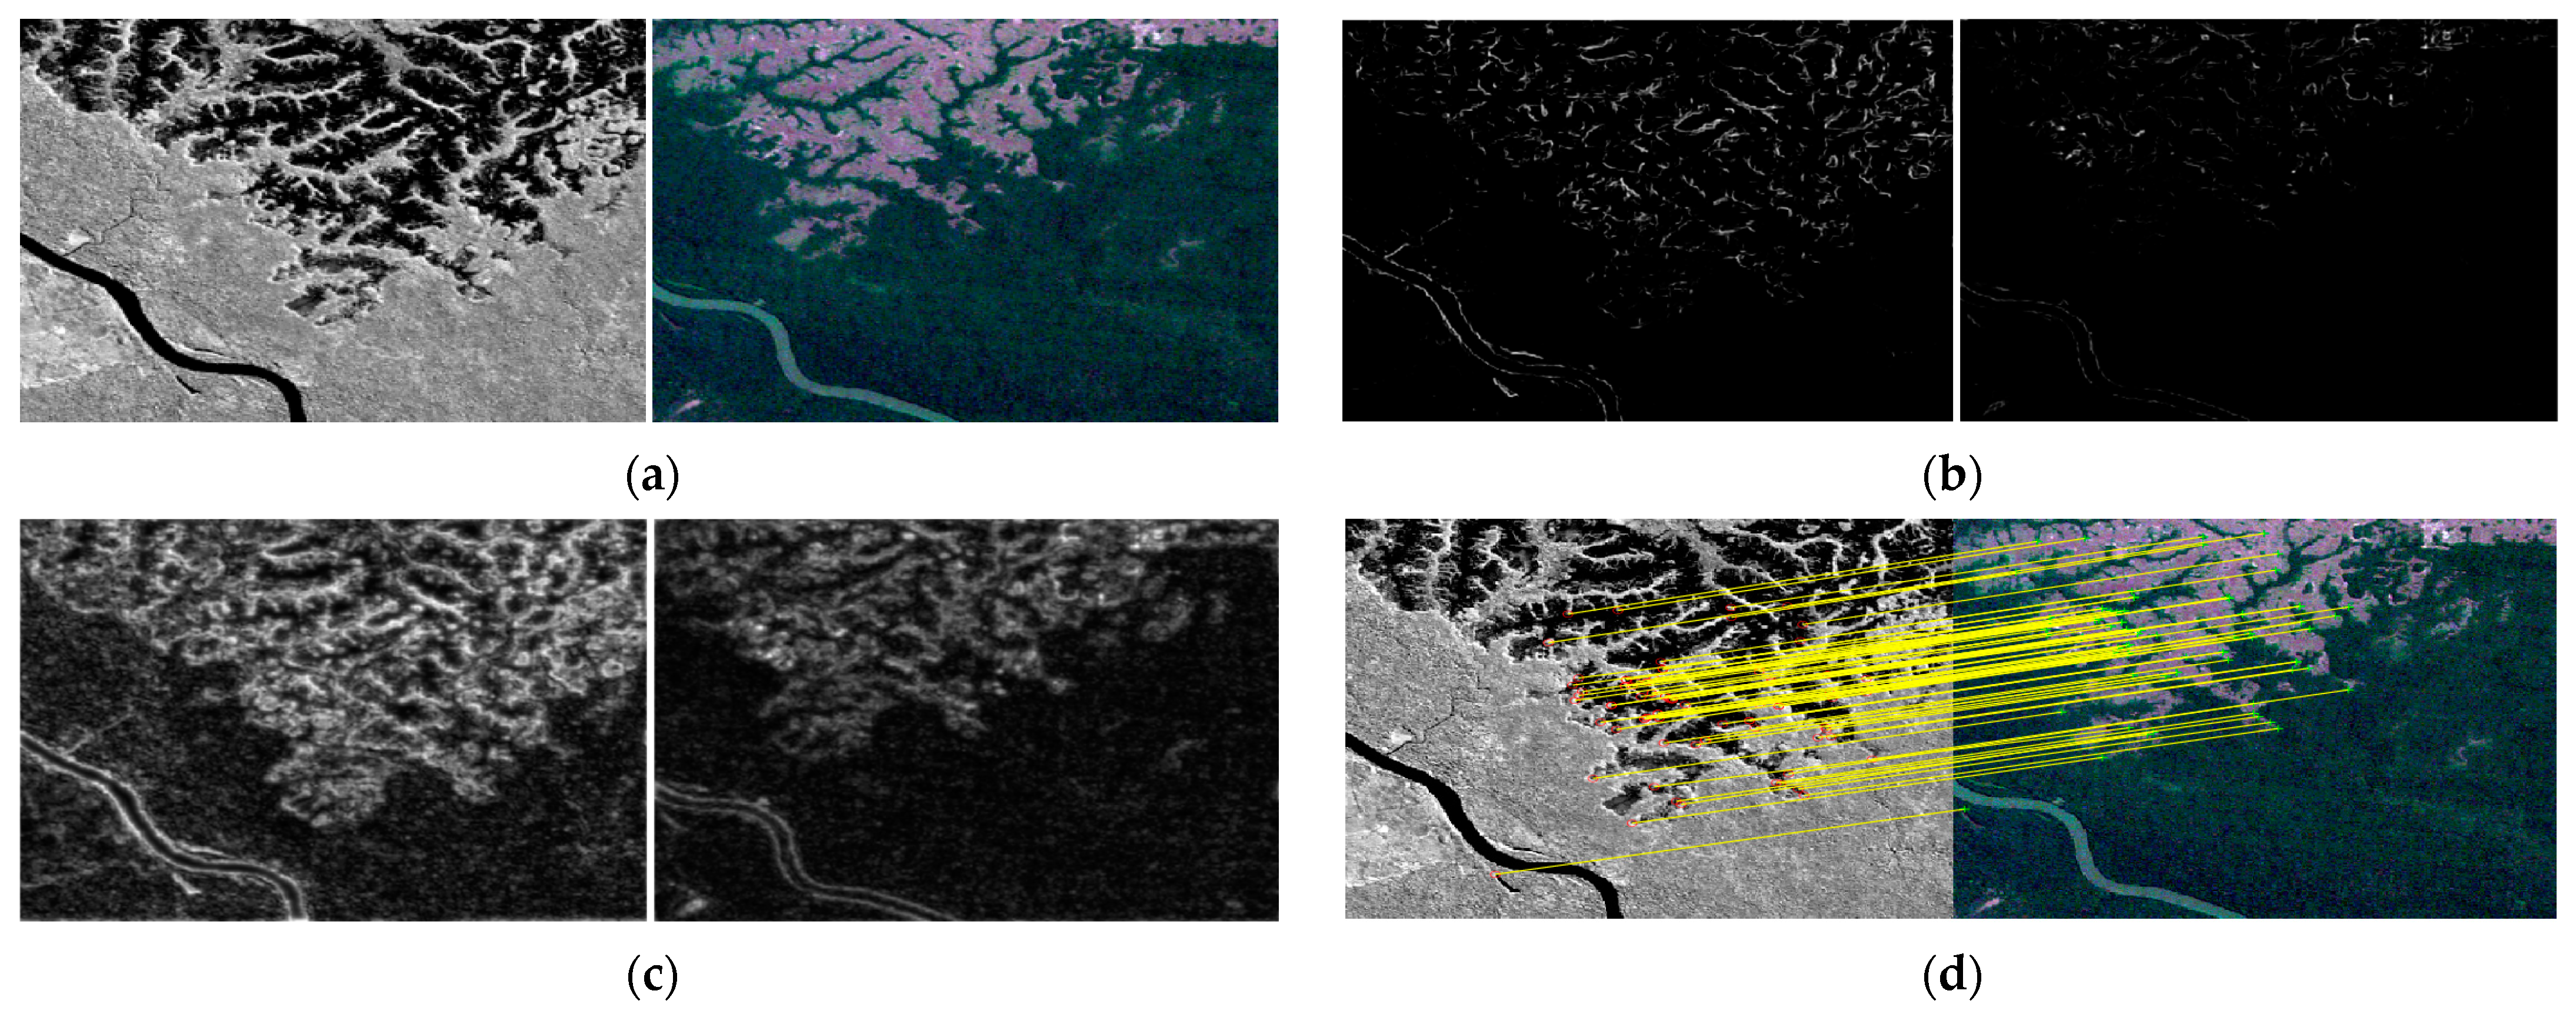
- FAST is applied on OCFMs obtained from input multimodal remote sensing image pairs to get plentiful candidate feature points.
- (2)
- To enhance the saliency of feature points, the extracted candidate feature points are ranked according to their response value in CFMs, and the top-k points will be selected as salient feature points.
- (3)
- To ensure the uniform distribution of feature points, non-maximum suppression is implemented on their neighborhood.
3.2. Construction of GCID
3.2.1. Scale-Invariant Description Region
- (1)
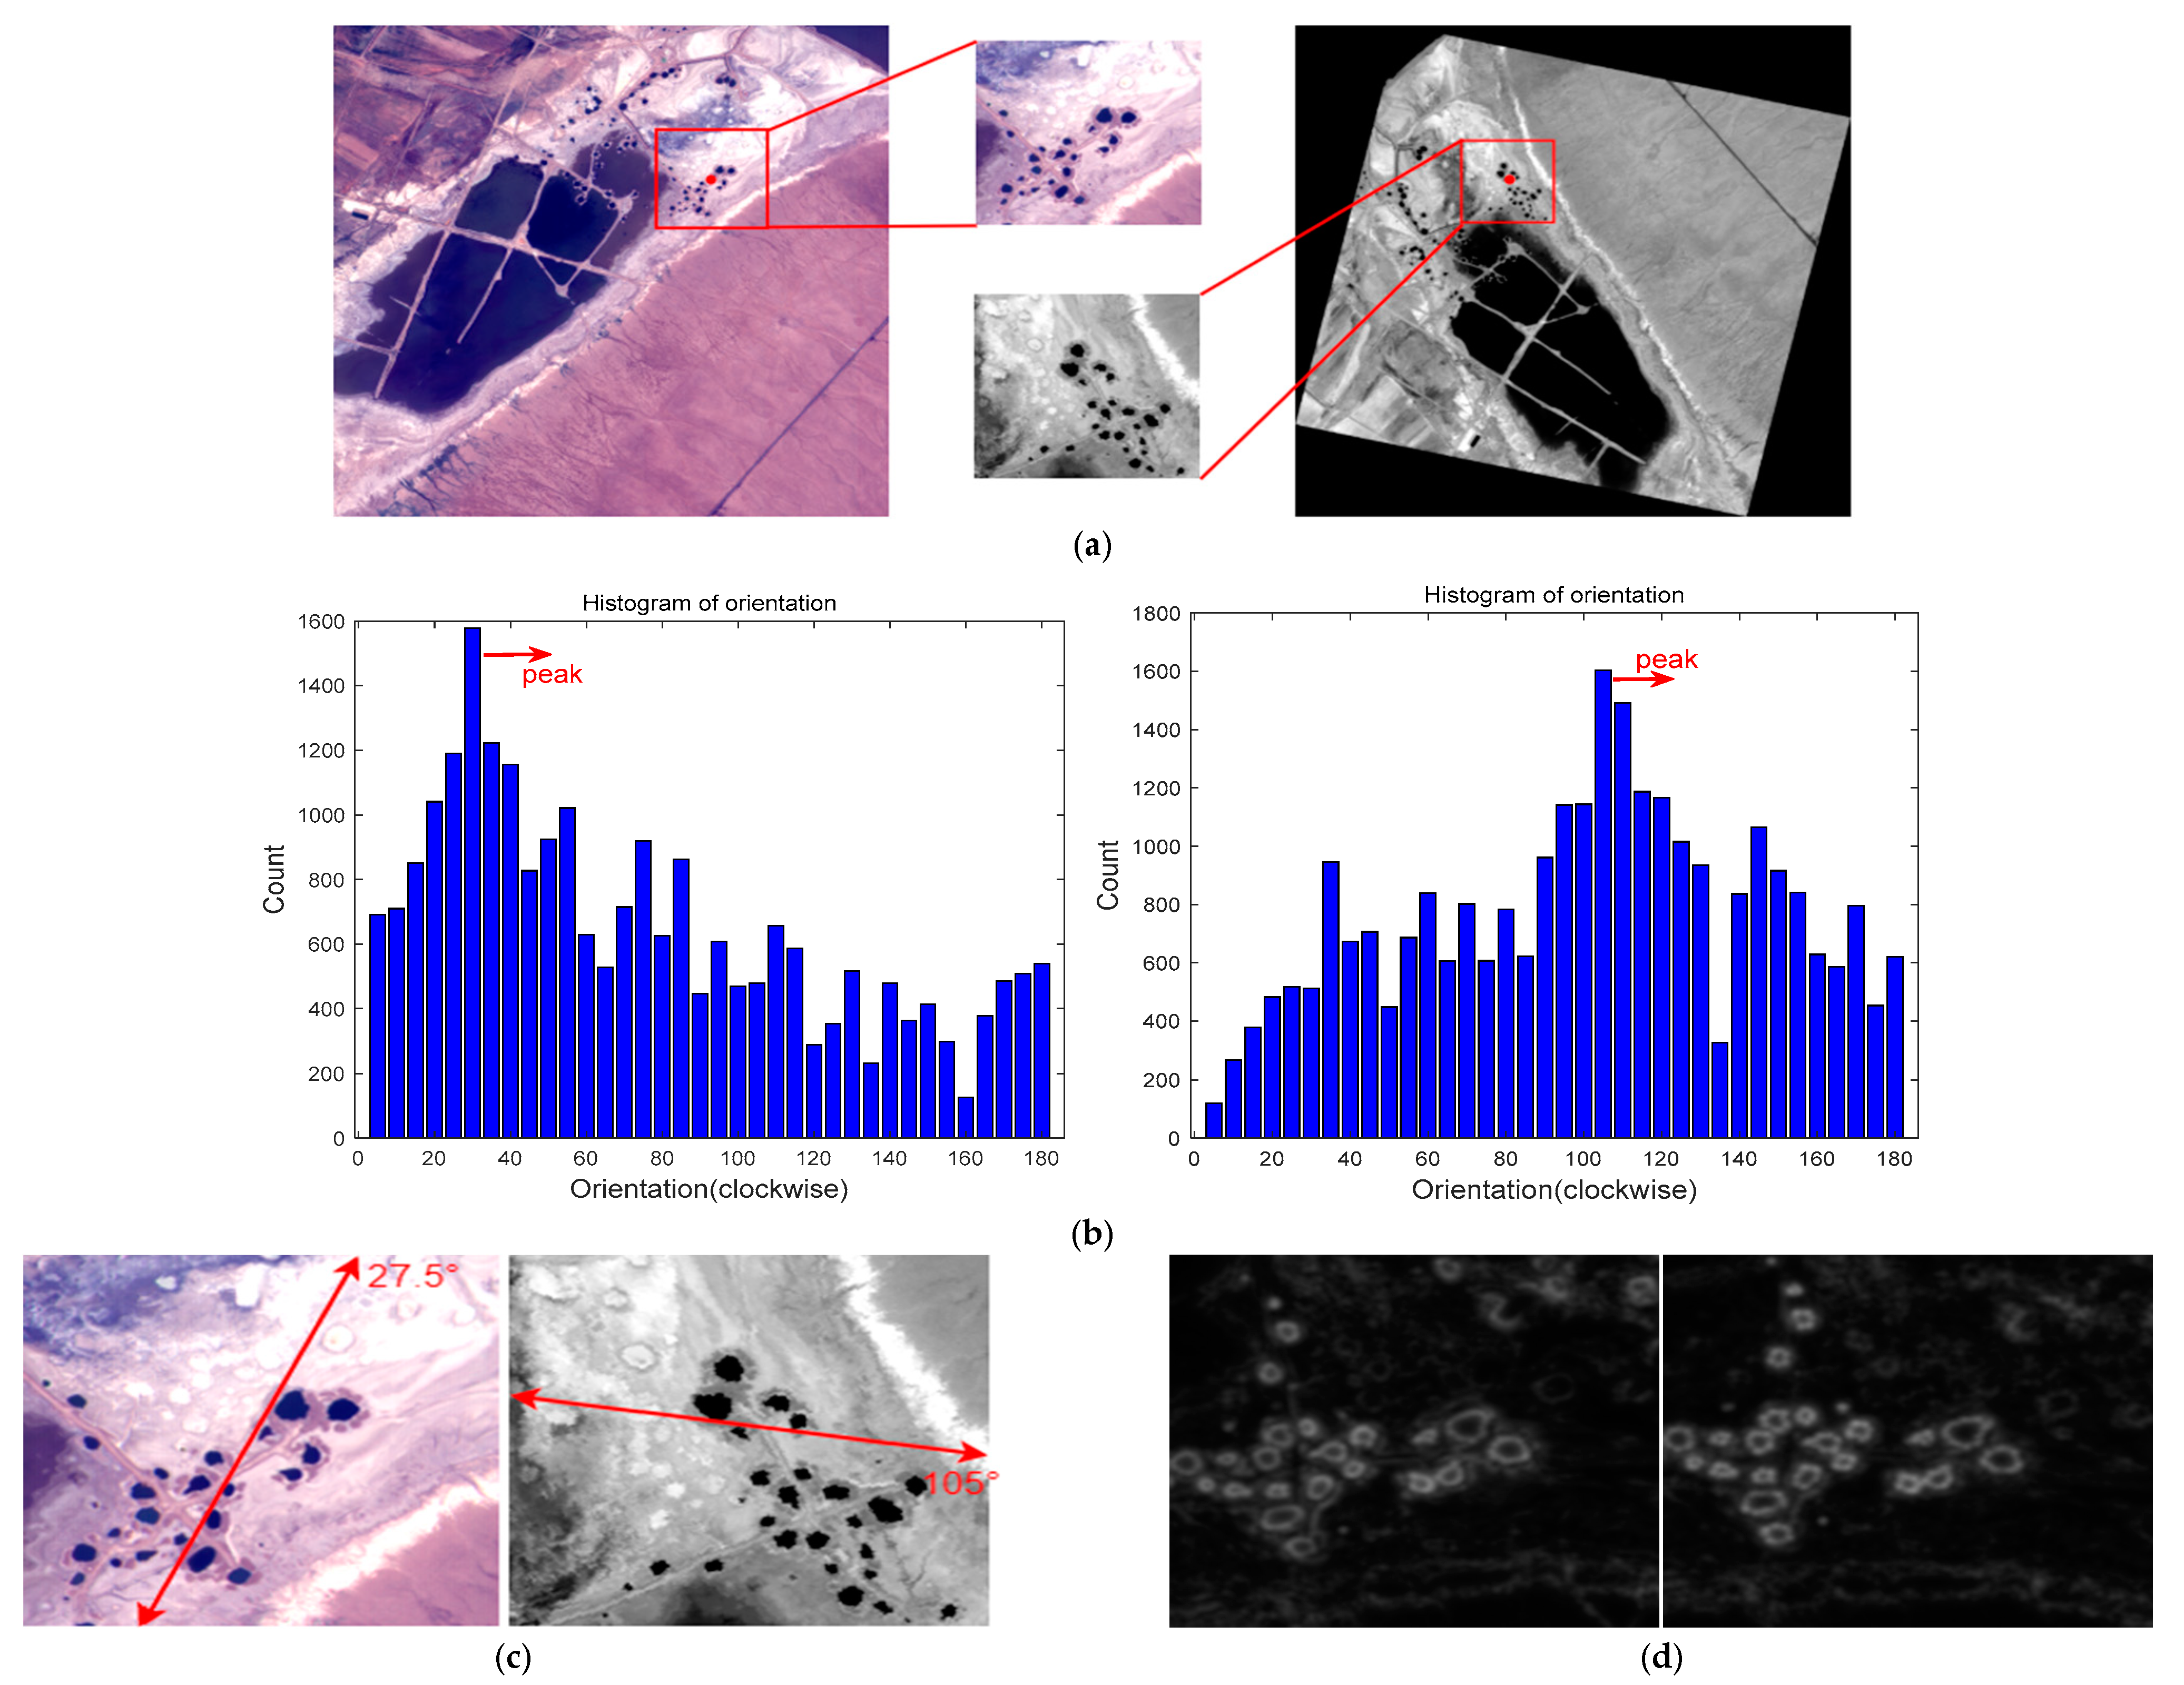
- The scale of point can be computed as follows:where is the assigned scale of point in the neighborhood of the feature point, which means that point has the maximum response at over scales. is the sum of filter responses of point in all orientations at scale .
- (2)
- In the neighborhood of the feature point, count the number of points that have the same and use the scale with the largest number of points as the scale of the feature point, which can be formulated as:where is the neighborhood of the feature point.
- (3)
- The central frequency of Log-Gabor filter controls their scales; therefore, reciprocal of that is adopted to determine the description region radius of a feature point as follows:where is the minimum wavelength, is the scale factor between successive filters, and is the initial radius. The above adaptive determination of the description regions can realize the scale invariance of the feature.
3.2.2. Rotation-Invariant Description Region
- (1)
- To improve the stability of description on image contrast, the range of the histogram is (0~180°); therefore, the histogram contains 36 bins, and every 5° is counted as one bin. Each bin can be calculated by ORM and Gaussian weighted JLFM as follows:where is the description region of a feature point.
- (2)
- Smoothing of the histogram is performed; the highest peak of the histogram is taken as the dominant orientation; the second highest peak that exceeds 80% of the highest peak is regarded as the auxiliary orientation.
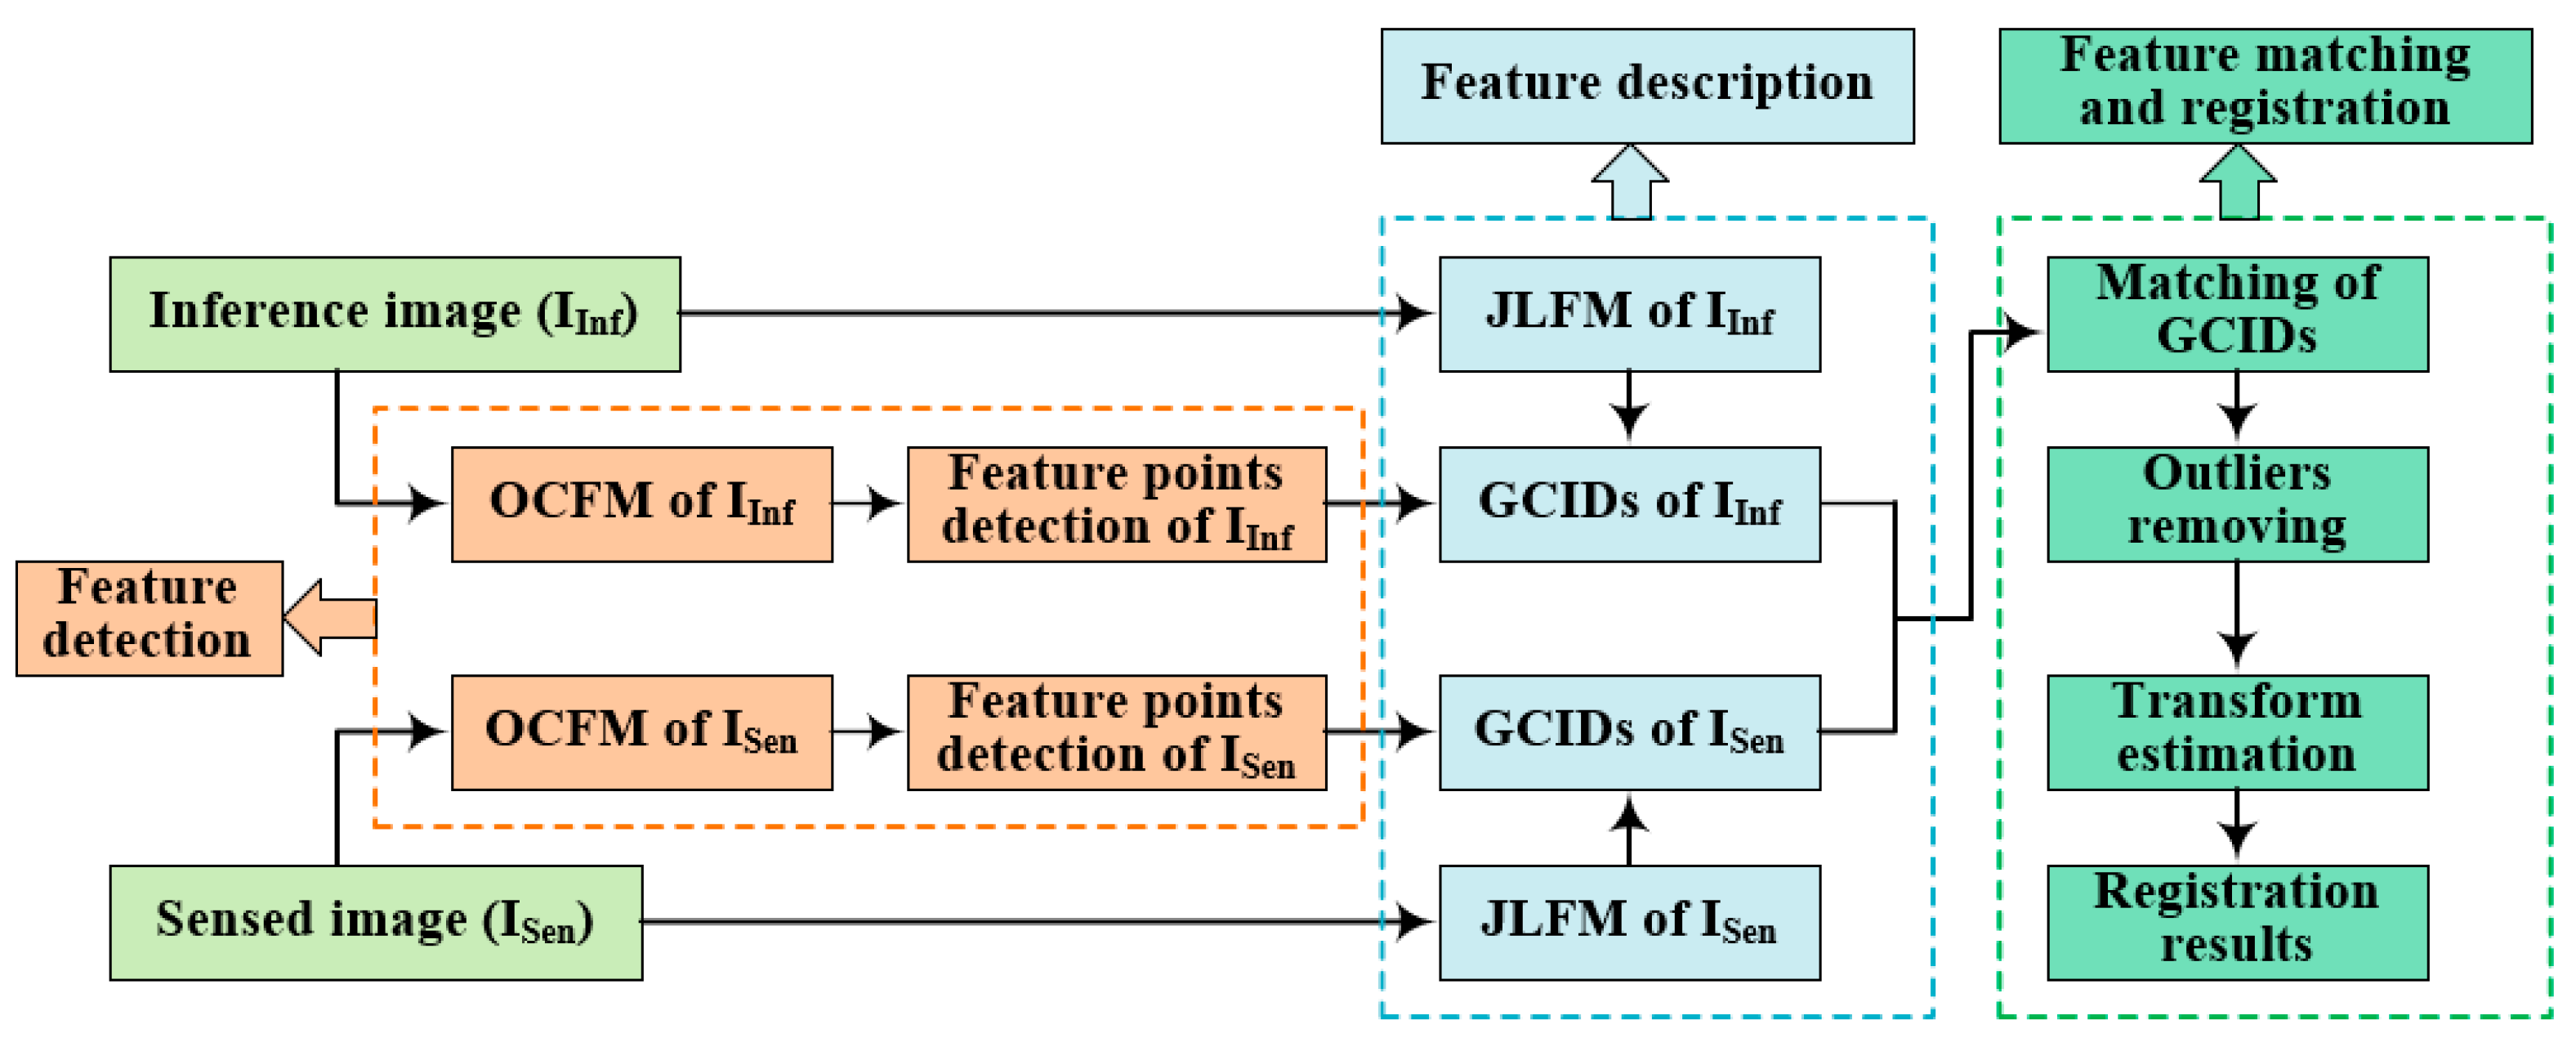
3.3. Registration Framework by Using GCID
- (1)
- OCFMs are first computed from and by Formulas (1)–(8), respectively and then feature points are detected by FAST and non-maximum suppression on OCFMs.
- (2)
- JLFMs are obtained from and by combing Log-Gabor filter responses over scales and orientations by Formulas (9) and (10).
- (3)
- GCIDs from and are generated by using JLFMs and feature points obtained by steps (1) and (2) according to Formulas (11)–(18), respectively.
- (4)
- Matching results of GCIDs from and are computed by their distance similarity; the outliers are removed by random sample consensus (RANSAC).
- (5)
- Transformation is estimated according to the matching results; the registration of and are achieved.
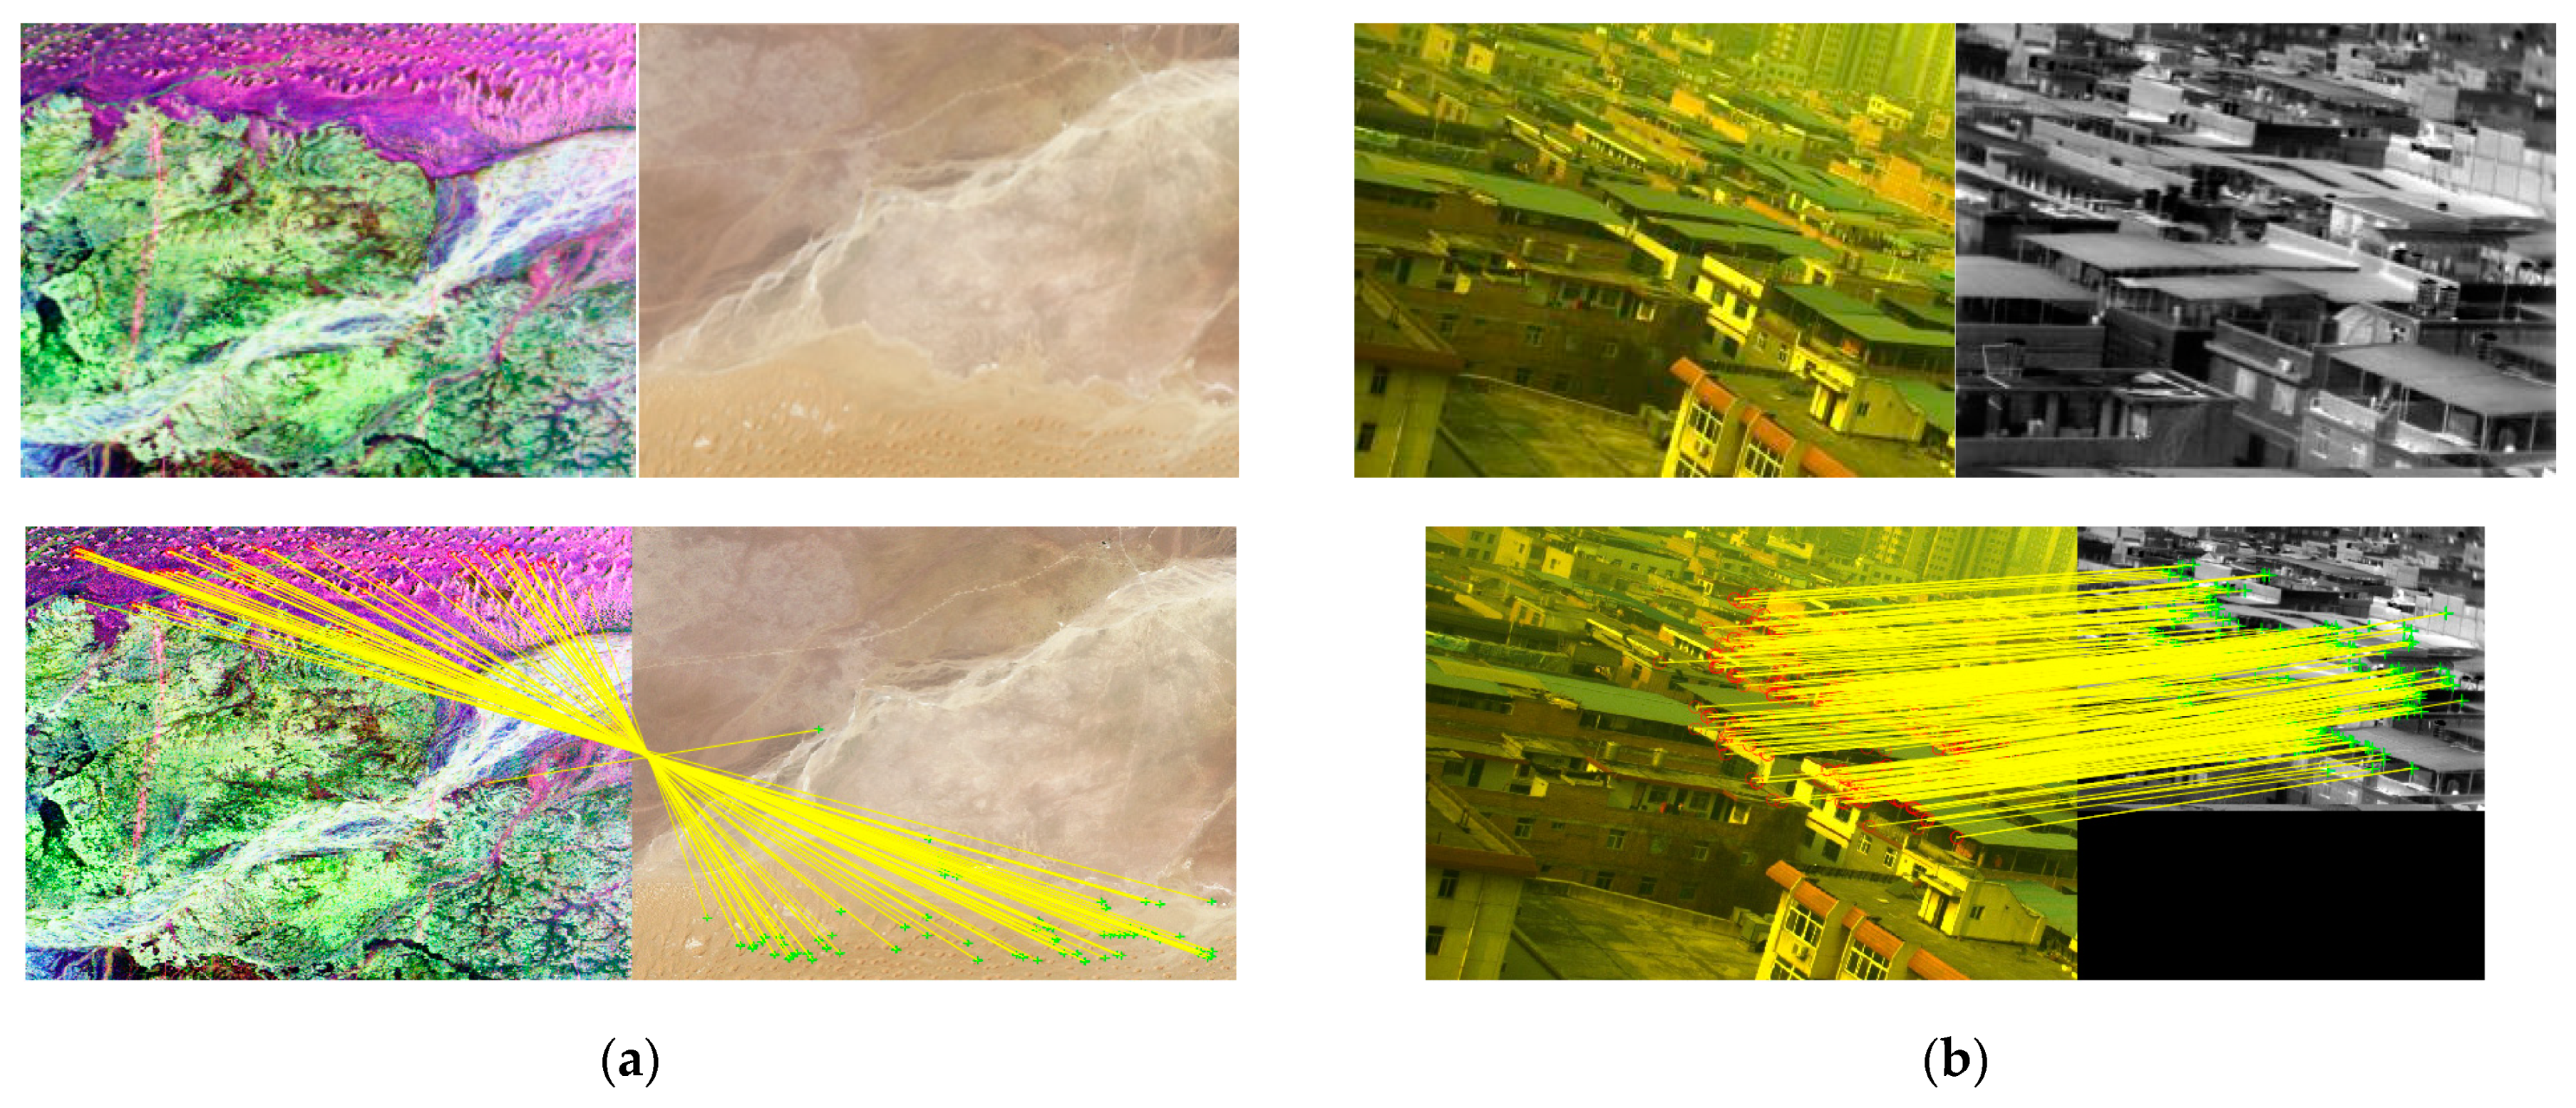
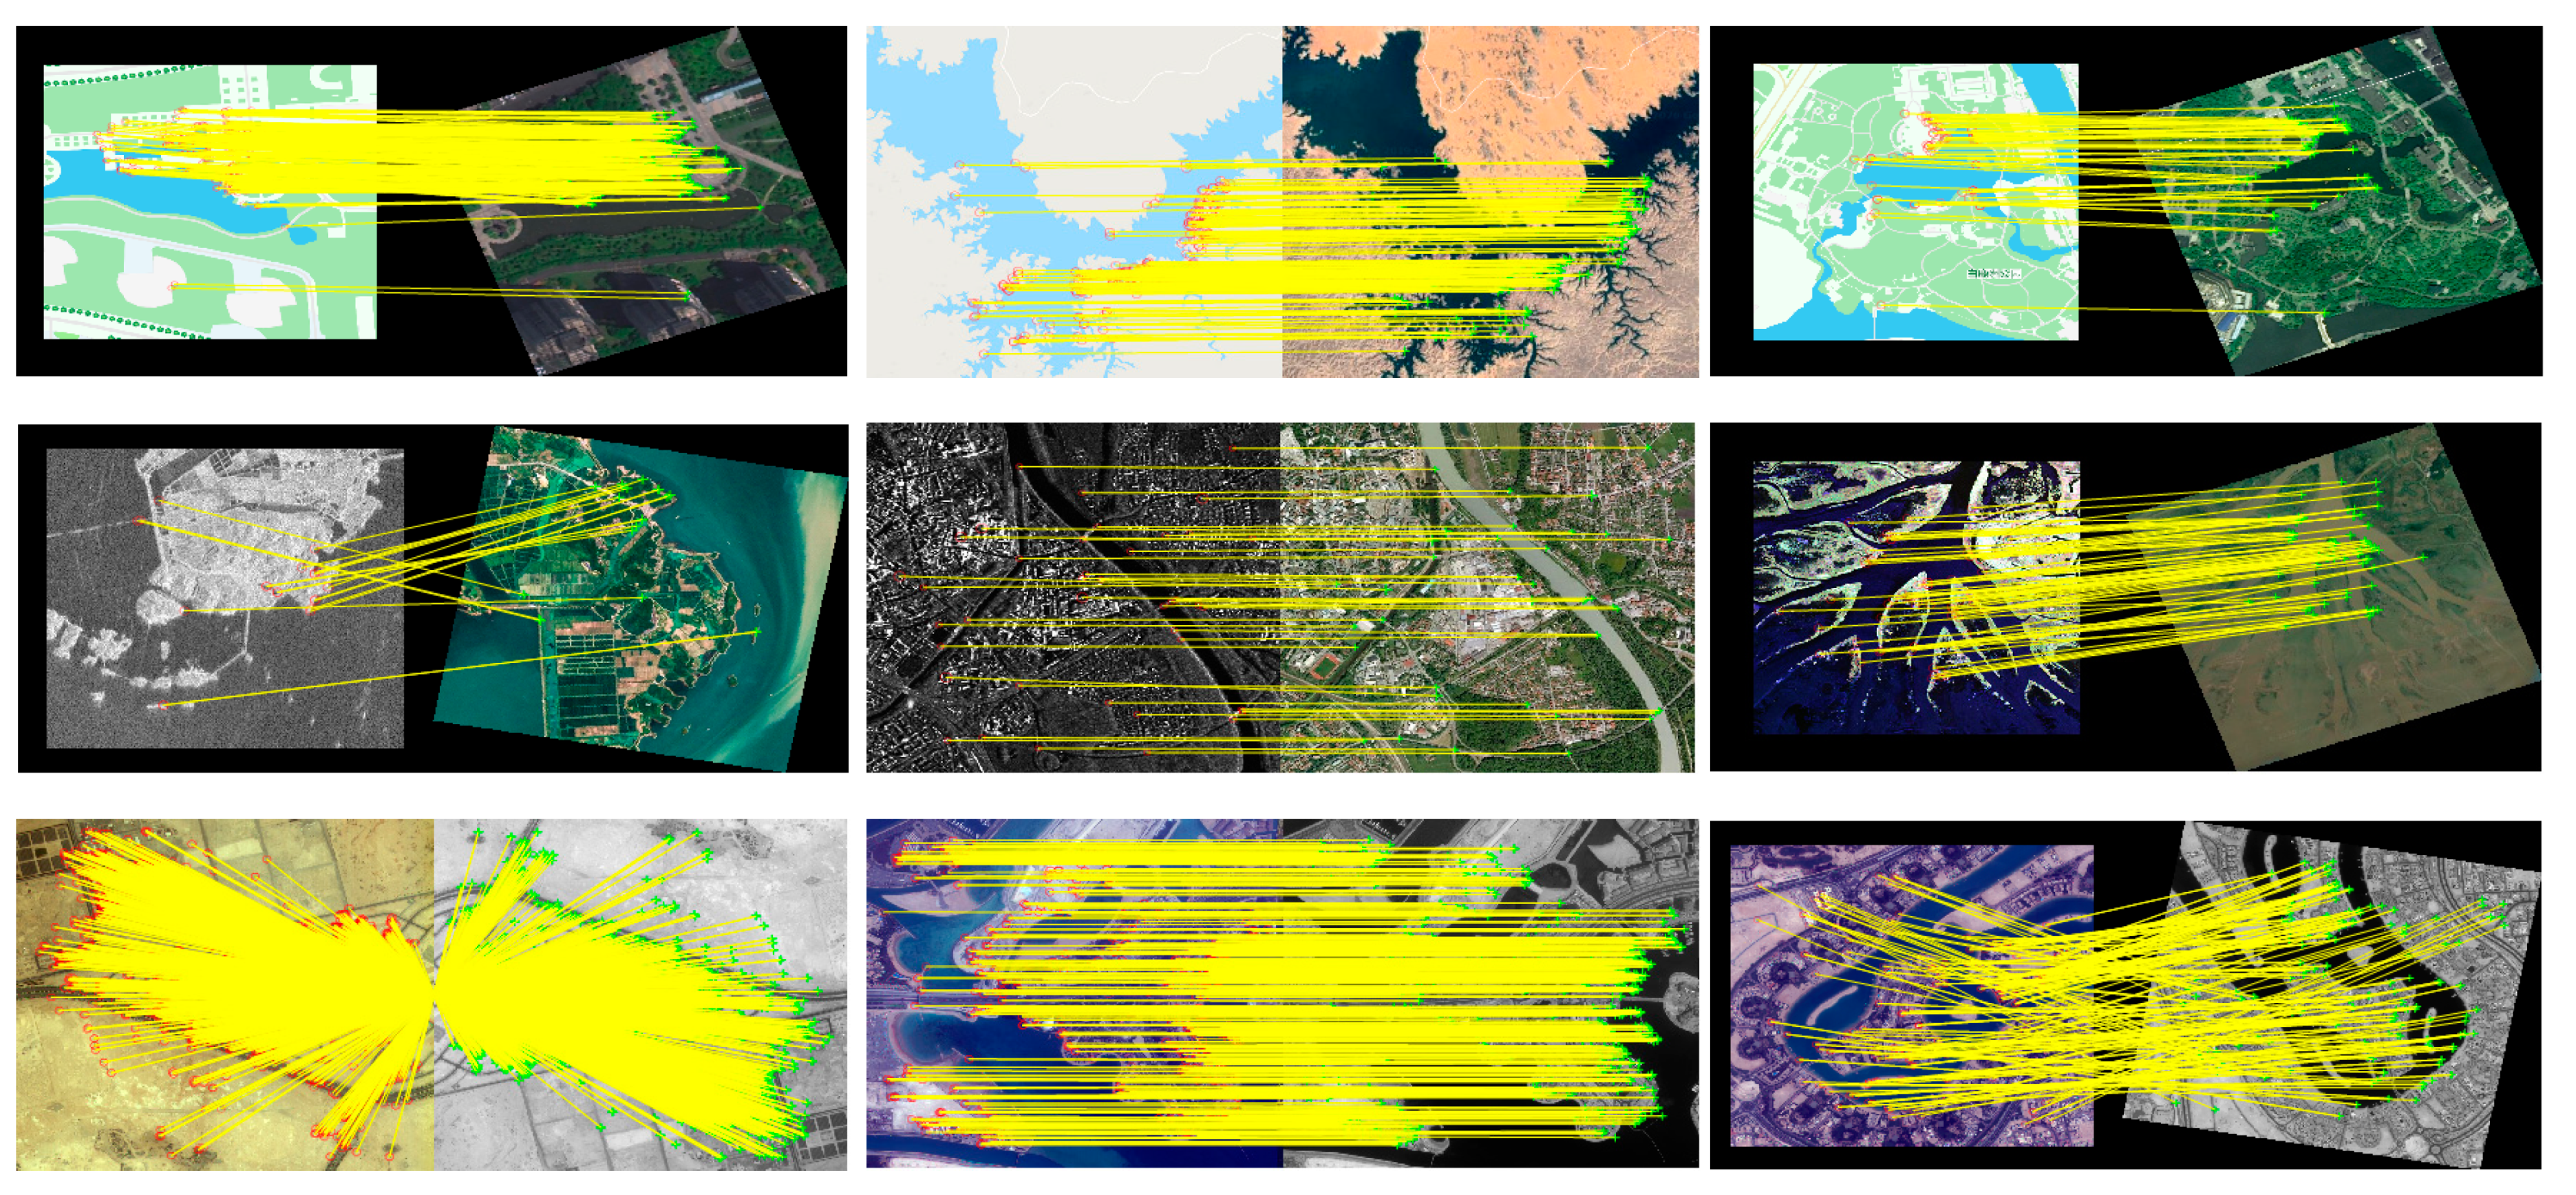
4. Experiment Results and Analysis
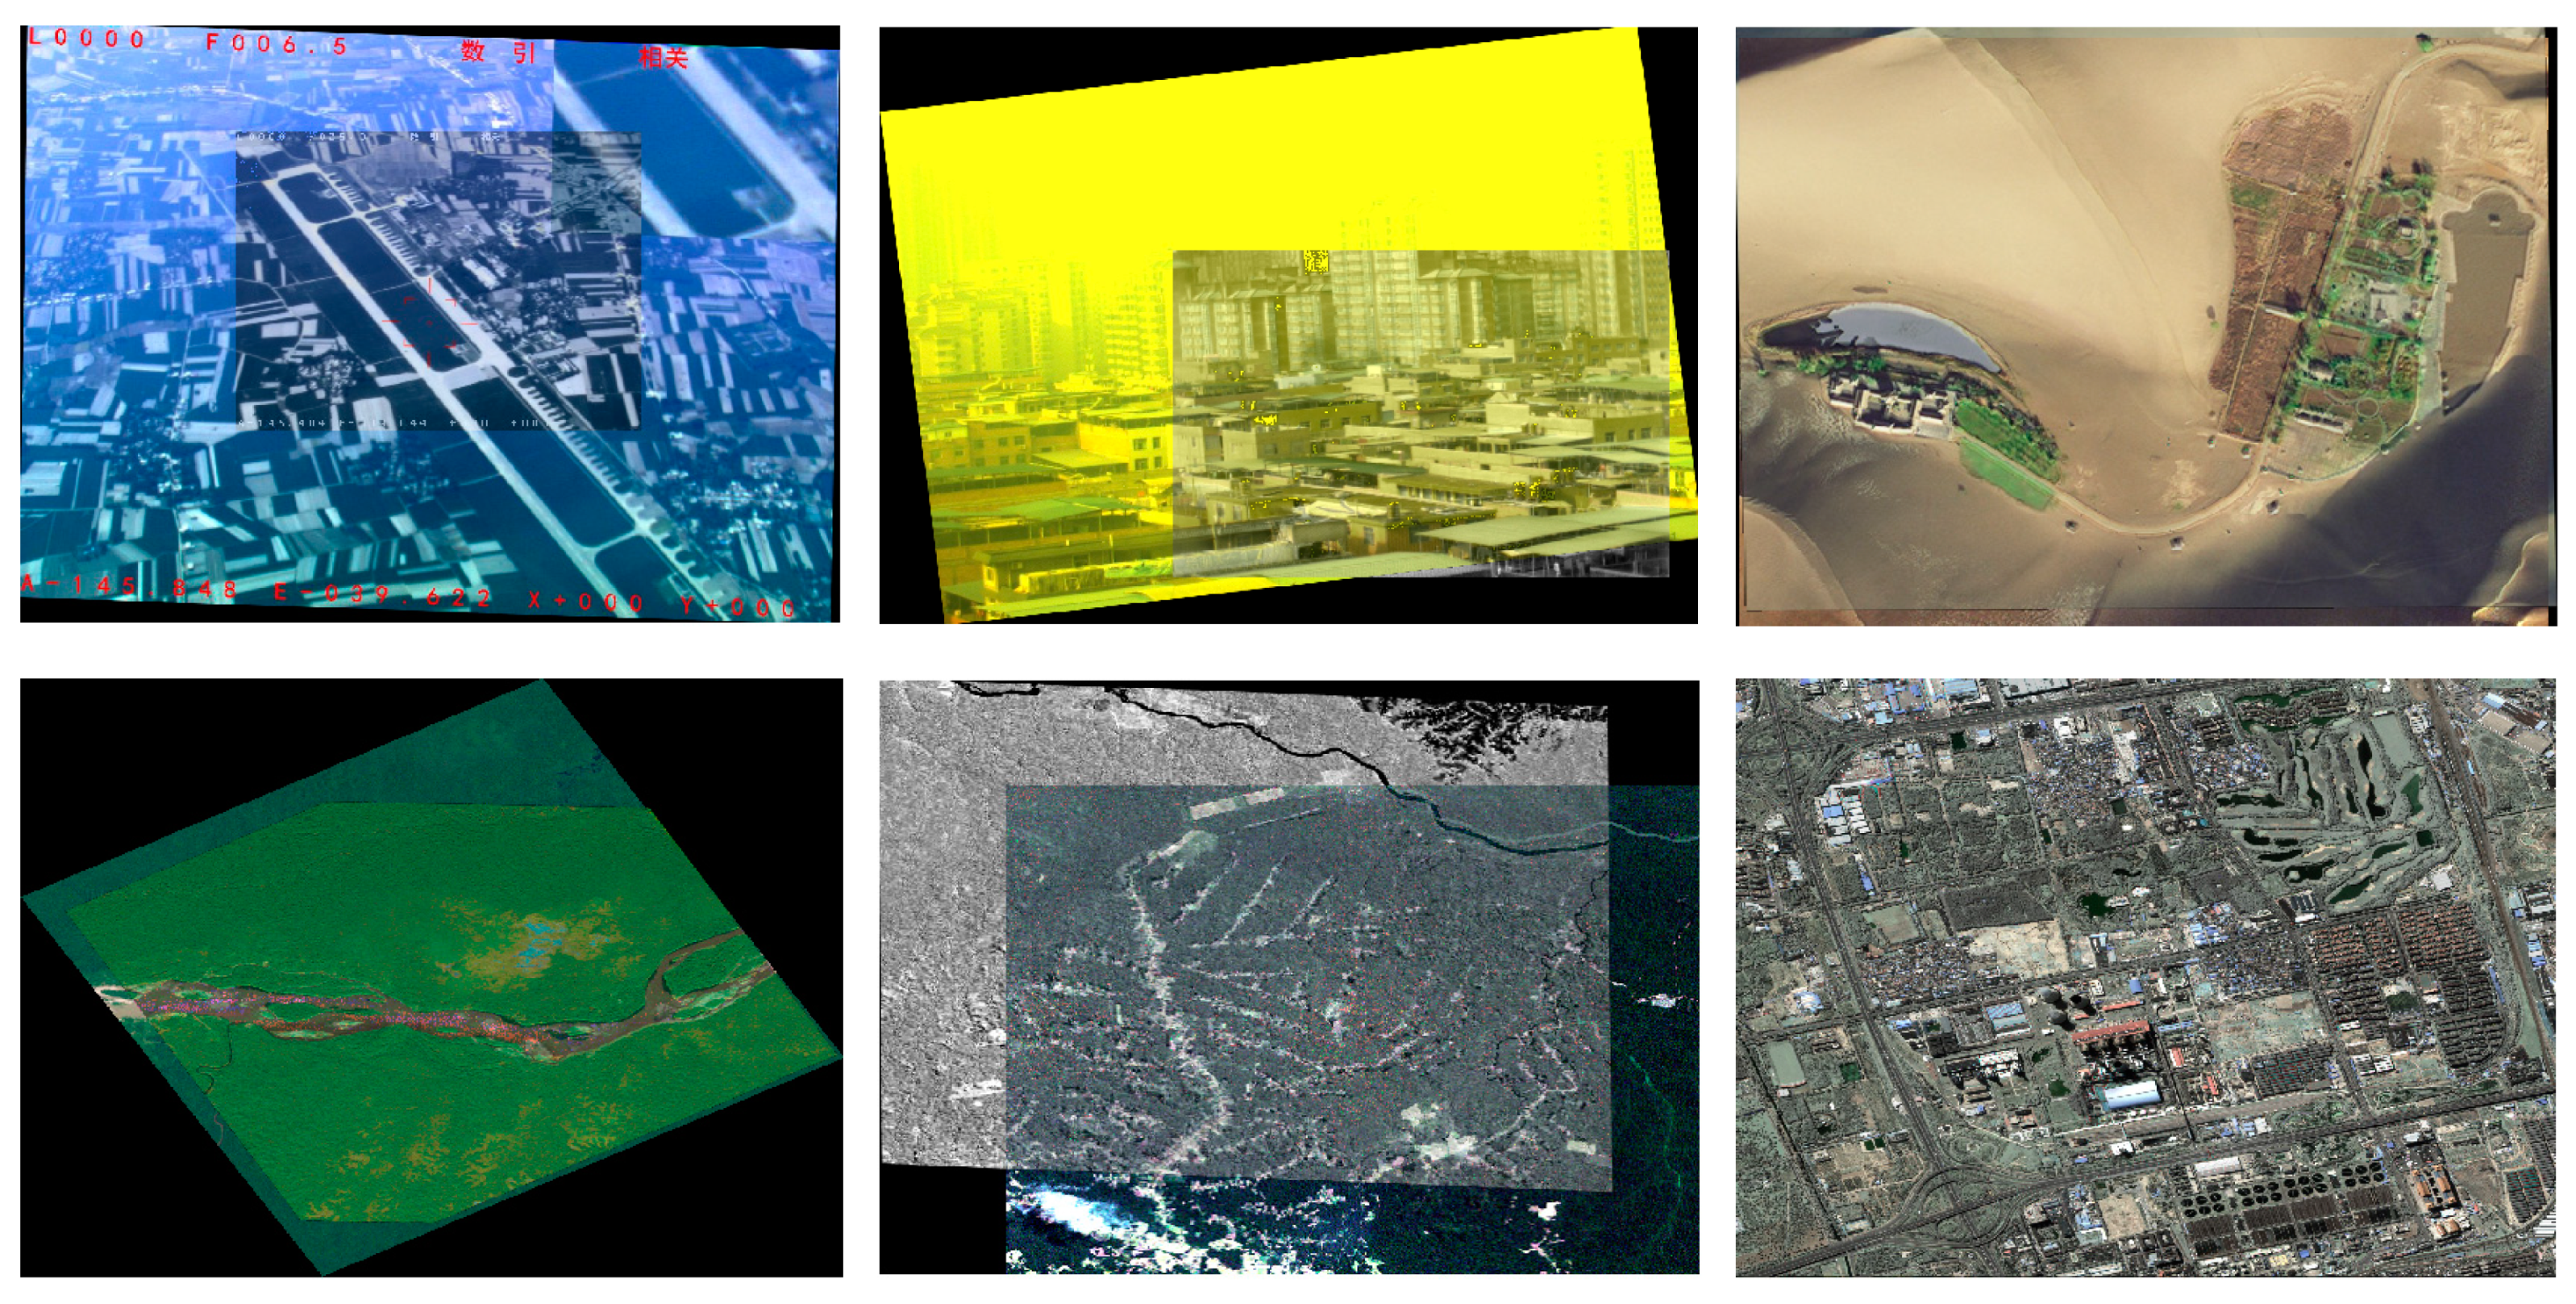
4.1. Multimodal Remote Sensing Datasets
- (1)
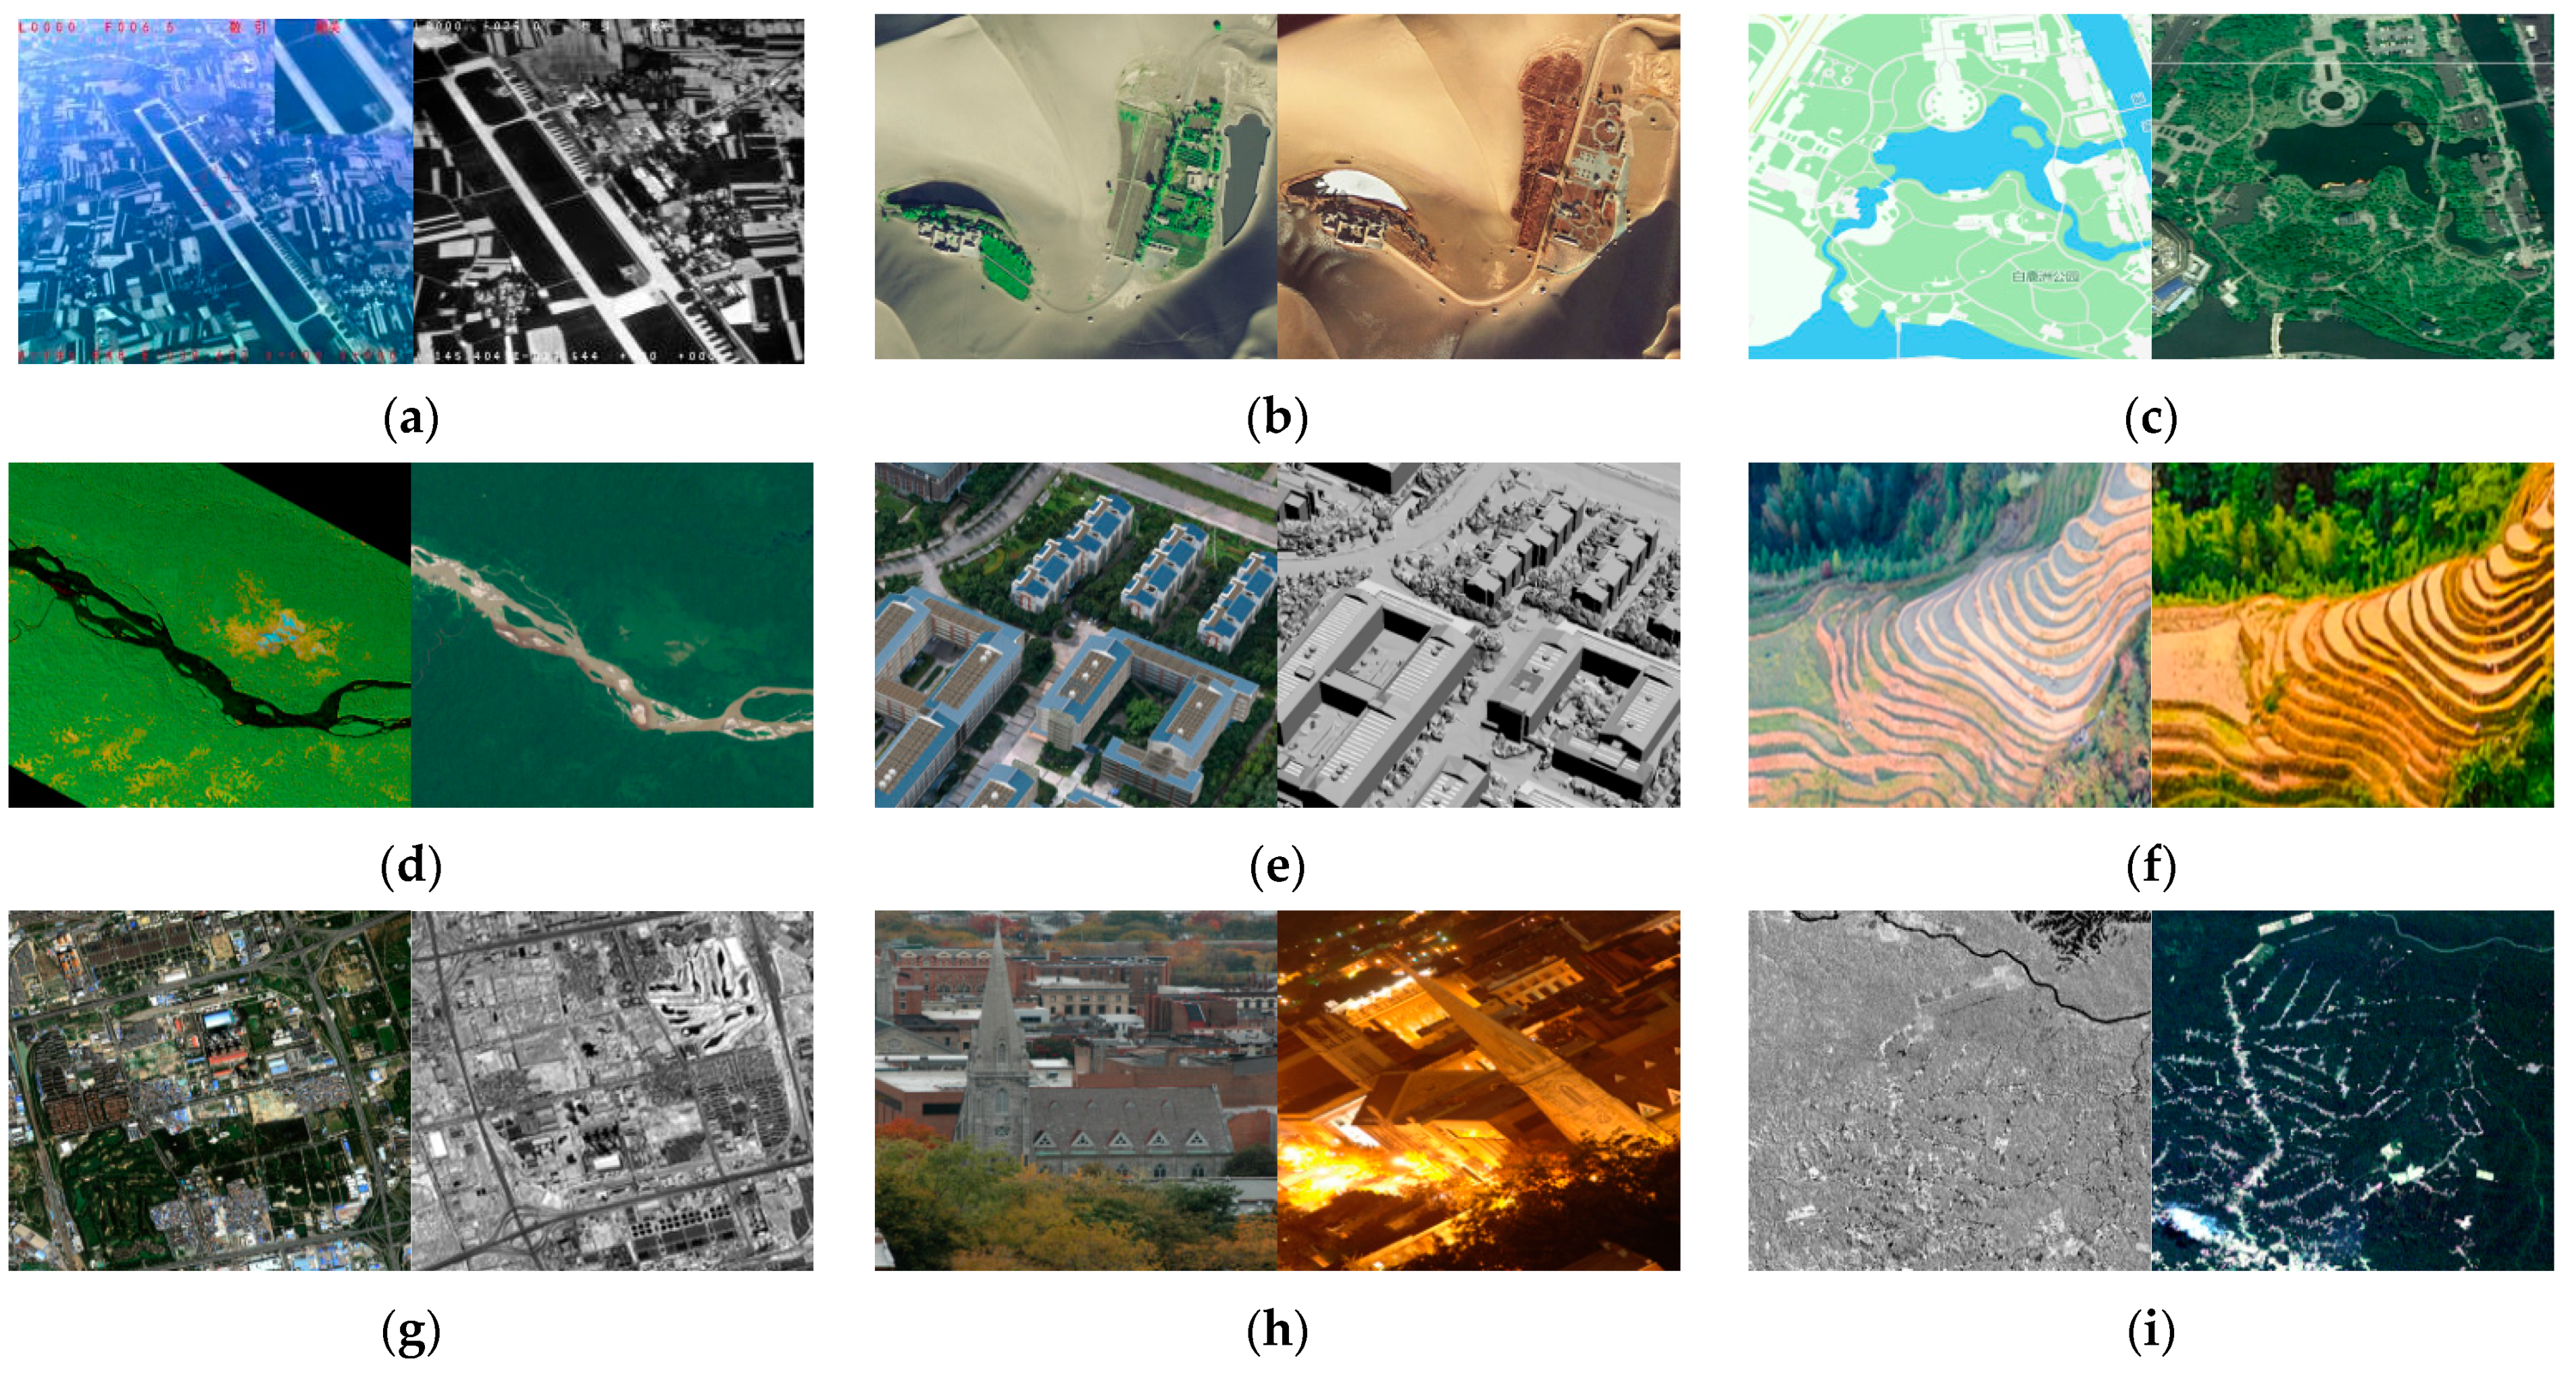
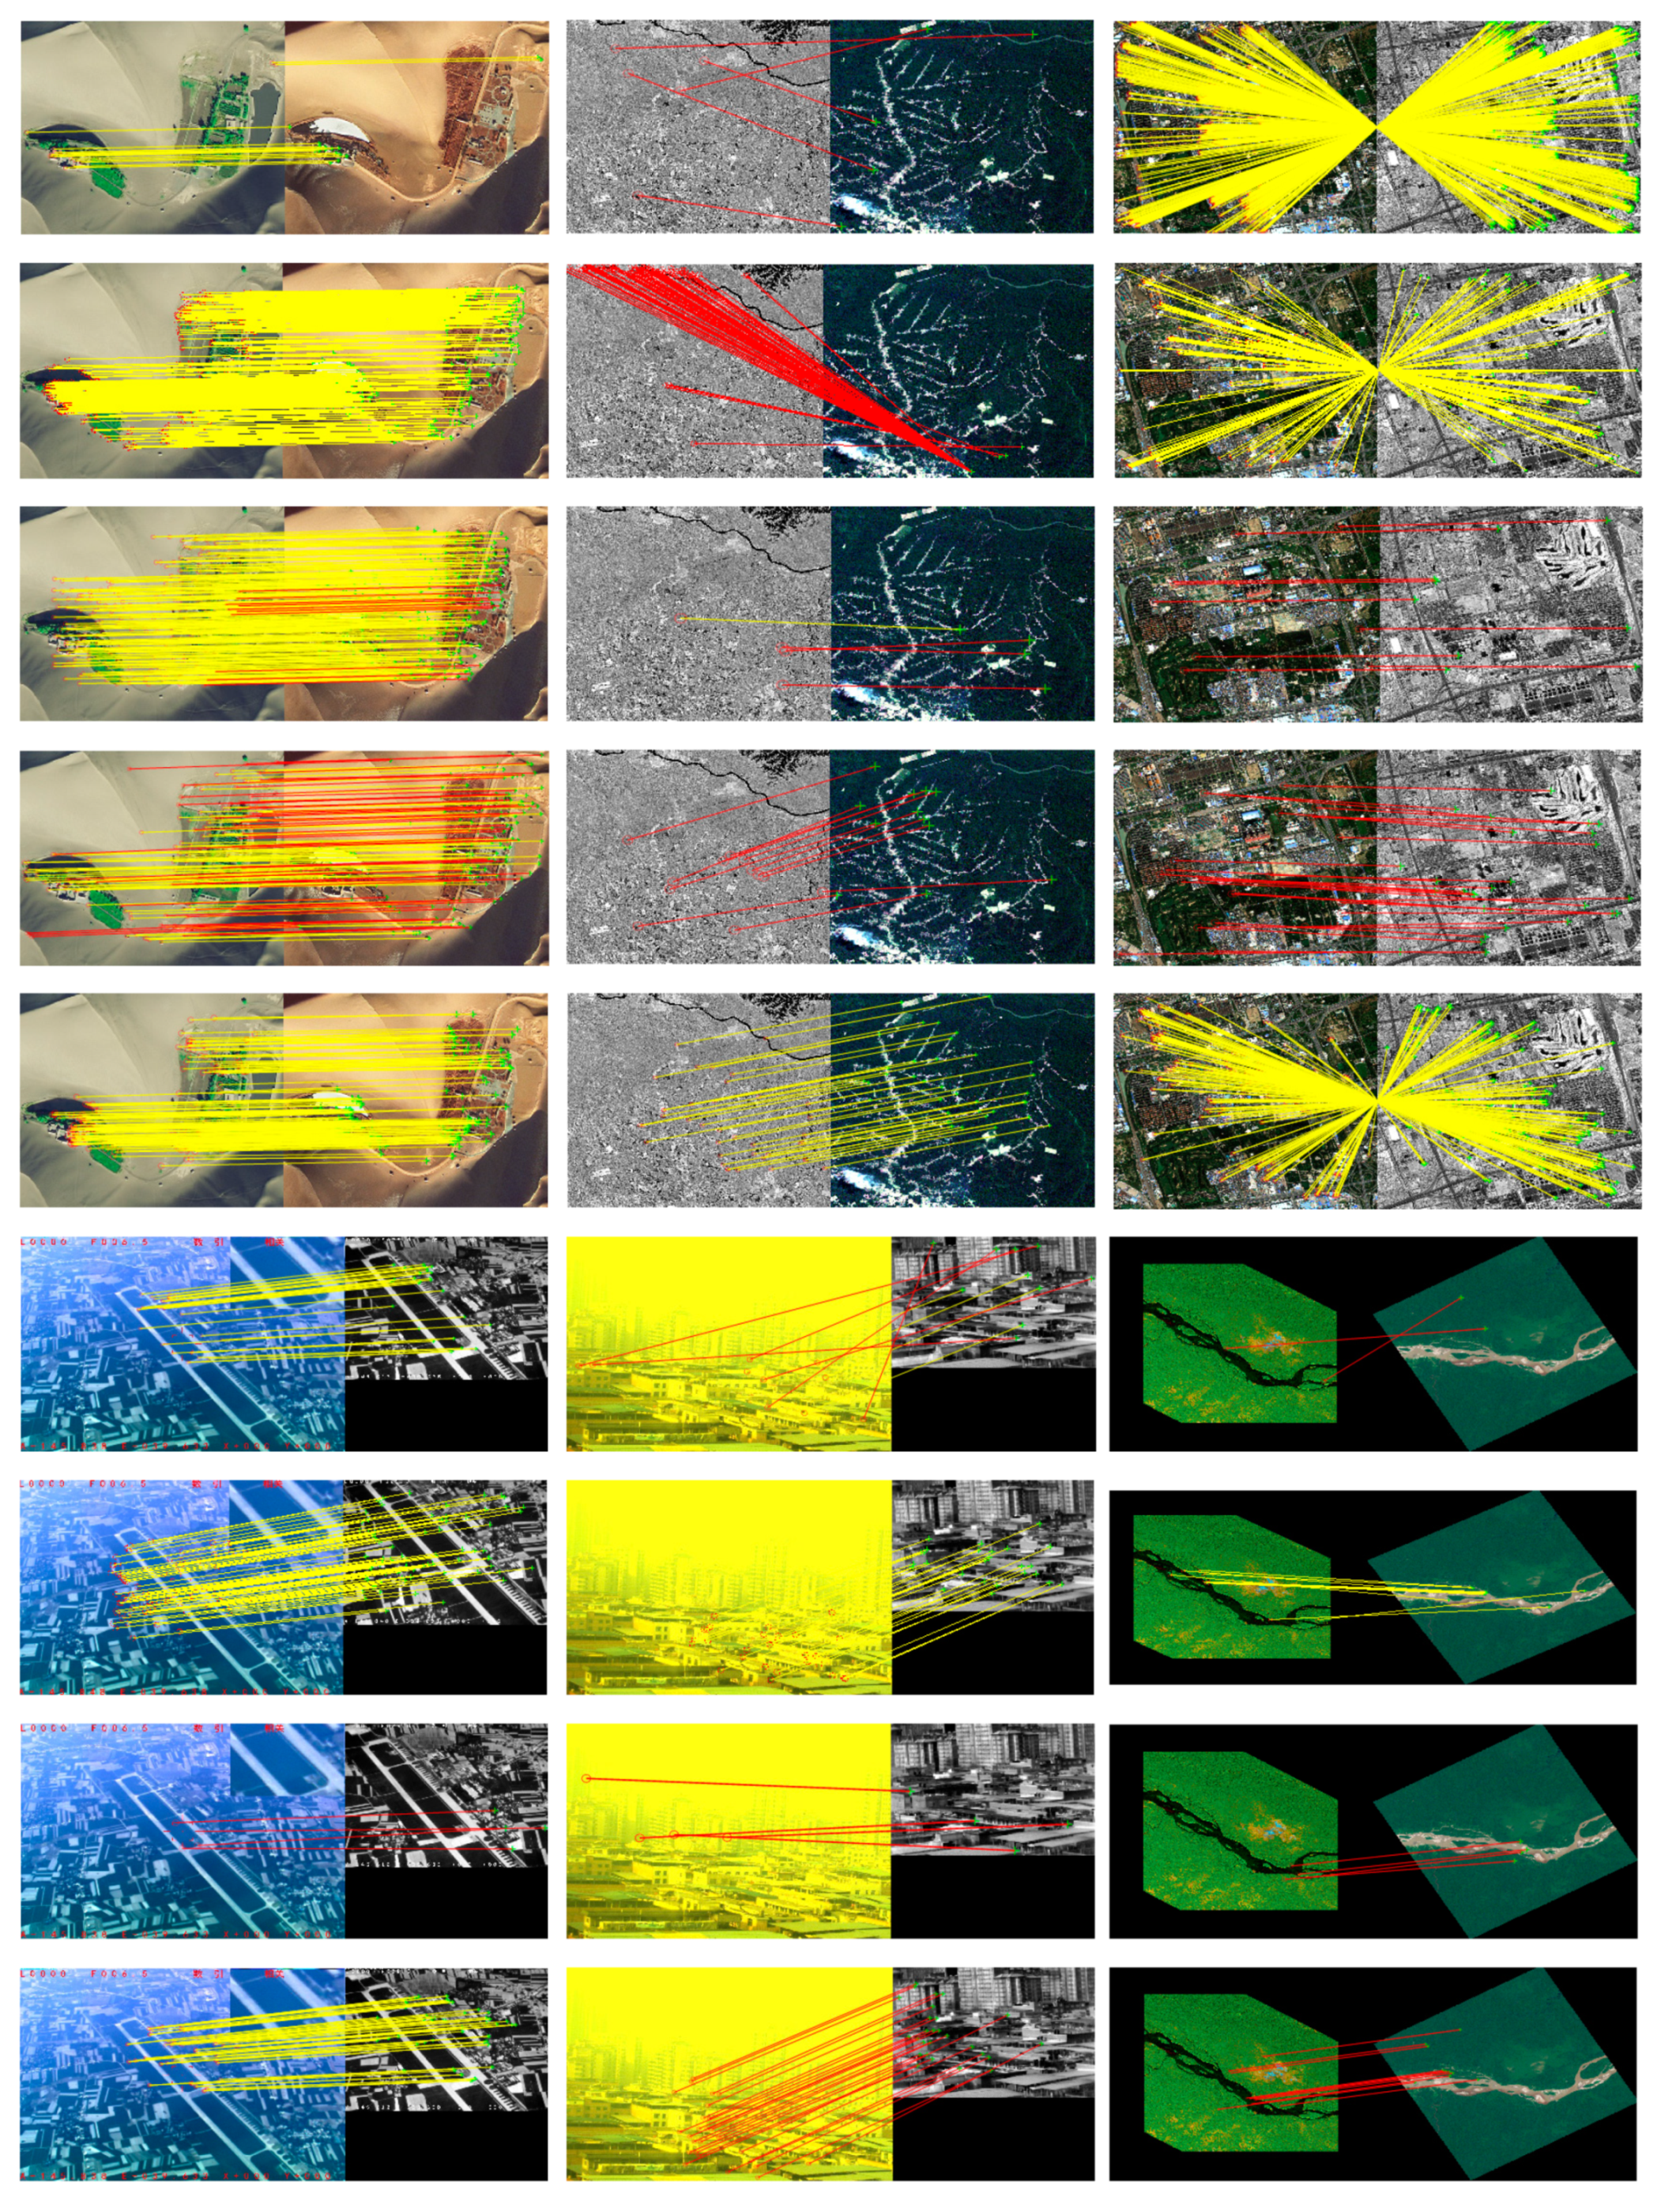
- Remote sensing dataset [14]: the dataset contains 78 image pairs, which can be divided into 7 modal types, such as UAV cross-season images, visible day-night, LiDAR depth-optical, infrared-optical, map-optical, optical cross-temporal, and SAR-optical images. These images have different resolutions ranging from to , while the corresponding images have the same resolution; therefore, differences in contrast and inconsistencies in detail are the main changes between them.
- (2)
- Computer vision dataset [14]: this dataset contains 54 image pairs, which includes 4 modal types, such as visible-infrared images, visible cross-season, day-night, and RGB-NIR images. These images have different resolutions ranging from to ; the corresponding images have the same resolution. Contrast difference and geometric deformation are the main changes between the image pairs.
- (3)
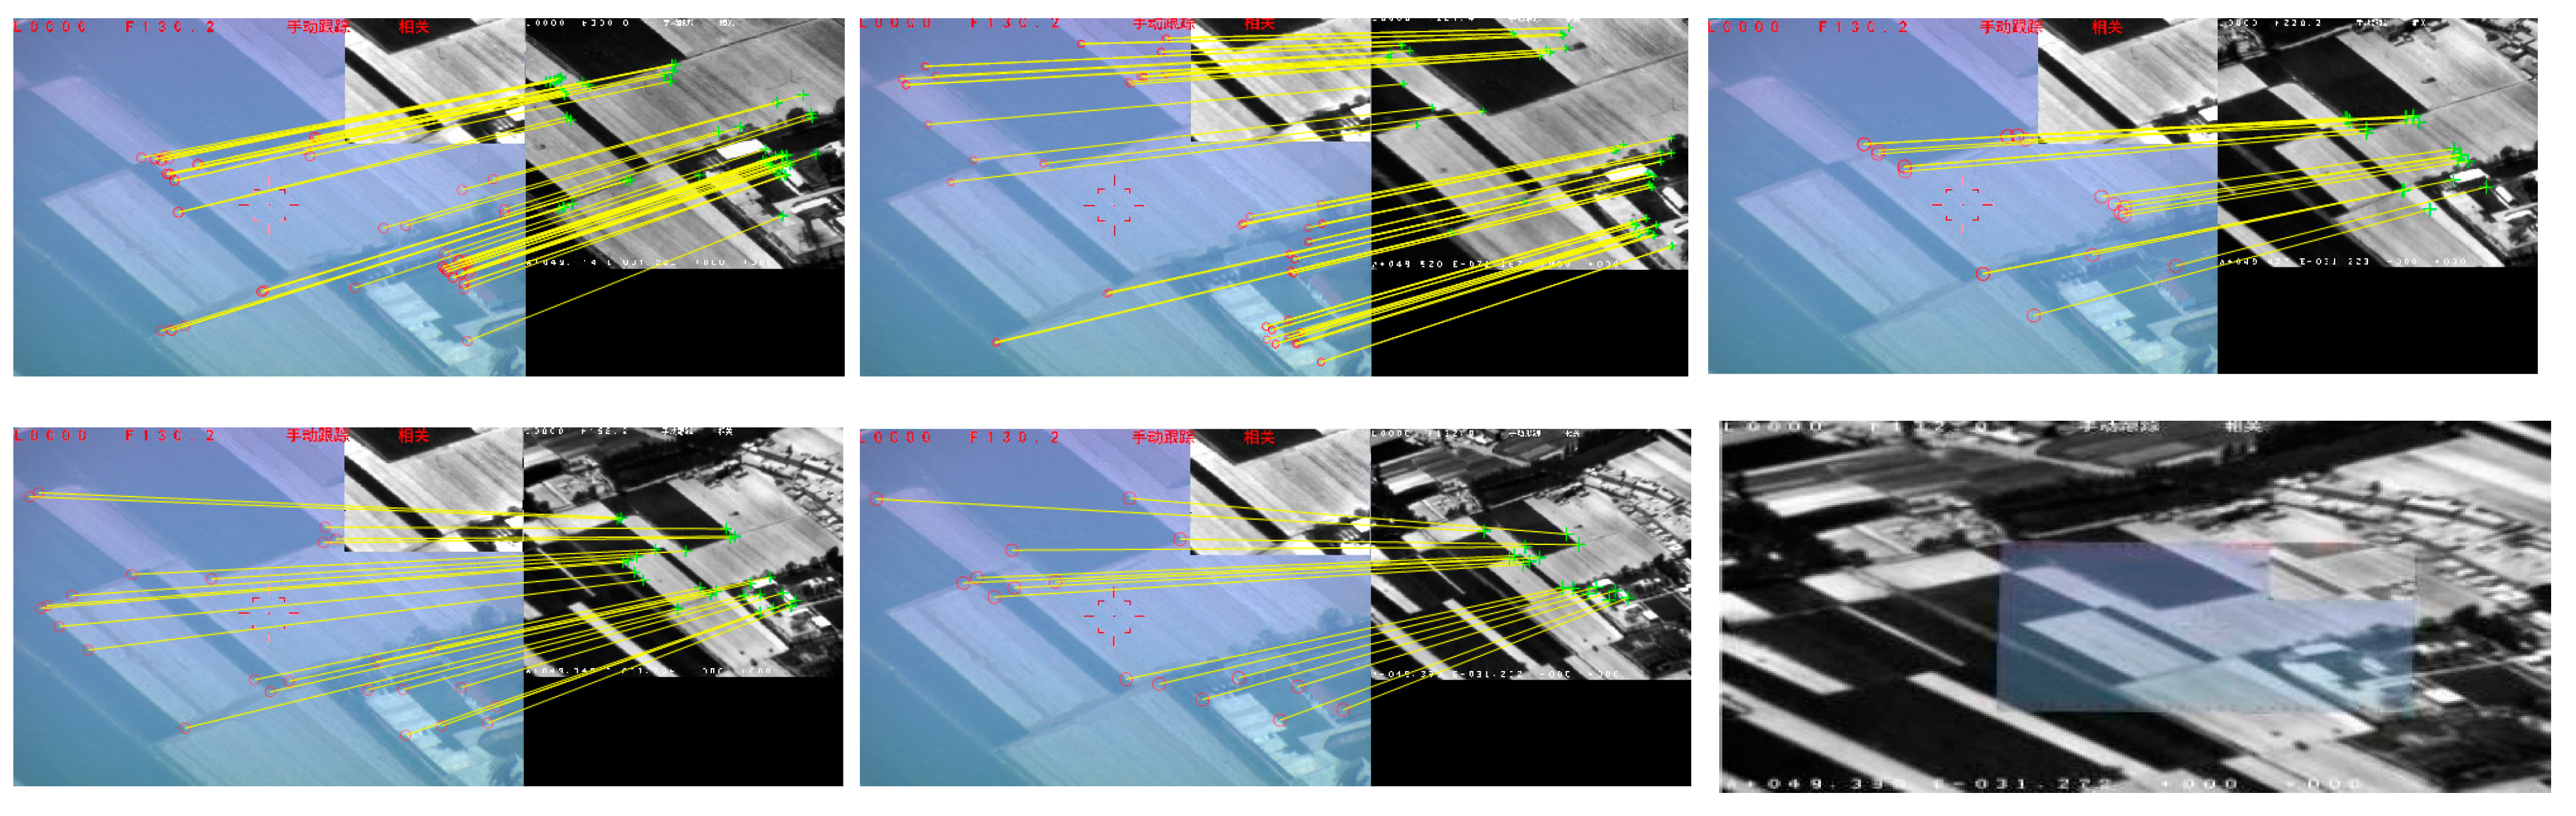
- UAV dataset [13]: those visible and infrared images were captured at the same time from EOP on UAV, which consisted of 160 image pairs with discontinuous focus length change from 25 to 300 mm for the infrared camera and from 6.5 to 130.2 mm for the visible camera. The infrared images were captured by a mid-wavelength infrared camera operated in the 3–5 μm waveband with a size of 640 × 512. The visible images were captured by a lightweight CCD camera with a size of 1024 × 768. Therefore, large geometric deformation and contrast differences occurred between those image pairs.
- (4)
- NIR-VIS dataset: this dataset was captured by Gaofen-14 satellite, which contained 40 image pairs. Near infrared (NIR) images were taken by a medium wavelength infrared camera and the visible images were taken by a visible camera; contrast difference is the main change between those image pairs.
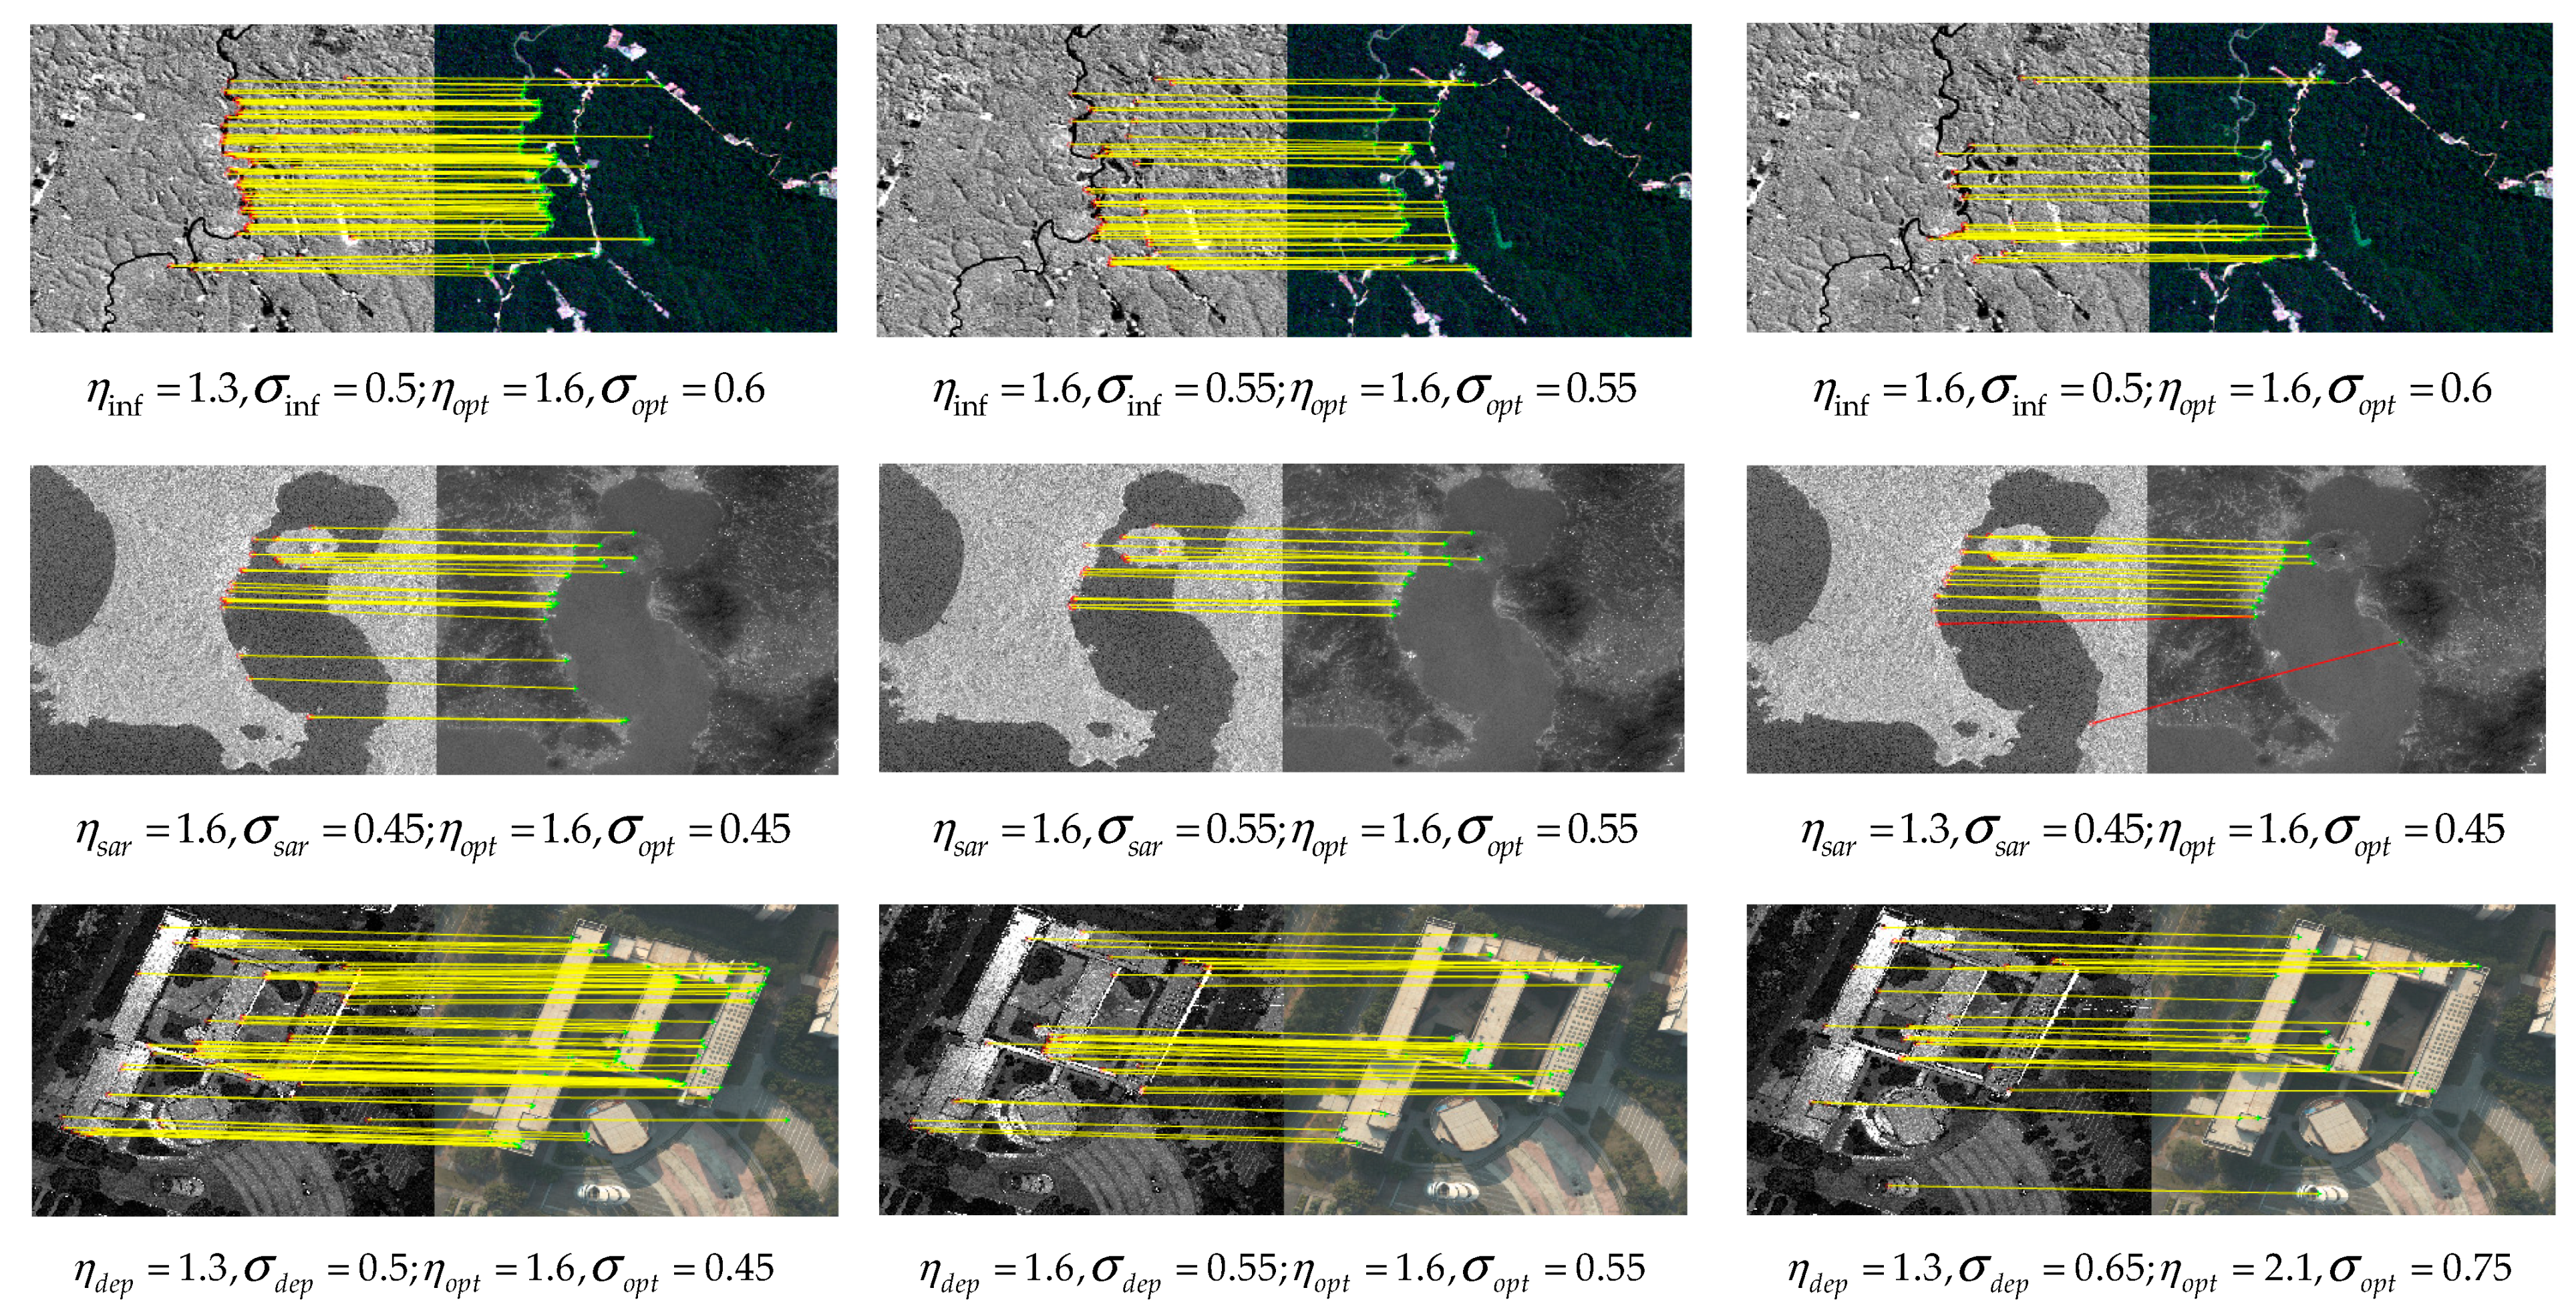
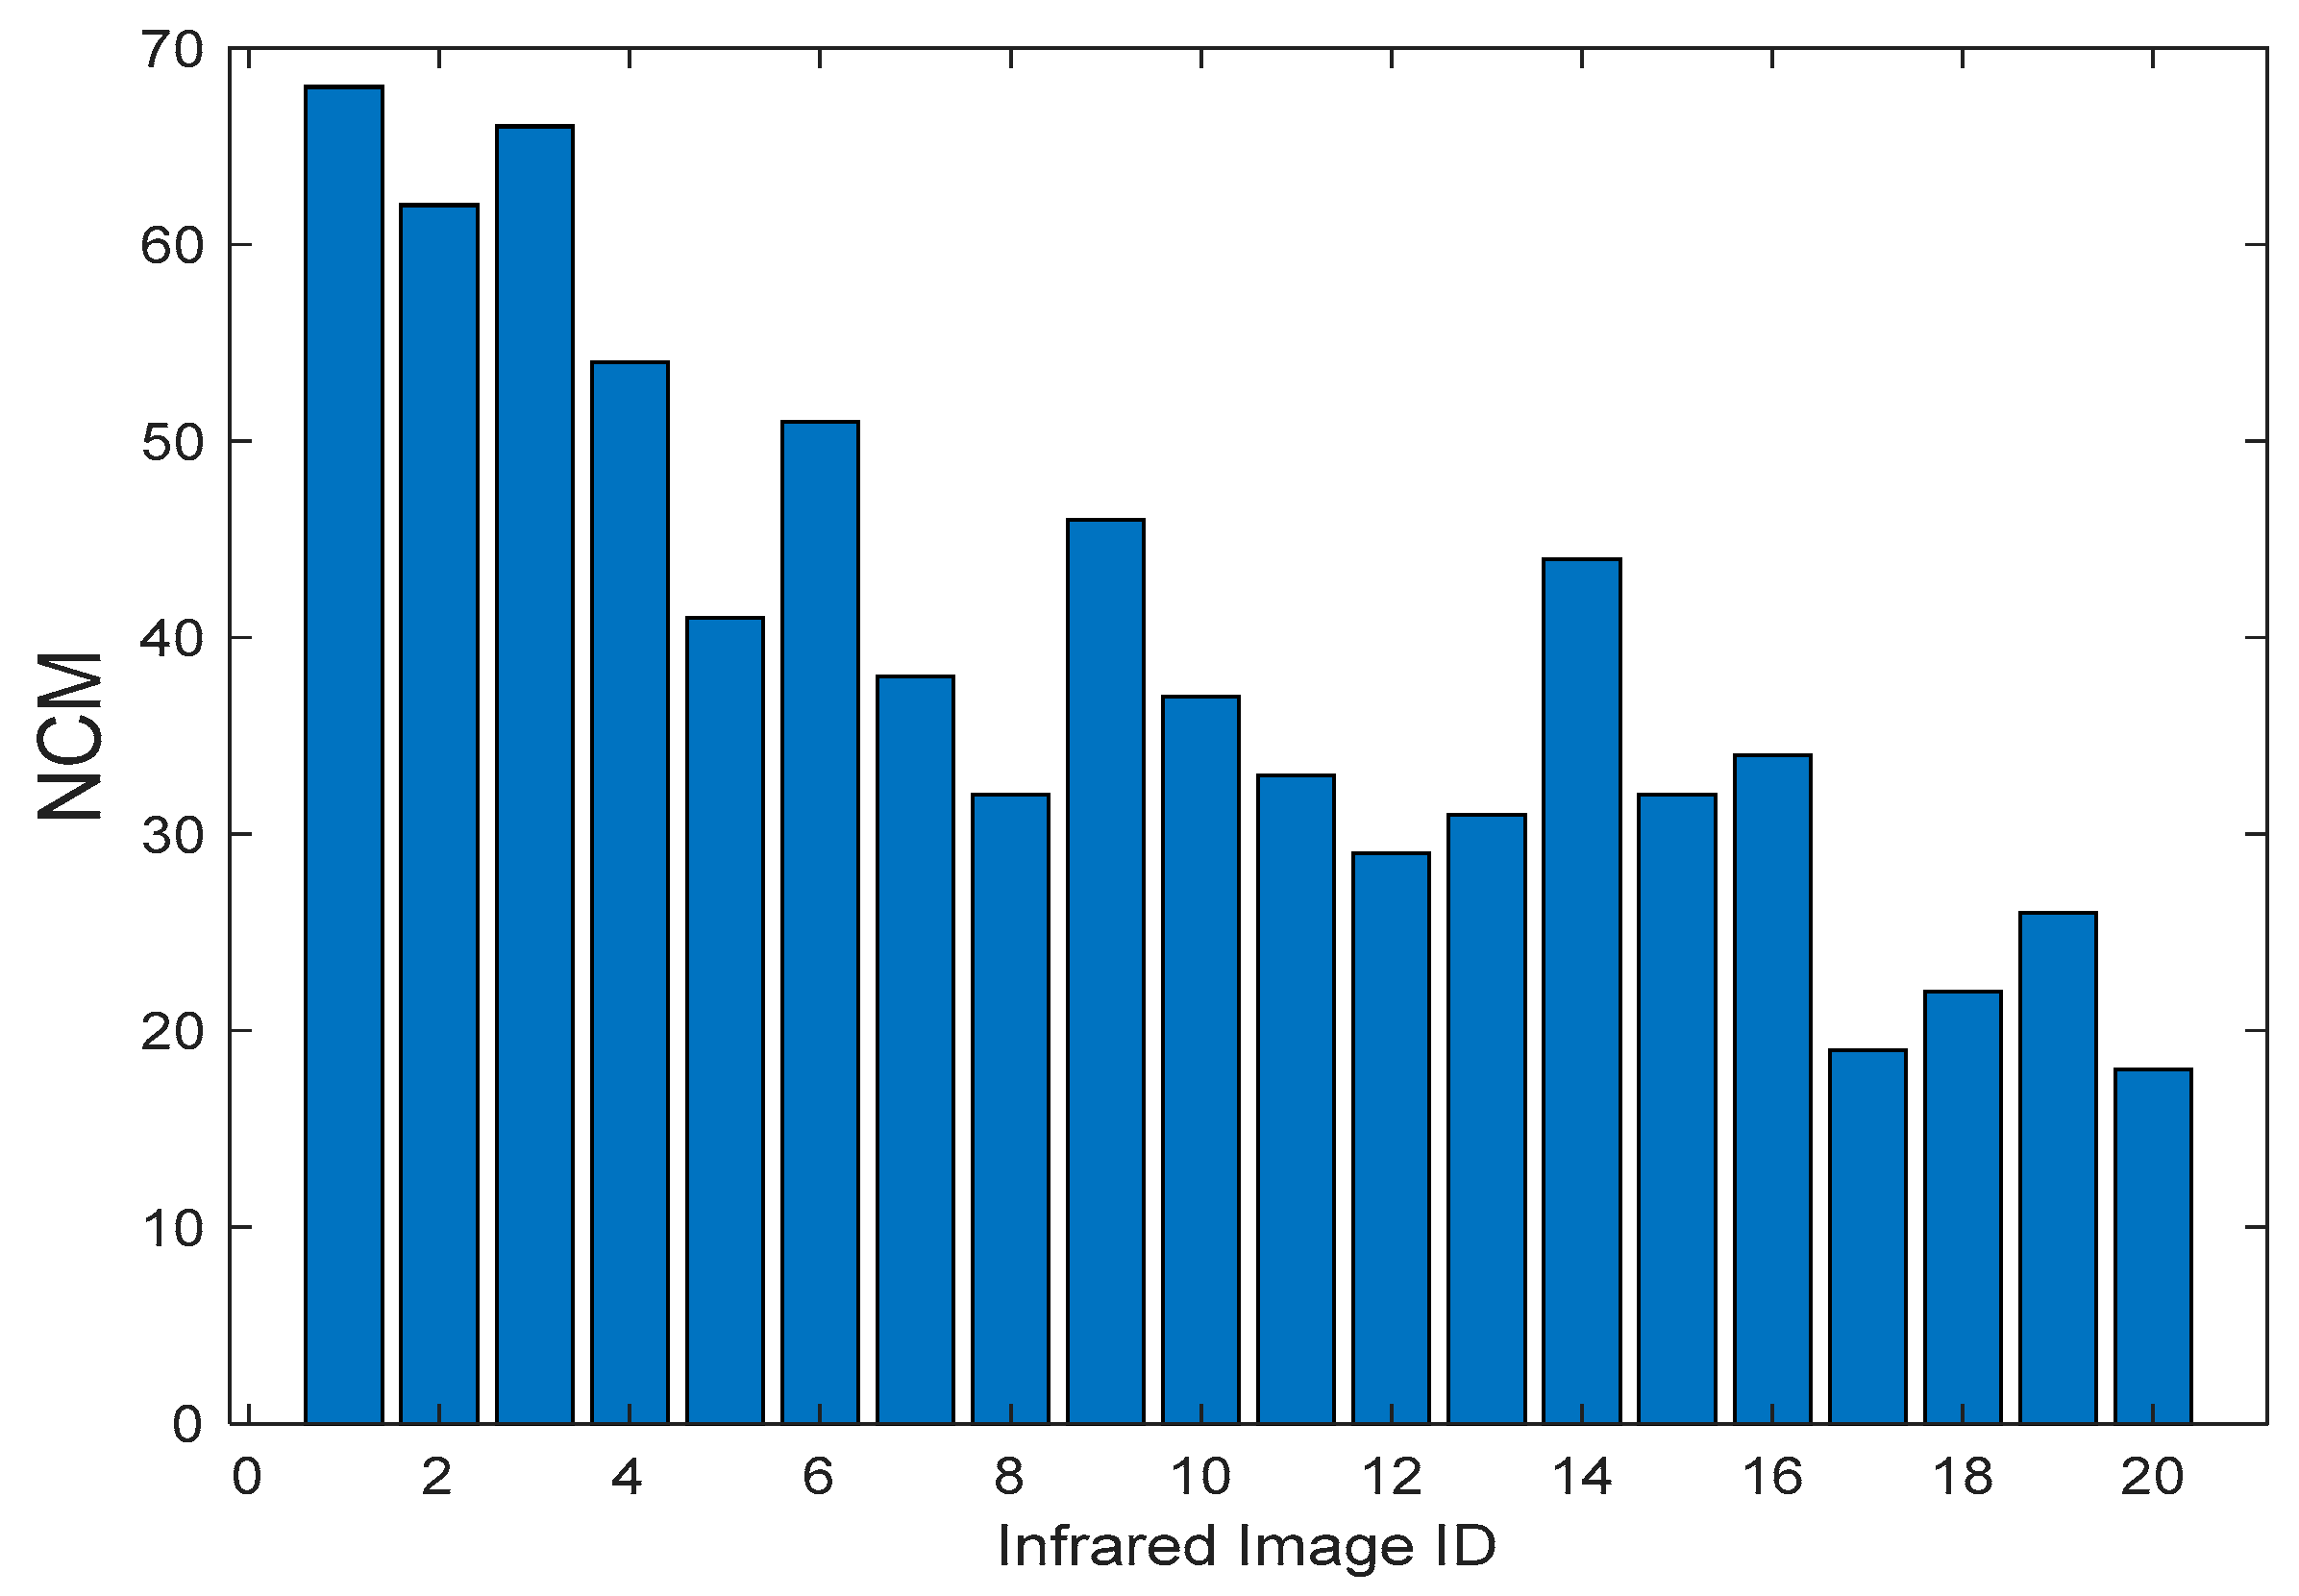
4.2. Parameter Optimization Experiments
4.3. Geometric Deformation Resistance Experiments
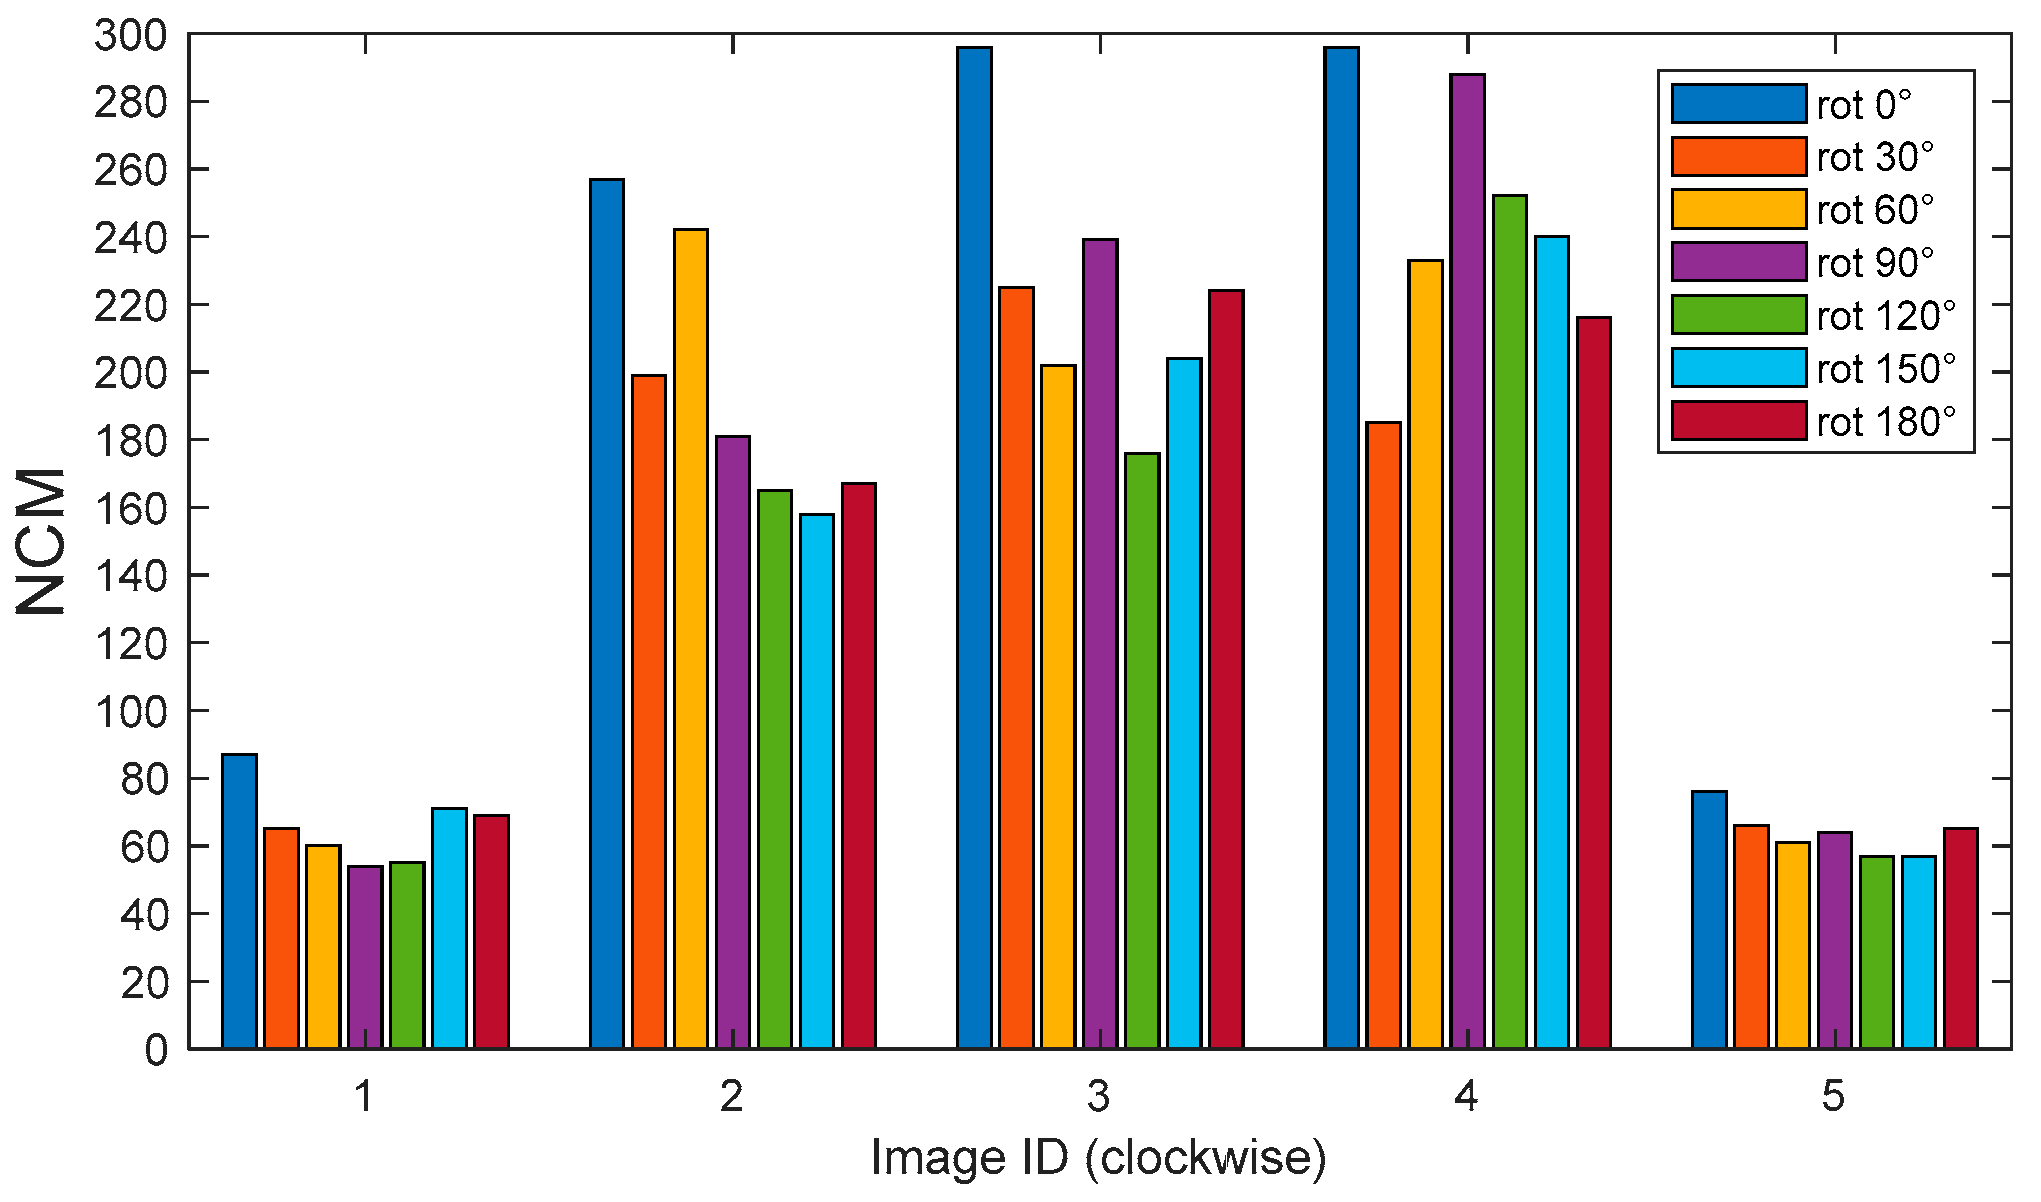
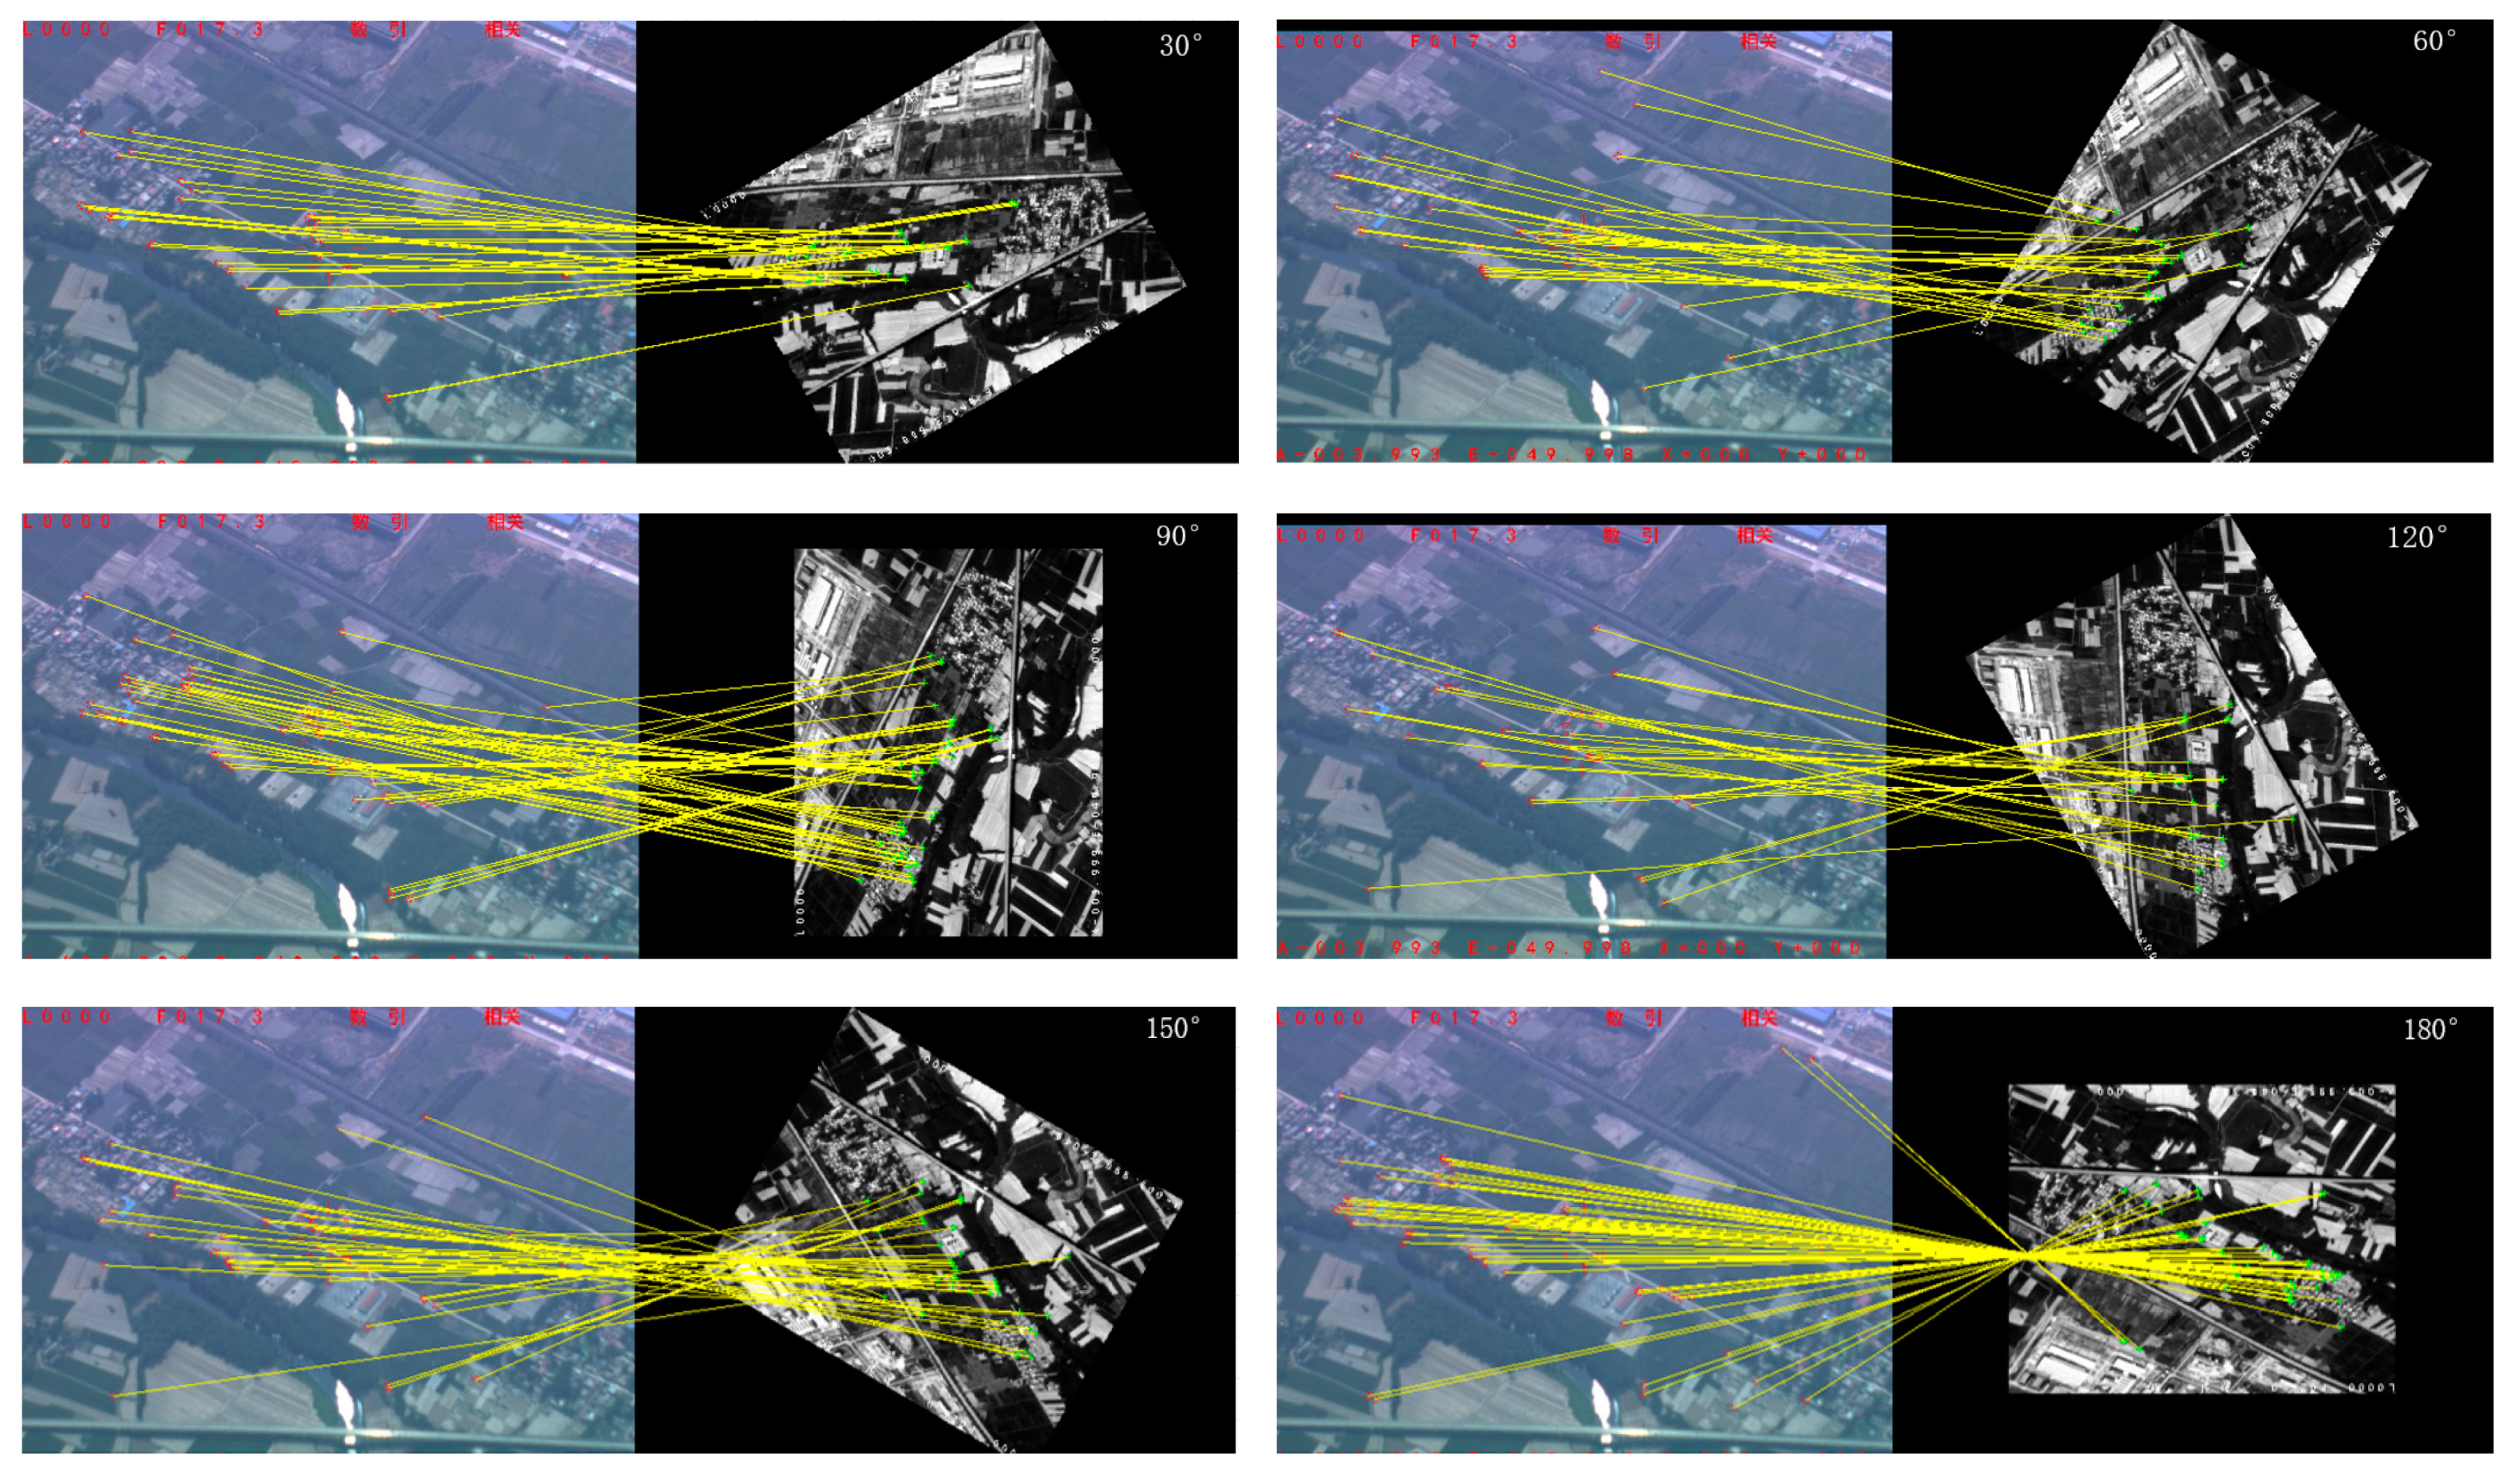
4.3.1. Rotation Robustness Test
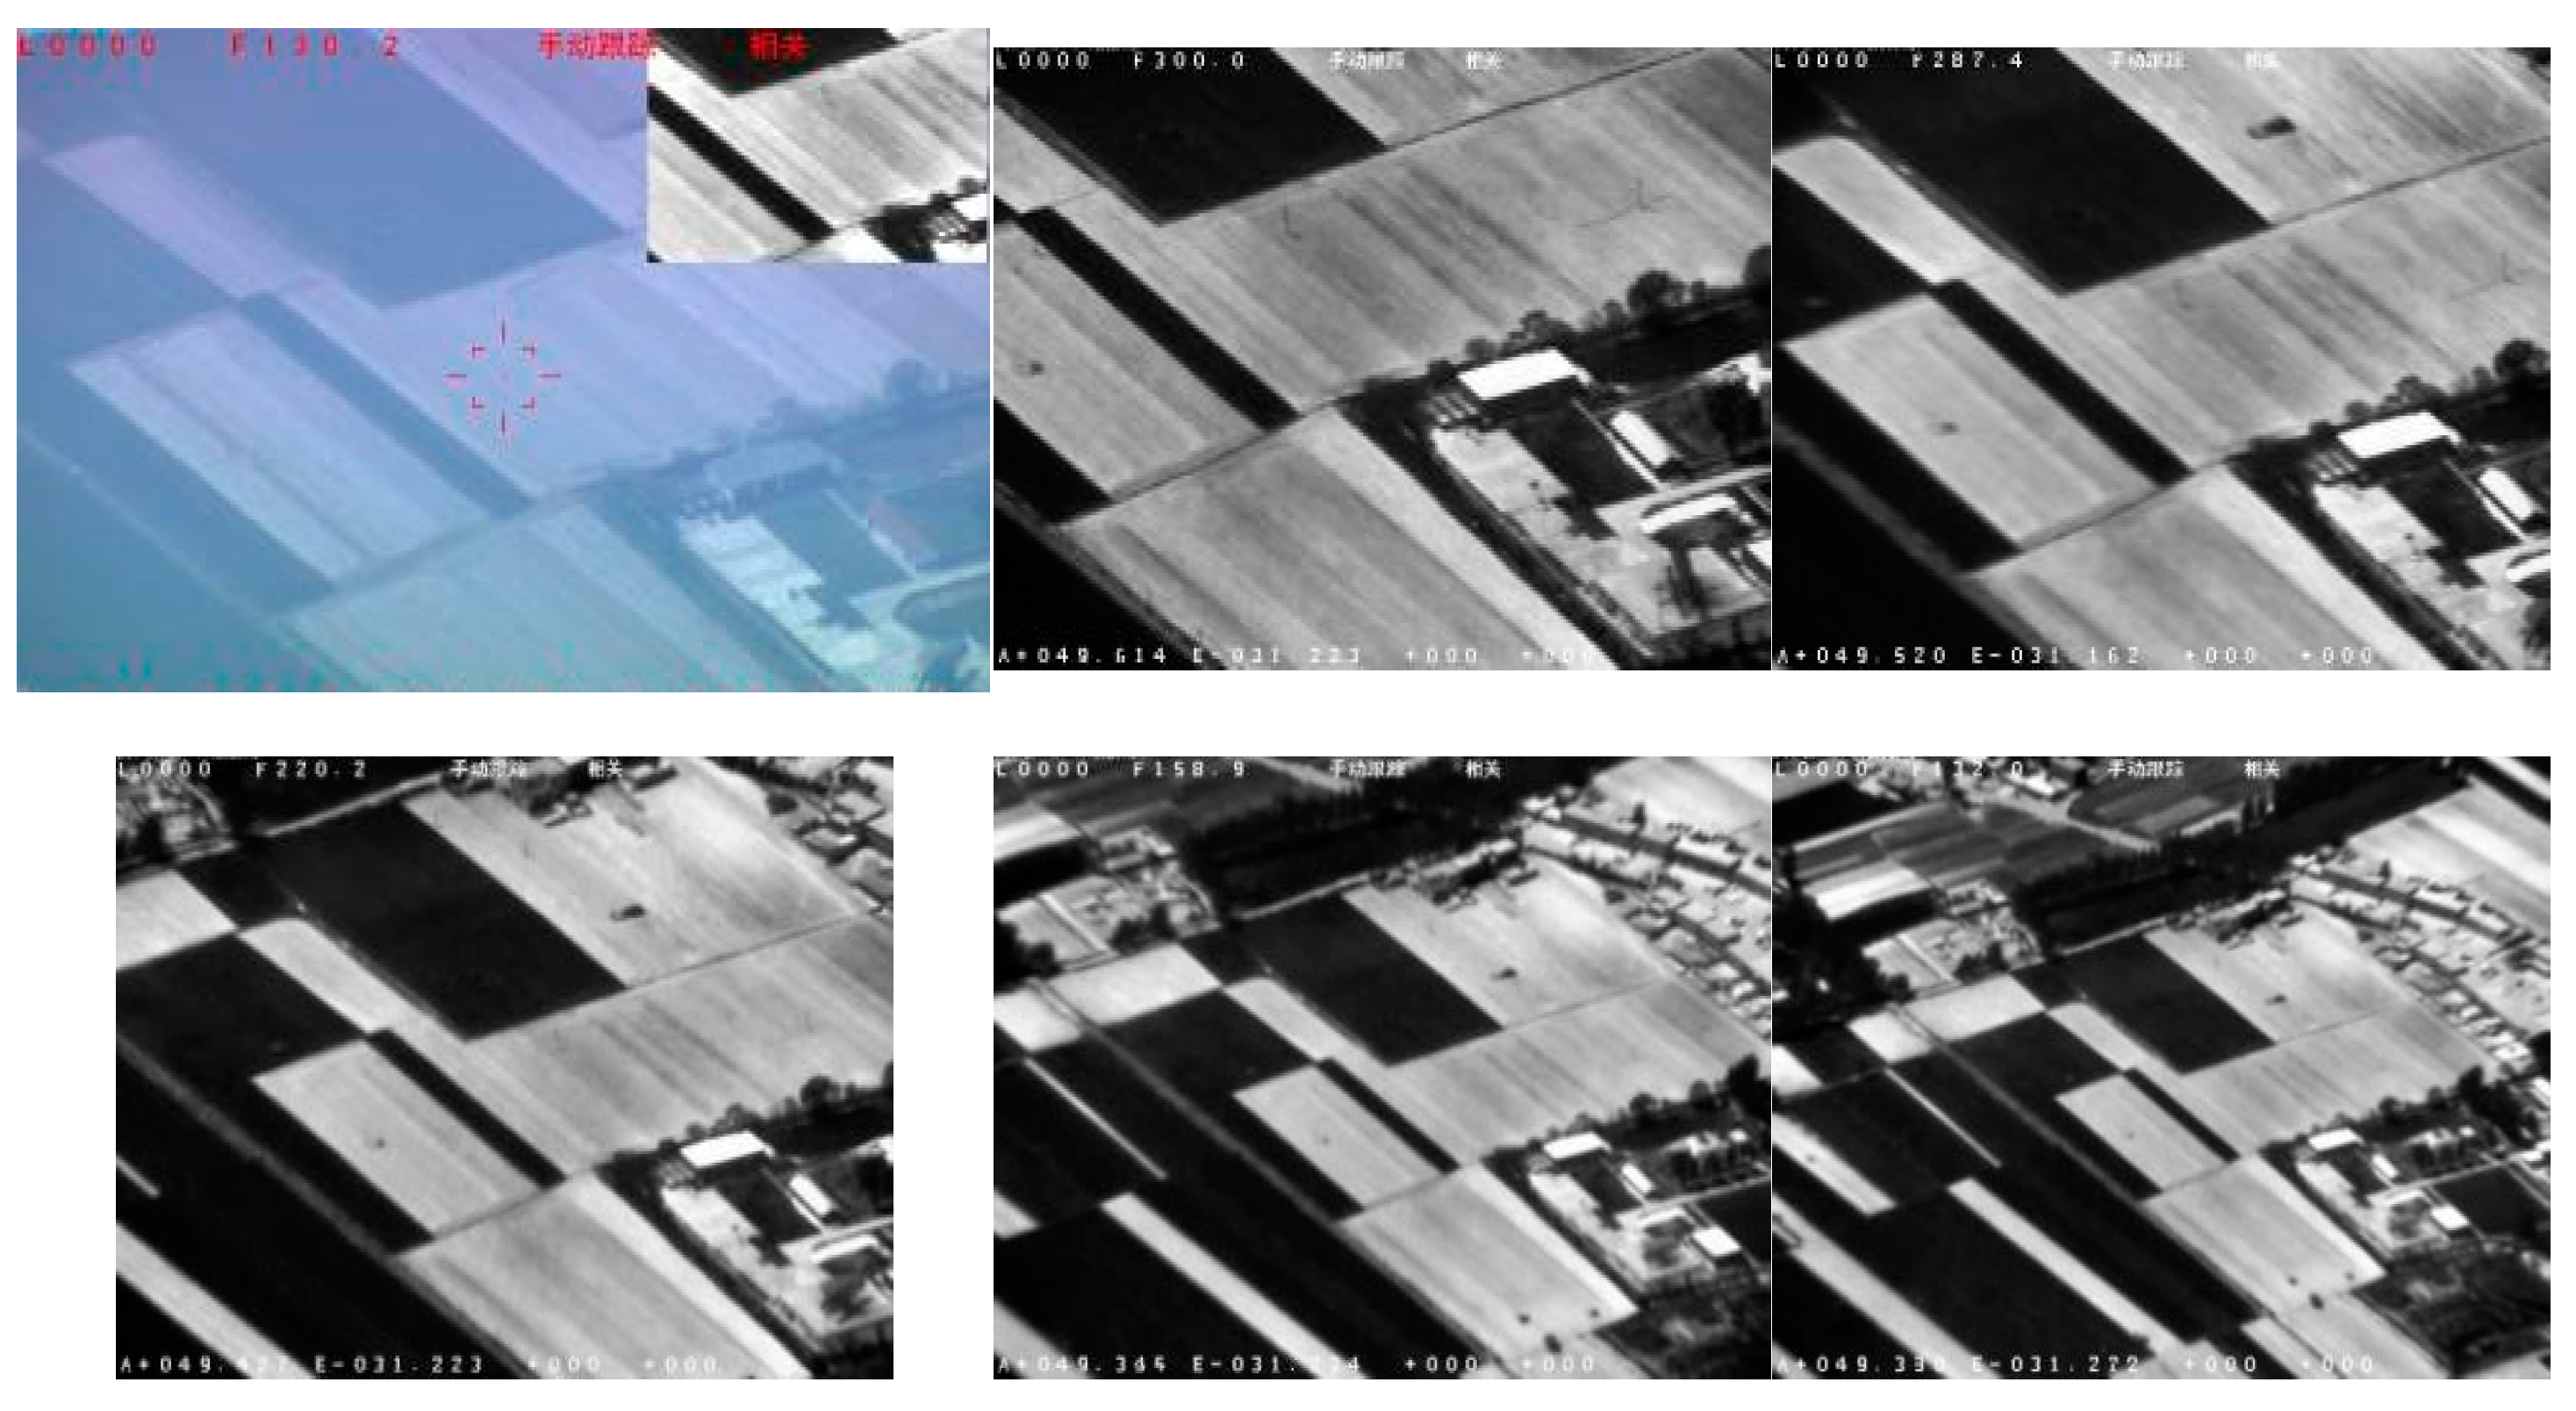
4.3.2. Scale Robustness Test
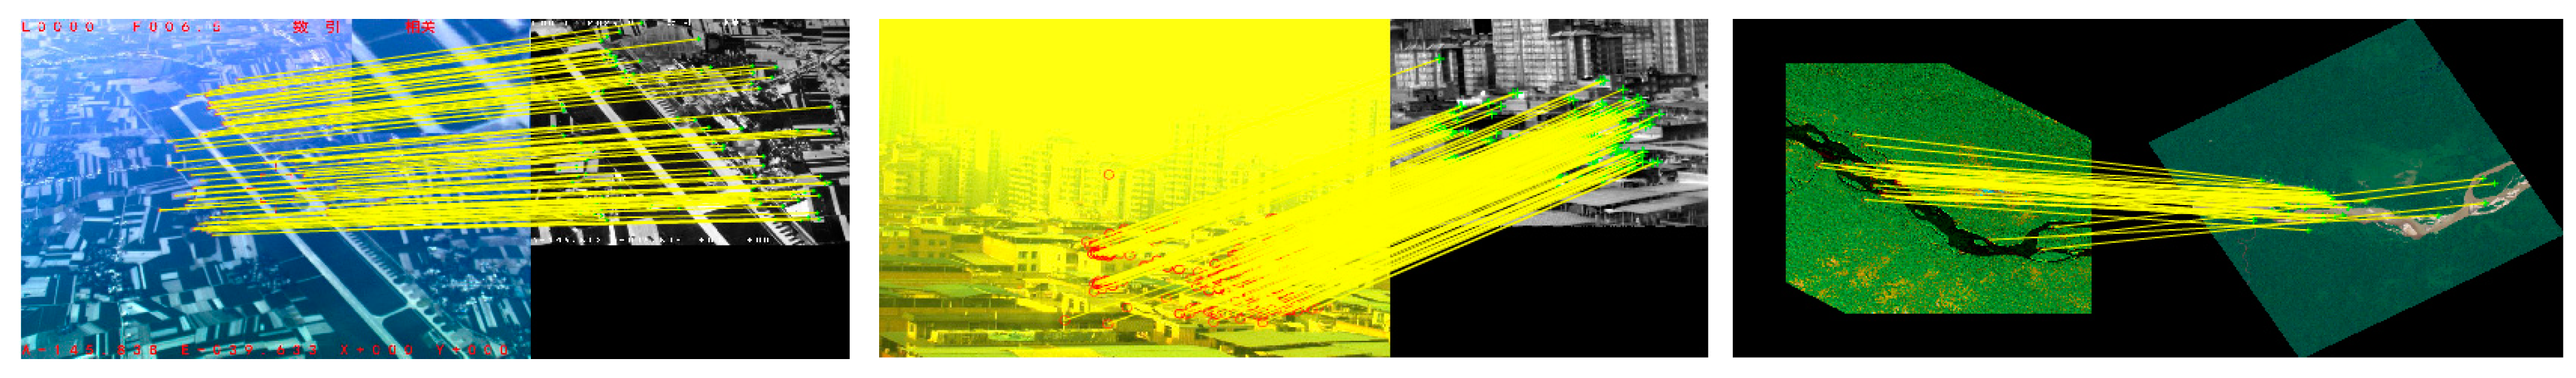
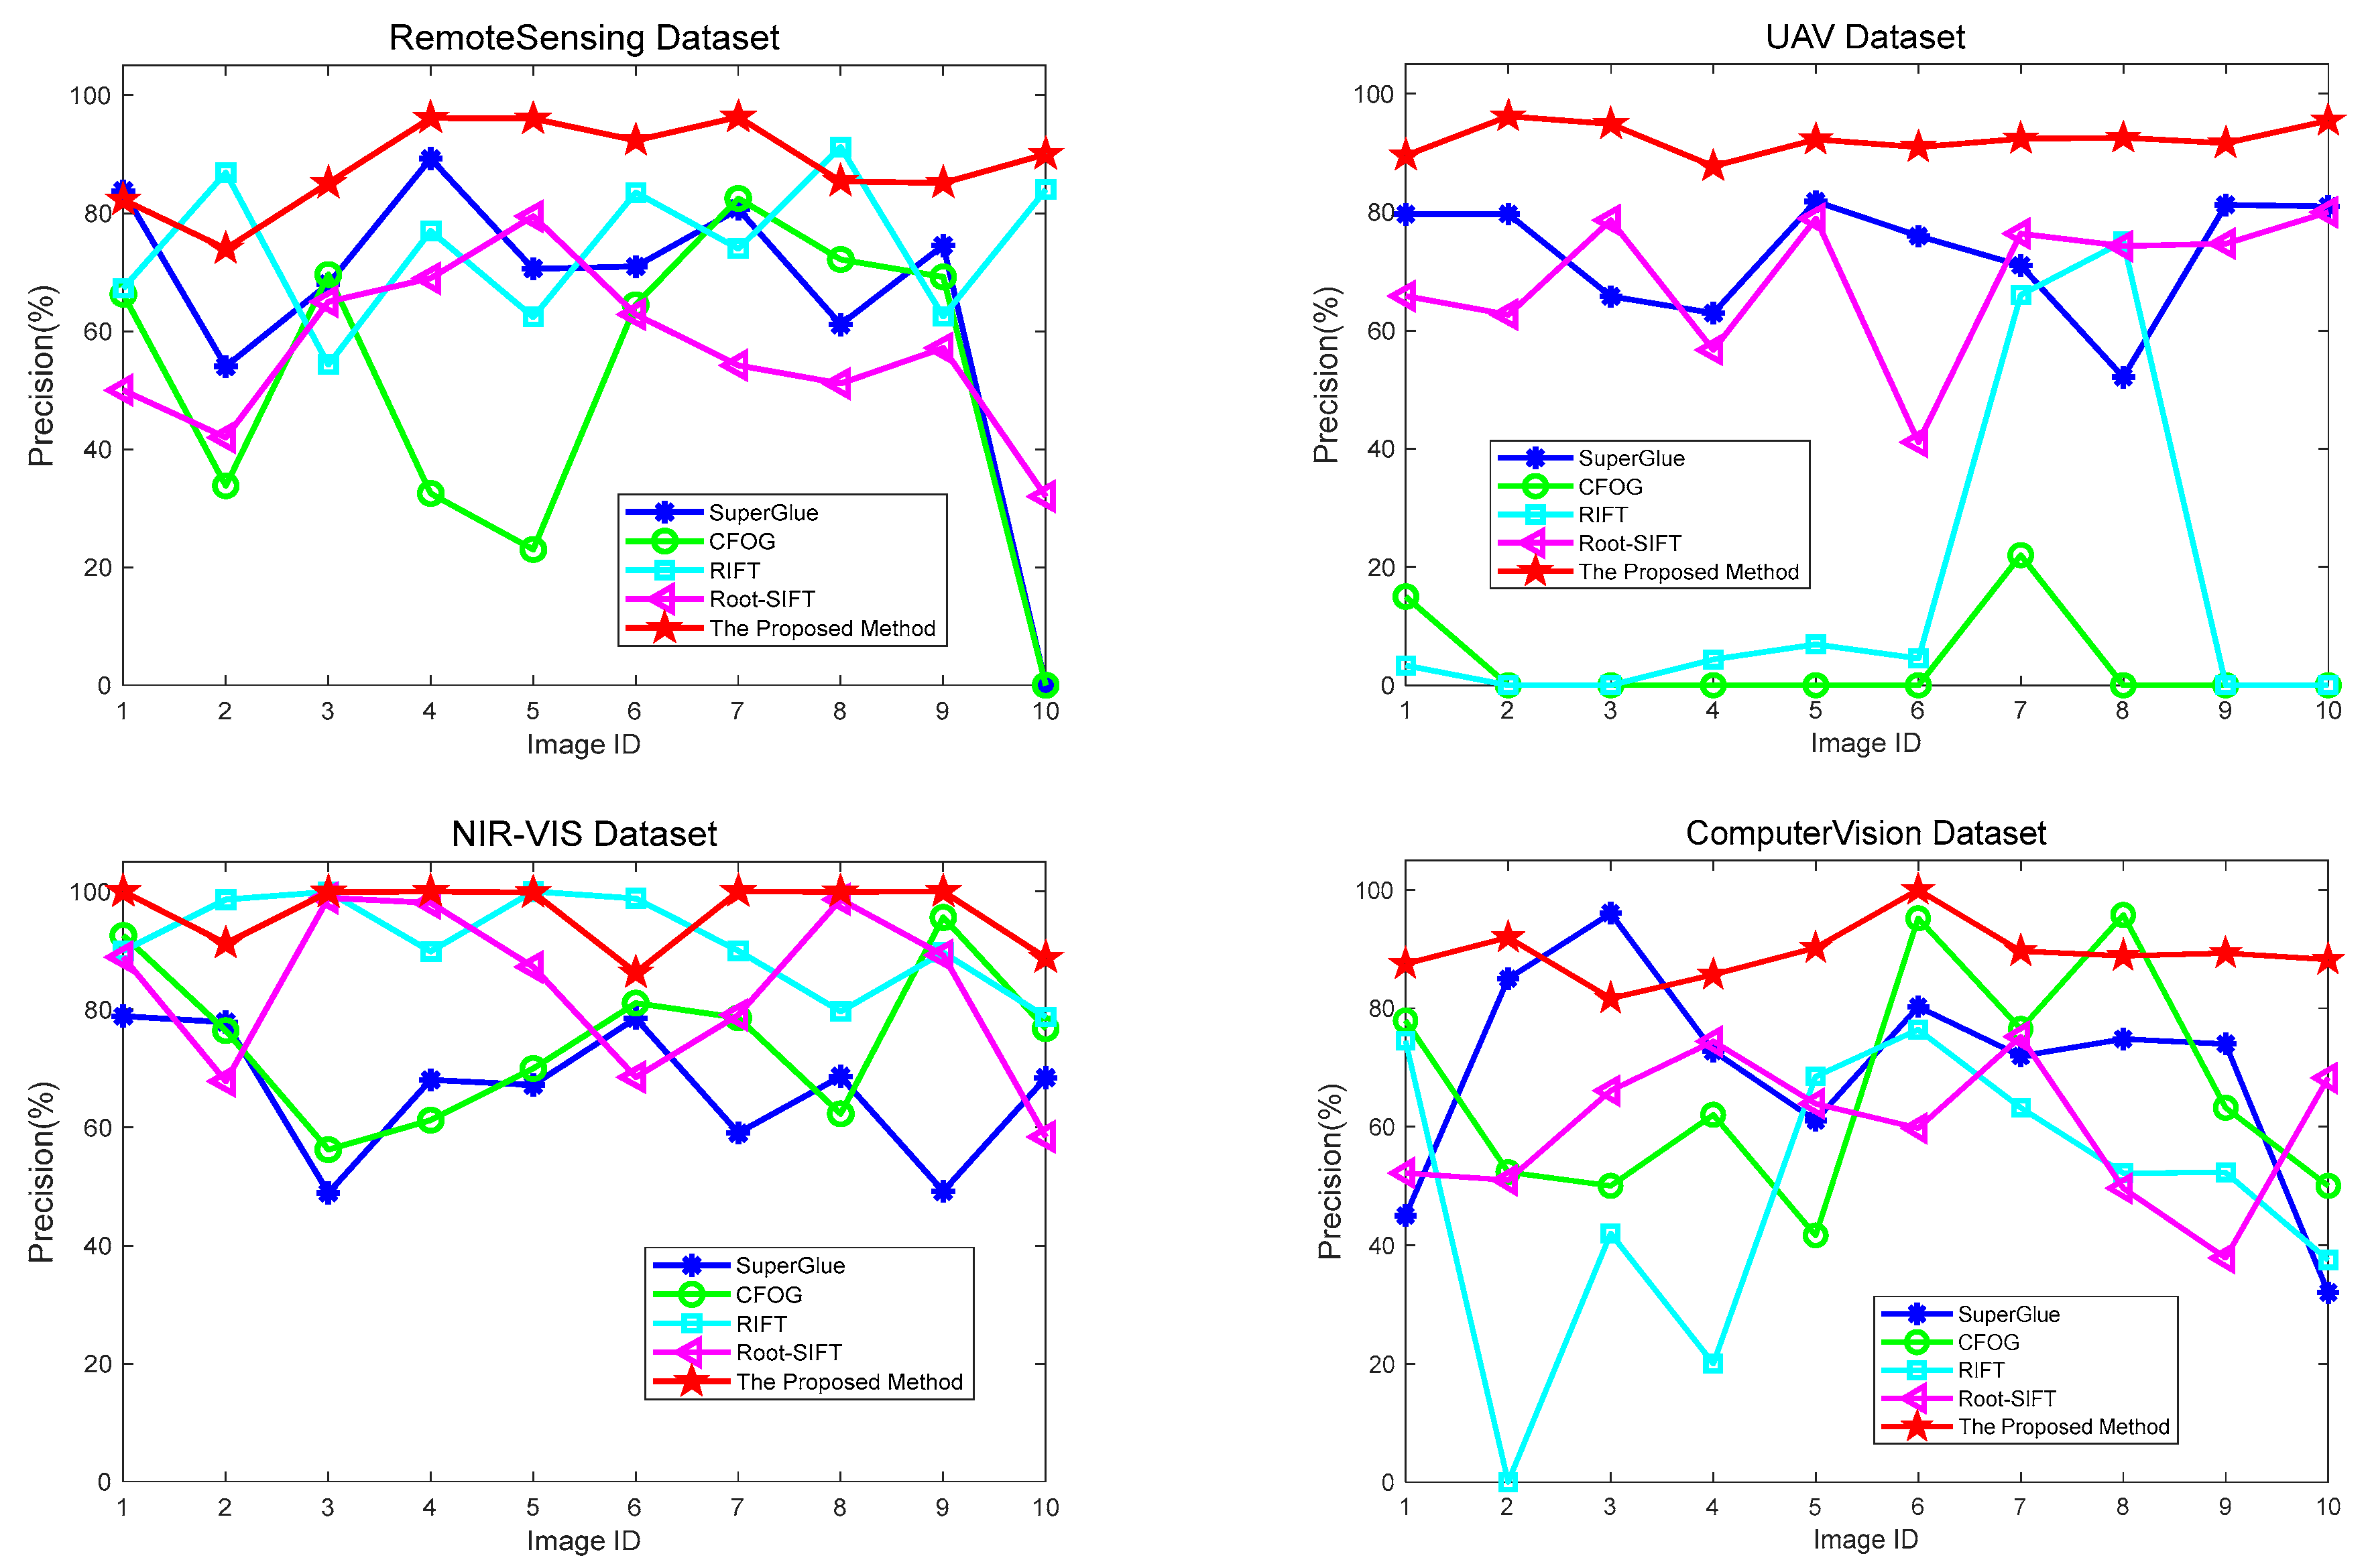
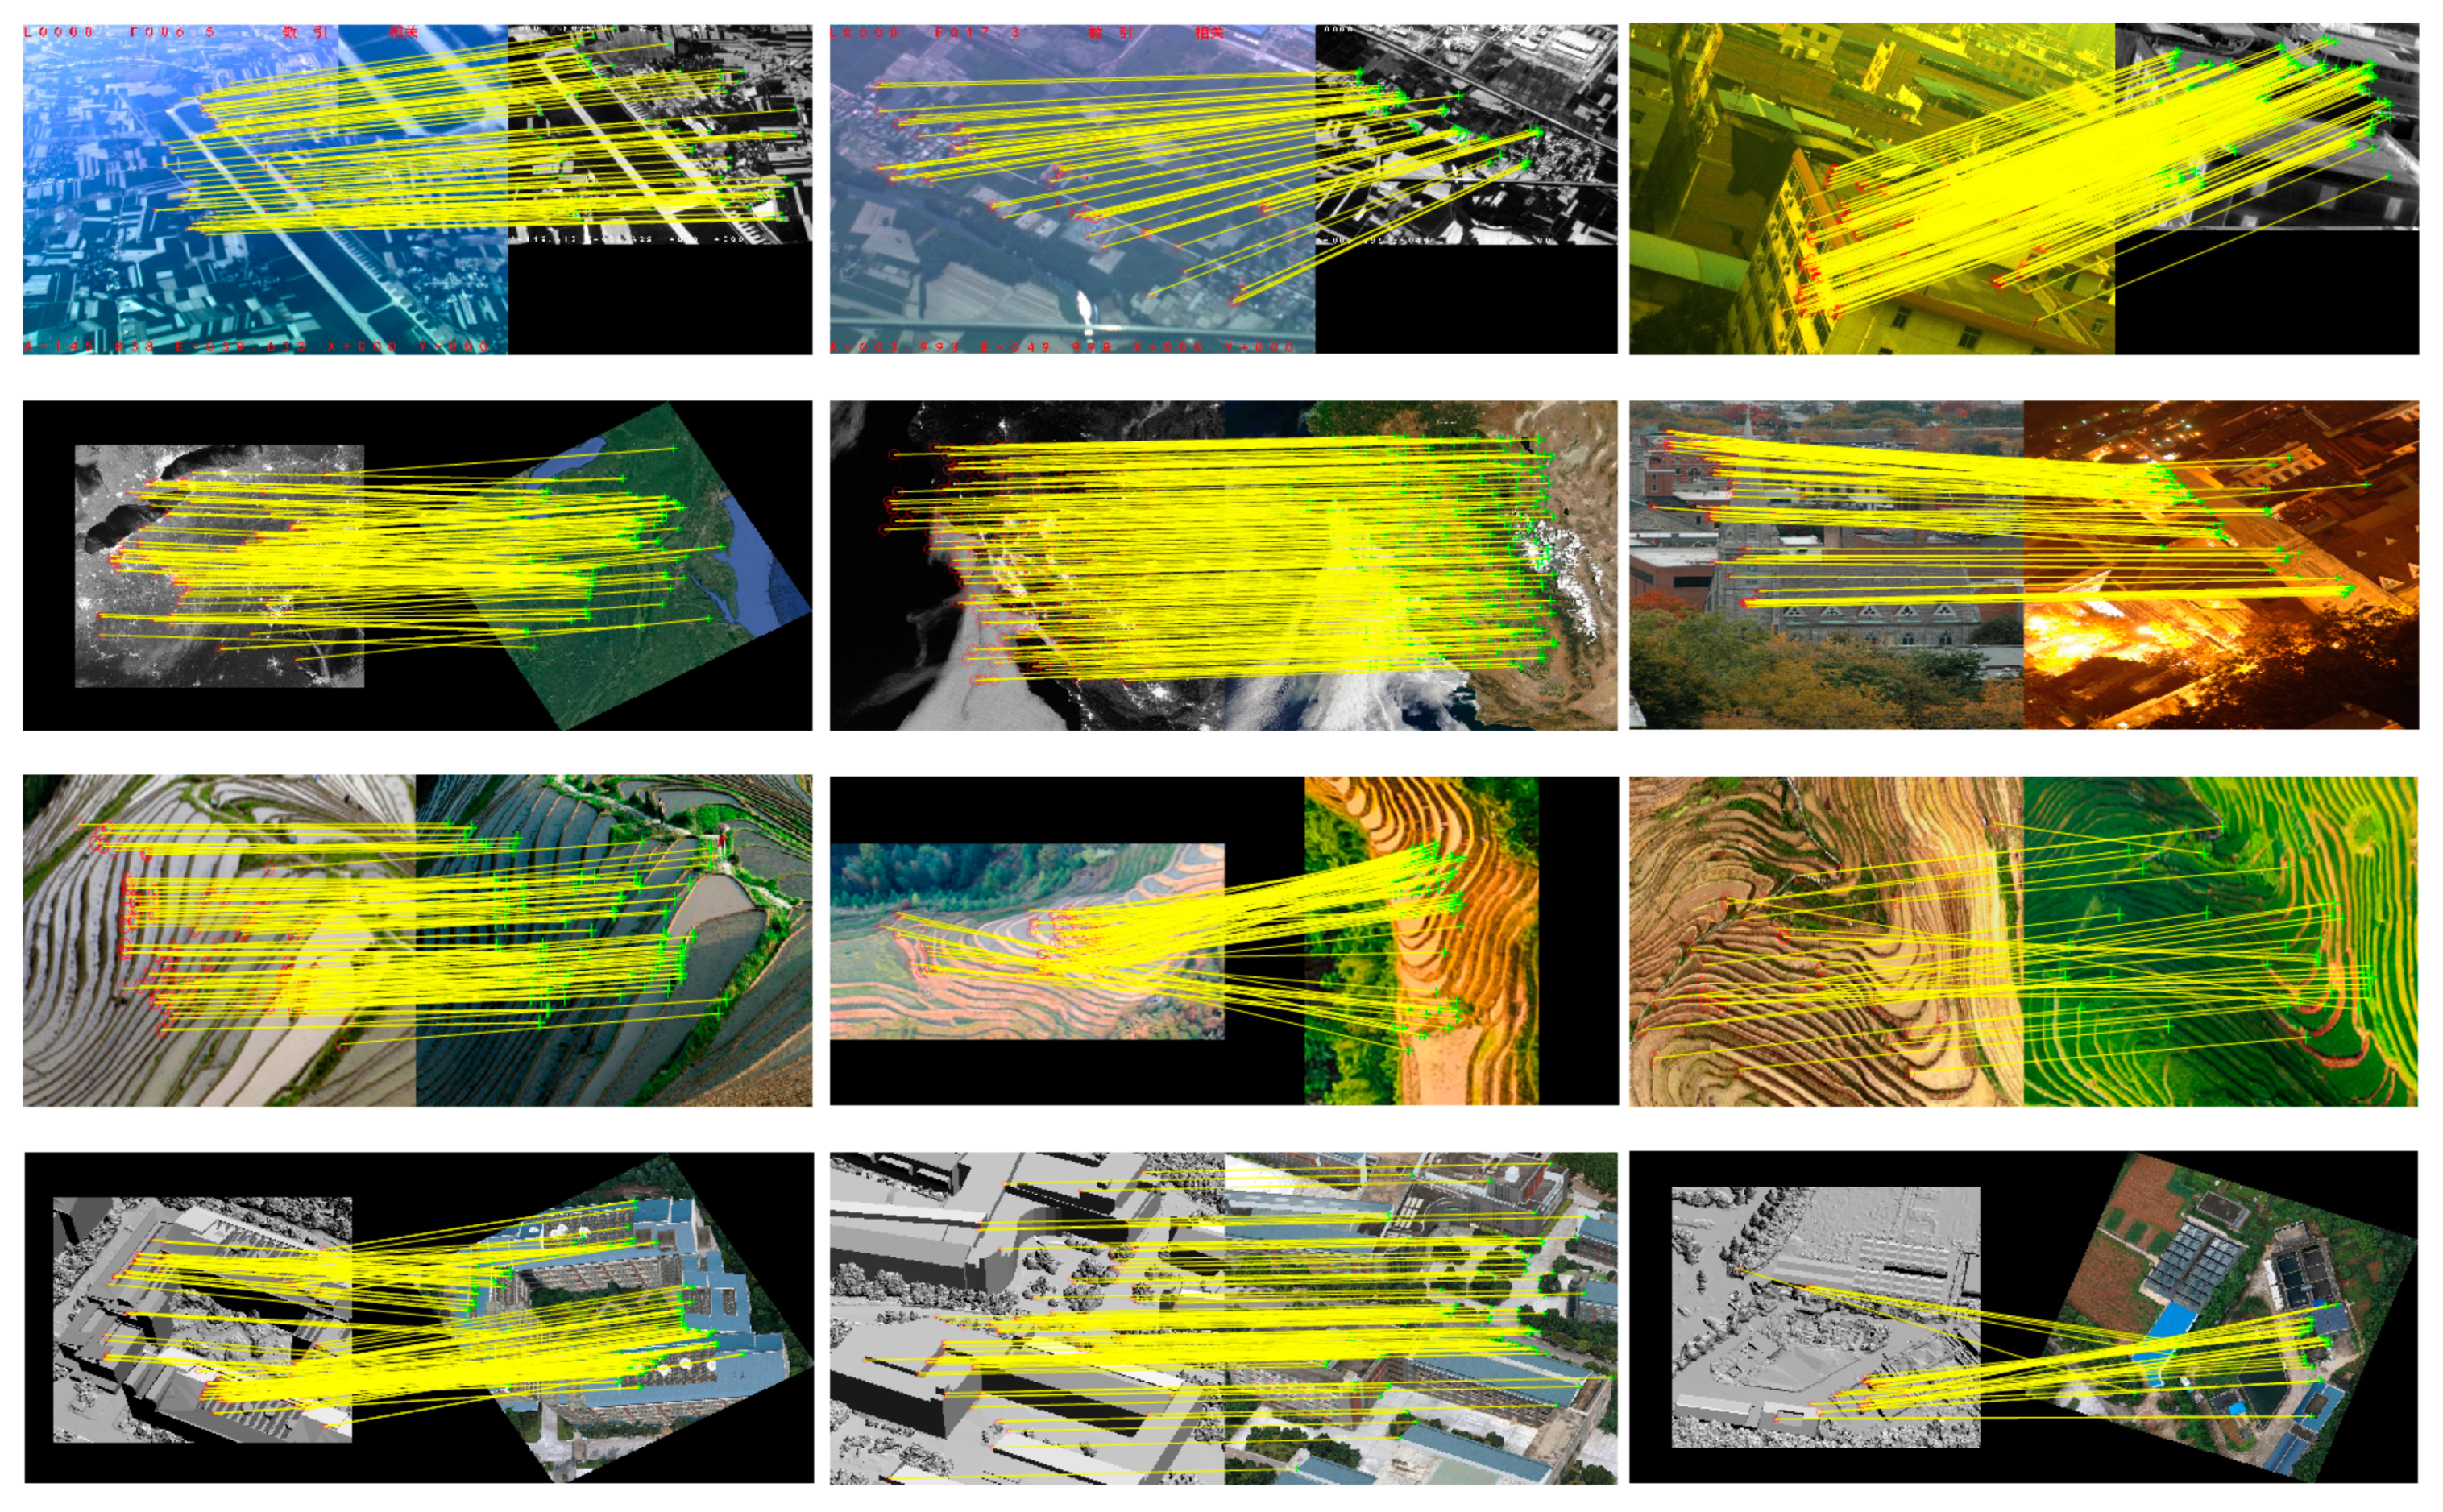
4.4. Comparative Experiments
5. Conclusions
Author Contributions
Funding
Institutional Review Board Statement
Informed Consent Statement
Data Availability Statement
Acknowledgments
Conflicts of Interest
References
- Ma, Y.; Wu, H.; Wang, L.; Huang, B.; Ranjan, R.; Zomaya, A.; Jie, W. Remote sensing big data computing: Challenges and opportunities. Future Gener. Comput. Syst. 2015, 51, 47–60. [Google Scholar] [CrossRef] [Green Version]
- Zhu, Z.; Luo, Y.; Qi, G.; Meng, J.; Li, Y.; Mazur, N. Remote sensing image defogging networks based on dual self-attention boost residual octave convolution. Remote Sens. 2021, 13, 3104. [Google Scholar] [CrossRef]
- Zhu, Z.; Luo, Y.; Wei, H.; Li, Y.; Qi, G.; Mazur, N.; Li, Y.; Li, P. Atmospheric light estimation based remote sensing image dehazing. Remote Sens. 2021, 13, 2432. [Google Scholar] [CrossRef]
- Paul, S.; Pati, U.C. A comprehensive review on remote sensing image registration. Int. J. Remote Sens. 2021, 42, 5396–5432. [Google Scholar] [CrossRef]
- Zitova, B.; Flusser, J. Image registration methods: A survey. Image Vis. Comput. 2003, 21, 977–1000. [Google Scholar] [CrossRef] [Green Version]
- Suri, S.; Reinartz, P. Mutual-information-based registration of TerraSAR-X and Ikonos imagery in urban areas. IEEE Trans. Geosci. Remote Sens. 2009, 48, 939–949. [Google Scholar] [CrossRef]
- Shi, Q.; Ma, G.; Zhang, F.; Chen, W.; Qin, Q.; Duo, H. Robust image registration using structure features. IEEE Geosci. Remote Sens. Lett. 2014, 11, 2045–2049. [Google Scholar]
- Dellinger, F.; Delon, J.; Gousseau, Y.; Michel, J.; Tupin, F. SAR-SIFT: A SIFT-like algorithm for SAR images. IEEE Trans. Geosci. Remote Sens. 2014, 53, 453–466. [Google Scholar] [CrossRef] [Green Version]
- Liu, X.; Lei, Z.; Yu, Q.; Zhang, X.; Shang, Y.; Hou, W. Multi-modal image matching based on local frequency information. EURASIP J. Adv. Signal Process. 2013, 2013, 3. [Google Scholar] [CrossRef] [Green Version]
- Ye, Y.; Shan, J.; Bruzzone, L.; Shen, L. Robust registration of multimodal remote sensing images based on structural similarity. IEEE Trans. Geosci. Remote Sens. 2017, 55, 2941–2958. [Google Scholar] [CrossRef]
- Fang, D.; Lv, X.; Yun, Y.; Li, F. An InSAR fine registration algorithm using uniform tie points based on Voronoi diagram. IEEE Geosci. Remote Sens. Lett. 2017, 14, 1403–1407. [Google Scholar] [CrossRef]
- Yang, K.; Pan, A.; Yang, Y.; Zhang, S.; Ong, S.H.; Tang, H. Remote sensing image registration using multiple image features. Remote Sens. 2017, 9, 581. [Google Scholar] [CrossRef] [Green Version]
- Liu, X.; Ai, Y.; Tian, B.; Cao, D. Robust and fast registration of infrared and visible images for electro-optical pod. IEEE Trans. Ind. Electron. 2019, 66, 1335–1344. [Google Scholar] [CrossRef]
- Jiang, X.; Ma, J.; Xiao, G.; Shao, Z.; Guo, X. A review of multimodal image matching: Methods and applications. Inf. Fus. 2021, 73, 22–71. [Google Scholar] [CrossRef]
- Almonacid-Caballer, J.; Pardo-Pascual, J.E.; Ruiz, L.A. Evaluating Fourier cross-correlation sub-pixel registration in landsat images. Remote Sens. 2017, 9, 1051. [Google Scholar] [CrossRef] [Green Version]
- Dong, Y.; Jiao, W.; Long, T.; He, G.; Gong, C. An extension of phase correlation-based image registration to estimate similarity transform using multiple polar Fourier transform. Remote Sens. 2018, 10, 1719. [Google Scholar] [CrossRef] [Green Version]
- Tong, X.; Ye, Z.; Xu, Y.; Gao, S.; Xie, H.; Du, Q.; Liu, S.; Xu, X.; Liu, S.; Luan, K.; et al. Image registration with Fourier-based image correlation: A comprehensive review of developments and applications. IEEE J. Sel. Top. Appl. Earth Obs. Remote Sens. 2019, 12, 4062–4081. [Google Scholar] [CrossRef]
- Zavorin, I.; Le Moigne, J. Use of multiresolution wavelet feature pyramids for automatic registration of multisensor imagery. IEEE Trans. Image Process. 2005, 14, 770–782. [Google Scholar] [CrossRef]
- Yang, Y.; Gao, X. Remote sensing image registration via active contour model. Int. J. Electron. Commun. 2009, 63, 227–234. [Google Scholar] [CrossRef]
- Zhao, C.; Zhao, H.; Lv, J.; Sun, S.; Li, B. Multimodal image matching based on multimodality robust line segment descriptor. Neurocomputing 2016, 177, 290–303. [Google Scholar] [CrossRef]
- Okorie, A.; Makrogiannis, S. Region-based image registration for remote sensing imagery. Comput. Vis. Image Underst. 2019, 189, 102825. [Google Scholar] [CrossRef]
- Chang, H.H.; Wu, G.L.; Chiang, M.H. Remote sensing image registration based on modified SIFT and feature slope grouping. IEEE Geosci. Remote Sens. Lett. 2019, 16, 1363–1367. [Google Scholar] [CrossRef]
- Hong, Y.; Leng, C.; Zhang, X.; Pei, Z.; Cheng, I.; Basu, A. HOLBP: Remote sensing image registration based on histogram of oriented local binary pattern descriptor. Remote Sens. 2021, 13, 2328. [Google Scholar] [CrossRef]
- Yan, X.; Zhang, Y.; Zhang, D.; Hou, N. Multimodal image registration using histogram of oriented gradient distance and data-driven grey wolf optimizer. Neurocomputing 2020, 392, 108–120. [Google Scholar] [CrossRef]
- Arandjelovic, R.; Zisserman, A. Three things everyone should know to improve object retrieval. In Proceedings of the 2012 IEEE Conference on Computer Vision and Pattern Recognition, Providence, RI, USA, 16–21 June 2012; pp. 2911–2918. [Google Scholar]
- Sun, X.; Xie, Y.; Luo, P.; Wang, L. A dataset for benchmarking image-based localization. In Proceedings of the IEEE Conference on Computer Vision and Pattern Recognition, Honolulu, HI, USA, 21–26 July 2017; pp. 7436–7444. [Google Scholar]
- Zhang, H.; Ni, W.; Yan, W.; Xiang, D.; Wu, J.; Yang, X.; Bian, H. Registration of multimodal remote sensing image based on deep fully convolutional neural network. IEEE J. Sel. Top. Appl. Earth Obs. Remote Sens. 2019, 12, 3028–3042. [Google Scholar] [CrossRef]
- Zhang, J.; Ma, W.; Wu, Y.; Jiao, L. Multimodal remote sensing image registration based on image transfer and local features. IEEE Geosci. Remote Sens. Lett. 2019, 16, 1210–1214. [Google Scholar] [CrossRef]
- Li, Z.; Zhang, H.; Huang, Y. A rotation-invariant optical and SAR image registration algorithm based on deep and gaussian features. Remote Sens. 2021, 13, 2628. [Google Scholar] [CrossRef]
- Sarlin, P.E.; DeTone, D.; Malisiewicz, T.; Rabinovich, A. SuperGlue: Learning feature matching with graph neural networks. In Proceedings of the IEEE Conference on Computer Vision and Pattern Recognition, Seattle, WA, USA, 14–19 June 2020; pp. 4938–4947. [Google Scholar]
- Liu, X.; Ai, Y.; Zhang, J.; Wang, Z. A novel affine and contrast invariant descriptor for infrared and visible image registration. Remote Sens. 2018, 10, 658. [Google Scholar] [CrossRef] [Green Version]
- Xie, X.; Zhang, Y.; Ling, X.; Wang, X. A novel extended phase correlation algorithm based on Log-Gabor filtering for multimodal remote sensing image registration. Int. J. Remote Sens. 2019, 40, 5429–5453. [Google Scholar] [CrossRef]
- Li, J.; Hu, Q.; Ai, M. RIFT: Multi-modal image matching based on radiation-variation insensitive feature transform. IEEE Trans. Image Process. 2019, 29, 3296–3310. [Google Scholar] [CrossRef]
- Yu, G.; Zhao, S. A new feature descriptor for multimodal image registration using phase congruency. Sensors 2020, 20, 5105. [Google Scholar] [CrossRef] [PubMed]
- Morrone, M.C.; Ross, J.; Burr, D.C.; Owens, R. Mach bands are phase dependent. Nature 1986, 324, 250–253. [Google Scholar] [CrossRef]
- Kovesi, P. Phase congruency: A low-level image invariant. Psychol. Res. 2000, 64, 136–148. [Google Scholar] [CrossRef]
- Kovesi, P. Phase congruency detects corners and edges. In Proceedings of the Australian Pattern Recognition Society Conference, Sydney, SA, Australia, 10–12 December 2003; pp. 309–318. [Google Scholar]
- Ye, Y.; Bruzzone, L.; Shan, J.; Bovolo, F.; Zhu, Q. Fast and robust matching for multimodal remote sensing image registration. IEEE Trans. Geosci. Remote Sens. 2019, 57, 9059–9070. [Google Scholar] [CrossRef] [Green Version]
- Donoser, M.; Bischof, H. Efficient maximally stable extremal region (MSER) tracking. In Proceedings of the IEEE Conference on Computer Vision and Pattern Recognition, New York, NY, USA, 17–22 June 2006; pp. 553–560. [Google Scholar]
- Henriques, J.F.; Caseiro, R.; Martins, P.; Batista, J. High-speed tracking with kernelized correlation filters. IEEE Trans. Pattern Anal. Mach. Intell. 2014, 37, 583–596. [Google Scholar] [CrossRef] [PubMed] [Green Version]
- Alavi, S.M.M.; Zhang, Y. Phase congruency parameter optimization for enhanced detection of image features for both natural and medical applications. arXiv 2017, arXiv:1705.02102. [Google Scholar]
- Rosten, E.; Drummond, T. Machine learning for high-speed corner detection. In Proceedings of the European Conference on Computer Vision, Graz, Austria, 7–13 May 2006; pp. 430–443. [Google Scholar]
- Calonder, M.; Lepetit, V.; Strecha, C.; Fua, P. BRIEF: Binary robust independent elementary features. In Proceedings of the European Conference on Computer Vision, Crete, Greece, 5–11 September 2010; pp. 778–792. [Google Scholar]
- Morel, J.M.; Yu, G. ASIFT: A new framework for fully affine invariant image comparison. SIAM J. Imaging Sci. 2009, 2, 438–469. [Google Scholar] [CrossRef]
- Lowe, D.G. Distinctive image features from scale-invariant keypoints. Int. J. Comput. Vis. 2004, 60, 91–110. [Google Scholar] [CrossRef]


| Parameters | Range | Default | Meaning |
|---|---|---|---|
| [3~6] | 4 | Number of wavelet scales. | |
| [1~6] | 6 | Number of filter orientations. | |
| 3 | Wavelength of smallest scale filter | ||
| [1.3, 1.6, 2.1, 3] | 1.6 | Scaling factor between successive filters. | |
| [0.1~1] | 0.55 | Ratio of the standard deviation of the Gaussian. | |
| [10~20] | 2 | Noise scaling factor. | |
| (0~1] | 0.5 | The fractional measure of frequency spread. | |
| [1~50] | 10 | Controls the sharpness of the transition in the sigmoid function. |
| Parameters | Optimization Range |
|---|---|
| [0.1, 0.15,…, 0.95, 1] (Interval 0.05) | |
| [1.3, 1.6, 2.1, 3] |
| Datasets | Optimized Parameters | Average NCM | Default Parameters | Average NCM |
|---|---|---|---|---|
| Infrared-Optical | [1.6, 0.50, 1.6, 0.60] | 86 | [1.6, 0.70, 1.6, 0.70] | 63 |
| Depth-Optical | [1.3, 0.50, 1.6, 0.45] | 204 | [1.6, 0.70, 1.6, 0.70] | 101 |
| SAR-Optical | [1.6, 0.45, 1.6, 0.45] | 96 | [1.6, 0.70, 1.6, 0.70] | 58 |
| Map-Optical | [1.6, 0.45, 2.1, 0.65] | 147 | [1.6, 0.70, 1.6, 0.70] | 61 |
| METHOD | AVERAGE PRECISION/% | |||
|---|---|---|---|---|
| NIR-IR | UAV | Remote Sensing | Computer Vision | |
| SUPERGLUE | 76.46 | 40.24 | 44.72 | 63.31 |
| CFOG | 99.17 | 0 | 61.50 | 63.29 |
| RIFT | 99.10 | 12.57 | 77.68 | 39.31 |
| ROOT-SIFT | 98.15 | 53.69 | 41.14 | 47.98 |
| OURS | 99.14 | 79.31 | 80.13 | 81.48 |
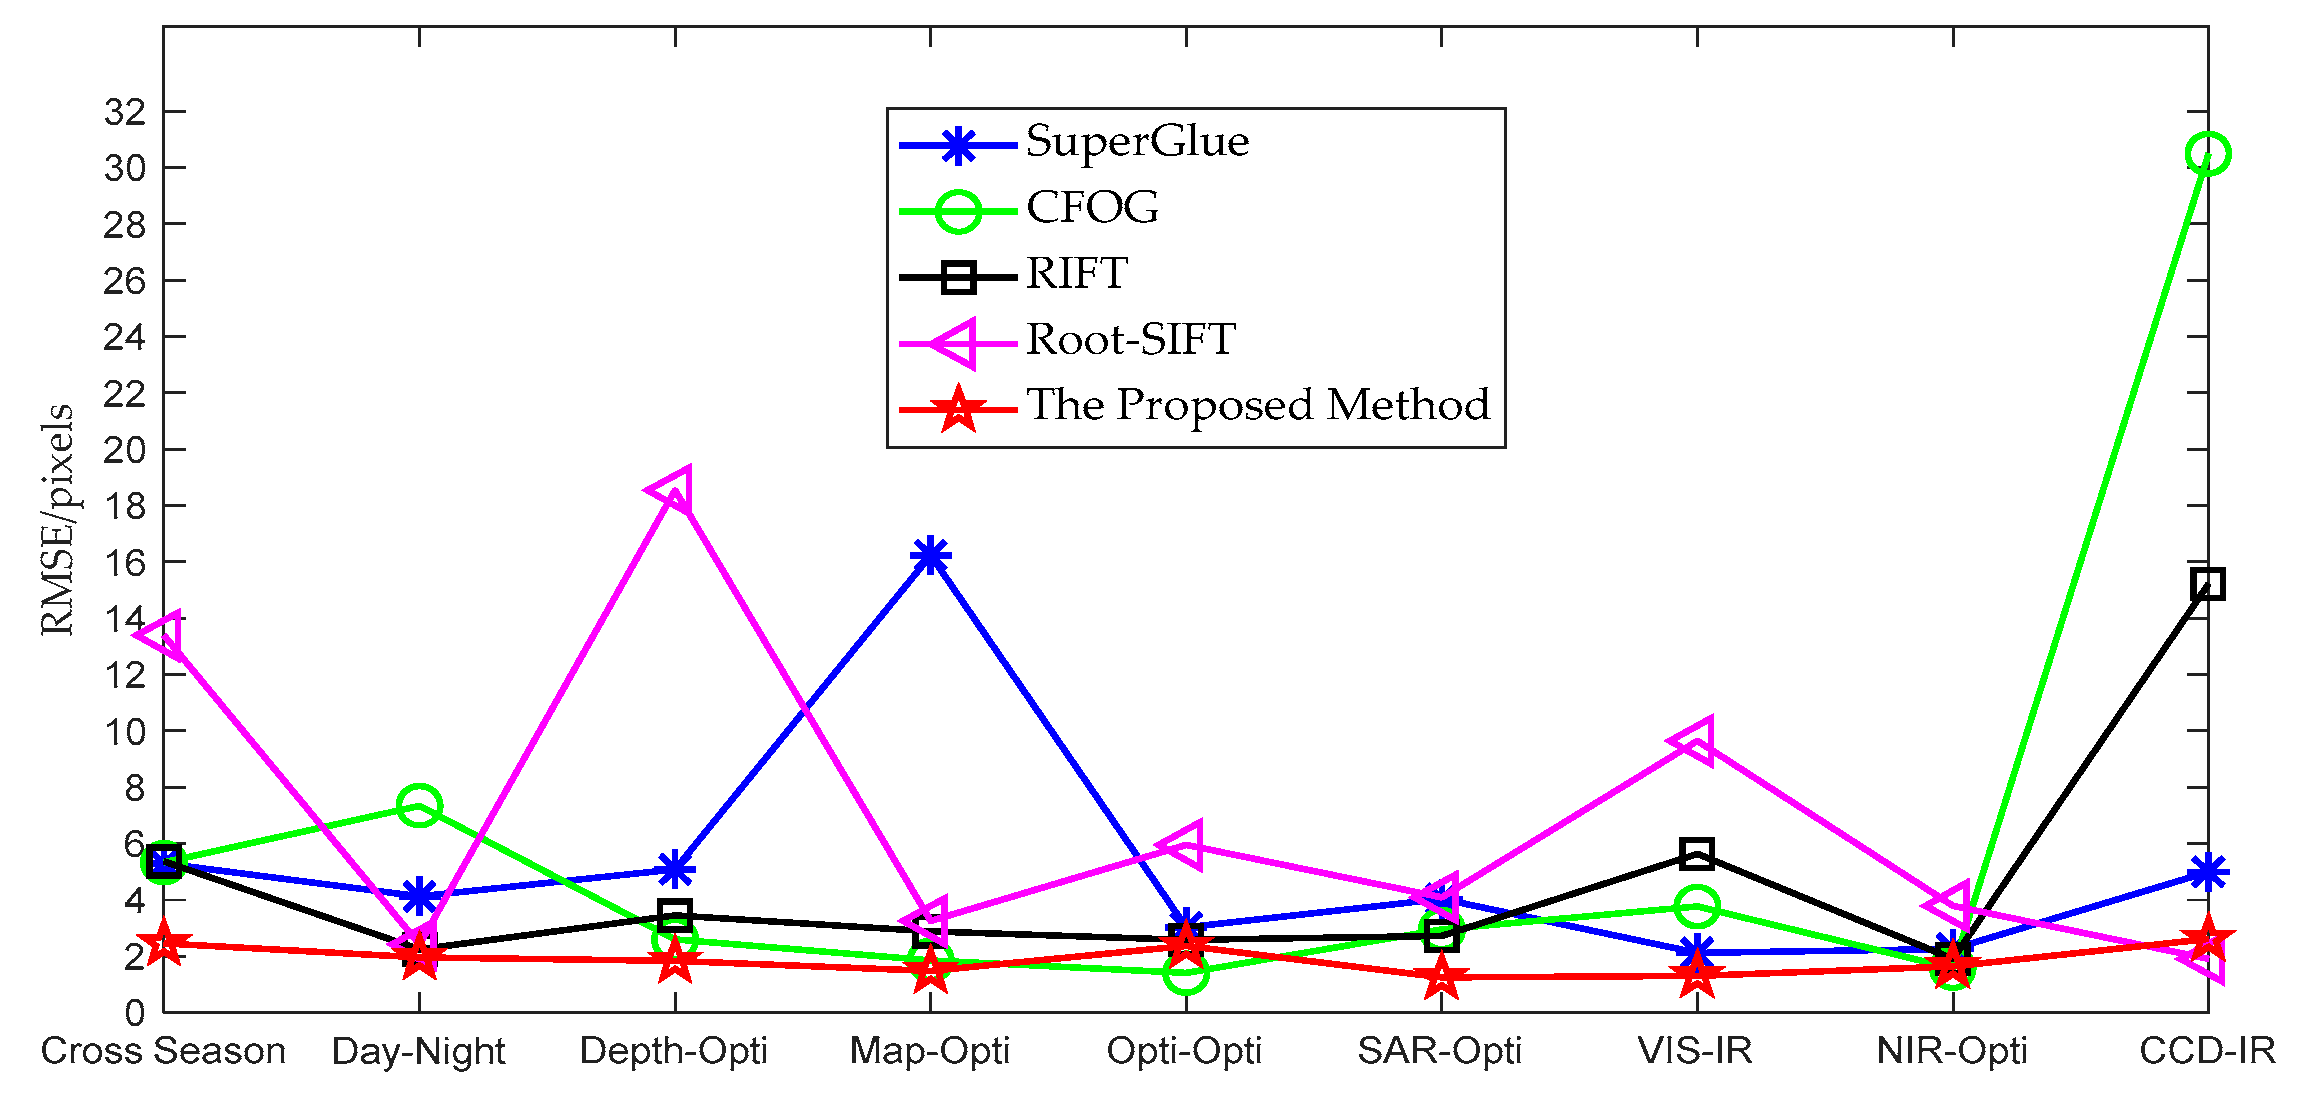
| Metric | Cross-Season | Day-Night | Opti-Opti | Depth-Opti | Map-Opti | SAR-Opti | IR-Opti | NIR-Opti | VIS-IR |
|---|---|---|---|---|---|---|---|---|---|
| MEE | 1.446 | 0.9649 | 1.1478 | 1.026 | 1.3842 | 0.8799 | 1.1324 | 1.089 | 1.50 |
| NCM | 99 | 135 | 154 | 204 | 147 | 96 | 183 | 668 | 125 |
| RMSE | 2.4648 | 1.9649 | 1.8412 | 1.4847 | 2.378 | 1.2567 | 1.3177 | 1.6547 | 2.629 |
| Precision | 0.7678 | 0.8508 | 0.7816 | 0.8266 | 0.7595 | 0.8716 | 0.9347 | 0.9914 | 0.7931 |
Publisher’s Note: MDPI stays neutral with regard to jurisdictional claims in published maps and institutional affiliations. |
© 2022 by the authors. Licensee MDPI, Basel, Switzerland. This article is an open access article distributed under the terms and conditions of the Creative Commons Attribution (CC BY) license (https://creativecommons.org/licenses/by/4.0/).
Share and Cite
Liu, X.; Xue, J.; Xu, X.; Lu, Z.; Liu, R.; Zhao, B.; Li, Y.; Miao, Q. Robust Multimodal Remote Sensing Image Registration Based on Local Statistical Frequency Information. Remote Sens. 2022, 14, 1051. https://doi.org/10.3390/rs14041051
Liu X, Xue J, Xu X, Lu Z, Liu R, Zhao B, Li Y, Miao Q. Robust Multimodal Remote Sensing Image Registration Based on Local Statistical Frequency Information. Remote Sensing. 2022; 14(4):1051. https://doi.org/10.3390/rs14041051
Chicago/Turabian StyleLiu, Xiangzeng, Jiepeng Xue, Xueling Xu, Zixiang Lu, Ruyi Liu, Bocheng Zhao, Yunan Li, and Qiguang Miao. 2022. "Robust Multimodal Remote Sensing Image Registration Based on Local Statistical Frequency Information" Remote Sensing 14, no. 4: 1051. https://doi.org/10.3390/rs14041051