
Mapping Dwellings in IDP/Refugee Settlements Using Deep Learning

 , , and
Abstract
:1. Introduction
2. Materials and Methods
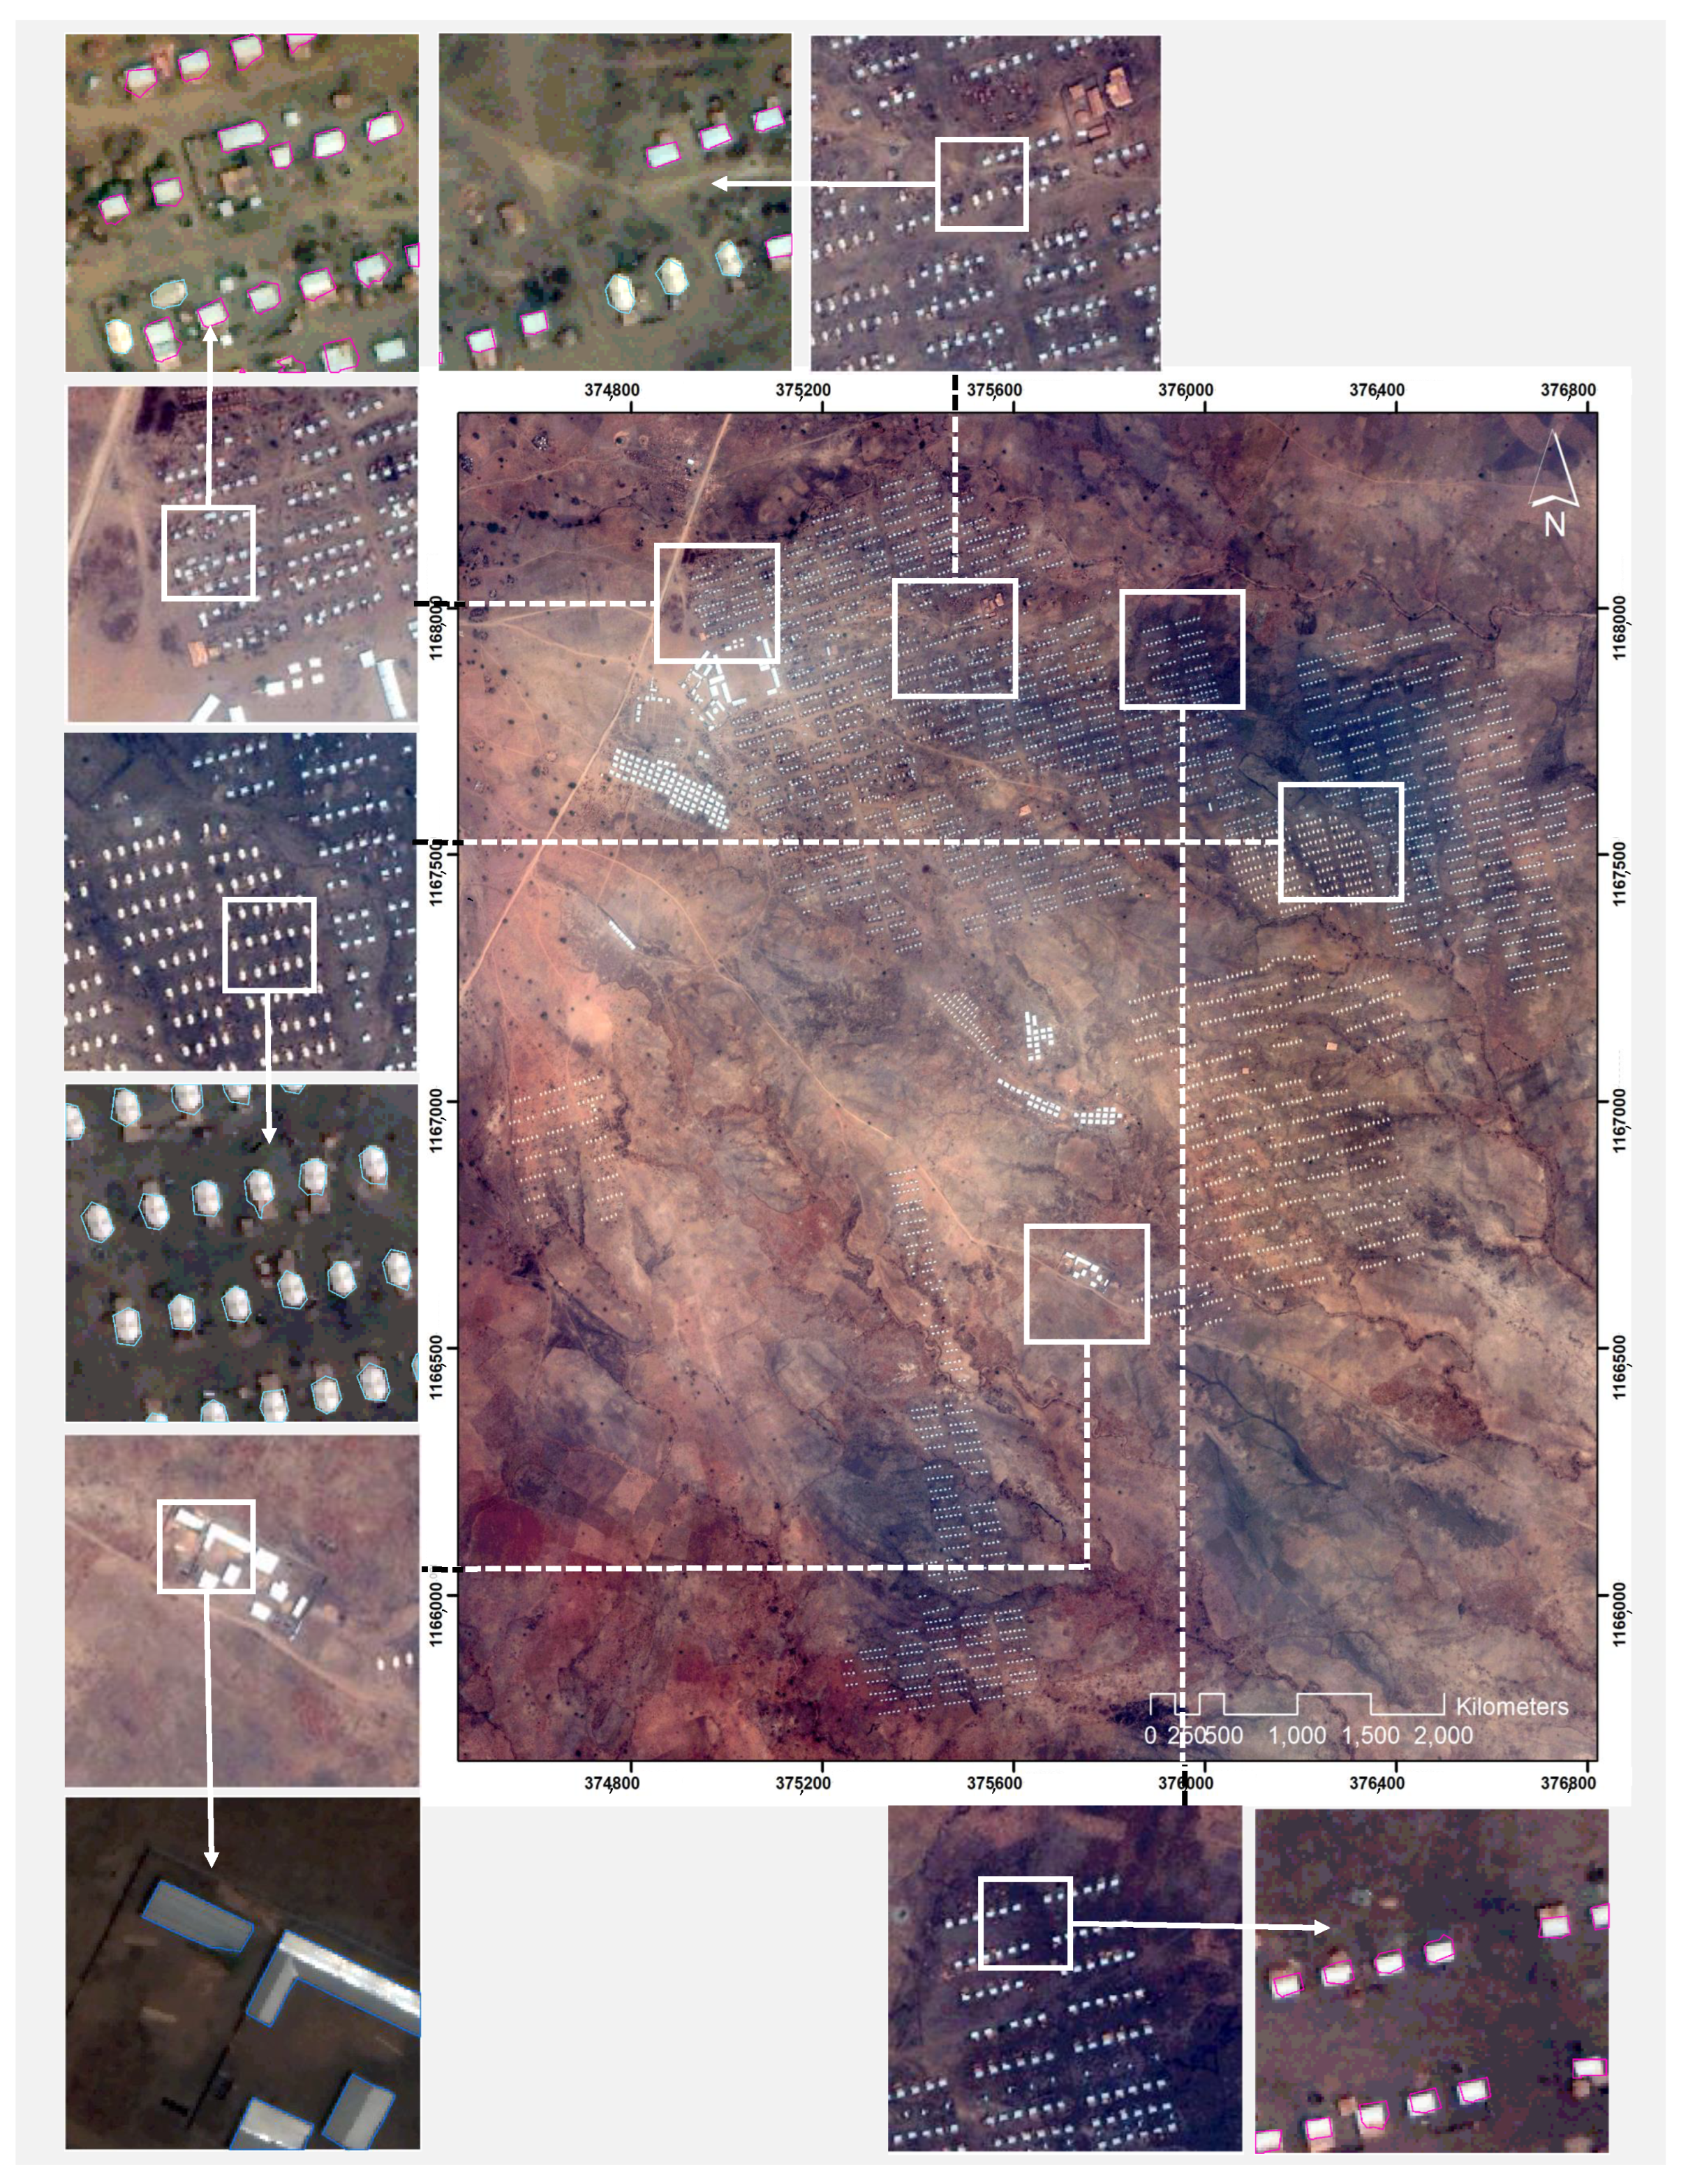
2.1. Study Site and Data Descriptions
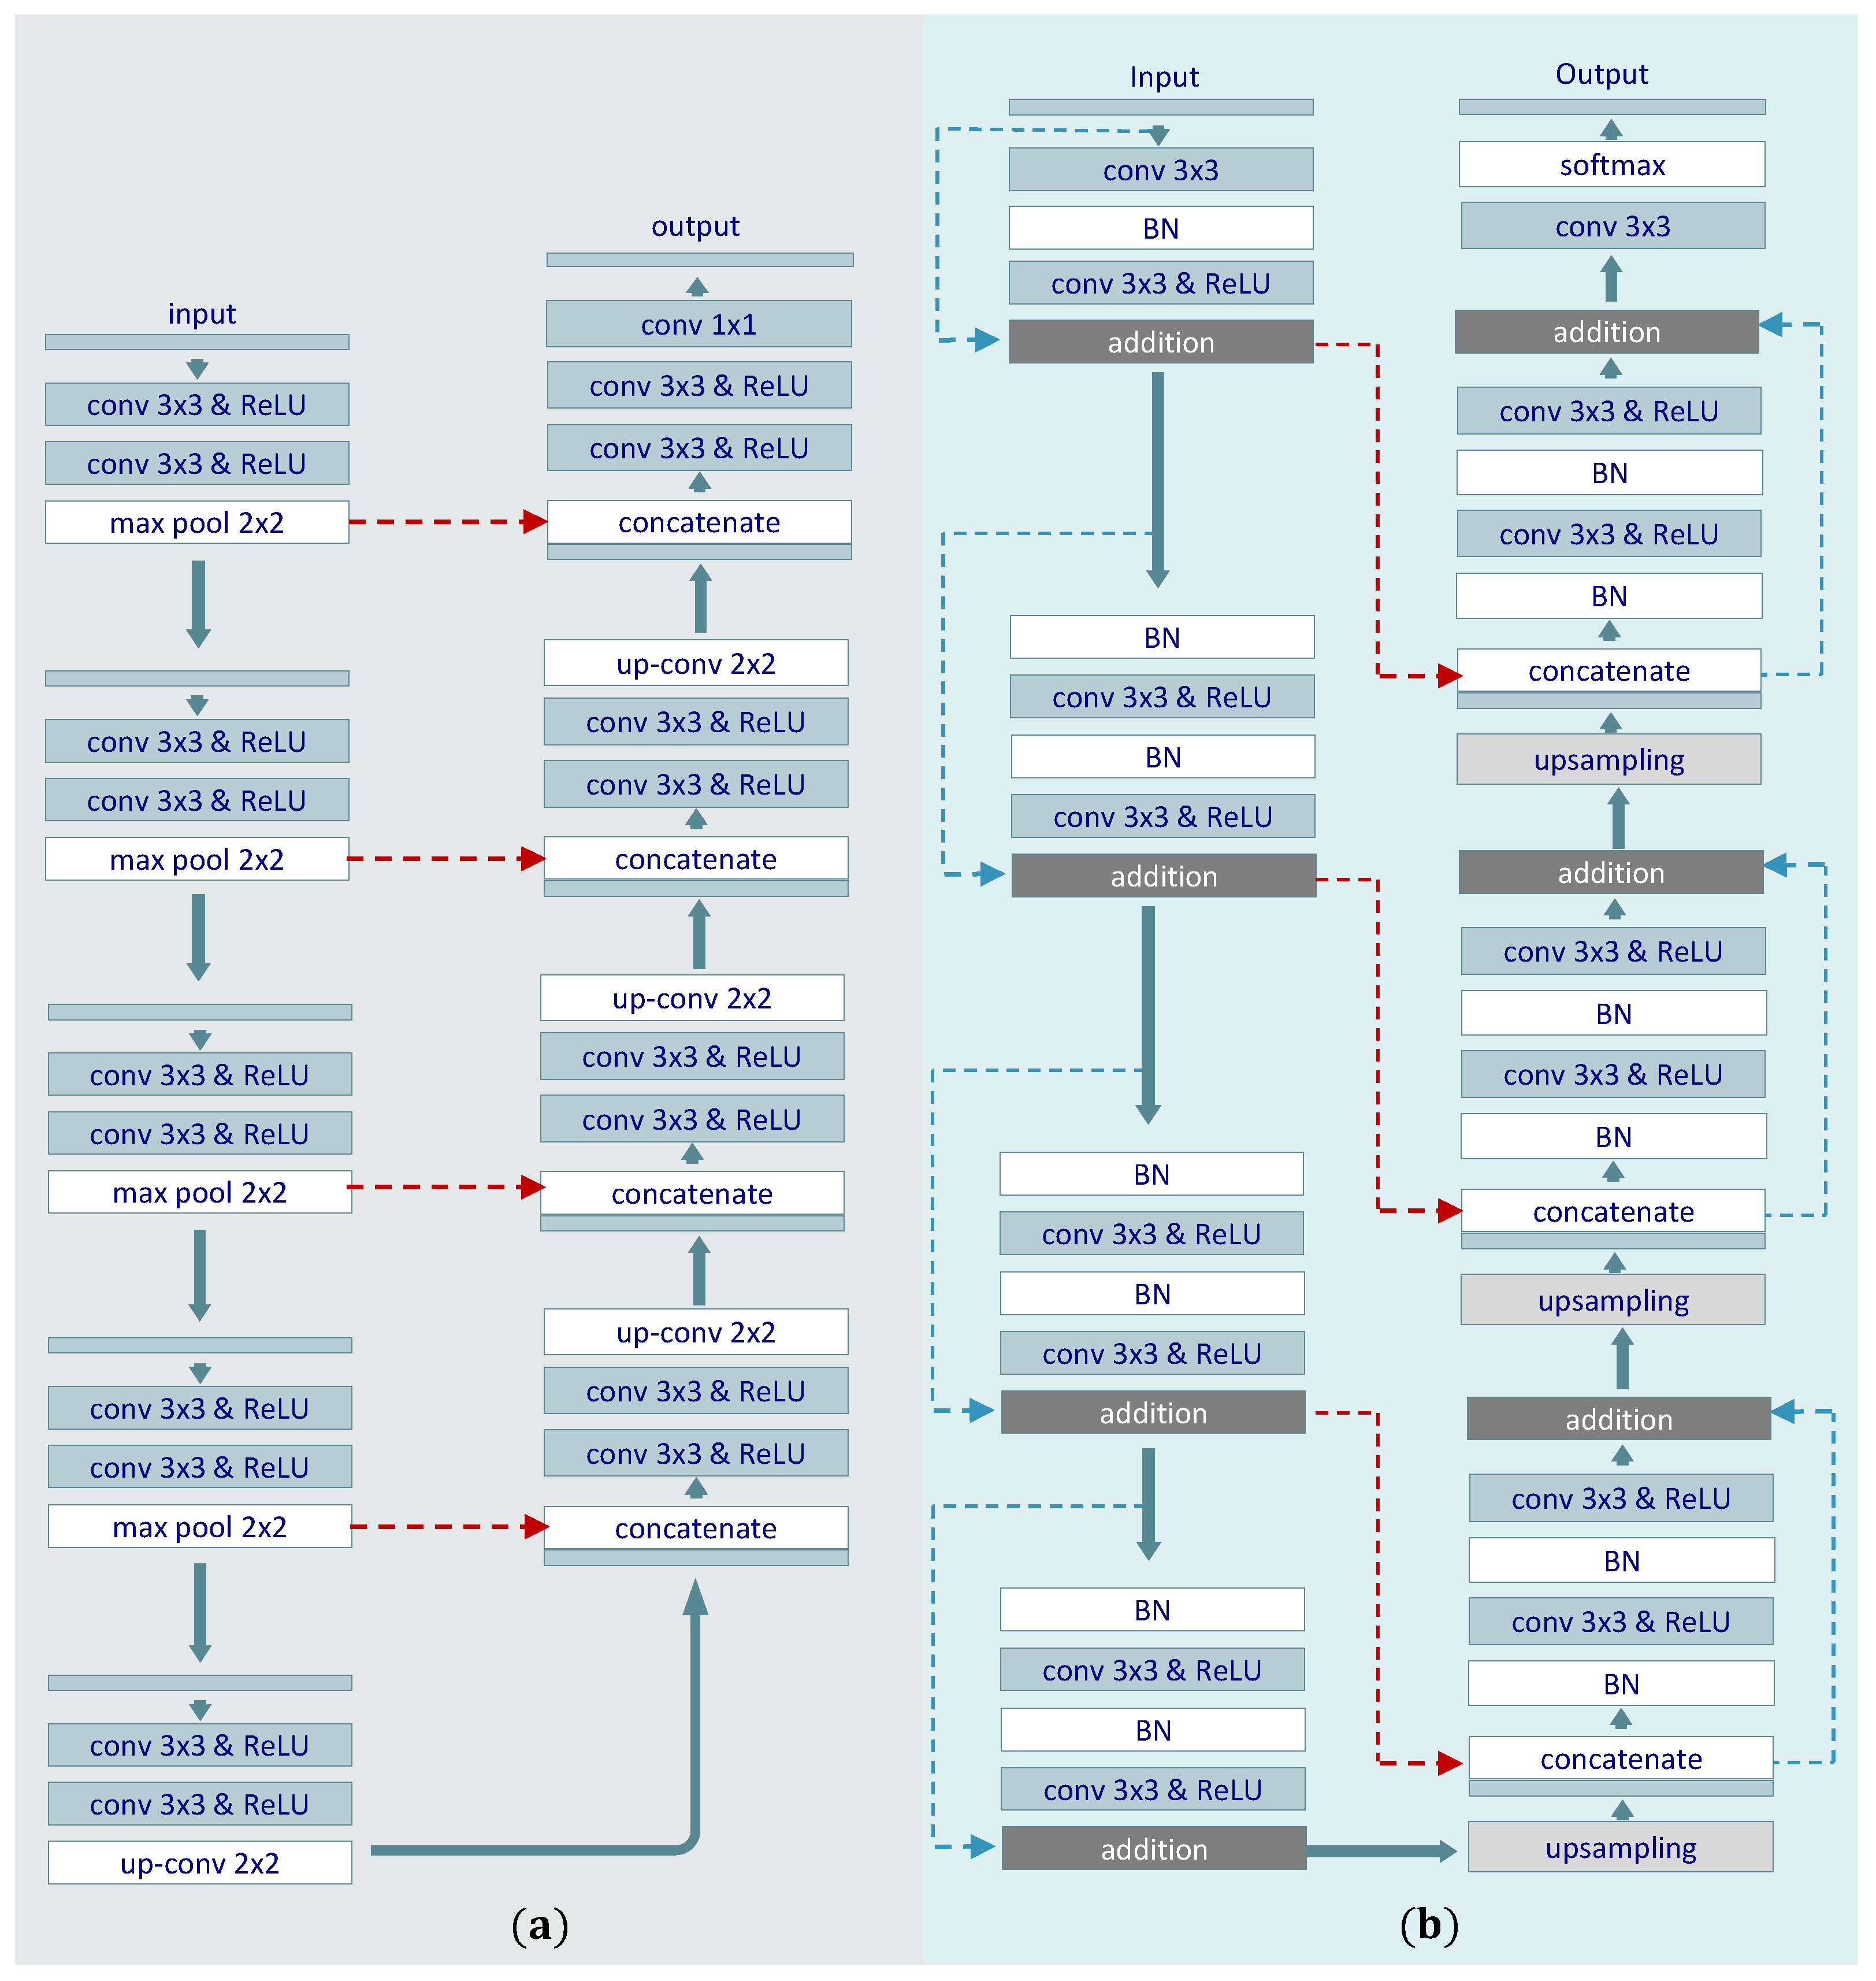
2.2. U-Net
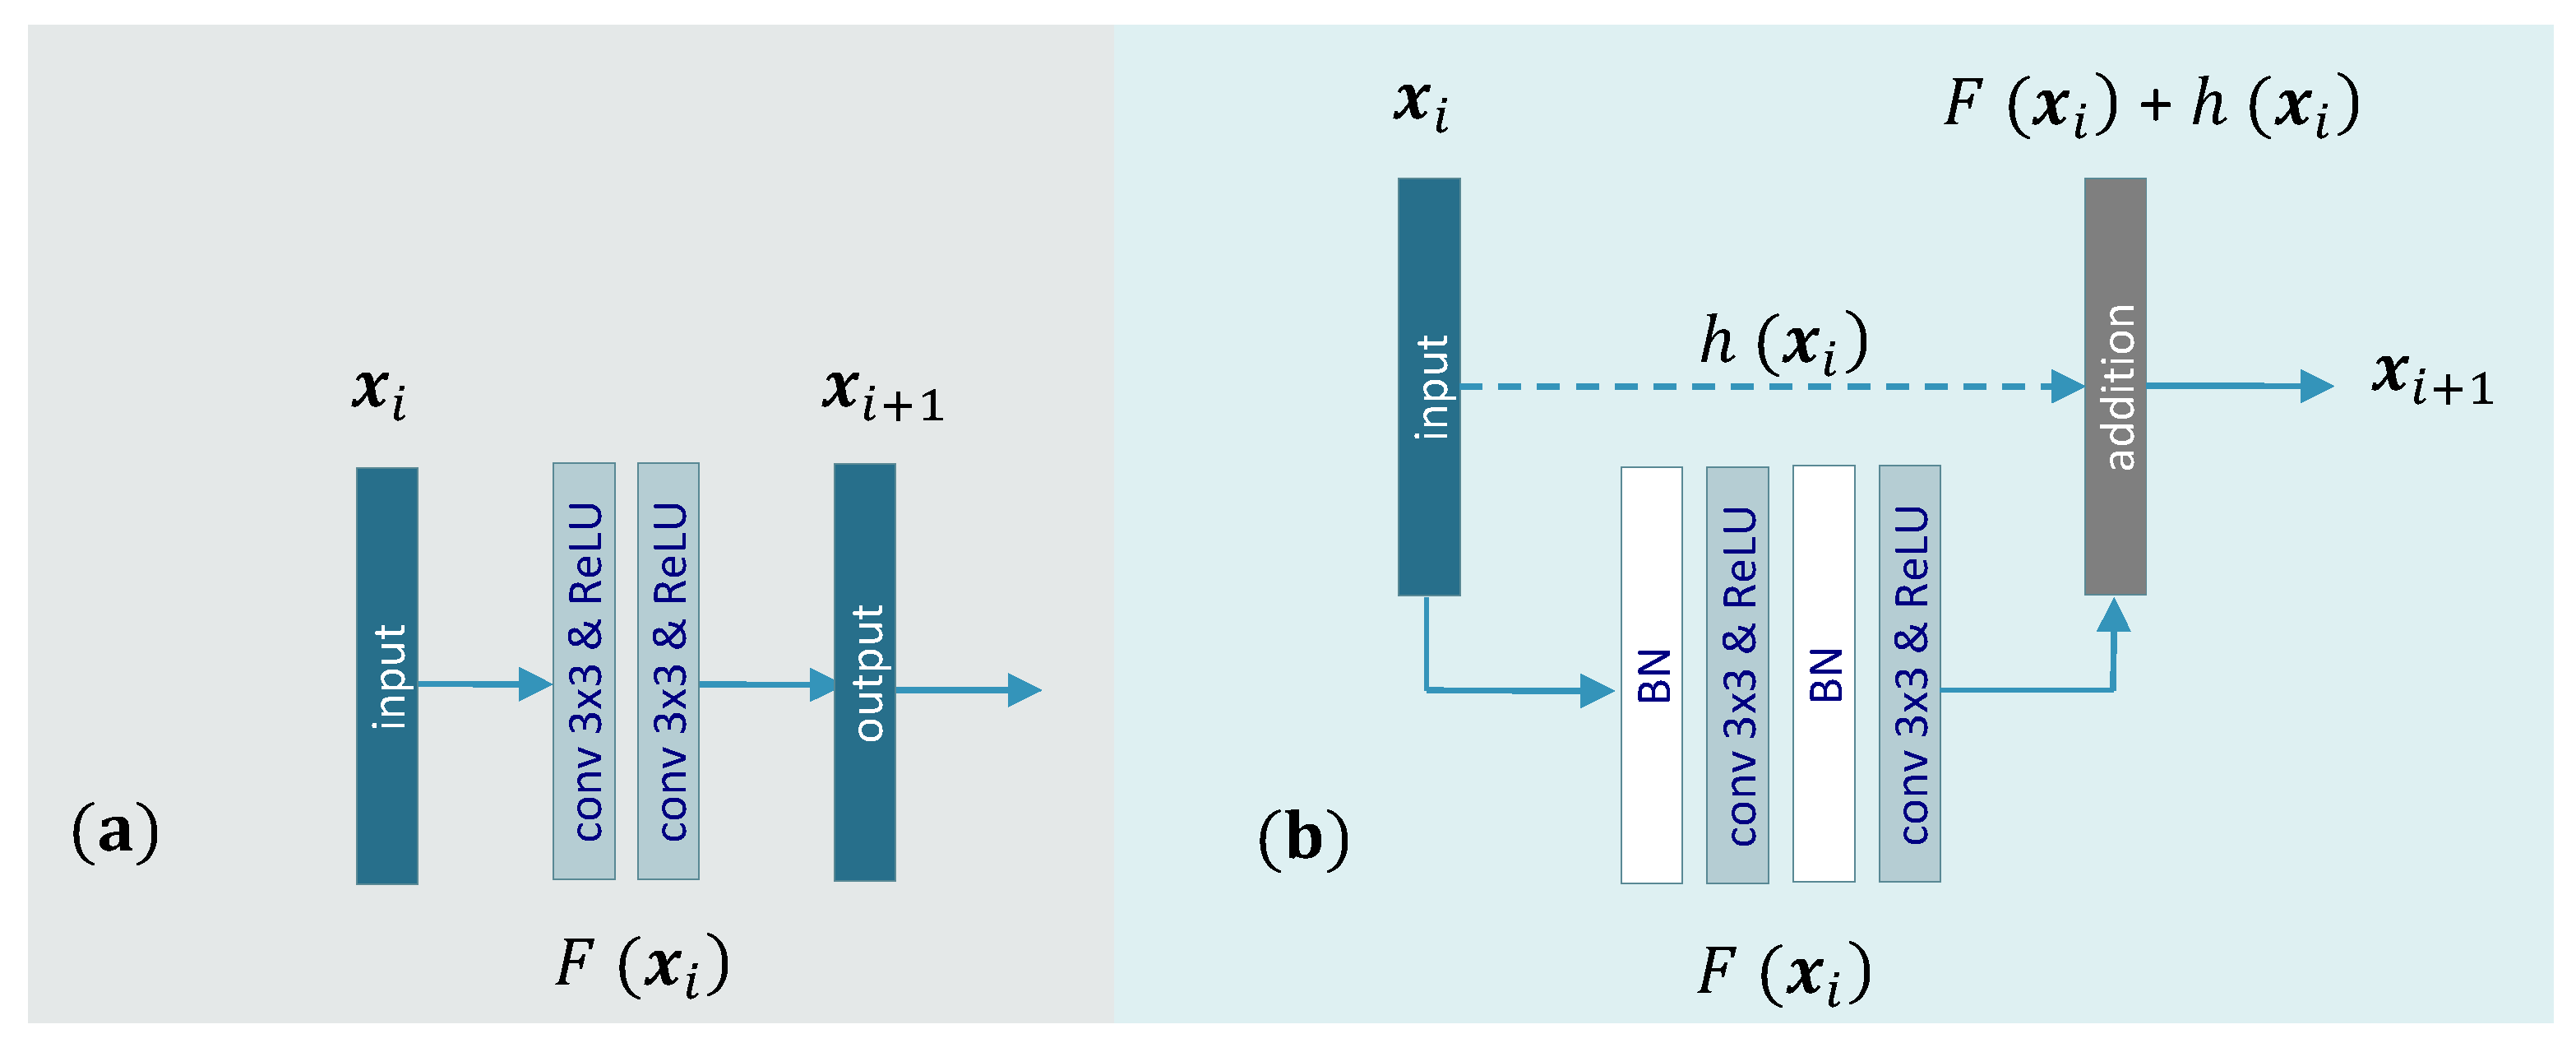
2.3. Residual U-Net
2.4. Applied Loss Functions
2.5. Implementation Details
2.6. Evaluation Metrics
3. Results
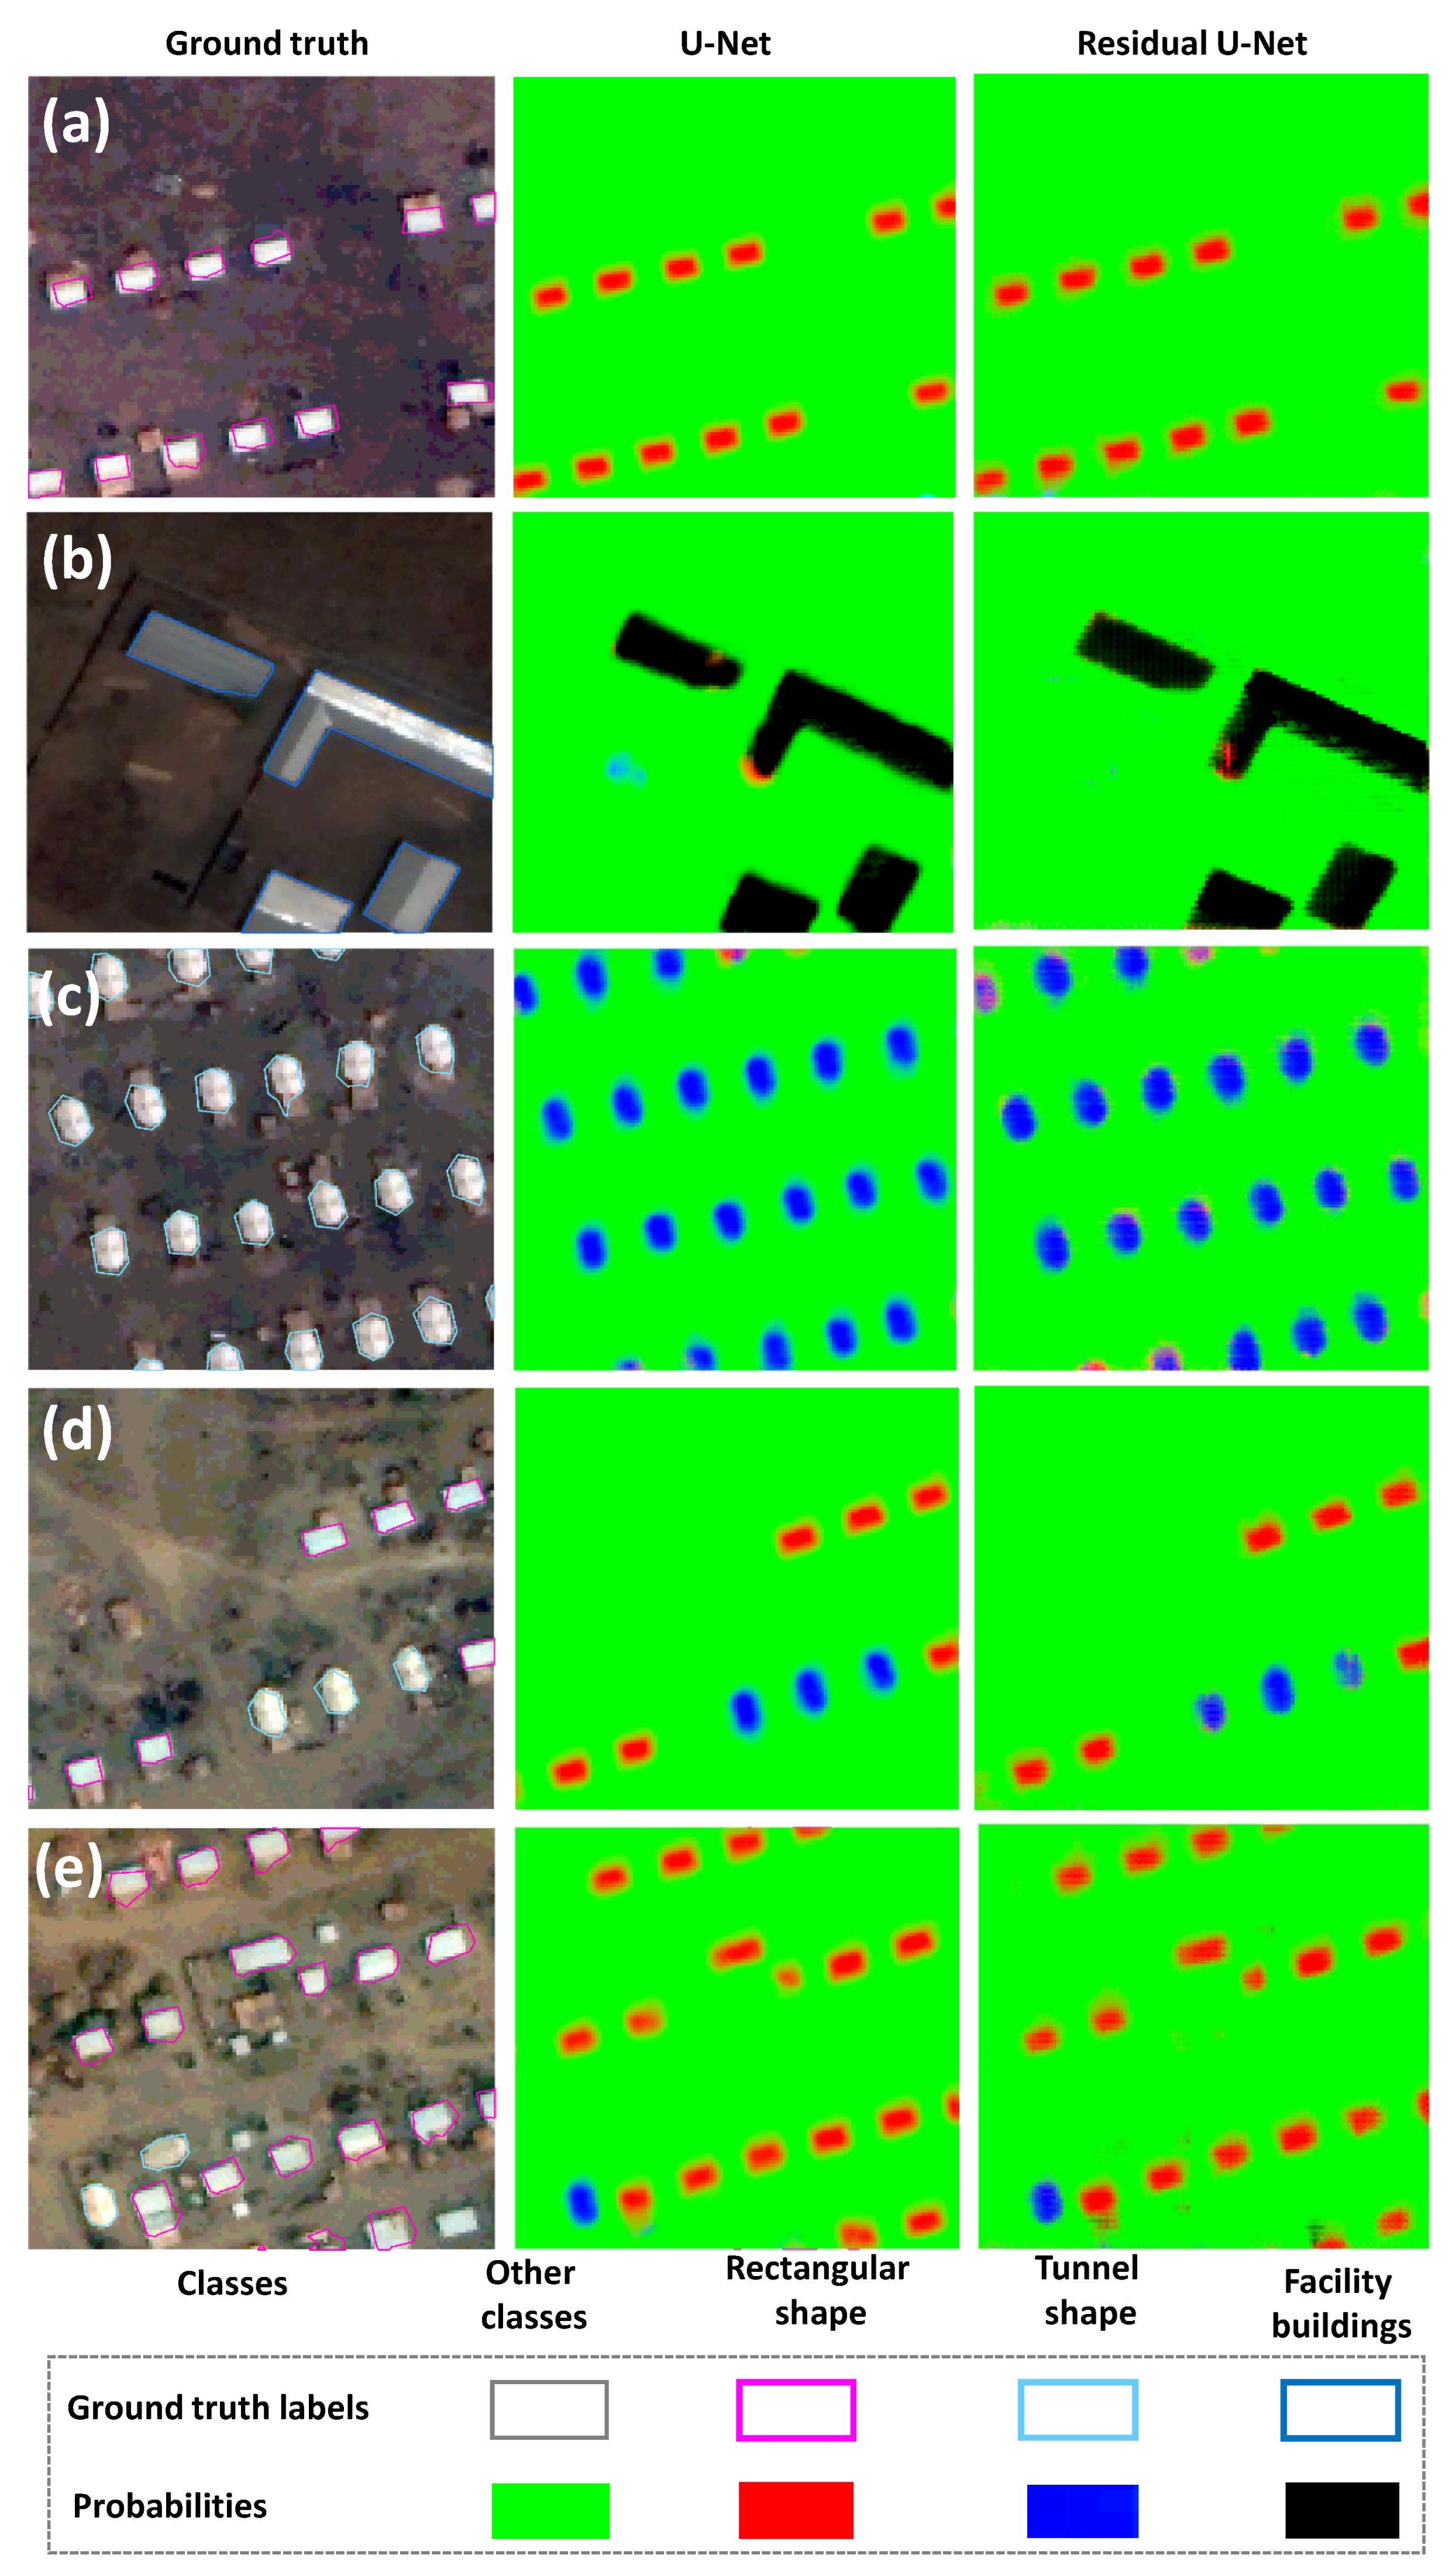
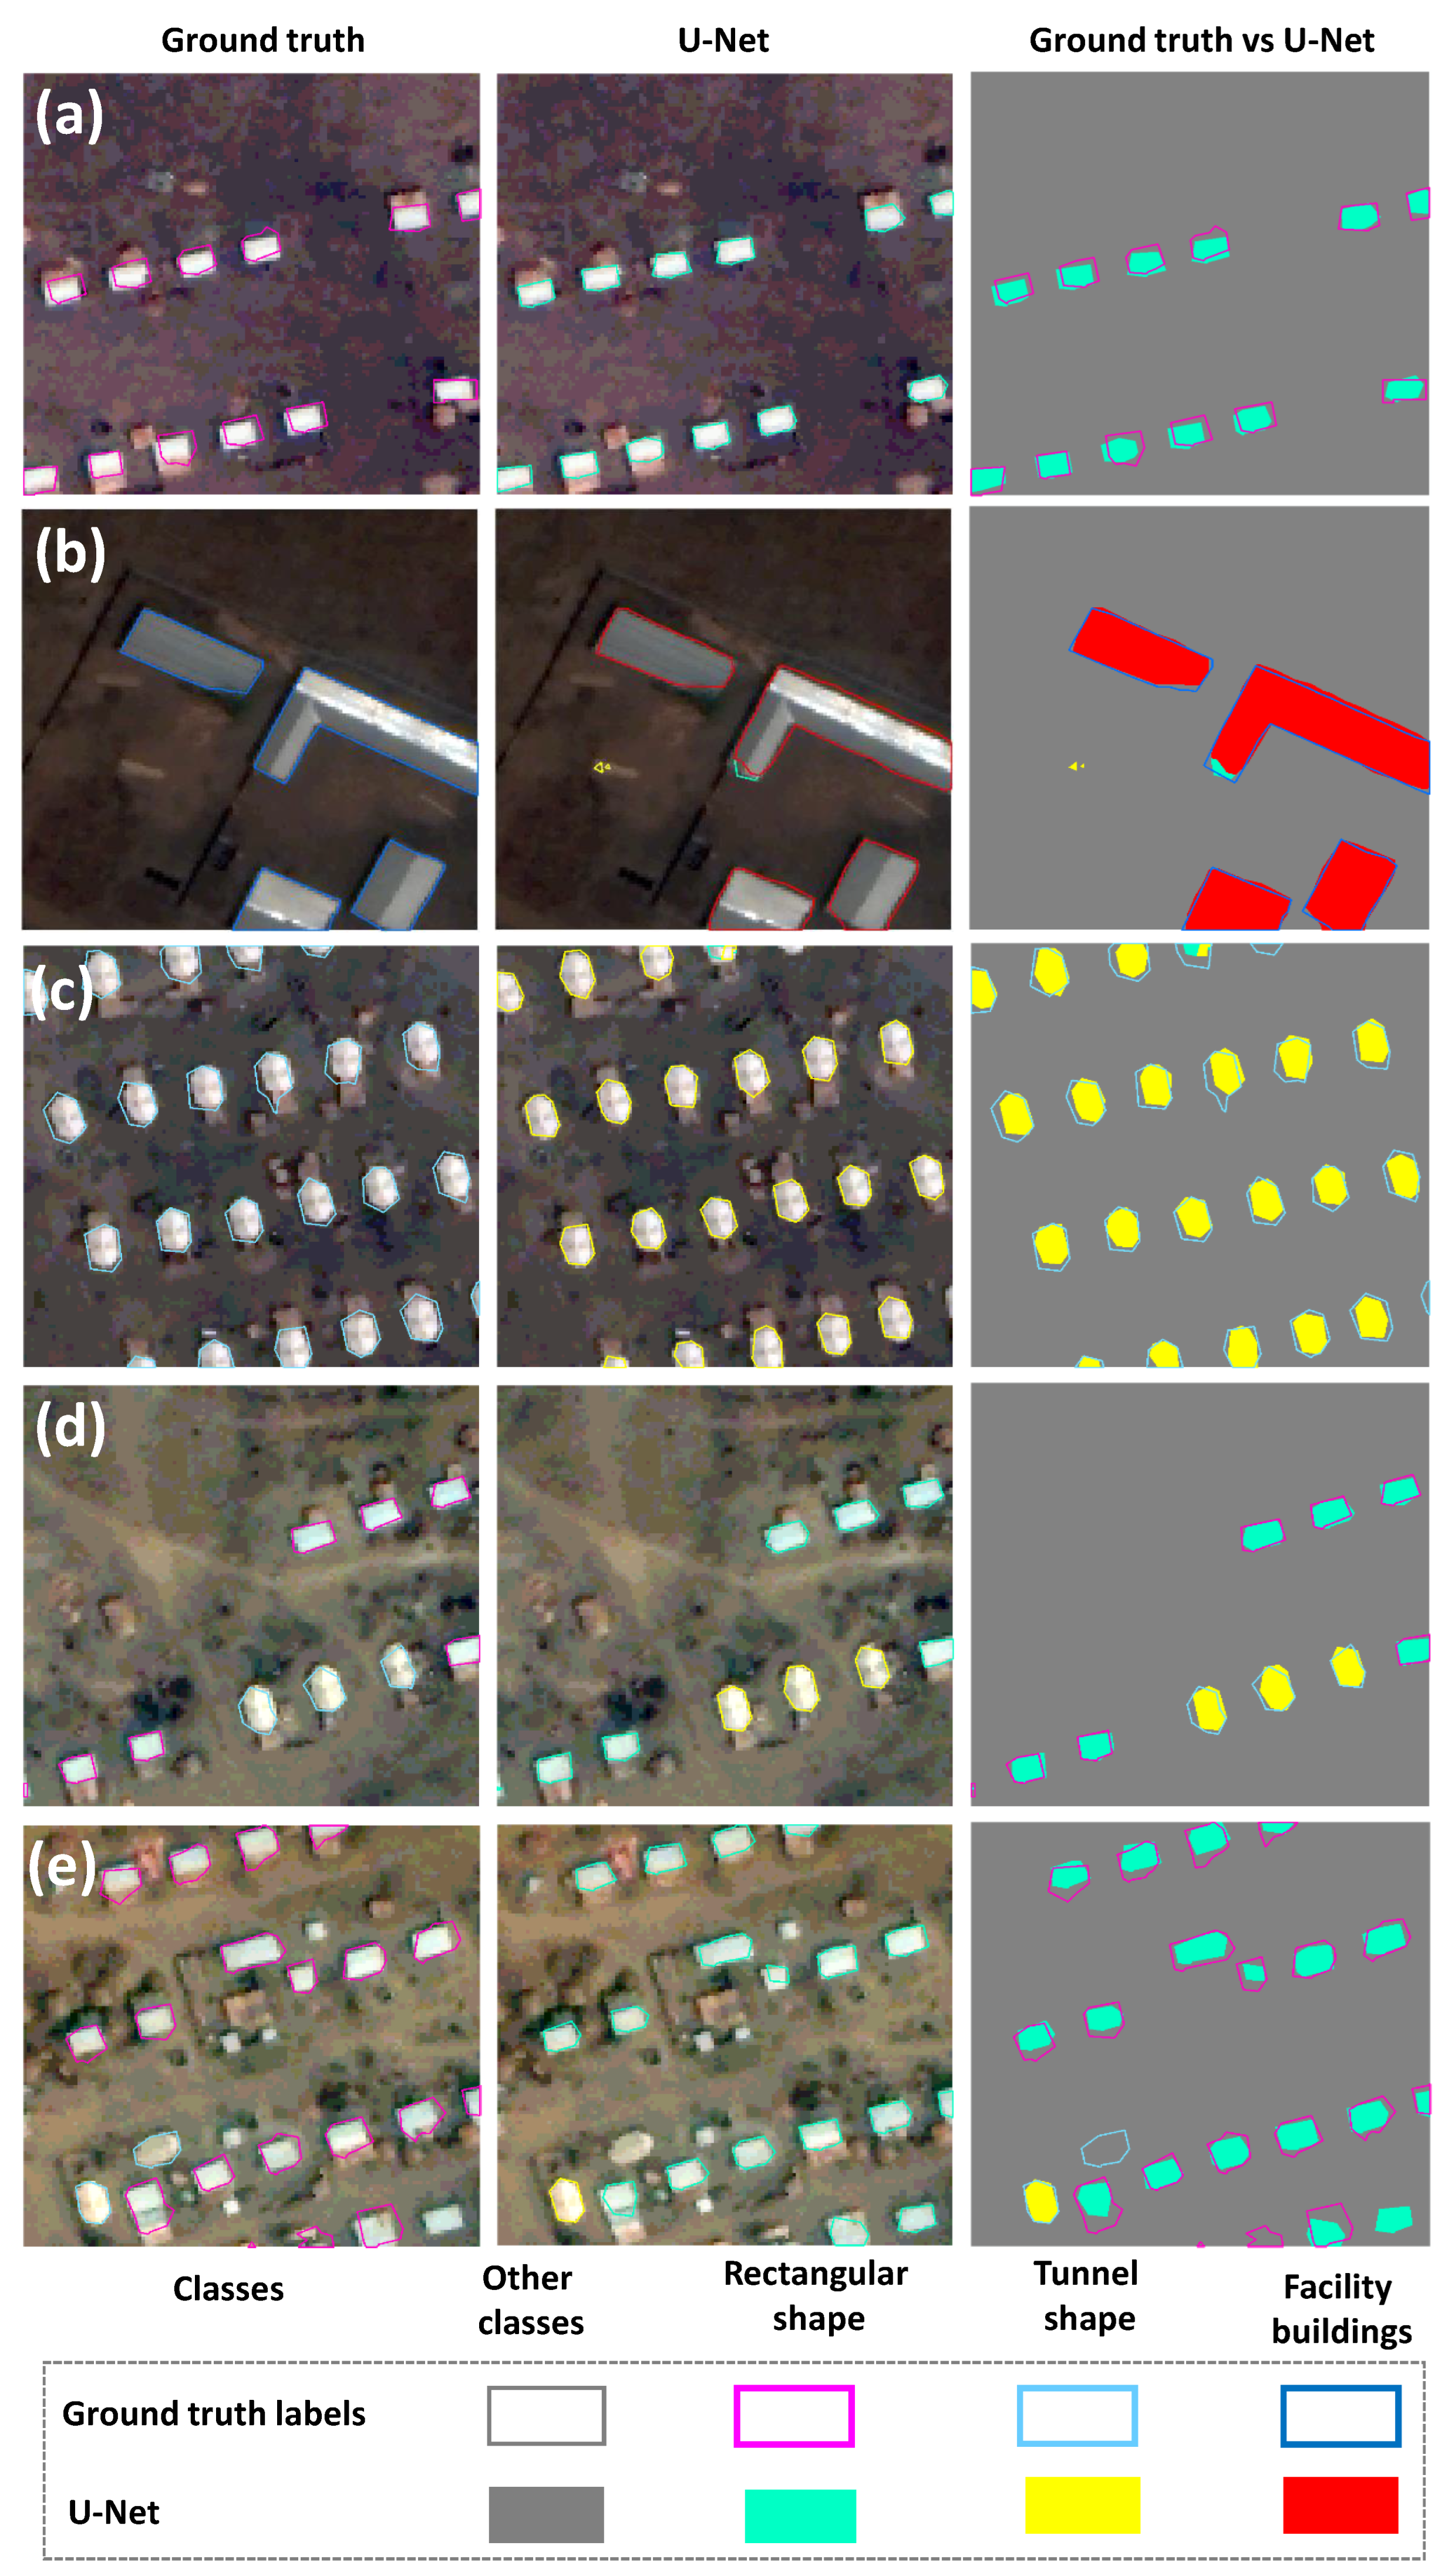
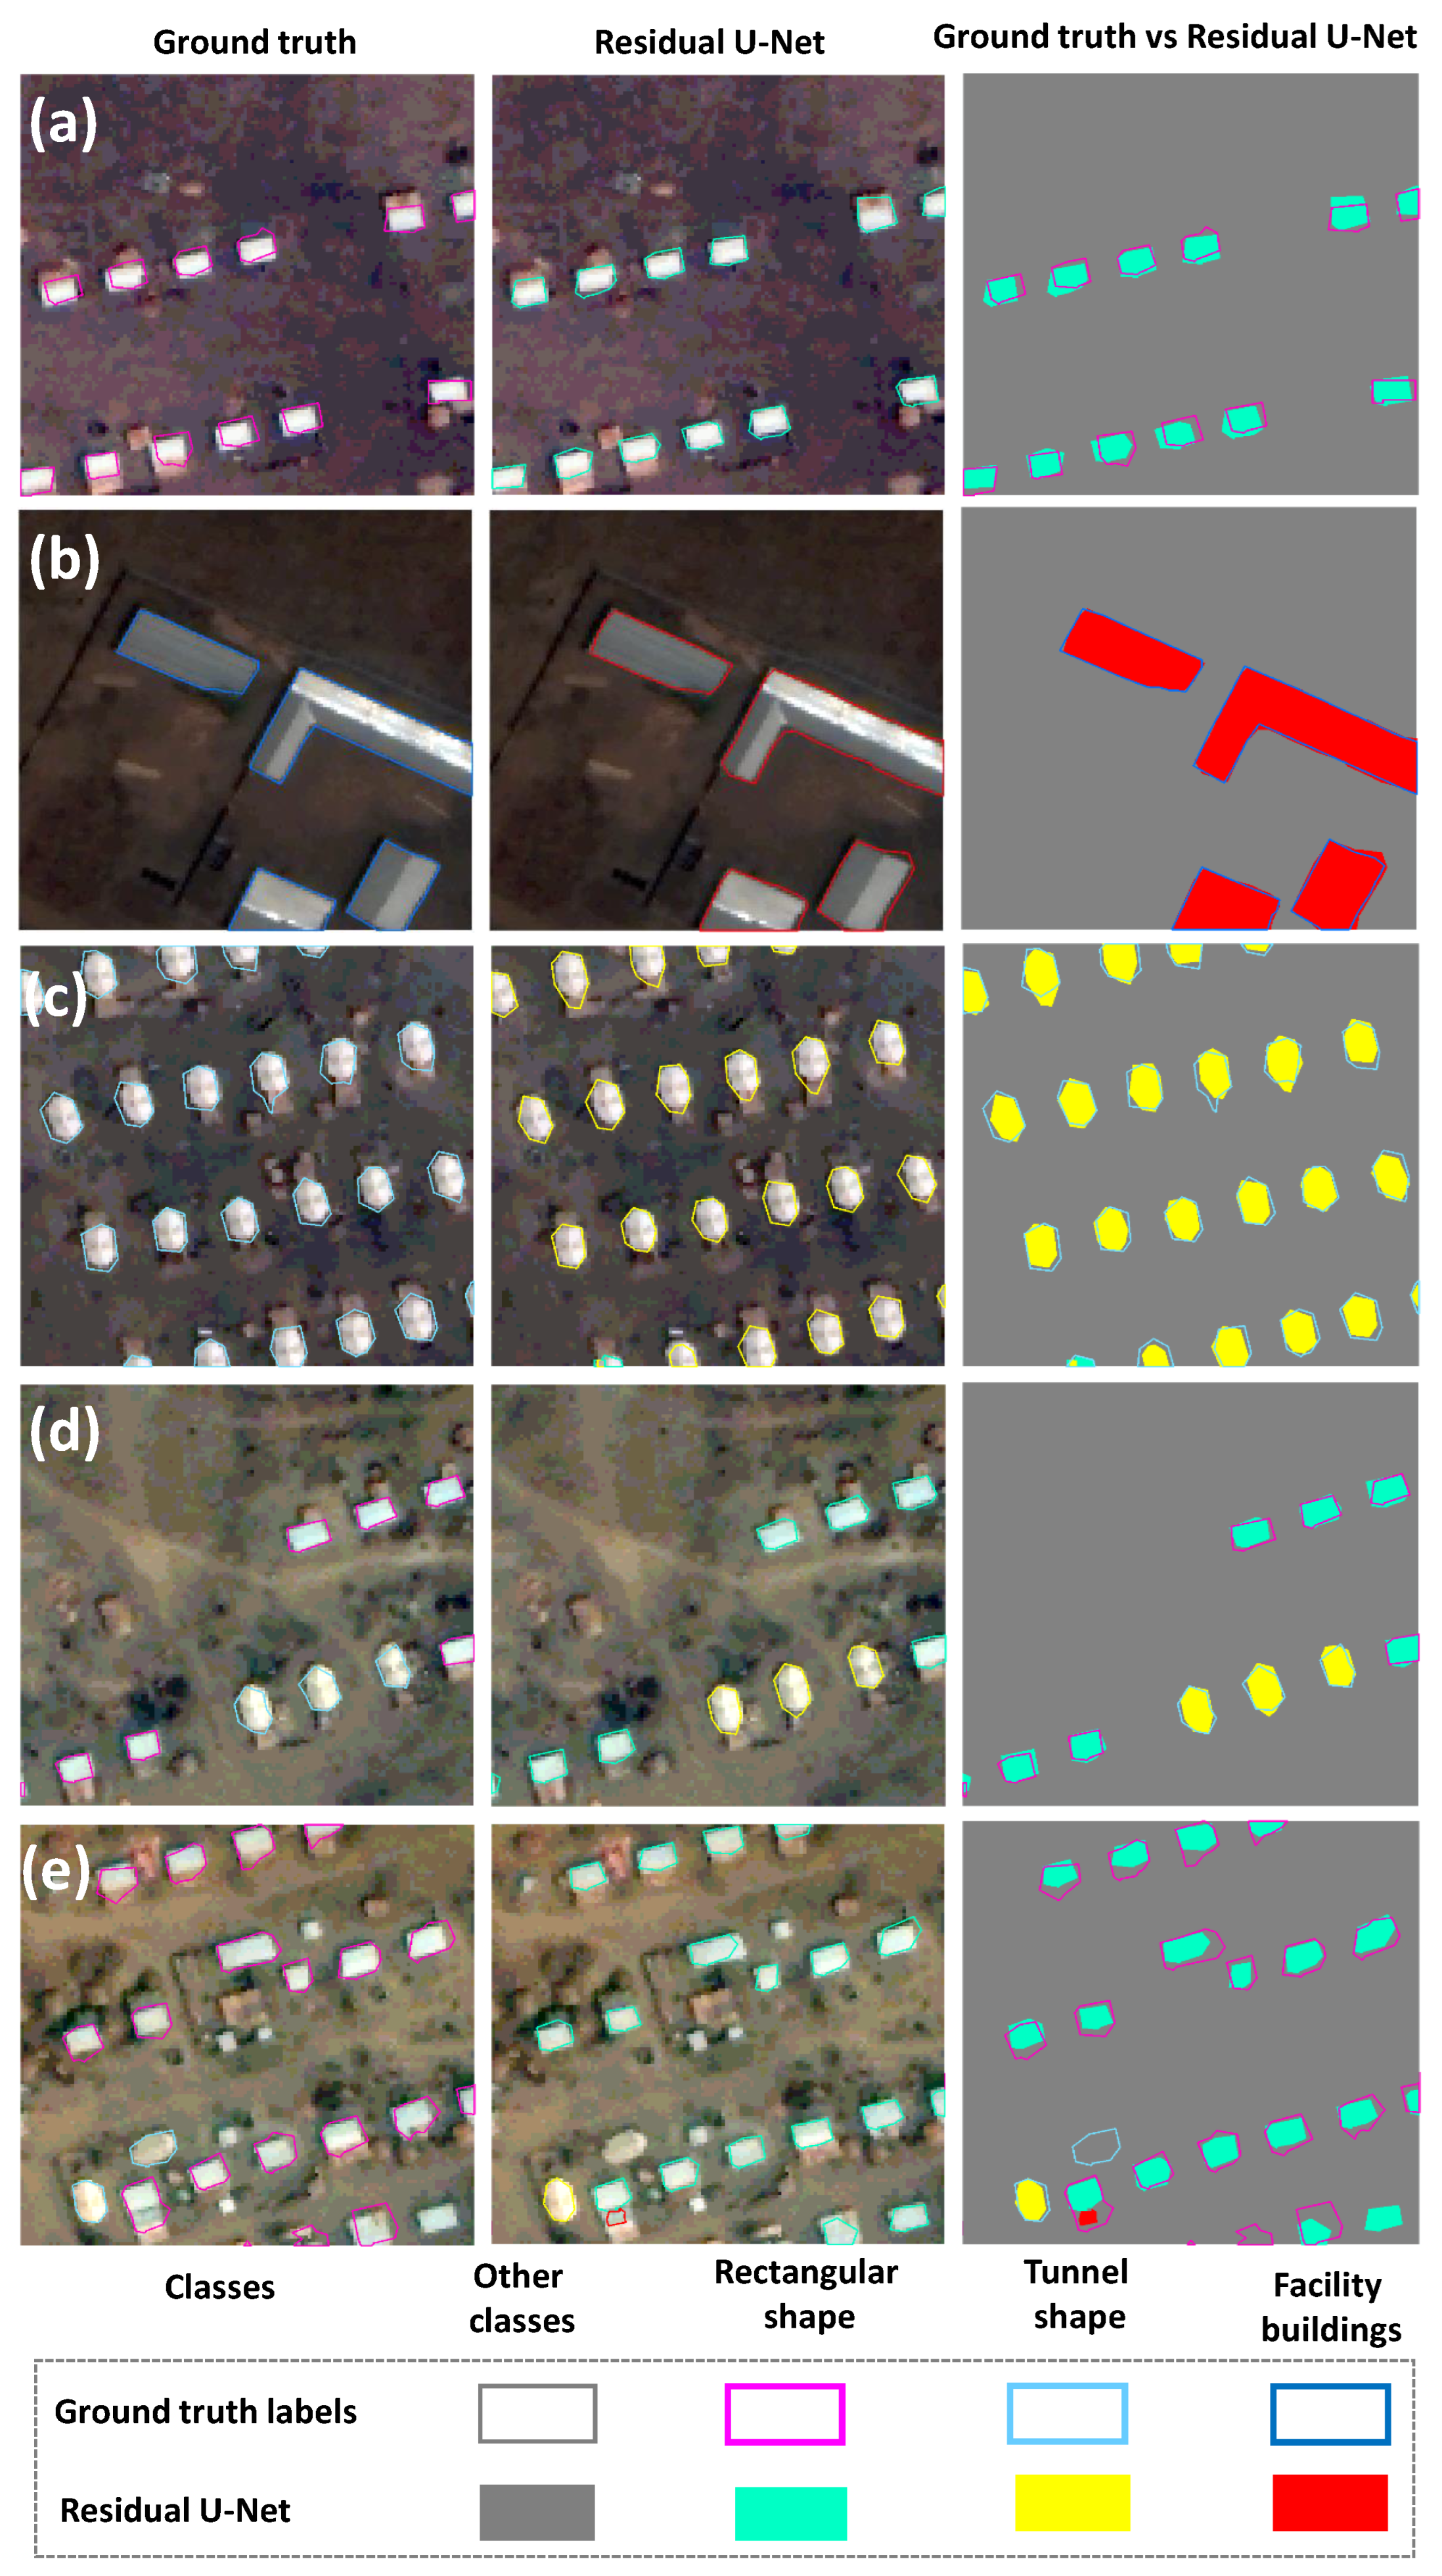
3.1. Qualitative Assessment
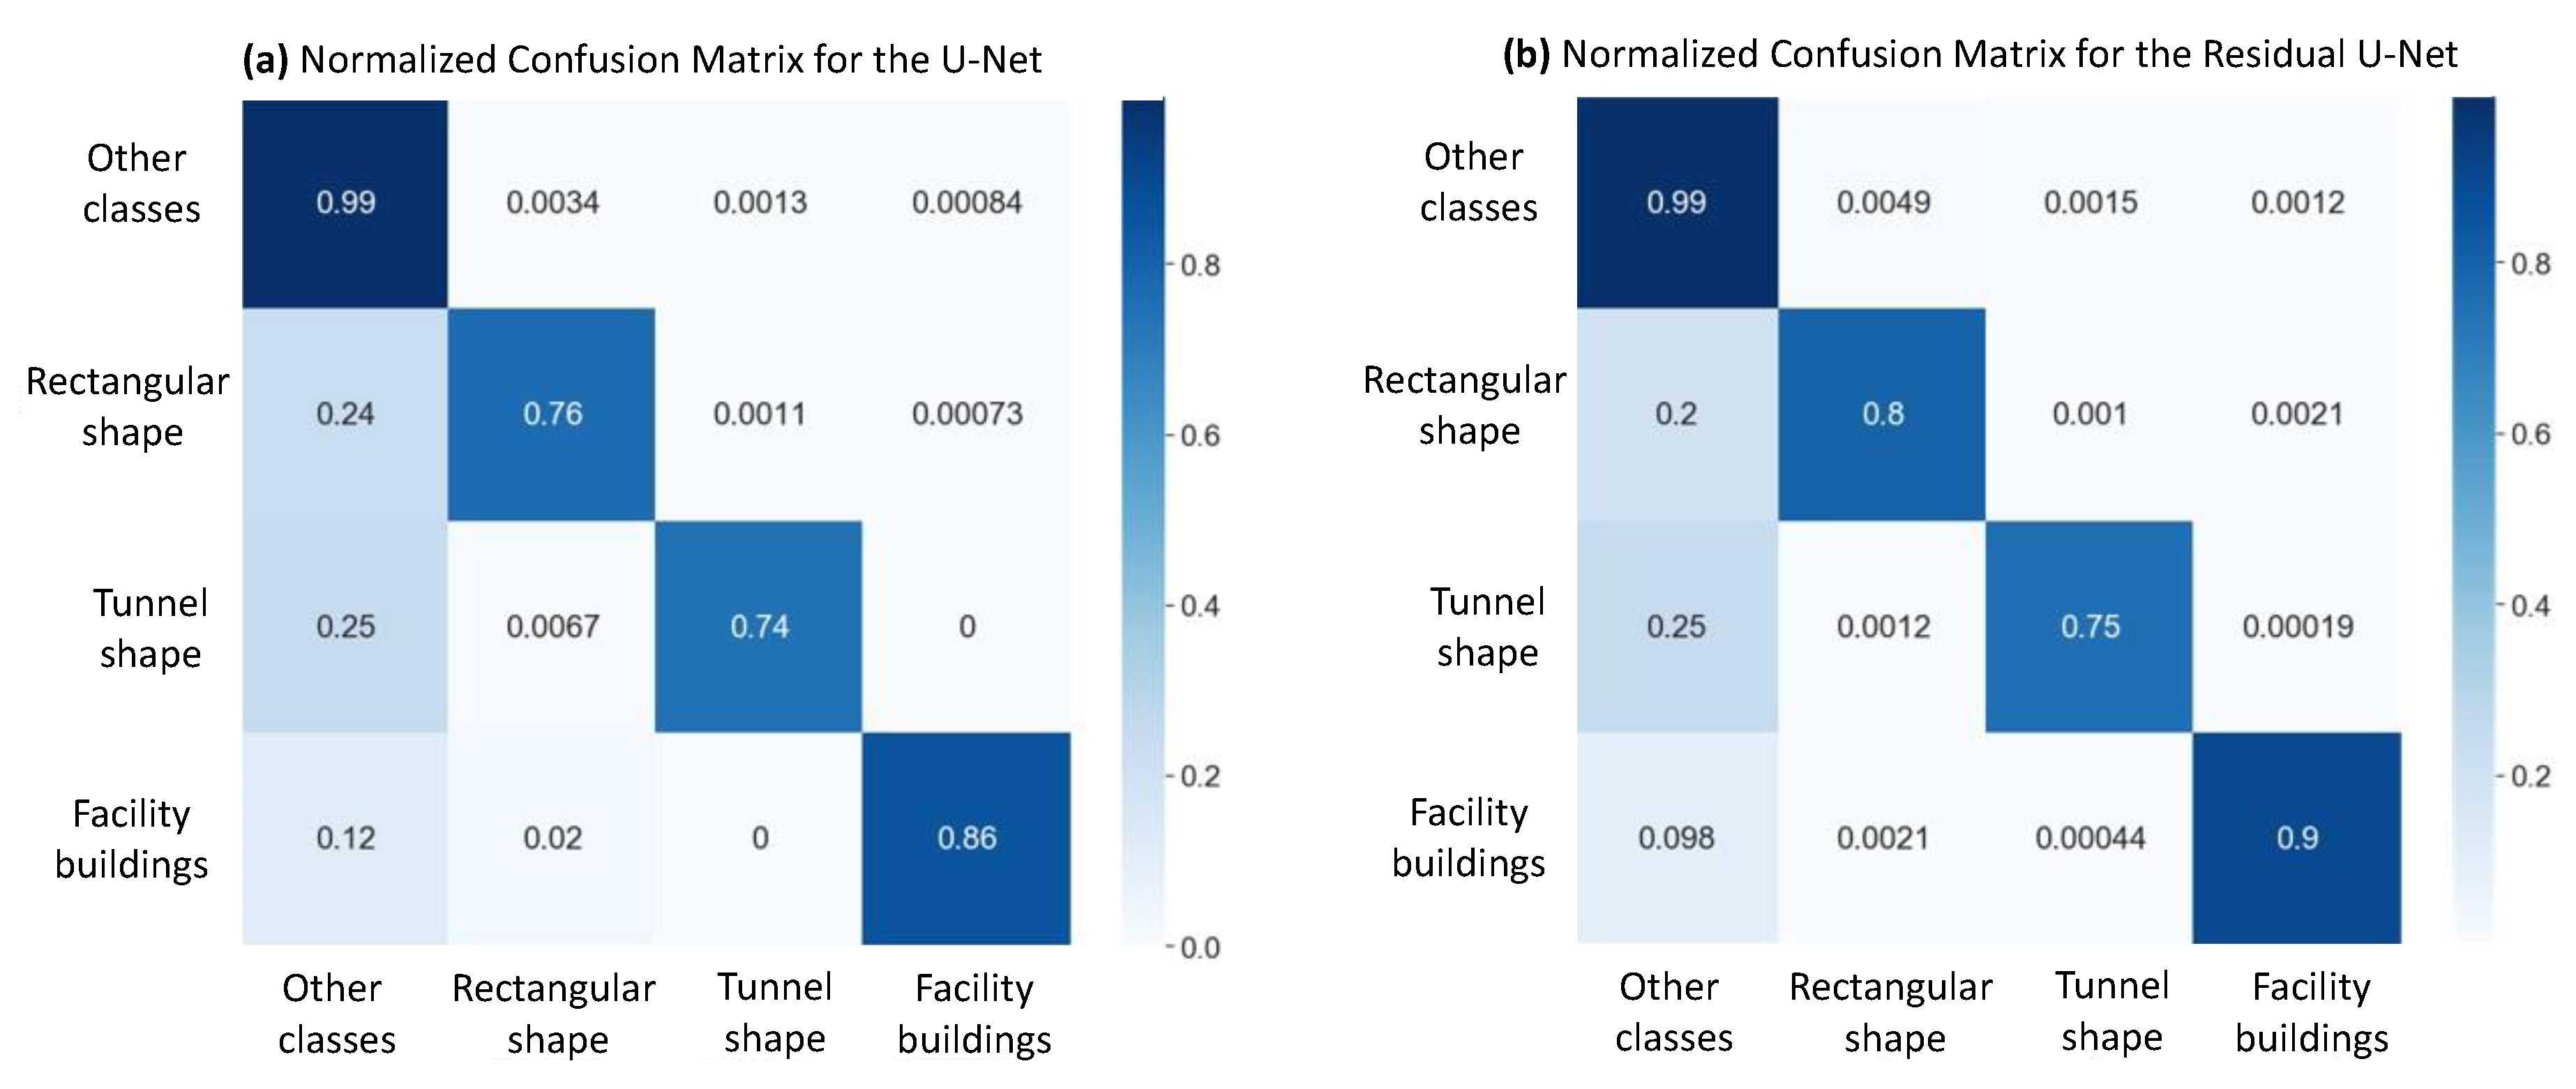
3.2. Quantitative Assessment
4. Discussion
5. Conclusions
Author Contributions
Funding
Data Availability Statement
Acknowledgments
Conflicts of Interest
References
- Gella, G.W.; Wendt, L.; Lang, S.; Tiede, D.; Hofer, B.; Gao, Y.; Braun, A. Mapping of Dwellings in IDP/Refugee Settlements from Very High-Resolution Satellite Imagery Using a Mask Region-Based Convolutional Neural Network. Remote Sens. 2022, 14, 689. [Google Scholar] [CrossRef]
- Lang, S.; Füreder, P.; Riedler, B.; Wendt, L.; Braun, A.; Tiede, D.; Schoepfer, E.; Zeil, P.; Spröhnle, K.; Kulessa, K.; et al. Earth observation tools and services to increase the effectiveness of humanitarian assistance. Eur. J. Remote Sens. 2020, 53, 67–85. [Google Scholar] [CrossRef] [Green Version]
- Van Den Hoek, J.; Friedrich, H.K. Satellite-Based Human Settlement Datasets Inadequately Detect Refugee Settlements: A Critical Assessment at Thirty Refugee Settlements in Uganda. Remote Sens. 2021, 13, 3574. [Google Scholar] [CrossRef]
- Xu, Y.; Ghamisi, P. Universal Adversarial Examples in Remote Sensing: Methodology and Benchmark. IEEE Trans. Geosci. Remote Sens. 2022, 60, 1–15. [Google Scholar] [CrossRef]
- Wang, W.; Chen, Y.; Ghamisi, P. Transferring CNN With Adaptive Learning for Remote Sensing Scene Classification. IEEE Trans. Geosci. Remote Sens. 2022, 60, 1–18. [Google Scholar] [CrossRef]
- Schmitt, M.; Hughes, L.H.; Qiu, C.; Zhu, X.X. SEN12MS–A Curated Dataset of Georeferenced Multi-Spectral Sentinel-1/2 Imagery for Deep Learning and Data Fusion. arXiv 2019, arXiv:1906.07789. [Google Scholar] [CrossRef] [Green Version]
- Sumbul, G.; Charfuelan, M.; Demir, B.; Markl, V. Bigearthnet: A large-scale benchmark archive for remote sensing image understanding. In Proceedings of the IGARSS 2019–2019 IEEE International Geoscience and Remote Sensing Symposium, Yokohama, Japan, 28 July–2 August 2019; pp. 5901–5904. [Google Scholar]
- Ghorbanzadeh, O.; Xu, Y.; Ghamisi, P.; Kopp, M.; Kreil, D. Landslide4Sense: Reference Benchmark Data and Deep Learning Models for Landslide Detection. IEEE Trans. Geosci. Remote Sens. 2022, 60, 1–17. [Google Scholar] [CrossRef]
- Zhu, X.X.; Hu, J.; Qiu, C.; Shi, Y.; Kang, J.; Mou, L.; Bagheri, H.; Häberle, M.; Hua, Y.; Huang, R.; et al. So2Sat LCZ42: A benchmark dataset for global local climate zones classification. arXiv 2019, arXiv:1912.12171. [Google Scholar]
- Center for International Earth Science Information Network (CIESIN); Flowminder Foundation; United Nations Population Fund (UNFPA); WorldPop, University of Southampton. Mapping and Classifying Settlement Locations 2020. Available online: https://eprints.soton.ac.uk/469540/ (accessed on 10 November 2022).
- Marconcini, M.; Metz-Marconcini, A.; Üreyen, S.; Palacios-Lopez, D.; Hanke, W.; Bachofer, F.; Zeidler, J.; Esch, T.; Gorelick, N.; Kakarla, A.; et al. Outlining where humans live, the World Settlement Footprint 2015. Sci. Data 2020, 7, 1–14. [Google Scholar] [CrossRef]
- Pesaresi, M.; Huadong, G.; Blaes, X.; Ehrlich, D.; Ferri, S.; Gueguen, L.; Halkia, M.; Kauffmann, M.; Kemper, T.; Lu, L.; et al. A global human settlement layer from optical HR/VHR RS data: Concept and first results. IEEE J. Sel. Top. Appl. Earth Obs. Remote Sens. 2013, 6, 2102–2131. [Google Scholar] [CrossRef]
- Nations, U. World Urbanization Prospects: The 2005 Revision; United Nations Publications: New York, NY, USA, 2011. [Google Scholar]
- Pesaresi, M.; Ehrlich, D.; Ferri, S.; Florczyk, A.; Freire, S.; Haag, F.; Halkia, M.; Julea, A.; Kemper, T.; Soille, P. Global human settlement analysis for disaster risk reduction. In Proceedings of the International Archives of the Photogrammetry, Remote Sensing & Spatial Information Sciences, Berlin/Heidelberg, Germany, 11–15 May 2015. [Google Scholar]
- Aguilar, R.; Kuffer, M. Cloud computation using high-resolution images for improving the SDG indicator on open spaces. Remote Sens. 2020, 12, 1144. [Google Scholar] [CrossRef]
- Ghaffarian, S.; Roy, D.; Filatova, T.; Kerle, N. Agent-based modelling of post-disaster recovery with remote sensing data. Int. J. Disaster Risk Reduct. 2021, 60, 102285. [Google Scholar] [CrossRef]
- Ghaffarian, S.; Kerle, N.; Pasolli, E.; Jokar Arsanjani, J. Post-disaster building database updating using automated deep learning: An integration of pre-disaster OpenStreetMap and multi-temporal satellite data. Remote Sens. 2019, 11, 2427. [Google Scholar] [CrossRef] [Green Version]
- Witmer, F.D. Remote sensing of violent conflict: Eyes from above. Int. J. Remote Sens. 2015, 36, 2326–2352. [Google Scholar] [CrossRef]
- Gruca, A.; Herruzo, P.; Rípodas, P.; Kucik, A.; Briese, C.; Kopp, M.K.; Hochreiter, S.; Ghamisi, P.; Kreil, D.P. CDCEO’21-First Workshop on Complex Data Challenges in Earth Observation. In Proceedings of the the 30th ACM International Conference on Information & Knowledge Management, Virtual, 1–5 November 2021; pp. 4878–4879. [Google Scholar]
- Rizeei, H.M.; Pradhan, B. Urban mapping accuracy enhancement in high-rise built-up areas deployed by 3D-orthorectification correction from WorldView-3 and LiDAR imageries. Remote Sens. 2019, 11, 692. [Google Scholar] [CrossRef] [Green Version]
- Ghorbanzadeh, O.; Tiede, D.; Wendt, L.; Sudmanns, M.; Lang, S. Transferable instance segmentation of dwellings in a refugee camp-integrating CNN and OBIA. Eur. J. Remote Sens. 2021, 54, 127–140. [Google Scholar] [CrossRef]
- Gao, Y.; Lang, S.; Tiede, D.; Gella, G.W.; Wendt, L. Comparing OBIA-Generated Labels and Manually Annotated Labels for Semantic Segmentation in Extracting Refugee-Dwelling Footprints. Appl. Sci. 2022, 12, 11226. [Google Scholar] [CrossRef]
- Tiede, D.; Füreder, P.; Lang, S.; Hölbling, D.; Zeil, P. Automated analysis of satellite imagery to provide information products for humanitarian relief operations in refugee camps–from scientific development towards operational services. PFG Photogramm. 2013, 3, 185–195. [Google Scholar] [CrossRef] [PubMed]
- Gao, Y.; Gella, G.W.; Liu, N. Assessing the Influences of Band Selection and Pretrained Weights on Semantic-Segmentation-Based Refugee Dwelling Extraction from Satellite Imagery. AGILE GISci. Ser. 2022, 3, 1–6. [Google Scholar] [CrossRef]
- Gella, G.W.; Wendt, L.; Lang, S.; Braun, A.; Tiede, D.; Hofer, B.; Gao, Y.; Riedler, B.; Alobaidi, A.; Schwendemann, G.M. Testing transferability of deep-learning-based dwelling extraction in refugee camps. GI_Forum 2021, 9, 220–227. [Google Scholar] [CrossRef]
- Lang, S.; Tiede, D.; Hölbling, D.; Füreder, P.; Zeil, P. Earth observation (EO)-based ex post assessment of internally displaced person (IDP) camp evolution and population dynamics in Zam Zam, Darfur. Int. J. Remote Sens. 2010, 31, 5709–5731. [Google Scholar] [CrossRef]
- Lüthje, F.; Tiede, D.; Füreder, P. Don’t see the dwellings for the trees: Quantifying the effect of tree growth on multi-temporal dwelling extraction in a refugee camp. In Proceedings of the GI_Forum, Salzburg, Austria, 7–10 July 2015. [Google Scholar]
- Tiede, D.; Lang, S.; Hölbling, D.; Füreder, P. Transferability of OBIA rulesets for IDP camp analysis in Darfur. In Proceedings of the GEOBIA, Ghent, Belgium, 29 June–2 July 2010. [Google Scholar]
- Ghorbanzadeh, O.; Shahabi, H.; Crivellari, A.; Homayouni, S.; Blaschke, T.; Ghamisi, P. Landslide detection using deep learning and object-based image analysis. Landslides 2022, 19, 929–939. [Google Scholar] [CrossRef]
- Tiede, D.; Krafft, P.; Füreder, P.; Lang, S. Stratified template matching to support refugee camp analysis in OBIA workflows. Remote Sens. 2017, 9, 326. [Google Scholar] [CrossRef] [Green Version]
- Kemper, T.; Jenerowicz, M.; Pesaresi, M.; Soille, P. Enumeration of dwellings in Darfur Camps from GeoEye-1 satellite images using mathematical morphology. IEEE J. Sel. Top. Appl. Earth Obs. Remote Sens. 2010, 4, 8–15. [Google Scholar] [CrossRef]
- Laneve, G.; Santilli, G.; Lingenfelder, I. Development of automatic techniques for refugee camps monitoring using very high spatial resolution (VHSR) satellite imagery. In Proceedings of the 2006 IEEE International Symposium on Geoscience and Remote Sensing, Denver, CO, USA, 31 July–4 August 2006; pp. 841–845. [Google Scholar]
- Quinn, J.A.; Nyhan, M.M.; Navarro, C.; Coluccia, D.; Bromley, L.; Luengo-Oroz, M. Humanitarian applications of machine learning with remote-sensing data: Review and case study in refugee settlement mapping. Philos. Trans. R. Soc. A Math. Phys. Eng. Sci. 2018, 376, 20170363. [Google Scholar] [CrossRef] [PubMed] [Green Version]
- Tiede, D.; Schwendemann, G.; Alobaidi, A.; Wendt, L.; Lang, S. Mask R-CNN-based building extraction from VHR satellite data in operational humanitarian action: An example related to Covid-19 response in Khartoum, Sudan. Trans. GIS 2021, 25, 1213–1227. [Google Scholar] [CrossRef] [PubMed]
- Duan, Y.; Zhang, W.; Huang, P.; He, G.; Guo, H. A New Lightweight Convolutional Neural Network for Multi-Scale Land Surface Water Extraction from GaoFen-1D Satellite Images. Remote Sens. 2021, 13, 4576. [Google Scholar] [CrossRef]
- Zheng, J.; Fu, H.; Li, W.; Wu, W.; Yu, L.; Yuan, S.; Tao, W.Y.W.; Pang, T.K.; Kanniah, K.D. Growing status observation for oil palm trees using Unmanned Aerial Vehicle (UAV) images. ISPRS J. Photogramm. Remote Sens. 2021, 173, 95–121. [Google Scholar] [CrossRef]
- Haq, M.A.; Ahmed, A.; Khan, I.; Gyani, J.; Mohamed, A.; Attia, E.A.; Mangan, P.; Pandi, D. Analysis of environmental factors using AI and ML methods. Sci. Rep. 2022, 12, 1–16. [Google Scholar] [CrossRef]
- Shahabi, H.; Rahimzad, M.; Tavakkoli Piralilou, S.; Ghorbanzadeh, O.; Homayouni, S.; Blaschke, T.; Lim, S.; Ghamisi, P. Unsupervised deep learning for landslide detection from multispectral sentinel-2 imagery. Remote Sens. 2021, 13, 4698. [Google Scholar] [CrossRef]
- Srivastava, A.; Yetemen, O.; Saco, P.M.; Rodriguez, J.F.; Kumari, N.; Chun, K.P. Influence of Orographic Precipitation on Coevolving Landforms and Vegetation in Semi-arid Ecosystems. Earth Surf. Process. Landforms 2022, 47, 2846–2862. [Google Scholar] [CrossRef]
- Long, J.; Shelhamer, E.; Darrell, T. Fully convolutional networks for semantic segmentation. In Proceedings of the Proceedings of the IEEE Conference on Computer Vision and Pattern Recognition, Boston, MA, USA, 7–12 June 2015; pp. 3431–3440. [Google Scholar]
- Jozdani, S.E.; Johnson, B.A.; Chen, D. Comparing deep neural networks, ensemble classifiers, and support vector machine algorithms for object-based urban land use/land cover classification. Remote Sens. 2019, 11, 1713. [Google Scholar] [CrossRef] [Green Version]
- Mahdianpari, M.; Salehi, B.; Rezaee, M.; Mohammadimanesh, F.; Zhang, Y. Very deep convolutional neural networks for complex land cover mapping using multispectral remote sensing imagery. Remote Sens. 2018, 10, 1119. [Google Scholar] [CrossRef] [Green Version]
- Cui, B.; Fei, D.; Shao, G.; Lu, Y.; Chu, J. Extracting raft aquaculture areas from remote sensing images via an improved U-net with a PSE structure. Remote Sens. 2019, 11, 2053. [Google Scholar] [CrossRef] [Green Version]
- Sherrah, J. Fully convolutional networks for dense semantic labelling of high-resolution aerial imagery. arXiv 2016, arXiv:1606.02585. [Google Scholar]
- DeLancey, E.R.; Simms, J.F.; Mahdianpari, M.; Brisco, B.; Mahoney, C.; Kariyeva, J. Comparing deep learning and shallow learning for large-scale wetland classification in Alberta, Canada. Remote Sens. 2019, 12, 2. [Google Scholar] [CrossRef] [Green Version]
- Ronneberger, O.; Fischer, P.; Brox, T. U-net: Convolutional networks for biomedical image segmentation. In Proceedings of the International Conference on Medical Image Computing and cOmputer-Assisted Intervention, Munich, Germany, 5–9 October 2015; pp. 234–241. [Google Scholar]
- Zhang, Z.; Liu, Q.; Wang, Y. Road extraction by deep residual u-net. IEEE Geosci. Remote Sens. Lett. 2018, 15, 749–753. [Google Scholar] [CrossRef] [Green Version]
- Jiang, X.; Wang, Y.; Liu, W.; Li, S.; Liu, J. Capsnet, cnn, fcn: Comparative performance evaluation for image classification. Int. J. Mach. Learn. Comput. 2019, 9, 840–848. [Google Scholar] [CrossRef]
- Lu, Y.; Koperski, K.; Kwan, C.; Li, J. Deep Learning for Effective Refugee Tent Extraction Near Syria–Jordan Border. IEEE Geosci. Remote Sens. Lett. 2020, 18, 1342–1346. [Google Scholar] [CrossRef]
- Tang, X.; Tu, Z.; Wang, Y.; Liu, M.; Li, D.; Fan, X. Automatic Detection of Coseismic Landslides Using a New Transformer Method. Remote Sens. 2022, 14, 2884. [Google Scholar] [CrossRef]
- Liu, P.; Wei, Y.; Wang, Q.; Chen, Y.; Xie, J. Research on post-earthquake landslide extraction algorithm based on improved U-Net model. Remote Sens. 2020, 12, 894. [Google Scholar] [CrossRef] [Green Version]
- Kalantar, B.; Ueda, N.; Saeidi, V.; Janizadeh, S.; Shabani, F.; Ahmadi, K.; Shabani, F. Deep neural network utilizing remote sensing datasets for flood hazard susceptibility mapping in Brisbane, Australia. Remote Sens. 2021, 13, 2638. [Google Scholar] [CrossRef]
- Naderpour, M.; Rizeei, H.M.; Ramezani, F. Forest fire risk prediction: A spatial deep neural network-based framework. Remote Sens. 2021, 13, 2513. [Google Scholar] [CrossRef]
- Meng, Z.; Li, L.; Tang, X.; Feng, Z.; Jiao, L.; Liang, M. Multipath residual network for spectral-spatial hyperspectral image classification. Remote Sens. 2019, 11, 1896. [Google Scholar] [CrossRef] [Green Version]
- He, K.; Zhang, X.; Ren, S.; Sun, J. Deep residual learning for image recognition. In Proceedings of the IEEE Conference on Computer Vision and Pattern Recognition, Las Vegas, NV, USA, 27–30 June 2016; pp. 770–778. [Google Scholar]
- Zelikowsky, M.; Bissiere, S.; Hast, T.A.; Bennett, R.Z.; Abdipranoto, A.; Vissel, B.; Fanselow, M.S. Prefrontal microcircuit underlies contextual learning after hippocampal loss. Proc. Natl. Acad. Sci. USA 2013, 110, 9938–9943. [Google Scholar] [CrossRef] [Green Version]
- Li, L. Deep residual autoencoder with multiscaling for semantic segmentation of land-use images. Remote Sens. 2019, 11, 2142. [Google Scholar] [CrossRef] [Green Version]
- Seydi, S.T.; Rastiveis, H.; Kalantar, B.; Halin, A.A.; Ueda, N. BDD-Net: An End-to-End Multiscale Residual CNN for Earthquake-Induced Building Damage Detection. Remote Sens. 2022, 14, 2214. [Google Scholar] [CrossRef]
- Wang, L.; Zhang, J.; Liu, P.; Choo, K.K.R.; Huang, F. Spectral–spatial multi-feature-based deep learning for hyperspectral remote sensing image classification. Soft Comput. 2017, 21, 213–221. [Google Scholar] [CrossRef]
- Khryashchev, V.; Larionov, R. Wildfire segmentation on satellite images using deep learning. In Proceedings of the 2020 Moscow Workshop on Electronic and Networking Technologies (MWENT), Moscow, Russia, 11–13 March 2020; pp. 1–5. [Google Scholar]
- Abderrahim, N.Y.Q.; Abderrahim, S.; Rida, A. Road segmentation using u-net architecture. In Proceedings of the 2020 IEEE International conference of Moroccan Geomatics (Morgeo), Moscow, Russia, 11–13 March 2020; pp. 1–4. [Google Scholar]
- Yang, Z.; Xu, C.; Li, L. Landslide Detection Based on ResU-Net with Transformer and CBAM Embedded: Two Examples with Geologically Different Environments. Remote Sens. 2022, 14, 2885. [Google Scholar] [CrossRef]
- Kingma, D.P.; Ba, J. Adam: A method for stochastic optimization. arXiv 2014, arXiv:1412.6980. [Google Scholar]
- Kalantar, B.; Ueda, N.; Saeidi, V.; Ahmadi, K.; Halin, A.A.; Shabani, F. Landslide susceptibility mapping: Machine and ensemble learning based on remote sensing big data. Remote Sens. 2020, 12, 1737. [Google Scholar] [CrossRef]
- Rahmati, O.; Panahi, M.; Ghiasi, S.S.; Deo, R.C.; Tiefenbacher, J.P.; Pradhan, B.; Jahani, A.; Goshtasb, H.; Kornejady, A.; Shahabi, H.; et al. Hybridized neural fuzzy ensembles for dust source modeling and prediction. Atmos. Environ. 2020, 224, 117320. [Google Scholar] [CrossRef]
- Yi, Y.; Zhang, W. A new deep-learning-based approach for earthquake-triggered landslide detection from single-temporal RapidEye satellite imagery. IEEE J. Sel. Top. Appl. Earth Obs. Remote Sens. 2020, 13, 6166–6176. [Google Scholar] [CrossRef]
- Kochupillai, M.; Kahl, M.; Schmitt, M.; Taubenböck, H.; Zhu, X.X. Earth Observation and Artificial Intelligence: Understanding emerging ethical issues and opportunities. IEEE Geosci. Remote Sens. Mag. 2022, 2–36. [Google Scholar] [CrossRef]


| Model | U-Net | Residual U-Net | ||||
|---|---|---|---|---|---|---|
| Evaluation metrics | Precision | Recall | F1 | Precision | Recall | F1 |
| Other classes | 98.8 | 99.45 | 99.12 | 99.31 | 99.61 | 99.46 |
| Rectangular shape | 87.24 | 99.45 | 81.01 | 92.03 | 87.93 | 89.93 |
| Tunnel shape | 89.19 | 76.18 | 82.17 | 95.66 | 81.6 | 88.07 |
| Facility buildings | 90.85 | 87.54 | 89.17 | 90.06 | 93.67 | 91.83 |
| Kappa coefficient | 82.26 | 82.37 |
Publisher’s Note: MDPI stays neutral with regard to jurisdictional claims in published maps and institutional affiliations. |
© 2022 by the authors. Licensee MDPI, Basel, Switzerland. This article is an open access article distributed under the terms and conditions of the Creative Commons Attribution (CC BY) license (https://creativecommons.org/licenses/by/4.0/).
Share and Cite
Ghorbanzadeh, O.; Crivellari, A.; Tiede, D.; Ghamisi, P.; Lang, S. Mapping Dwellings in IDP/Refugee Settlements Using Deep Learning. Remote Sens. 2022, 14, 6382. https://doi.org/10.3390/rs14246382
Ghorbanzadeh O, Crivellari A, Tiede D, Ghamisi P, Lang S. Mapping Dwellings in IDP/Refugee Settlements Using Deep Learning. Remote Sensing. 2022; 14(24):6382. https://doi.org/10.3390/rs14246382
Chicago/Turabian StyleGhorbanzadeh, Omid, Alessandro Crivellari, Dirk Tiede, Pedram Ghamisi, and Stefan Lang. 2022. "Mapping Dwellings in IDP/Refugee Settlements Using Deep Learning" Remote Sensing 14, no. 24: 6382. https://doi.org/10.3390/rs14246382