Article

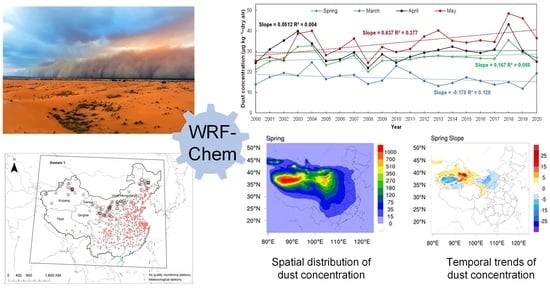
Spatial and Temporal Variations in Spring Dust Concentrations from 2000 to 2020 in China: Simulations with WRF-Chem

1
Laboratory of Geospatial Technology for the Middle and Lower Yellow River Regions, Ministry of Education (Henan University), Kaifeng 475004, China
2
Henan Key Laboratory of Integrated Air Pollution Control and Ecological Security, Henan University, Kaifeng 475004, China
3
Institute of Urban Big Data, College of Geography and Environmental Science, Kaifeng 475004, China
*
Author to whom correspondence should be addressed.
These authors contributed equally to this work.
Remote Sens. 2022, 14(23), 6090; https://doi.org/10.3390/rs14236090
Submission received: 16 October 2022 / Revised: 16 November 2022 / Accepted: 28 November 2022 / Published: 1 December 2022

Abstract

:
Dust emitted from arid and semi-arid areas of China is a main contributor to the global atmospheric aerosols. However, the long-term spatial and temporal variations in dust concentrations in China is still unknown. Here, we simulated the spatial and temporal variations in spring dust concentrations in China from 2000 to 2020 using the Weather Research and Forecasting model coupled with Chemistry (WRF-Chem). The results showed that the configured WRF-Chem model in this study reproduced the spatial patterns and temporal variations of dust aerosols. The annual mean spring dust concentration at the country level was 26.95 g kg−1-dry air and showed a slightly increasing trend in China during 2000–2020. There were clear spatial differences and inter-annual variations in dust concentrations. The dust concentration generally decreased from the dust source regions of the northwest to the southeast regions of China. Obvious increasing and decreasing trends in spring dust concentrations were identified in the regions of northern Xinjiang and Gansu and in the regions of southern Xinjiang and western Inner Mongolia, respectively. In May, the dust concentration showed an increasing trend in most regions of northwestern China. This provided the basic information for insight into the long-term spatial and temporal variations in spring dust concentrations in China.

Graphical Abstract

1. Introduction

Dust is one of the main constituents of atmospheric aerosols [1]. Many studies have shown that 1000 to 3000 million tons (Mt) of dust aerosols in the atmosphere each year come from dust emissions from arid and semi-arid regions [2,3,4]. This dust can be divided into natural dust and anthropogenic dust, according to the different types of dust sources [5,6,7,8,9,10,11]. Natural dust emissions are mainly generated from bare surfaces such as deserts, including the Gobi Desert [10]. Dust aerosols can impact the climate through their direct effects on radiative forcing and indirect effects on clouds and precipitation [1,12,13]. The deposition of dust aerosols onto the land and oceans plays an important role in biogeochemical cycles, both in continental and marine ecosystems [4,14,15,16]. In addition, dust aerosol is also a main contributor to air pollution [17,18] and poses a threat to human health [4,19].
To accurately assess the impact of dust aerosols on the climate and the ecological environment, it is essential to quantify the spatial and temporal distributions of dust aerosols [20]. Some studies have assessed the spatial and temporal variations of dust events by using meteorological observations [21,22,23,24,25]. To accurately quantify the distribution of dust sources, the spatial and temporal variations of aerosol optical depth (AOD), or dust emissions, were estimated based on remote sensing retrievals and dust emission modules coupled with earth system models [26,27,28,29].
The dust concentration in the atmosphere is one of the important indicators used to quantify health exposure and estimate dust transport and deposition [30,31,32]. Several studies have used the ambient PM10 (particulate matter in aerodynamic diameter ≤10 µm) concentration to represent the dust concentration, and investigated the spatial distribution and temporal variation of dust concentrations in dust source regions, such as Xinjiang Province and western Inner Mongolia, using environmental monitoring records [33,34,35]. Li and Zhang investigated seasonal variations from December 2010 to November 2011 using the observed hourly dust concentrations in the Horqin Sandy Land area of China [3]. Wang et al. estimated the dust concentration based on lidar remote sensing [36]. However, these methods are difficult to use for large areas due to the limited number of observation stations. Therefore, some studies estimated spatial distributions of dust concentrations over a large area by using air quality models, including the Weather Research and Forecasting model coupled with Chemistry (WRF-Chem) [37,38,39,40].
Although air quality models can reproduce the dust concentrations over a large region, most of these studies mainly concentrated on specific dust episodes (e.g., Rizza et al., 2017; Karagulian et al., 2019; Karegar et al., 2019) [41,42,43] or a short-term simulations (e.g., Shahid et al., 2021) [40]. China is one of the major contributors to global dust aerosols [27,44]. Around half of the world’s dust aerosols come from northwest China [45,46]. However, the quantification of spatial and temporal dynamics in dust concentrations, especially regarding long-term variations, were still limited in China.
Therefore, it is necessary to estimate the long-term variations of dust concentrations in China. To understand the long-term changes of dust concentrations in China, we first evaluated the performance of the WRF-Chem model in the simulation of dust aerosols by using meteorological data from the National Climatic Data Center (NCDC) of the National Oceanic and Atmospheric Administration (NOAA) and then simulated the long-term dust concentrations in China over the past 20 years.

2. Materials and Methods

2.1. Model Setup and Input Data

WRF-Chem is an online coupled atmospheric chemistry transport model that can simultaneously simulate meteorological and chemical processes in the atmosphere [44]. A single domain which covered nearly the entire East Asia region (Figure 1) was used to simulate hourly dust concentrations. Table 1 shows the domain configuration and the main parametrizations of physics and chemistry. The domain had 193 × 163 grid points, with a horizontal resolution of 27 km × 27 km. The central point of the simulation domain was 105.0°E, 37.5°N. All the points were projected onto a Lambert conformal grid. There were 28 layers from the surface to 100 hPa in the vertical dimension.
The parameterization scheme of the model has an important impact on the simulation of meteorological fields (e.g., temperature, wind speed and direction, radiation) as well as physicochemical reactions and aerosol formation. Therefore, we localized the parameters of the model before performing the simulation. The major physics parameterizations of the WRF-Chem model include the Lin (Purdue) method [47], the New Goddard longwave and shortwave radiation scheme [48], the Noah land surface model [49], the MYJ planetary boundary layer [50], and the Betts–Miller–Janjić (BMJ) cumulus scheme [50]. The Goddard Global Ozone Chemistry Aerosol Radiation and Transport (GOCART) model [51] was adopted to calculate the dust emission and concentrations in this study. Dust simulations were conducted from 18 February to 31 May, 2000–2020. The simulation of the first ten days for each year were discarded as spin-up (18–28 February). We initialized the meteorological conditions of WRF-Chem using the National Center for Environmental Prediction (NCEP) Final Analysis (FNL) data. The FNL meteorological inputs have a 1° × 1° horizontal resolution, 26 pressure levels from 1000 hPa to 10 hPa, and are available every six hours.

2.2. Observation Data and Model Evaluation

Meteorological conditions can directly affect the accuracy of dust process simulations. Here, we used hourly observed data of the 2 m air temperature (T2), the wind speed at a height of 10 m (WS), wind direction at a 10 m height (WD), and the precipitation (PCP) to verify the findings of the WRF-Chem model. The hourly meteorological data at 416 observational sites were obtained from the NCDC of NOAA.
Most of the PM10 was caused by windblown dust in the dust source areas [44,52]. We evaluated the simulated PM10 concentrations simulated by WRF-Chem that did not consider the anthropogenic emissions by using the hourly PM10 measurements at 205 national air quality monitoring stations in northwest China, obtained from the Ministry of Ecology and Environment of China (Figure 1). In addition, we also compared the aerosol optical depth (AOD) simulated by WRF-Chem with the AOD products of Moderate-Resolution Imaging Spectroradiometer (MODIS) and the earth system modeling and data assimilation of the Modern-Era Retrospective Analysis for Research and Applications (MERRA2) from the spring of 2015. The spatial resolution of the monthly AOD of MODIS and MERRA2 are 1° × 1° and 0.625° × 0.5°, respectively.
The statistical metrics of mean bias (MB), normalized mean error (NME), normalized mean bias (NMB), root mean square error (RMSE), and correlation coefficient (R) were selected to quantify the performance of the WRF-Chem model [44,53]. The detailed calculation method of these metrics can be referred to in the work of Zhang et al. (2006) [53]. These metrics have been widely used to evaluate the performance of the WRF-Chem model [44].

3. Results

3.1. Performance of the WRF-Chem Model

Table 2 shows the statistical summary of the WRF-Chem model performance regarding simulated spring meteorological variables and PM10 concentrations during 2000–2020. Although the WRF-Chem model underestimated the air temperature, wind speed, wind direction, and precipitation, to a certain extent, it was able to reproduce well the nature of temporal changes in the observed and simulated meteorological parameters (Table 2). The MB, NMB, and R of the air temperature were −0.76 °C, −6%, and 1.0, respectively, indicating that among several meteorological variables, the temperature simulations were the closest to those in the observations. For the PM10 concentrations, the MB, NMB, and R values were 5.68 μg m−3, 5%, and 0.4, respectively, which also indicated that the WRF-Chem model can simulate the dust aerosol concentrations well. Figure 2 shows the comparison of simulated and observed PM10 and PM2.5 concentrations in four cities selected in the dust source area of northwest China from 2015 to 2020. It can be seen that although the WRF-Chem model underestimated the PM10 and PM2.5 concentrations, to a certain extent, in Hohhot, it can generally well simulate the temporal variations in concentrations of PM10 and PM2.5. This is mainly due to the fact that we did not consider the anthropogenic emission in WRF-Chem model.
In order to evaluate the simulation performance of the WRF-Chem model for the size variations in the dust aerosols, we compared the remote sensing AOD with the model simulated AOD (Figure 3). Figure 3 shows an example of the spatial distributions of spring AOD generated from MODIS (Figure 3a,d), MERRA2 (Figure 3b,e), and the WRF-Chem model (Figure 3c,f) in 2015 and 2019. Overall, the AOD simulated by the WRF-Chem model had a similar spatial pattern to the AOD of MODIS and MERRA2 in the dust source region of northwest China. The AOD of MODIS was generally higher than that of the MERRA2 and the WRF-Chem model simulation, especially in eastern China. The main reason for the overestimation is that MODIS retrieved all types of aerosols, such as black carbon, sulfate, and anthropogenic organic carbon, which were not included in the current WRF-Chem model or MERRA2. The comparison of the simulation results with data from MERRA2 shows that the simulated AOD has a similar distribution pattern to that of MERRA2, indicating that the WRF-Chem model can capture the spatial variations of the dust AOD.

3.2. Inter-Annual Variations of Dust Concentrations

Figure 4 shows the inter-annual variations of dust concentrations in March, April, May, and the entire spring, during 2000−2020 within China, at the national scale. The annual mean dust concentrations at the national scale in China were 16.89 μg kg−1-dry air (μg kg−1), 29.90 μg kg−1, 34.13 μg kg−1, and 26.95 μg kg−1, respectively. Overall, the spring dust concentration showed a slight upward trend of 0.167 μg kg−1 yr−1 (R2 = 0.088, P = 0.19) over the past 20 years. The maximum and minimum spring concentrations of dust aerosol occurred in 2018 (35.42 μg kg−1) and 2008 (20.13 μg kg−1), respectively. The spring dust aerosol concentration increased continuously from 2000 to 2004, then the dust aerosol concentration showed a downward trend from 2005 to 2008, and then showed a slow growth trend until 2020.
The average dust concentration in May was higher than that in March and April during the analysis period. The dust concentration in May increased significantly at a rate of 0.637 μg kg−1 yr−1 (R2 = 0.377, P = 0.003) from 2000 to 2020. The minimum and maximum dust concentrations in May also appeared in 2008 and 2018, which were 35.42 μg kg−1 and 48.42 μg kg−1, respectively. In March, the dust concentration was significantly lower than that in April and May, showing a slightly decreasing trend of 0.178 μg kg−1 yr−1 (R2 = 0.120, P = 0.123). The maximum and minimum dust concentrations in March were 24.58 μg kg−1 and 11.80 μg kg−1 in 2004 and 2019, respectively. Except for during May of 2000–2003, the dust concentration in April was clearly higher than that in March and lower than that in May. Similar to May, the maximum and minimum dust concentrations in April also occurred in 2018 (43.09 μg kg−1) and 2008 (21.88 μg kg−1), respectively.

3.3. Spatial Variations of Dust Concentrations

Figure 5 shows the spatial variations of annual mean dust concentrations in March, April, May, and the entire spring during 2000–2020. We can see that the spatial distribution pattern of dust concentrations in spring was generally similar to that in March, April, and May. The high dust concentrations were mainly distributed in the dust source regions of northwest China, where dust events are prone to occur under strong wind conditions. In general, the spring dust concentration decreased gradually from the northwest to southeast, and the highest spring dust concentrations were mainly distributed in the Taklimakan Desert of southern Xinjiang and the deserts of Badain Jaran and Tengger in western Inner Mongolia (Figure 5d).
In March, the spatial pattern of high dust concentration (>500 μg kg−1) was similar to that in April and May, mainly concentrated in southern Xinjiang and western Inner Mongolia, and the maximum dust concentration reached 1270 μg kg−1. The coverage area of high dust concentration in April was larger than that in March, and the maximum dust concentration was 1625 μg kg−1. In addition, the coverage of the dust aerosol also expanded to the southeast and spread to the west of Zhejiang and the north of Guangxi. In May, the coverage of dust aerosol was larger than that in March and April, and its maximum concentration was1503 μg kg−1. The eastward transportation of dust aerosol can affect the Korean Peninsula.
Figure 6 shows the spatial distribution of the dust concentration linear trends during 2000−2020 in March, April, May, and spring. We can see that the linear trends for the monthly and spring dust concentrations clearly showed spatial and temporal variations. In spring, the dust concentration showed an obvious increasing trend in northern Xinjiang and Gansu, while the dust concentration showed a clearly decreasing trend southern Xinjiang and western Inner Mongolia (Figure 6d). However, there was no obvious change in other regions of China. The dust concentration in March showed an obvious increasing trend in the central and eastern regions of Xinjiang, but it showed a downward trend in regions of southern Xinjiang, western Qinghai, central and western Inner Mongolia, and central China (Figure 6a). The spatial variations in the linear trends of the dust concentrations in April were similar to those found in March. However, the dust concentration in April in most parts of northern Xinjiang showed an upward trend, while the decreasing trend in southern Xinjiang was clearly weaker than that found in March, and the decreasing trend in western Inner Mongolia was more obvious than that in March. Compared with March and April, the dust concentrations showed an upward trend in May over most regions of northwestern China, especially in eastern Xinjiang (>15 μg kg−1-dry air yr−1) (Figure 6c).

4. Discussion

In general, the simulation results indicated that the WRF-Chem model can well simulate the meteorological conditions and PM10 concentrations. Many previous studies have confirmed that the main source of PM10 is dust emissions [4,54,55,56,57]. In this study, we did not consider the anthropogenic emissions, but the simulated PM10 concentration over the dust source region was still close to those found in the observations. This also confirmed that the main source of PM10 is dust emission, especially in dust source areas. The spatial pattern of simulated AOD was similar to the remote sensing observations over arid source zones, but was significantly lower than that in southeastern China, especially in the central and eastern regions. This is mainly due to the fact that we did not considering the anthropogenic emissions of air pollutants, resulting in low AOD values in regions with large anthropogenic emissions.
The monthly dust concentrations simulated in this study for China in spring peaked at 34.13 μg kg−1 in May, which was consistent with the previous findings that the contribution of dust emission to PM10 over most regions of China is the largest in May [3,35,56,57]. The inter-annual variations in spring dust concentrations in this study were similar to the spring PM10 concentrations in Xinjiang during 2000–2013 and 84 Chinese cities during 2000–2006 [35,58]. The slightly increasing trend in dust concentrations simulated in this study was consistent with the upward trend in annual dust emissions in China [44]. The maximum dust concentration occurred in 2018, which was mainly due to the highest dust frequency in 2018 [56,59]. The major reason for the increase in sand and dust is that precipitation in central and eastern Inner Mongolia, as well as in eastern Mongolia, was scare in 2017, resulting in poor vegetation growth and weak dust suppression conditions compared with those of the previous years of 2000–2016 [60,61,62], which caused the dust frequency in northern China to be significantly higher in 2018 than that in the spring of other years from 2000–2020.
In 2008, the lowest spring dust concentration was mainly due to the fact that the dust frequency and intensity were lower than those in the same period during 2000–2020 [63,64]. The main reason for the significantly weak dusty weather in spring of 2008 was as follows. In the summer and autumn of 2007, the precipitation in the dust source regions of northwestern China and western Inner Mongolia was higher than the that for the same period during other years of the study period, which caused the vegetation to grow well in northwestern China [65,66]. In addition, East Asia received significant rain and snow, and the snow cover was large in the spring of 2008 [67]. Meanwhile, the zonal circulation was dominant in northern China in the spring of 2008 [68], which was not conductive to the activity of cold air in the spring, and provided a circulation background for the weak dust events. These land surface and weather conditions made the dust source regions unfavorable for the formation of dust events, resulting in the lower dust concentrations in the atmosphere.
The spatial distribution pattern of high dust concentrations identified in this study was consistent with that of the dust source regions in northwest China [27,44,69], which also indicated that the WRF-Chem model configured in this study can capture the spatial variations of dust concentrations well. Previous studies found that the dust aerosol decreased over the past 20 years in northwest China [7,70]; however, the spatial variations of trends regarding dust aerosols was still unclear. Here, we found increased spring dust concentrations in northern Xinjiang and western Gansu over the past 20 years. Dust emission can directly influence the dust aerosol concentration in the atmosphere [7,71,72], which is determined by the complex interactions among vegetation, climate, soil properties, and land use [13,44]. Previous studies have reported that the vegetation greenness increased in Xinjiang over the past 20 years [73,74,75,76,77], but some studies found that the vegetation degraded in northern Xinjiang, and the vegetation cover decreased in spring [75,78,79], which may be partly responsible for the increase in dust concentrations due to the increased spring dust emissions in this region [44].
The underlying surface wind speed and precipitation are two main impacting factors of the dust emission [13,27,44,55]. Precipitation has been recognized as the primary driving factor of vegetation dynamics and soil moisture in arid and semi-arid areas [25,80,81], which can inhibit dust emissions by promoting vegetation growth and increasing soil moisture. Many previous studies have found a clearly increasing trend in precipitation in northwest China over the past several decades [82,83]. Our results showed that the spring precipitation over the dust source regions of northwest China can obviously inhibit dust concentrations, but cannot decrease the dust concentrations in western Inner Mongolia (Figure 7a). This is due to the fact that the surface vegetation condition is the main limiting factor of dust emissions in eastern Inner Mongolia, and the spring precipitation cannot decisively impact the vegetation coverage in this region in spring. The increased precipitation did not reduce the spring mean dust concentration in northern Xinjiang, but rather increased the mean dust concentration in this region. The averaged wind speed in China showed a decreasing trend over the past 50 years, but it has begun to increase significantly since 2000 in northwest China [84,85]. We also found that there is a significant positive correlation between dust concentrations and wind speed in this region (Figure 7b), indicating that wind speed may be the primary driving factor for the increased dust concentration during this period.
The simulated spatial and temporal variations in natural dust aerosol concentrations in northern China over the past two decades can provided an important scientific basis for understanding the evolutionary characteristics of dust aerosol concentrations. Anthropogenic dust is the soil particles that are emitted by modifying or disturbing soil particles through direct (e.g., the construction and driving of vehicles) and indirect (e.g., the wind blowing over agricultural land) human activities [8,86]. It has been recognized that anthropogenic dust emission is a non-negligible contributor to dust concentrations (around 20% of the total dust aerosol) [10,11,87,88], especially in urban and rural areas where human activities are more intense. However, current dust emission mechanisms are mainly aimed at soil wind erosion sand dust particles under natural conditions, which is one of the main reasons for the underestimation of the dust concentrations found in this study. Therefore, it is urgent to consider anthropogenic dust sources when studying dust aerosol.

5. Conclusions

This WRF-Chem model simulated the spatial and temporal process of spring dust concentrations in China over the past two decades by using the WRF-Chem model. The configured WRF-Chem model can well capture the spatial and temporal variations in dust concentrations. The annual mean concentration was 26.95 μg kg−1 and showed a slight upward trend from 2000 to 2020. The highest and lowest concentrations of spring dust aerosols in China occurred in 2018 (35.42 μg kg−1) and 2008 (20.13 μg kg−1), respectively. The dust concentration gradually decreased from northwest to southeast, and the dust concentration was the highest in southern Xinjiang and northwestern Inner Mongolia. In northern Xinjiang and Gansu, the dust concentration showed a clear increasing trend, while it showed a clear decreasing trend in southern Xinjiang and western Inner Mongolia.

Author Contributions

Conceptualization, H.S.; methodology, H.S. and Y.K.; software, F.W. and M.W.; validation, H.Z. and X.R.; data curation, F.W. and M.W.; writing—original draft preparation, F.W.; writing—review and editing, H.S. and F.W.; visualization, F.W. and M.W.; supervision, H.S.; project administration, H.S.; funding acquisition, H.S. All authors have read and agreed to the published version of the manuscript.

Funding

This study was funded by the Training Plan for Young Backbone Teachers in Colleges and Universities in Henan Province, China (2021GGJS024), the National Natural Science Foundation of China (32130066), and the Youth Talent Program of Henan University, China.

Data Availability Statement

The datasets generated in current study are available from the corresponding author on reasonable request.

Acknowledgments

The authors thank the National Supercomputing Center in Zhengzhou for their data processing support.

Conflicts of Interest

The authors declare no conflict of interest.

References

  1. Cabello, M.; Orza, J.A.G.; Barrero, M.A.; Gordo, E.; Berasaluce, A.; Cantón, L.; Dueñas, C.; Fernández, M.C.; Pérez, M. Spatial and temporal variation of the impact of an extreme Saharan dust event. J. Geophys. Res. Atmos 2012, 117, D11204. [Google Scholar] [CrossRef]
  2. Shao, Y.; Wyrwoll, K.-H.; Chappell, A.; Huang, J.; Lin, Z.; McTainsh, G.H.; Mikami, M.; Tanaka, T.Y.; Wang, X.; Yoon, S. Dust cycle: An emerging core theme in Earth system science. Aeolian Res. 2011, 2, 181–204. [Google Scholar] [CrossRef]
  3. Li, X.; Zhang, H. Seasonal variations in dust concentration and dust emission observed over Horqin Sandy Land area in China from December 2010 to November 2011. Atmos. Environ. 2012, 61, 56–65. [Google Scholar] [CrossRef]
  4. Guan, Q.; Luo, H.; Pan, N.; Zhao, R.; Yang, L.; Yang, Y.; Tian, J. Contribution of dust in northern China to PM10 concentrations over the Hexi corridor. Sci. Total Environ. 2019, 660, 947–958. [Google Scholar] [CrossRef] [PubMed]
  5. Ginoux, P.; Prospero, J.M.; Gill, T.E.; Hsu, N.C.; Zhao, M. Global-scale attribution of anthropogenic and natural dust sources and their emission rates based on MODIS Deep Blue aerosol products. Rev. Geophys. 2012, 50, 3005. [Google Scholar] [CrossRef]
  6. Viana, M.; Pey, J.; Querol, X.; Alastuey, A.; de Leeuw, F.; Lukewille, A. Natural sources of atmospheric aerosols influencing air quality across Europe. Sci. Total Environ. 2014, 472, 825–833. [Google Scholar] [CrossRef]
  7. Liu, J.; Ding, J.; Rexiding, M.; Li, X.; Zhang, J.; Ran, S.; Bao, Q.; Ge, X. Characteristics of dust aerosols and identification of dust sources in Xinjiang, China. Atmos. Environ. 2021, 262, 118651. [Google Scholar] [CrossRef]
  8. Tegen, I.; Fung, I. Contribution to the atmospheric mineral aerosol load from land surface modification. J. Geophys. Res. 1995, 100, 18707–18726. [Google Scholar] [CrossRef]
  9. Tegen, I.; Werner, M.; Harrison, S.P.; Kohfeld, K.E. Relative importance of climate and land use in determining present and future global soil dust emission. Geophys. Res. Lett. 2004, 31, L05105. [Google Scholar] [CrossRef] [Green Version]
  10. Chen, S.; Jiang, N.; Huang, J.; Xu, X.; Zhang, H.; Zang, Z.; Huang, K.; Xu, X.; Wei, Y.; Guan, X.; et al. Quantifying contributions of natural and anthropogenic dust emission from different climatic regions. Atmos. Environ. 2018, 191, 94–104. [Google Scholar] [CrossRef]
  11. Webb, N.P.; Pierre, C. Quantifying Anthropogenic Dust Emissions. Earth’s Future 2018, 6, 286–295. [Google Scholar] [CrossRef] [Green Version]
  12. Huang, J.; Wang, T.; Wang, W.; Li, Z.; Yan, H. Climate effects of dust aerosols over East Asian arid and semiarid regions. J. Geophys. Res.-Atmos. 2014, 119, 11398–11416. [Google Scholar] [CrossRef]
  13. Chen, W.; Meng, H.; Song, H.; Zheng, H. Progress in dust modelling, Global dust budgets, and soil organic carbon dynamics. Land 2022, 11, 176. [Google Scholar] [CrossRef]
  14. Zheng, Y.; Zhao, T.; Che, H.; Liu, Y.; Han, Y.; Liu, C.; Xiong, J.; Liu, J.; Zhou, Y. A 20-year simulated climatology of global dust aerosol deposition. Sci. Total Environ. 2016, 557–558, 861–868. [Google Scholar] [CrossRef] [PubMed]
  15. Mahowald, N.M.; Scanza, R.; Brahney, J.; Goodale, C.L.; Hess, P.G.; Moore, J.K.; Neff, J. Aerosol deposition impacts on land and ocean carbon cycles. Curr. Clim. Chang. Rep. 2017, 3, 16–31. [Google Scholar] [CrossRef] [Green Version]
  16. Song, H.; Zhang, K.; Piao, S.; Liu, L.; Wang, Y.-P.; Chen, Y.; Yang, Z.; Zhu, L.; Wan, S. Soil organic carbon and nutrient losses resulted from spring dust emissions in Northern China. Atmos. Environ. 2019, 213, 585–596. [Google Scholar] [CrossRef]
  17. Tao, M.; Gui, L.; Li, R.; Wang, L.; Liang, S.; Li, Q.; Wang, L.; Yu, C.; Chen, L. Tracking prevailing dust aerosol over the air pollution in central China with integrated satellite and ground observations. Atmos. Environ. 2021, 253, 118369. [Google Scholar] [CrossRef]
  18. Filonchyk, M. Characteristics of the severe March 2021 Gobi Desert dust storm and its impact on air pollution in China. Chemosphere 2022, 287, 132219. [Google Scholar] [CrossRef]
  19. Singh, C.; Singh, S.K.; Chauhan, P.; Budakoti, S. Simulation of an extreme dust episode using WRF-CHEM based on optimal ensemble approach. Atmos. Res. 2021, 249, 105296. [Google Scholar] [CrossRef]
  20. Deepshikha, S.; Satheesh, S.; Srinivasan, J. Regional distribution of absorbing efficiency of dust aerosols over India and adjacent continents inferred using satellite remote sensing. Geophys. Res. Lett. 2005, 32, L03811. [Google Scholar] [CrossRef]
  21. Sun, J.; Zhang, M.; Liu, T. Spatial and temporal characteristics of dust storms in China and its surrounding regions, 1960-1999: Relations to source area and climate. J. Geophys. Res.-Atmos. 2001, 106, 10325–10333. [Google Scholar] [CrossRef]
  22. Yang, X.; Shen, S.; Yang, F.; He, Q.; Ali, M.; Huo, W.; Liu, X. Spatial and temporal variations of blowing dust events in the Taklimakan Desert. Theor. Appl. Climatol. 2016, 125, 669–677. [Google Scholar] [CrossRef]
  23. Wang, X.; Liu, J.; Che, H.; Ji, F.; Liu, J. Spatial and temporal evolution of natural and anthropogenic dust events over northern China. Sci. Rep. 2018, 8, 2141. [Google Scholar] [CrossRef] [PubMed] [Green Version]
  24. Liu, C.; Yan, X.; Jiang, F. Desert vegetation responses to the temporal distribution patterns of precipitation across the northern Xinjiang, China. Catena 2021, 206, 105544. [Google Scholar] [CrossRef]
  25. Liu, X.; Song, H.; Lei, T.; Liu, P.; Xu, C.; Wang, D.; Yang, Z.; Xia, H.; Wang, T.; Zhao, H. Effects of natural and anthropogenic factors and their interactions on dust events in Northern China. Catena 2021, 196, 104919. [Google Scholar] [CrossRef]
  26. Taramelli, A.; Pasqui, M.; Barbour, J.; Kirschbaum, D.; Bottai, L.; Busillo, C.; Calastrini, F.; Guarnieri, F.; Small, C. Spatial and temporal dust source variability in northern China identified using advanced remote sensing analysis. Earth Surf. Proc. Land 2013, 38, 793–809. [Google Scholar] [CrossRef]
  27. Song, H.; Zhang, K.; Piao, S.; Wan, S. Spatial and temporal variations of spring dust emissions in northern China over the last 30 years. Atmos. Environ. 2016, 126, 117–127. [Google Scholar] [CrossRef]
  28. Proestakis, E.; Amiridis, V.; Marinou, E.; Georgoulias, A.K.; Solomos, S.; Kazadzis, S.; Chimot, J.; Che, H.; Alexandri, G.; Binietoglou, I.; et al. Nine-year spatial and temporal evolution of desert dust aerosols over South and East Asia as revealed by CALIOP. Atmos. Chem. Phys. 2018, 18, 1337–1362. [Google Scholar] [CrossRef] [Green Version]
  29. Shao, S.; Han, Y.; Qin, F.; Xu, M.; Zhao, Y. Spatial and temporal properties of a winter dust event in North China. City Environ. Interact. 2019, 4, 100025. [Google Scholar] [CrossRef]
  30. Layton, D.W.; Beamer, P.I. Migration of contaminated soil and airborne particulates to indoor dust. Environ. Sci. Technol. 2009, 43, 8199–8205. [Google Scholar] [CrossRef]
  31. Giannadaki, D.; Pozzer, A.; Lelieveld, J. Modeled global effects of airborne desert dust on air quality and premature mortality. Atmos. Chem. Phys. 2014, 14, 957–968. [Google Scholar] [CrossRef] [Green Version]
  32. Prospero, J.M.; Collard, F.-X.; Molinié, J.; Jeannot, A. Characterizing the annual cycle of African dust transport to the Caribbean Basin and South America and its impact on the environment and air quality. Glob. Biogeochem. Cycles 2014, 28, 757–773. [Google Scholar] [CrossRef]
  33. Wang, Y.Q.; Zhang, X.Y.; Gong, S.L.; Zhou, C.H.; Hu, X.Q.; Liu, H.L.; Niu, T.; Yang, Y.Q. Surface observation of sand and dust storm in East Asia and its application in CUACE/Dust. Atmos. Chem. Phys. 2008, 8, 545–553. [Google Scholar] [CrossRef] [Green Version]
  34. Jugder, D.; Shinoda, M.; Sugimoto, N.; Matsui, I.; Nishikawa, M.; Park, S.-U.; Chun, Y.-S.; Park, M.-S. Spatial and temporal variations of dust concentrations in the Gobi Desert of Mongolia. Glob. Planet. Chang. 2011, 78, 14–22. [Google Scholar] [CrossRef]
  35. Zhang, X.-X.; Sharratt, B.; Chen, X.; Wang, Z.-F.; Liu, L.-Y.; Guo, Y.-H.; Li, J.; Chen, H.-S.; Yang, W.-Y. Dust deposition and ambient PM10 concentration in northwest China: Spatial and temporal variability. Atmos. Chem. Phys. 2017, 17, 1699–1711. [Google Scholar] [CrossRef] [Green Version]
  36. Wang, T.; Han, Y.; Hua, W.; Tang, J.; Huang, J.; Zhou, T.; Huang, Z.; Bi, J.; Xie, H. Profiling dust mass concentration in Northwest China using a Joint Lidar and Sun-Photometer Setting. Remote Sens. 2021, 13, 1099. [Google Scholar] [CrossRef]
  37. Chen, S.; Zhao, C.; Qian, Y.; Leung, L.R.; Huang, J.; Huang, Z.; Bi, J.; Zhang, W.; Shi, J.; Yang, L.; et al. Regional modeling of dust mass balance and radiative forcing over East Asia using WRF-Chem. Aeolian Res. 2014, 15, 15–30. [Google Scholar] [CrossRef]
  38. Ma, S.; Zhang, X.; Gao, C.; Tong, D.Q.; Xiu, A.; Wu, G.; Cao, X.; Huang, L.; Zhao, H.; Zhang, S.; et al. Multimodel simulations of a springtime dust storm over northeastern China: Implications of an evaluation of four commonly used air quality models (CMAQ v5.2.1, CAMx v6.50, CHIMERE v2017r4, and WRF-Chem v3.9.1). Geosci. Model Dev. 2019, 12, 4603–4625. [Google Scholar] [CrossRef] [Green Version]
  39. Zhao, J.; Ma, X.; Wu, S.; Sha, T. Dust emission and transport in Northwest China: WRF-Chem simulation and comparisons with multi-sensor observations. Atmos. Res. 2020, 241, 104978. [Google Scholar] [CrossRef]
  40. Shahid, M.Z.; Chishtie, F.; Bilal, M.; Shahid, I. WRF-Chem Simulation for Modeling Seasonal Variations and Distributions of Aerosol Pollutants over the Middle East. Remote Sens. 2021, 13, 2112. [Google Scholar] [CrossRef]
  41. Rizza, U.; Barnaba, F.; Miglietta, M.M.; Mangia, C.; Di Liberto, L.; Dionisi, D.; Costabile, F.; Grasso, F.; Gobbi, G.P. WRF-Chem model simulations of a dust outbreak over the central Mediterranean and comparison with multi-sensor desert dust observations. Atmos. Chem. Phys. 2017, 17, 93–115. [Google Scholar] [CrossRef] [Green Version]
  42. Karagulian, F.; Temimi, M.; Ghebreyesus, D.; Weston, M.; Kondapalli, N.K.; Valappil, V.K.; Aldababesh, A.; Lyapustin, A.; Chaouch, N.; Al Hammadi, F.; et al. Analysis of a severe dust storm and its impact on air quality conditions using WRF-Chem modeling, satellite imagery, and ground observations. Air Qual. Atmos. Health 2019, 12, 453–470. [Google Scholar] [CrossRef] [Green Version]
  43. Karegar, E.; Hossein Hamzeh, N.; Bodagh Jamali, J.; Ranjbar Saadat Abadi, A.; Moeinaddini, M.; Goshtasb, H. Numerical simulation of extreme dust storms in east of Iran by the WRF-Chem model. Nat. Hazards 2019, 99, 769–796. [Google Scholar] [CrossRef]
  44. Song, H.; Wang, K.; Zhang, Y.; Hong, C.; Zhou, S. Simulation and evaluation of dust emissions with WRF-Chem (v3.7.1) and its relationship to the changing climate over East Asia from 1980 to 2015. Atmos. Environ. 2017, 167, 511–522. [Google Scholar] [CrossRef]
  45. Zhang, X.Y.; Gong, S.L.; Zhao, T.L.; Arimoto, R.; Wang, Y.Q.; Zhou, Z.J. Sources of Asian dust and role of climate change versus desertification in Asian dust emission. Geophys. Res. Lett. 2003, 30, 2272. [Google Scholar] [CrossRef] [Green Version]
  46. Wang, X.; Cheng, H.; Che, H.; Sun, J.; Lu, H.; Qiang, M.; Hua, T.; Zhu, B.; Li, H.; Ma, W.; et al. Modern dust aerosol availability in northwestern China. Sci. Rep. 2017, 7, 8741. [Google Scholar] [CrossRef] [PubMed] [Green Version]
  47. Lin, Y.-L.; Farley, R.D.; Orville, H.D. Bulk parameterization of the snow field in a cloud model. J. Appl Meteorol. Clim. 1983, 22, 1065–1092. [Google Scholar] [CrossRef]
  48. Chou, M.D.; Suarez, M.J. A shortwave radiation parameterization for atmospheric studies. NASA Tech. Memo 1999, 15, 40. [Google Scholar]
  49. Chen, F.; Dudhia, J. Coupling an advanced land surface–hydrology model with the Penn State–NCAR MM5 Modeling System. Part I: Model implementation and sensitivity. Mon. Weather. Rev. 2001, 129, 569–585. [Google Scholar] [CrossRef]
  50. Janjić, Z.I. The step-mountain eta coordinate model: Further developments of the convection, viscous sublayer, and turbulence closure schemes. Mon. Weather Rev. 1994, 122, 927–945. [Google Scholar] [CrossRef]
  51. Ginoux, P.; Chin, M.; Tegen, I.; Prospero, J.M.; Holben, B.; Dubovik, O.; Lin, S.-J. Sources and distributions of dust aerosols simulated with the GOCART model. J. Geophys. Res. Atmos. 2001, 106, 20255–20273. [Google Scholar] [CrossRef]
  52. Jugder, D.; Shinoda, M.; Kimura, R.; Batbold, A.; Amarjargal, D. Quantitative analysis on windblown dust concentrations of PM10 (PM2.5) during dust events in Mongolia. Aeolian Res. 2014, 14, 3–13. [Google Scholar] [CrossRef]
  53. Zhang, Y.; Liu, P.; Pun, B.; Seigneur, C. A comprehensive performance evaluation of MM5-CMAQ for the Summer 1999 Southern Oxidants Study episode—Part I: Evaluation protocols, databases, and meteorological predictions. Atmos. Environ. 2006, 40, 4825–4838. [Google Scholar] [CrossRef]
  54. Du, H.; Wang, T.; Xue, X.; Li, S. Modelling of sand/dust emission in Northern China from 2001 to 2014. Geoderma 2018, 330, 162–176. [Google Scholar] [CrossRef]
  55. Pederzoli, A.; Mircea, M.; Finardi, S.; di Sarra, A.; Zanini, G. Quantification of Saharan dust contribution to PM10 concentrations over Italy during 2003–2005. Atmos. Environ. 2010, 44, 4181–4190. [Google Scholar] [CrossRef]
  56. Yang, L.; Zhang, S.; Huang, Z.; Yang, Y.; Wang, L.; Han, W.; Li, X. Characteristics of dust events in China from 2015 to 2020. Atmosphere 2021, 12, 952. [Google Scholar] [CrossRef]
  57. Li, X.; Song, H.; Zhai, S.; Lu, S.; Kong, Y.; Xia, H.; Zhao, H. Particulate matter pollution in Chinese cities: Areal-temporal variations and their relationships with meteorological conditions (2015–2017). Environ. Pollut. 2019, 246, 11–18. [Google Scholar] [CrossRef]
  58. Qu, W.J.; Arimoto, R.; Zhang, X.Y.; Zhao, C.H.; Wang, Y.Q.; Sheng, L.F.; Fu, G. Spatial distribution and interannual variation of surface PM10 concentrations over eighty-six Chinese cities. Atmos. Chem. Phys. 2010, 10, 5641–5662. [Google Scholar] [CrossRef] [Green Version]
  59. Zhang, X.; Zhou, B.; Li, Z.; Lin, Y.; Li, L.; Han, Y. Seasonal distribution of atmospheric coarse and fine particulate matter in a Medium-Sized City of Northern China. Toxics 2022, 10, 216. [Google Scholar] [CrossRef]
  60. Tong, S.; Li, X.; Zhang, J.; Bao, Y.; Bao, Y.; Na, L.; Si, A. Spatial and temporal variability in extreme temperature and precipitation events in Inner Mongolia (China) during 1960–2017. Sci. Total Environ. 2019, 649, 75–89. [Google Scholar] [CrossRef]
  61. Yu, W.; Li, Y.; Cao, S. Drought assessment using GRACE terrestrial water storage deficit in Mongolia from 2002 to 2017. Water 2019, 11, 1301. [Google Scholar] [CrossRef]
  62. Cai, S.; Song, X.; Hu, R.; Leng, P.; Li, X.; Guo, D.; Zhang, Y.n.; Hao, Y.; Wang, Y. Spatiotemporal characteristics of agricultural droughts based on soil moisture data in Inner Mongolia from 1981 to 2019. J. Hydrol. 2021, 603, 127104. [Google Scholar] [CrossRef]
  63. Gao, T.; Han, J.; Wang, Y.; Pei, H.; Lu, S. Impacts of climate abnormality on remarkable dust storm increase of the Hunshdak Sandy Lands in northern China during 2001–2008. Meteorol. Appl. 2012, 19, 265–278. [Google Scholar] [CrossRef]
  64. An, L.; Che, H.; Xue, M.; Zhang, T.; Wang, H.; Wang, Y.; Zhou, C.; Zhao, H.; Gui, K.; Zheng, Y.; et al. Temporal and spatial variations in sand and dust storm events in East Asia from 2007 to 2016: Relationships with surface conditions and climate change. Sci. Total Environ. 2018, 633, 452–462. [Google Scholar] [CrossRef] [PubMed]
  65. Zhao, Y.; Feng, Q.; Lu, A. Spatiotemporal variation in vegetation coverage and its driving factors in the Guanzhong Basin, NW China. Ecol. Inform. 2021, 64, 101371. [Google Scholar] [CrossRef]
  66. Yang, P.; Xia, J.; Zhang, Y.; Hong, S. Temporal and spatial variations of precipitation in Northwest China during 1960–2013. Atmos. Res. 2017, 183, 283–295. [Google Scholar] [CrossRef]
  67. Zhu, L.L.; Ma, G.Y.; Zhang, Y.Y.; Wang, J.G.; Tian, W.; Kan, X. Accelerated decline of snow cover in China from 1979 to 2018 observed from space. Sci. Total Environ. 2022, 814, 152491. [Google Scholar] [CrossRef]
  68. Zhu, C.; Wang, B.; Qian, W. Why do dust storms decrease in northern China concurrently with the recent global warming? Geophys. Res. Lett. 2008, 35, L18702. [Google Scholar] [CrossRef] [Green Version]
  69. Wang, X.; Wen, H.; Shi, J.; Bi, J.; Huang, Z.; Zhang, B.; Zhou, T.; Fu, K.; Chen, Q.; Xin, J. Optical and microphysical properties of natural mineral dust and anthropogenic soil dust near dust source regions over northwestern China. Atmos. Chem. Phys. 2018, 18, 2119–2138. [Google Scholar] [CrossRef] [Green Version]
  70. Fu, P.; Huang, J.; Li, C.; Zhong, S. The properties of dust aerosol and reducing tendency of the dust storms in northwest China. Atmos. Environ. 2008, 42, 5896–5904. [Google Scholar] [CrossRef]
  71. Tegen, I. Modeling the mineral dust aerosol cycle in the climate system. Quat. Sci. Rev. 2003, 22, 1821–1834. [Google Scholar] [CrossRef]
  72. Fountoukis, C.; Ackermann, L.; Ayoub, M.A.; Gladich, I.; Hoehn, R.D.; Skillern, A. Impact of atmospheric dust emission schemes on dust production and concentration over the Arabian Peninsula. Model. Earth Syst. Environ. 2016, 2, 115. [Google Scholar] [CrossRef] [Green Version]
  73. He, P.; Sun, Z.; Han, Z.; Dong, Y.; Liu, H.; Meng, X.; Ma, J. Dynamic characteristics and driving factors of vegetation greenness under changing environments in Xinjiang, China. Environ. Sci. Pollut. Res. Int. 2021, 28, 42516–42532. [Google Scholar] [CrossRef] [PubMed]
  74. Li, J.; Li, Z.; Dong, S.; Wei, M.; Zhou, J. Spatial and temporal changes in vegetation and desertification (1982–2018) and their responses to climate change in the Ulan Buh Desert, Northwest China. Theor. Appl. Climatol. 2021, 143, 1643–1654. [Google Scholar] [CrossRef]
  75. Wang, S.; Liu, Q.; Huang, C. Vegetation change and its response to climate extremes in the arid region of Northwest China. Remote Sens. 2021, 13, 1230. [Google Scholar] [CrossRef]
  76. Xue, J.; Wang, Y.; Teng, H.; Wang, N.; Li, D.; Peng, J.; Biswas, A.; Shi, Z. Dynamics of vegetation greenness and its response to climate change in Xinjiang over the past two decades. Remote Sens. 2021, 13, 4063. [Google Scholar] [CrossRef]
  77. Qin, D.; Chen, L.; Ma, Y.; Yang, L.; Zhou, Z.; Jia, H.; Li, Z.; Liu, F. Analysis on spatio-temporal variation characteristics of vegetation coverage in Xinjiang in recent 20 years. Arab. J. Geosci. 2022, 15, 1179. [Google Scholar] [CrossRef]
  78. Liu, Y.; Li, L.; Chen, X.; Zhang, R.; Yang, J. Temporal-spatial variations and influencing factors of vegetation cover in Xinjiang from 1982 to 2013 based on GIMMS-NDVI3g. Glob. Planet Chang. 2018, 169, 145–155. [Google Scholar] [CrossRef]
  79. Wang, X.; Li, Y.; Wang, X.; Li, Y.; Lian, J.; Gong, X. Temporal and spatial variations in NDVI and analysis of the driving factors in the desertified areas of Northern China from 1998 to 2015. Front. Environ. Sci. 2021, 9, 633020. [Google Scholar] [CrossRef]
  80. Miao, L.; Jiang, C.; Xue, B.; Liu, Q.; He, B.; Nath, R.; Cui, X. Vegetation dynamics and factor analysis in arid and semi-arid Inner Mongolia. Environ. Earth Sci. 2014, 73, 2343–2352. [Google Scholar] [CrossRef]
  81. Xie, B.; Jia, X.; Qin, Z.; Shen, J.; Chang, Q. Vegetation dynamics and climate change on the Loess Plateau, China: 1982–2011. Reg. Environ. Chang. 2016, 16, 1583–1594. [Google Scholar] [CrossRef]
  82. Li, B.; Chen, Y.; Chen, Z.; Xiong, H.; Lian, L. Why does precipitation in northwest China show a significant increasing trend from 1960 to 2010? Atmos. Res. 2016, 167, 275–284. [Google Scholar] [CrossRef]
  83. Peng, D.; Zhou, T. Why was the arid and semiarid northwest China getting wetter in the recent decades? J. Geophys. Res. Atmos. 2017, 122, 9060–9075. [Google Scholar] [CrossRef]
  84. Li, Z.; Xiao, Z.; Zheng, C. Observation analysis of wind climate in China for 1971–2017 under the demand of wind energy evaluation and utilization. Energy Rep. 2021, 7, 3535–3546. [Google Scholar] [CrossRef]
  85. Yang, Q.; Li, M.; Zu, Z.; Ma, Z. Has the stilling of the surface wind speed ended in China? Sci. China Earth Sci. 2021, 64, 1036–1049. [Google Scholar] [CrossRef]
  86. Chen, S.; Huang, J.; Qian, Y.; Zhao, C.; Kang, L.; Yang, B.; Wang, Y.; Liu, Y.; Yuan, T.; Wang, T.; et al. An overview of mineral dust modeling over East Asia. J. Meteorol. Res. 2017, 31, 633–653. [Google Scholar] [CrossRef]
  87. Huang, J.P.; Liu, J.J.; Chen, B.; Nasiri, S.L. Detection of anthropogenic dust using CALIPSO lidar measurements. Atmos. Chem. Phys. 2015, 15, 11653–11665. [Google Scholar] [CrossRef] [Green Version]
  88. Guan, X.; Huang, J.; Zhang, Y.; Xie, Y.; Liu, J. The relationship between anthropogenic dust and population over global semi-arid regions. Atmos. Chem. Phys. 2016, 16, 5159–5169. [Google Scholar] [CrossRef]
Figure 1. The simulation domain of the WRF-Chem model and the meteorological (red triangles) and air quality (black circles) observation sites.
Remotesensing 14 06090 g001
Figure 2. Comparison of monthly PM10 and PM2.5 concentrations between the spring simulations (SIM) and observations (OBS) from 2015 to 2020 in selected cities of Hohhot (a), Baotou (b), Erdos (c), and Yulin (d).
Remotesensing 14 06090 g002
Figure 3. AOD maps of MODIS (a) 2015, MERRA2 (b), and WRF-Chem simulation (c) in 2015, and of MODIS (d), MERRA2 (e), and WRF-Chem (f) simulation in 2019.
Remotesensing 14 06090 g003
Figure 4. Interannual variations in dust concentrations in March (blue line), April (black line), May (red line), and spring (green line) during 2000−2020 in China.
Remotesensing 14 06090 g004
Figure 5. Spatial distributions of annual mean dust concentrations (μg kg−1-dry air) of China in March (a), April (b), May (c), and spring (d) during 2000−2020.
Remotesensing 14 06090 g005
Figure 6. Spatial distributions of linear trends regarding dust concentrations (μg kg−1-dry air yr−1) in March (a), April (b), May (c), and spring (d) during 2000–2020.
Remotesensing 14 06090 g006
Figure 7. Maps of correlations between dust concentrations and precipitation (a), and between dust concentrations and wind speeds (b) during the springs of 2000–2020.
Remotesensing 14 06090 g007
Table 1. The WRF-Chem model configurations.
Domain ConfigurationPhysics and Dust Parameterizations
Number of grids in east-north193MicrophysicsLin (Purdue)
Number of grids in north-south163Longwave radiationNew Goddard
Vertical layers28Shortwave radiationNew Goddard
Horizontal resolution27 kmLand surfaceNoah
Map projectionLambertPlanetary boundary layerMYJ
Central latitude37.5°NCumulus cloudBMJ
Central longitude105.0°EDust emission and aerosol schemeGOCART
Table 2. Performance of the WRF-Chem model in simulations for meteorological variables and PM10 concentrations.
VariablesOBSSIMMBNMB (%)NME (%)RMSER
TEM (℃)13.5312.78−0.76−6122.671.0
WD (°)204.07180.62−23.45−111977.170.3
WS (m s−1)4.043.83−0.21−5221.110.4
PRE (mm)1.310.19−1.12−86955.380.3
PM2.5 (μg m−3)38.6625.39−13.28−346536.420.3
PM10 (μg m−3)109.69115.375.68576121.070.4
Publisher’s Note: MDPI stays neutral with regard to jurisdictional claims in published maps and institutional affiliations.

