Article

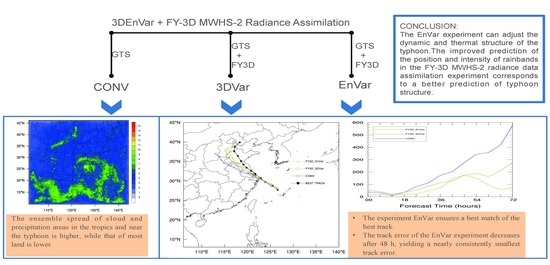
Impacts of 3DEnVar-Based FY-3D MWHS-2 Radiance Assimilation on Numerical Simulations of Landfalling Typhoon Ampil (2018)

1
Key Laboratory of Meteorological Disaster, Ministry of Education (KLME)/Joint International Research Laboratory of Climate and Environment Change (ILCEC)/Collaborative Innovation Center on Forecast and Evaluation of Meteorological Disasters (CIC-FEMD), Nanjing University of Information Science & Technology, Nanjing 210044, China
2
Shanghai Typhoon Institute, China Meteorological Administration, Shanghai 200030, China
3
China Meteorological Administration Meteorological Observation Center, Beijing 100086, China
*
Author to whom correspondence should be addressed.
Remote Sens. 2022, 14(23), 6037; https://doi.org/10.3390/rs14236037
Submission received: 21 October 2022 / Revised: 17 November 2022 / Accepted: 18 November 2022 / Published: 29 November 2022

Abstract

:
The module for assimilating radiance data of the Microwave Humidity Sounder-2 (MWHS-2) onboard the Feng Yun 3D (FY-3D) satellite is built in the Weather Research and Forecasting (WRF) model data assimilation (WRFDA) system. The CONV, 3DVar, and EnVar experiments are conducted to investigate the impact of assimilating the new humidity sounder based on Typhoon Ampil (2018). Both the 3DVar and EnVar experiments assimilate FY-3D MWHS-2 radiance data on top of the conventional data, while the CONV experiment only applies conventional data. In the EnVar experiment, notable geopotential height increment is observed around the typhoon, leading the typhoon to move northeast. In addition, the moisture field is improved to some extent. Finally, from the analysis of the dynamic field of the typhoon, it can be found that the EnVar experiment can adjust the dynamic structure of the typhoon. Furthermore, the assimilation of FY-3D MWHS-2 radiance data reduces the forecast error of the typhoon track and intensity. Additionally, the precipitation skill is improved in terms of rainfall pattern and the verification score. This improvement in the precipitation may be closely related to the features of the circulation structure concerning the evolution of the typhoon. The improved prediction of the position and intensity of rainbands in the FY-3D MWHS-2 radiance data assimilation experiment corresponds to a better prediction of typhoon structure.

Graphical Abstract

1. Introduction

Over the last couple of decades, numerical weather prediction (NWP) has played an important role in short and medium-range weather forecasts with the rapid progress made in computing power, atmospheric remote sensing technology, and NWP theory [1]. As the dynamic framework and the microphysics schemes of the numerical models become more and more accurate, the accuracy of NWP relies heavily on the quality of initial conditions [2]. Therefore, data assimilation (DA) is essential for providing high-quality initial conditions to reduce forecast errors. By assimilating remote sensing products with a high spatial and temporal resolution, remarkable improvements in NWP have been witnessed [3,4,5,6,7,8,9,10,11]. In terms of satellites, there are mainly two kinds of devices; one is an infrared radiometer, and the other is a microwave instrument. Compared with infrared radiometers, an advantage of microwave instruments is the capability to have better detection of regions covered by upper tropospheric cloud shields [12]. Therefore, microwave data are widely used to adjust initial moisture conditions for improved forecasts [13].
Since the late 1980s, satellite radiance data have been used in numerical models directly or indirectly to improve the accuracy of weather forecasts [14,15]. The use of satellite data has greatly improved the effectiveness of NWP. According to the research by the European Centre for Medium-Range Weather Forecasts (ECMWF), satellite observations account for more than 90% of all data used for assimilation [16]. Among them, microwave data can describe the structure and process of water vapor and detect information about the vertical atmosphere, which contributes greatly to the improvement of prediction [10,17]. Since China launched its first second-generation meteorological satellite FY-3A from Taiyuan Satellite Launch Base in May 2008, the application of Fengyun 3 series satellites in NWP is in large demand [18]. Lu et al. [19] (2011) made a preliminary evaluation of the MicroWave Temperature Sounder (MWTS) on the FY-3A satellite by using ECMWF’s numerical model and radiation transfer model. They found that the bias of the MWTS was related to the frequency drift of the channels and the nonlinear errors were caused by the instrumental materials. After bias correction, its quality was comparable to the data of Advanced Microwave Sounding Unit-A (AMSU-A) loaded on the Meteorological Operational (MetOp) satellite. Chen et al. [20] (2015) studied the analysis and forecast effects of MicroWave Humidity Sounders (MWHS) data from FY-3A and FY-3B satellites with ECMWF’s operational data assimilation and forecast Integrated Forecast System (IFS). The results showed that the data quality of the two satellites was reliable, and the analysis field of the ECMWF operational forecast model was improved after data assimilation. Additionally, the forecast skill with assimilating FY-3 and FY-3B MWHS radiance data was also comparable to that using similar instruments in Europe or the United States that had been in operation for a long time. Lawrence et al. [21] (2017) evaluated the long-term performance of the MicroWave Humidity Sounder-2 (MWHS-2) instrument on the FY-3C satellite based on the ECMWF’s NWP system and found that the quality of its data was good for most channels. According to their previous study [22], the swath width of MWHS-2 channels is 2260 km, which is wider than ATMS (2580 km) and MHS (2310 km), meaning more fields of view can be acquired by MWHS-2. In addition, the resolutions of all channels of MWHS-2 are higher than those of ATMS and MHS with similar frequency bands. Jiang et al. [23] (2020) used the GSI (Gridpoint Statistical Interpolation) global analysis system to make assessments on some commonly used radiance data, including MWHS-2, Microwave Humidity Sounder (MHS), and Advanced Technology Microwave Sounder (ATMS) by a more than one-year cycling assimilation experiment and results showed that the qualities of MWHS-2 and ATMS data were comparable. Based on the reliability of the microwave data quality of Fengyun 3 series satellites, many researchers have performed plenty of experiments to analyze the influence of assimilating their microwave data on numerical weather prediction. Xu et al. [24] (2016) studied the effects of the FY-3B MWHS radiance data assimilation method on the analysis and forecast of binary typhoons Chan-hom and Linfa in 2015. Results showed that the analysis of wind, temperature, and humidity was improved. Moreover, a good performance of track, intensity, and precipitation forecast was found. Similarly, selecting a binary typhoon case Haitang and Nesat in 2017, Xian et al. [25] (2019) conducted all-sky assimilation of the MWHS-2 radiance observations from the FY-3C satellite to examine the impact of all-sky assimilation on the forecast of the binary typhoons with inspiring results. Niu et al. [26] (2021) found that assimilating MWTS-2 radiance data can improve the track forecast of Typhoon Lekima with a GSI (grid point statistical interpolation) data assimilation system compared with AMSU-A radiance assimilation.
Launched from Taiyuan Satellite Launch Base on 15 November 2017, FY-3D is the fourth polar-orbit satellite operated by the China Meteorological Administration (CMA) [18]. Among the ten advanced remote sensing instruments, MWHS-2 is the second-generation microwave humidity sounder. Currently, the impact of assimilating MWHS-2 radiance data from the FY-3D satellite to improve NWP with different data assimilation methods for typhoon forecast has not been fully studied, especially in the hybrid 3DEnVar framework. As a destructive natural hazard, typhoons can cause huge casualties and property losses [27]. In accounting for most of their life span on the open ocean with sparse conventional observations, the effects of assimilating MWHS-2 radiance data from FY-3D satellite on NWP deserve to be further studied.
In the rest of the study, an introduction to the 3DEnVar method and the FY-3D MWHS-2 radiance observations are presented in Section 2, followed by an overview of the Typhoon Ampil and experimental design in Section 3. Section 4 provides the results after the assimilation of FY-3D MWHS-2 radiance data, while Section 5 summarizes and makes some conclusions.

2. 3DEnVar Method for Radiance Data Assimilation

2.1. 3DEnVar Method

The cost function for 3D-Var is as follows
J ( x ) = 1 2 ( x x b ) T B 1 ( x x b ) + 1 2 [ y o H ( x ) ] T R 1 [ y o H ( x ) ] ,
where x denotes the atmospheric state variable, x b denotes the background of the atmospheric state. The difference between the analysis and the background in the model space is constrained by the background error covariance matrix B . The cost function is also defined with the difference between the observation y o and the analysis in the observation space normalized by the observation error covariance R . Here H ( x ) denotes the observation operator, which transforms model variables to equivalent satellite radiance and projects variables from model space to radiance observation space. The standard deviation of the difference between the observation and the simulated brightness temperature based on the model is served as the observation error covariance R for the radiance data assimilation. Further, the hybrid 3DEnVar data assimilation method further applies the ensemble to provide flow-dependent background error covariance by adding extra terms as,
J ( x ) = 1 2 β 1 ( x x b ) T B 1 ( x x b ) + 1 2   β 2   α T A 1 α + 1 2 [ y o H ( x ) ] T R 1 [ y o H ( x ) ]
where α denotes the introduced ensemble control variable [28], A is the space covariance of ensembles. β 1 and β 2 are defined as the weight on the static background error covariance [29,30] and the ensemble covariance respectively, which are constrained by
1 β 1 + 1 β 2 = 1
The final form of the analytical increments of the hybrid assimilation is as follows,
δ x = δ x 1 + n = 1 N ( a n x n , b e )
where n stands for the ensemble size. The total increment is the sum of δ x 1 associated with the static background error and the flow dependent increment related to the ensemble perturbation.
Before the assimilation, quality control of radiance data is vital. Referring to the previous studies of Fengyun polar-orbit satellites and some common satellite quality control methods [25], the final used quality control schemes are as follows: (1) Eliminate the observations with brightness temperature less than 50 K or greater than 550 K; (2) reject observations with residual (difference between observation and simulated background brightness temperature) exceeding 15 K; (3) for the observation whose residual error is greater than 3σ0 after bias correction. σ0 is the standard deviation of the observation; (4) discard those complex observations over land and ocean, which are marked by the WRF model topographic files. In the practice of assimilation, due to the complexity of cloud and precipitation, only regions not contaminated by clouds in satellite fields of view are used, which is called the clear-sky strategy. The systematic bias of radiance is estimated by combining several predictors with their coefficients, including the constant 1000–300 hPa, and 200–50 hPa layer thicknesses, surface skin temperature, total column precipitable vapor, and the satellite zenith angle as the predictors. The variational bias correction scheme (VarBC) [31] is applied by adding the predictor coefficients in the control variables.

2.2. FY-3D MWHS-2 Radiance Data

The FY-3D satellite is the fourth of China’s Fengyun 3 series polar-orbit meteorological satellites [18] that was launched successfully on 15 November 2017. Its operational orbit is 830.5 km above the earth’s surface, and its local equatorial crossing time is 1345 UTC (ascending). The FY-3D satellite is equipped with 10 state-of-the-art remote sensing instruments, which the MWHS-2 inherits from its last generation FY-3C satellite [32]. The features of all channels for FY-3D MWHS-2 are presented in Table 1. There are 15 channels from the FY-3D MWHS-2 sounder. Two detection channels in the atmospheric window of 89 GHz (Channel 1 with nadir resolution of 25 km) and 150 GHz (Channel 10 with nadir resolution of 15 km) can be used for precipitation identification. Channels 2~9 (located near the oxygen absorption line 118.75 GHz with nadir resolution of 25 km) are used to detect the vertical structure of atmospheric temperature and precipitation parameters. Furthermore, channels 11~15 (located near the water vapor absorption line of 183.31 GHz with nadir resolution of 15 km) are used to obtain finer vertical distribution information of atmospheric water vapor.

3. Typhoon Ampil and Experimental Design

3.1. Typhoon Ampil (2018)

Typhoon Ampil was the tenth named storm in the 2018 Pacific typhoon season. It formed over the northwest Pacific Ocean at 1200 UTC on 18 July 2018 and moved northwest after its formation. At about 0500 UTC on 22 July, Ampil made its landfall in Shanghai, China, located at (30°N, 120°E), which had been the third typhoon to hit Shanghai directly since 1949. For most typhoons, the most destructive period is during their landfall, and the damage is usually caused by typhoons with strong intensity and a long lifespan [33]. Ampil lasted for more than 60 h after its landfall, and it brought heavy and persistent precipitation. Therefore, it is necessary to study the rainstorm process related to Ampil and to find potential ways to improve forecast skills.
Figure 1 shows the typhoon circulation by National Centers for Environmental Prediction (NCEP) Final (FNL) Operational Global Analysis data [34]. The generation and development of many destructive tropical cyclones are closely related to the large-scale environment of subtropical anticyclones [35,36,37]. Sufficient moisture flux was observed in the east of Taiwan to Ampil’s inner core area, and the subtropical anticyclone was largely affected when the intensity of Ampil increased. With the increasing typhoon, the subtropical high extended westward and moved southward. Forced by the subtropical anticyclone, Ampil tended to move along the periphery of it. Satellite radiance data information can provide monitoring of a large area of the Earth. Compared to conventional observations, the high temporal and spatial resolution of the radiance data facilitates more precise initial conditions for the numeric weather forecast model [38,39]. Thus, an accurate initial condition of the circulation is essential to improve the forecast of Ampil by assimilating FY-3D MWHS-2 radiance data.

3.2. Experimental Design

The Advanced Research WRF (ARW) [40,41] Version 4.2 is employed in our current study. Figure 2 shows the simulation domain with the center located at (31°N, 123°E) and the best track of Typhoon Ampil. The horizontal grid size is 559 × 469, and the grid resolution is 9 km. Vertically, there are 57 layers with the model top at 10 hPa. The 0.25° × 0.25° Global Forecast System (GFS) reanalysis data are used to provide the initial and boundary conditions. Some parameterizations used in this study include the Thompson microphysics scheme [42], the Yonsei University (YSU) boundary layer scheme [43], the Goddard short wave radiation scheme [44], the Rapid Radiative Transfer Model (RRTM) longwave radiation scheme [45], the Noah Land surface model, and the Grell–Freitas cumulus parameterization scheme [46].
As the flow chart shows in Figure 3, at the very beginning, a 6-h spin-up forecast was initiated at 0000 UTC on 21 July. The 6-h forecast valid at 0600 UTC on 21 July is provided as the background of the first analysis. Cycling data assimilation is conducted from 0600 UTC on 21 July to 0600 UTC on 22 July every 6 h by applying the short-term forecast of the previous data assimilation cycle to generate the background for the current data assimilation. Then, three experiments are performed to study the utility of the new humidity sounder. The first one, named CONV, just assimilates the Global Telecommunications System (GTS) data with the 3DVar method. Figure 4 shows the distribution of GTS data. The GTS system is a data communication system set up by the World Meteorological Organization (WMO) to quickly and accurately observe meteorological data all over the world. Apart from GTS data, the second experiment also assimilates FY-3D MWHS-2 radiance data with the 3DVar method. Similar to the data used in the second experiment, the third experiment adopts the EnVar method for assimilation. Finally, deterministic forecasts are conducted from each analysis. In order to avoid the potential correlations between adjoining radiance observations, the raw FY-3D MWHS-2 radiance data are thinned on a 54 km grid. The initial ensemble is randomly perturbed with the standard deviation in the background error covariance. Similarly, the 6-h spin-up ensemble forecast was launched and initiated at 0000 UTC on 21 July 2018. For each analysis, Ensemble Transform Kalman Filter (ETKF) [47] is applied to update the ensemble perturbation by perturbing the observations. The EnVar experiment employs the hybrid method with 40 ensemble members using the mean of the 6-h ensemble forecasts as the background. In this study, 75% weight is prescribed to the flow-dependent background error for EnVar.

4. Results

4.1. Performance of the Bias Correction

In our current study, channels 5–7 and 11–15, which are sensitive to temperature and moisture, respectively, are used. Channel 5 is selected to check the effect of bias correction. Figure 5 is the scatter plots of the simulated and the observed FY-3D MWHS-2 radiance brightness temperature before and after the bias correction at 0600 UTC on 21 July 2018. It should be pointed out that the FY-3D MWHS-2 brightness temperature simulation is calculated by the Radiative Transfer for TOVS (RTTOV) [48]. Most dots are a bit above the diagonal in Figure 5a, denoting that the simulated brightness temperature in the background is higher than the FY-3D MWHS-2 brightness temperature observation before the bias correction. The mean value of OMB (observed bright temperature minus simulated bright temperature of background) after the bias correction is equal to 0.297 K in Figure 5b, which is reduced compared to that before the bias correction (−2.303 K). Overall, the bias is reduced after the bias correction. Further, after the assimilation of FY-3D MWHS-2 radiance data, the points in Figure 5c are convergent to the diagonal. The root mean square error (RMSE) of the analysis field is reduced from 0.842 K to 0.736 K compared with Figure 5b (before the assimilation).
Figure 6 shows the frequency distribution histogram of channel 5 at 0600 UTC on 21 July 2018. Before the bias correction, there was a high frequency of OMB with values less than 0 K with a peak between −2.5 K to −2 K, demonstrating that for most cases, the simulation of brightness temperature in the background is higher than the observations. After the bias correction, the peak moves to around 0 K. It suggests that the bias correction is valid. Compared with OMB, the value of OMA (observed minus simulated brightness temperature of analysis) is further reduced to 0 K with less abnormal values.

4.2. Ensemble Spread

Ensemble spread represents the uncertainty of the background field of the model in the 3DEnVar data assimilation system. The higher the ensemble spread, the greater the error in the background field. Figure 7 shows the ensemble spread of 6-h forecast at 500 hPa from 0000 UTC on 21 July to 0600 UTC on 21 July, where Figure 7a is zonal wind speed, Figure 7b is meridional wind speed, Figure 7c is temperature, and Figure 7d is geopotential height. It can be found that the ensemble spread of cloud and precipitation areas in the tropics and near the typhoon is higher, while that of most land is lower. Based on the flow-dependent background error, it is necessary to assimilate the FY-3D MWHS-2 radiance data to provide additional observation information on these areas in the model to reduce the forecast error.

4.3. Impact on Analyzed Typhoon Structure

4.3.1. The 500 hPa Geopotential Height Increments

Figure 8 shows the increment of geopotential height at 500 hPa at 0600 UTC on 21 July 2018. The increment refers to the difference between the analysis field after the assimilation and the background field before the assimilation for the geopotential height. In the CONV experiment, except for a small area in the south of the typhoon center, the typhoon center and most surrounding areas are uniformly negative increments. In the 3DVar experiment, the increment of the typhoon center is similar to that in the CONV experiment, and the magnitude of the increment is slightly smaller. Compared to the previous two experiments, increments in the EnVar experiment are negative on the east side of the typhoon center, while the value on its west side is positive. The pattern of this geopotential height increment tends to make the typhoon move more northeastward than the other two experiments, which corresponds to the track forecast denoted in the figure of Section 4.5. The increments of CONV, 3DVar, and EnVar experiments were different for both the TC vortex and its surroundings. It seems the absolute increment for Ampil in EnVar was larger than that for the environment (figure in Section 4.4), whereas the increments are quite comparable for both Ampil and its surroundings for CONV and 3DVar. These can be explained by the large background error in the flow-dependent background error covariance used in EnVar.

4.3.2. The 850 hPa Relative Humidity Increments

Figure 9 shows the increment of 850 hPa relative humidity at 0600 UTC on 21 July 2018. In the CONV experiment, it can be found that the negative increment is observed in the south of the typhoon, and the positive increment is located at the north side of the typhoon. However, in the 3DVar experiment, the positive increment is also found in the south around the core of the typhoon. Further, in the EnVar experiment, a positive increment with a pattern of spiral cloud belt is evident. The magnitude of its outer region is greater than 10%, which is favorable for the maintenance of typhoons. For other dynamical model variables, their increments are calculated through multivariate correlations, although only temperature and humidity are applied in the observation operator of RTTOV.
Figure 10 is the RMSD profile of the analysis increment of specific humidity enlarged by 10 times based on the whole model domain. The value of RMSD reflects whether these model layers are sensitive to assimilation. It should be mentioned that the humidity increment of the CONV experiment is rather small (not shown). It can be found that both the 3DVar experiment and the EnVar experiment have a peak at the middle layer of the model. However, the maximum humidity increment of the EnVar experiment is around 0.5 g/kg, which is 0.1 g/kg greater than that in the 3DVar experiment. The results are consistent with the 850 hPa relative humidity increment in Figure 9.

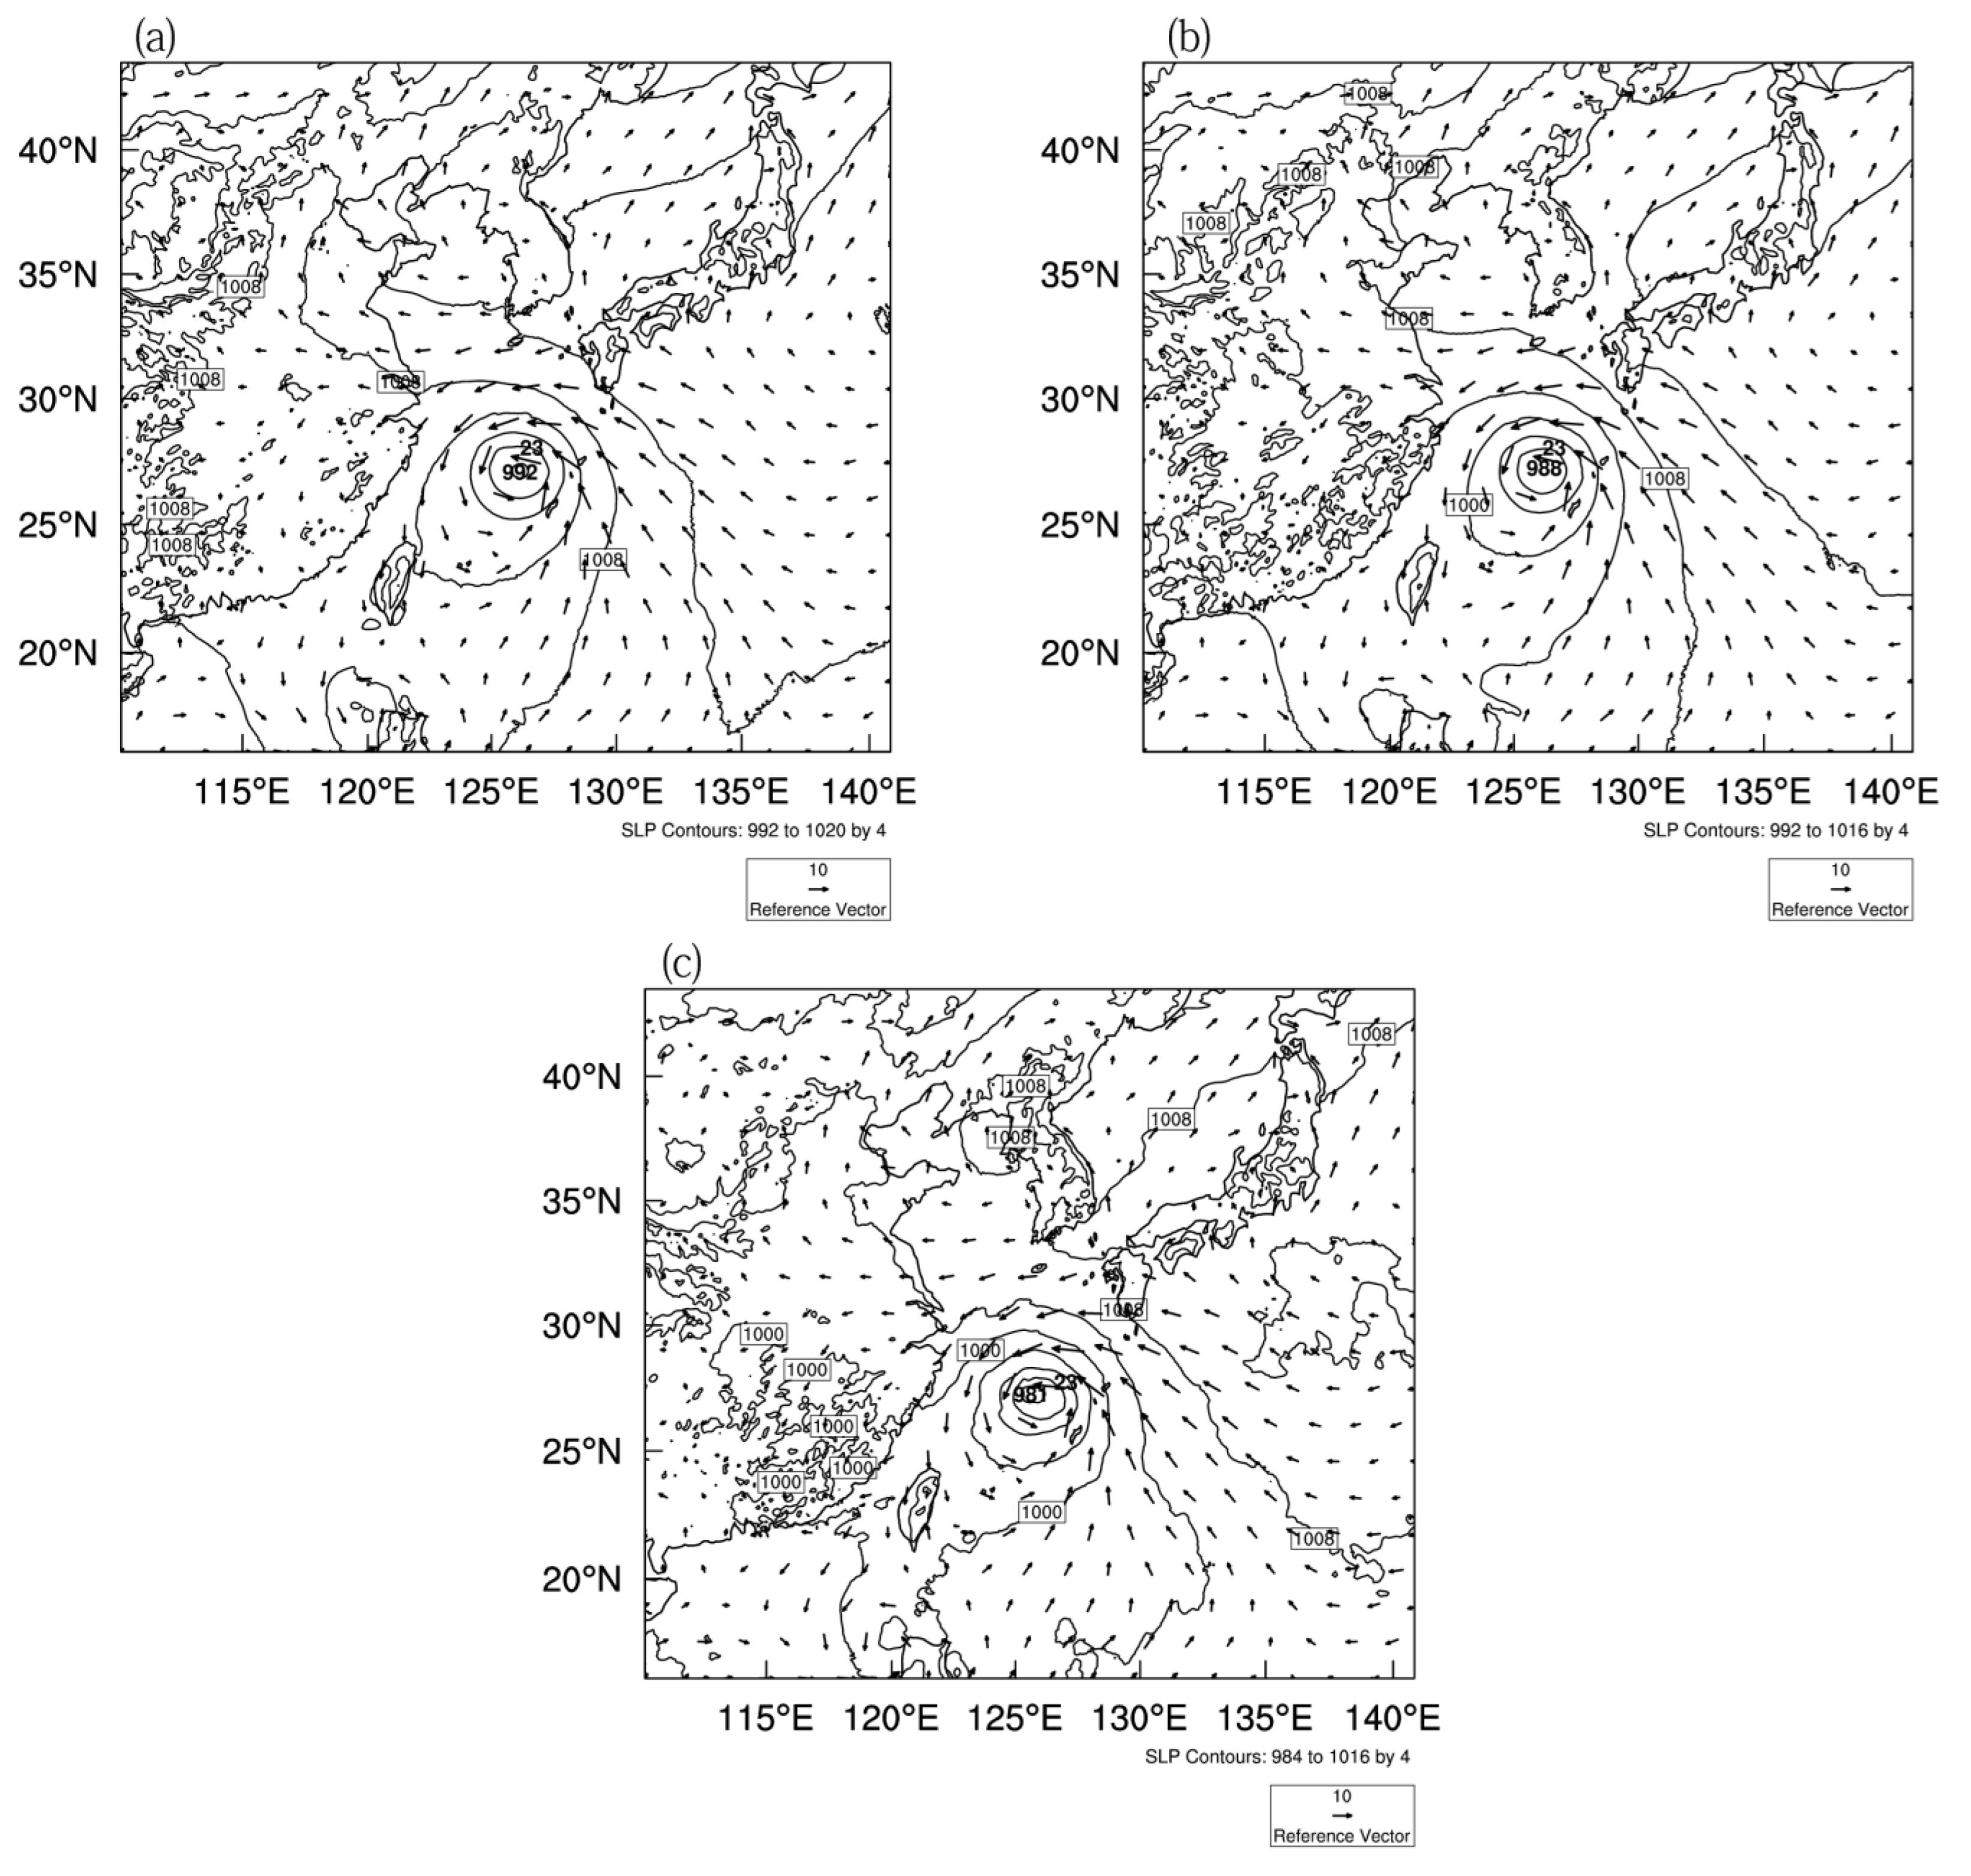
4.3.3. The Analyzed Typhoon Structures

Figure 11 shows the analyzed sea level pressure and surface wind vectors at 0600 UTC on 21 July 2018. It can be found that the three experiments simulate the circulation structure of Typhoon Ampil well. Compared with the CONV experiment, the analyzed typhoon intensity is stronger, and the wind speed near the typhoon’s inner core area is also higher in both the 3DVar experiment and the EnVar experiment. Meanwhile, the pressure isolines of the typhoon analyzed by the EnVar experiment are more tightly packed compared to the other two experiments. The minimum sea level pressure (MSLP) of the CONV experiment is 992 hPa, while those of the 3DVar experiment and the EnVar experiment are 988 hPa and 981 hPa, respectively. The simulated MSLP of the EnVar experiment is the lowest, which is the closest to the CMA best track dataset, with a value of 982 hPa.

4.4. Forecast Verification against Conventional Observations

The forecast errors are assessed in Figure 12 versus the conventional observation averaged from 24-h forecasts initialized from each analysis. For the wind components, the RMSE at the low and middle layers are small, while the RMSE at the high layers are large. In contrast, the feature of specific humidity is totally different from them. In addition, the RMSE of temperature at the middle layer are small. However, the RMSE at low and high layers are large. Generally, the RMSE of the 3DVar experiment are smaller than the CONV experiment, but the values are relatively higher than that in the EnVar experiment, which denotes that the forecast errors of the EnVar experiment are the smallest.

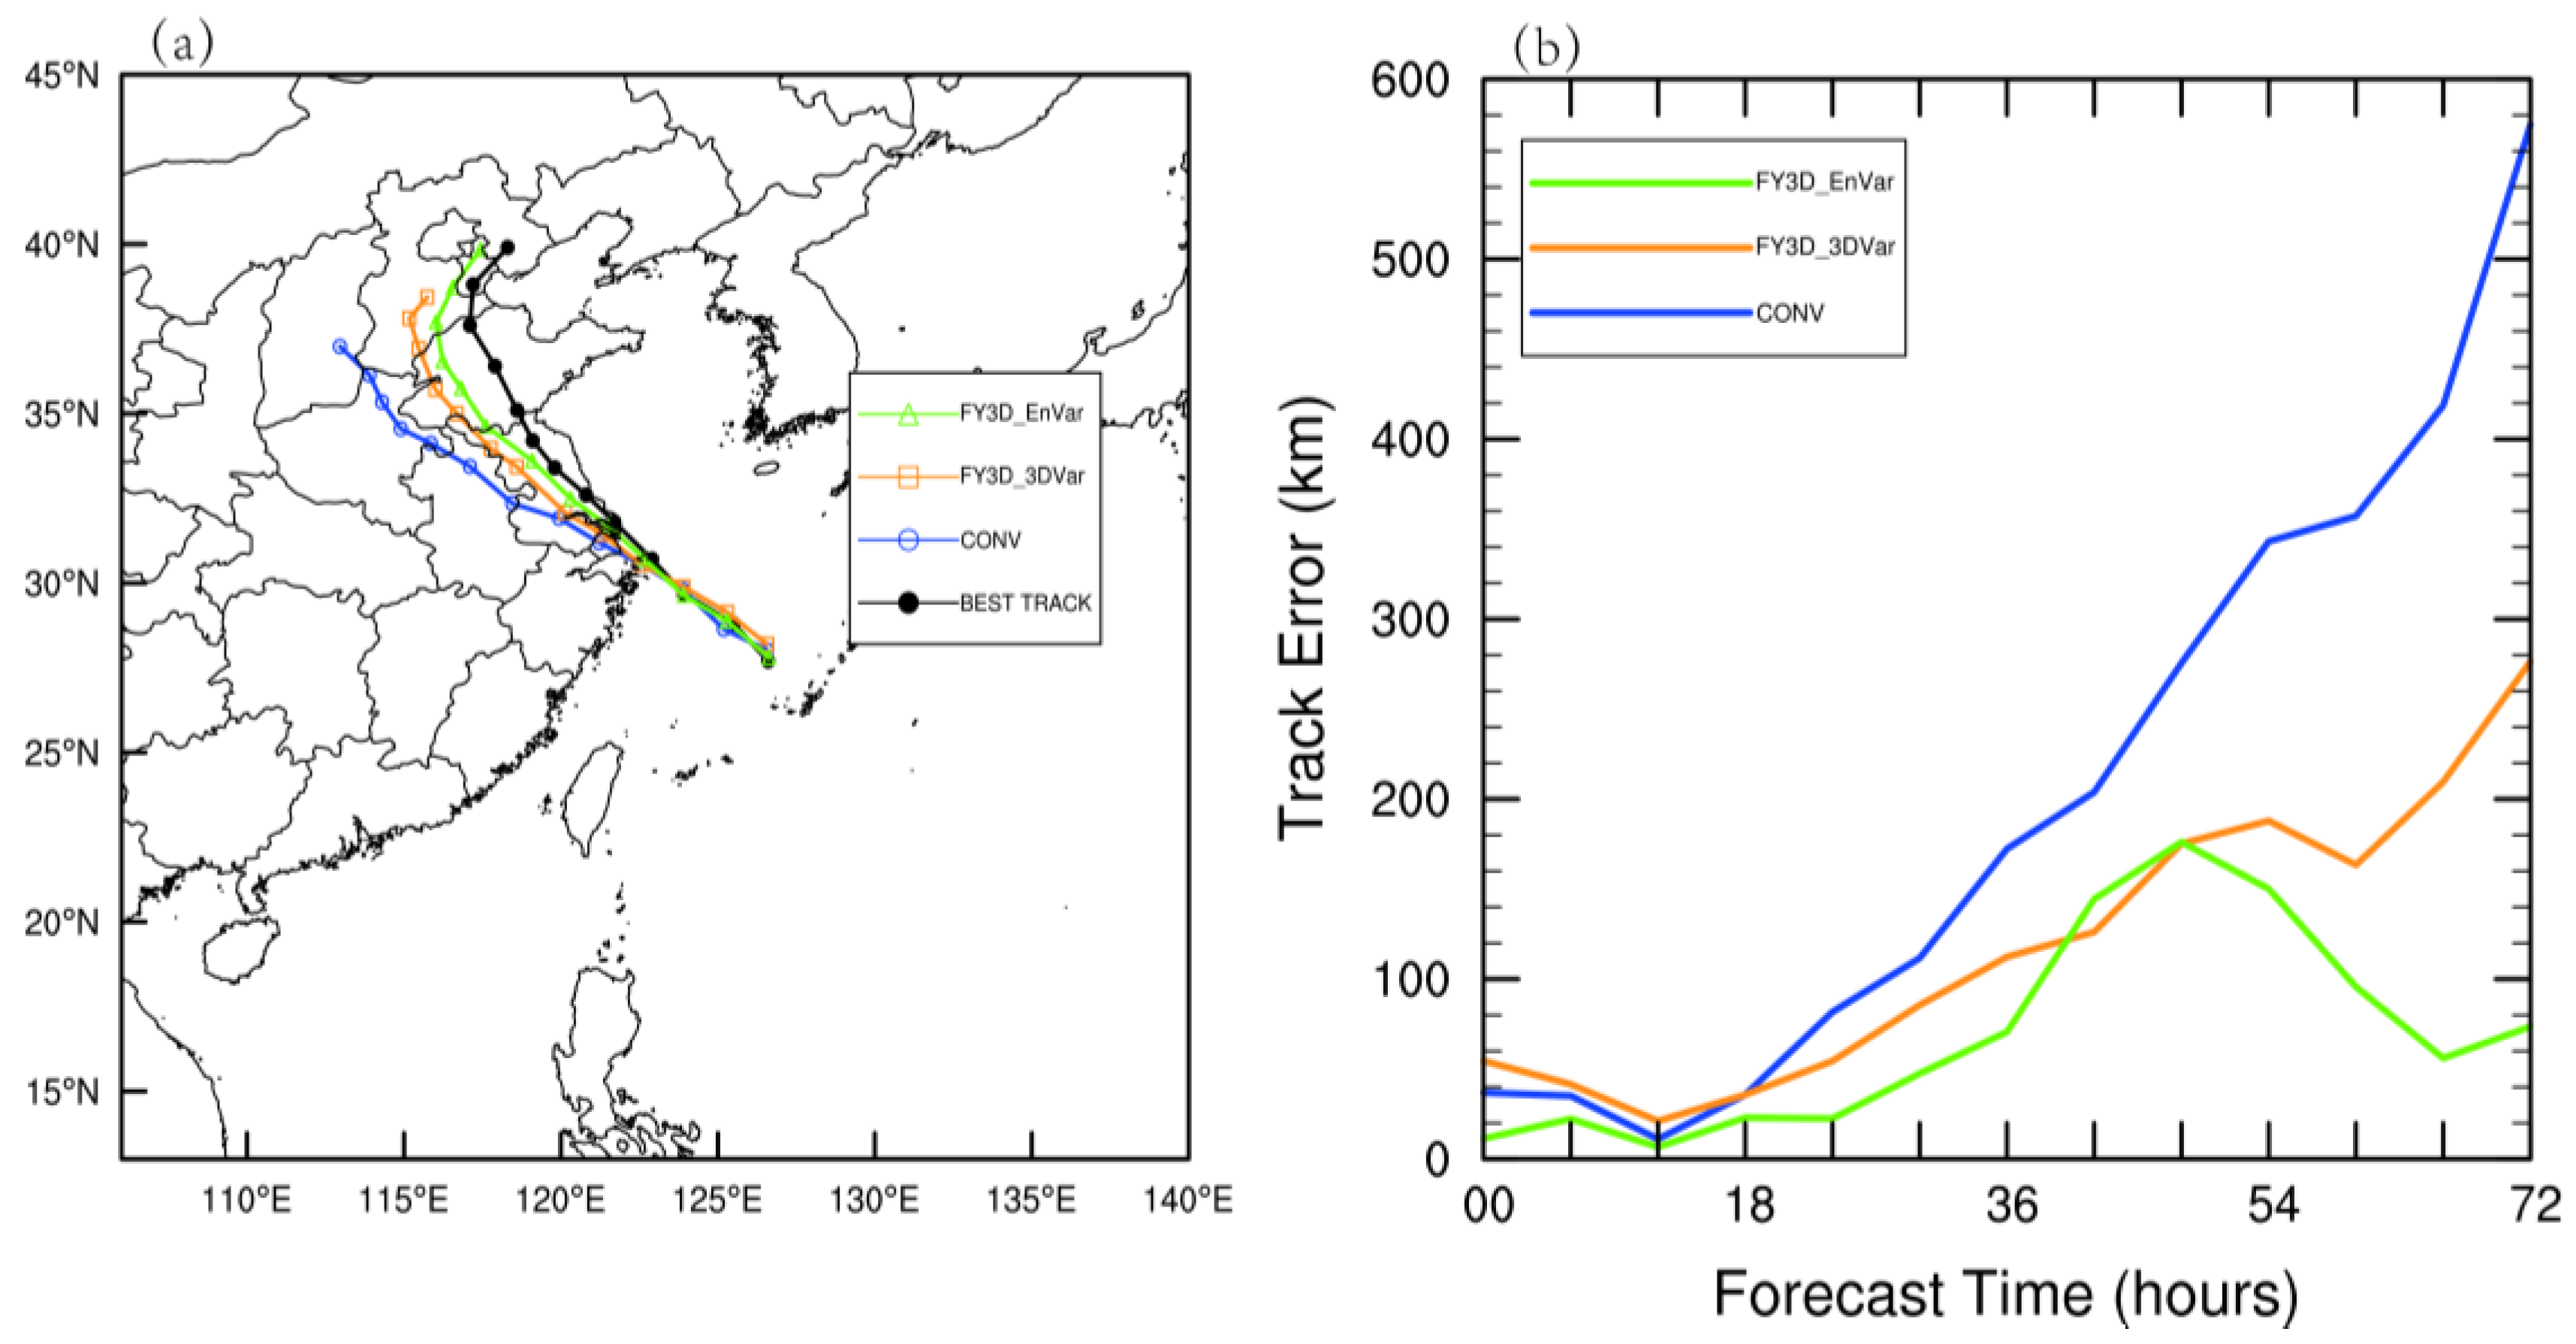
4.5. Typhoon Track and Intensity Forecast

Figure 13 shows the track of all the experiments in the 72-h deterministic forecast initialized from 0600 UTC on 21 July. It should be mentioned that the best track dataset is collected by the CMA [49,50]. Initial track errors exist in all experiments at the beginning time, as expected in the background. It can be found from Figure 13b that in the first 12 h, the forecast track errors of all experiments are reduced slightly. The forecast errors increase gradually with forecast leading time for the first 54 h. The track errors of the 3DVar experiment are also increasing with the forecast hours for all the forecast hours, while the track error of the CONV experiment increases more notably. However, the track error of the EnVar experiment decreases after 48 h, yielding a nearly consistently smallest track error with a maximum of about 180 km.
Figure 14 shows the MSLP and the maximum surface wind speed of all experiments in the 72-h deterministic forecast. It can be found that the overall trend of the three experiments is consistent with the observation. The MSLP forecast error of the EnVar experiment is smallest with a magnitude less than 4 hPa after 30 h’ model integration, although there is an obvious stronger positive deviation compared with CONV and 3DVar for the first 24 h. In addition, the Max Wind Speed of the EnVar experiment matches best with the best track in the first 42 h with its maximum error of less than 3 m/s. With the integration of the model, the forecast of maximum surface wind speed in three experiments is obviously lower than the observation after 42 h. According to Figure 13 and Figure 14, it can be found that the intensity prediction of EnVar has less improvement than the track prediction when compared with 3DVar and CONV.

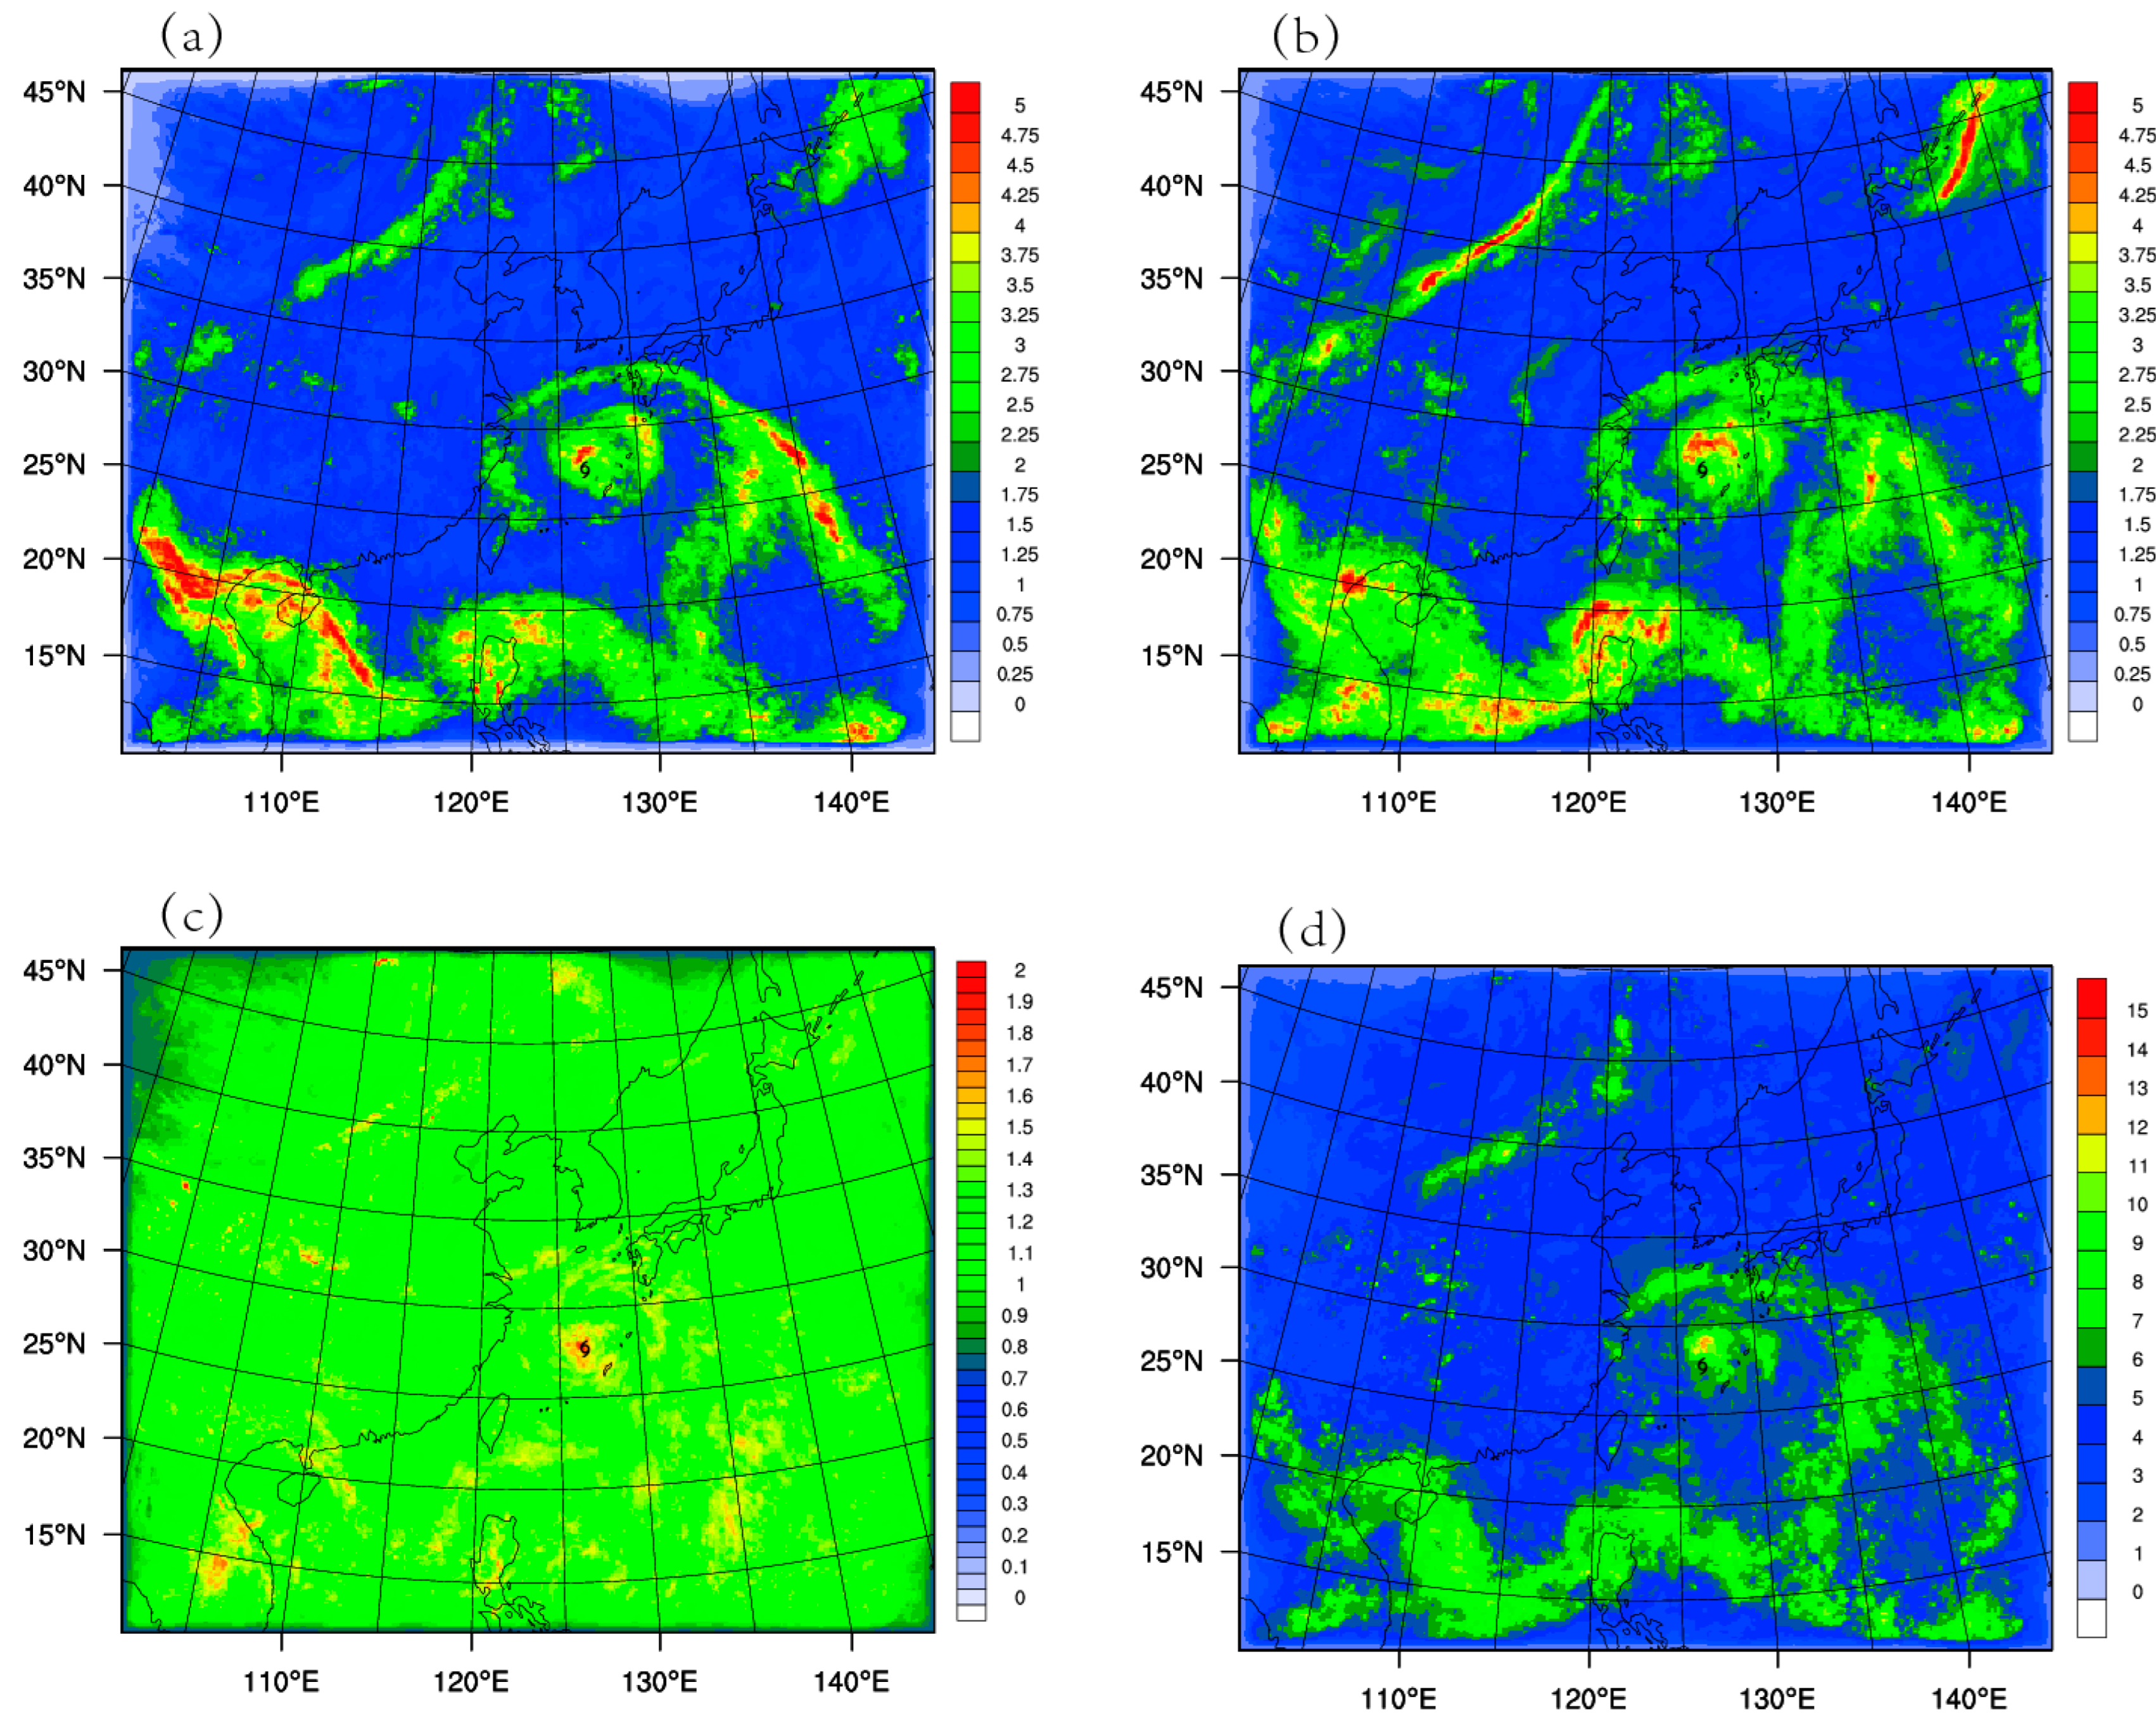
4.6. Precipitation Forecasts

In this section, the accumulated precipitation is verified to validate the method of assimilating the FY-3D MWHS-2 radiance data with the EnVar method. Figure 15 shows the 24-h accumulated precipitation after the landing of Typhoon Ampil from 0000 UTC on 23 July to 0000 UTC on 24 July 2018. In the observation, there are two rainstorm centers, respectively, in Tianjin and Shandong Province. Compared with the observation, the precipitation region of the CONV experiment is obviously more to the west, and the two rain belts are connected. There are heavy rains in Hebei, Shandong, and Henan Provinces. Compared to the CONV experiment, the precipitation field of the 3DVar experiment is significantly modified. It seems that the false precipitation region is reduced in Henan Province but increased in Hebei Province. Generally, there is a west bias in the precipitation region compared with the observation. The EnVar experiment further reduced the false precipitation regions in both Henan and Hebei Province. In addition, the precipitation center in the east of Shandong Province is also simulated to some extent.
In order to make an objective estimate on the forecast skill of the three experiments, the fraction skill score (FSS) is employed [51]. Generally speaking, the higher the FSS score, the better the forecasting skill. Figure 16 is the 24-h FSS of all experiments. The FSSs of the 3DVar experiment at each threshold are higher than those of the CONV experiment, while the EnVar experiment has the highest scores at each threshold. For small threshold values, the advantage of the EnVar experiment is not obvious since the difference between the two experiments is small, especially below 25 mm. For thresholds over 50 mm, the advantage of it is evident.

5. Conclusions

In this study, the effects of assimilating FY-3D MWHS-2 radiance data are investigated with the EnVar and 3DVar assimilation methods under clear-sky conditions on the forecast of Typhoon Ampil. Three numerical experiments are designed named CONV, 3DVar, and EnVar experiments. Both the 3DVar and the EnVar experiments assimilate FY-3D MWHS-2 radiance data on top of the conventional data, while the CONV experiment only applied conventional data. Some conclusions are found in these experiments.
The quality control and bias correction schemes for the FY-3D MWHS-2 humidity sounder are efficient. Compared to the CONV experiment and the 3DVar experiment, it is found that the increment of 500 hPa geopotential height, and the 850 hPa relative humidity in the EnVar experiment is notable, which are preferable for the maintenance of the typhoon. The assimilation of FY-3D MWHS-2 radiance data with the EnVar method is able to improve the forecasts of model variables. In the simulated 24-h precipitation, the rainfall center and the FSS of the EnVar experiment are the best. For the typhoon track and intensity, the EnVar experiment shows the overall best performance in the track, the MSLP, and the max surface wind speed forecast.
In this study, positive effects are found with the FY-3D MWHS-2 radiance data using the EnVar method for the case study of Typhoon Ampil in terms of the typhoon initialization and forecast, although the improvements in this study may be different from operational applications. In the following work, more typhoon cases should be chosen to verify the effectiveness of this new humidity sounder. In addition, an all-sky strategy to capture the typhoon’s inner core structure should be taken. In short, the new humidity sounder FY-3D MWHS-2 has great potential for the improvement of typhoon forecast, and this deserves to be further studied.

Author Contributions

Conceptualization, F.S.; methodology, C.S. and L.Z.; software, A.S.; data curation, C.S.; writing—original draft preparation, L.S. and F.S.; writing—review and editing, L.S., F.S. and A.S. All authors have read and agreed to the published version of the manuscript.

Funding

This research was funded by the Chinese National Natural Science Foundation of China, grant number G42192553; Program of Shanghai Academic/Technology Research Leader, grant number 21XD1404500; the Shanghai Typhoon Research Foundation, grant number TFJJ202107; the Chinese National Natural Science Foundation of China, grant number G41805016 and G41805070.

Conflicts of Interest

The authors declare no conflict of interest.

References

  1. Bishop, C.H.; Etherton, B.J.; Majumdar, S.J. Adaptive sampling with the ensemble transform Kalman filter. Part I: Theoretical aspects. Mon. Weather Rev. 2001, 129, 420. [Google Scholar] [CrossRef]
  2. Barker, D.M.; Huang, W.; Guo, Y.; Bourgeois, A.J.; Xiao, Q.N. A three-dimensional variational data assimilation system for MM5: Implementation and initial results. Mon. Weather Rev. 2004, 132, 897–914. [Google Scholar] [CrossRef]
  3. Barker, D.; Huang, X.-Y.; Liu, Z.; Auligné, T.; Zhang, X.; Rugg, S.; Ajjaji, R.; Bourgeois, A.; Bray, J.; Chen, Y.; et al. The Weather Research and Forecasting (WRF) model’s community variational/ensemble data assimilation system: WRFDA. Bull. Am. Meteor. Soc. 2012, 93, 831–843. [Google Scholar] [CrossRef] [Green Version]
  4. Bauer, P.; Geer, A.J.; Lopez, P.; Salmond, D. Direct 4D-Var assimilation of all-sky radiances. Part I: Implementation. Quart. J. Roy. Meteor. Soc. 2010, 136, 1868–1885. [Google Scholar] [CrossRef]
  5. Chou, M.D.; Suarez, M.J. An efficient thermal infrared radiation parameterization for use in general circulation models. NASA Tech. Memo. 1994, 3, 104606. [Google Scholar]
  6. Chien, F.; Kue, H. On the extreme rainfall of Typhoon Morakot. J. Geophys. Res. 2009, 116, D05104. [Google Scholar] [CrossRef] [Green Version]
  7. Chen, J.; Chen, H. Interdecadal variability of summer rainfall in Taiwan associated with tropical cyclones and monsoon. J. Clim. 2011, 24, 5786–5798. [Google Scholar] [CrossRef]
  8. Chen, Y.; English, S.; Bormann, N.; Zhu, J. Assessment of FY-3A and FY-3B MWHS Observations. Weather Forecast. 2015, 30, 1280–1290. [Google Scholar] [CrossRef]
  9. Dee, D.P. Variational bias correction of radiance data in the ECMWF system. In Proceedings of the ECMWF Workshop on Assimilation of High Spectral Resolution Sounders in NWP, Reading, UK, 28 June–1 July 2004; pp. 97–112. [Google Scholar]
  10. English, S.J.; Renshaw, R.J.; Dibben, P.C.; Smith, A.J.; Rayer, P.J.; Poulsen, C.; Saunders, F.W.; Eyre, J.R. A comparison of the impact of TOVS and A TOVS satellite sounding data on the accuracy of numerical weather forecasts. Quart. J. Roy. Meteor. Soc. 2000, 126, 2911–2931. [Google Scholar]
  11. Grell, G.A.; Freitas, S.R. A scale and aerosol aware stochastic convective parameterization for weather and air quality modeling. Atmos. Chem. Phys. 2014, 13, 5233–5250. [Google Scholar] [CrossRef] [Green Version]
  12. Geer, A.J.; Lonitz, K.; Weston, P.; Kazumori, M.; Okamoto, K.; Zhu, Y.; Liu, E.H.; Collard, A.; Bell, W.; Migliorini, S.; et al. All-sky satellite data assimilation at operational forecasting centres. Quart. J. Roy. Meteor. Soc. 2018, 144, 1191–1217. [Google Scholar] [CrossRef]
  13. Hong, S.Y.; Noh, Y.; Dudhia, J. A new vertical diffusion package with an explicit treatment of entrainment processes. Mon. Weather Rev. 2006, 134, 2318–2341. [Google Scholar] [CrossRef]
  14. Houtekamer, P.L.; Zhang, F. Review of the ensemble Kalman filter for atmospheric data assimilation. Mon. Weather Rev. 2016, 144, 4489–4532. [Google Scholar] [CrossRef]
  15. Hung, C.; Shih, M.; Lin, T. The climatological analysis of typhoon tracks, steering flow, and the Pacific Subtropical High in the vicinity of Taiwan and the Western North Pacific. Atmospehere 2020, 11, 543. [Google Scholar] [CrossRef]
  16. Jones, T.A.; Stensrud, D.; Wicker, L. Simultaneous radar and satellite data storm-scale assimilation using an Ensemble Kalman Filter approach for 24 May. Mon. Weather Rev. 2015, 143, 165–194. [Google Scholar] [CrossRef]
  17. Jiang, L.; Shi, C.; Zhang, T.; Guo, Y.; Yao, S. Evaluation of assimilating FY-3C MWHS-2 radiances using the GSI Global analysis system. Remote Sens. 2020, 12, 2511. [Google Scholar] [CrossRef]
  18. Kalnay, E.; Kanamitsu, M.; Kistler, R.; Collins, W.; Deaven, D.; Gandin, L.; Iredell, M.; Saha, S.; White, G.; Woollen, J.; et al. The NCEP/NCAR 40-year reanalysis project. Bull. Am. Meteor. Soc. 1996, 77, 437–471. [Google Scholar] [CrossRef]
  19. Lorenc, A.C. The potential of the ensemble Kalman filter for NWP—A comparison with 4D-Var. Quart. J. Roy. Meteor. Soc. 2003, 129, 3183–3203. [Google Scholar] [CrossRef]
  20. Lu, Q.; Bell, W.; Bauer, P.; Bormann, N.; Peubey, C. An evaluation of FY-3A satellite data for numerical weather prediction. Quart. J. Roy. Meteor. Soc. 2011, 137, 1298–1311. [Google Scholar] [CrossRef]
  21. Lawrence, H.; Bormann, N.; Lu, Q.; Geer, A.; English, S. An Evaluation of FY-3C MWHS-2 at ECMWF; ECMWF: Reading, UK, 2015; pp. 1–24. Available online: https://www.ecmwf.int/sites/default/files/elibrary/2015/10668-evaluation-fy-3c-mwhs-2-ecmwf.pdf (accessed on 20 October 2022).
  22. Li, J.; Liu, G. Direct assimilation of Chinese FY-3C Microwave Temperature Sounder-2 radiances in the global GRAPES system. Atmos. Meas. Tech. 2016, 9, 3095–3113. [Google Scholar] [CrossRef] [Green Version]
  23. Lawrence, H.; Carminati, F.; Bell, W.; Bormann, N.; Newman, S.; Atkinson, N.; Geer, A.; Migliorini, S.; Lu, Q.; Chen, K. An evaluation of FY-3C MWRI and Assessment of the long-term quality of FY-3C MWHS-2 at ECMWF and the Met Office. ECMWF Tech. Memo. 2017, 798, 1–26. [Google Scholar] [CrossRef]
  24. Lu, X.Q.; Yu, H.; Ying, M.; Zhao, B.; Zhang, S.; Lin, L.; Bai, L.; Wan, R. Western North Pacific tropical cyclone database created by the China Meteorological Administration. Adv. Atmos. Sci. 2021, 38, 690–699. [Google Scholar] [CrossRef]
  25. Mlawer, E.J.; Taubman, S.J.; Brown, P.D.; Iacono, M.J.; Clough, S.A. Radiative transfer for inhomogeneous atmospheres: RRTM, a validated correlated-k model for the longwave. J. Geophys. Res. Atmos. 1997, 102, 16663–16682. [Google Scholar] [CrossRef] [Green Version]
  26. McNally, A.P.; Watts, P.D.; Smith, J.A.; Engelen, R.; Kelly, G.A.; Thépaut, J.N.; Matricardi, M. The assimilation of AIRS radiance data at ECMWF. Q. J. R. Meteorol. Soc. 2006, 132, 935–957. [Google Scholar] [CrossRef] [Green Version]
  27. Moradi, I.; Evans, K.F.; Mccarty, W. Assimilation of satellite microwave observations over the rainbands of tropical cyclones. Mon. Weather Rev. 2020, 148, 4729–4745. [Google Scholar] [CrossRef]
  28. Newman, K.M.; Schwartz, C.S.; Liu, Z.; Shao, H.; Huang, X.Y. Evaluating forecast impact of assimilating Microwave Humidity Sounder (MHS) radiances with a regional ensemble Kalman filter data assimilation system. Weather Forecast 2015, 43, 964–983. [Google Scholar] [CrossRef]
  29. Niu, Z.; Zhang, L.; Dong, P.; Weng, F.; Huang, W. Impact of assimilating FY-3D MWTS-2 upper air sounding data on forecasting typhoon lekima (2019). Remote Sens. 2021, 13, 1841. [Google Scholar] [CrossRef]
  30. Pailleux, J. Use of satellite data in the ECMWF analysis system. ECMWF Workshop High Resolut. Anal. 1985, 6, 15–26. [Google Scholar]
  31. Pielke, R.A.; Landsea, C.W. Normalized hurricane damages in the United States: 1925–95. Weather Forecast 1998, 13, 621–631. [Google Scholar] [CrossRef]
  32. Rabier, F. Overview of global data assimilation developments in numerical weather prediction centres. Q. J. R. Meteorol. Soc. 2005, 131, 3215–3233. [Google Scholar] [CrossRef]
  33. Roberts, N.M.; Lean, H.W. Scale-selective verification of rainfall accumulations from high-resolution forecasts of convective events. Mon. Weather Rev. 2008, 136, 78–97. [Google Scholar] [CrossRef] [Green Version]
  34. Ridal, M.; Dahlbom, M. Assimilation of multinational radar reflectivity data in a mesoscale model: A proof of concept. J. Appl. Meteorol. Climatol. 2017, 56, 1739–1750. [Google Scholar] [CrossRef]
  35. Saunders, R.; Hocking, J.; Turner, E.; Rayer, P.; Rundle, D.; Brunel, P.; Vidot, J.; Roquet, P.; Matricardi, M.; Geer, A.; et al. An update on the RTTOV fast radiative transfer model (currently at version 12). Geosci. Model Dev. 2018, 11, 2717–2737. [Google Scholar] [CrossRef]
  36. Shen, F.; Min, J. Assimilating AMSU-A radiance data with the WRF hybrid En3DVAR system for track predictions of Typhoon Megi (2010). Adv. Atmos. Sci. 2015, 32, 1231–1243. [Google Scholar] [CrossRef]
  37. Sawada, M.; Ma, Z.Z.; Mehra, A. Impacts of assimilating high-resolution atmospheric motion vectors derived from Himawari-8 on tropical cyclone forecast in HWRF. Mon. Weather Rev. 2019, 147, 3721–3740. [Google Scholar] [CrossRef]
  38. Shen, F.; Xu, D.; Min, J. Effect of momentum control variables on assimilating radar observations for the analysis and forecast for Typhoon Chanthu (2010). Atmos. Res. 2019, 230, 104622. [Google Scholar] [CrossRef]
  39. Shen, F.; Xu, D.; Li, H.; Min, J.; Liu, R. Assimilation of GPM microwave imager radiance data with the WRF Hybrid 3DEnVar system for the prediction of Typhoon Chan-hom (2015). Atmos. Res. 2021, 251, 105422. [Google Scholar] [CrossRef]
  40. Sun, W.; Xu, Y. Assimilation of FY-3D MWHS2 Radiances with WRF Hybrid-3DVAR System for the Forecast of Heavy Rainfall Evolution Associated with Typhoon Ampil. Mon. Weather Rev. 2021, 149, 1419–1473. [Google Scholar] [CrossRef]
  41. Thompson, G.; Field, P.R.; Rasmussen, R.M.; Hall, W.D. Explicit forecasts of winter precipitation using an improved bulk microphysics scheme. Part II: Implementation of a new snow parameterization. Mon. Weather Rev. 2008, 136, 5095–5115. [Google Scholar] [CrossRef]
  42. Tu, J.; Chen, J. Large-scale indices for assessing typhoon activity around Taiwan. Int. J. Climatol. 2019, 39, 921–933. [Google Scholar] [CrossRef]
  43. Wang, X.; Snyder, C.; Hamill, T.M. On the theoretical equivalence of differently proposed ensemble/3D-Var hybrid analysis schemes. Mon. Weather Rev. 2007, 135, 222–227. [Google Scholar] [CrossRef]
  44. Wang, X.; Barker, D.; Snyder, C.; Hamill, T.M. A hybrid ETKF–3DVAR data assimilation scheme for the WRF model. Part II: Real observation experiments. Mon. Weather Rev. 2008, 136, 5132–5147. [Google Scholar] [CrossRef] [Green Version]
  45. Xian, Z.; Chen, K.; Zhu, J. All-sky assimilation of the MWHS-2 observations and evaluation the impacts on the analyses and forecasts of binary typhoons. J. Geophys. Res. Atmos. 2019, 124, 6359–6378. [Google Scholar] [CrossRef]
  46. Xu, D.; Min, J.; Shen, F.; Ban, J.; Chen, P. Assimilation of MWHS radiance data from the FY-3B satellite with the WRF Hybrid-3DVAR system for the forecasting of binary typhoons. J. Adv. Model. Earth Syst. 2016, 8, 1014–1028. [Google Scholar] [CrossRef] [Green Version]
  47. Xu, D.; Shen, F.; Min, J. Effect of background error tuning on assimilating radar radial velocity observations for the forecast of hurricane tracks and intensities. Meteorol. Appl. 2020, 27, e1820. [Google Scholar] [CrossRef] [Green Version]
  48. Xu, D.; Shen, F.; Min, J. Assimilation of GPM microwave imager radiance for track prediction of typhoon cases with the WRF hybrid En3DVAR system. Adv. Atmos. Sci. 2021, 38, 983–993. [Google Scholar] [CrossRef]
  49. Yamada, H.; Yoneyama, K.; Katsumata, M.; Shirooka, R. Observations of a super cloud cluster accompanied by synoptic-scale eastward-propagating precipitating systems over the Indian Ocean. J. Atmos. Sci. 2010, 67, 1456–1473. [Google Scholar] [CrossRef]
  50. Ying, M.; Zhang, W.; Yu, H.; Lu, X.; Feng, J.; Fan, Y.; Zhu, Y.; Chen, D. An overview of the China Meteorological Administration tropical cyclone database. J. Atmos. Oceanic Technol. 2014, 31, 287–301. [Google Scholar] [CrossRef]
  51. Zhang, P.; Chen, L.; Xian, D.; Xu, Z. Recent progress of Fengyun meteorology satellites. Chin. J. Space Sci. 2018, 38, 788–796. [Google Scholar]
Figure 1. (a,c,e) The 850 hPa circulation including geopotential height (lines, unit: dagpm), specific humidity (shading, unit: g/kg), wind field (vectors, unit: m/s) and (b,d,f) the 500 hPa circulation including geopotential height (lines, unit: dagpm), wind field (vectors, unit: m/s) at (a,b) 0000 UTC, (c,d) 0600 UTC, (e,f) 1200 UTC on 21 July 2018. gpm is the units of geopotential height. 1 gpm = 9.8 J and 1 dagpm = 10 gpm.
Remotesensing 14 06037 g001
Figure 2. The track of Ampil (black dot line) in the model domain overlapped by terrain height (filled colors, unit: m) from 1800 UTC on 19 July 2018 to 0600 UTC on 26 July 2018.
Remotesensing 14 06037 g002
Figure 3. Flow chart of experiments.
Remotesensing 14 06037 g003
Figure 4. Distribution of GTS observations at (a) 0600 UTC on 21 July 2018, (b) 0600 UTC on 22 July 2018. SATOB (satellite atmospheric motion vector), Airep (aircraft data), SOUND (radiosondes).
Remotesensing 14 06037 g004
Figure 5. The scatter plots of channel 5 observed versus simulated brightness temperature (unit: K) of background (a) before the bias correction, (b) after the bias correction, and (c) observed versus simulated brightness temperature of the analysis.
Remotesensing 14 06037 g005
Figure 6. The frequency distribution histogram of (a) OMB without bias correction, (b) OMB with bias correction, and (c) OMA with bias correction of channel 5.
Remotesensing 14 06037 g006
Figure 7. Ensemble spread of (a) zonal wind (unit: m/s), (b) meridional wind (unit: m/s), (c) temperature (unit: K), and (d) geopotential height (unit: gpm) at 0600 UTC on 21 July 2018 at 500 hPa.
Remotesensing 14 06037 g007
Figure 8. 500 hPa geopotential height increment (unit: gpm) of (a) the CONV experiment, (b) the 3DVar experiment, and (c) the EnVar experiment at 0600 UTC on 21 July 2018.
Remotesensing 14 06037 g008
Figure 9. 850 hPa relative humidity increment (unit: %) of (a) the CONV experiment, (b) the 3DVar experiment, and (c) the EnVar experiment at 0600 UTC on 21 July 2018. The black dots represent the typhoon center at 0600UTC on 21 July 2018.
Remotesensing 14 06037 g009
Figure 10. The RMSD profile of the analysis increment of specific humidity (unit: 0.1 g/kg) at 0600 UTC on 21 July 2018.
Remotesensing 14 06037 g010
Figure 11. Sea level pressure (contours, unit: hPa) and surface wind field (vectors, unit: m/s) of (a) the CONV experiment, (b) the 3DVar experiment, and (c) the EnVar experiment at 0600 UTC on 21 July 2018.
Remotesensing 14 06037 g011
Figure 12. RMSE of the (a) zonal wind speed (unit: m/s), (b) meridional wind speed (unit: m/s), (c) temperature (unit: K), and (d) specific humidity (unit: g/kg) averaged from 24-h forecasts initialized from each analysis.
Remotesensing 14 06037 g012
Figure 13. The deterministic 72-h forecast of (a) tracks and (b) track errors (unit: km) initialized from 0600 UTC on 21 July 2018.
Remotesensing 14 06037 g013
Figure 14. The deterministic 72-h forecast of (a) MSLP (unit: hPa) and (b) maximum surface wind speed (unit: m/s) initialized from 0600 UTC on 21 July 2018.
Remotesensing 14 06037 g014
Figure 15. 24-h precipitation distribution of (a) the observation, (b) the CONV experiment, (c) the 3DVar experiment, and (d) the EnVar experiment from 0000 UTC on 23 July to 0000 UTC on 24 July 2018.
Remotesensing 14 06037 g015
Figure 16. 24-h FSS at different thresholds.
Remotesensing 14 06037 g016
Table 1. FY-3D MWHS-2 sounder characteristics.
ChannelCentral Frequency (GHz)PolarizationsBandwidth (MHz)Frequency Stability (MHz)Antenna Main Beam WidthAntenna Main Beam Efficiency
189V1500502.0°>92%
2118.75 ± 0.08H20302.0°>92%
3118.75 ± 0.2H100302.0°>92%
4118.75 ± 0.3H165302.0°>92%
5118.75 ± 0.8H200302.0°>92%
6118.75 ± 1.1H200302.0°>92%
7118.75 ± 2.5H200302.0°>92%
8118.75 ± 3.0H1000302.0°>92%
9118.75 ± 5.0H2000302.0°>92%
10150V1500501.1°>95%
11183.31 ± 1H500301.1°>95%
12183.31 ± 1.8H700301.1°>95%
13183.31 ± 3H1000301.1°>95%
14183.31 ± 4.5H2000301.1°>95%
15183.31 ± 7H2000301.1°>95%
Publisher’s Note: MDPI stays neutral with regard to jurisdictional claims in published maps and institutional affiliations.

