
Monitoring and Analysis of Population Distribution in China from 2000 to 2020 Based on Remote Sensing Data

Abstract
:
1. Introduction
2. Study Area and Data Source
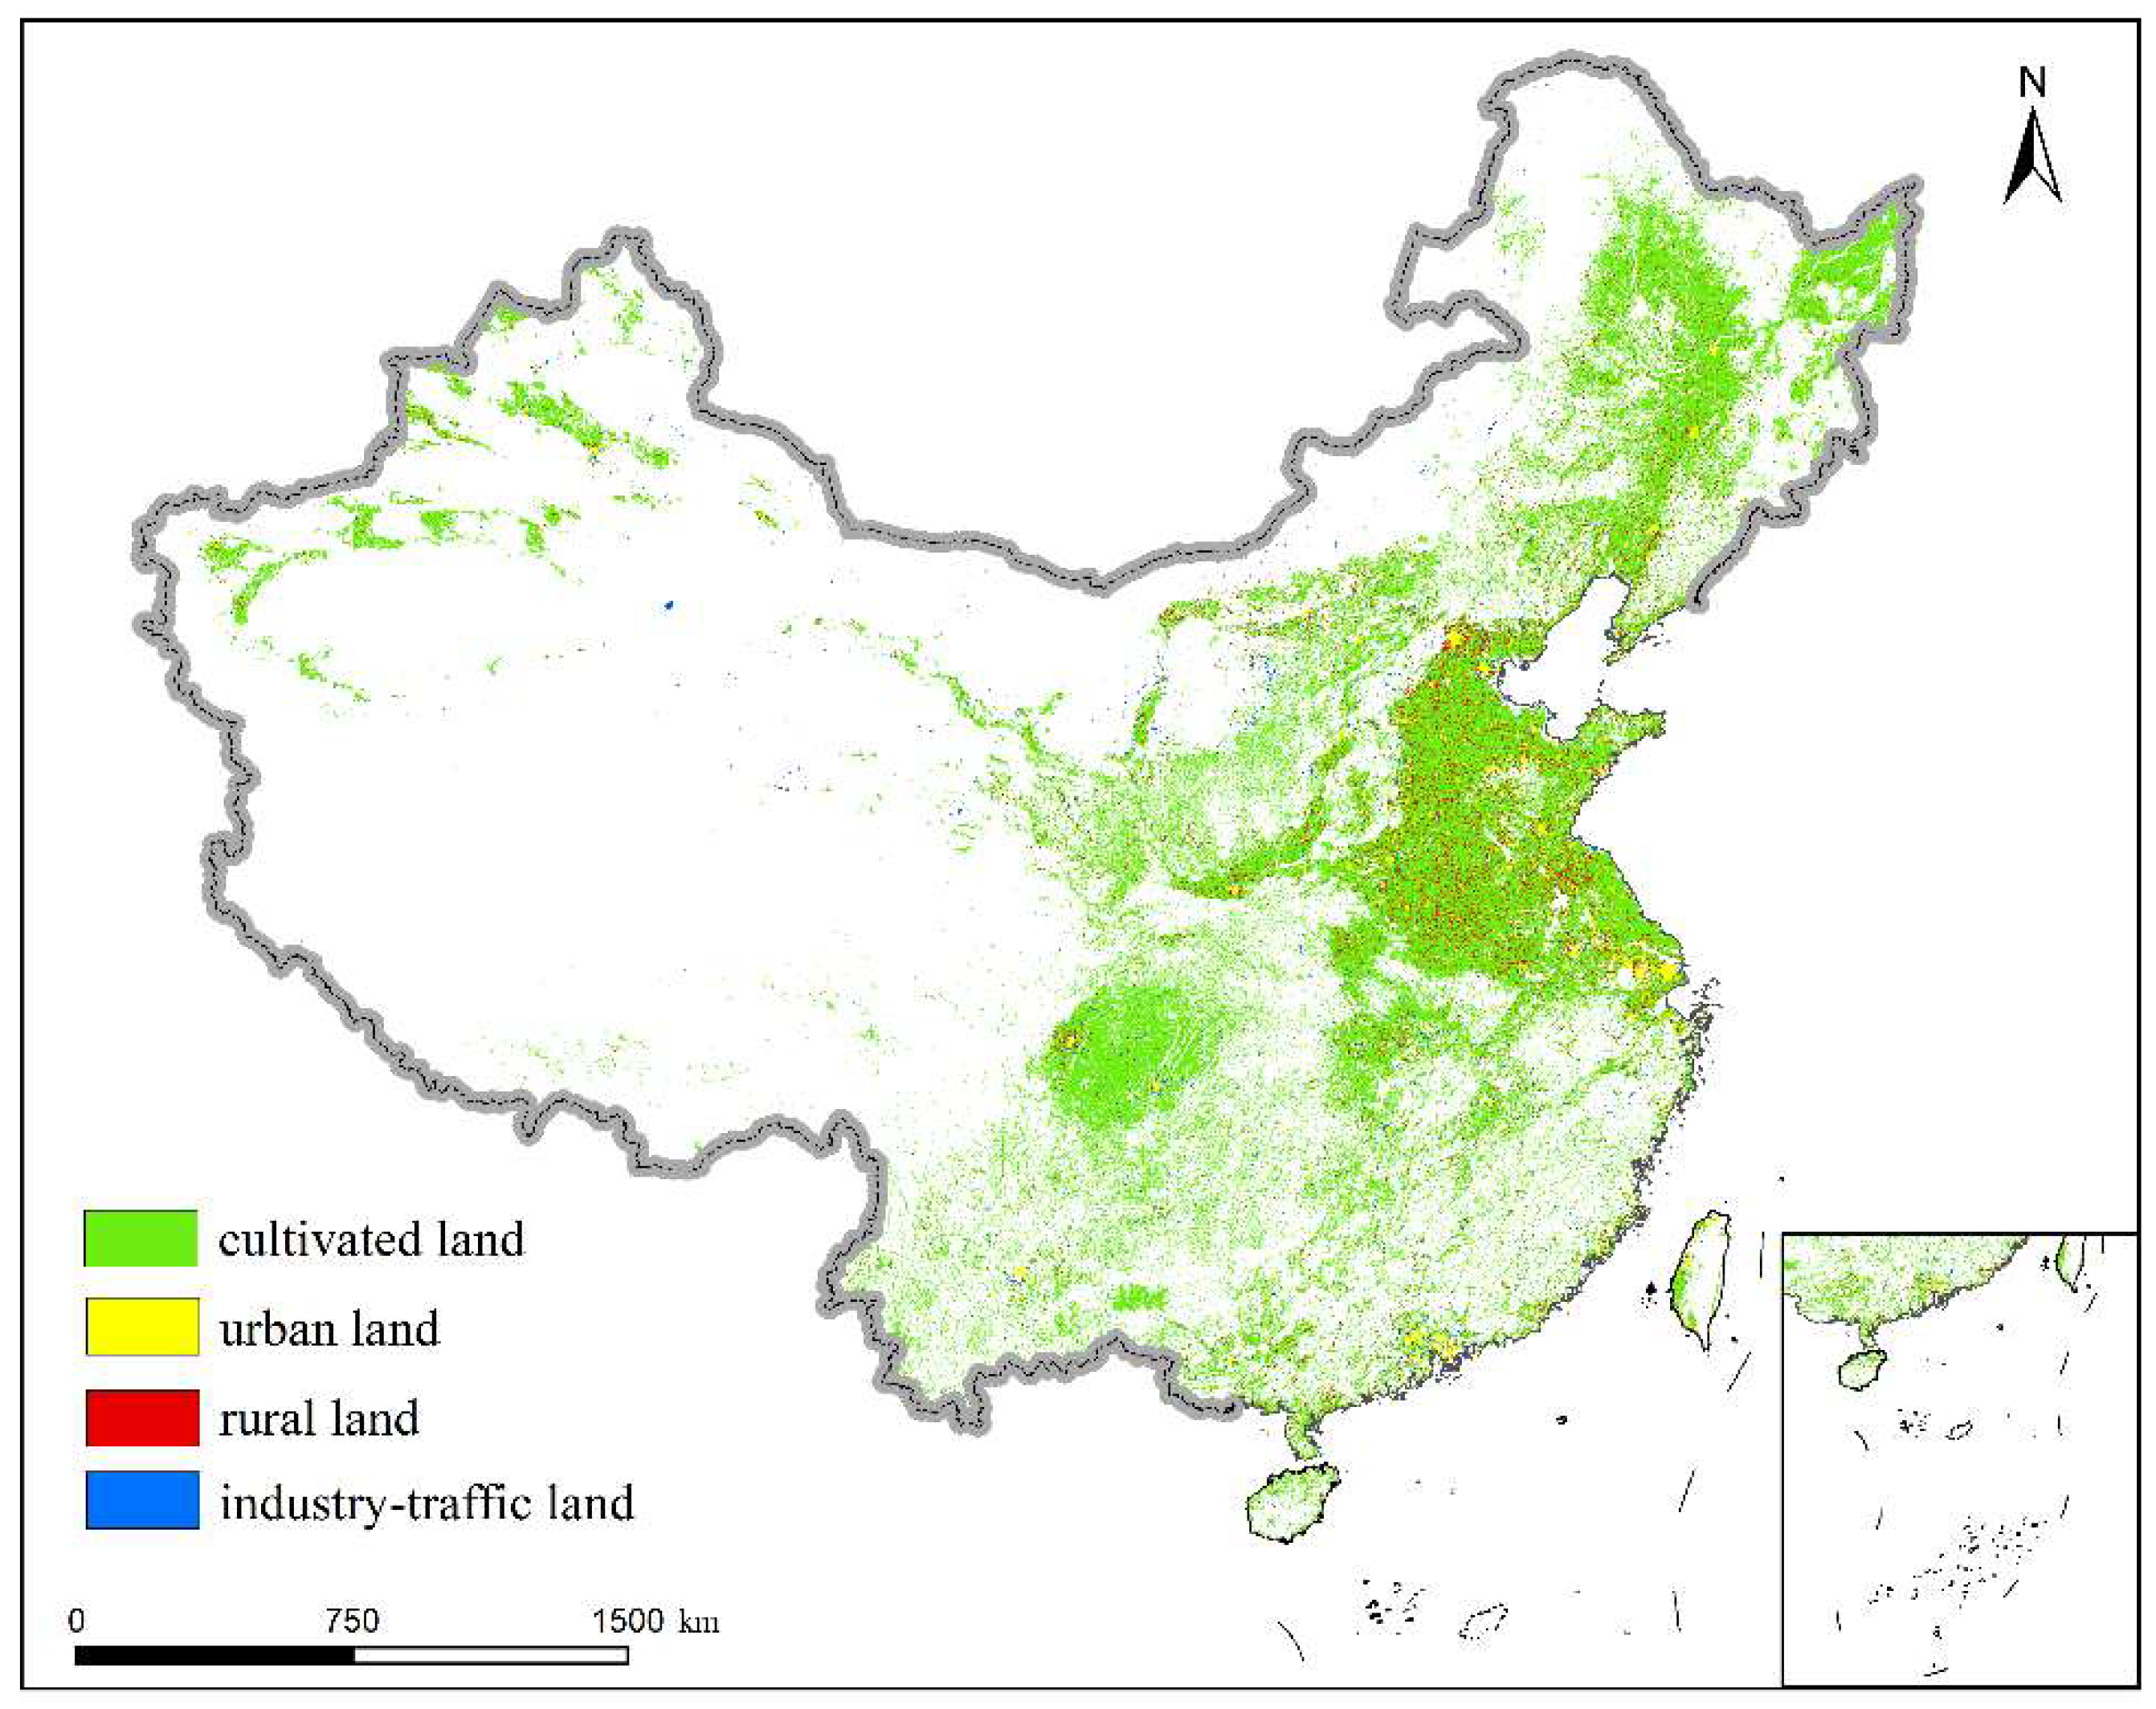
2.1. Study Area
2.2. Data Source
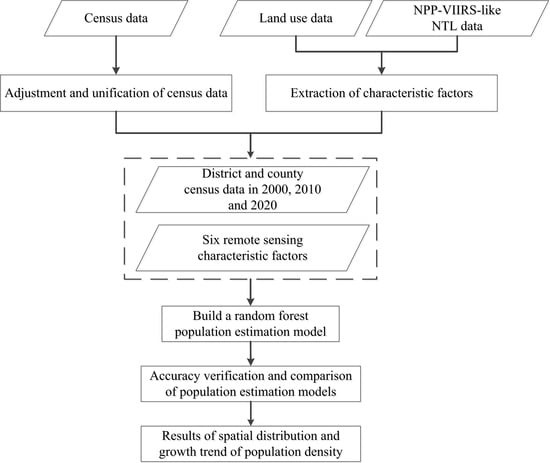
3. Methods
3.1. Impact Factor Calculation and Selection
3.2. Population Monitoring Estimation Model Construction
3.3. Population Estimation Model Revision
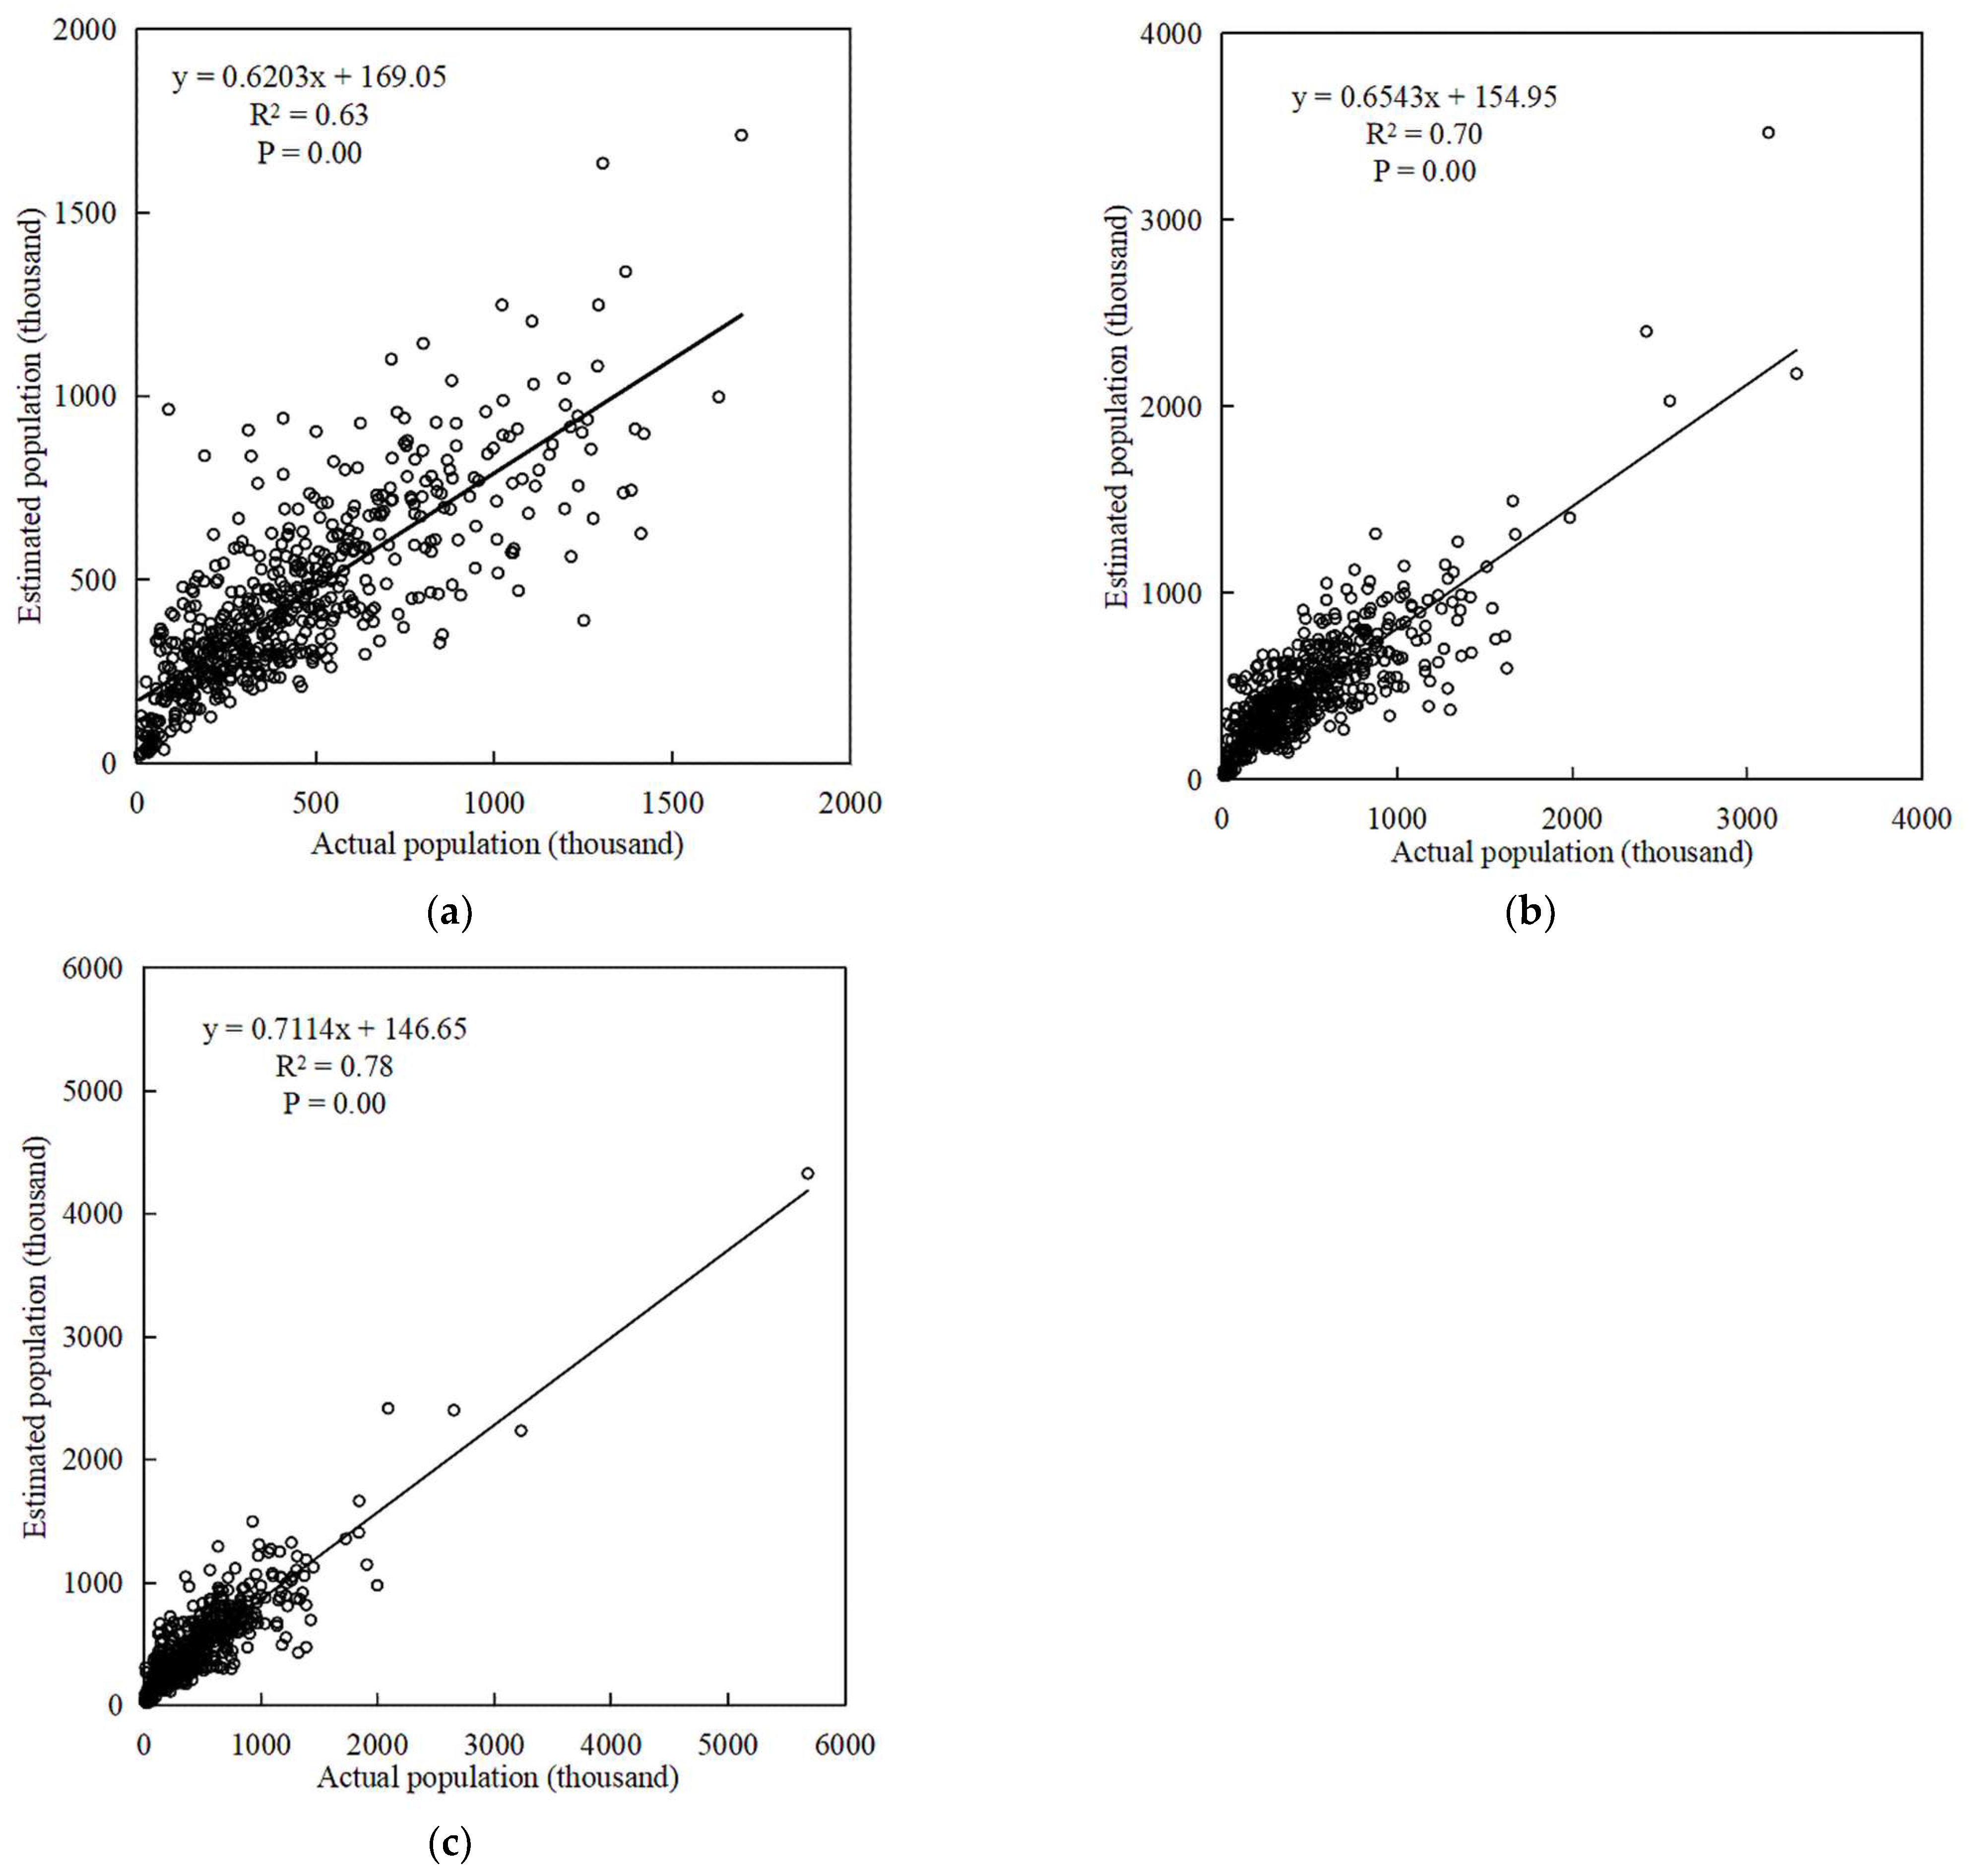
3.4. Precision Inspection and Verification
4. Results
4.1. The Spatiotemporal Pattern of China’s Regional Population Density Distribution from 2000 to 2020
4.2. China’s Regional Population Growth Trend from 2000 to 2020
5. Discussion
5.1. China’s Regional Population Growth Trend from 2000 to 2020
5.2. Population Monitoring Estimation Model Validation Results
5.3. Challenges in China’s Regional Population Monitoring and Estimation Based on Remote Sensing Data
6. Conclusions
Author Contributions
Funding
Data Availability Statement
Conflicts of Interest
References
- Acuto, M.; Parnell, S.; Seto, K.C. Building a global urban science. Nat. Sustain. 2018, 1, 2–4. [Google Scholar] [CrossRef]
- Bai, Z.; Wang, J.; Wang, M.; Gao, M.; Sun, J. Accuracy Assessment of Multi-Source Gridded Population Distribution Datasets in China. Sustainability 2018, 10, 1363. [Google Scholar] [CrossRef] [Green Version]
- Stevens, F.R.; Gaughan, A.E.; Linard, C.; Tatem, A.J. Disaggregating census data for population mapping using random forests with remotely-sensed and ancillary data. PLoS ONE 2015, 10, e0107042. [Google Scholar] [CrossRef] [PubMed] [Green Version]
- Ehrlich, D.; Kemper, T.; Pesaresi, M.; Corbane, C. Built-up area and population density: Two Essential Societal Variables to address climate hazard impact. Environ. Sci. Policy 2018, 90, 73–82. [Google Scholar] [CrossRef] [PubMed]
- Aquilino, M.; Adamo, M.; Blonda, P.; Barbanente, A.; Tarantino, C. Improvement of a Dasymetric Method for Implementing Sustainable Development Goal 11 Indicators at an Intra-Urban Scale. Remote Sens. 2021, 13, 2835. [Google Scholar] [CrossRef]
- Melchiorri, M.; Pesaresi, M.; Florczyk, A.; Corbane, C.; Kemper, T. Principles and Applications of the Global Human Settlement Layer as Baseline for the Land Use Efficiency Indicator—SDG 11.3.1. ISPRS Int. J. Geo-Inf. 2019, 8, 96. [Google Scholar] [CrossRef] [Green Version]
- Su, M.D.; Lin, M.C.; Hsieh, H.I.; Tsai, B.W.; Lin, C.H. Multi-layer multi-class dasymetric mapping to estimate population distribution. Sci. Total Environ. 2010, 408, 4807–4816. [Google Scholar] [CrossRef]
- Rabelo, L.; Sepulveda, J.; Compton, J.; Moraga, R.; Turner, R. Disaster and prevention management for the NASA shuttle during lift-off. Disaster Prev. Manag. Int. J. 2006, 15, 262–274. [Google Scholar] [CrossRef]
- Yu, B.; Lian, T.; Huang, Y.; Yao, S.; Ye, X.; Chen, Z.; Yang, C.; Wu, J. Integration of nighttime light remote sensing images and taxi GPS tracking data for population surface enhancement. Int. J. Geogr. Inf. Sci. 2018, 33, 687–706. [Google Scholar] [CrossRef]
- Sun, L.; Wang, J.; Chang, S. Population Spatial Distribution Based on Luojia 1–01 Nighttime Light Image: A Case Study of Beijing. Chin. Geogr. Sci. 2021, 31, 966–978. [Google Scholar] [CrossRef]
- Chu, H.-J.; Yang, C.-H.; Chou, C. Adaptive Non-Negative Geographically Weighted Regression for Population Density Estimation Based on Nighttime Light. ISPRS Int. J. Geo-Inf. 2019, 8, 26. [Google Scholar] [CrossRef] [Green Version]
- Ye, T.; Zhao, N.; Yang, X.; Ouyang, Z.; Liu, X.; Chen, Q.; Hu, K.; Yue, W.; Qi, J.; Li, Z.; et al. Improved population mapping for China using remotely sensed and points-of-interest data within a random forests model. Sci. Total Environ. 2019, 658, 936–946. [Google Scholar] [CrossRef] [PubMed]
- Gaughan, A.E.; Stevens, F.R.; Huang, Z.; Nieves, J.J.; Sorichetta, A.; Lai, S.; Ye, X.; Linard, C.; Hornby, G.M.; Hay, S.I.; et al. Spatiotemporal patterns of population in mainland China, 1990 to 2010. Sci. Data 2016, 3, 160005. [Google Scholar] [CrossRef] [Green Version]
- Bhaduri, B.; Bright, E.; Coleman, P.; Urban, M.L. LandScan USA: A high-resolution geospatial and temporal modeling approach for population distribution and dynamics. GeoJournal 2007, 69, 103–117. [Google Scholar] [CrossRef]
- Hallisey, E.; Tai, E.; Berens, A.; Wilt, G.; Peipins, L.; Lewis, B.; Graham, S.; Flanagan, B.; Lunsford, N.B. Transforming geographic scale: A comparison of combined population and areal weighting to other interpolation methods. Int. J. Health Geogr. 2017, 16, 29. [Google Scholar] [CrossRef] [PubMed] [Green Version]
- Mennis, J.; Hultgren, T. Intelligent Dasymetric Mapping and Its Application to Areal Interpolation. Cartogr. Geogr. Inf. Sci. 2006, 33, 179–194. [Google Scholar] [CrossRef]
- Azar, D.; Engstrom, R.; Graesser, J.; Comenetz, J. Generation of fine-scale population layers using multi-resolution satellite imagery and geospatial data. Remote Sens. Environ. 2013, 130, 219–232. [Google Scholar] [CrossRef]
- Zhuo, L.; Ichinose, T.; Zheng, J.; Chen, J.; Shi, P.J.; Li, X. Modelling the population density of China at the pixel level based on DMSP/OLS non-radiance-calibrated night-time light images. Int. J. Remote Sens. 2009, 30, 1003–1018. [Google Scholar] [CrossRef]
- Elvidge, C.D.; Baugh, K.E.; Kihn, E.A.; Kroehl, H.W.; Davis, E.R.; Davis, C.W. Relation between satellite observed visible-near infrared emissions, population, economic activity and electric power consumption. Int. J. Remote Sens. 2010, 18, 1373–1379. [Google Scholar] [CrossRef]
- Ma, T.; Zhou, Y.; Wang, Y.; Zhou, C.; Haynie, S.; Xu, T. Diverse relationships between Suomi-NPP VIIRS night-time light and multi-scale socioeconomic activity. Remote Sens. Lett. 2014, 5, 652–661. [Google Scholar] [CrossRef]
- Elvidge, C.D.; Baugh, K.; Zhizhin, M.; Hsu, F.C.; Ghosh, T. VIIRS night-time lights. Int. J. Remote Sens. 2017, 38, 5860–5879. [Google Scholar] [CrossRef] [Green Version]
- Small, C.; Pozzi, F.; Elvidge, C. Spatial analysis of global urban extent from DMSP-OLS night lights. Remote Sens. Environ. 2005, 96, 277–291. [Google Scholar] [CrossRef]
- Chen, X.; Nordhaus, W.D. VIIRS Nighttime Lights in the Estimation of Cross-Sectional and Time-Series GDP. Remote Sens. 2019, 11, 1057. [Google Scholar] [CrossRef] [Green Version]
- Wang, Y.; Teng, F.; Wang, M.; Li, S.; Lin, Y.; Cai, H. Monitoring Spatiotemporal Distribution of the GDP of Major Cities in China during the COVID-19 Pandemic. Int. J. Environ. Res. Public Health 2022, 19, 8048. [Google Scholar] [CrossRef] [PubMed]
- Dai, Z.; Hu, Y.; Zhao, G. The Suitability of Different Nighttime Light Data for GDP Estimation at Different Spatial Scales and Regional Levels. Sustainability 2017, 9, 305. [Google Scholar] [CrossRef] [Green Version]
- Wu, J.; Ma, L.; Li, W.; Peng, J.; Liu, H. Dynamics of Urban Density in China: Estimations Based on DMSP/OLS Nighttime Light Data. IEEE J. Sel. Top. Appl. Earth Obs. Remote Sens. 2014, 7, 4266–4275. [Google Scholar] [CrossRef] [Green Version]
- Ma, T.; Zhou, Y.; Zhou, C.; Haynie, S.; Pei, T.; Xu, T. Night-time light derived estimation of spatio-temporal characteristics of urbanization dynamics using DMSP/OLS satellite data. Remote Sens. Environ. 2015, 158, 453–464. [Google Scholar] [CrossRef]
- Xu, Y.; Mo, Y.; Zhu, S. Poverty Mapping in the Dian-Gui-Qian Contiguous Extremely Poor Area of Southwest China Based on Multi-Source Geospatial Data. Sustainability 2021, 13, 8717. [Google Scholar] [CrossRef]
- Yu, B.; Shi, K.; Hu, Y.; Huang, C.; Chen, Z.; Wu, J. Poverty Evaluation Using NPP-VIIRS Nighttime Light Composite Data at the County Level in China. IEEE J. Sel. Top. Appl. Earth Obs. Remote Sens. 2015, 8, 1217–1229. [Google Scholar] [CrossRef]
- Shi, K.; Chen, Y.; Yu, B.; Xu, T.; Chen, Z.; Liu, R.; Li, L.; Wu, J. Modeling spatiotemporal CO2 (carbon dioxide) emission dynamics in China from DMSP-OLS nighttime stable light data using panel data analysis. Appl. Energy 2016, 168, 523–533. [Google Scholar] [CrossRef]
- Shi, K.; Xu, T.; Li, Y.; Chen, Z.; Gong, W.; Wu, J.; Yu, B. Effects of urban forms on CO2 emissions in China from a multi-perspective analysis. J. Environ. Manag. 2020, 262, 110300. [Google Scholar] [CrossRef]
- Su, Y.; Chen, X.; Li, Y.; Liao, J.; Ye, Y.; Zhang, H.; Huang, N.; Kuang, Y. China’s 19-year city-level carbon emissions of energy consumptions, driving forces and regionalized mitigation guidelines. Renew. Sustain. Energy Rev. 2014, 35, 231–243. [Google Scholar] [CrossRef]
- Shi, K.; Yu, B.; Huang, C.; Wu, J.; Sun, X. Exploring spatiotemporal patterns of electric power consumption in countries along the Belt and Road. Energy 2018, 150, 847–859. [Google Scholar] [CrossRef]
- Shi, K.; Chen, Y.; Yu, B.; Xu, T.; Yang, C.; Li, L.; Huang, C.; Chen, Z.; Liu, R.; Wu, J. Detecting spatiotemporal dynamics of global electric power consumption using DMSP-OLS nighttime stable light data. Appl. Energy 2016, 184, 450–463. [Google Scholar] [CrossRef]
- Zhao, X.; Yu, B.; Liu, Y.; Yao, S.; Lian, T.; Chen, L.; Yang, C.; Chen, Z.; Wu, J. NPP-VIIRS DNB Daily Data in Natural Disaster Assessment: Evidence from Selected Case Studies. Remote Sens. 2018, 10, 1526. [Google Scholar] [CrossRef] [Green Version]
- Fan, X.; Nie, G.; Deng, Y.; An, J.; Zhou, J.; Li, H. Rapid detection of earthquake damage areas using VIIRS nearly constant contrast night-time light data. Int. J. Remote Sens. 2018, 40, 2386–2409. [Google Scholar] [CrossRef]
- Cole, T.; Wanik, D.; Molthan, A.; Román, M.; Griffin, R. Synergistic Use of Nighttime Satellite Data, Electric Utility Infrastructure, and Ambient Population to Improve Power Outage Detections in Urban Areas. Remote Sens. 2017, 9, 286. [Google Scholar] [CrossRef] [Green Version]
- Jephcote, C.; Hansell, A.L.; Adams, K.; Gulliver, J. Changes in air quality during COVID-19 ‘lockdown’ in the United Kingdom. Environ. Pollut. 2021, 272, 116011. [Google Scholar] [CrossRef]
- Chen, L.A.; Chien, L.C.; Li, Y.; Lin, G. Nonuniform impacts of COVID-19 lockdown on air quality over the United States. Sci. Total Environ. 2020, 745, 141105. [Google Scholar] [CrossRef] [PubMed]
- Wang, Y.; Wang, M.; Huang, B.; Li, S.; Lin, Y. Estimation and Analysis of the Nighttime PM2.5 Concentration Based on LJ1-01 Images: A Case Study in the Pearl River Delta Urban Agglomeration of China. Remote Sens. 2021, 9, 3405. [Google Scholar] [CrossRef]
- Tan, M.; Li, X.; Li, S.; Xin, L.; Wang, X.; Li, Q.; Li, W.; Li, Y.; Xiang, W. Modeling population density based on nighttime light images and land use data in China. Appl. Geogr. 2018, 90, 239–247. [Google Scholar] [CrossRef]
- Bagan, H.; Yamagata, Y. Analysis of urban growth and estimating population density using satellite images of nighttime lights and land-use and population data. GIScience Remote Sens. 2015, 52, 765–780. [Google Scholar] [CrossRef]
- Zeng, C.; Zhou, Y.; Wang, S.; Yan, F.; Zhao, Q. Population spatialization in China based on night-time imagery and land use data. Int. J. Remote Sens. 2011, 32, 9599–9620. [Google Scholar] [CrossRef]
- Lu, D.; Wang, Y.; Yang, Q.; Su, K.; Zhang, H.; Li, Y. Modeling Spatiotemporal Population Changes by Integrating DMSP-OLS and NPP-VIIRS Nighttime Light Data in Chongqing, China. Remote Sens. 2021, 13, 284. [Google Scholar] [CrossRef]
- Wang, L.; Wang, S.; Zhou, Y.; Liu, W.; Hou, Y.; Zhu, J.; Wang, F. Mapping population density in China between 1990 and 2010 using remote sensing. Remote Sens. Environ. 2018, 210, 269–281. [Google Scholar] [CrossRef]
- Li, X.; Zhou, W. Dasymetric mapping of urban population in China based on radiance corrected DMSP-OLS nighttime light and land cover data. Sci. Total Environ. 2018, 643, 1248–1256. [Google Scholar] [CrossRef]
- Yu, S.; Zhang, Z.; Liu, F. Monitoring Population Evolution in China Using Time-Series DMSP/OLS Nightlight Imagery. Remote Sens. 2018, 10, 194. [Google Scholar] [CrossRef] [Green Version]
- Chen, Z.; Yu, B.; Yang, C.; Zhou, Y.; Yao, S.; Qian, X.; Wang, C.; Wu, B.; Wu, J. An extended time series (2000–2018) of global NPP-VIIRS-like nighttime light data from a cross-sensor calibration. Earth Syst. Sci. Data 2021, 13, 889–906. [Google Scholar] [CrossRef]
- Mao, H.; Ahn, Y.-Y.; Bhaduri, B.; Thakur, G. Improving land use inference by factorizing mobile phone call activity matrix. J. Land Use Sci. 2017, 12, 138–153. [Google Scholar] [CrossRef]
- Sun, W.; Zhang, X.; Wang, N.; Cen, Y. Estimating Population Density Using DMSP-OLS Night-Time Imagery and Land Cover Data. IEEE J. Sel. Top. Appl. Earth Obs. Remote Sens. 2017, 10, 2674–2684. [Google Scholar] [CrossRef]
- You, H.; Jin, C.; Sun, W. Spatiotemporal Evolution of Population in Northeast China during 2012–2017: A Nighttime Light Approach. Complexity 2020, 2020, 3646145. [Google Scholar] [CrossRef]
- Ortakavak, Z.; Cabuk, S.N.; Cetin, M.; Senyel Kurkcuoglu, M.A.; Cabuk, A. Determination of the nighttime light imagery for urban city population using DMSP-OLS methods in Istanbul. Environ. Monit. Assess. 2020, 192, 790. [Google Scholar] [CrossRef]
- Breiman, L. Random Forests. Mach. Learn. 2001, 45, 5–32. [Google Scholar] [CrossRef] [Green Version]
- Ma, L.; Chen, M.; Che, X.; Fang, F. Research on Population-Land-Industry Relationship Pattern in Underdeveloped Regions: Gansu Province of Western China as an Example. Sustainability 2019, 11, 2434. [Google Scholar] [CrossRef] [Green Version]
- Deng, X.; Bai, X. Sustainable Urbanization in Western China. Environ. Sci. Policy Sustain. Dev. 2014, 56, 12–24. [Google Scholar] [CrossRef]
- Zhang, Q.; Su, S. Determinants of urban expansion and their relative importance: A comparative analysis of 30 major metropolitans in China. Habitat Int. 2016, 58, 89–107. [Google Scholar] [CrossRef]
- Wu, J.; Zhang, Z.; Yang, X.; Li, X. Analyzing Pixel-Level Relationships between Luojia 1-01 Nighttime Light and Urban Surface Features by Separating the Pixel Blooming Effect. Remote Sens. 2021, 13, 4838. [Google Scholar] [CrossRef]
- Zhao, X.; Yu, B.; Liu, Y.; Chen, Z.; Li, Q.; Wang, C.; Wu, J. Estimation of Poverty Using Random Forest Regression with Multi-Source Data: A Case Study in Bangladesh. Remote Sens. 2019, 11, 375. [Google Scholar] [CrossRef] [Green Version]
- Georganos, S.; Grippa, T.; Niang Gadiaga, A.; Linard, C.; Lennert, M.; Vanhuysse, S.; Mboga, N.; Wolff, E.; Kalogirou, S. Geographical random forests: A spatial extension of the random forest algorithm to address spatial heterogeneity in remote sensing and population modelling. Geocarto Int. 2019, 36, 121–136. [Google Scholar] [CrossRef]


| Datasets | Format | Resolution | Sources | Access Link |
|---|---|---|---|---|
| NPP-VIIRS-like nighttime light data | Grid | 500 m | Harvard Dataverse | https://doi.org/10.7910/DVN/YGIVCD (accessed on 20 April 2022) |
| Land use data | Grid | 1000 m | Resource and Environment Science and Data Center | https://www.resdc.cn/ (accessed on 20 April 2022) |
| Census data | Table | County level city | Census Database | http://www.stats.gov.cn/ (accessed on 15 May 2022) |
Publisher’s Note: MDPI stays neutral with regard to jurisdictional claims in published maps and institutional affiliations. |
© 2022 by the authors. Licensee MDPI, Basel, Switzerland. This article is an open access article distributed under the terms and conditions of the Creative Commons Attribution (CC BY) license (https://creativecommons.org/licenses/by/4.0/).
Share and Cite
Teng, F.; Wang, Y.; Wang, M.; Wang, L. Monitoring and Analysis of Population Distribution in China from 2000 to 2020 Based on Remote Sensing Data. Remote Sens. 2022, 14, 6019. https://doi.org/10.3390/rs14236019
Teng F, Wang Y, Wang M, Wang L. Monitoring and Analysis of Population Distribution in China from 2000 to 2020 Based on Remote Sensing Data. Remote Sensing. 2022; 14(23):6019. https://doi.org/10.3390/rs14236019
Chicago/Turabian StyleTeng, Fei, Yanjun Wang, Mengjie Wang, and Linqi Wang. 2022. "Monitoring and Analysis of Population Distribution in China from 2000 to 2020 Based on Remote Sensing Data" Remote Sensing 14, no. 23: 6019. https://doi.org/10.3390/rs14236019