Article

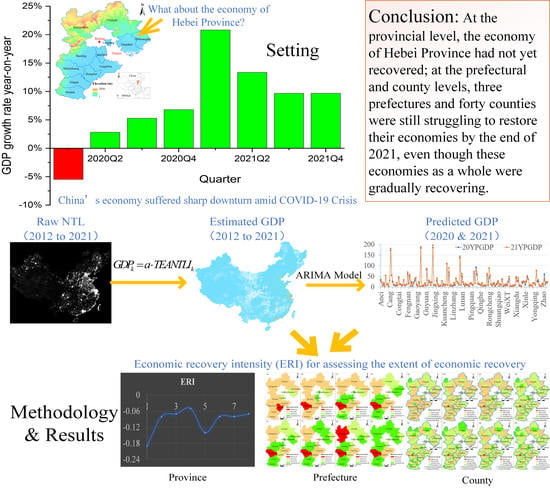
Assessment of Economic Recovery in Hebei Province, China, under the COVID-19 Pandemic Using Nighttime Light Data

1
School of Ecological Environment, Institute of Disaster Prevention, Sanhe 065201, China
2
Hebei Key Laboratory of Earthquake Disaster Prevention and Risk Assessment, Sanhe 065201, China
*
Author to whom correspondence should be addressed.
Remote Sens. 2023, 15(1), 22; https://doi.org/10.3390/rs15010022
Submission received: 14 November 2022 / Revised: 9 December 2022 / Accepted: 14 December 2022 / Published: 21 December 2022

Abstract

:
The COVID-19 pandemic has presented unprecedented disruptions to human society worldwide since late 2019, and lockdown policies in response to the pandemic have directly and drastically decreased human socioeconomic activities. To quantify and assess the extent of the pandemic’s impact on the economy of Hebei Province, China, nighttime light (NTL) data, vegetation information, and provincial quarterly gross domestic product (GDP) data were jointly utilized to estimate the quarterly GDP for prefecture-level cities and county-level cities. Next, an autoregressive integrated moving average model (ARIMA) model was applied to predict the quarterly GDP for 2020 and 2021. Finally, economic recovery intensity (ERI) was used to assess the extent of economic recovery in Hebei Province during the pandemic. The results show that, at the provincial level, the economy of Hebei Province had not yet recovered; at the prefectural and county levels, three prefectures and forty counties were still struggling to restore their economies by the end of 2021, even though these economies, as a whole, were gradually recovering. In addition, the number of new infected cases correlated positively with the urban NTL during the pandemic period, but not during the post-pandemic period. The study results are informative for local government’s strategies and policies for allocating financial resources for urban economic recovery in the short- and long-term.

Graphical Abstract

1. Introduction

A sudden outbreak of a new coronavirus disease (coronavirus disease 2019, COVID-19) occurred in Wuhan, China, at the end of 2019, and the virus spread rapidly throughout China and the world. From 3 January 2020 to 12 August 2022, a cumulative total of 5,898,144 confirmed cases and 24,129 deaths have been reported within China. As of 12 August 2022, a total of 3,438,923,503 vaccine doses have been administered in China [1]. However, the pandemic is still raging around the world. Although governments, residents, scientists, and medical professionals worldwide are doing their utmost to combat the pandemic, and the spread of the pandemic has been initially contained, its impact on social, economic, environmental, political, and cultural development is exceptionally far-reaching. The COVID-19 pandemic reduced the annual growth rate of the global economy to around −3.2% in 2020. The International Monetary Fund (IMF) estimates that the global economy is expected to recover by 6.1% in 2021 and 3.6% in 2022 [2].
Remote sensing data from nighttime light (NTL) emissions provide unique and direct perspectives for investigating some human socioeconomic activities and can quantitatively characterize the intensity of human activities by detecting urban nighttime illumination, even low-intensity artificial nocturnal lighting arising from small-scale communities and fishery activities. As a definitive proxy of the dynamics of human activities, NTL data have been widely applied in diverse socioeconomic fields, such as urban sprawl [3,4,5], population estimation [6,7], electricity consumption [8,9,10], carbon emission [11,12], poverty evaluation [13,14,15,16], and disaster relief and alleviations [17,18,19]. After the outbreak of COVID-19, NTL data served as an effective indicator for investigating human responses to the pandemic because of its extensive coverage, objectivity, and high temporal resolution. In contrast to other natural disasters, the COVID-19 pandemic did not cause damage to electrical facilities, and with the imposition of regional home quarantine measures, the closure of numerous factories and commercial centers resulted in a noticeable dimming of NTL. A few studies have proven that the NTL radiances during the quarantine period were significantly dimmer than before the pandemic [20,21,22,23]. Xu et al. [24] comparatively analyzed NTL changes due to lockdowns in 20 megacities worldwide. The NTL generally decreased after the lockdown, but the regional variations and spatial patterns differed. Asian cities showed the most dramatic decrease in NTL radiance, while cities in Europe, Africa, North America, and South America showed no noticeable decline. Shao et al. [25] found that the level of socioeconomic activity in Wuhan was not fully restored to its initial status after lifting the lockdown, and the reduction in NTL radiance corresponded to the impact of the pandemic on the industrial and service sectors. A study by Lan et al. [26] showed similar results and concluded that cities in western and northeastern China recovered gradually, while cities in the east displayed significant variations because of the increased number of infected cases. Yin et al. [27] used the NTL indexes to assess the degree of recovery of urban activities in 17 regions of China before, during, and after the pandemic, and the results showed evident disparities in economic activities across these regions.
In addition, NTL data have also been used to analyze and predict other socioeconomic activities related to COVID-19. Beyer et al. [28] used NTL data to construct an electricity consumption model to assess the decline in electricity consumption after the lockdown, owing to the pandemic. Based on NTL data, Anand and Kim [29] found that 75% of protected areas in Africa experienced varying light intensity reductions due to the decline in tourism during the pandemic. Alahmadi et al. [30] showed that the change in NTL intensity reflects the lifestyle of the Saudi Muslim population under the influence of the pandemic. Wu et al. [31] utilized six NTL indices to assess the operational performance of China’s Southeast Asia Industrial Park, and the results suggest that the area of the industrial park affected by COVID-19 was less than its surrounding 10 km buffer zone. Tian et al. [32] developed a work recovery index using NTL data to analyze the resumption of work and production in 21 major cities in China after the pandemic in late March 2020 by excluding residential areas.
Since June 2021, COVID-19 has been mutating, and the new mutated strains, such as Omicron and Delta, which have an insidious onset and are highly contagious and fast spreading, were soon rampaging across China again. In response to the emergence of pandemic conditions around the country, the local Chinese government had adopted various prevention and control measures, such as community closure, individual home quarantine, and the closing of enterprises, factories, restaurants, grocery stores, and schools to minimize the mobility and gathering of people. Once no new cases of infection had emerged, the government lifted the lockdown measures and encouraged the resumption of work and production. As a result, the Chinese economy has been experiencing large fluctuations since the emergence of the COVID-19 pandemic in 2019. The key to designing an effective COVID-19 pandemic response policy is to have access to the latest information on the epidemic itself and “near real-time” data on the related economic impact. Economic activity data are critical at the national and provincial levels, and even at the prefecture and county levels—especially when government policies have shifted from a total provincial lockdown to precise prevention and control at the prefecture and county levels. Accordingly, the combination of NTL data and traditional statistics for obtaining data on human socio-economic dynamics under such emergencies is valuable for assessing the financial losses due to lockdown measures and formulating relevant monetary relief programs.
The paper is structured as follows: Section 2 outlines the study site and the dataset used. Section 3 describes the calibration process for NTL data, the estimation method for quarterly gross domestic product (GDP), and the prediction models for quarterly GDP based on time series GDP data. Section 4 shows the accuracy results of estimated GDP and predicted GDP and assesses the extent of their respective economic recovery at the provincial, prefectural, and county scales. Section 5 analyzes the relationship between NTL and infection cases, highlights the contributions and practical implications of this study, and discusses the limitations of this study. Section 6 draws conclusions with respect to this study.

2. Study Site and Data Sources

2.1. Study Sites

Hebei Province (Figure 1) is situated in North China, within latitude 36°05′–42°40′N and longitude 113°27′–119°50′E, enclosing the capital Beijing, adjoining Tianjin and the Bohai Sea in the east, and touching Taihang Mountain in the west and the Yanshan Mountain in the north, with a total area of 188,800 km2. By the end of 2021, the resident population of Hebei Province was 74.48 million, and the province’s GDP was CNY 4039.13 billion, with an economic growth rate of 6.5%, ranking twelfth across the nation. Hebei Province has a temperate continental monsoon climate, with an average annual precipitation of 484.5 mm and a precipitation distribution characterized by more in the southeast and less in the northwest; the average temperature in January is below 3 °C, and the average temperature in July is 18 °C to 27 °C [33]. The topography is high in the northwest and low in the southeast, with an average elevation of 1 m to 2836 m. Hebei province, the capital of Shijiazhuang, administers 11 prefecture-level cities, namely Shijiazhuang, Tangshan, Qinhuangdao, Handan, Xingtai, Baoding, Zhangjiakou, Chengde, Cangzhou, Langfang, and Hengshui, and 167 prefectural districts and counties.
Hebei Province is divided into the central provinces of China’s three major economic zones, and its economic development level is in the middle of China. The province’s landscape comprises high mountains, hills, and plains bordered by the Bohai Sea. As an essential member of the Beijing–Tianjin–Hebei metropolitan area, Hebei Province is responsible for transferring equipment manufacturing, trade and logistics, education and training, health and retirement, financial services, cultural and creative, and sports and leisure industries from Beijing and Tianjin. Hebei Province, especially its capital Shijiazhuang, was hit by three severe COVID-19 pandemic waves in the first quarter (Q1) of 2020, the Q1 of 2021, and the fourth quarter (Q4) of 2021. The pandemic in Hebei Province is highly representative of that of all of China. Therefore, studying the impact of lockdown measures on the economic activity status in Hebei Province during the pandemic not only provides precise decision-making services for resource allocation under the pandemic but also provides references for economic development and the formulation of pandemic control measures in the Beijing–Tianjin region and other provinces.

2.2. Data Sources

Multiple sensors capture the illumination of the Earth’s environment at night. NTL data are provided by the Defense Meteorological Satellite Program–Operational Linescan System (DMSP-OLS) and the Suomi National Polar-Orbiting Partnership–Visible Infrared Imaging Radiometer Suite (NPP-VIIRS), which are currently two of the most widely used and reliable sources of NTL data. The monthly cloud-free NPP-VIIRS/DNB (day night band) composite data from April 2012 to December 2021 are provided by Earth Observation Group (EOG) [34], where the “vcmsl” version data were adopted instead of the “vcm” version, owing to the ability of the “vcmsl” data to cover the whole of China. The DMSP-OLS NTL data feature a spatial resolution of 30 arc seconds and a dynamic range of 6 bits for DN values. Compared to the DMSP-OLS data, the NPP-VIIRS NTL data have a higher spatial resolution (15 arc seconds) and a wider radiation detection range (14 bits), and its onboard calibration capability significantly decreases the problem of light oversaturation and blooming [35,36]. Monthly composites are generated by averaging the daily NPP-VIIRS/DNB data. Although averaging removes lightning, moonlight, and cloud cover from the DNB data, the “vcmsl” version of the monthly composite data still contain stray lights, auroras, fires, ships, and other temporal lights [37]. Therefore, the monthly composite data require the subsequent pre-processing of these outliers. The quarterly composite NTL data can be derived by averaging the monthly composite NTL data.
MOD13A1 V6 products include the enhanced vegetation index (EVI) values and pixel reliability index layers at the 500 m spatial resolution, which are released by the Atmosphere Archive and Distribution System (LAADS) Distributed Active Archive Center (DAAC) every 16 days [38]. EVI products minimize the variation in the canopy background and promote sensitivity over high biomass areas. As an essential auxiliary set of data to the NTL data, it can effectively mitigate the saturation and blooming of NTL data. The quality assurance (QA) bit flags of the pixel reliability layer are ranked into five levels: fill/no data, good data, marginal data, snow/ice, and cloudy [39]. The high-quality EVI values corresponding to good data and marginal data were retained, and then the 16-day EVI products were averaged to generate the mean EVI images of China from 2012 to 2020.
GDP statistics for all 31 provinces in China for four quarters per year, from 2012 to 2021, were collected from the National Bureau of Statistics of China [40]. Data for the COVID-19 pandemic from 22 January 2020, to 31 December 2021, involving the number of confirmed cases, the number of new confirmed cases, the number of cured cases, and the number of death cases were retrieved from the Health Commission of Hebei Province [41]. The administrative boundary data of 31 provinces in China and the administrative boundary data of 167 prefectures and counties in Hebei Province were derived from the National Catalogue Service for Geographic Information [42]. All of the spatial data were projected onto a Lambert conformal conic projection, and the NTL and MOD13A1 raster data were resampled with the same 500 m resolution. A descriptive view of each data source is presented in Table 1.

3. Methodology

The schematic diagram of the methodological workflow implemented in this study is illustrated in Figure 2. Firstly, we corrected the NPP-VIIRS NTL data to mitigate the saturation and blooming of NTL using vegetation information and lighting characteristics. Secondly, a linear regression model was developed to estimate the GDP of cities at the prefectural and county levels. Furthermore, the autoregressive integrated moving average (ARIMA) time series models were employed to predict the GDP of cities at the prefectural and county levels in Hebei Province in 2020 and 2021. The estimated GDP and predicted GDP were then combined to calculate the economic recovery intensity (ERI) index, and the economic resumptions of administrative units were assessed against the classified ERI indices. Lastly, the spatial distribution of cities and dynamics of economic resumption at all levels under the impact of the COVID-19 pandemic were further discussed, in light of the resumption of provincial, prefectural, and county-level cities’ economies.

3.1. Calibration of NTL Data

The NTL indicates the level of economic development, assuming that its value on the water surface is zero and the maximum value is distributed in the urban commercial center and airport area. To reduce the effects of illumination noise, such as stray lights, auroras, fires, and boats included in the monthly NTL data, the light values on the surface of the water bodies were considered background noise for the NTL data, and the light values larger than those in the urban commercial center and airport areas were set as the maximum light values. The following equation was employed to eliminate illumination noise initially:
N T L c = { 0 f o r N T L N T L min N T L     N T L min f o r N T L min < N T L < N T L max N T L max N T L min f o r N T L N T L max
where NTLc is the initial corrected light value; NTLmin denotes the light value on the surface of large water bodies counted throughout China; NTLmax indicates the light value over the commercial centers or airport areas in the metropolitan cities of Beijing, Shanghai, and Guangzhou.
Despite the improved onboard calibration capability for NPP-VIIRS NTL data, it is subject to a few problems of light saturation and blooming, both in the inner city and at the urban border. Due to the introduction of EVI information, the EVI-adjusted NTL index (EANTLI) can be used to reduce the saturation of the urban core, alleviate the blooming effect in the outskirts, and strengthen the disparity of light within the city [43,44]. For the quarterly composite NTL data, the equations of EANTLI for NTL correction are given by the following:
E A N T L I = 1 + N T L n E V I m 1 N T L n + E V I m N T L n
N T L n = N T L c N T L c min N T L c max N T L c min
where NTLn denotes the normalized NTLc; EVIm indicates the annual average EVI values, and NTLcmax, and NTLcmin indicates the maximum and minimum NTLc, respectively.

3.2. Estimation Model of Quarterly GDP at the Pixel Level

Many mathematical models are available to estimate GDP using NTL data, such as the linear, power, quadratic polynomial, and neural network models. From these models, the linear regression model is relatively accurate and easier to accomplish [45]. Accordingly, linear regression models are employed to characterize the correlation between NTL indices and GDP. Based on previous studies, and considering the contribution of NTL to GDP, a linear regression model with an intercept of zero was developed for the total EANTLI value and provincial quarterly GDP within the administrative unit [46].
G D P k = a T E A N T L I k
where GDPk denotes the estimated quarterly GDP within the kth province; TEANTLI denotes the sum of EANTLI within the kth province.
The pixel-level GDP estimation, based on the regression model, is calculated directly using the light pixel values, instead of the total NTL index values, so it is possible to incur large GDP deviations. As a result, corrections for the estimated GDP for each pixel in the administrative unit are necessary. The equation for the provincial GDP correction is as follows:
G D P i , j c = G D P i , j G D P t G D P s
where G D P i , j c represents the corrected quarterly GDP of the ith row and jth column pixel; G D P i , j represents the estimated quarterly GDP of the ith row and jth column pixel; GDPt denotes the statistical provincial quarterly GDP of each province; GDPs denotes the sum of estimated GDP of each province.
In order to attain the GDP of prefectures and counties, the top-down model illustrated in Equation (4) is then utilized to downscale the calculated provincial GDP to the pixel level. The GDP of each prefecture and county in Hebei Province can be acquired by summing the GDP of all pixels at the county and prefectural administrative units, respectively.

3.3. Predictive Model for Quarterly GDP at Provincial, Prefectural, and County Levels

GDP is frequently adopted as an indicator to measure the economic status of a country or region, and it is strongly influenced by factors such as economic structure, national policies, and political systems. The nature of the heterogeneity and complexity of economic development across China leads to the usual nonlinear variation in GDP in the same quarter of the same region in different years. Therefore, in this study, the ARIMA model predicts quarterly GDP values for the COVID-19 outbreak period, i.e., 2020 and 2021. The ARIMA model is one of the most commonly used methods of time series analysis, which mainly represents the development pattern of time series data from the perspective of autocorrelation, and it is very straightforward in itself, which is only related to endogenous variables without the help of other exogenous variables. Due to the mature theory associated with it, the ARIMA model has become the classical model in time series analysis and has been widely used in actual enterprise production. The ARIMA model is based on the autoregressive model (AR model) and moving average model (MA model), combined with a difference operation, in order to transform the non-stationary time series into stationary time series from time series data, so as to achieve data interpretation and short-term prediction [47]. This predictive model can be expressed as follows:
y t = K + i = 1 p γ i y t i + ε t + i = 1 q θ i ε t i
where yt and yt-i denote predicted value at time t and t-i, respectively; K is a constant term; γi denotes the ith order autoregressive coefficient; εt denotes the residual term for the whole model; θi denotes the ith-order moving-average coefficient; εt-i denotes the error term of the (ti)th order; p denotes the order number of AR, which is used to obtain the independent variables; and q denotes order number of MA, which is used to smooth the time series data.
The GDP estimated (EGDP) by NTL can be considered very close to the realistic statistical GDP, while the predicted GDP (PGDP) based on time series can be treated as the predicted GDP based on the normal economic development situation. When comparing the GDP derived directly from NTL data with the GDP predicted by a predictive model, if the former is smaller than the latter, it indicates that the region’s GDP has not recovered, and vice versa. In order to quantitatively assess the economic recovery, an equation for expressing the ERI was developed as follows:
E R I = E G D P P G D P E G D P
where ERI denotes the level of economic recovery, and EGDP and PGDP denote estimated quarterly GDP using NTL data and predicted quarterly GDP using the predictive model, respectively. A positive ERI value indicates that the economy has recovered in that quarter, and vice versa.

3.4. Accuracy Assessment Indices

The coefficient of determination (R2) is the proportion of variance in the GDP predicted by the lighting index. The relative error (RE) was derived from the estimated GDP and GDP statistics for each administrative unit to assess the predictive ability of the regression function for GDP [48]. The mean relative error (MRE) was used to measure the overall accuracy of the GDP estimates of the linear regression model for the 31 provinces. The equations for the calculation of these three parameters are as follows:
R = i = 1 n ( T E A N T L I i T E A N T L I ¯ ) ( G D P i c G D P i c ¯ ) i = 1 n ( T E A N T L I i T E A N T L I ¯ ) 2 i = 1 n ( G D P i c G D P i c ¯ ) 2
R E = | G D P i c G D P i t | G D P i t 100 %
M R E = i = 1 n R E i n
where T E A N T L I i , G D P i c , and G D P i t refer to the sum of EANTLI, the corrected, and the statistical quarterly GDP of the ith province, respectively; T E A N T L I ¯ and G D P i c ¯ refer to the average of TEANTLI and corrected quarterly GDP for all provinces, respectively.

4. Results

4.1. Accuracy Assessment

4.1.1. Regression Results and Accuracy of GDP Estimation

During the second quarter (Q2) of 2012 and the fourth quarter (Q4) of 2021, the NPP-VIIRS NTL data corrected by the EANTLI index indicated a significant regression relationship with GDP at a provincial level, in which the maximum, minimum, and average values of R2 were 0.94, 0.78, and 0.89, respectively, as shown in Figure 3. These significant statistical relationships suggest that the EANTLI lighting index is well-suited for GDP estimation.
Figure 4 illustrates the REs of the GDP of the 31 provinces, estimated using the EANTLI lighting index between Q2 2012 and Q4 2021. For the corrected NPP-VIIRS NTL data, the larger REs of GDP appeared in Q1 2013, with the fourth quarter (Q3) 2015 for Shanxi Province and Q3 2021 for Henan Province, which were 10.3%, 6.1%, and 6.1%, respectively, while the REs of GDP for the rest quarters were less than 1.2%. The maximum, minimum, and average values of REs for estimated GDP in Hebei Province were 0.169%, 0.002%, and 0.037% between Q2 2012 and Q4 2021, respectively. In addition, the maximum, minimum, and average MREs for all quarters were 0.43%, 0.04%, and 0.08%, respectively. Therefore, except for a few quarters of estimated GDP in Shanxi and Henan provinces, the accuracy of the provincial GDP simulation results in the remaining quarters being reliable. Especially for Hebei Province, the simulated quarterly GDP can be used for the subsequent analysis of economic recovery. The accuracy of the estimated prefectural and county-level GDP is analyzed in detail in Section 5.2 “Uncertainty Analysis of Results”.

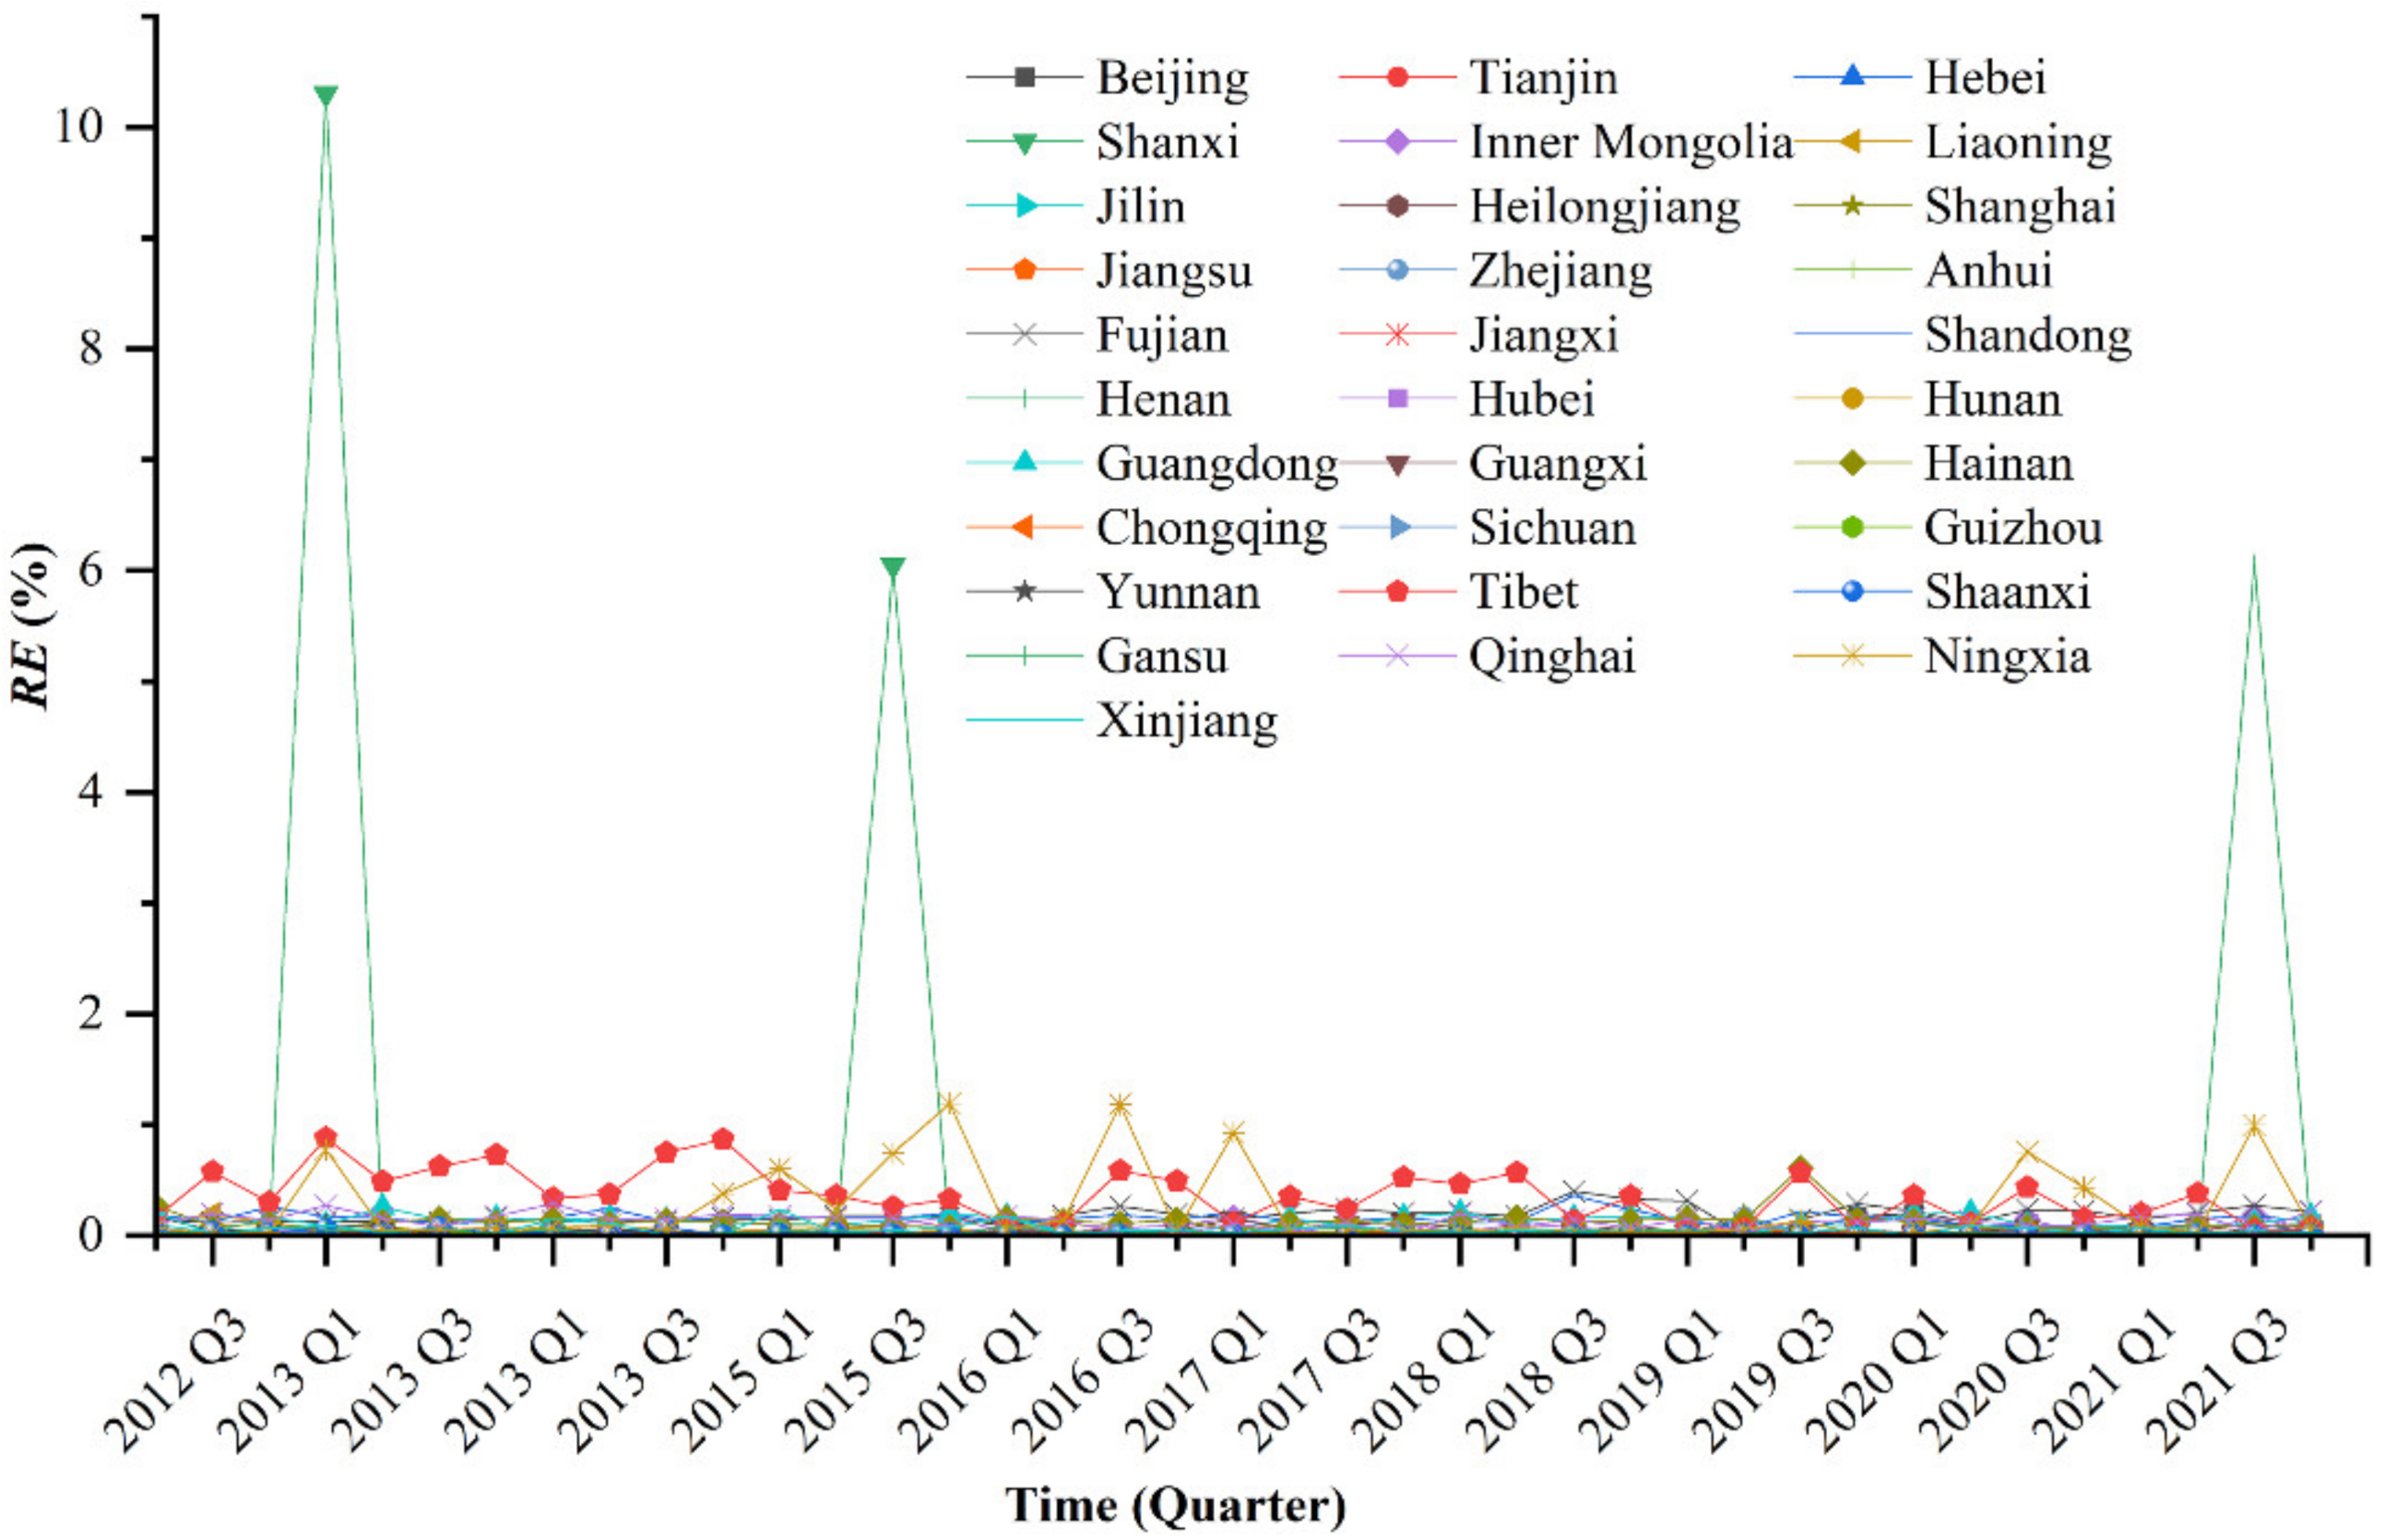
4.1.2. Results of Predictive Model

Using the ARIMA model, the MRE of predicted quarterly GDP in Hebei Province is 4.17%. The MREs of predicted quarterly GDP for Baoding, Cangzhou, Chengde, Handan, Hengshui, Langfang, Qinhuangdao, Shijiazhuang, Tangshan, Xingtai, and Zhangjiakou were 7.82%, 7.16%, 11.54%, 8.56%, 8.09%, 9.42%, 10.76%, 10.44%, 7.33%, 9.81%, and 11.65%, respectively. The MREs of predicted quarterly GDP for 167 county-level cities in Hebei province are shown in Figure 5. There are 151 county-level cities with MREs less than 20%, accounting for 90.42% of all county-level cities, while counties with MREs greater than 25% include Kangbao, Guyuan, Fengning, Chicheng, Shangyi, Zhangbei, and Weichang, all of which are located in the mountainous regions of northern Hebei Province, as shown in Figure 5. Because of the high vegetation coverage in these areas, there is a potential underestimation of GDP calculated by NTL data; therefore, the MREs in these areas are relatively large. The above MREs show that the built predictive model is reliable for predicting quarterly GDP over the entire Hebei province, as well as prefecture-level cities and most county-level cities in Hebei province.

4.2. Economic Recovery Assessment of Hebei Province

COVID-19 has a long incubation period of 14 days, survives for 72 h on different media, completes its evolution by adapting to the surrounding environment, and mutates to become more transmissible and survivable; the number of asymptomatic infections also begins to multiply after infection with this virus, so that humans are not yet able to curb this virus effectively. Although the local government took strict containment measures during the pandemic to clear infected cases at the social level, COVID-19 still emerged repeatedly in Hebei Province between 2020 and 2021, as shown in Table 2, seriously disrupting local production, economic development, and people’s daily lives. The short-term economic analysis of the pandemic does not reflect the level of the economic recovery of the region over time. Consequently, changes in quarterly GDP data for the long time series between 2012 and 2021 were used to assess economic recovery at the provincial, prefectural, and county levels, respectively.

4.2.1. Provincial Economic Recovery

Table 3 shows the estimated GDP, predicted GDP, and their corresponding ERIs in Hebei Province for each quarter of 2020 and 2021. Table 3 reveals that the ERIs for all quarters of 2020 and 2021 in Hebei Province were less than 0, which indicates that the GDP in all quarters of 2020 and 2021 in Hebei Province did not achieve the expected level, due to the impact of the COVID-19 pandemic. The quarterly ERI values showed a gradual increase in 2020, but the ERI suddenly became smaller in Q1 of 2021 and then gradually increased again, indicating that the economy of Hebei province was more affected by the pandemic in Q1, followed by a progressive economic rebound.

4.2.2. Economic Recovery of Prefecture-Level Cities

Based on the ERI values calculated by Equation (7), the economic recovery levels of prefecture-level cities in Hebei province were classified into worst (−0.4 to −0.2), poor (−0.2 to 0.0), good (0.0–0.1), and excellent (0.1–0.3), in which the worst and poor categories indicate that the economy has not recovered, and the good and excellent categories indicate that the economy has recovered. Figure 6 shows the economic recovery levels of prefecture-level cities in Hebei Province in Q1, Q2, Q3, and Q4 of 2020 and 2021, respectively. Figure 6 suggests that the number of cities that failed to recover their GDP in Q1, Q2, Q3, and Q4 of 2020 were 9, 9, 6, and 4, respectively, and the number of cities that failed to recover in Q1, Q2, Q3, and Q4 of 2021 are 3, 5, 3, and 3, respectively. The cities most severely affected by the COVID-19 pandemic during 2020 and 2021 were Shijiazhuang and Cangzhou, which did not recover GDP for eight quarters, followed by Zhangjiakou, Hengshui, Qinhuangdao, Chengde, Baoding, Xingtai, Handan, and Langfang, which did not recover GDP for seven, six, three, three, two, two, two, and one quarters, respectively. From the ERI values, the economic development of Tangshan is stable and not affected by the pandemic. Langfang, Baoding, Xingtai, and Handan were slightly affected by the pandemic and have excellent economic development trends. Although the pandemic affected Chengde and Qinhuangdao, both cities had a positive economic recovery. Shijiazhuang, Cangzhou, and Hengshui have been seriously affected by the pandemic and have not yet fully recovered economically. Overall, under the impact of the pandemic in both 2020 and 2021, the number of prefecture-level cities in Hebei province that did not recover in GDP showed a decreasing trend, and the economy of Hebei province gradually recovered.

4.2.3. Economic Recovery of County-Level Cities

According to the ERI values calculated by Equation (7), the economic recovery level of each district and county in Hebei province is classified into worst (−9.96 to −2.0), poor (−2.0 to 0.0), good (0.0 to 4.0), and excellent (0.40 to 0.92), where the worst and poor categories indicate that the economy has not recovered, and the good and excellent categories indicate that the economy has recovered. Figure 7 shows the economic recovery status in Q1, Q2, Q3, and Q4 of each district and county in Hebei Province in 2020 and 2021. As illustrated in Figure 7, from Q1 to Q4 of 2020, the numbers of districts and counties in Hebei province with no economic recovery were 123, 102, 88, and 34, respectively. From Q1 to Q4 of 2021, the number of districts and counties in Hebei province with no economic recovery were 36, 58, 50, and 40, respectively. From a year-on-year and year-over-year perspective, the number of county-level cities in Hebei Province that had not recovered economically showed a decreasing trend, and the overall economic recovery in 2021 was better than that in 2020. As shown in Table 2 and Figure 7, the presence of COVID-19 cases in Q1 and Q2 of 2020 in Hebei Province had severely impacted local investment and economic development, although the containment measures controlled the transmission and spread of the virus. With the clearance of COVID-19 cases, the economy of Hebei Province gradually recovered after Q3 2020, and by Q4 2020, 79.64% of the county-level cities in Hebei Province had recovered economically. However, in Q1 of 2021, Baoding, Langfang, Shijiazhuang, and Xingtai suffered a relapse of the COVID-19 pandemic, and the number of county-level cities that did not recover economically increased by two, compared with the previous quarter. Compared to Q1 2021, 60 and 50 counties did not achieve economic recovery in Q2 and Q3, respectively. Although the COVID-19 pandemic occurred again in Baoding and Shijiazhuang in Q4 2021, 76.05% of the province’s counties recovered well, due to local governments’ precise prevention and control measures.
Regarding ERI values, Zhengding County in Shijiazhuang showed ERI values less than −2.0 for seven quarters, and the COVID-19 pandemic severely struck its economy. Rongcheng County, Xiong County, Gaobeidian in Baoding City, and Kangbao County in Zhangjiakou City showed ERI values higher than 0.4 for seven, seven, six, and six quarters, respectively, indicating these four county cities had stable economic development, and none of them were affected much by the COVID-19 pandemic.
Based on the number of quarters (0–8) in which the economy of county-level cities in Hebei Province did not recover, the level of impact of COVID-19 on the economy of county-level cities in Hebei Province was classified into no impact (0), low impact (1–2), moderate impact (3–5), and high impact (6–8), as shown in Figure 8. Figure 8 shows that 13 county-level cities were economically unaffected during the COVID-19 pandemic in 2020 and 2021: Qianan in Tangshan City, Longhua County, and Luanping County in Chengde City; Anci District and Yongqing County in Langfang City; Rongcheng County, Dingxing County, and Dingzhou in Baoding City; Jinzhou and Xinle in Shijiazhuang City; Chengan County in Handan City; Kangbao County in Zhangjiakou City; and Xinhe County in Xingtai City. Except for Kangbao, Longhua, Rongcheng, and Xinhe, which are formerly poor counties, Dingxing and Rongcheng, which belong to the Xiongan New Area, are priority zones for investment and construction by the Chinese central government. Yongqing and Cheng’an are moderately developed counties; other cities, such as Qian’an, Anci, Dingzhou, Xinle, and Jinzhou, are developed counties and municipal districts. A total of 72 county-level cities were less economically affected by the COVID-19 pandemic, including 24 former poverty-stricken counties, 5 economically underdeveloped counties, 25 moderately developed counties, and 18 developed counties and municipal districts. A total of 49 counties and cities were moderately affected by the COVID-19 pandemic, mainly in Baoding, Hengshui, Xingtai, Shijiazhuang, and Langfang, including 7 former poverty-stricken counties, 10 economically underdeveloped counties, 19 mid-developed counties, and 13 developed counties and municipal districts. The number of county-level cities with the worst economies affected by the COVID-19 pandemic is 33. These cities included 4 former poverty-stricken counties, such as Fengning and Wuqiang counties, 5 moderately developed counties, such as Anguo and Xianghe, and 14 economically developed port cities and municipal districts, such as Caofeidian and Chang’an districts. In summary, the no-impact, low-impact, moderate-impact, and high-impact counties include both poverty-stricken counties in the mountains and plains and moderately economically developed counties and urban areas. In other words, the impact of the COVID-19 pandemic on the economy of county-level cities is almost non-selective.

5. Discussion

5.1. Relationship between Pandemics and NTL

After the first case of the COVID-19 outbreak was confirmed in Hebei Province on 22 January 2020, all levels of government in Hebei Province adopted strict lockdown measures to stop the further transmission of COVID-19. As shown in Figure 9a, the total radiance of monthly NTL obtained by pixel-by-pixel integration decreased by −1,625,961.432 nW/cm2/Sr in January 2020, compared with December 2019, over the entire Hebei Province, and the NTL levels of commercial centers, parks, schools, industrial parks, and highways were significantly dimmer, while the NTL of residential areas, hospitals, transportation hubs, and highway entrances and exits were significantly brighter. In January 2021, severe outbreaks re-emerged in Shijiazhuang, Baoding, Langfang, and Xingtai in Hebei Province. Although no infections were reported in other cities, the governments at all levels in Hebei Province still adopted more aggressive closure measures to restrict the mobility of people and vehicles and block the extensive spread of the virus. As shown in Figure 9b, the total radiance of monthly NTL obtained by pixel-by-pixel integration decreased by −3,173,491.338 nW/cm2/Sr in January 2021, compared to December 2020, over the entire Hebei Province, with a significant decrease in NTL in cities, towns, and even remote villages. In November 2021, the pandemic reoccurred in Shijiazhuang, Hebei Province. Unlike the previous measures for preventing and controlling the pandemic, this time, the Hebei provincial government adopted graded zoning control measures, so that the social production and daily life of most people did not suffer a significant impact. As shown in Figure 9c, the total radiance of monthly NTL obtained by pixel-by-pixel integration only decreased by −1,572,115.551 nW/cm2/Sr in November 2021, compared with October 2020, over the entire Hebei Province, and the NTL illumination levels of cities and towns appeared to be enhanced.
NTL is strongly tied to human social and economic activities and indicates a city’s economic development [49]. During the COVID-19 pandemic, the closure and home quarantine measures imposed by the government changed the NTL of the city to varying degrees; therefore, the pandemic will indirectly affect the rate of socioeconomic development [26]. As illustrated in Figure 6 and Figure 7, when the number of coronavirus cases is cleared and the lockdown measures are lifted, the economy of the city overall will not recover immediately, although consumption in the city will surge in the short-term; if there is a recurrence of the pandemic, the recovery process of the city’s economy will become even slower. Because of the impact of the pandemic, small- and medium-sized enterprises experienced a reduction in business and a lack of capital reserves, which led to a large number of bankruptcies and job losses, which, in turn, led to a dramatic reduction in social consumption and investment. In addition, regional industries are often so intertwined and connected that the impact of the pandemic can spread through the industrial chain; when an emergency response to the pandemic occurs in one region, it can quickly disrupt other regions. Consequently, the duration of the pandemic’s impact on the urban economy is likely to be medium- to long-term.
Linear regression models between the number of new COVID-19 cases and the sum of monthly NTL within the city in January 2020, February 2020, January 2021, and November 2021 were constructed, respectively, in order to analyze the impact of the COVID-19 pandemic on the urban economy, as shown in Figure 10. In the early stage of the COVID-19 outbreak, prefecture-level cities in Hebei Province implemented various lockdown policies, and the impact of these measures on the urban economy was also different. Therefore, Figure 10a shows a weak correlation between the number of new infected cases and the total monthly NTL. As the spread and infection of COVID-19 continued in cities, the number of infections in cities increased, and governmental lockdown measures rapidly restricted the gathering and movement of people, so NTL in cities can provide a direct indication of the severity of the pandemic. In this case, the number of new infected cases in February 2020 demonstrated a moderate correlation with the total monthly NTL (R2 = 0.613), as shown in Figure 10b. When the COVID-19 pandemic reoccurred in January 2021, only Shijiazhuang and Xingtai reported many infected cases, while the other cities had only one, or even no, cases, in which the lockdown and control measures only had a significant impact on NTL in the pandemic cities, so the number of new infections was not correlated with the total monthly NTL, as shown in Figure 10c,d. Therefore, the number of infected cases during the lockdown period was positively correlated with NTL, whereas the two were not correlated during the reopening period or in the case of a pandemic in a few cities, and our findings are consistent with the result of Meng et al. and Zhang et al. [50,51].

5.2. Uncertainty Analysis of Results

This study employed provincial quarterly GDP data, NPP-VIIRS NTL, and vegetation data to build an estimation model of GDP and estimate prefecture- and city-level GDP through downscaling. Quarterly GDP data can provide a higher temporal resolution for variations in regional economic conditions, and analytical urban economic development is more refined and accurate. The downscaling method can solve the problem of the lack of GDP at the prefectural and county levels, but the accuracy of GDP estimated by this method is subject to further verification of the statistical data. Therefore, we evaluated the degree of mutual agreement between the annual estimated GDP and the statistical GDP, based on the correlation between the two. The determination coefficients of the quadratic polynomial between annual statistical GDP and estimated GDP at the county level in the years from 2013 to 2019 were 0.730, 0.730, 0.779, 0.696, 0.706, 0.725, and 0.708, respectively, as illustrated in Figure 11. Likewise, the determination coefficients of the quadratic polynomial between annual statistical GDP and estimated GDP at the prefectural level from 2013 to 2019 were 0.800, 0.823, 0.793, 0.710, 0.752, 0.829, and 0.887, respectively, as illustrated in Figure 12. Apparently, due to the objective characteristics of the NTL data, the GDP data retrieved by NTL data can reflect the realistic GDP fluctuations at the prefecture- and county-level, which are consistent with Zhao et al. and Shi et al. [46,52].

5.3. Contributions and Practical Implications

The economic losses caused by the pandemic cannot be estimated in the short-term, due to the lack of relevant economic data. This means that actual GDP data are not immediately available to government statistical agencies, and sometimes it takes several years before these data are acquired. For example, the Chinese statistical yearbook data released in the current year usually refers to the statistics of the last year, and the lagging timeliness of these data cannot meet the demand for “near real-time” data under a pandemic context. In the case of unpredictable emergencies, it is clear that traditional statistical tools do not provide a timely indication of the dynamics of human social activity. NTL data offer the potential to track changes in human socioeconomic activity, but this capability has not been fully exploited until now [53]. This study integrates NTL data with traditional statistics to construct an NTL-GDP model and analyzes economic variation over time by tracking quarterly changes of nighttime lighting illumination. The accuracy assessment results demonstrate that NTL data can be used to monitor economic fluctuations under the COVID-19 pandemic. Additionally, the ERI index proposed in this study was applied to assess the extent of economic recovery in Hebei province at the provincial, prefectural, and county scales. The study results suggest that NTL can be used as a valid data source for the reasonable estimation of the economic impact of the COVID-19 pandemic.
Previous studies have focused on pre-pandemic and post-pandemic changes in short-term light intensity to assess economic recovery. However, the recurrence of COVID-19 and the multiple implementations of lockdown measures can lead to dramatic changes in the local economy, and these studies have rarely involved the long-term impact of the pandemic on the economy at the national and regional scales. This study adopted NTL as a data source, introduced a quantitative assessment methodology for economic recovery to model the development of the economy of Hebei province during the COVID-19 pandemic, utilized time series data to reveal the spatial variability of economic recovery and disruptions in various regions of Hebei province, and assessed the enormous impact of the pandemic on prefecture-level cities and county-level cities in Hebei province. The study results fill a critical gap in the socioeconomic recovery statistics of Hebei Province during the COVID-19 pandemic and provide valuable reference information for promoting the economy’s resilience at different stages and in different regions of the province. Furthermore, the findings will provide recommendations and foundations for government policymakers to formulate budget plans, arrange healthcare resources, and adapt to new challenges induced by the pandemic.

5.4. Future Works

The NPP-VIIRS satellite transit time is 1:30 a.m. local time, when the partial illumination of some facilities may be turned off, which leads the NPP-VIIRS NTL image to ignore some crucial urban illumination and, thus, can cause large errors in GDP estimation for cities located in high mountainous areas with dense vegetation cover. Figure 5 shows that the seven county-cities with MREs exceeding 25% of the predicted GDP are all located in the high mountainous regions in the north. Furthermore, population aggregation usually embodies the electricity consumption of the community, and the illumination of NTL generated by social electricity consumption has been demonstrated to be strongly correlated with population density and is widely being used in population estimation from a national to county scale [54,55]. Points of interest (POI) data, a new data type based on location service, contain semantic information that cannot be extracted from satellite images, such as hospitals, hotels, residential areas, and railway stations [56]. The POI data not only reveal different human activity situations under the COVID-19 pandemic, but also compensate for the deficiency of NTL detection by NPP-VIIRS in the early morning. As such, in future research, multi-source auxiliary data, such as population, POI, vegetation, and water bodies, need to be incorporated with NTL to improve the accuracy of GDP estimation.

6. Conclusions

To quantify the economic response to the COVID-19 pandemic in Hebei Province, we proposed a method to apply NTL and vegetation data to estimate quarterly GDP at the prefectural and county levels. We assessed the extent of economic recovery in Hebei Province in 2020 and 2021, following the predictive models of GDP. This study investigated the spatial variation and temporal dynamics of economic activities in Hebei Province in 2020 and 2021 under the impact of the pandemic and concluded the following.
(1)
At the provincial level, the economy of Hebei province suffered declines in all quarters of 2020 and 2021, but showed a progressive recovery trend. At the prefectural scale, the economy of prefecture-level cities in Hebei province showed large economic fluctuations and a slow recovery process in the affected areas. By the end of 2021, the economies of all prefecture-level cities had recovered, except for Shijiazhuang, Cangzhou, Zhangjiakou, and Hengshui. At the county-level scale, the COVID-19 pandemic caused dramatic economic disturbances for county-level cities in Hebei Province. Although the economies of the county-level cities are recovering rapidly, the economies of 40 county-level cities have not yet recovered.
(2)
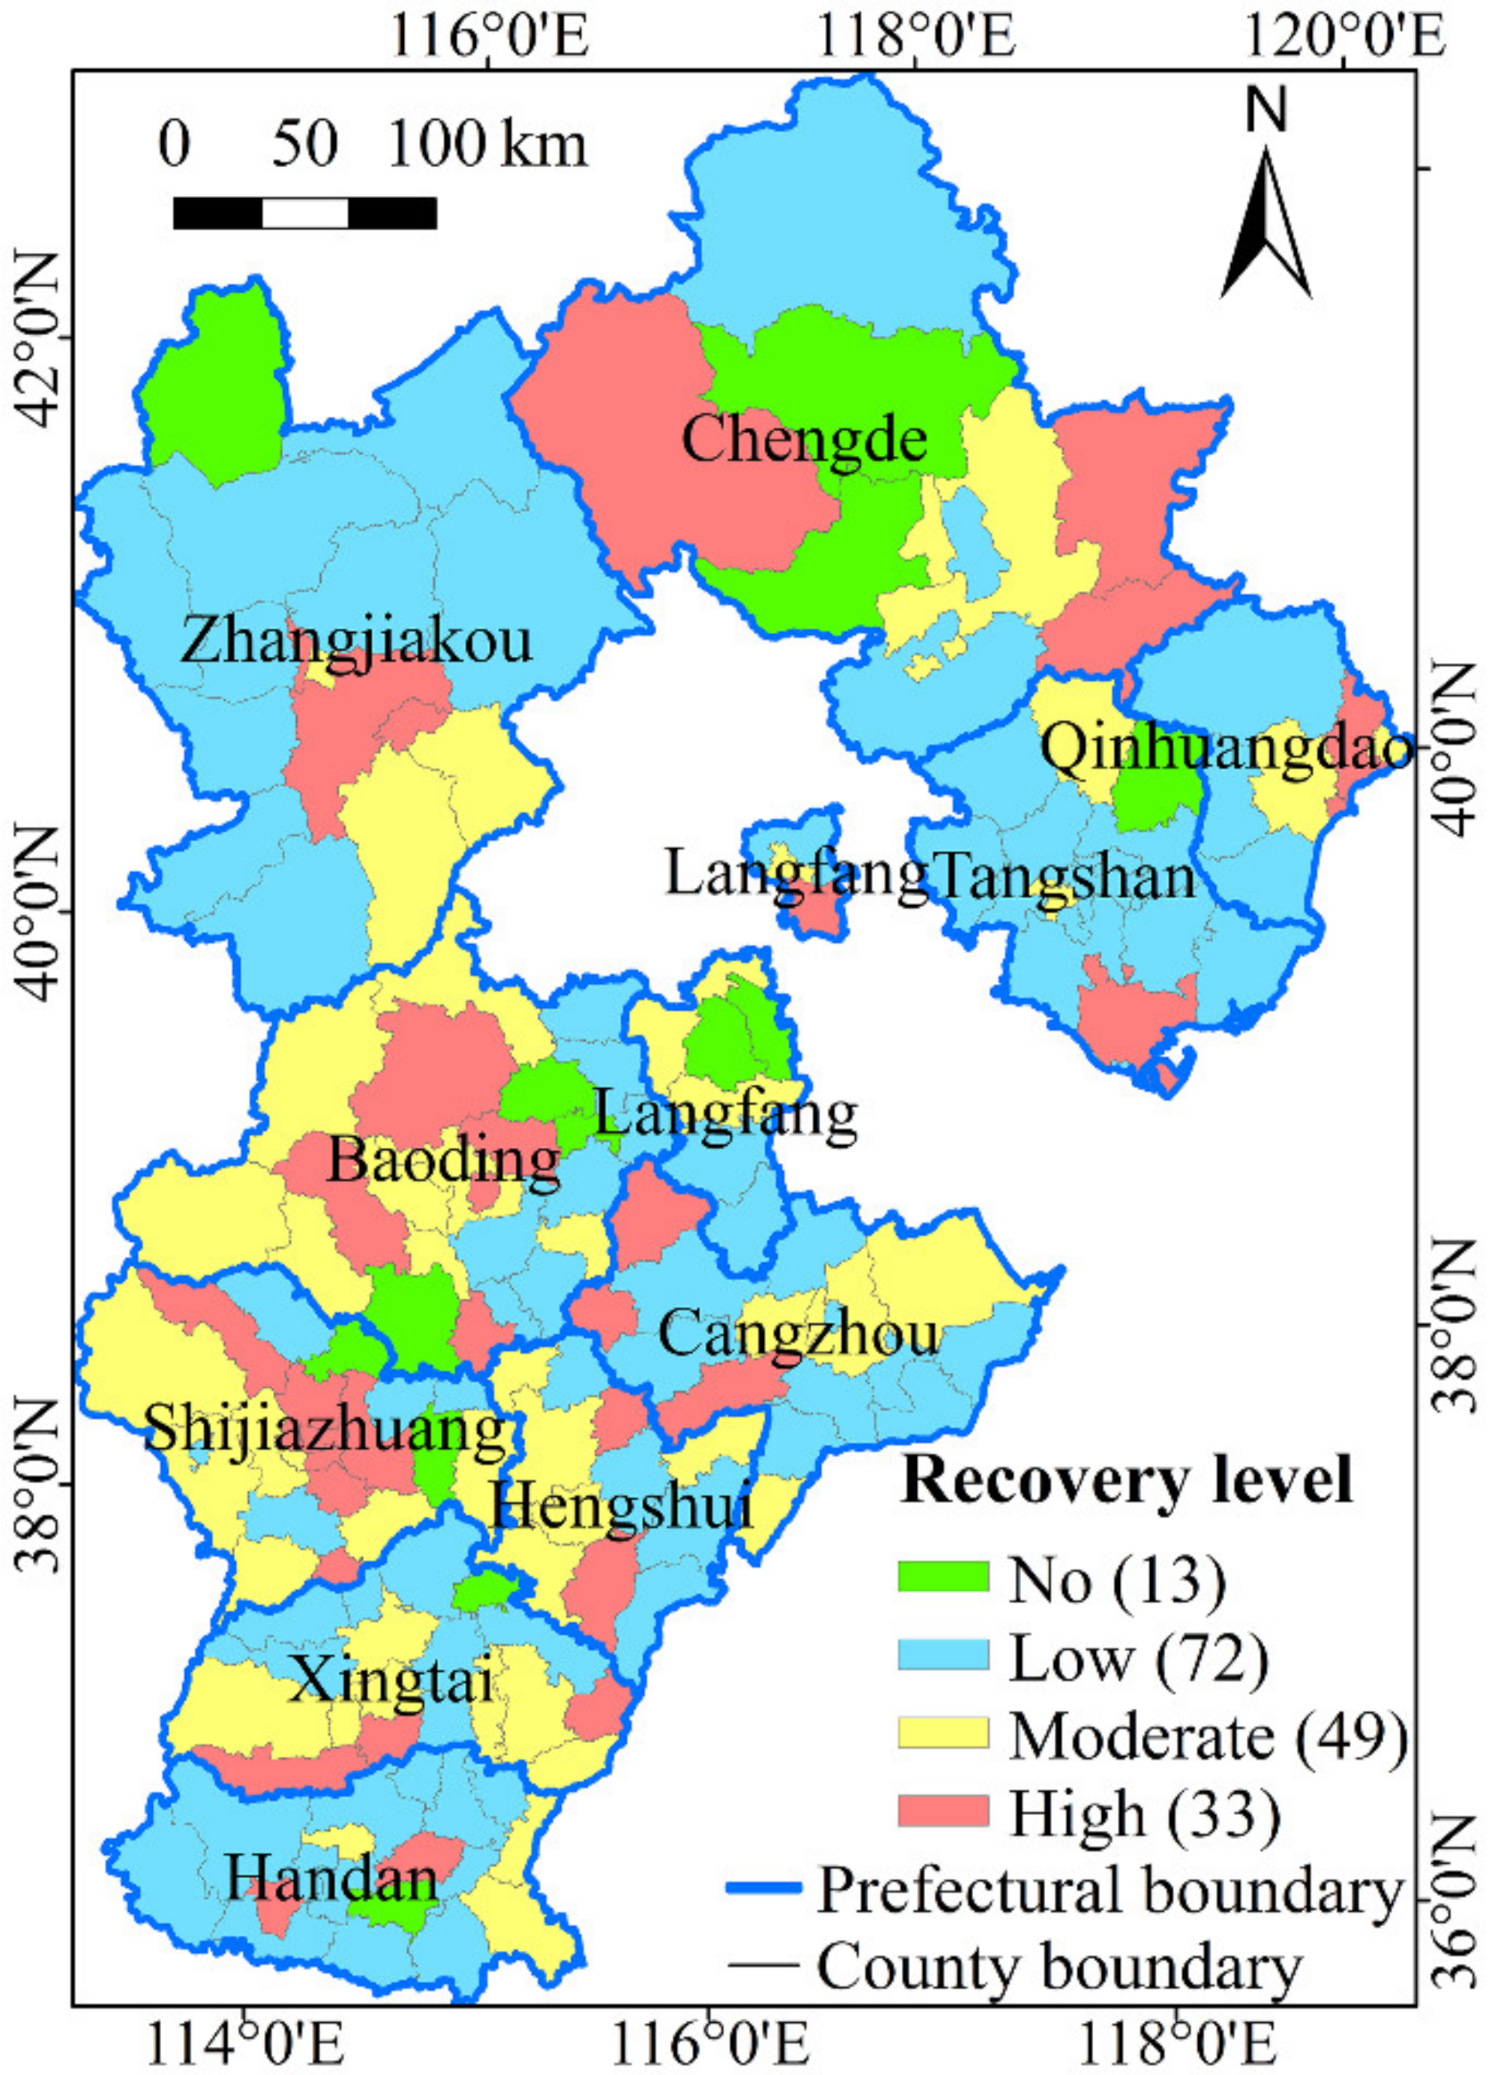
Overall, the economies of 49.1% of county-level cities in Hebei province were affected by the COVID-19 pandemic lockdown policy during 2020 and 2021. The unaffected, low-impact, moderate-impact, and high-impact areas all contain economically undeveloped, moderately developed, and developed county-level cities, indicating that the impact of the COVID-19 pandemic on the economy of Hebei Province is non-discriminatory.
(3)
During the initial and mid-term phases of the COVID-19 outbreak, the number of new infections correlates positively with the total monthly NTL of the city. In contrast, during the later phases of the outbreak, or under conditions where only a few cities suffered from the pandemic, the number of new infections did not correlate with the total monthly NTL of the city.

Author Contributions

F.L. and S.L. designed this experiment and arranged the structure of this manuscript; J.L. and W.H. calibrated the nighttime light data, developed predictive models for GDP and validated the results; M.Z. and F.L. analyzed and evaluated the economic recovery of Hebei Province; F.L. wrote this manuscript based on these findings. All authors have read and agreed to the published version of the manuscript.

Funding

This research was funded by the Fundamental Research Funds for the Central Universities of China (ZY20180101), and the Hebei Key Laboratory of Earthquake Disaster Prevention and Risk Assessment (FZ213109).

Data Availability Statement

The monthly composite NPP-VIIRS NTL data used in this study are available for download from the Earth Observation Group of the Colorado School of Mines at https://eogdata.mines.edu/nighttime_light/monthly/v10/, accessed on 16 December 2022. MOD 13A1 V6 products are available at https://ladsweb.modaps.eosdis.nasa.gov/search/, accessed on 16 December 2022. China’s provincial quarterly GDP statistics are available at https://data.stats.gov.cn/easyquery.htm?cn=E0102, accessed on 16 December 2022.

Acknowledgments

We would like to thank the Earth Observations Group for providing free monthly NPP-VIIRS cloud-free nighttime light data for this study.

Conflicts of Interest

The authors declare no conflict of interest.

References

  1. WHO Coronavirus (COVID-19) Dashboard. Available online: https://covid19.who.int/ (accessed on 14 August 2022).
  2. International Monetary Fund. World Economic Outlook: War Sets Back the Global Recovery; International Monetary Fund: Washington, DC, USA, 2022. [Google Scholar]
  3. Li, F.; Liu, X.; Liao, S.; Jia, P. The Modified Normalized Urban Area Composite Index: A Satelliate-Derived High-Resolution Index for Extracting Urban Areas. Remote Sens. 2021, 13, 2350. [Google Scholar] [CrossRef]
  4. Luqman, M.; Rayner, P.J.; Gurney, K.R. Combining Measurements of Built-up Area, Nighttime Light, and Travel Time Distance for Detecting Changes in Urban Boundaries: Introducing the BUNTUS Algorithm. Remote Sens. 2019, 11, 2969. [Google Scholar] [CrossRef] [Green Version]
  5. Zhang, E.; Feng, H.; Peng, S. Measurement of Urban Expansion and Spatial Correlation of Central Yunnan Urban Agglomeration Using Nighttime Light Data. Math. Probl. Eng. 2021, 2021, 8898468. [Google Scholar] [CrossRef]
  6. Alahmadi, M.; Mansour, S.; Martin, D.J.; Atkinson, P.M. An Improved Index for Urban Population Distribution Mapping Based on Nighttime Lights (DMSP-OLS) Data: An Experiment in Riyadh Province, Saudi Arabia. Remote Sens. 2021, 13, 1171. [Google Scholar] [CrossRef]
  7. Chen, X. Nighttime Lights and Population Migration: Revisiting Classic Demographic Perspectives with an Analysis of Recent European Data. Remote Sens. 2020, 12, 169. [Google Scholar] [CrossRef] [Green Version]
  8. Cheng, L.; Feng, R.; Wang, L.; Yan, J.; Liang, D. An Assessment of Electric Power Consumption Using Random Forest and Transferable Deep Model with Multi-Source Data. Remote Sens. 2022, 14, 1469. [Google Scholar] [CrossRef]
  9. Sun, Y.; Wang, S.; Zhang, X.; Chan, T.O.; Wu, W. Estimating Local-Scale Domestic Electricity Energy Consumption Using Demographic, Nighttime Light Imagery and Twitter Data. Energy 2021, 226, 120351. [Google Scholar] [CrossRef]
  10. Jasinski, T. Modeling Electricity Consumption Using Nighttime Light Images and Artificial Neural Networks. Energy 2019, 179, 831–842. [Google Scholar] [CrossRef]
  11. Chen, J.; Gao, M.-Z.A.; Cheng, S.; Liu, X.; Hou, W.; Song, M.; Li, D.; Fan, W. China’s City-Level Carbon Emissions during 1992–2017 Based on the Inter-Calibration of Nighttime Light Data. Sci. Rep. 2021, 11, 3323. [Google Scholar] [CrossRef]
  12. Shi, K.; Chen, Z.; Cui, Y.; Wu, J.; Yu, B. NPP-VIIRS Nighttime Light Data Have Different Correlated Relationships with Fossil Fuel Combustion Carbon Emissions from Different Sectors. IEEE Geosci. Remote Sens. Lett. 2021, 18, 2062–2066. [Google Scholar] [CrossRef]
  13. Li, C.; Yang, W.; Tang, Q.; Tang, X.; Lei, J.; Wu, M.; Qiu, S.Y. Detection of Multidimensional Poverty Using Luojia 1-01 Nighttime Light Imagery. J. Indian Soc. Remote 2020, 48, 963–977. [Google Scholar] [CrossRef]
  14. Yu, B.; Shi, K.; Hu, Y.; Huang, C.-H.; Chen, Z.; Wu, J. Poverty Evaluation Using NPP-VIIRS Nighttime Light Composite Data at the County Level in China. IEEE J.-STARS 2015, 8, 1217–1229. [Google Scholar] [CrossRef]
  15. Shen, D.; Zhou, L.; Wang, P. Identification of Poverty Based on Nighttime Light Remote Sensing Data: A Case Study on Contiguous Special Poverty-Stricken Areas in Liupan Mountains. Remote Sens. Nat. Res. 2019, 31, 157–163. [Google Scholar]
  16. Yong, Z.; Li, K.; Xiong, J.; Cheng, W.; Wang, Z.; Sun, H.; Ye, C. Integrating DMSP-OLS and NPP-VIIRS Nighttime Light Data to Evaluate Poverty in Southwestern China. Remote Sens. 2022, 14, 600. [Google Scholar] [CrossRef]
  17. Li, X.; Zhan, C.; Tao, J.; Li, L. Long-Term Monitoring of the Impacts of Disaster on Human Activity Using DMSP/OLS Nighttime Light Data: A Case Study of the 2008 Wenchuan, China Earthquake. Remote Sens. 2018, 10, 588. [Google Scholar] [CrossRef] [Green Version]
  18. Liu, Z.; Du, Y.; Yi, J.; Liang, F.; Ma, T.; Pei, T. Quantitative Association between Nighttime Lights and Geo-Tagged Human Activity Dynamics during Typhoon Mangkhut. Remote Sens. 2019, 11, 2091. [Google Scholar] [CrossRef] [Green Version]
  19. Liu, Z.; Zhang, J.; Li, X.; Chen, X. Long-Term Resilience Curve Analysis of Wenchuan Earthquake-Affected Counties Using DMSP-OLS Nighttime Light Images. IEEE J.-STARS 2021, 14, 10854–10874. [Google Scholar] [CrossRef]
  20. Elvidge, C.D.; Ghosh, T.; Hsu, F.-C.; Zhizhin, M.; Bazilian, M. The Dimming of Lights in China during the COVID-19 Pandemic. Remote Sens. 2020, 12, 2851. [Google Scholar] [CrossRef]
  21. Ghosh, T.; Elvidge, C.D.; Hsu, F.-C.; Zhizhin, M.; Bazilian, M. The Dimming of Lights in India during the COVID-19 Pandemic. Remote Sens. 2020, 12, 3289. [Google Scholar] [CrossRef]
  22. Liu, Q.; Sha, D.; Liu, W.; Houser, P.; Zhang, L.; Hou, R.; Lan, H.; Flynn, C.; Lu, M.; Hu, T.; et al. Spatiotemporal Patterns of COVID-19 Impact on Human Activities and Environment in Mainland China Using Nighttime Light and Air Quality Data. Remote Sens. 2020, 12, 1576. [Google Scholar] [CrossRef]
  23. Roberts, M. Tracking Economic Activity in Response to the COVID-19 Crisis Using Nighttime Lights—The Case of Morocco. Dev. Eng. 2021, 6, 100067. [Google Scholar] [CrossRef] [PubMed]
  24. Xu, G.; Xiu, T.; Li, X.; Liang, X.; Jiao, L. Lockdown Induced Night-time Light Dynamics during the COVID-19 Epidemic in Global Megacities. Int. J. Appl. Earth Obs. 2021, 102, 102421. [Google Scholar] [CrossRef] [PubMed]
  25. Shao, Z.; Tang, Y.; Huang, X.; Li, D.R. Monitoring Work Resumption of Wuhan in the COVID-19 Epidemic Using Daily Nighttime Light. Photogramm. Eng. Remote Sens. 2021, 87, 197–206. [Google Scholar] [CrossRef]
  26. Lan, T.; Shao, G.; Tang, L.; Xu, Z.; Zhu, W.; Liu, L. Quantifying Spatiotemporal Changes in Human Activities Induced by COVID-19 Pandemic Using Daily Nighttime Light Data. IEEE J.-STARS 2021, 14, 2740–2753. [Google Scholar] [CrossRef]
  27. Yin, R.; He, G.-J.; Jiang, W.; Peng, Y.; Zhang, Z.-m.; Li, M.; Gong, C. Night-Time Light Imagery Reveals China’s City Activity during the COVID-19 Pandemic Period in Early 2020. IEEE J.-STARS 2021, 14, 5111–5122. [Google Scholar] [CrossRef]
  28. Beyer, R.C.M.; Franco-Bedoya, S.; Galdo, G. Examining the Economic Impact of COVID-19 in India through Daily Electricity Consumption and Nighttime Light Intensity. World Dev. 2021, 140, 105287. [Google Scholar] [CrossRef]
  29. Anand, A.; Kim, D.H. Pandemic Induced Changes in Economic Activity around African Protected Areas Captured through Night-Time Light Data. Remote Sens. 2021, 13, 314. [Google Scholar] [CrossRef]
  30. Alahmadi, M.; Mansour, S.; Dasgupta, N.; Abulibdeh, A.O.; Atkinson, P.M.; Martin, D. Using Daily Nighttime Lights to Monitor Spatiotemporal Patterns of Human Lifestyle under COVID-19: The Case of Saudi Arabia. Remote Sens. 2021, 13, 4633. [Google Scholar] [CrossRef]
  31. Wu, M.; Ye, H.; Niu, Z.; Huang, W.; Hao, P.; Li, W.; Yu, B. Operation Status Comparison Monitoring of China s Southeast Asian Industrial Parks before and after COVID-19 Using Nighttime Lights Data. ISPRS Int. J. Geo-Inf. 2022, 11, 122. [Google Scholar] [CrossRef]
  32. Tian, S.; Feng, R.; Zhao, J.; Wang, L. An Analysis of the Work Resumption in China under the COVID-19 Epidemic Based on Night Time Lights Data. ISPRS Int. J. Geo-Inf. 2021, 10, 614. [Google Scholar] [CrossRef]
  33. Overview of Hebei. Available online: http://www.hebei.gov.cn/hebei/14462058/14462085/14471224/index.html (accessed on 25 April 2022).
  34. EOG Nighttime Light. Available online: https://eogdata.mines.edu/nighttime_light/monthly/v10/ (accessed on 6 December 2022).
  35. Li, F.; Wang, Q.; Hu, W.; Liu, J.; Zhang, X. Rapid Assessment of Disaster Damage and Economic Resilience in Relation to the Flooding in Zhengzhou, China in 2021. Remote Sens. Lett. 2022, 13, 651–662. [Google Scholar] [CrossRef]
  36. Liu, L.; Li, Z.; Fu, X.; Liu, X.; Li, Z.; Zheng, W. Impact of Power on Uneven Development: Evaluating Built-Up Area Changes in Chengdu Based on NPP-VIIRS Images (2015–2019). Land 2022, 11, 489. [Google Scholar] [CrossRef]
  37. Elvidge, C.D.; Baugh, K.E.; Zhizhin, M.N.; Hsu, F.-C.; Ghosh, T. VIIRS Night-Time Lights. Int. J. Remote Sens. 2017, 38, 5860–5879. [Google Scholar] [CrossRef] [Green Version]
  38. Level-1 and Atmosphere Archive & Distribution System Distributed Active Archive Center. Available online: https://ladsweb.modaps.eosdis.nasa.gov/search/ (accessed on 6 December 2022).
  39. MODIS Vegetation Index User’s Guide. Available online: https://measures.arizona.edu/documents/MODIS/MODIS_VI_UsersGuide_09_18_2019_C61.pdf (accessed on 6 December 2022).
  40. Quarterly Data for Sub-Provincial Statistics. Available online: https://data.stats.gov.cn/easyquery.htm?cn=E0102 (accessed on 6 December 2022).
  41. Provincial Dynamics. Available online: http://wsjkw.hebei.gov.cn/sjdt/index.jhtml (accessed on 6 December 2022).
  42. 1:250,000 National Basic Geographic Database. Available online: https://www.webmap.cn/commres.do?method=result25W (accessed on 6 December 2022).
  43. Zhang, P.; Pan, J.; Xie, L.; Zhou, T.; Bai, H.; Zhu, Y. Spatial-Temporal Evolution and Regional Differentiation Features of Urbanization in China from 2003 to 2013. ISPRS Int. J. Geo-Inf. 2019, 8, 31. [Google Scholar] [CrossRef] [Green Version]
  44. Zhuo, L. An EVI-Based Method to Reduce Saturation of DMSP/OLS Nighttime Light Data. Int. J. Remote Sens. 2015, 36, 4114–4130. [Google Scholar] [CrossRef]
  45. Ji, X.; Li, X.; He, Y.; Liu, X. A Simple Method to Improve Estimates of County-Level Economics in China Using Nighttime Light Data and GDP Growth Rate. ISPRS Int. J. Geo-Inf. 2019, 8, 419. [Google Scholar] [CrossRef] [Green Version]
  46. Zhao, M.; Cheng, W.; Zhou, C.; Li, M.; Wang, N.; Liu, Q. GDP Spatialization and Economic Differences in South China Based on NPP-VIIRS Nighttime Light Imagery. Remote Sens. 2017, 9, 673. [Google Scholar] [CrossRef] [Green Version]
  47. Zhu, Y.; Wang, Y.; Liu, T.; Sui, Q. Assessing Macroeconomic Recovery after a Natural Hazard Based on ARIMA—A Case Study of the 2008 Wenchuan Earthquake in China. Nat. Hazards 2018, 91, 1025–1038. [Google Scholar] [CrossRef]
  48. Dai, Z.; Hu, Y.; Zhao, G. The Suitability of Different Nighttime Light Data for GDP Estimation at Different Spatial Scales and Regional Levels. Sustainability 2017, 9, 305. [Google Scholar] [CrossRef] [Green Version]
  49. Gu, Y.; Shao, Z.; Huang, X.; Cai, B. GDP Forecasting Model for China’s Provinces Using Nighttime Light Remote Sensing Data. Remote Sens. 2022, 14, 3671. [Google Scholar] [CrossRef]
  50. Meng, Y.; Zhu, V.; Zhu, Y. Co-Distribution of Light At Night (LAN) and COVID-19 Incidence in the United States. BMC Public Health 2021, 21, 1509. [Google Scholar] [CrossRef] [PubMed]
  51. Zhang, Y.; Peng, N.; Yang, S.; Jia, P. Associations between Nighttime Light and COVID-19 Incidence and Mortality in the United States. Int. J. Appl. Earth Obs. 2022, 112, 102855. [Google Scholar] [CrossRef] [PubMed]
  52. Shi, K.; Wu, Y.; Li, D.; Li, X. Population, GDP, and Carbon Emissions as Revealed by SNPP-VIIRS Nighttime Light Data in China with Different Scales. IEEE Geosci. Remote Sens. Lett. 2022, 19, 1–5. [Google Scholar] [CrossRef]
  53. Stokes, E.C.; Román, M.O. Tracking COVID-19 Urban Activity Changes in the Middle East from Nighttime Lights. Sci. Rep. 2022, 12, 8096. [Google Scholar] [CrossRef] [PubMed]
  54. Wu, B.; Yang, C.; Wu, Q.; Wang, C.; Wu, J.; Yu, B. A Building Volume Adjusted Nighttime Light Index for Characterizing the Relationship between Urban Population and Nighttime Light Intensity. Comput. Environ. Urban 2023, 99, 101911. [Google Scholar] [CrossRef]
  55. Liu, P.; Wang, Q.; Zhang, D.; Lu, Y. An Improved Correction Method of Nighttime Light Data Based on EVI and WorldPop Data. Remote Sens. 2020, 12, 3988. [Google Scholar] [CrossRef]
  56. Zhang, Q.; Zheng, Z.; Wu, Z.; Cao, Z.; Luo, R. Using Multi-Source Geospatial Information to Reduce the Saturation Problem of DMSP/OLS Nighttime Light Data. Remote Sens. 2022, 14, 3264. [Google Scholar] [CrossRef]
Figure 1. Location map of the study site.
Remotesensing 15 00022 g001
Figure 2. Schematic diagram for assessing the economic recovery of Hebei Province under the impact of the COVID-19 pandemic.
Remotesensing 15 00022 g002
Figure 3. Coefficients of determination (R2) of the linear regression between the nighttime lighting index EANTLI and quarterly GDP for the 31 provinces from the 2nd quarter (Q2) of 2012 to the 4th quarter (Q4) of 2021.
Remotesensing 15 00022 g003
Figure 4. Relative errors (REs) of estimated GDP for 31 Chinese provinces from the 2nd quarter (Q2) of 2012 to the 4th quarter (Q4) of 2021.
Remotesensing 15 00022 g004
Figure 5. The MREs of predicted quarterly GDP for 167 county-level cities in Hebei province.
Remotesensing 15 00022 g005
Figure 6. The levels of the economic recovery of prefecture-level cities in Hebei Province in Q1 (a), Q2 (b), Q3 (c), and Q4 (d) of 2020, and the levels of the economic recovery of prefecture-level cities in Hebei Province in Q1 (e), Q2 (f), Q3 (g), and Q4 (h) of 2021.
Remotesensing 15 00022 g006
Figure 7. Economic recovery status of county-level cities in Hebei Province in Q1 (a), Q2 (b), Q3 (c), and Q4 (d) of 2020; and economic recovery status of county-level cities in Hebei Province in Q1 (e), Q2 (f), Q3 (g), and Q4 (h) of 2021.
Remotesensing 15 00022 g007
Figure 8. Spatial distribution map of the economic impact of the pandemic on county-level cities in Hebei Province during 2020 and 2021.
Remotesensing 15 00022 g008
Figure 9. The pixel-by-pixel radiance difference maps of monthly NTL for (a) January 2020 vs. December 2019, (b) January 2021 vs. December 2020, and (c) November 2021 vs. October 2021 over the entire Hebei province.
Remotesensing 15 00022 g009
Figure 10. Relationships between total monthly NTL and new COVID-19 cases in prefecture-level cities in Hebei Province (a) in January 2020, (b) in February 2020, (c) in January 2021, and (d) in November 2021.
Remotesensing 15 00022 g010
Figure 11. Correlations between annual statistical GDP and estimated GDP at the county scale for 2013 (a), 2014 (b), 2015 (c), 2016 (d), 2017 (e), 2018 (f), and 2019 (g).
Remotesensing 15 00022 g011
Figure 12. Correlations between annual statistical GDP and estimated GDP at the prefectural scale for 2013 (a), 2014 (b), 2015 (c), 2016 (d), 2017 (e), 2018 (f), and 2019 (g).
Remotesensing 15 00022 g012
Table 1. Introduction of data sources.
DataData DescriptionYearSource
NPP-VIIRSVersion 1 NPP-VIIRS monthly vcmsl NTL dataApril 2012–December 2021Earth observation group
MOD13A1Version 6 16-day EVI and 16-day pixel reliability index data2012–2021Atmosphere Archive and Distribution System and Distributed Active Archive Center
GDP statisticsQuarterly GDP statistics for 31 Chinese provinces2012–2021National Bureau of Statistics of China
Administrative boundariesAdministrative boundaries for 11 prefecture-level cities and 167 county-level cities in Hebei Province, and 31 provinces in China2015National Catalogue Service for Geographic Information
Table 2. Quarterly new COVID-19 cases in prefecture-level cities in Hebei Province from 2020 to 2021.
Prefecture2020 Q12020 Q22020 Q32020 Q42021 Q12021 Q22021 Q32021 Q4
Baoding32600110015
Cangzhou481000000
Chengde10000000
Handan320000000
Hengshui80000000
Langfang302001000
Qinhuangdao100000000
Shijiazhuang2900089600136
Tangshan580000000
Xingtai2300071002
Zhangjiakou412000000
Table 3. Estimated GDP, predicted GDP, and corresponding economic recovery intensity (ERI) in Hebei Province for each quarter of 2020 and 2021.
Quarter2020GDP2021GDP
EstimatedPredictiveERIEstimatedPredictiveERI
Q17410.138839.48−0.198750.489953.40−0.14
Q28977.129707.87−0.089988.8610821.79−0.08
Q39417.1210049.21−0.0710321.4011163.13−0.08
Q410402.5210963.64−0.0511330.5312077.56−0.07
Disclaimer/Publisher’s Note: The statements, opinions and data contained in all publications are solely those of the individual author(s) and contributor(s) and not of MDPI and/or the editor(s). MDPI and/or the editor(s) disclaim responsibility for any injury to people or property resulting from any ideas, methods, instructions or products referred to in the content.

