
Complementarity Characteristics of Actual and Potential Evapotranspiration and Spatiotemporal Changes in Evapotranspiration Drought Index over Ningxia in the Upper Reaches of the Yellow River in China
 ,
,
Abstract
:1. Introduction
- (1).
- revealing the complementary relationship between AET and PET;
- (2).
- analyzing the internal relation between drought and ET by putting forward the physical significance and model of ET drought index (EDI), quantifying the degree of drought by using EDI and verifying the validity of EDI;
- (3).
- analyzing the variation trends of annual and monthly EDI and the influencing factors.
2. Materials and Methods
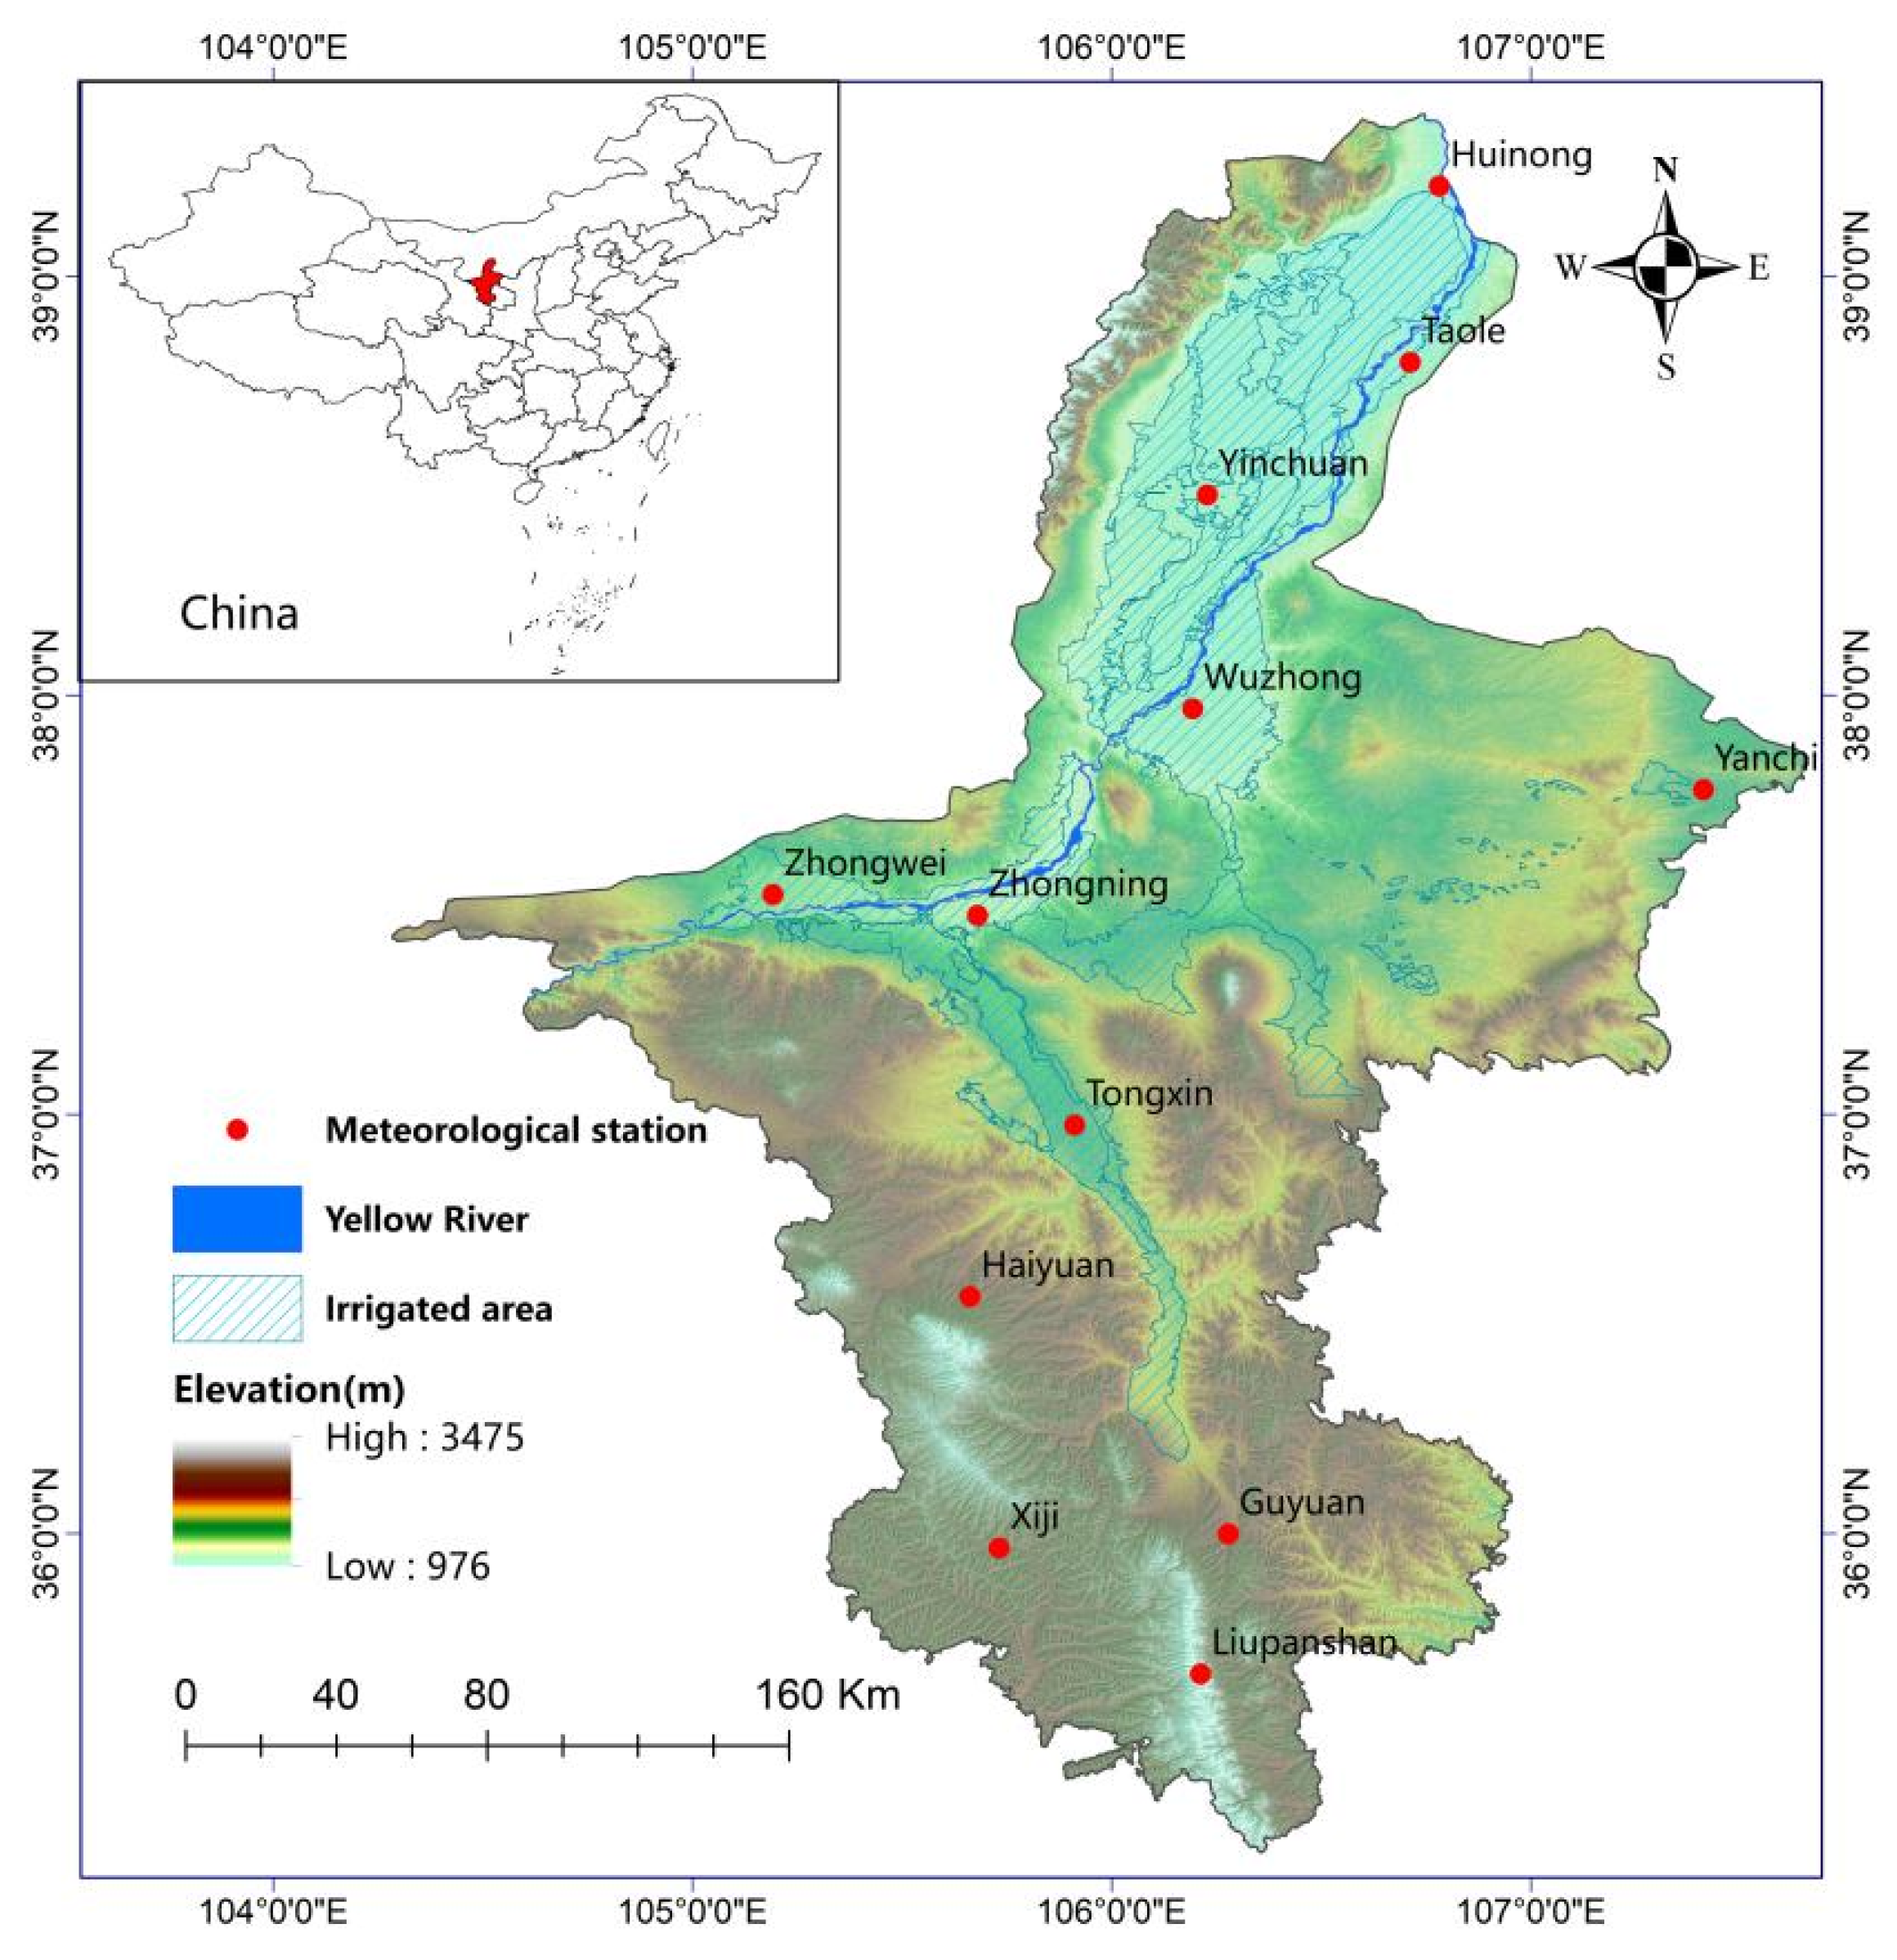
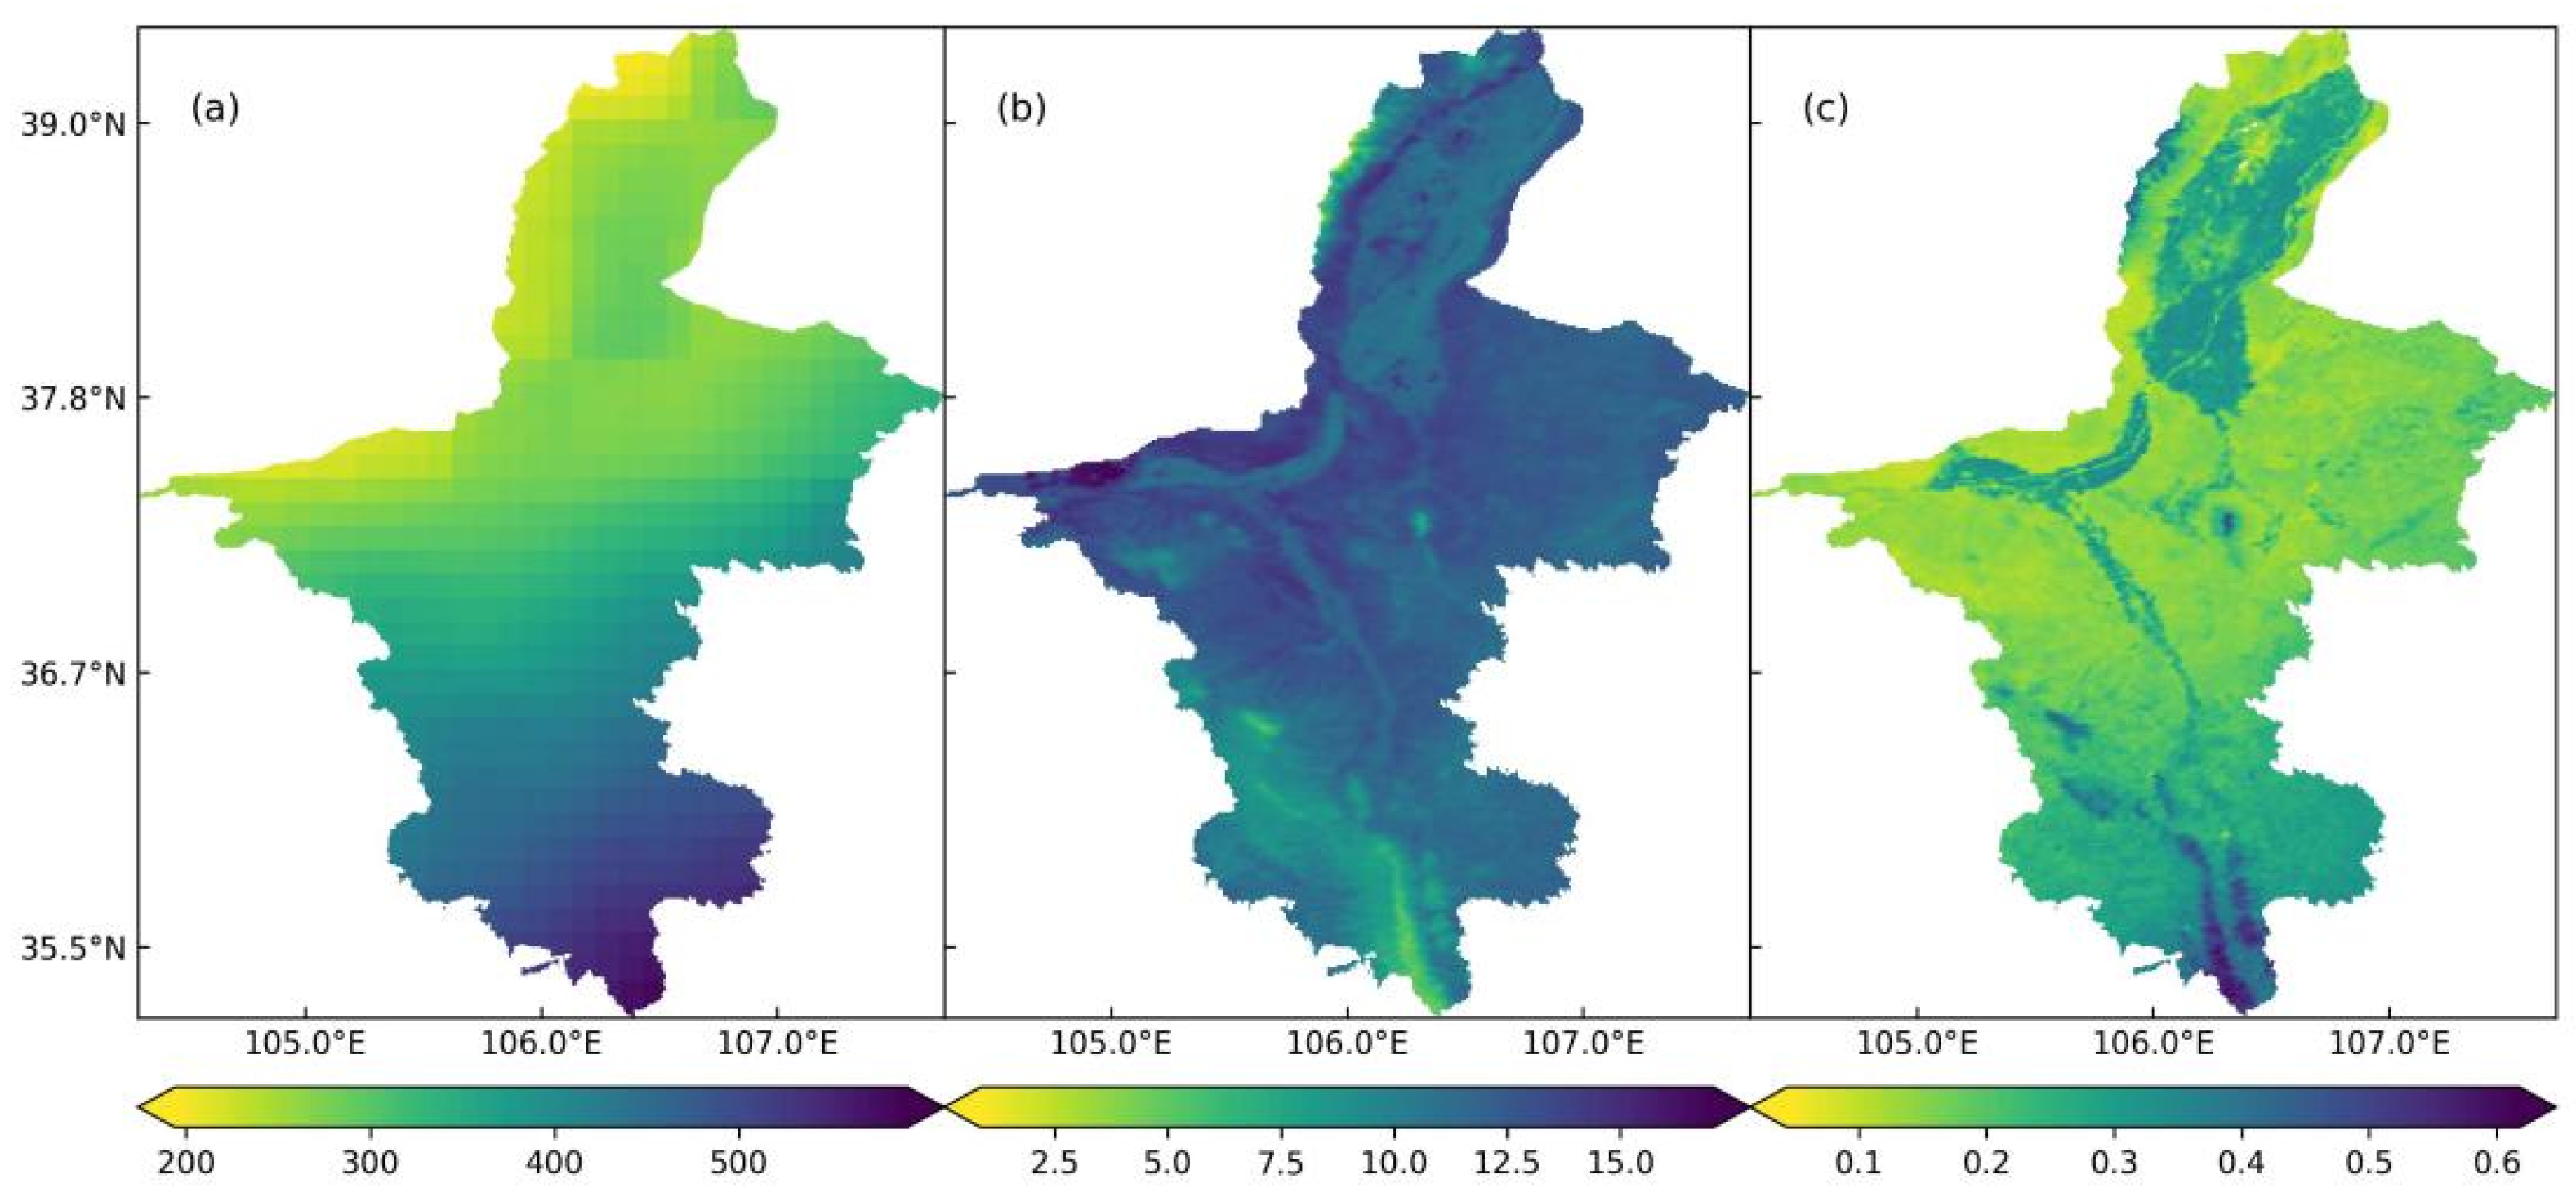
2.1. Study Area
2.2. Materials
2.2.1. MODIS ET Product
2.2.2. MODIS Vegetation Index Product
2.2.3. MODIS Land Surface Temperature Product
2.2.4. Integrated Multi-satellite Retrievals for Global Precipitation Measurement (GPM)
2.2.5. ASTER Global Digital Elevation Model
2.2.6. Meteorological Station Observation Data
2.2.7. Area Data of the Yellow River Irrigated
2.3. Methodology
2.3.1. Theil–Sen Median Trend Analysis and Mann–Kendall Test
2.3.2. ET Complementarity Theory
2.3.3. Proposal of EDI
3. Results
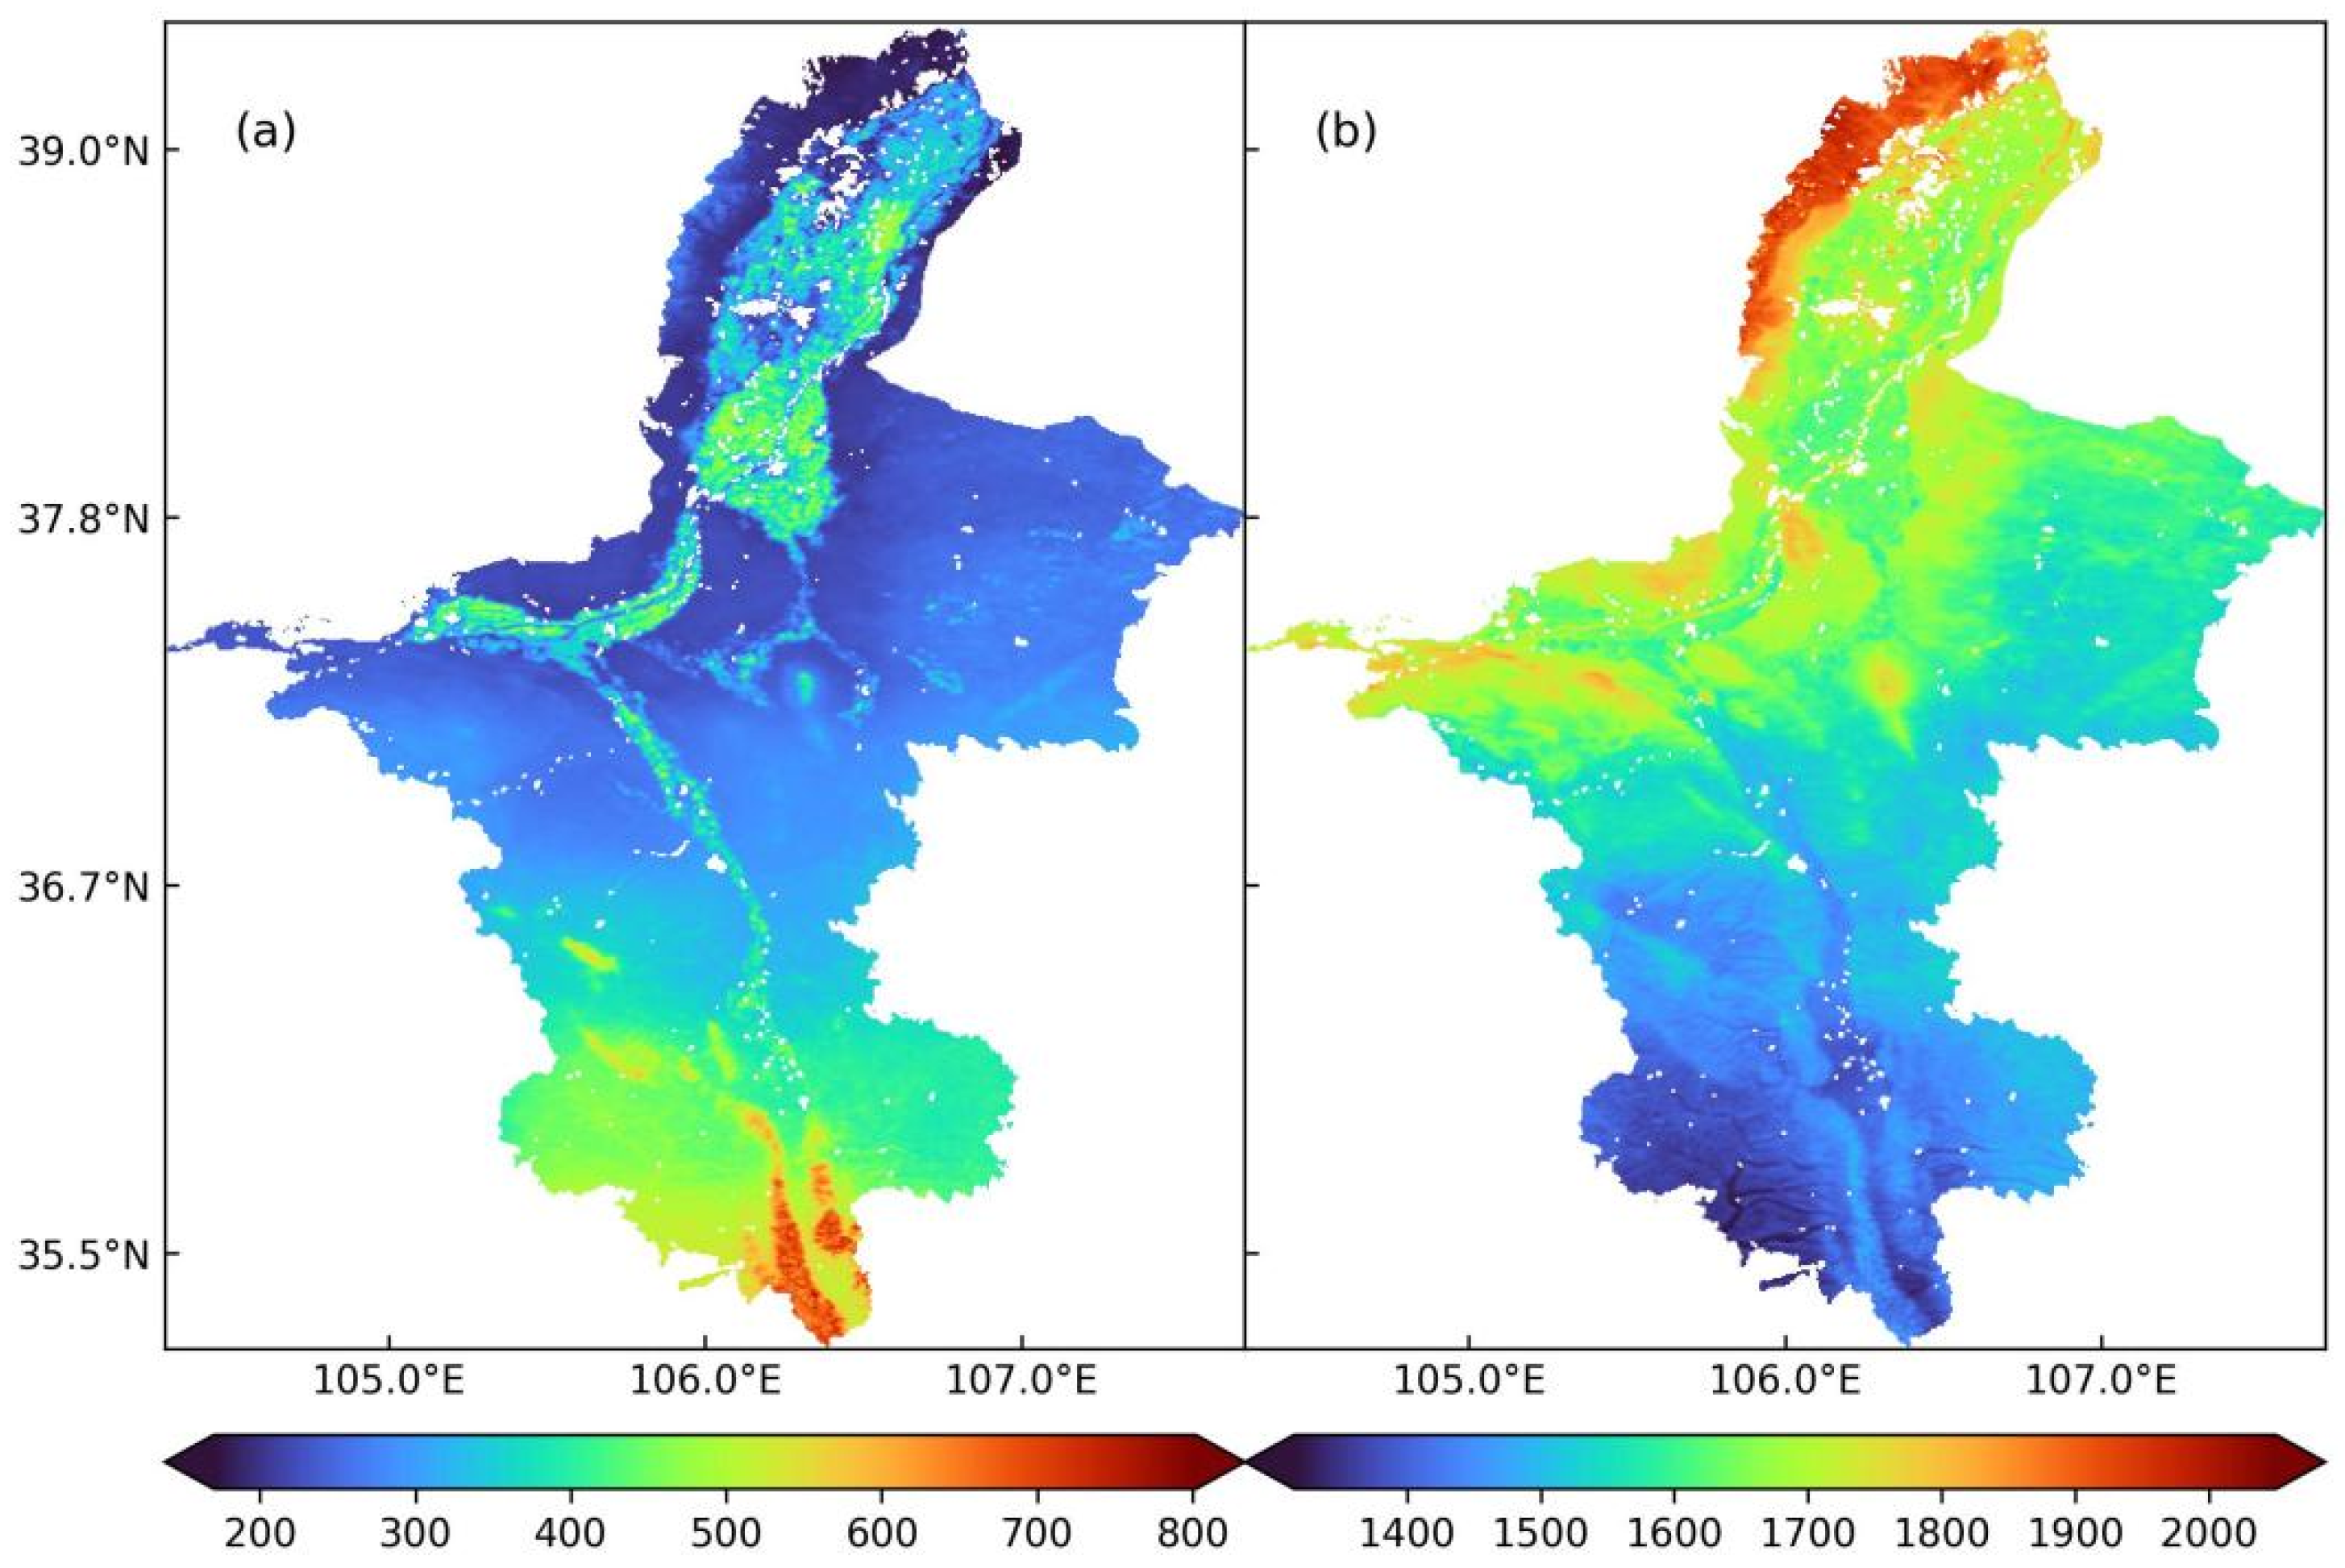
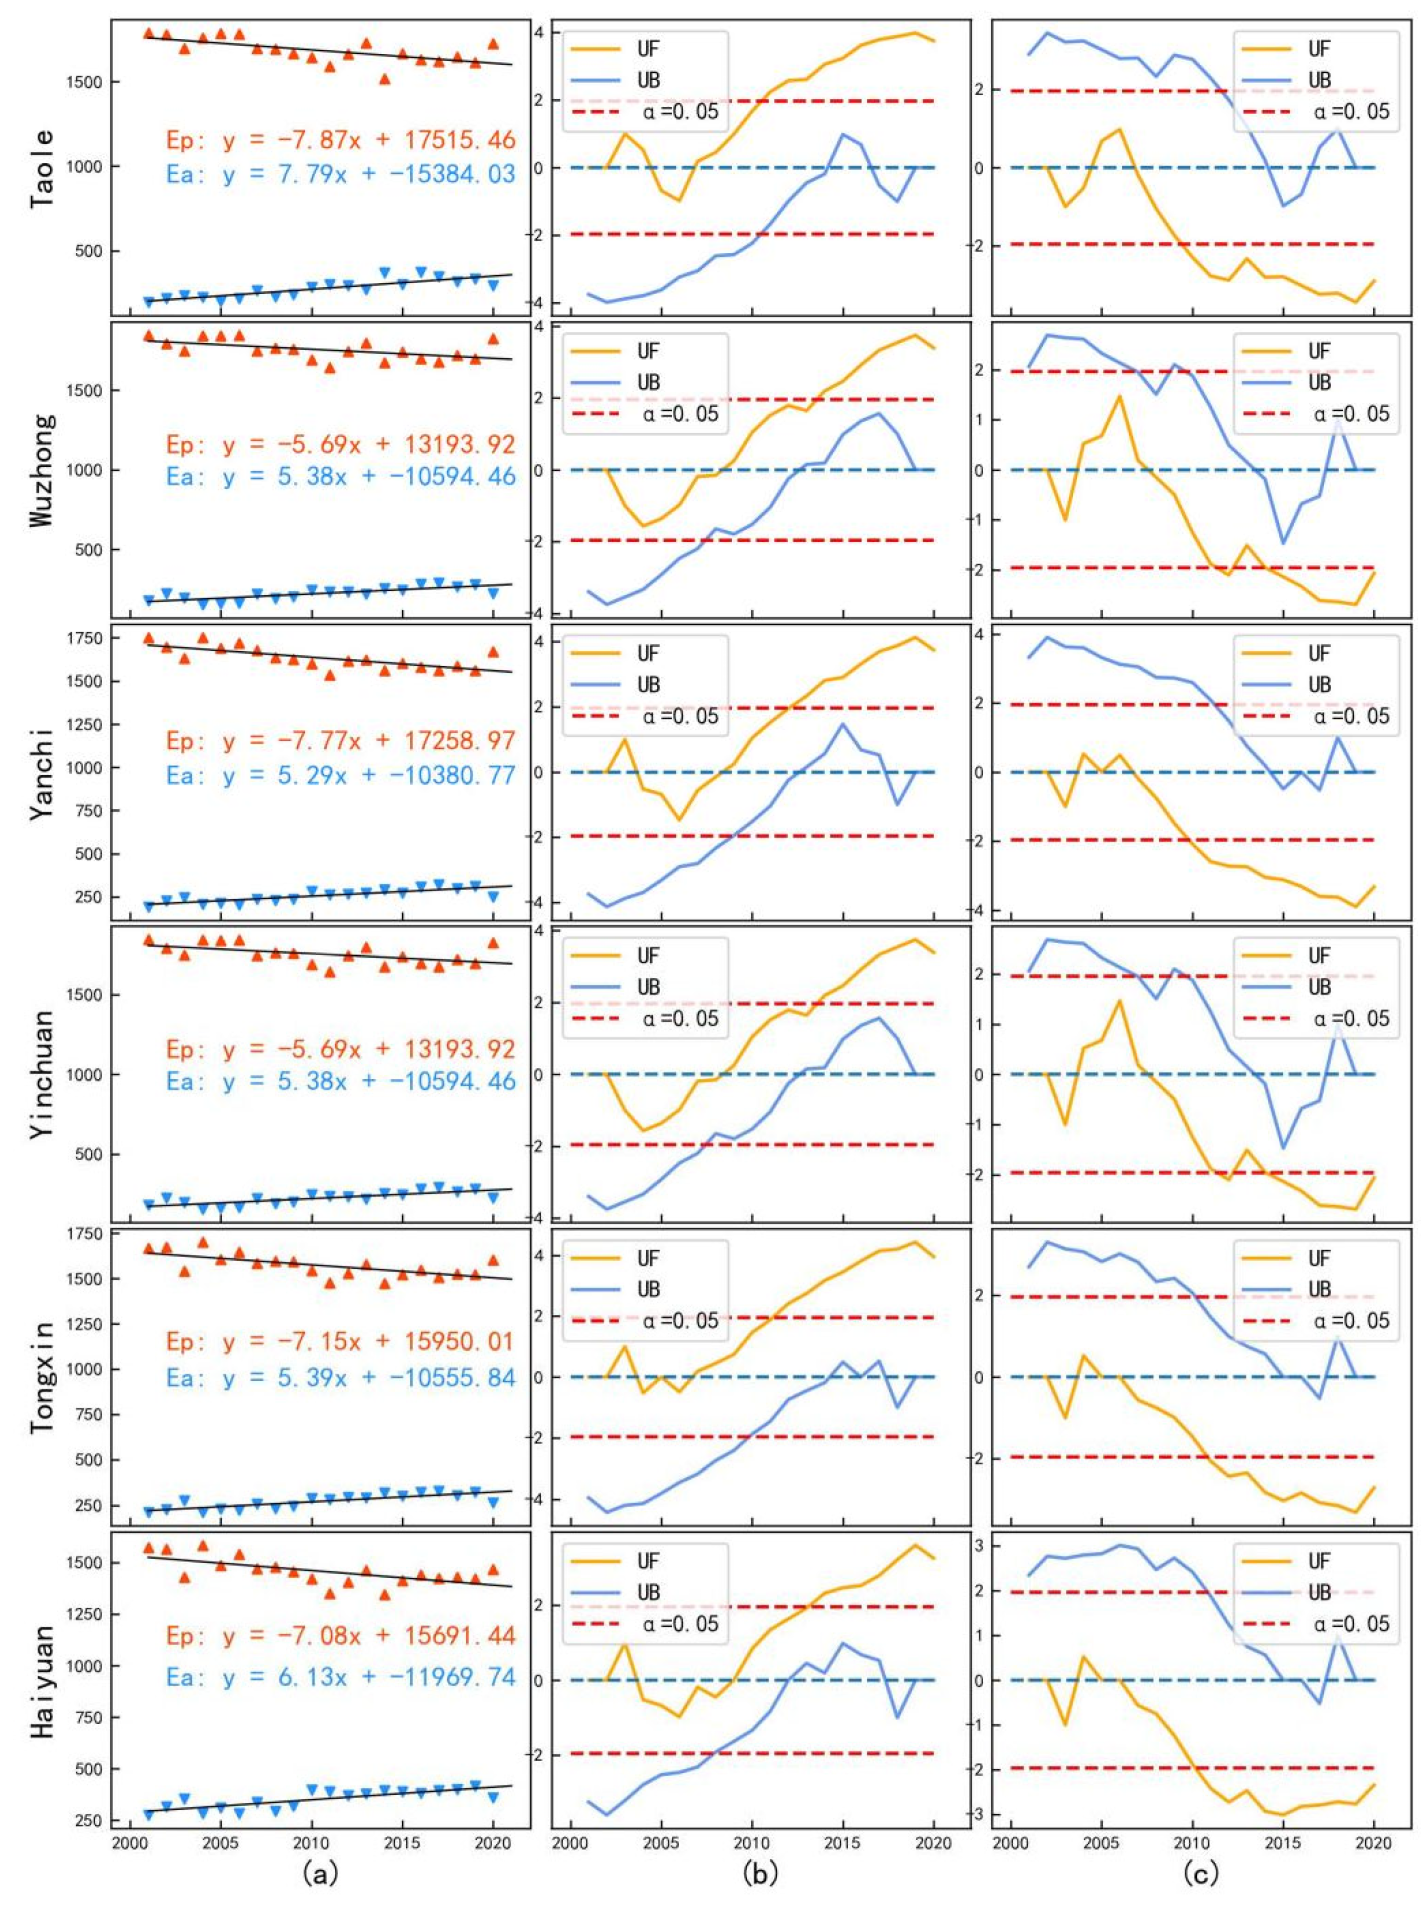
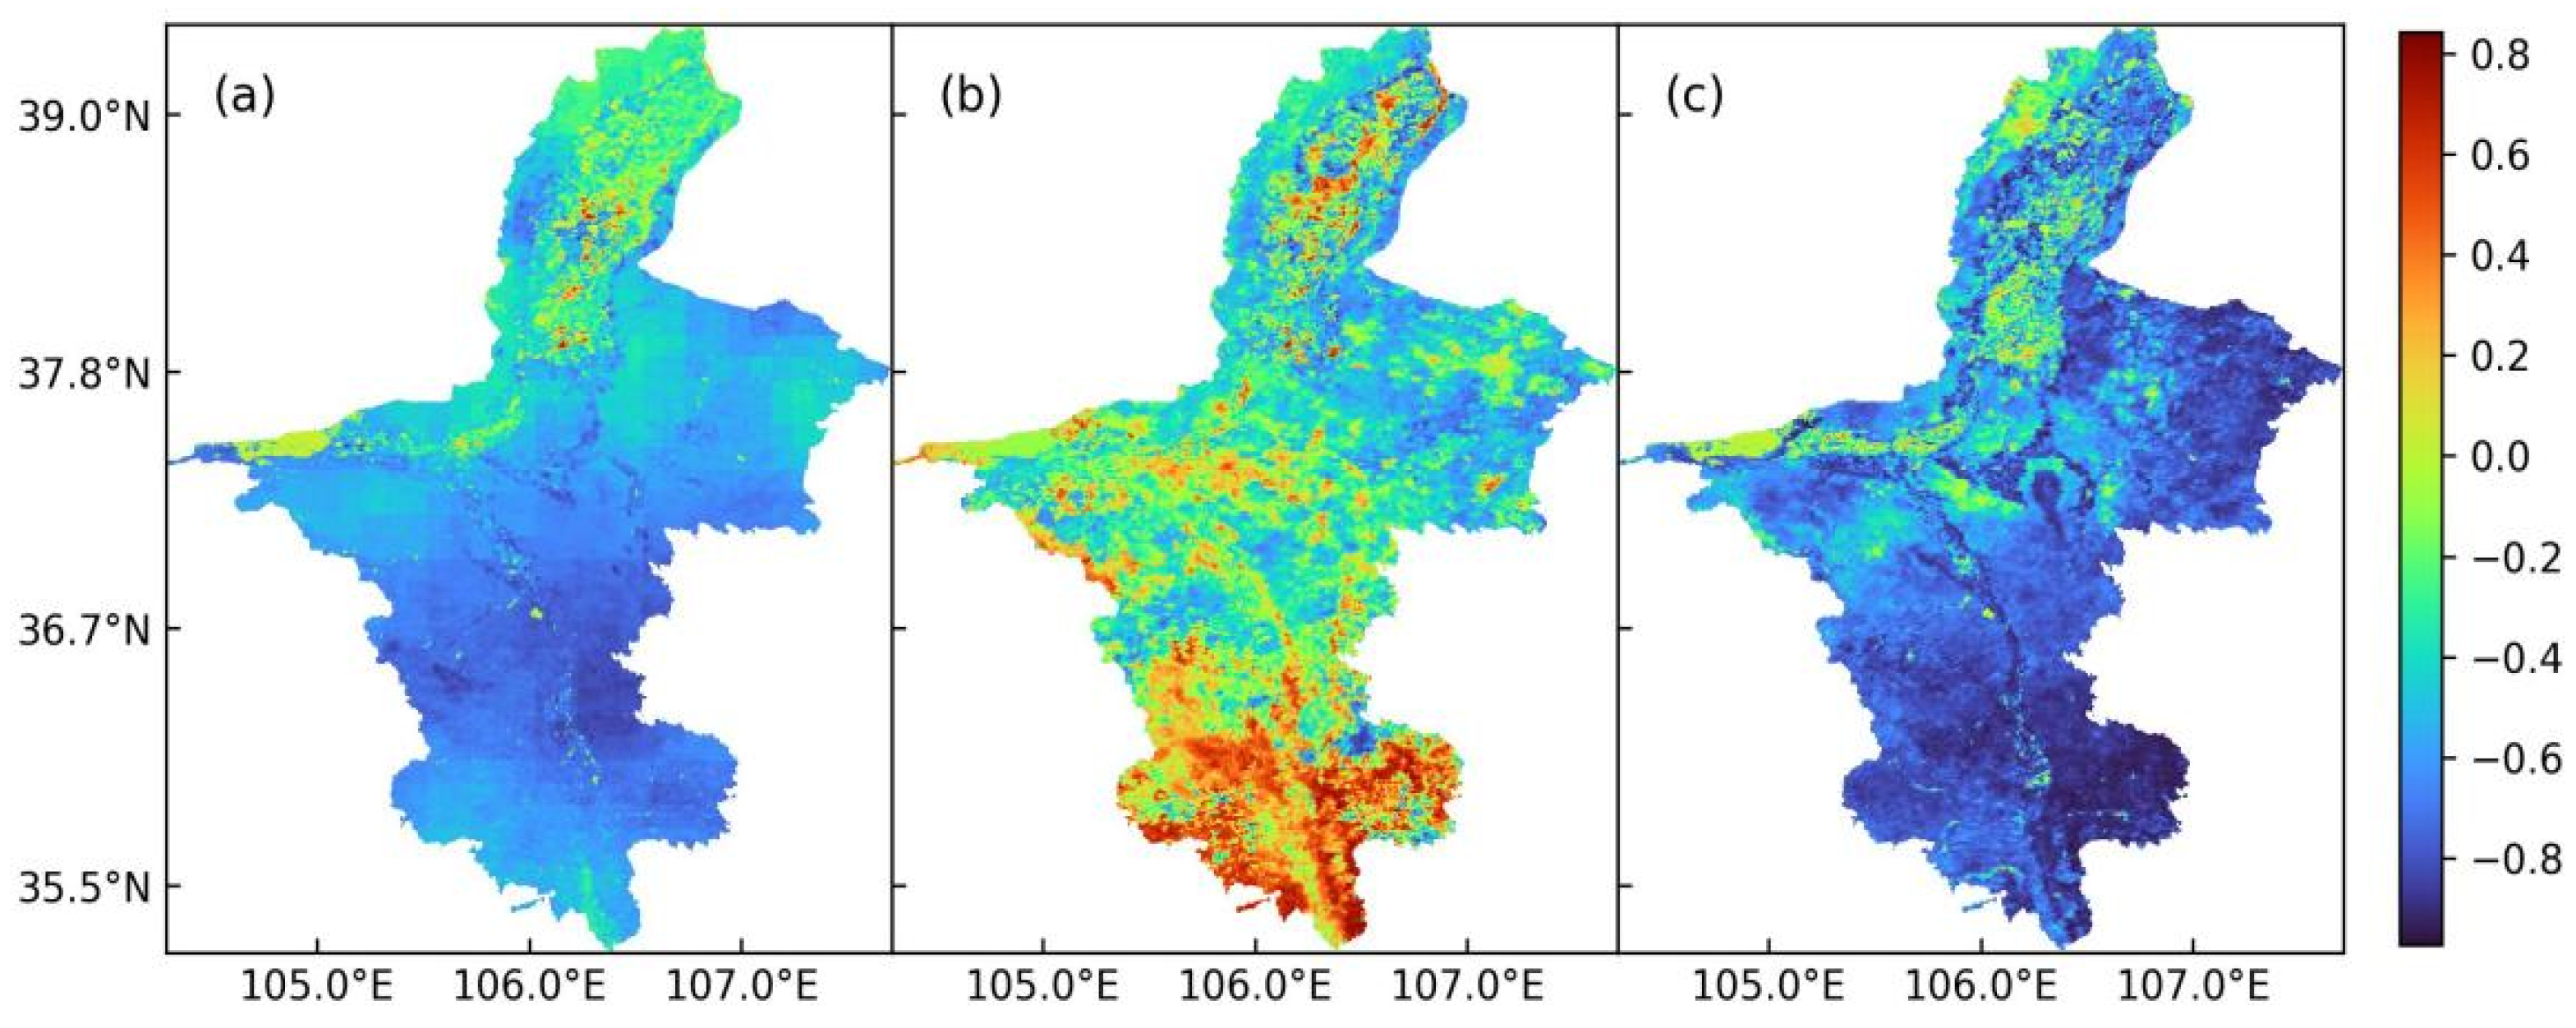
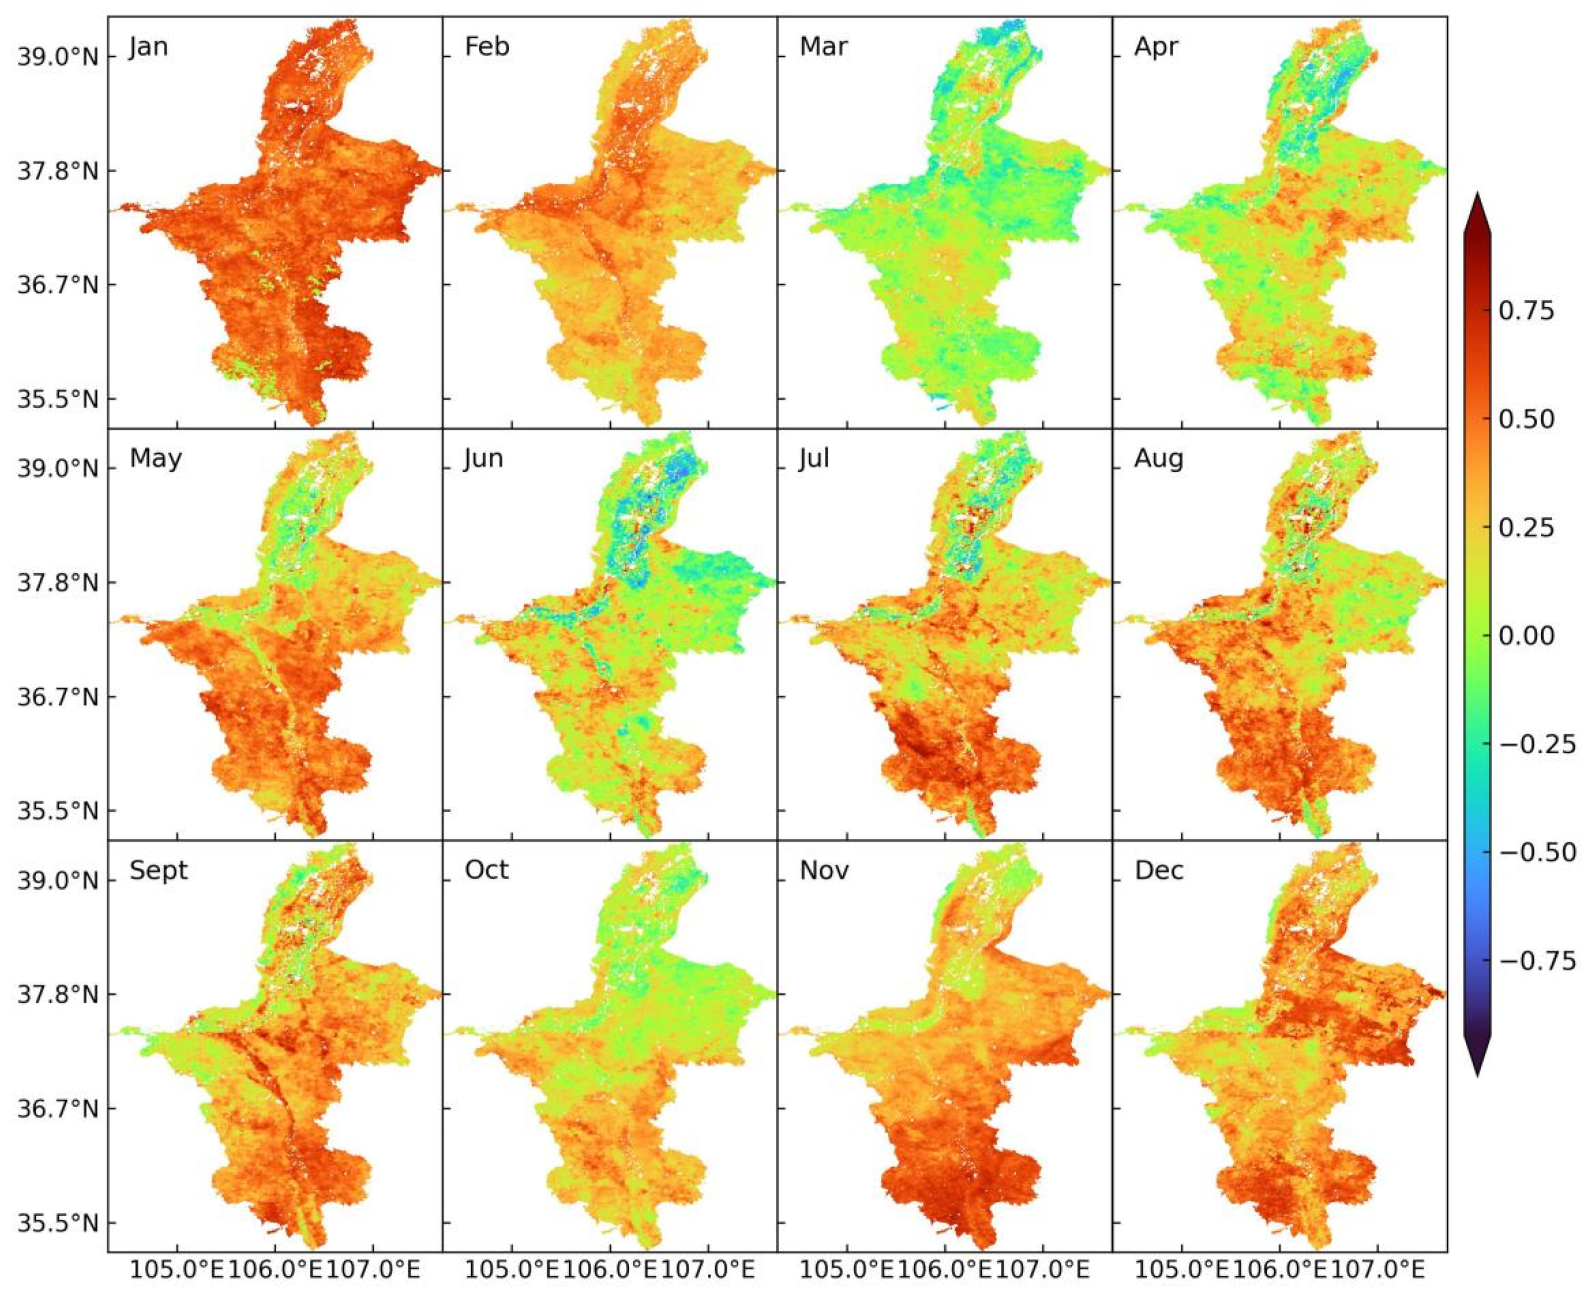
3.1. Trend of Spatiotemporal Variation in AET and PET
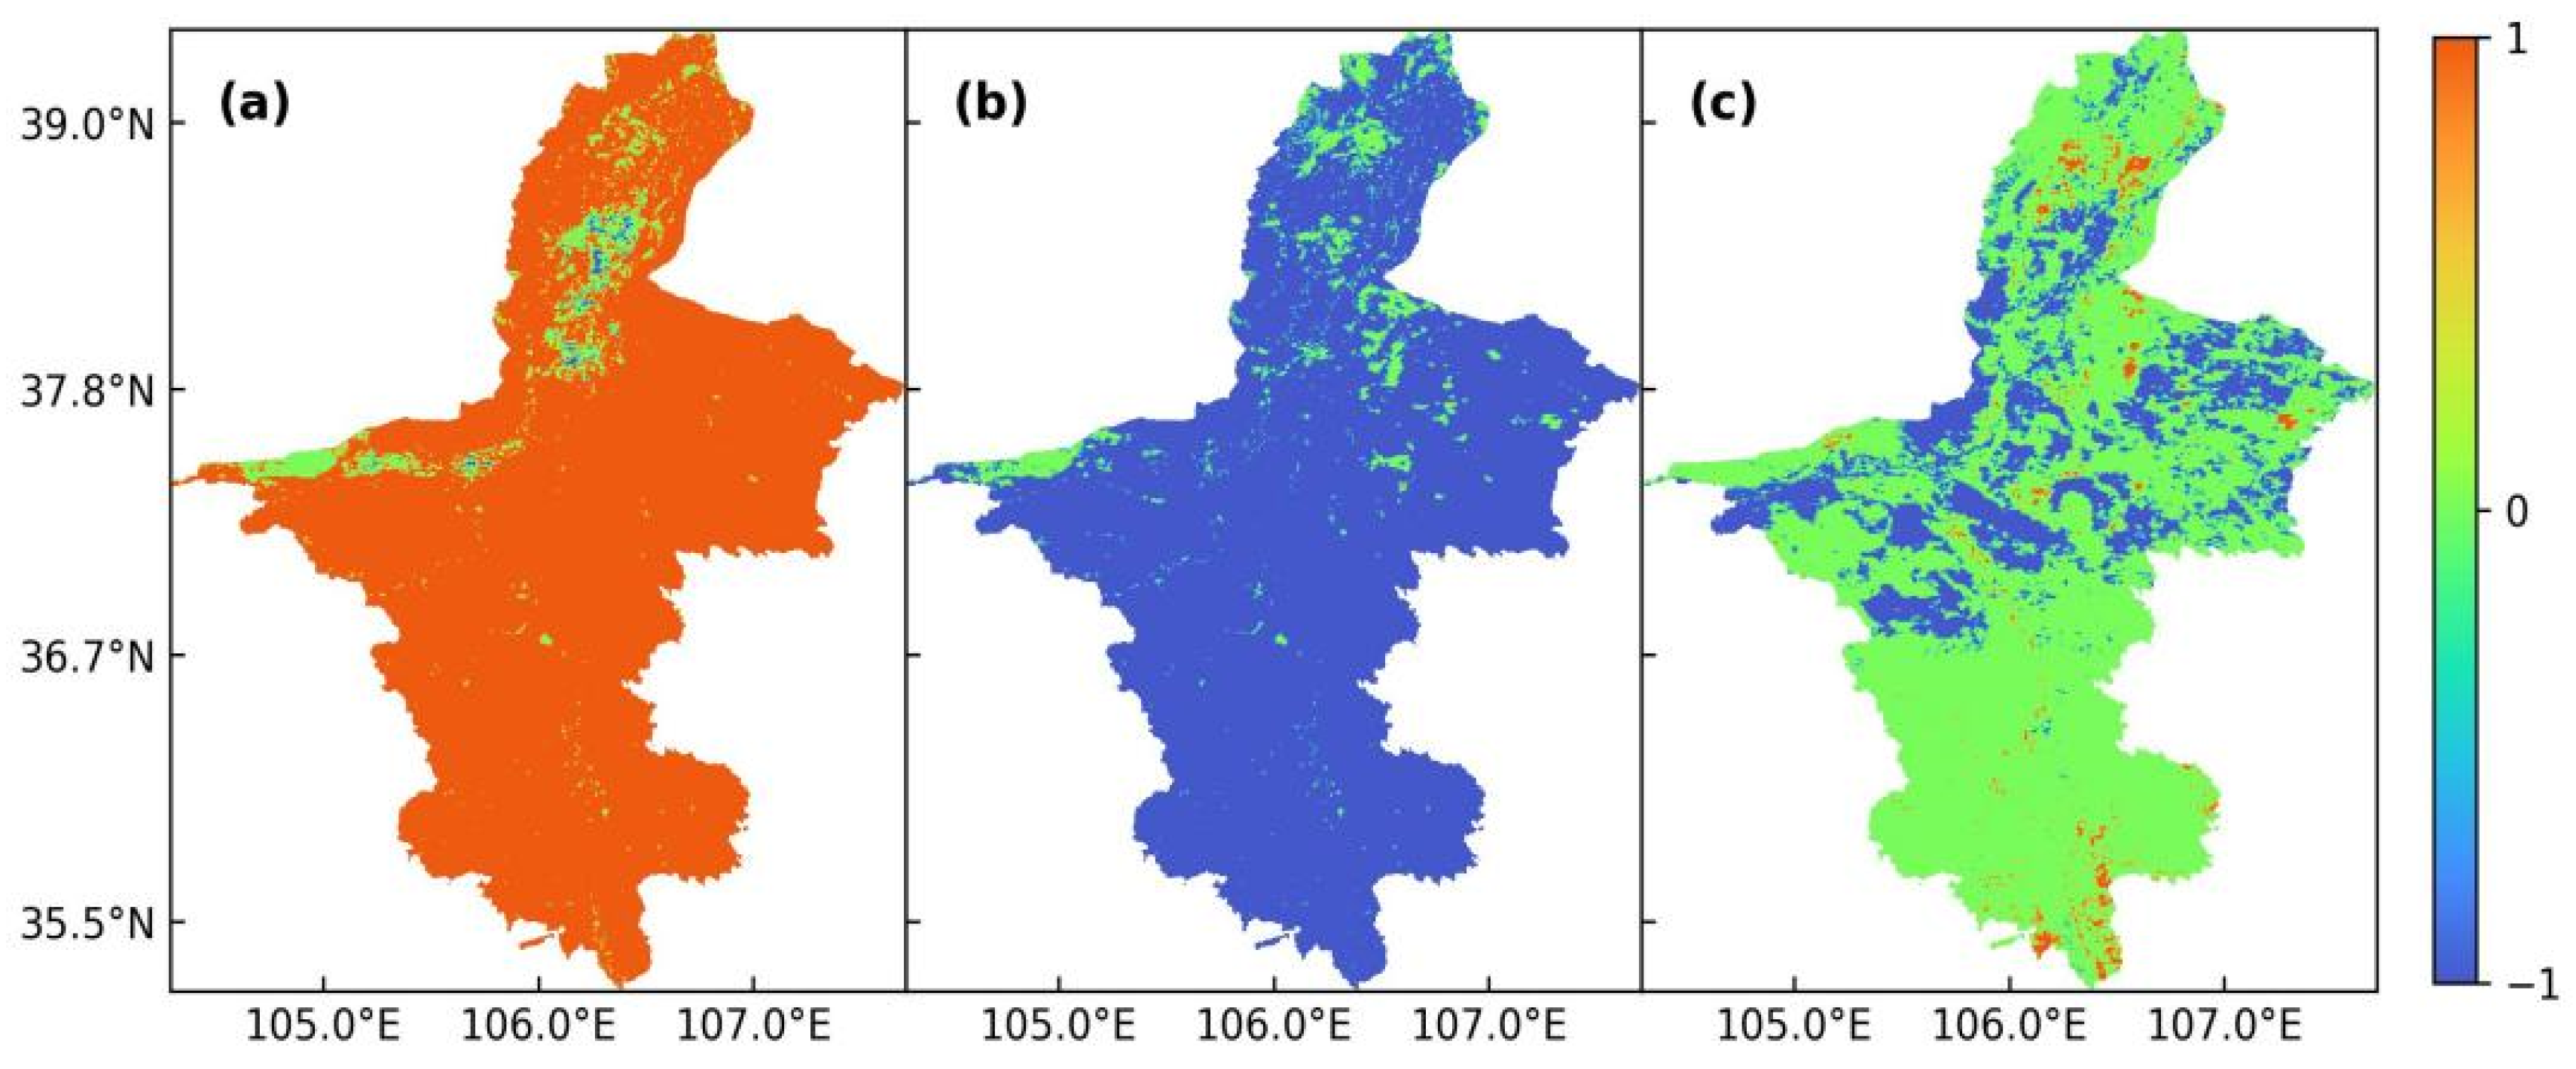
3.2. Validation of ET Complementarity
3.2.1. Point Scale Verification
3.2.2. Regional Scale Verification
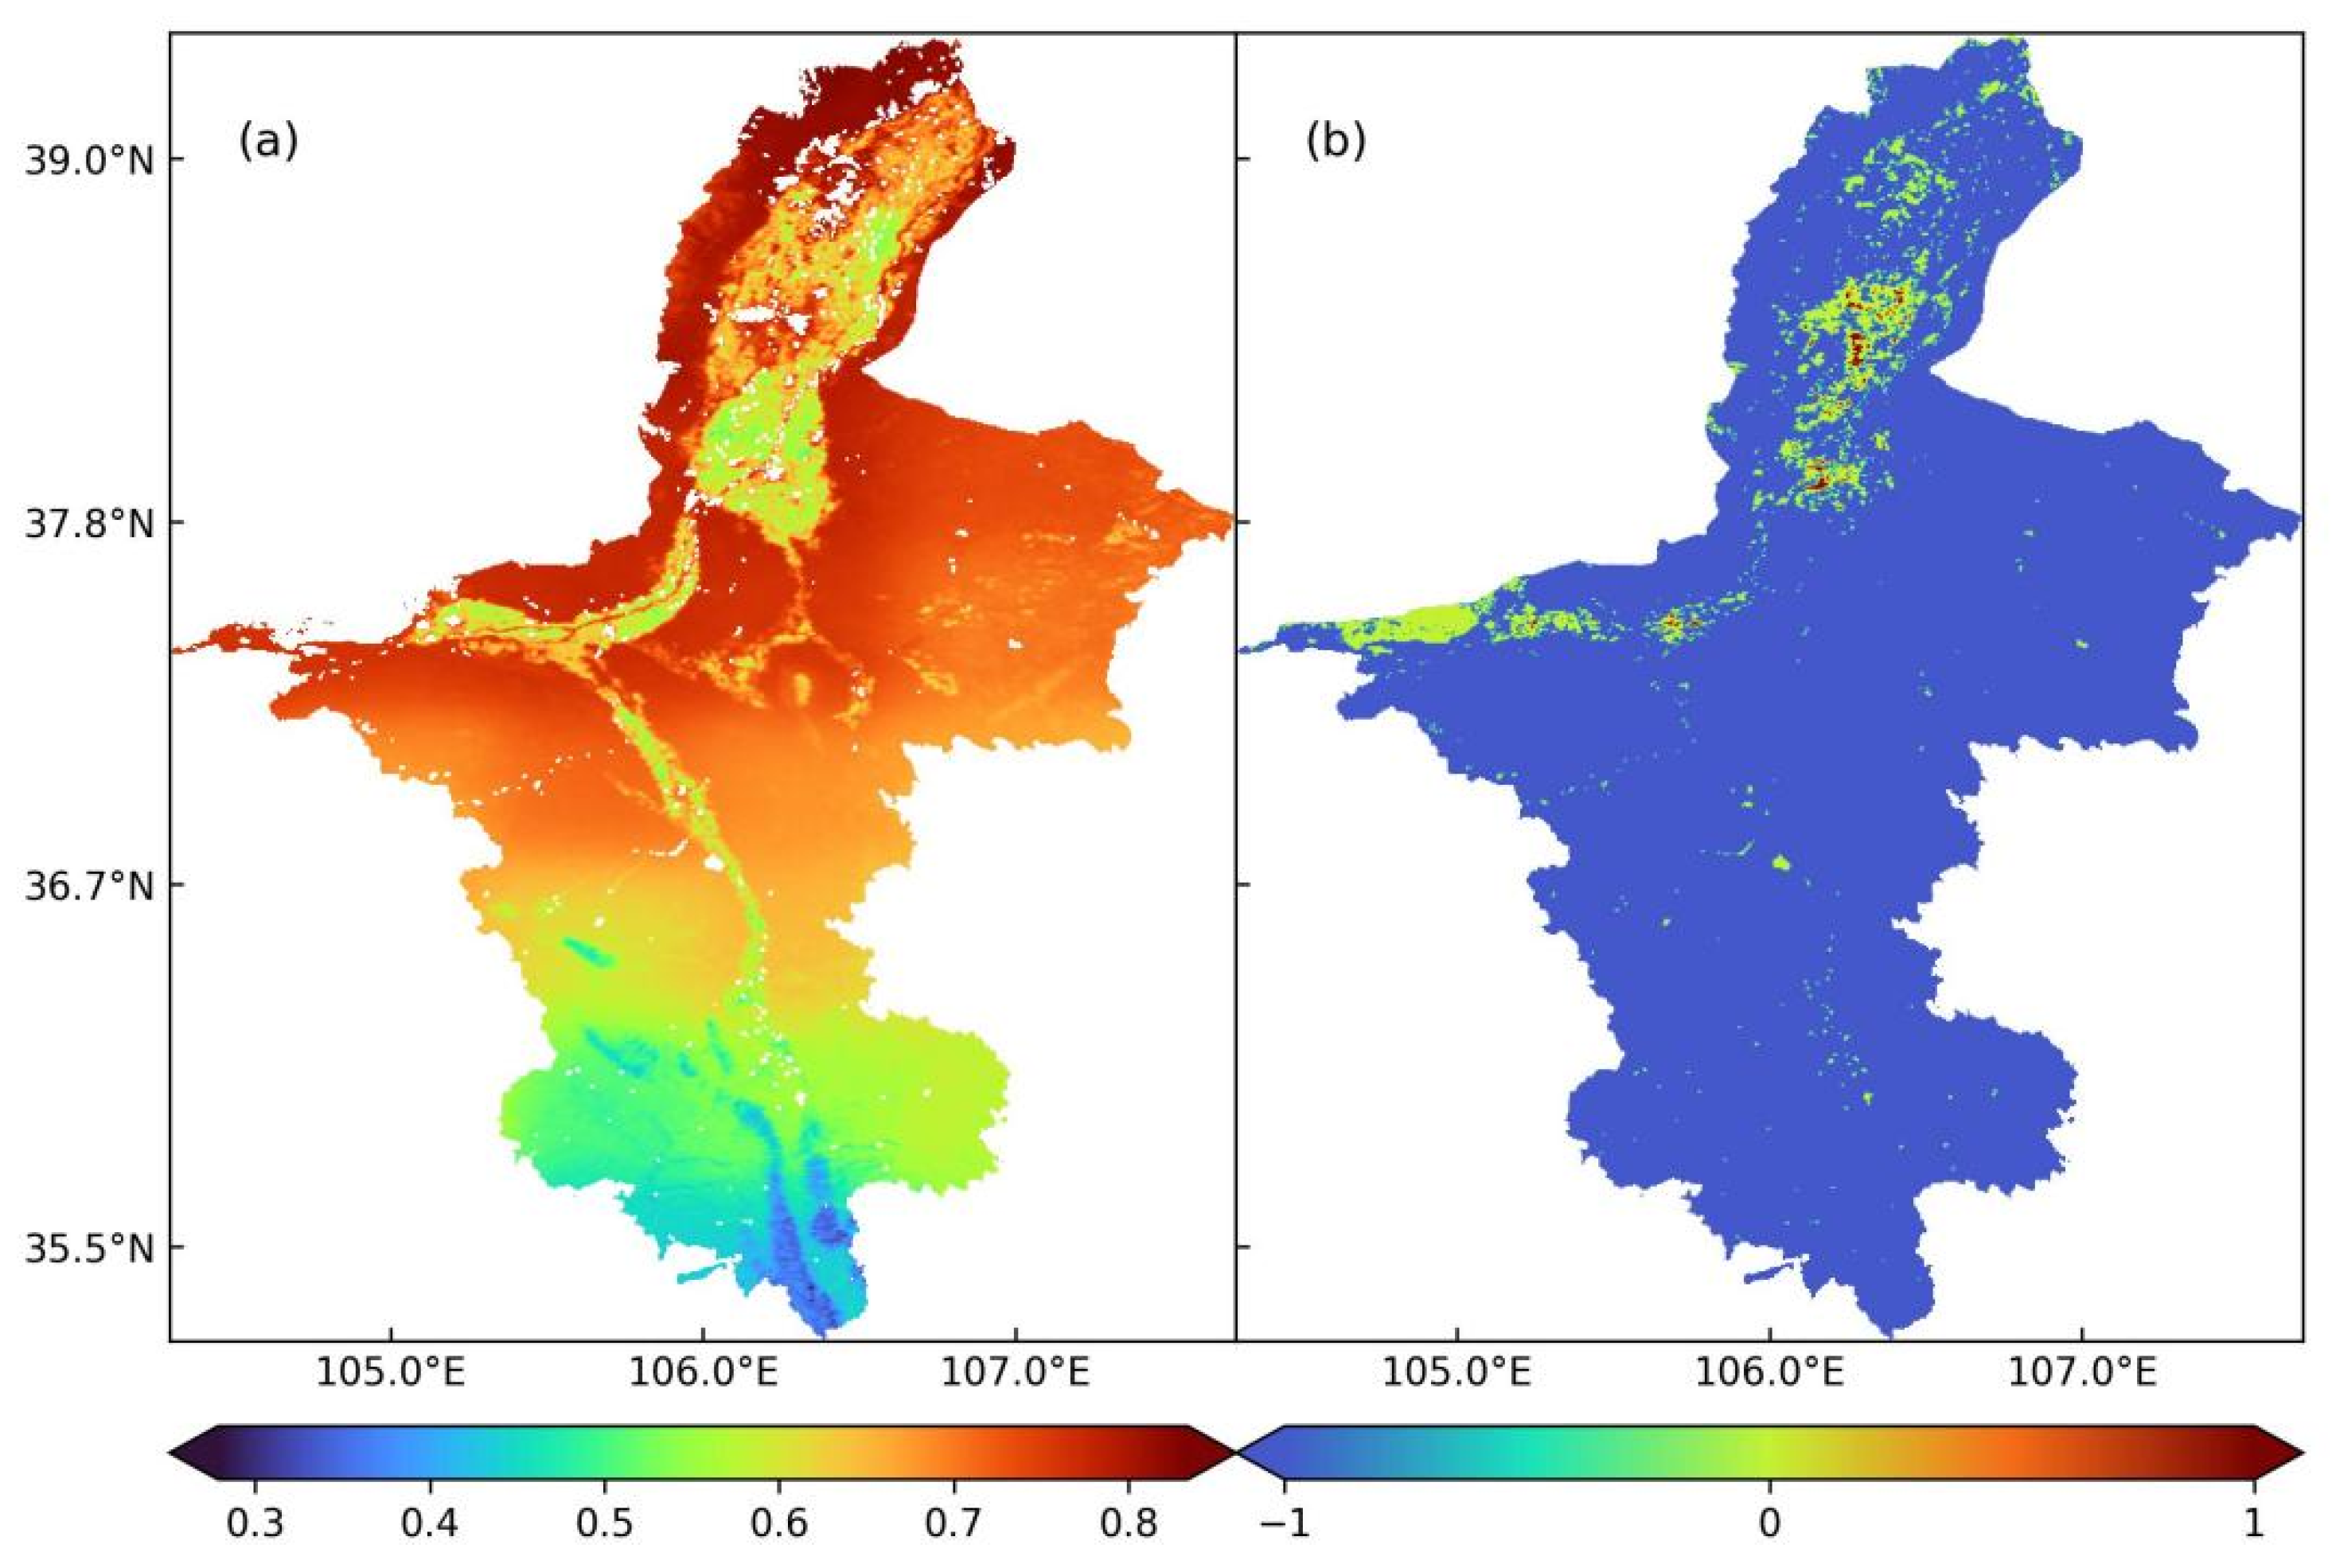
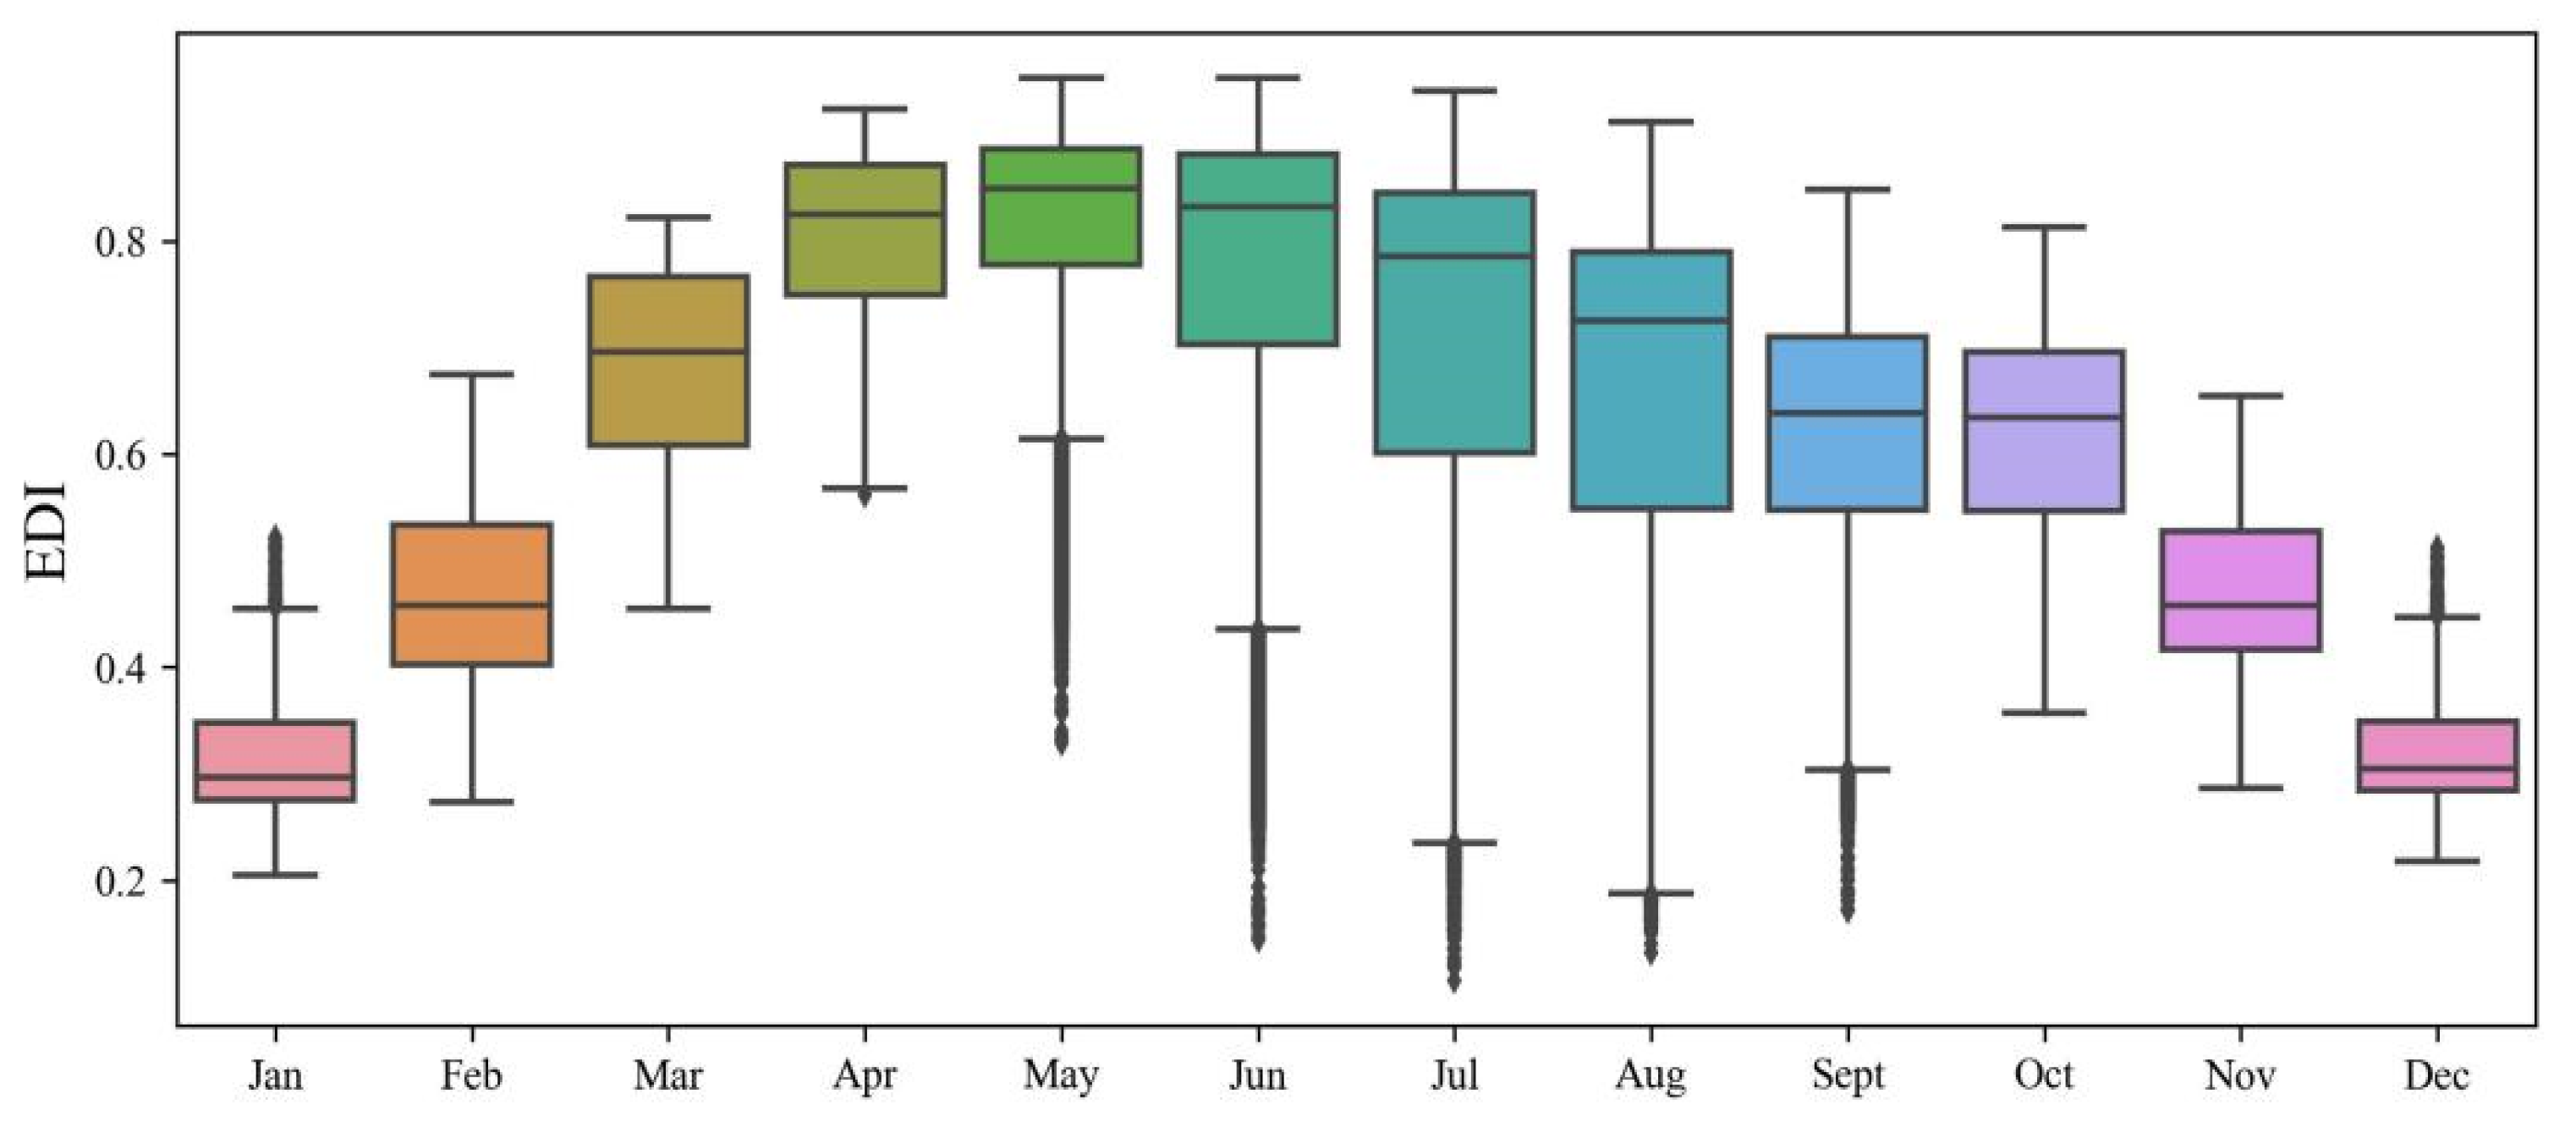
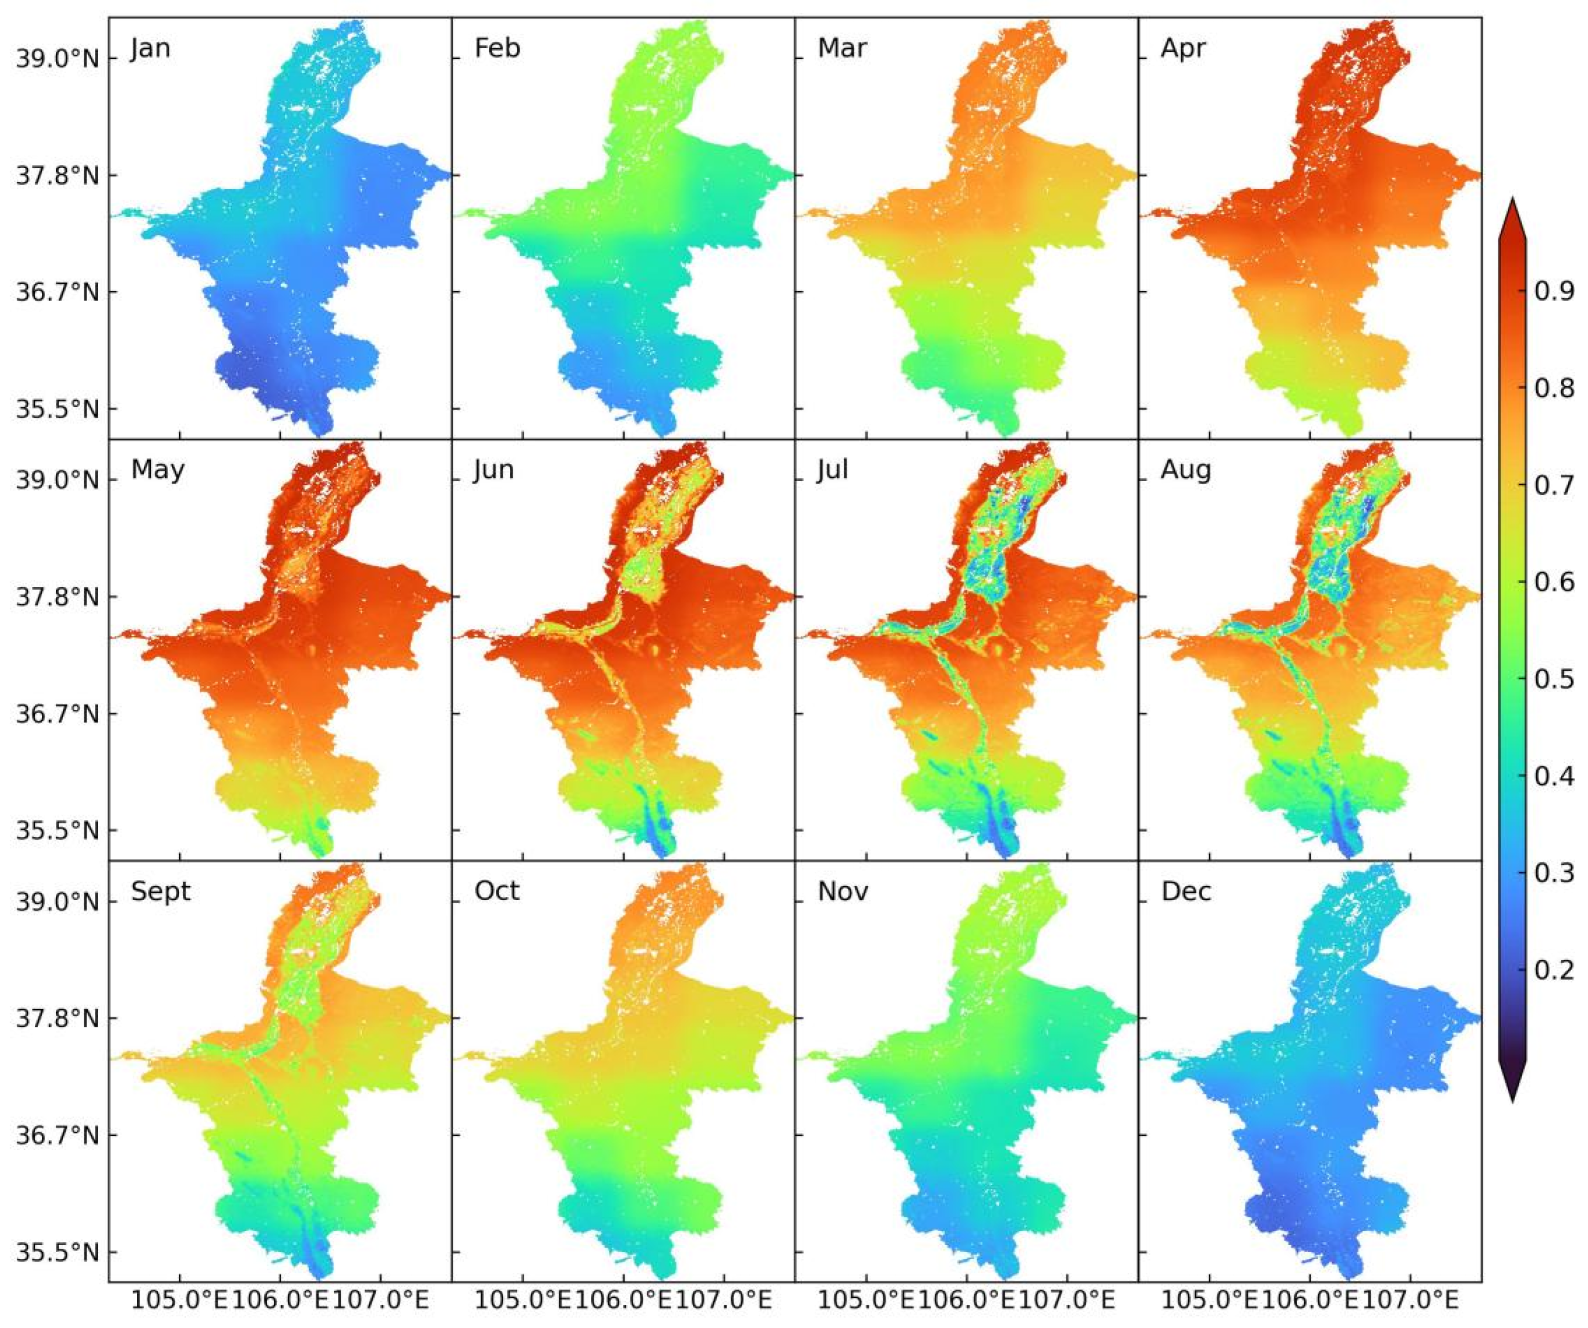
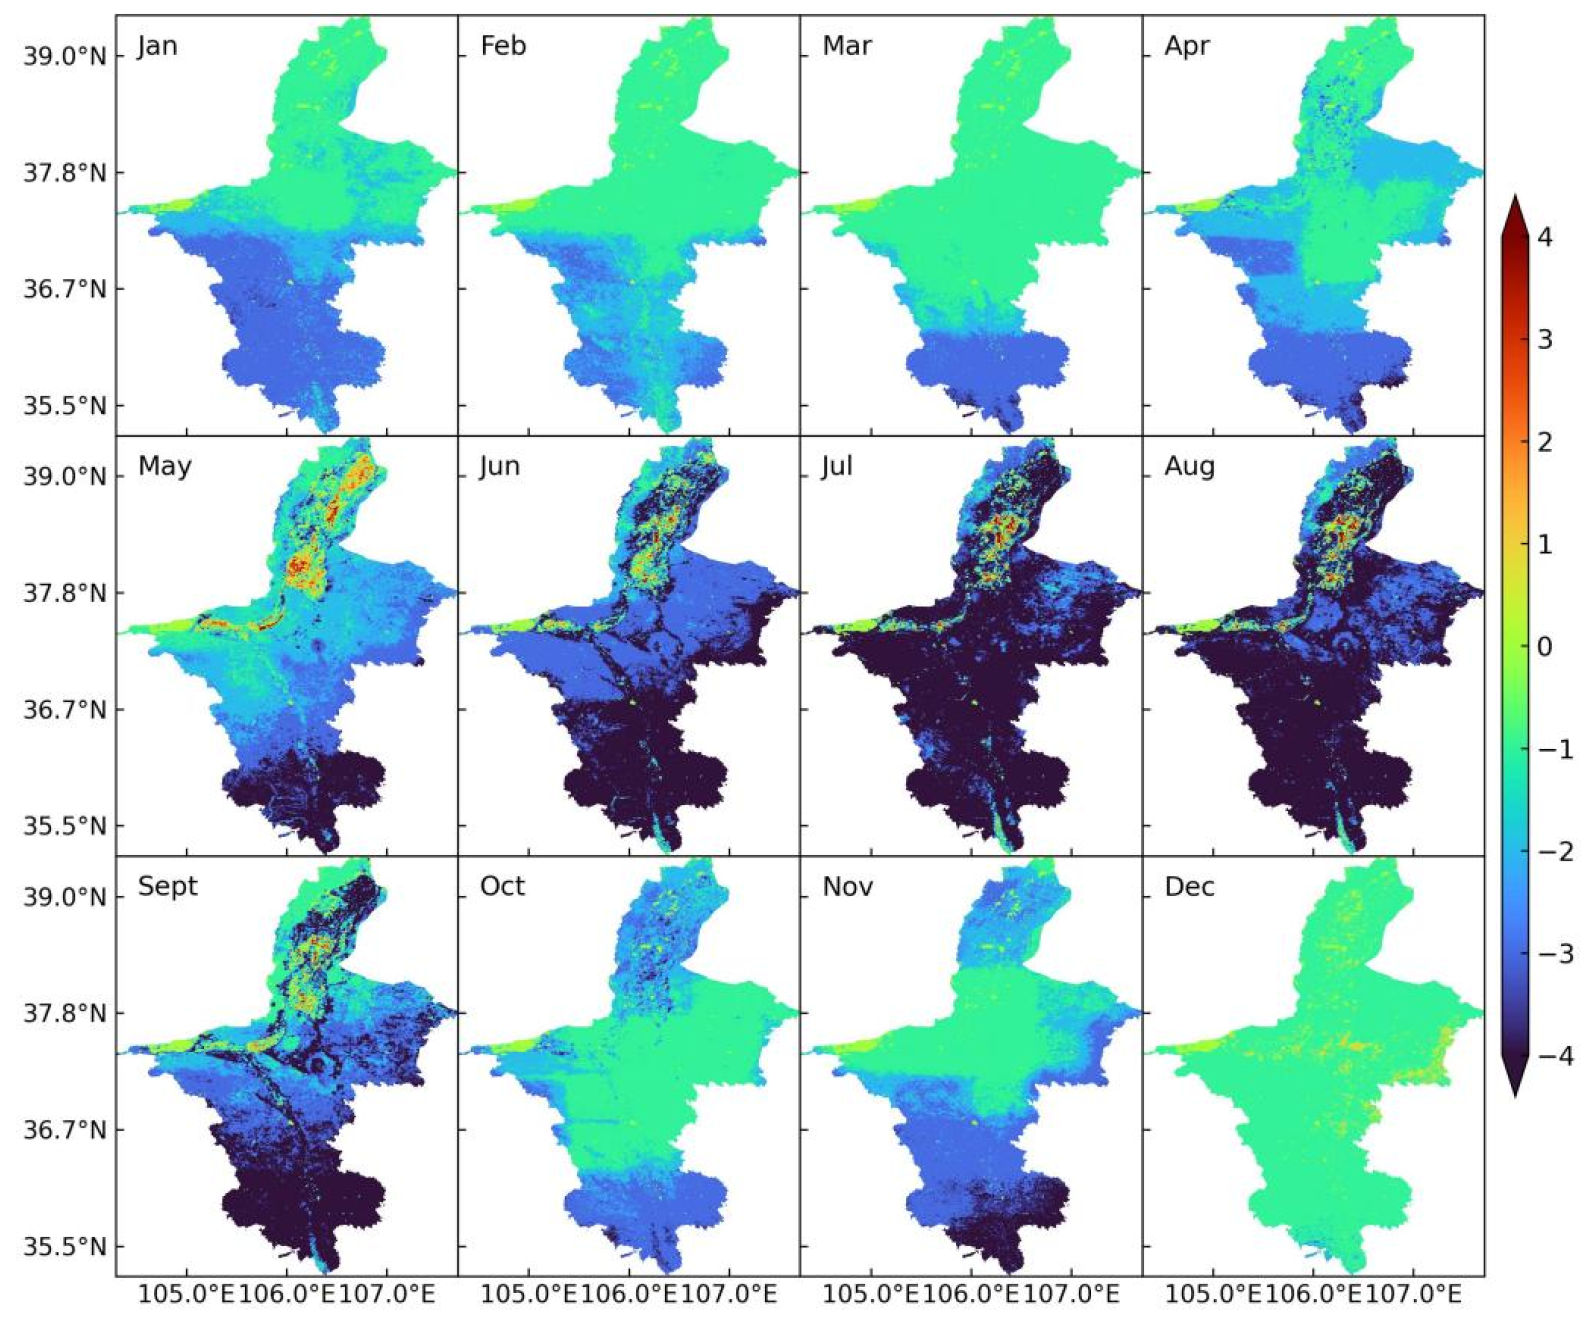
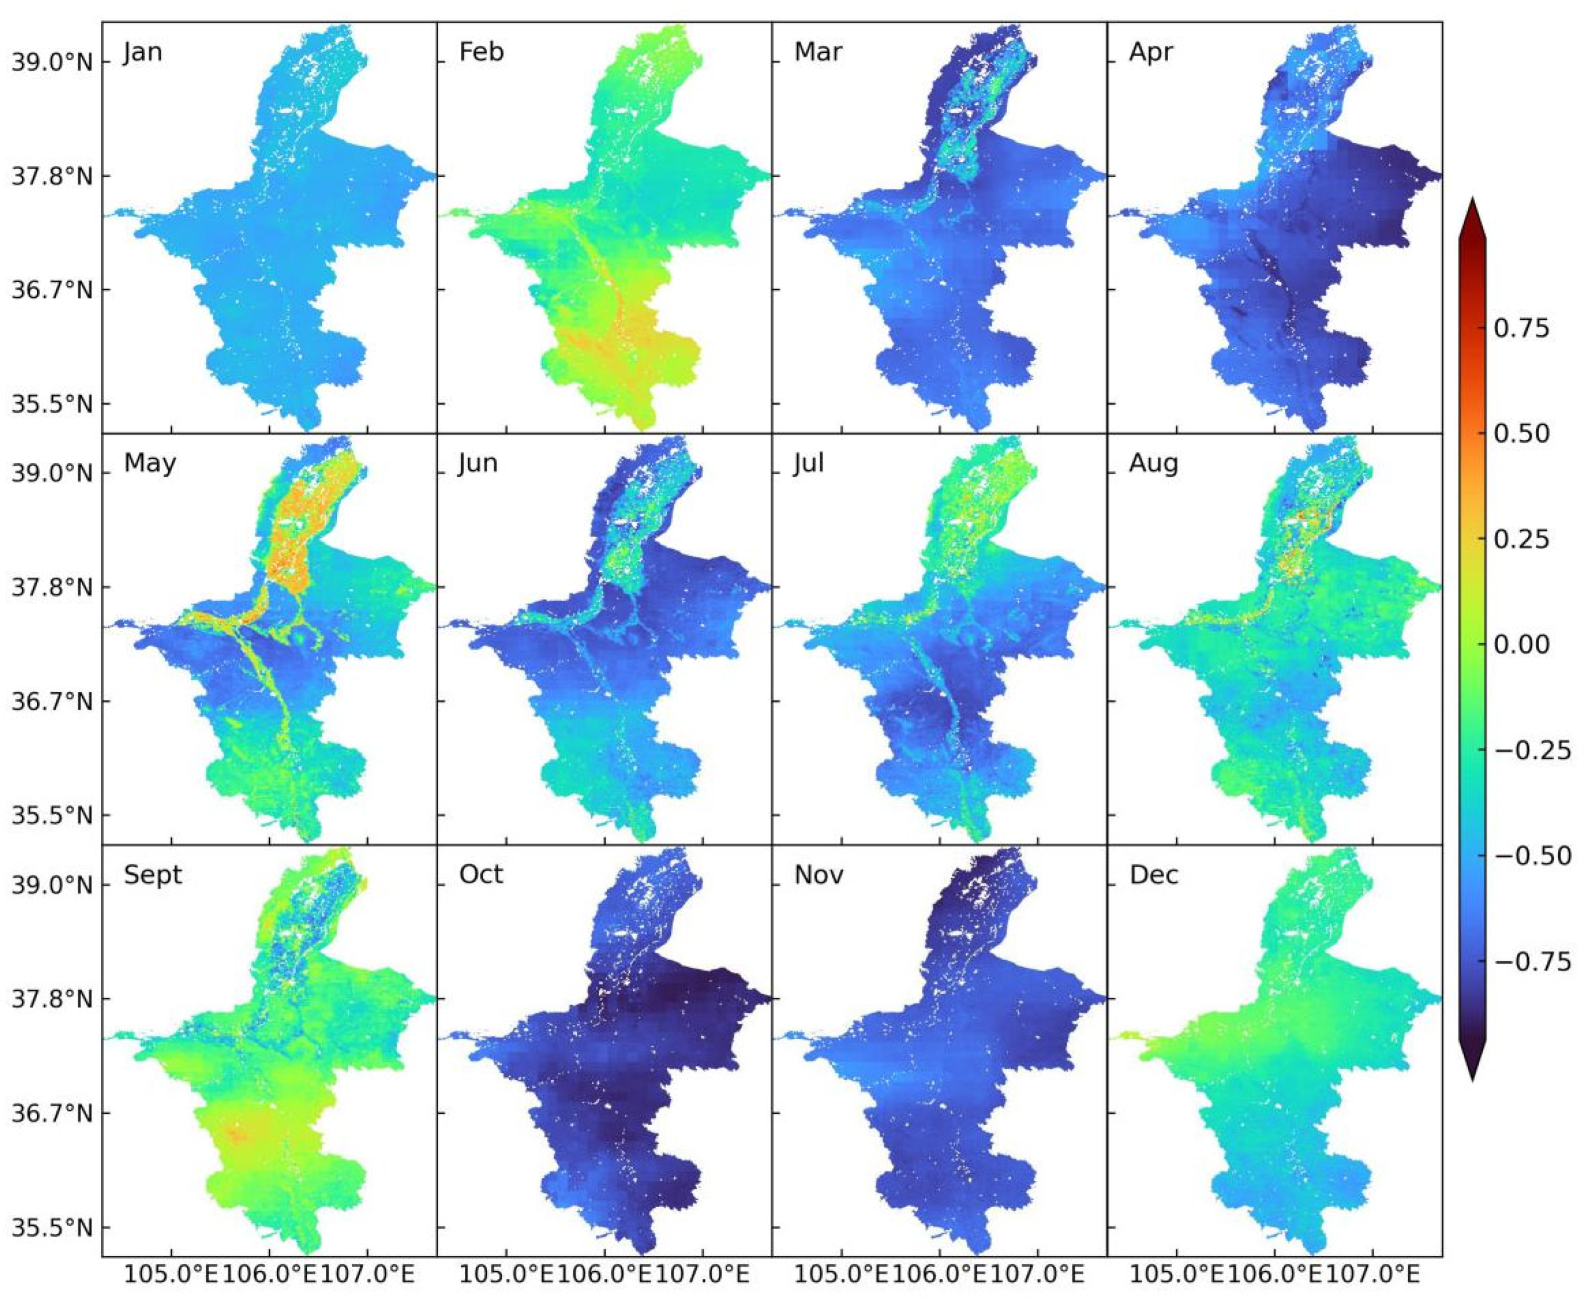
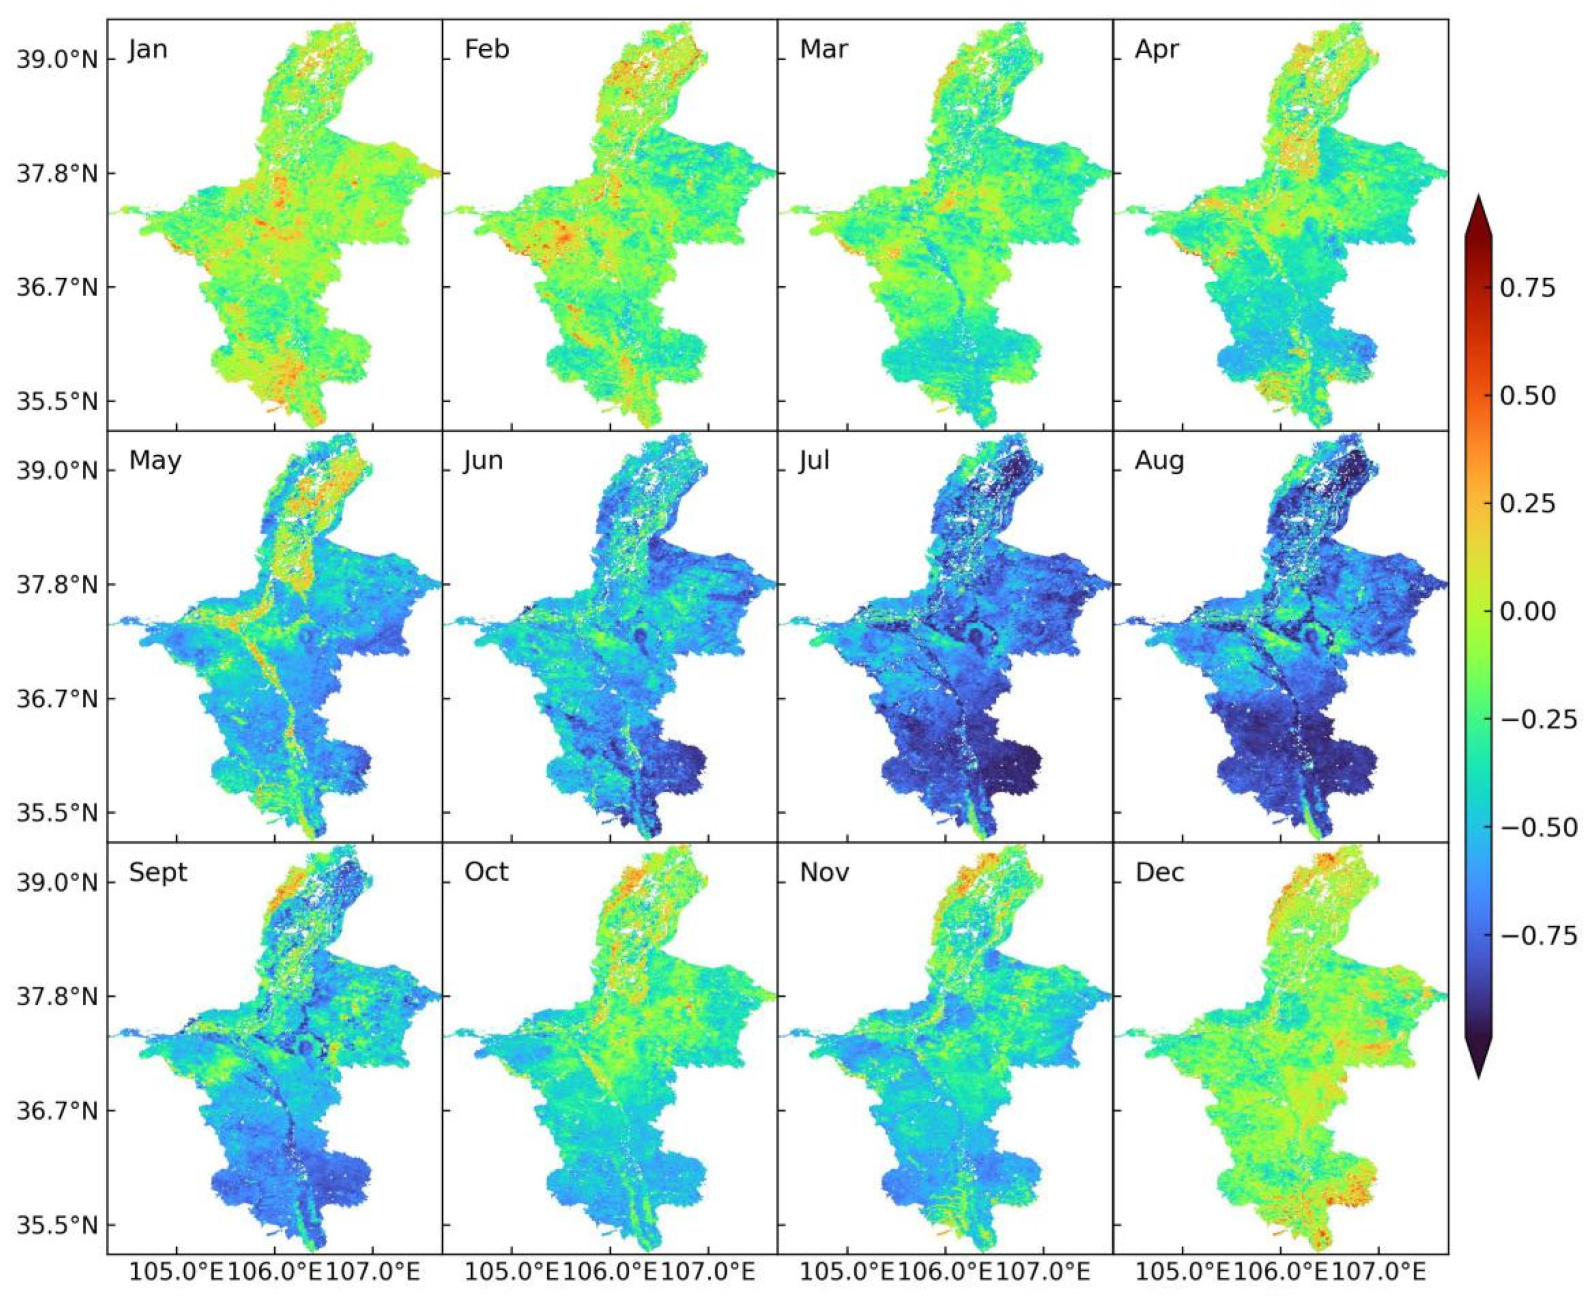
3.3. EDI
3.4. Correlation Analysis of EDI
3.4.1. Correlation Analysis on the Annual Scale
3.4.2. Correlation Analysis on the Monthly Scale
4. Discussion
5. Conclusions
- (1)
- The energy of ET in the study area was stable from 2001 to 2020, and AET and PET showed a complimentary relationship in the majority of regions in the study area, and most regions showed strict complementarity. The complementary theory of ET had applicability in the study area, and the results will provide a theoretical basis for further research and application of the ET model in arid and semi-arid regions.
- (2)
- Based on the complementarity theory of ET, EDI was proposed to accurately reflect the drought in the study area at both the annual and monthly scales. EDI has the concise model and clear physical meaning that will provide technical support for drought research based on ET data.
- (3)
- There was significant correlation between annual EDI and precipitation, land surface temperature and NDVI in the study area. The influencing factors of monthly EDI were different between the seasons. Irrigation had a great impact on the monthly EDI of irrigated and non-irrigated areas. Particularly for the irrigation period, irrigation would cause great differences between the monthly EDI of irrigated and non-irrigated areas.
Author Contributions
Funding
Data Availability Statement
Acknowledgments
Conflicts of Interest
References
- Han, S.Z.; Zhang, B.Z. Advances of evapotranspiration research based on the Penman approach and complementary principle. J. Hydraul. Eng. 2018, 49, 9. [Google Scholar]
- Allen, R.G.; Pereira, L.S.; Raes, D.; Smith, M. Crop Evapotranspiration-Guidelines for Computing Crop Water Requirements; FAO: Rome, Italy, 1998; Contract No.: 15–64. [Google Scholar]
- Li, X.; Jiang, T.; Wu, P.; Wang, Y.; Su, B. Relationship between actual evapotranspiration and potential evapotranspiration in the Pearl River basin. Trans. Atmos. Sci. 2016, 39, 692–701. [Google Scholar]
- Penman, H.L. Natural Evaporation from Open Water, Bare Soil and Grass. Proc. R Oyal Soc. Lond. 1948, 193, 120–145. [Google Scholar]
- Bouchet, R. Evapotranspiration réelle et potentielle, signification climatique. Int. Assoc. Hydrol. Sci. Publ. 1963, 62, 134–142. [Google Scholar]
- Cohen, S.; Ianetz, A.; Stanhill, G. Evaporative climate changes at Bet Dagan, Israel, 1964–1998. Agric. For. Meteorol. 2002, 111, 83–91. [Google Scholar] [CrossRef]
- Yao, J.; Yang, Q.; Chen, Y.; Hu, W.; Liu, Z.; Zhao, L. Climate change in arid areas of Northwest China in past 50 years and its effects on the local ecological environment. Chin. J. Ecol. 2013, 32, 1283–1291. [Google Scholar]
- Yin, Y.; Wu, S.; Zhao, D.; Zheng, D.; Pan, T. Impact of Climate Change on Actual Evapotranspiration on the Tibetan Plateau during 1981–2010. Acta Geogr. Sin. 2012, 67, 1471–1481. [Google Scholar]
- Song, D.; Jia, B.; Jiao, H. Review of Renewable Energy Subsidy System in China. Energies 2022, 15, 7429. [Google Scholar] [CrossRef]
- Song, D.; Liu, Y.; Qin, T.; Gu, H.; Cao, Y.; Shi, H. Overview of the Policy Instruments for Renewable Energy Development in China. Energies 2022, 15, 6513. [Google Scholar] [CrossRef]
- Song, D.; Pei, H.; Liu, Y.; Wei, H.; Yang, S.; Hu, S. Review on Legislative System of Photovoltaic Industry Development in China. Energies 2022, 15, 306. [Google Scholar] [CrossRef]
- Song, D.; Jiao, H.; Te Fan, C. Overview of the photovoltaic technology status and perspective in China. Renew. Sustain. Energy Rev. 2015, 48, 848–856. [Google Scholar] [CrossRef]
- Kim, H.W.; Hwang, K.; Mu, Q.; Lee, S.O.; Choi, M. Validation of MODIS 16 Global Terrestrial Evapotranspiration Products in Various Climates and Land Cover Types in Asia. Ksce J. Civ. Eng. 2012, 16, 229–238. [Google Scholar] [CrossRef]
- Liu, S.M.; Xu, Z.W.; Zhu, Z.L.; Jia, Z.Z.; Zhu, M.J. Measurements of evapotranspiration from eddy-covariance systems and large aperture scintillometers in the Hai River Basin, China. J. Hydrol. 2013, 487, 24–38. [Google Scholar] [CrossRef]
- He, T.; Shao, Q. Spatial-temporal Variation of Terrestrial Evapotranspiration in China from 2001 to 2010 Using MOD16 Products. J. Geo-Inf. Sci. 2014, 16, 979–988. [Google Scholar]
- Dong, G.; Fan, D.; Yang, T.; Xu, H.; Zhou, J.; Dang, S.; Cheng, C. Analysis on the Applicability of GPM and TRMM Precipitation Data in the Yellow River Basin. Res. Soil Water Conserv. 2018, 25, 81–87. [Google Scholar]
- Meng, C.; Mo, X.; Liu, S.; Hu, S. Extensive evaluation of IMERG precipitation for both liquid and solid in Yellow River source region. Atmos. Res. 2021, 256, 105570. [Google Scholar] [CrossRef]
- Li, Y.; Ning, S.; Ding, W.; Jin, J.; Zhang, Z. The evaluation of latest GPM—Era precipitation data in Yellow River Basin. Remote Sens. Land Resour. 2019, 31, 164–170. [Google Scholar]
- Liu, X.; Li, W.; Su, Z.; Wang, S.; Li, C.; Wang, X. Change of Mean Temperature and Extreme Temperature in Ningxia during the Period of 1962–2015. Arid. Zone Res. 2018, 35, 1173–1180. [Google Scholar]
- Li, W.; Zhao, Y.; Wang, X.; Wang, S.; Li, C.; Wang, X.; Dong, Y. Influence of water quality on element leaching of sandy compacted gravel under freeze-thaw cycle conditions. J. Drain. Irrig. Mach. Eng. 2020, 38, 506–510. [Google Scholar]
- Ningxia Irrigation Area. Available online: http://www.yrcc.gov.cn/hhyl/yhgq/201108/t20110813_101700.html (accessed on 1 May 2022).
- Yang, Y.; Wang, L. Variation characteristics and numerical simulation of soil water content and land evapotranspiration over farmland in the Loess Plateau. In Proceedings of the 34th Annual Meeting of the Chinese Meteorological Society, Zhengzhou, China, 26–29 September 2017. [Google Scholar]
- Liu, H.; Song, D.; Kong, J.; Mu, Z.; Zhang, Q.; Wang, X. Spatiotemporal Variation in Actual Evapotranspiration and the Influencing Factors in Ningxia from 2001 to 2020. Int. J. Env. Res. Public Health 2022, 19, 12693. [Google Scholar] [CrossRef] [PubMed]


| RS Data | Data Type | Satellite Orbit | Time Span | Spatial Resolution | Temporal Resolution | Data Sources |
|---|---|---|---|---|---|---|
| MOD16A2 | monthly ET | h26v05 | January 2001– December 2020 | 500 m | 8 days | NASA |
| MOD16A3 | annual ET | h26v05 | January 2001– December 2020 | 500 m | 1 year | NASA |
| MOD13A3 | monthly NDVI | h26v05 | January 2001– December 2020 | 1000 m | 1 month | NASA |
| MOD11A2 | monthly surface temperatures | h26v05 | January 2001– December 2020 | 1000 m | 8 days | NASA |
| RS Data | Data Type | Time Span | Spatial Resolution | Temporal Resolution | RS Data Source |
|---|---|---|---|---|---|
| IMERG | monthly precipitation | January 2001–December 2020 | 0.1° | 1 month | NASA |
| Number | Station | Latitude (N) | Longitude (E) | Altitude (m) |
|---|---|---|---|---|
| 53519 | Huinong | 39.22 | 106.77 | 1093.1 |
| 53612 | Wuzhong | 37.98 | 106.18 | 1132.2 |
| 53614 | Yinchuan | 38.48 | 106.22 | 1111.6 |
| 53615 | Taole | 38.80 | 106.70 | 1102.9 |
| 53704 | Zhongwei | 37.53 | 105.18 | 1226.6 |
| 53705 | Zhongning | 37.48 | 105.67 | 1184.4 |
| 53723 | Yanchi | 37.78 | 107.40 | 1350.4 |
| 53806 | Haiyuan | 36.57 | 105.65 | 1854.8 |
| 53810 | Tongxin | 36.98 | 105.90 | 1340.7 |
| 53817 | Guyuan | 36.00 | 106.27 | 1754.2 |
| 53903 | Xiji | 35.97 | 105.72 | 1917.9 |
| 53910 | Liupanshan | 35.67 | 106.20 | 2839.1 |
| Condition | Relationship | Value |
|---|---|---|
| ()/() ≧ 0 | Indetermination | 0 |
| ()/() < 0 & |()| > 1.96&|()| > 1.96 | Asymmetric complementation | 1 |
| ()/() < 0 & |()| > 1.96 & |()| > 1.96 & |()/()| ≈ 1 | Complementation | 2 |
| ETa | ETp | ETa + ETp | ||||||
|---|---|---|---|---|---|---|---|---|
| Trend | Value | Area | Trend | Value | Area | Trend | Value | Area |
| Upward | 1 | 94.60% | Upward | 1 | 0.20% | Upward | 1 | 2.70% |
| Unvaried | 0 | 5% | Unvaried | 0 | 6.30% | Unvaried | 0 | 75.50% |
| Downward | −1 | 0.40% | Downward | −1 | 93.50% | Downward | −1 | 21.80% |
| Year | Taole | Wuzhong | Yanchi | ||||||
|---|---|---|---|---|---|---|---|---|---|
| 2001 | 1048.2 | 194.8 | 1786.9 | 1073.3 | 179.1 | 1844.7 | 1077.4 | 192.3 | 1752.3 |
| 2002 | 1181.2 | 218.7 | 1776 | 1174.8 | 224.2 | 1791.7 | 1142.9 | 227 | 1697.6 |
| 2003 | 1086 | 233.4 | 1694.4 | 1145.8 | 195.9 | 1746.6 | 1182.8 | 247.4 | 1631.7 |
| 2004 | 901 | 226.2 | 1757.4 | 935.5 | 154.2 | 1842.4 | 841.6 | 206.7 | 1751.6 |
| 2005 | 834.6 | 203 | 1784.2 | 919.1 | 160.8 | 1840.8 | 843.8 | 214.5 | 1689.1 |
| 2006 | 928.4 | 218.4 | 1780.9 | 984.9 | 165.4 | 1843.8 | 917.5 | 204.8 | 1720.2 |
| 2007 | 967.2 | 265.9 | 1694 | 1013.7 | 221.8 | 1745.2 | 976.7 | 236.9 | 1677 |
| 2008 | 1076.3 | 228.8 | 1692 | 959.6 | 190.6 | 1762 | 934.4 | 229.6 | 1633.5 |
| 2009 | 1080.1 | 242.3 | 1666.6 | 919.1 | 202.8 | 1757.4 | 956.5 | 236.7 | 1623.4 |
| 2010 | 1084 | 283 | 1642.1 | 1020.6 | 245.9 | 1689.5 | 922.5 | 281 | 1599.6 |
| 2011 | 1103.4 | 301.9 | 1587.5 | 1121.8 | 235.3 | 1642 | 1019.2 | 262.9 | 1533 |
| 2012 | 877.5 | 294.3 | 1661.9 | 906.7 | 233.7 | 1743.3 | 996.3 | 264 | 1615.4 |
| 2013 | 807.5 | 271.4 | 1727.5 | 797.3 | 220.2 | 1796.5 | 904.8 | 272.8 | 1620.9 |
| 2014 | 898 | 370.3 | 1516.1 | 951.1 | 254.7 | 1673.8 | 927.4 | 291.4 | 1560.9 |
| 2015 | 979.1 | 301.6 | 1665.3 | 976.4 | 245.6 | 1738.8 | 1034.3 | 271.2 | 1602.7 |
| 2016 | 978.9 | 372 | 1627.5 | 976.6 | 282.8 | 1695.4 | 1056 | 307.3 | 1580.2 |
| 2017 | 889 | 347.6 | 1617.4 | 862.7 | 290.6 | 1675.7 | 971.8 | 320 | 1560.7 |
| 2018 | 888.9 | 316.5 | 1643.6 | 854.2 | 265.8 | 1719.4 | 965.5 | 299.3 | 1584.6 |
| 2019 | 856 | 332.4 | 1612.2 | 866 | 280.3 | 1696 | 934 | 309.9 | 1559.7 |
| 2020 | 913.3 | 293.5 | 1723.4 | 883.1 | 224.2 | 1823.4 | 1023.7 | 250 | 1669 |
| Year | Yinchuan | Haiyuan | Tongxin | ||||||
| 2001 | 1073.3 | 179.1 | 1844.7 | 1168.3 | 275.1 | 1571.8 | 1186.9 | 211 | 1668 |
| 2002 | 1174.8 | 224.2 | 1791.7 | 1225.9 | 314.3 | 1564.4 | 1177.7 | 226 | 1673.2 |
| 2003 | 1145.8 | 195.9 | 1746.6 | 1300.2 | 354.8 | 1429 | 1208.8 | 277 | 1541.4 |
| 2004 | 935.5 | 154.2 | 1842.4 | 935.2 | 282.6 | 1583.4 | 835.5 | 212.1 | 1700.2 |
| 2005 | 919.1 | 160.8 | 1840.8 | 975.7 | 311.4 | 1485.7 | 850.8 | 230.9 | 1606.4 |
| 2006 | 984.9 | 165.4 | 1843.8 | 1025.9 | 283.8 | 1540.4 | 959.3 | 222.3 | 1645.6 |
| 2007 | 1013.7 | 221.8 | 1745.2 | 1141.1 | 336.3 | 1469.5 | 1033 | 257.6 | 1584.7 |
| 2008 | 959.6 | 190.6 | 1762 | 1082.5 | 292.6 | 1477.6 | 1004.8 | 231.7 | 1594.6 |
| 2009 | 919.1 | 202.8 | 1757.4 | 1129.6 | 317.6 | 1456.4 | 1080.3 | 246.7 | 1592.8 |
| 2010 | 1020.6 | 245.9 | 1689.5 | 1220.2 | 397.9 | 1420.7 | 1144.7 | 289.6 | 1543.5 |
| 2011 | 1121.8 | 235.3 | 1642 | 1322.9 | 389.9 | 1350.4 | 1132.8 | 283.5 | 1474.2 |
| 2012 | 906.7 | 233.7 | 1743.3 | 1223.4 | 370.5 | 1405.4 | 964.9 | 294.4 | 1529.2 |
| 2013 | 797.3 | 220.2 | 1796.5 | 1082.4 | 377.3 | 1461.1 | 867.8 | 291.6 | 1577.5 |
| 2014 | 951.1 | 254.7 | 1673.8 | 1154 | 395.4 | 1343.4 | 1032.1 | 320.1 | 1472.6 |
| 2015 | 976.4 | 245.6 | 1738.8 | 1068.8 | 389 | 1412.7 | 991.9 | 300.4 | 1522.2 |
| 2016 | 976.6 | 282.8 | 1695.4 | 1081.8 | 380.1 | 1439.9 | 953.7 | 321.7 | 1545.1 |
| 2017 | 862.7 | 290.6 | 1675.7 | 1049.7 | 393.5 | 1421.9 | 939.8 | 327.8 | 1506.9 |
| 2018 | 854.2 | 265.8 | 1719.4 | 1133.1 | 400 | 1427.5 | 917.6 | 305 | 1523.5 |
| 2019 | 866 | 280.3 | 1696 | 1054 | 416.5 | 1421.4 | 965 | 323.3 | 1522.2 |
| 2020 | 883.1 | 224.2 | 1823.4 | 1086.9 | 359.5 | 1465.4 | 982 | 264.1 | 1602.3 |
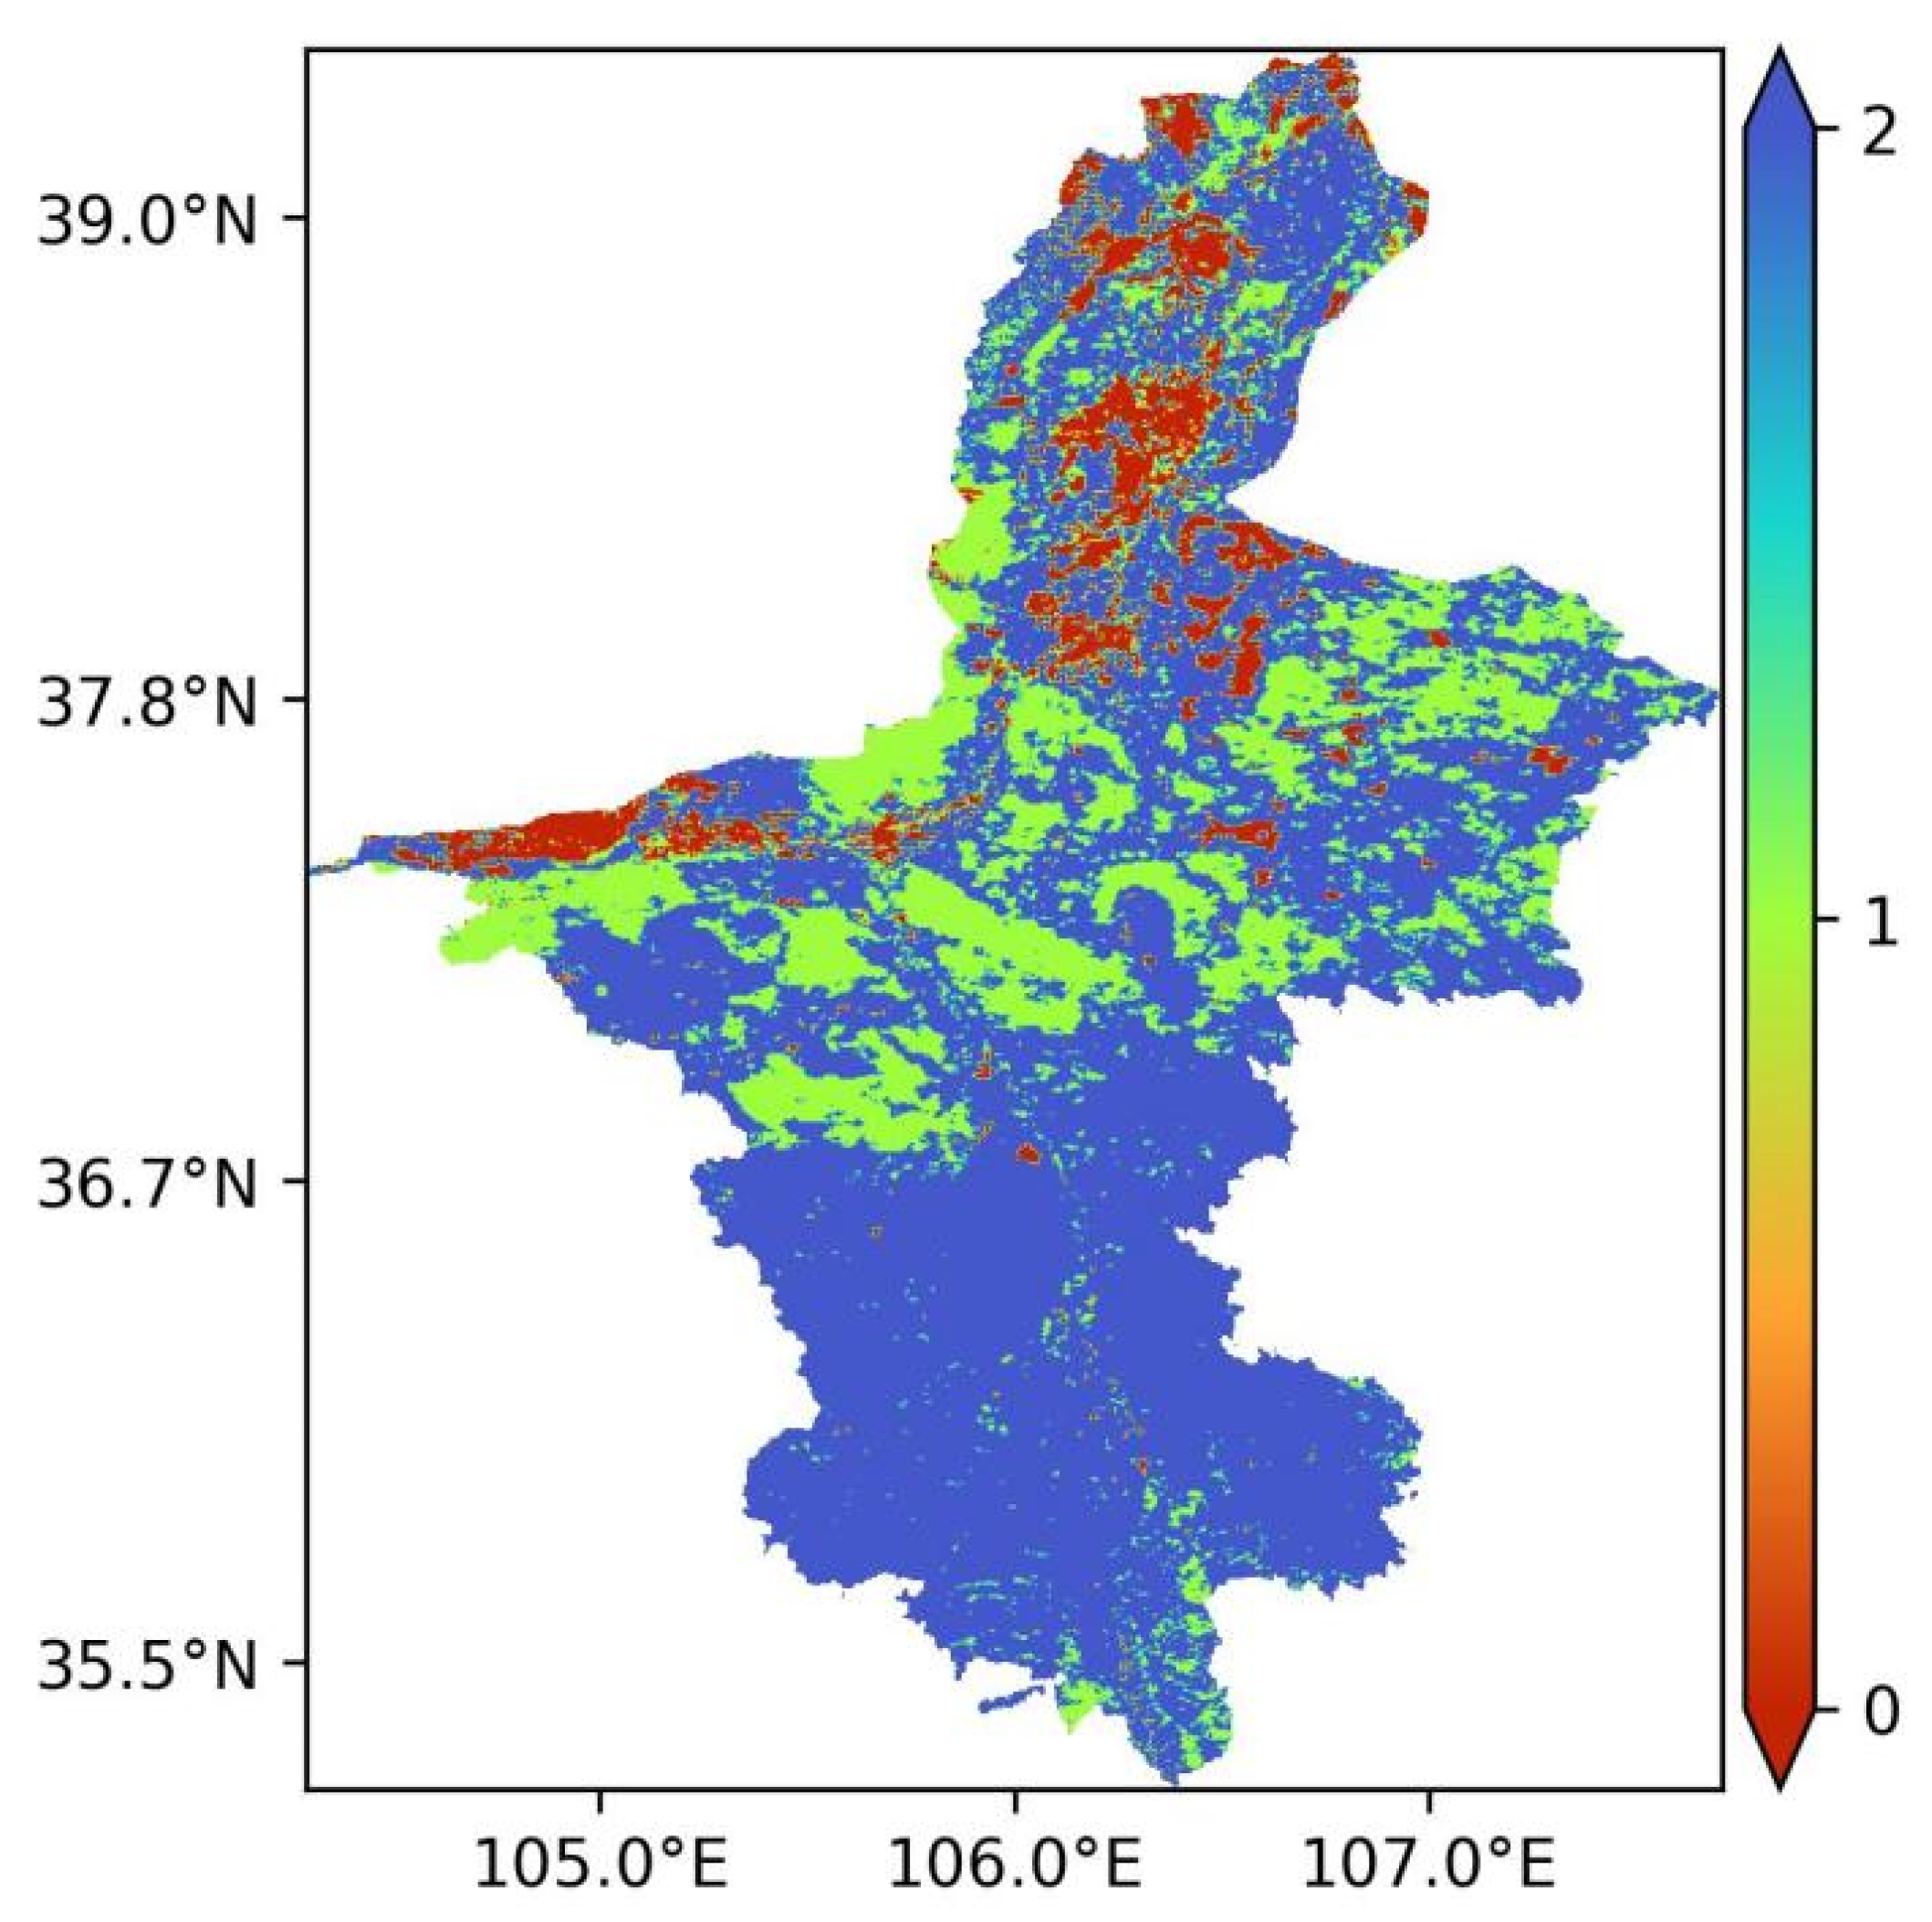
| Complementary Relationship | Value | Area |
|---|---|---|
| Indetermination | 0 | 8.80% |
| Asymmetric Complementation | 1 | 21.90% |
| Complementation | 2 | 69.20% |
| Trend | Value | Area |
|---|---|---|
| Upward | 1 | 0.20% |
| Unvaried | 0 | 4.70% |
| Downward | −1 | 95.10% |
| Month | Average Correlation Coefficient | ||
|---|---|---|---|
| Precipitation | Land Surface Temperature | NDVI | |
| January | −0.49 | 0.53 * | −0.08 |
| February | −0.13 | 0.35 | −0.14 |
| March | −0.66 * | 0.11 | −0.23 |
| April | −0.71 * | 0.13 | −0.25 |
| May | −0.43 | 0.34 | −0.41 * |
| June | −0.55 * | 0.12 | −0.58 * |
| July | −0.50 * | 0.29 | −0.69 * |
| August | −0.32 | 0.31 | −0.69 * |
| September | −0.35 | 0.34 | −0.50 * |
| October | −0.80 * | 0.19 | −0.31 |
| November | −0.74 * | 0.39 | −0.38 |
| December | −0.30 | 0.38 | −0.11 |
Publisher’s Note: MDPI stays neutral with regard to jurisdictional claims in published maps and institutional affiliations. |
© 2022 by the authors. Licensee MDPI, Basel, Switzerland. This article is an open access article distributed under the terms and conditions of the Creative Commons Attribution (CC BY) license (https://creativecommons.org/licenses/by/4.0/).
Share and Cite
Liu, H.; Song, D.; Kong, J.; Mu, Z.; Wang, X.; Jiang, Y.; Zhang, J. Complementarity Characteristics of Actual and Potential Evapotranspiration and Spatiotemporal Changes in Evapotranspiration Drought Index over Ningxia in the Upper Reaches of the Yellow River in China. Remote Sens. 2022, 14, 5953. https://doi.org/10.3390/rs14235953
Liu H, Song D, Kong J, Mu Z, Wang X, Jiang Y, Zhang J. Complementarity Characteristics of Actual and Potential Evapotranspiration and Spatiotemporal Changes in Evapotranspiration Drought Index over Ningxia in the Upper Reaches of the Yellow River in China. Remote Sensing. 2022; 14(23):5953. https://doi.org/10.3390/rs14235953
Chicago/Turabian StyleLiu, Huihui, Dongdong Song, Jinling Kong, Zengguang Mu, Xixuan Wang, Yizhu Jiang, and Jingya Zhang. 2022. "Complementarity Characteristics of Actual and Potential Evapotranspiration and Spatiotemporal Changes in Evapotranspiration Drought Index over Ningxia in the Upper Reaches of the Yellow River in China" Remote Sensing 14, no. 23: 5953. https://doi.org/10.3390/rs14235953