Article

Direct Assimilation of Chinese FY-3E Microwave Temperature Sounder-3 Radiances in the CMA-GFS: An Initial Study

1
Earth System Modeling and Prediction Centre, China Meteorological Administration, Beijing 100081, China
2
State Key Laboratory of Severe Weather, Institute of Meteorological, China Meteorological Administration, Beijing 100081, China
3
Joint Center for Data Assimilation for Research and Application, Nanjing University of Information Science and Technology, Nanjing 210044, China
*
Author to whom correspondence should be addressed.
Remote Sens. 2022, 14(23), 5943; https://doi.org/10.3390/rs14235943
Submission received: 15 October 2022 / Revised: 19 November 2022 / Accepted: 21 November 2022 / Published: 24 November 2022

Abstract

:
FengYun-3E (FY-3E), the fifth satellite in China’s second-generation polar-orbiting satellite FY-3 series, was launched on 5 July 2021. FY-3E carries a third-generation microwave temperature sounder (MWTS-3). For the first time, this study demonstrates that MWTS-3 radiances data assimilation can improve the China Meteorological Administration Global Forecast System (CMA-GFS). By establishing a cloud detection module based on the retrieval results of the new channels of MWTS-3, a quality control module according to the error characteristics of MWTS-3 data, and a bias correction module considering the scanning position of satellite and weather systems, the effective assimilation of MWTS-3 data in the CMA-GFS has been realized. Through one-month cycling experiments of assimilation and forecasts, the error characteristics and assimilation effects of MWTS-3 data are carefully evaluated. The results show that the observation errors in MWTS-3 data are similar to those in advanced technology microwave sounder (ATMS) data within the same frequency channel, are slightly larger than those in the advanced microwave-sounding unit-A (AMSU-A) data, and are much better than those in the MWTS-2 data. The validation of the assimilation and prediction results demonstrate the positive contribution of MWTS-3 data assimilation, which can remarkably reduce the analysis errors in the Northern and Southern Hemispheres. Specifically, the error growth on the upper layer of the model is obviously suppressed. When all other operational satellite observations are included, the assimilation of MWTS-3 data has a neutral or slightly positive contribution to the analysis and forecast results, and the improvement is mainly found in the Southern Hemisphere. The relevant evaluation results indicate that the MWTS-3 data assimilation has good application prospects for operation.

1. Introduction

In recent years, satellite observations have become a key component of the global operational numerical weather prediction (NWP) system due to their high spatial-temporal resolution and wide spatial coverage. Many studies have shown that direct assimilation of microwave-sounding data can remarkably improve the initial conditions of numerical models so as to improve the prediction levels of global and regional models [1,2,3,4,5]. Most NWP centers have reported a substantial reduction in the root mean square error (RMSE) in forecasts by effectively assimilating the data from the Advanced Television and Infrared Observation Satellite (TIROS) operational vertical sounder (ATOVS) onboard the National Oceanic and Atmospheric Administration satellites (NOAA-15, -16, -17, -18 -19, and -20), the Meteorological Operational satellite-A/B (MetOp-A/B) and the Aqua earth observing system. Adjoint sensitivity experiments [6] have proven that microwave temperature-sounding data has become the most influential observation in almost all operational forecasting systems [7,8,9,10].
Recently, China’s polar-orbiting meteorological satellites have become an important part of the global polar-orbiting satellite observing system. Since the successful launch of China’s new generation polar-orbiting satellite Fengyun-3A (FY-3A) on 26 May 2008 [11,12], Fengyun-3B/C/D (FY-3B/C/D) satellites have been launched successively. The performance of microwave sounders onboard these satellites is similar to those of the advanced microwave-sounding unit-A (AMSU-A) onboard the NOAA and MetOp satellites [11,12]. FY-3A/B are equipped with the first-generation microwave temperature sounder (MWTS-1), which has four channels with frequencies comparable to channels 3, 5, 7, and 9 of the AMSU-A [13]. FY-3C/D are equipped with the second-generation microwave temperature sounder (MWTS-2). MWTS-2 has 13 channels, and the channels located in the oxygen absorption band (50–60 GHz) are identical to those of the AMSU-A. Various studies on data evaluation [14,15] and assimilation have been carried out for the MWTS, and many of them have indicated that the assimilation of MWTS-1 and MWTS-2 data has positive impacts on NWP results [15,16,17,18,19,20].
FY-3E satellite was successfully launched on 5 July 2021, which is the world’s first meteorological satellite sent into the early-morning orbit for civil use [21]. It has a local equatorial crossing time of about 5:40 am. This satellite carries a third-generation microwave temperature sounder (MWTS-3). A systematic evaluation study [22] has demonstrated that the performance of MWTS-3 is remarkably better than the previous two generations of instruments, with more observational information and well-suppressed observational noises.
The purpose of this study is to evaluate the impacts of the direct assimilation of the MWTS-3 radiance data on the China Meteorological Administration global forecast system (CMA-GFS) for the first time. By establishing the quality control (QC) and bias correction modules suitable for the MWTS-3 data, the effective assimilation of MWTS-3 data in the CMA-GFS is realized. The influence of MWTS-3 data assimilation on the CMA-GFS is evaluated based on the results of one-month assimilation and forecasting. It should be noted that the original name of the operational numerical prediction system in China was the Global and Regional Estimation and PrEdiction System (GRAPES) [23,24,25]. After September 2021, it was renamed CMA-GFS.
The remainder of this paper is organized as follows. Section 2 introduces the CMA-GFS four-dimensional variational assimilation (4D-Var) system. The general details of the FY-3E MWTS-3 radiance data is described here. Section 2 also provides the QC and bias correction scheme for the MWTS-3 radiance data, and the initial assessments of MWTS-3 data. Section 3 presents the analysis of the numerical results of the FY-3E MWTS-3 radiance data assimilation experiments. The discussion and conclusion are given in Section 4 and Section 5.

2. Materials and Methods

2.1. CMA-GFS 4D-Var System

The main components of CMA-GFS include: four-dimensional variational (4D-Var) data assimilation; fully compressible non-hydrostatical model core with semi-implicit and semi-Lagrangian discretization scheme; modularized model physics package, and global and regional assimilation and prediction systems [23].
The CMA-GFS 4D-Var system is an analysis system designed for operational application [26]. This assimilation system adopts an incremental analysis method, and the assimilation process is divided into outer circulation and inner circulation. In order to reduce the amount of computation, the horizontal resolution of the nonlinear model in the outer circulation of the assimilation is 0.25 degrees, the horizontal resolution of the tangent linear model and the adjoint model in the inner circulation is 1.0 degrees, and only the simplified physical process is applied. The model has 87 vertical layers, with the top being approximately 0.1 hPa. The 4D-Var data assimilation system applies the incremental analysis scheme proposed by Courtier et al. (1998) [2]. By using the observations distributed within a time interval (t0, tn) in the assimilation, the cost function can be defined as follows:
J ( x ( t 0 ) ) = 1 2 ( x ( t 0 ) x b ( t 0 ) ) T B 1 ( x ( t 0 ) x b ( t 0 ) ) + 1 2 i = 0 N ( H ( x i ) y i o ) T R i 1 ( H ( x i ) y i o ) + J c
where x(t0) is a state vector composed of atmospheric and surface variables; xb(t0) is a background estimate of the state vector provided by a 6 h forecast, and y i o is a vector of all the observations; H is the observation operator that transforms the state vector x into observation space; Ri is the estimated error covariance of the observations at time i; Jc is a constraint term added to control various noises and errors generated in variational analysis. For the CMA-GFS data assimilation system, Jc is the weak constraints of the digital filtering. B is the error covariance matrix of xb. In order to solve the problem that the inverse of the background error covariance matrix (B−1) is too large to be computed, the background term is preconditioned, which improves the convergence in the minimization process and avoids calculating B−1 directly. In the CMA-GFS 4D-Var system, the limited-memory Broyden-Fletcher-Goldfarb-Shanno (L-BFGS) algorithm [27] is used to perform the minimization.
Currently, the CMA-GFS can directly assimilate radiosonde data, surface synoptic observations (SYNOPs), ship reports, aircraft reports (Airep), atmospheric motion vectors (AMVs), the AMSU-A and the microwave humidity sounder (MHS) data of NOAA-15/18/19, the AMSU-A, MHS and infrared atmospheric sounding interferometer (IASI) data of MetOp-A/B, Suomi National Polar-orbiting Partnership (NPP) ATMS data, the MWHS-2, micro-wave radiation imager (MWRI) and Global Navigation Satellite System (GNSS) radio occultation sounder (GNOS) data of FY-3C/D, the MWTS-2 and hyperspectral infrared atmospheric sounder-2 (HIRAS) radiance data of FY-3D, the Constellation Observing System for Meteorology, Ionosphere and Climate radio occultation (COSMIC RO) data, etc.
The radiative transfer for TIROS operational vertical sounder-12 (RTTOV-12) [28] is used as the observation operator for the direct assimilation of satellite radiance data in the CMA-GFS 4D-Var system. The transmittance coefficients applicable to the RTTOV-12 for FY-3E MWTS-3 simulation are provided by the National Satellite Meteorological Center of CMA.

2.2. FY-3E MWTS-3 Observations

The MWTS-3 radiance data in L1b format from September to October 2021 were used in this study. Channel characteristics of FY-3E MWTS-3 are shown in Table 1. Compared with the MWTS-2, MWTS-3 has improved its detection capability and performance indicators. The number of detection channels of MWTS-3 is 17, which is 4 more than that of MWTS-2. Channels 1 and 2 are horizontally polarized, while the other channels are vertically polarized. The noise equivalent differential temperature (NEDT) of channels 1–11 is about 0.3–0.35 K. The NEDT of channels 12–17 is slightly larger, around 0.6–2.1 K. The swath width of MWTS-3 is 2700 km, which is much larger than that of the MWTS-2 (2250 km) and is also wider than that of similar instruments in the world, such as the AMSU-A (2300 km) and ATMS (2500 km). For MWTS-3, the number of fields of view (FOV) in a single scan line also increases to 98 from 90 for the MWTS-2, which is larger than that of AMSU-A (30) and ATMS (96).
In terms of channel settings, two channels that can detect cloud water content were added into MWTS-3 for the first time, with the detection frequencies being 23.8 GHz and 31.4 GHz, respectively. As a result, the existing mature scheme can be used to identify the microwave data in cloudy areas [22] based on cloud liquid water path (CLWP) retrieval [29,30,31]. In addition, MWTS-3 also has two detection channels at the oxygen absorption band 50–60 GHz, which can be used to detect the atmospheric temperature information at central altitudes of about 500 and 700 hPa.
The weighting function of MWTS-3 is shown in Figure 1, which is calculated using the RTTOV-12 based on the American standard atmosphere profile. The MWTS-3 can detect atmospheric temperature information from the troposphere to the stratosphere. The peaks of the weighting function of channels 1–4 are mainly located on the ground, and those of channels 5–17 are uniformly distributed in the vertical direction, which allows the MWTS-3 to detect the atmospheric temperature information at different heights. The weighting function of channel 17 has the highest peak at about 2 hPa.

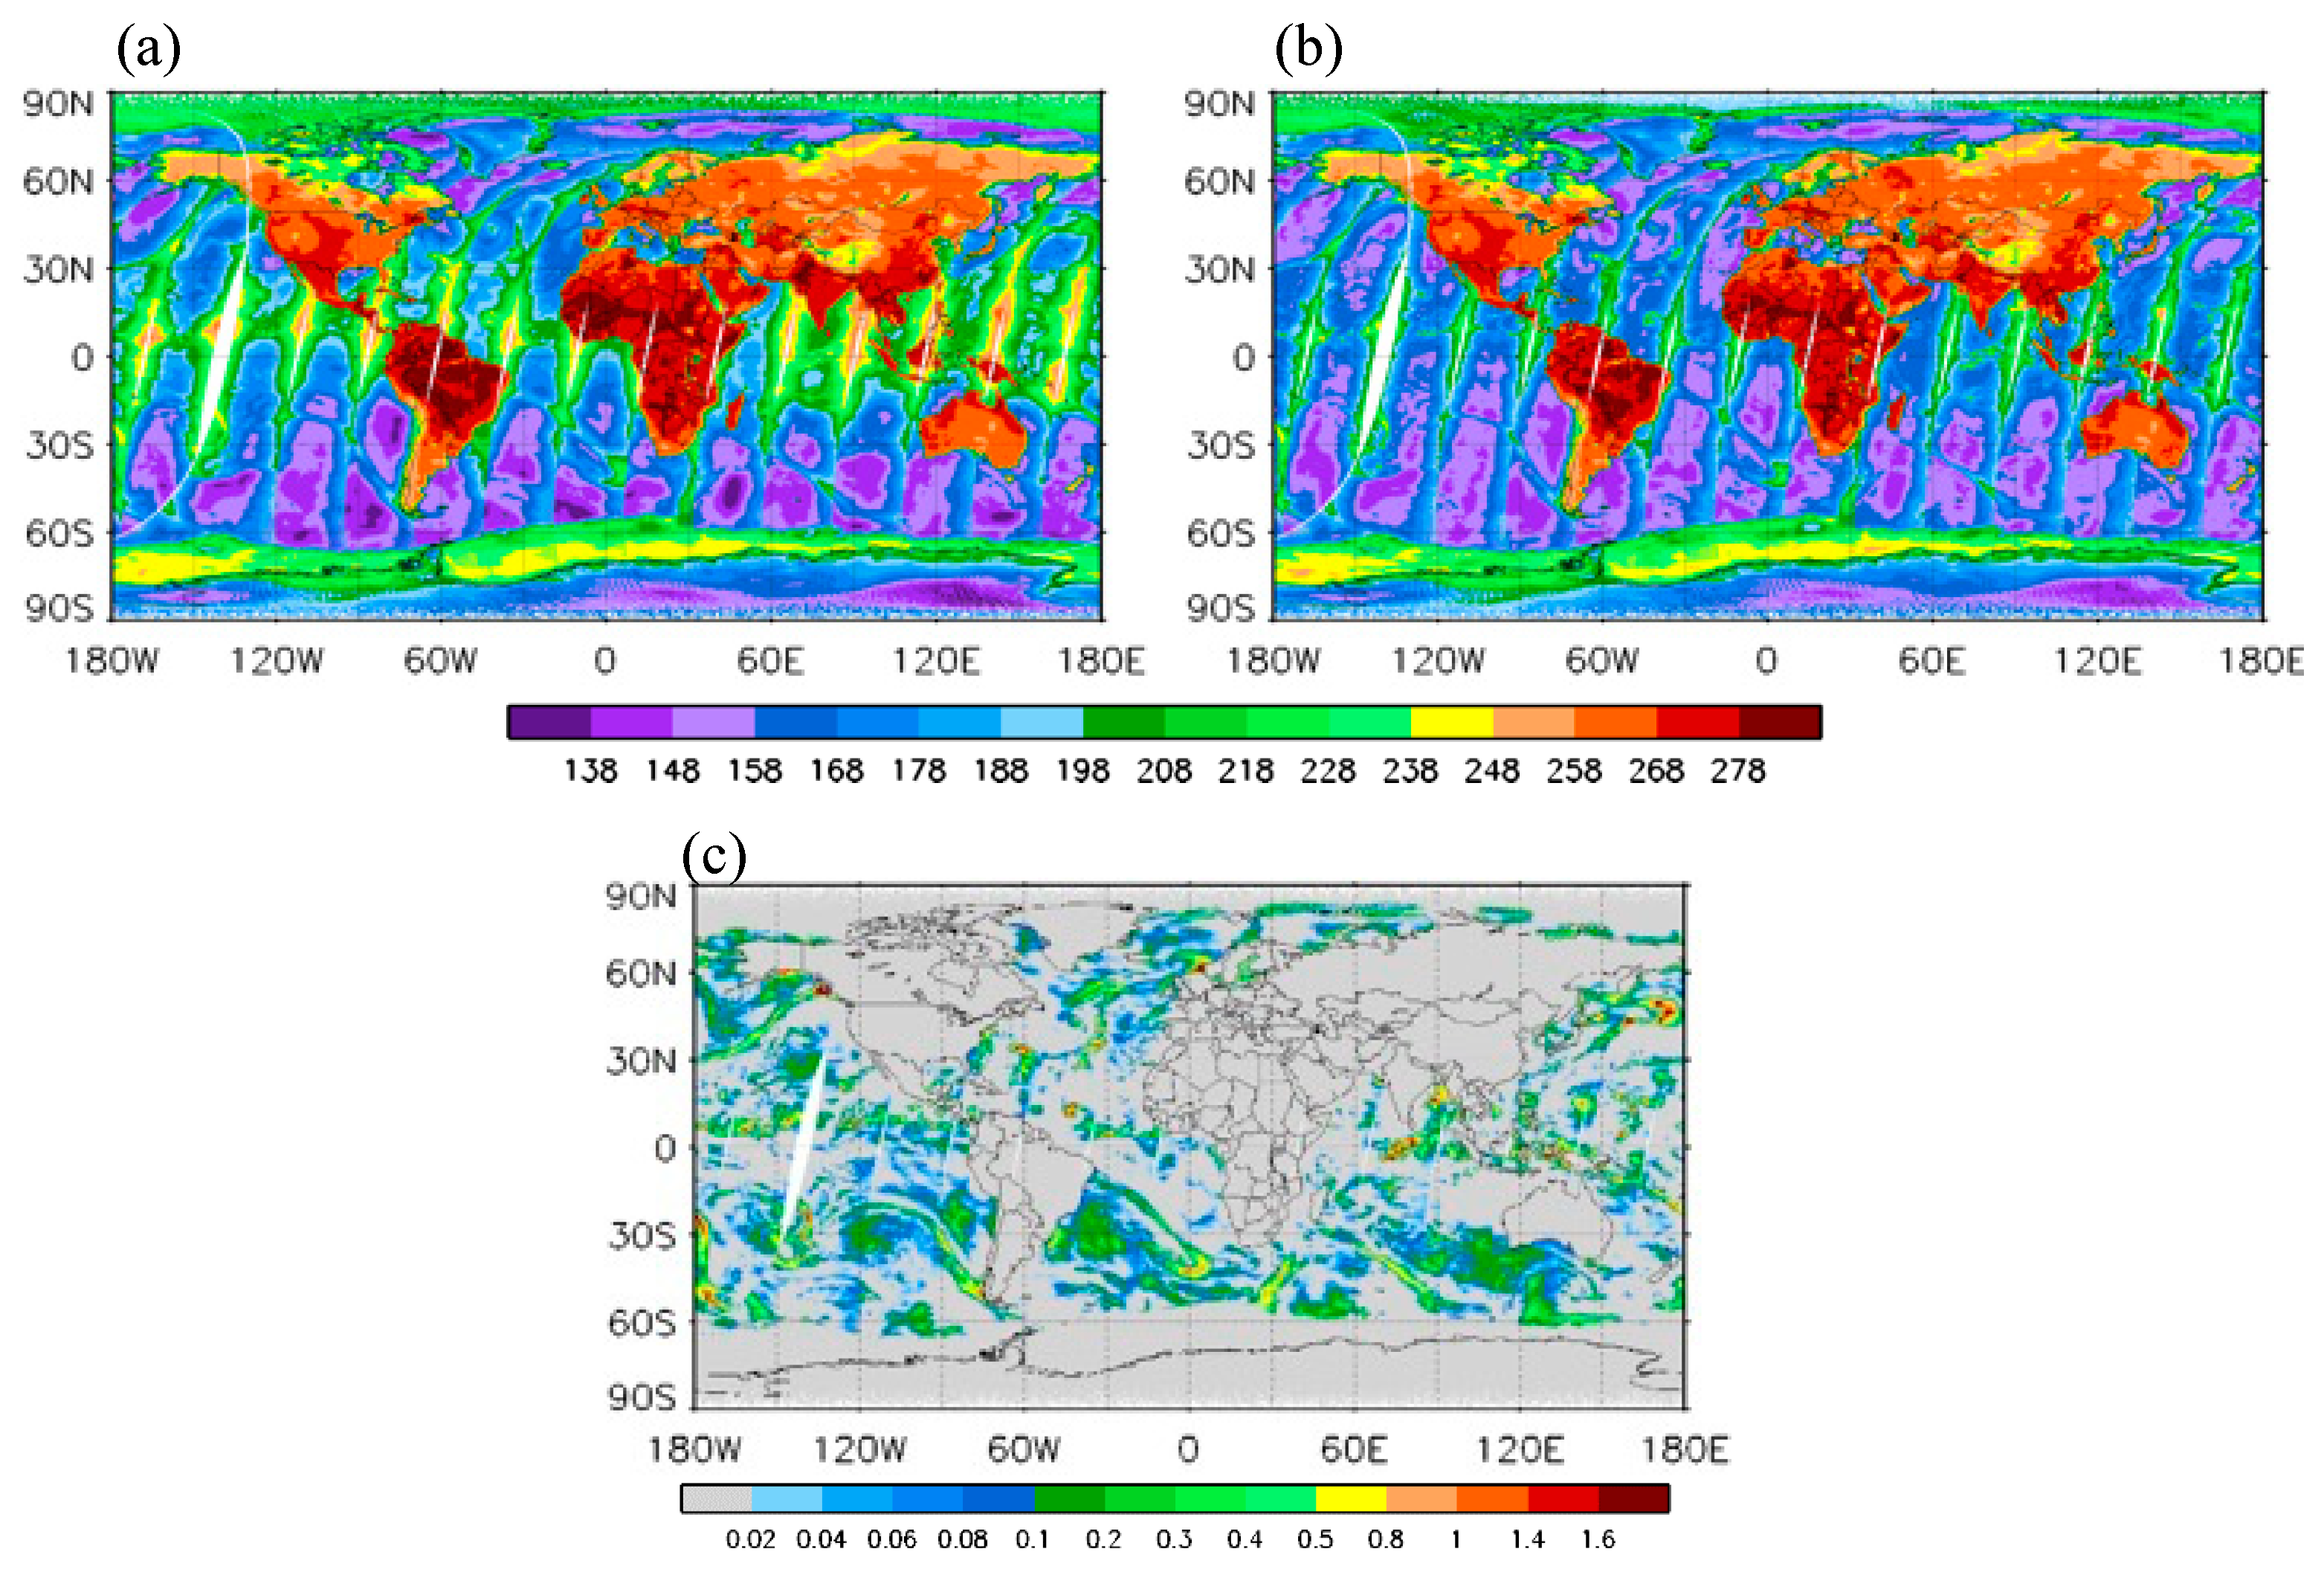
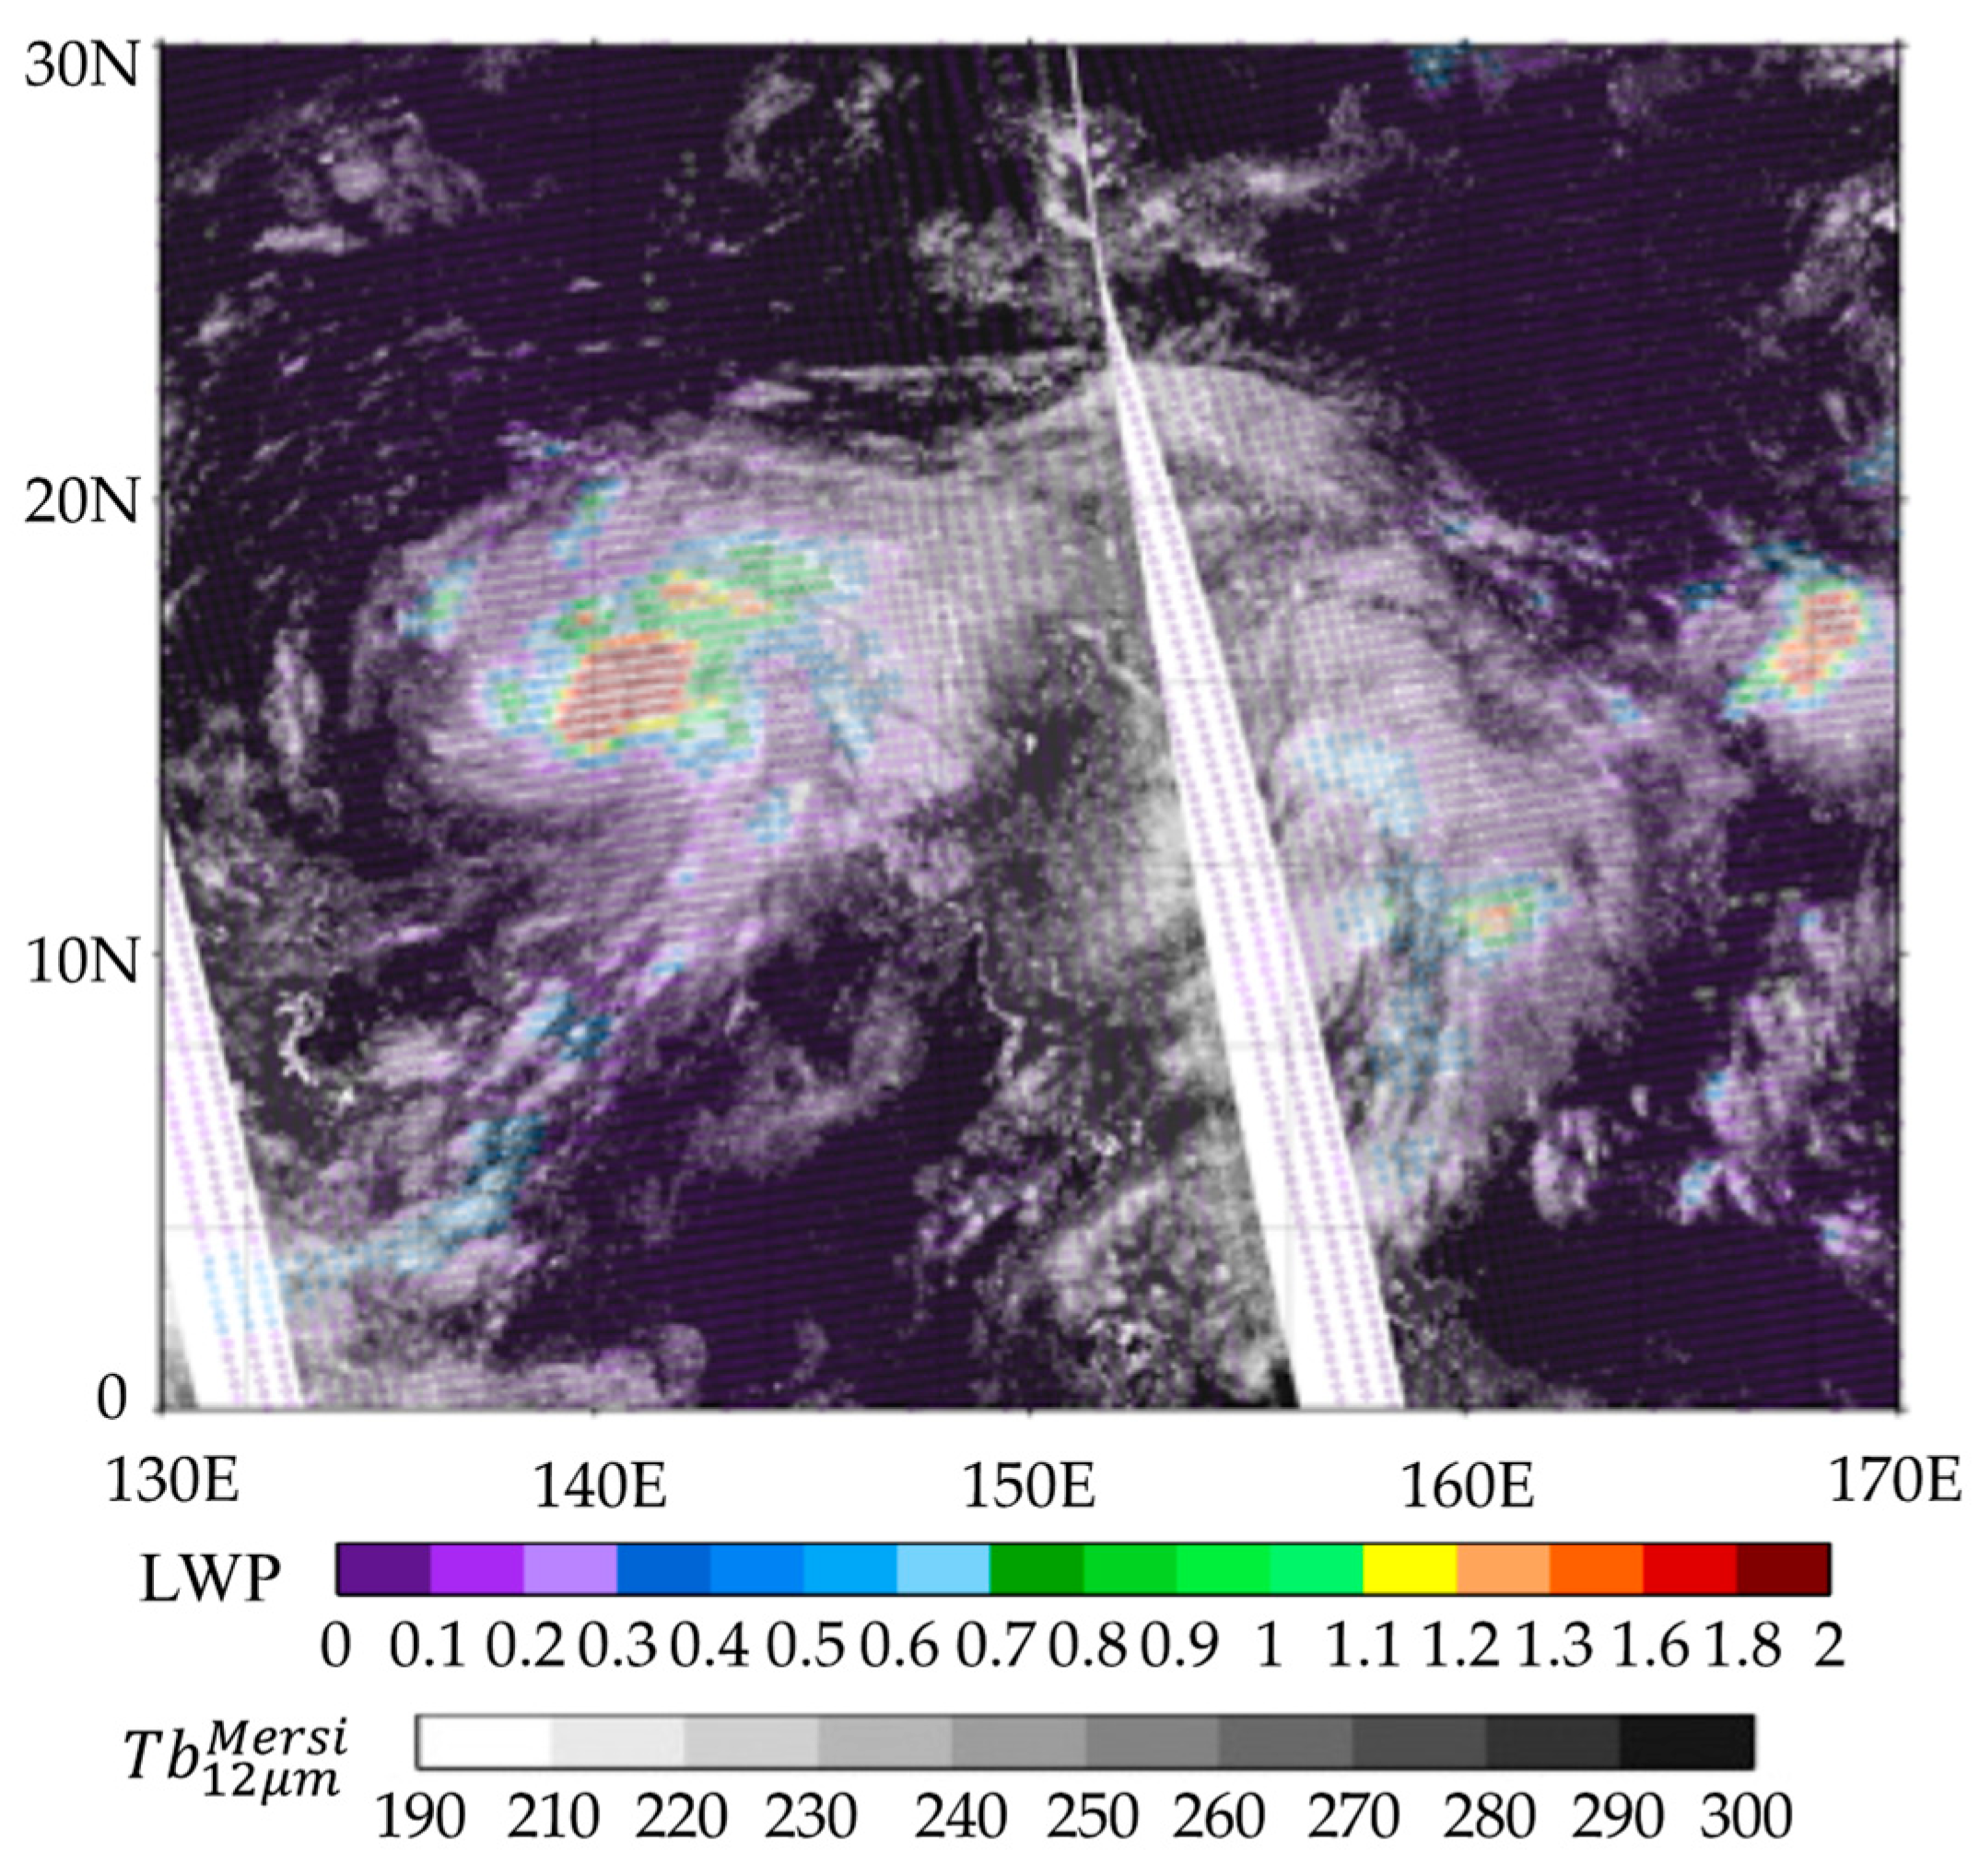
2.3. Cloud Detection

The MWTS-3 instrument observes the Earth from outer space, which is inevitably affected by clouds. Although the long wavelength allows microwave radiation to penetrate most nonprecipitation clouds, it is inevitably influenced by cloud absorption, large-particle scattering, etc. At present, the assimilation of radiance data in cloudy areas is very challenging due to the lack of reliable information about clouds in the input atmospheric profiles and the inability to accurately involve the cloud impact in the fast radiative transfer model. Many schemes have been developed to assimilate the cloud-influenced observations of microwave-sounding data [32,33,34]. However, in order to ensure the stability of the operational NWP system, the CMA-GFS is still assimilating the clear sky data of microwave temperature-sounding. Hence, it is necessary to perform cloud detection on the MWTS-3 data in this study.
The microwave sounders onboard the satellites (from FY-3A to FY-3D) lack channels that are sensitive to cloud absorption and scattering, which makes it difficult to perform cloud detection in MWTS-1/2 data assimilation. In the early stage, cloud products of the visible and infrared radiometer (VIRR) mounted on the same platform were used to assist in cloud detection [15,16]. In order to meet the needs of cloud detection, the MWTS-3 onboard FY-3E has included the channels of 23.8 GHz and 31.4 GHz for the first time. Previous studies have developed a mature CLWP retrieval method over the ocean area based on the brightness temperatures observed at these two frequencies [29], which provides an effective way for cloud detection in MWTS-3.
Figure 2 shows the distribution of FY-3E MWTS-3 observed brightness temperatures at channels 1–2 and the retrieved CLWP during 0300–1500 Universal Time (UTC) on 1 July 2014. Note that only the CLWP over the ocean area is retrieved (areas covered by sea ice are also excluded), which ranges from 0.01 to 2.0 g kg−1.
The accuracy of the retrieval product is assessed by comparing it with the brightness temperature of a 12 μm-channel (channel 7) in the medium resolution spectral imager with a low light level (MERSI-ll) [21] onboard the same platform. Figure 3 shows the distribution of the retrieved CLWP and MERSI channel 7 brightness temperature during 0300–1500 UTC on 24 September 2021. As shown in Figure 3, there is a tropical cyclone over the north Pacific with an obvious high brightness temperature center, which has a good spatial correspondence with the large-value area of the retrieved CLWP. A larger CLWP indicates thicker clouds.
For the land area, the differences between the observed and simulated brightness temperature (O-B) on window channel 3 of MWTS-3 is used for cloudy data identification. When the O-B exceeds 1.5 K, this FOV is determined to be the data over cloud and will be rejected.

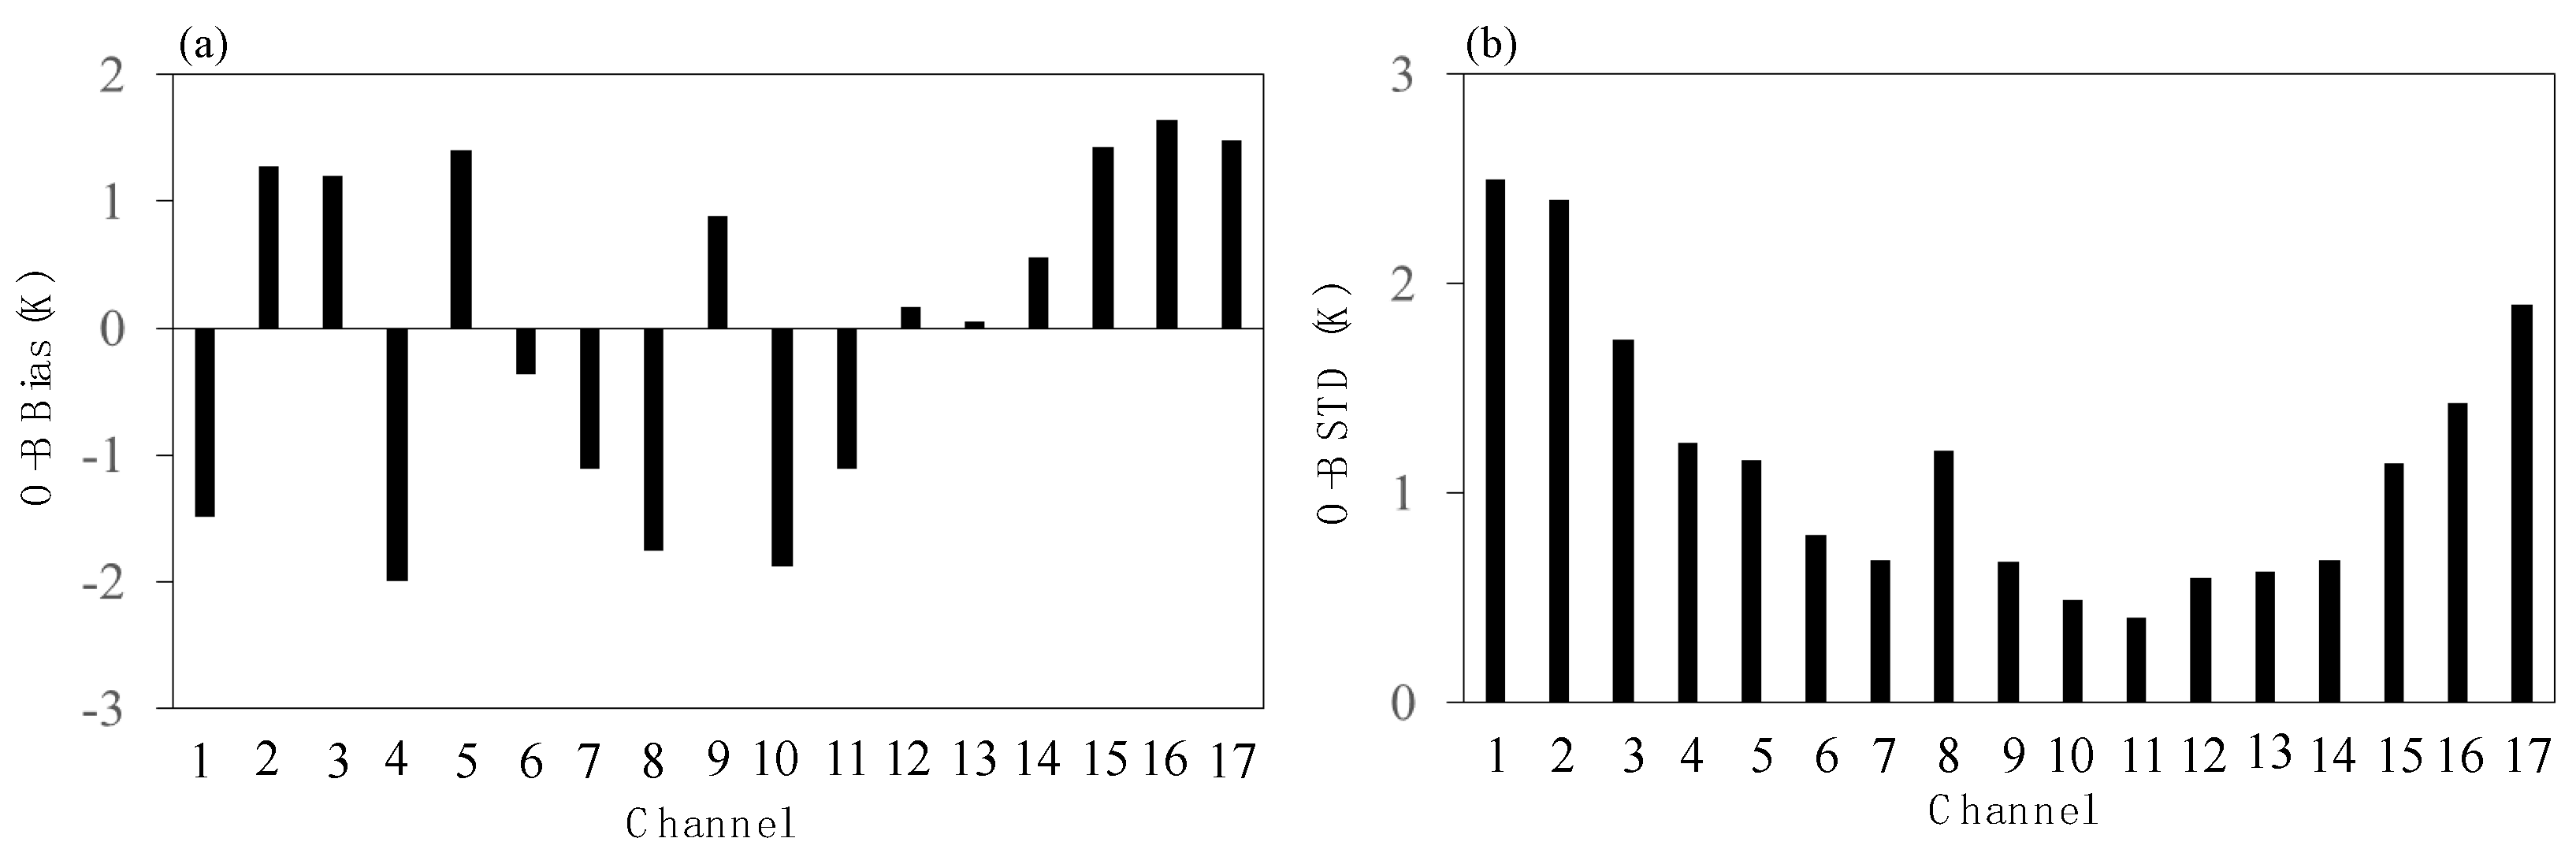
2.4. The Initial Evaluation of Observation Bias and Error

The accurate estimation of observation bias and error is an important prerequisite for the effective assimilation of satellite data. Observation from 10–23 September 2021 was selected for the evaluation of MWTS-3 data before assimilation. The RTTOV-12 was used to simulate the brightness temperature during the same period based on the ERA-5 reanalysis data released by the European Centre for Medium-Range Weather Forecasts (ECMWF). On this basis, the observation bias and error of MWTS-3 were estimated by analyzing the difference between the observed (O) and simulated (B) brightness temperature. In order to avoid the influence of the uncertainty of land surface emissivity, only clear-sky observations over the ocean were selected for the estimation. The means and standard deviations (STDs) of the calculated O-B of the MWTS-3 data are shown in Figure 4.
It can be seen that the biases and errors have great channel differences. For all channels, the biases are basically between ±2.0 K. Specifically, the biases of channels 1, 4, 7, 8, 10, and 11 are negative, whereas the biases of channels 4, 8, and 10 reach about −2.0 K. Channels 2, 3, 5, and 9 and the four channels in the upper stratosphere, i.e., channels 14–17, all have positive biases, which are basically around 1.5 K. While the biases of rest channels are close to 0.
The O-B STD (Figure 4b) gradually decreases and then increases with the increasing height from the ground to higher altitudes. The O-B STDs of channels 1–5 are sensitive to clouds and are also greatly affected by weather systems. Influenced by the relatively larger error of the lower-layer background, the O-B STDs of these channels are the largest. The peak values of the weighting function of channels 6–14 are mainly between 20–700 hPa, and the overall STD is within 1 K (except channel 8). The STD of channel 8 is about 1.2 K, obviously higher than those of adjacent channels. The peak values of the weighting function of channels 15–17 appear in the upper stratosphere, where remarkable increases in the observation errors are found in these channels, which may be due to the large error of the upper-level temperature profile in the background field and large NEDTs of these channels.
In general, the observation errors of MWTS-3 are within the normal range; only the noise of channel 8 is greater than expected. In addition, the biases of channels 6–7 also exceed those of similar channels of the same-type instruments, such as the ATMS (personal communication with Prof. Wen F. Z.).

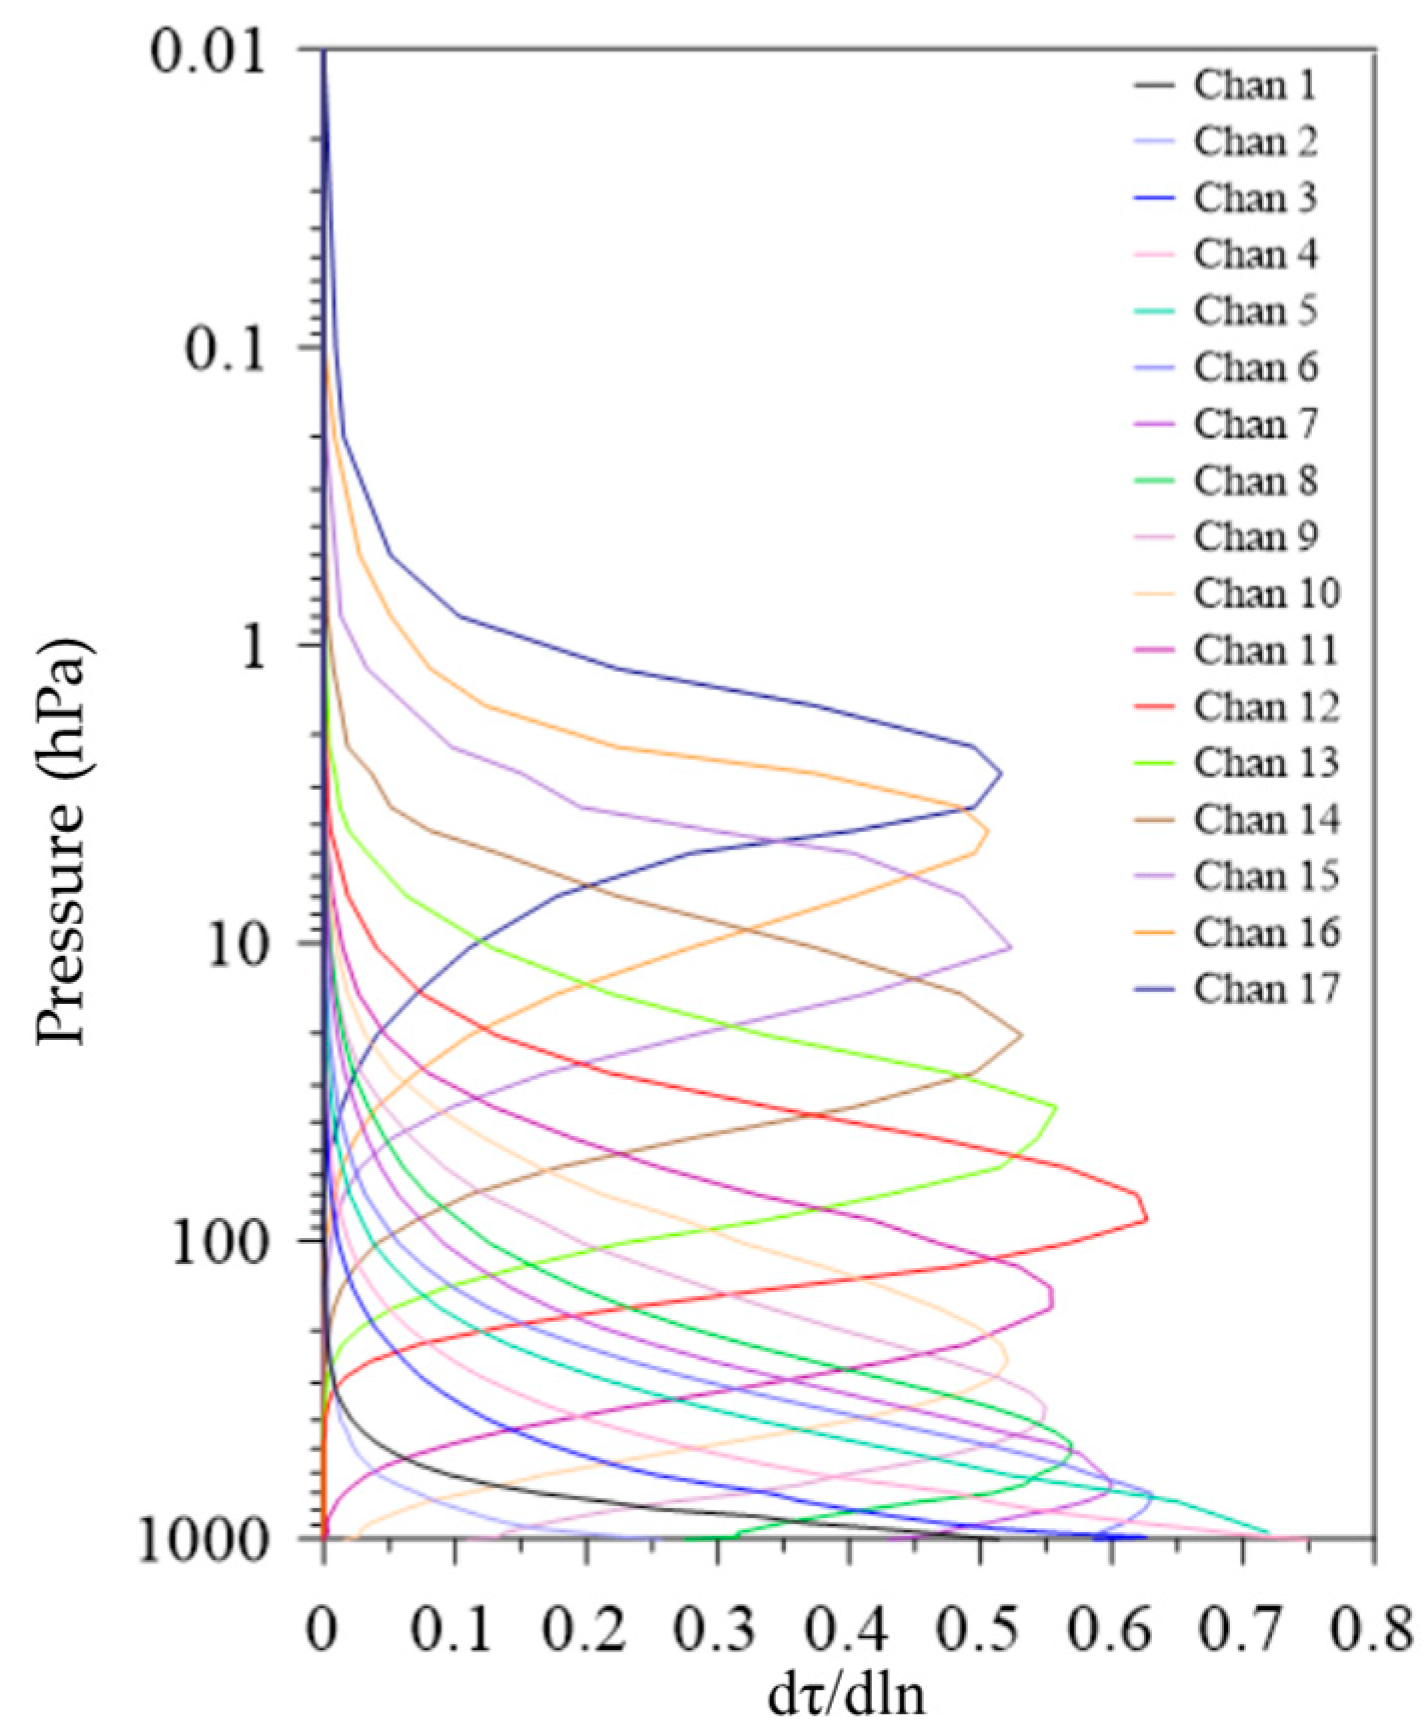
2.5. Channel Selection

As shown in Figure 1, it is found that the maximums of the weighting function of MWTS-3 channels 1–5 are close to the ground and are sensitive to the underlying surface. Due to those inaccurate surface physical variables, such as the surface temperature and surface emissivity, these near-ground channels were not included in the data assimilation. When considering the bias problems of channels 6–8 in the preliminary evaluation in Section 2.4, these three channels were also excluded. For the upper tropospheric or stratospheric channels 11–17, since the error of the CMA-GFS is relatively larger near the model top (10 hPa to 0.1 hPa), the two high-level channels of 16 and 17 were excluded. As a preliminary study, MWTS-3 channels 9–15 were directly assimilated in the CMA-GFS.

2.6. Quality Control Based on Scan and Surface Characteristics

In addition to cloud detection, some extra QC procedures were applied to eliminate the observation data with abnormal O-B values caused by complex underlying surfaces and large terrain height.
Extra QC procedures were carried out in the following order. (I) The observations of channels 9 and 10 in the cloudy area are removed. (II) All FOVs covering the coastline are removed. A land mask database with longitudinal and latitudinal resolutions of 0.1° is used for land/ocean/coast identification. (III) The 10 outermost FOVs on each side of a scan line are not used; (IV) The observations of channel 9 over the sea ice or the land are not used. Sea ice surface is identified by the criteria that the sea surface temperature is lower than 271.45 K. (V) If the terrain height is greater than 500 m, the data of channel 10 is rejected. This threshold is based on previous experience. In the CMA-GFS, the QC of AMSU-A, ATMS, MWTS-1/2 data all adopt this threshold. Lastly, the MWTS-3 data, which passes all the above QC procedures, is thinned to a spatial resolution of 120 km according to the distance between the observations and the nearest model grid.

2.7. Bias Correction

The CMA-GFS 4D-VAR system was used in this study. The basic theory of variational data assimilation is the Bayesian conditional probability theorem [35]. This theory assumes that the background error and observation error satisfy the Gaussian distribution, and that there is no systematic bias. However, in practical application, systematic biases generally exist in the background and are mainly caused by the continuous forward integration of the numerical model. Meanwhile, there are inevitably systematic errors in the radiation transfer model simulations. These also lead to a certain degree of systematic biases in the O-B, meaning effective bias correction is necessary.
The importance of bias correction for satellite radiances in data assimilation has been realized by many meteorologists, and a lot of studies have been conducted to develop effective bias correction methods. It is found that systematic bias mainly consists of the bias caused by the scanning position difference and the bias depending on the air-mass property. Harris and Kelly (2001) developed a static bias correction scheme [36]. After a lot of practical applications, it has proven to be an effective correction scheme and is widely used in operational NWP centers around the world [3,4]. In 2007, Liu et al. (2007) added this scheme to the CMA-MESO model and also achieved good results [37]. However, considering the limitation of the static bias correction scheme in estimating the bias caused by the change in the weather system, an air-mass bias correction method has been proposed to take into account the impact of weather systems on systematic biases [3]. In addition, a variational bias correction scheme has also been established, which considers the variation of biases in combination with the minimization process of the assimilation system [38]. At present, this scheme has been applied in many national operational forecast centers, such as the National Centers for Environmental Prediction (NCEP) and the ECMWF [3,39,40]. After selecting the appropriate forecast factors, the variational bias correction scheme statistically updates the correction coefficients in the minimization process of the cost function. This scheme has also been tested in the CMA-GFS, and it is expected to achieve operational application in 2023. However, only the scan bias correction and the air-mass bias correction are involved in this study.

2.7.1. Scan Bias Correction

Since the scan angle bias obviously changes with the latitude, the statistics of scan bias also need to be conducted in different latitude bands. The whole hemisphere was divided into 18 latitudinal bands using 10° intervals. For each latitude band, the O-B difference between each scanning position and the nadir point in each scan line was calculated, and then the average value of all the O-B differences in the same latitude band was obtained as the systematic bias in this latitude band. A linear smoothing method was also applied to avoid discontinuous correction between the two adjacent latitudinal bands.

2.7.2. Air-Mass Bias Correction

In this study, two predictors were selected for the air-mass bias correction, namely, the thicknesses between 300–1000 hPa and 50–200 hPa of the background. Using the two-week thickness data, a linear regression equation was established for each channel, and the coefficients, ajo and aji, in the regression equation were obtained for the channel j data with a scan angle of θ . The regression equation is as follows:
Bias j ( θ ) = a j 0 + i = 1 2 a j i ( θ ) X j i ( θ )
Here Bias j is the O-B bias, and Xji is for the thickness. ajo and aji represent the linear relationship between the O-B bias and the two thickness data. Using these coefficients, the O-B bias was calculated and subtracted from each observation in the assimilation process.
After the bias correction, the QC module also removes the observation data with large O-B values, and the pixels with O-B values greater than two times that of the observation error are rejected. According to the analysis results in Figure 4, the observation errors were set to 0.55 K for MWTS-3 channels 9, 10, and 12–14, 0.4 K for channel 11, and 1.1 K for channel 15 in this study.

3. Results

3.1. Experimental Design

Four experiments were conducted to demonstrate the impact of MWTS-3 data on the CMA-GFS during the period from 24 September to 25 October 2021. Table 2 shows the specific experimental designs. Experiment 1 assimilated only the conventional observations, called CTRL1. The conventional observations contain a global set of surface and upper-air reports, including radiosondes, SYNOP, ship reports, Aireps, and AMVs from the Global Telecommunications System (GTS). Experiment 2 assimilated the conventional observations: NOAA-15/18/19 AMSU-A, NOAA-18/19 MHS, MetOp-A/B AMSU-A, MHS and IASI, NPP ATMS, FY-3C/D MWHS-2 and MWRI, FY-3D MWTS-2 and HIRAS radiance data, FY-3C/D GNOS, COSMIC RO data, etc., called CTRL2. The setup of the two sensitive experiments (TEST1 and TEST2) is identical to the control experiments (CTRL1 and CTRL2), except that the FY-3E MWTS-3 radiance data were added in TEST1 and TEST2.

3.2. Analysis and Forecast of the Cycling Experiments

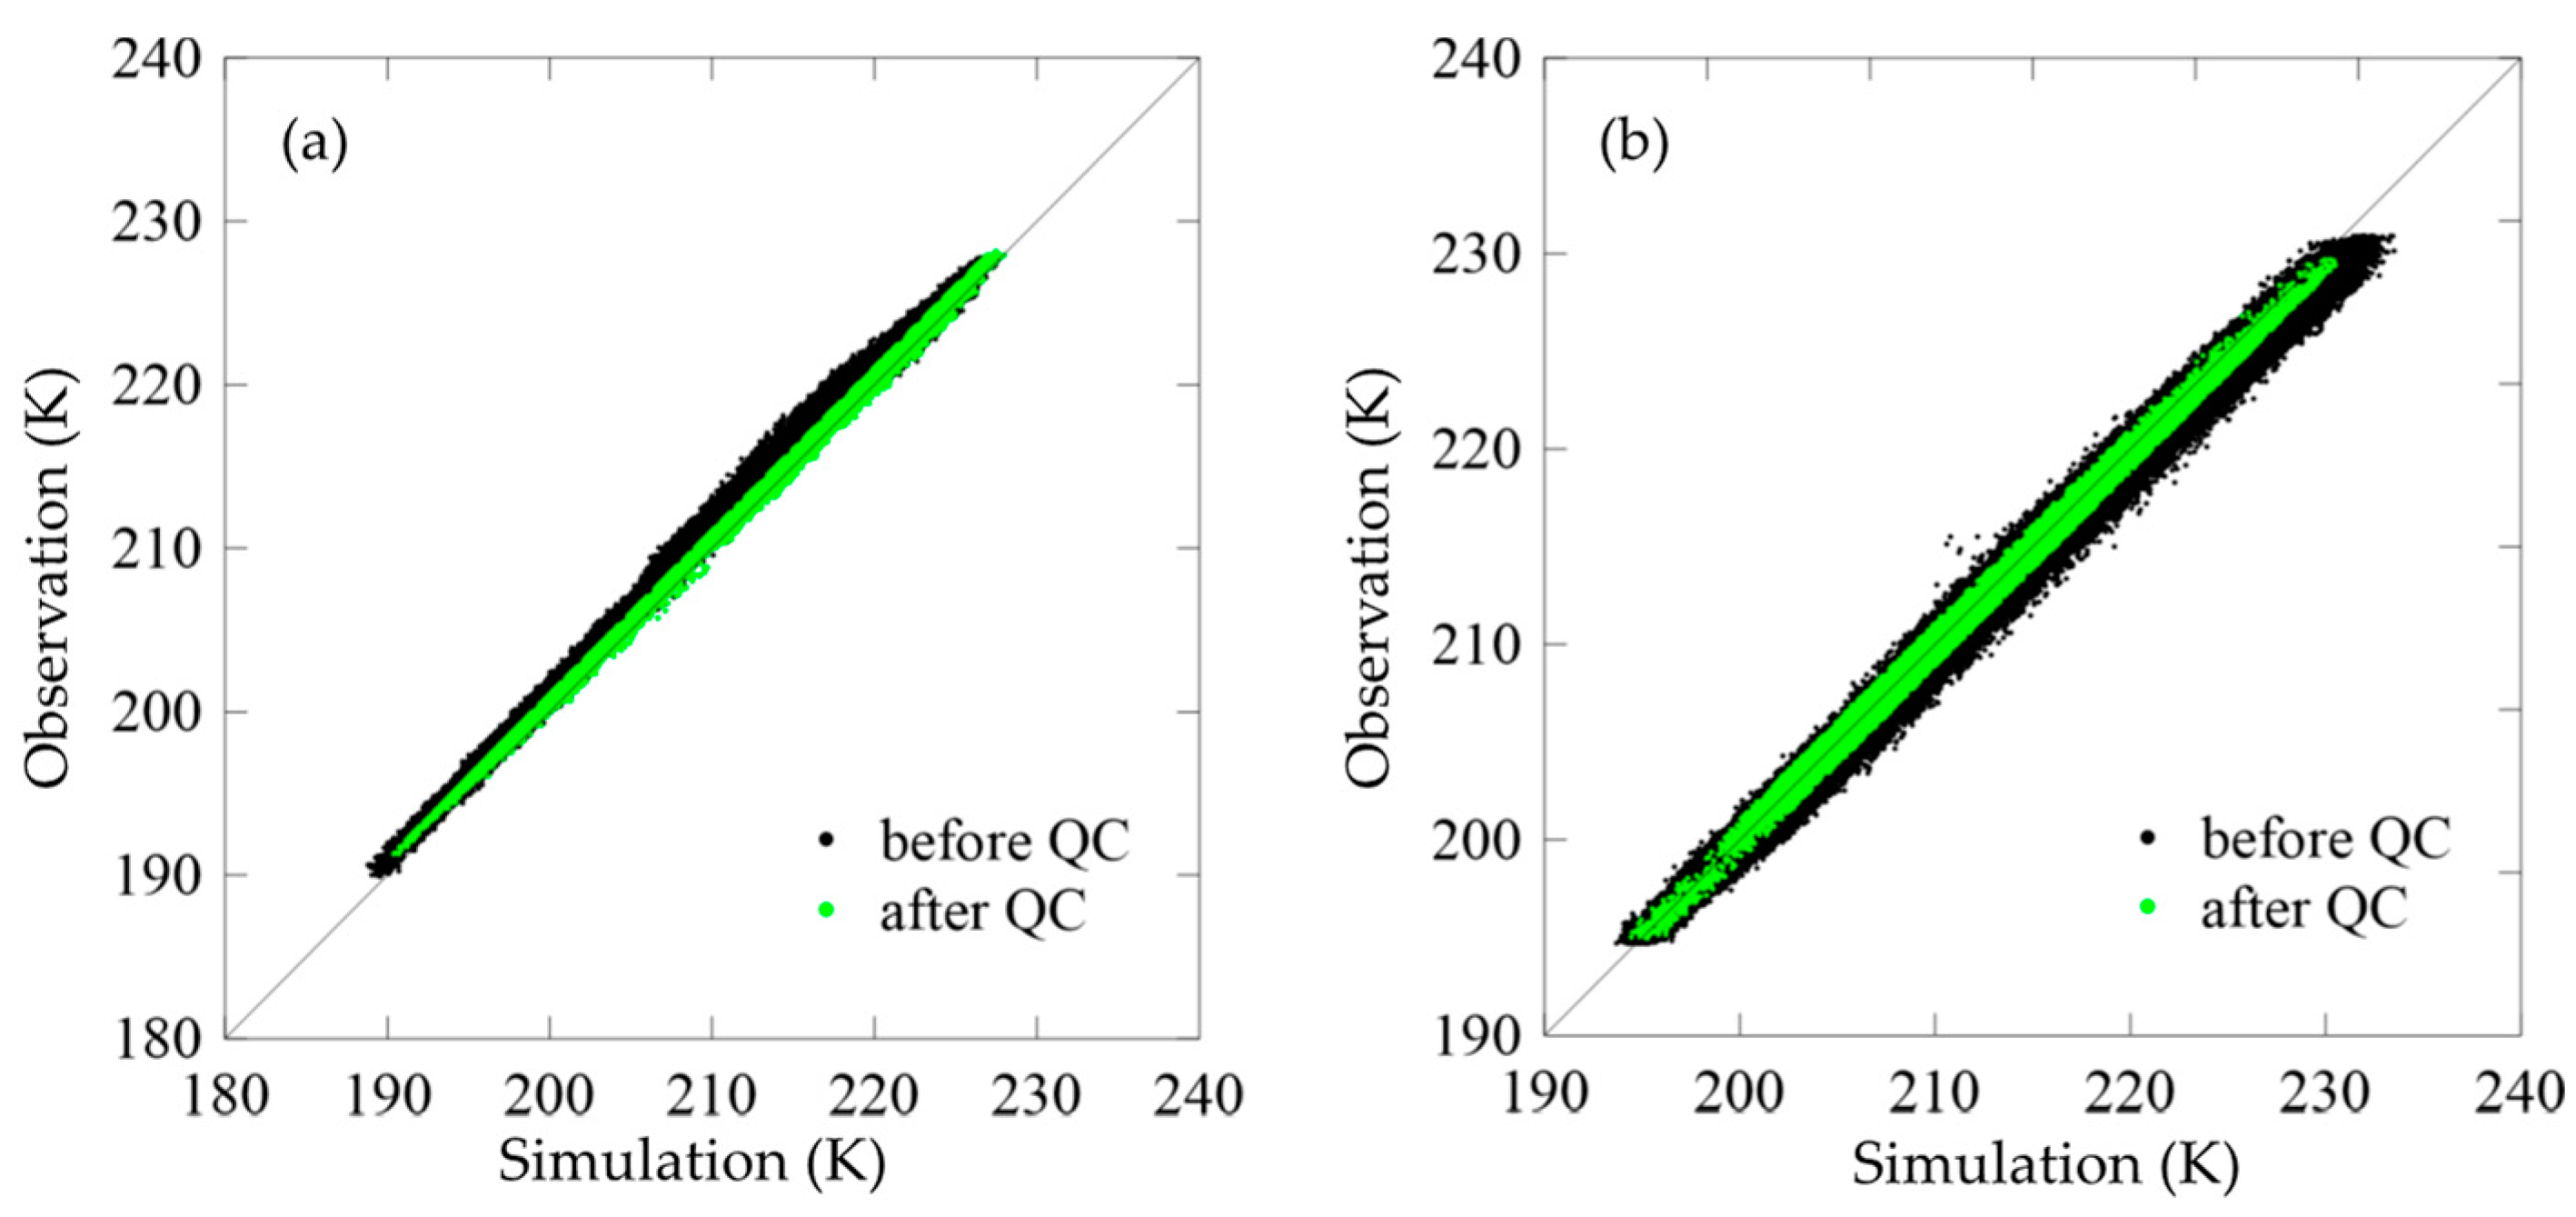
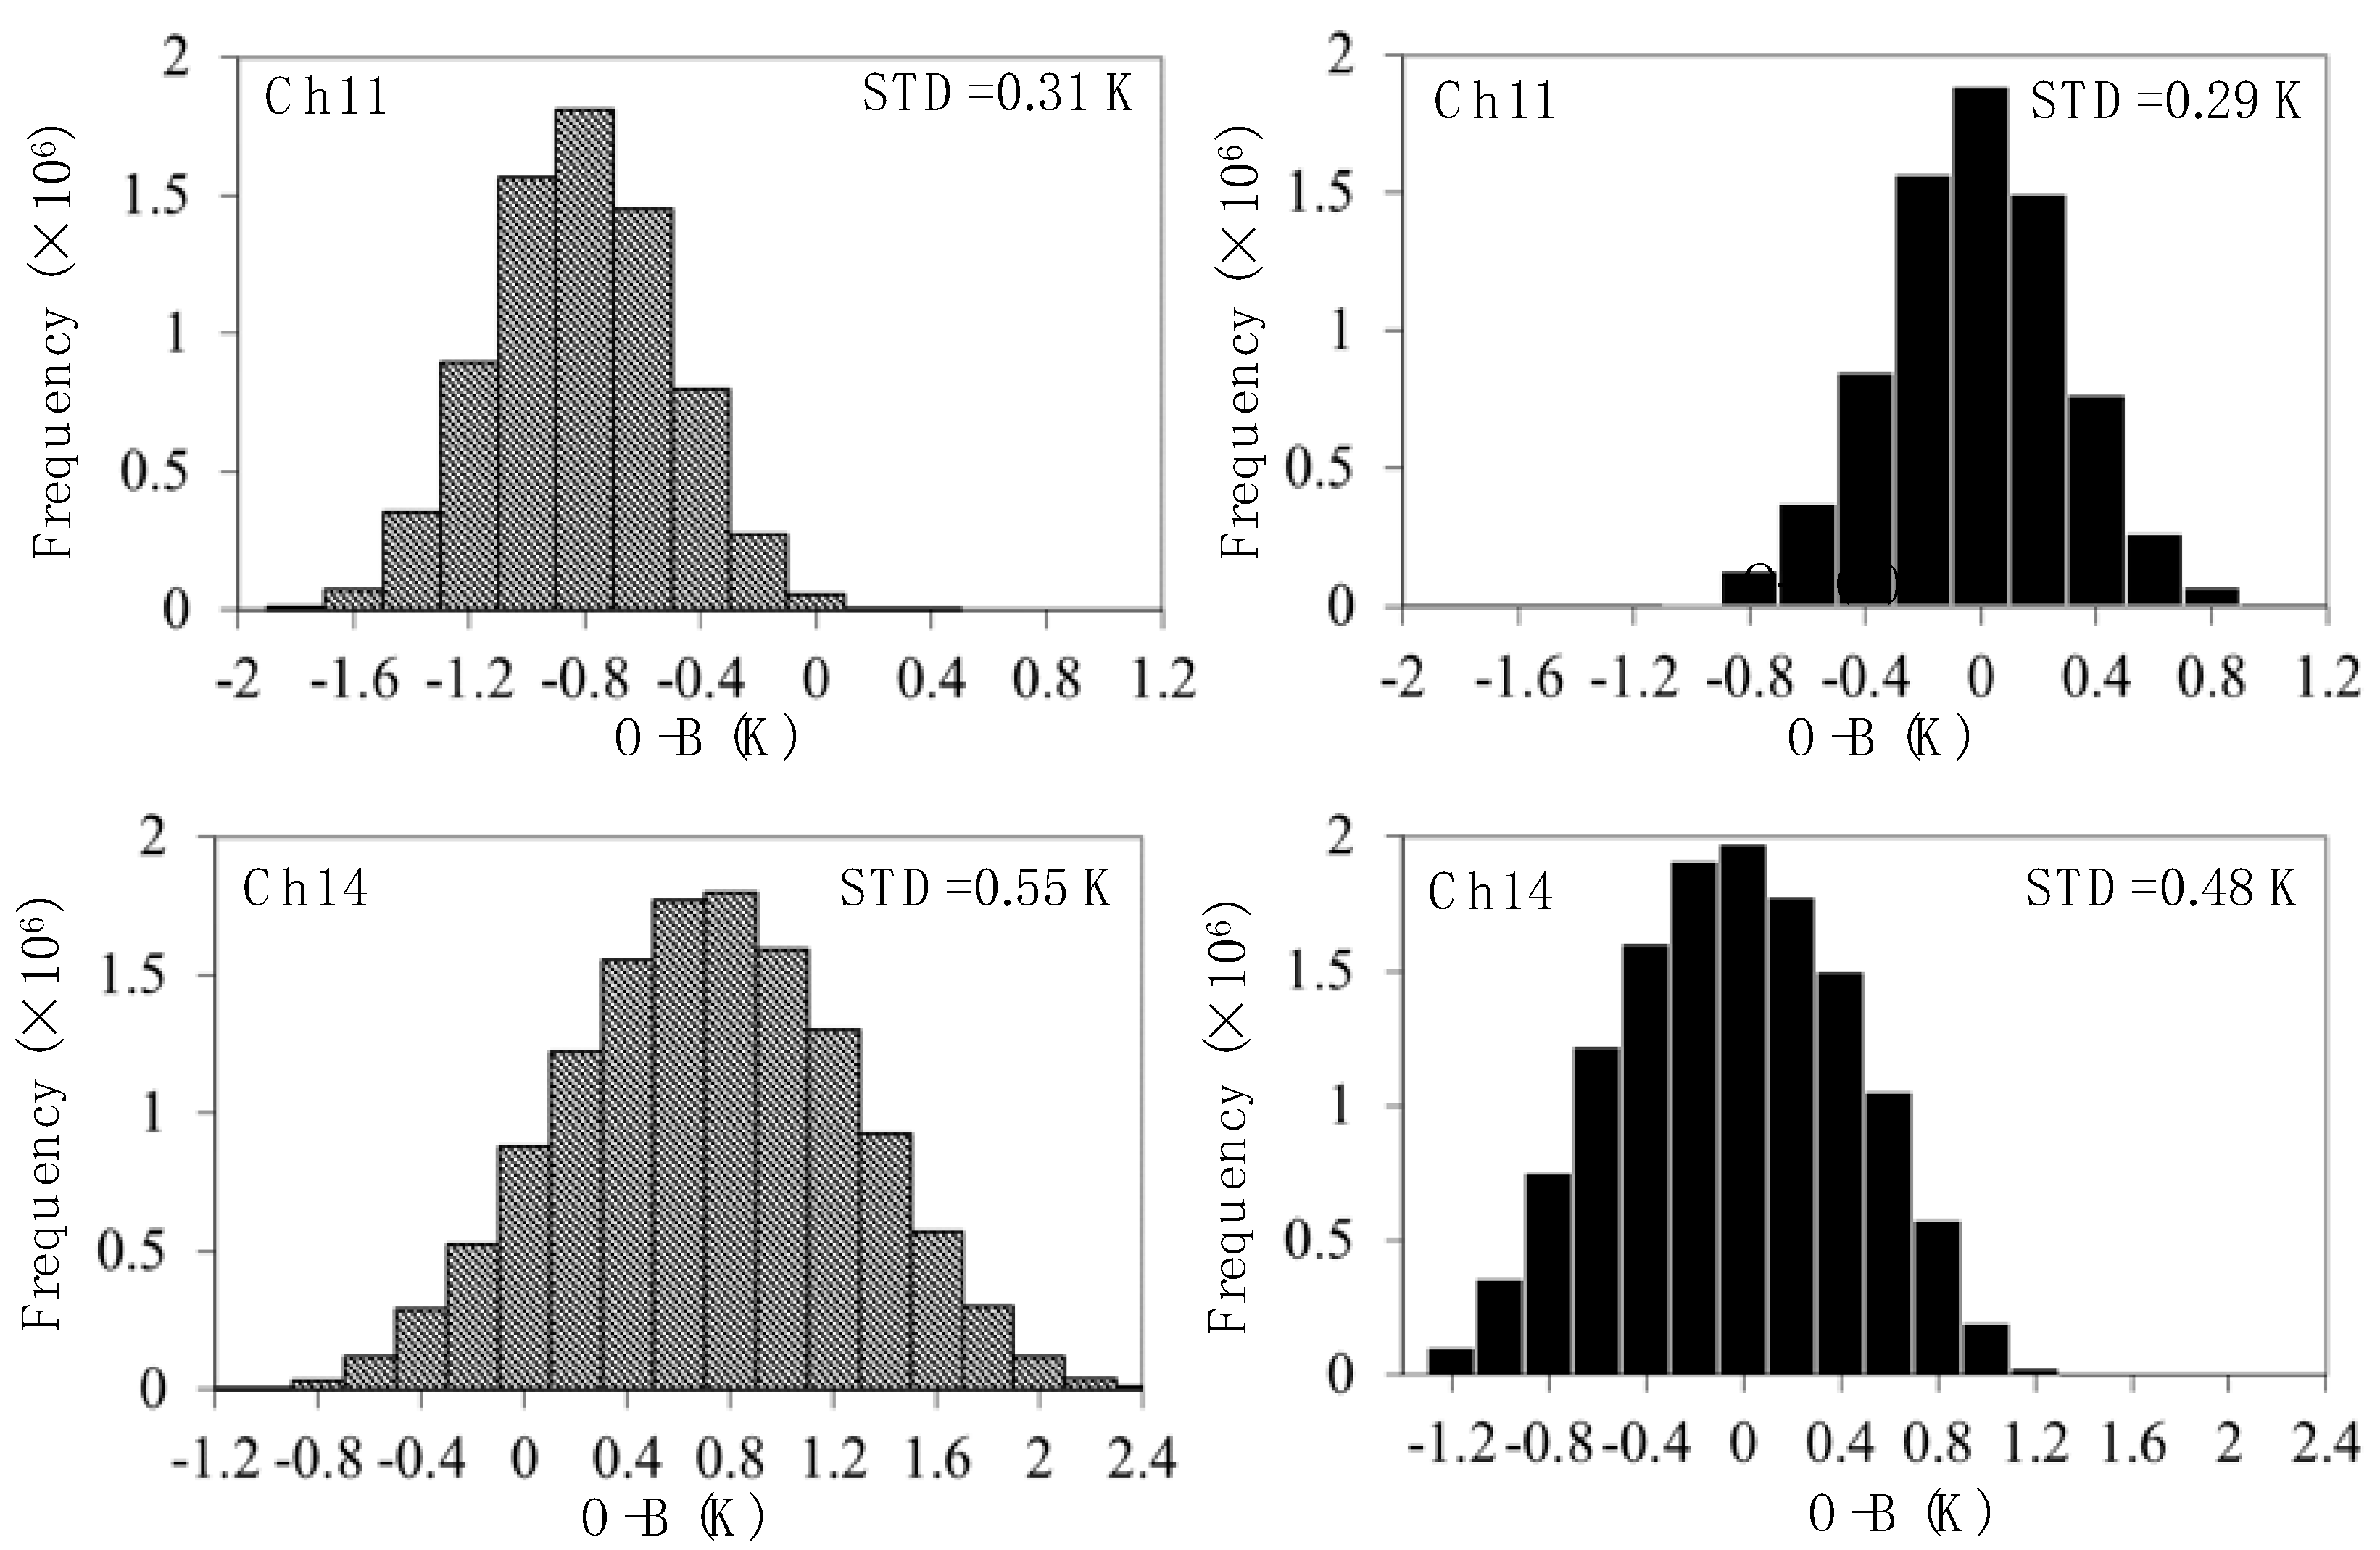
3.2.1. Characteristics of Data after Quality Control and Bias Correction

Figure 5 shows scatter plots of the observed and simulated brightness temperature of MWTS-3 channels 11 and 14 before and after QC during September 24–30, 2021. It can be seen that the differences between the O and B of channel 11 are larger before QC, which are scatter distributed, especially in the range of 210–220 K. Besides, the scatter plots obviously deviate from the diagonal. After QC, only the clear-sky observations over the ocean are retrained, which makes the distributions of O and B closer to each other, and the differences between them are from −3 K to −5 K. Figure 5b is for channel 14, where the scatter plots are already close to the diagonal before QC, only the plots with a brightness temperature higher than 230 K slightly deviate from the diagonal. The QC removes those abnormal observations effectively and makes the plots closer to the diagonal after QC.
Figure 6 shows the probability density functions of O-B for channels 11 and 14 before and after bias correction. Before bias correction, the biases of channels 11 and 14 are about −0.8 K and 0.8 K, and the STDs are 0.31 K and 0.55 K, respectively. The biases after correction are within ±0.1 K, and the STDs are slightly reduced to 0.29 K and 0.48 K, respectively. This indicates that the systematic biases of O-B have been corrected.

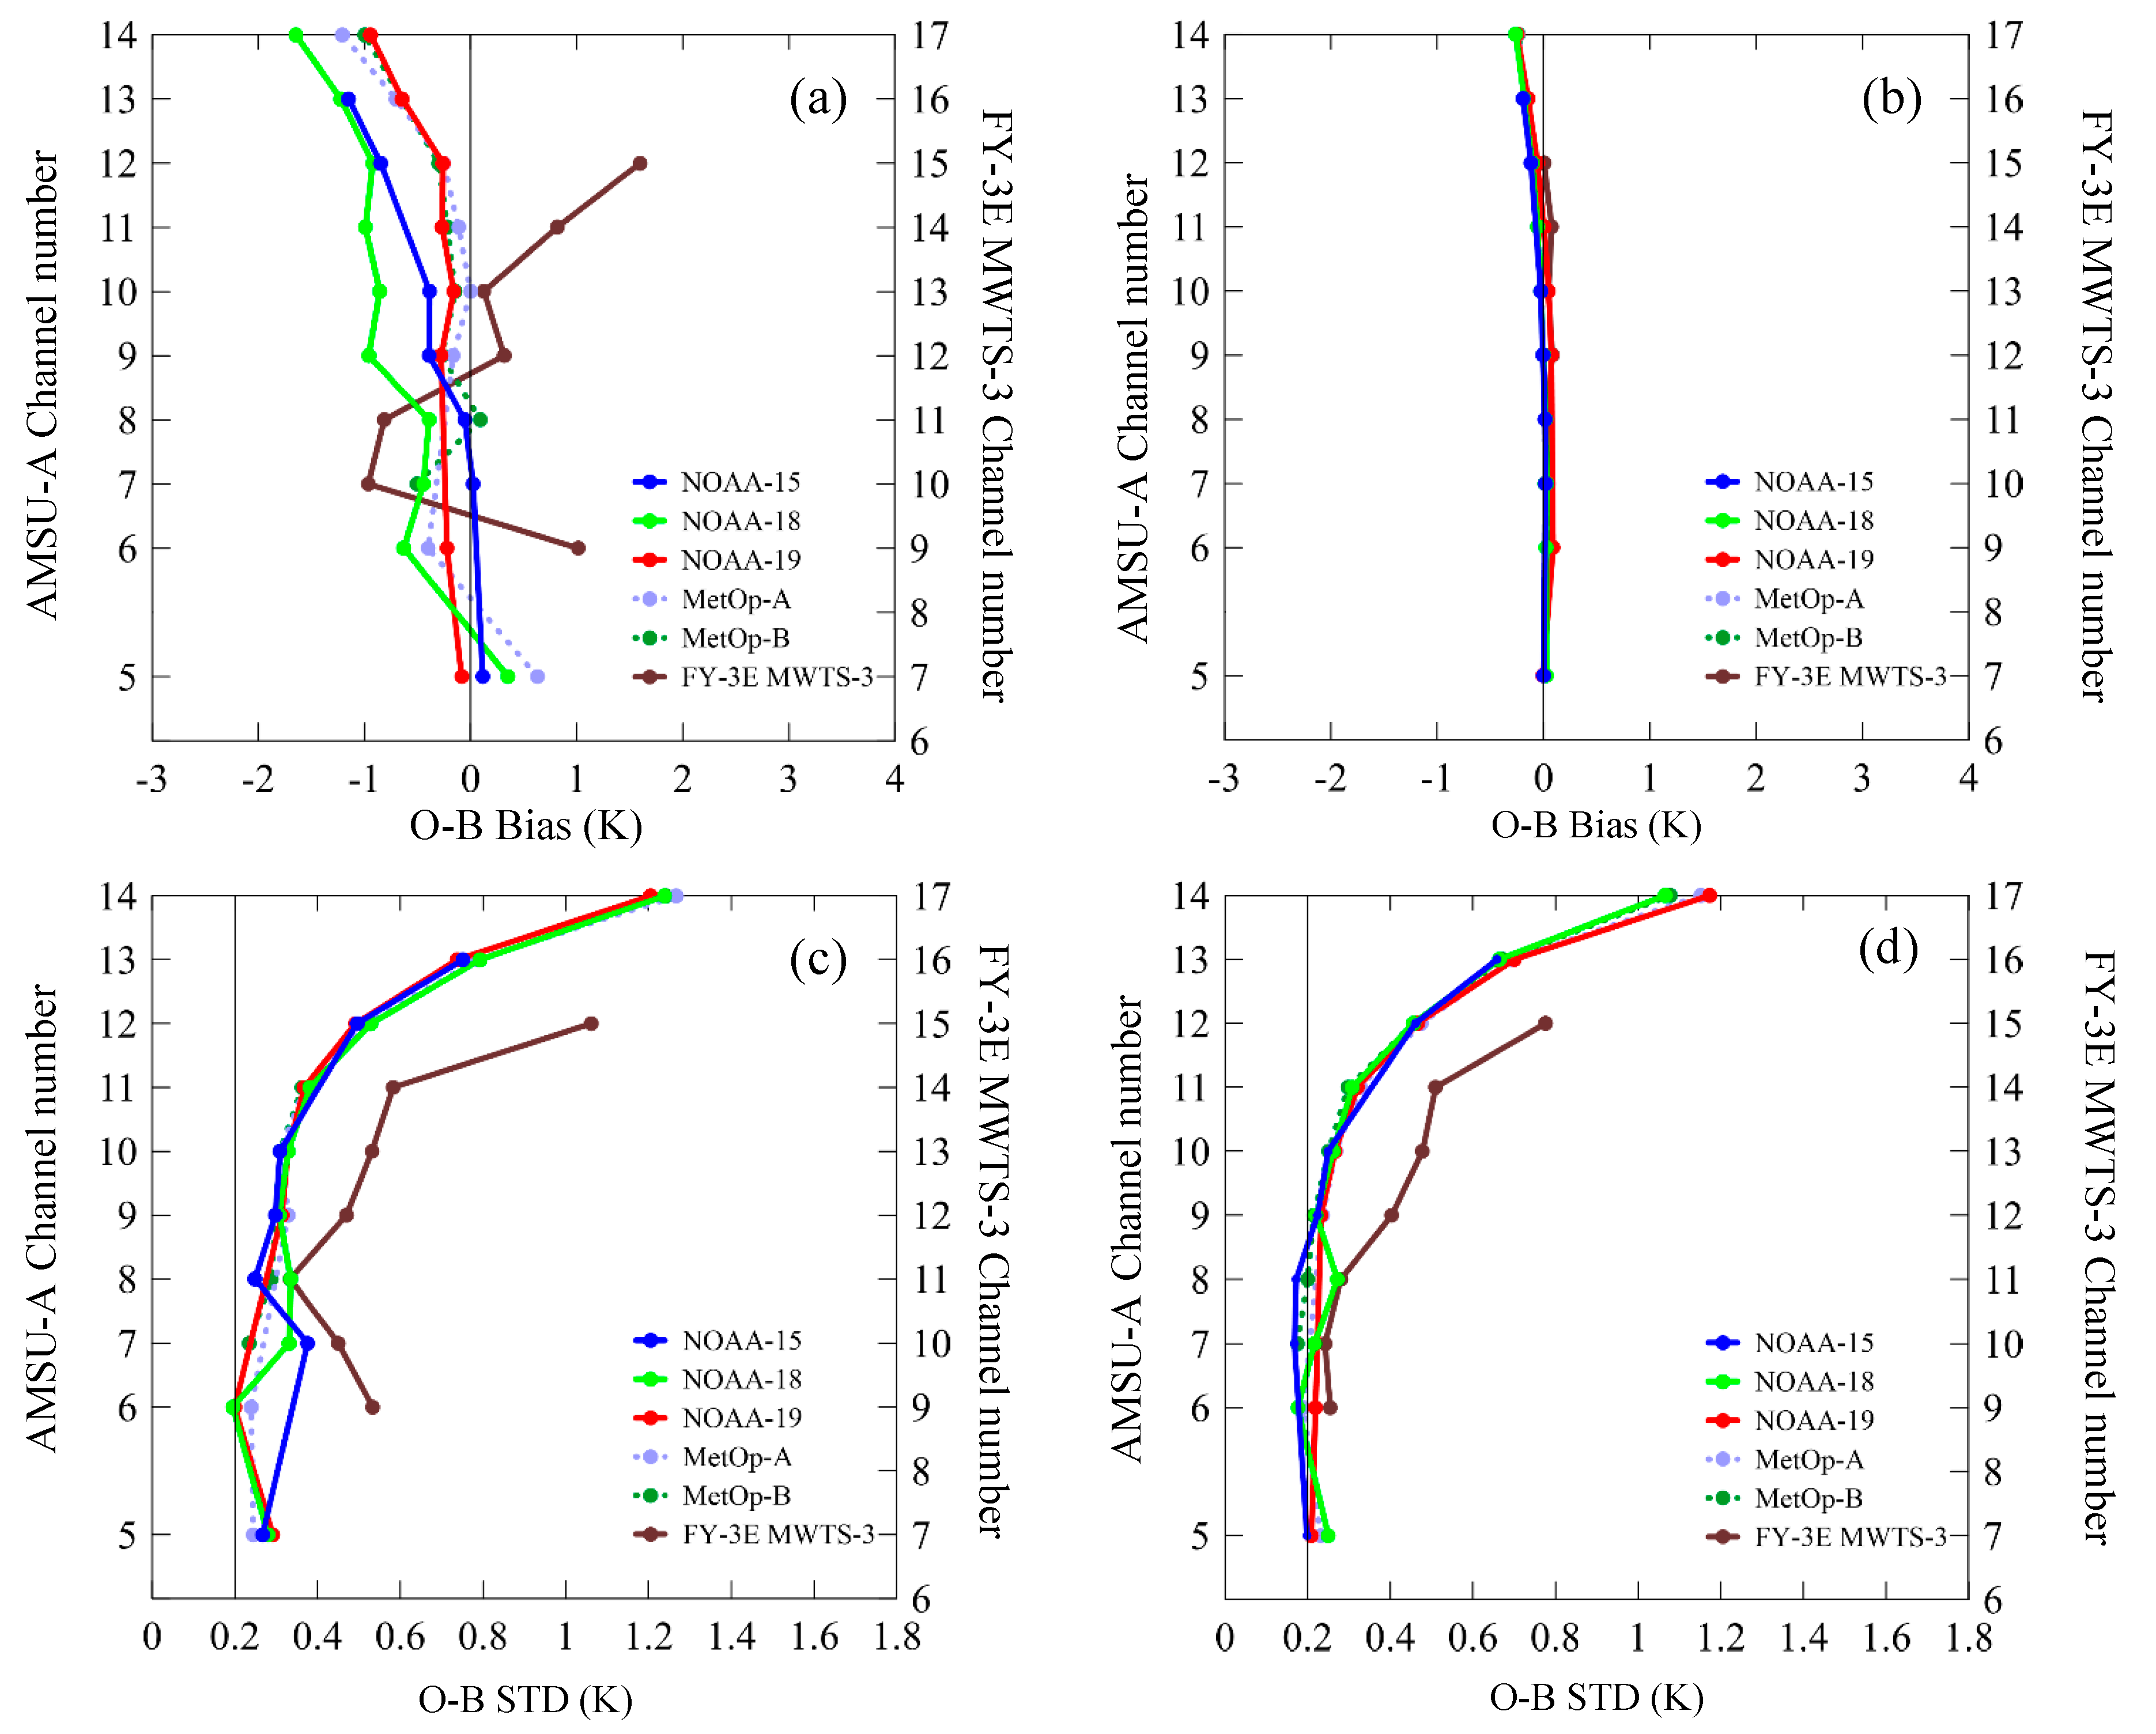
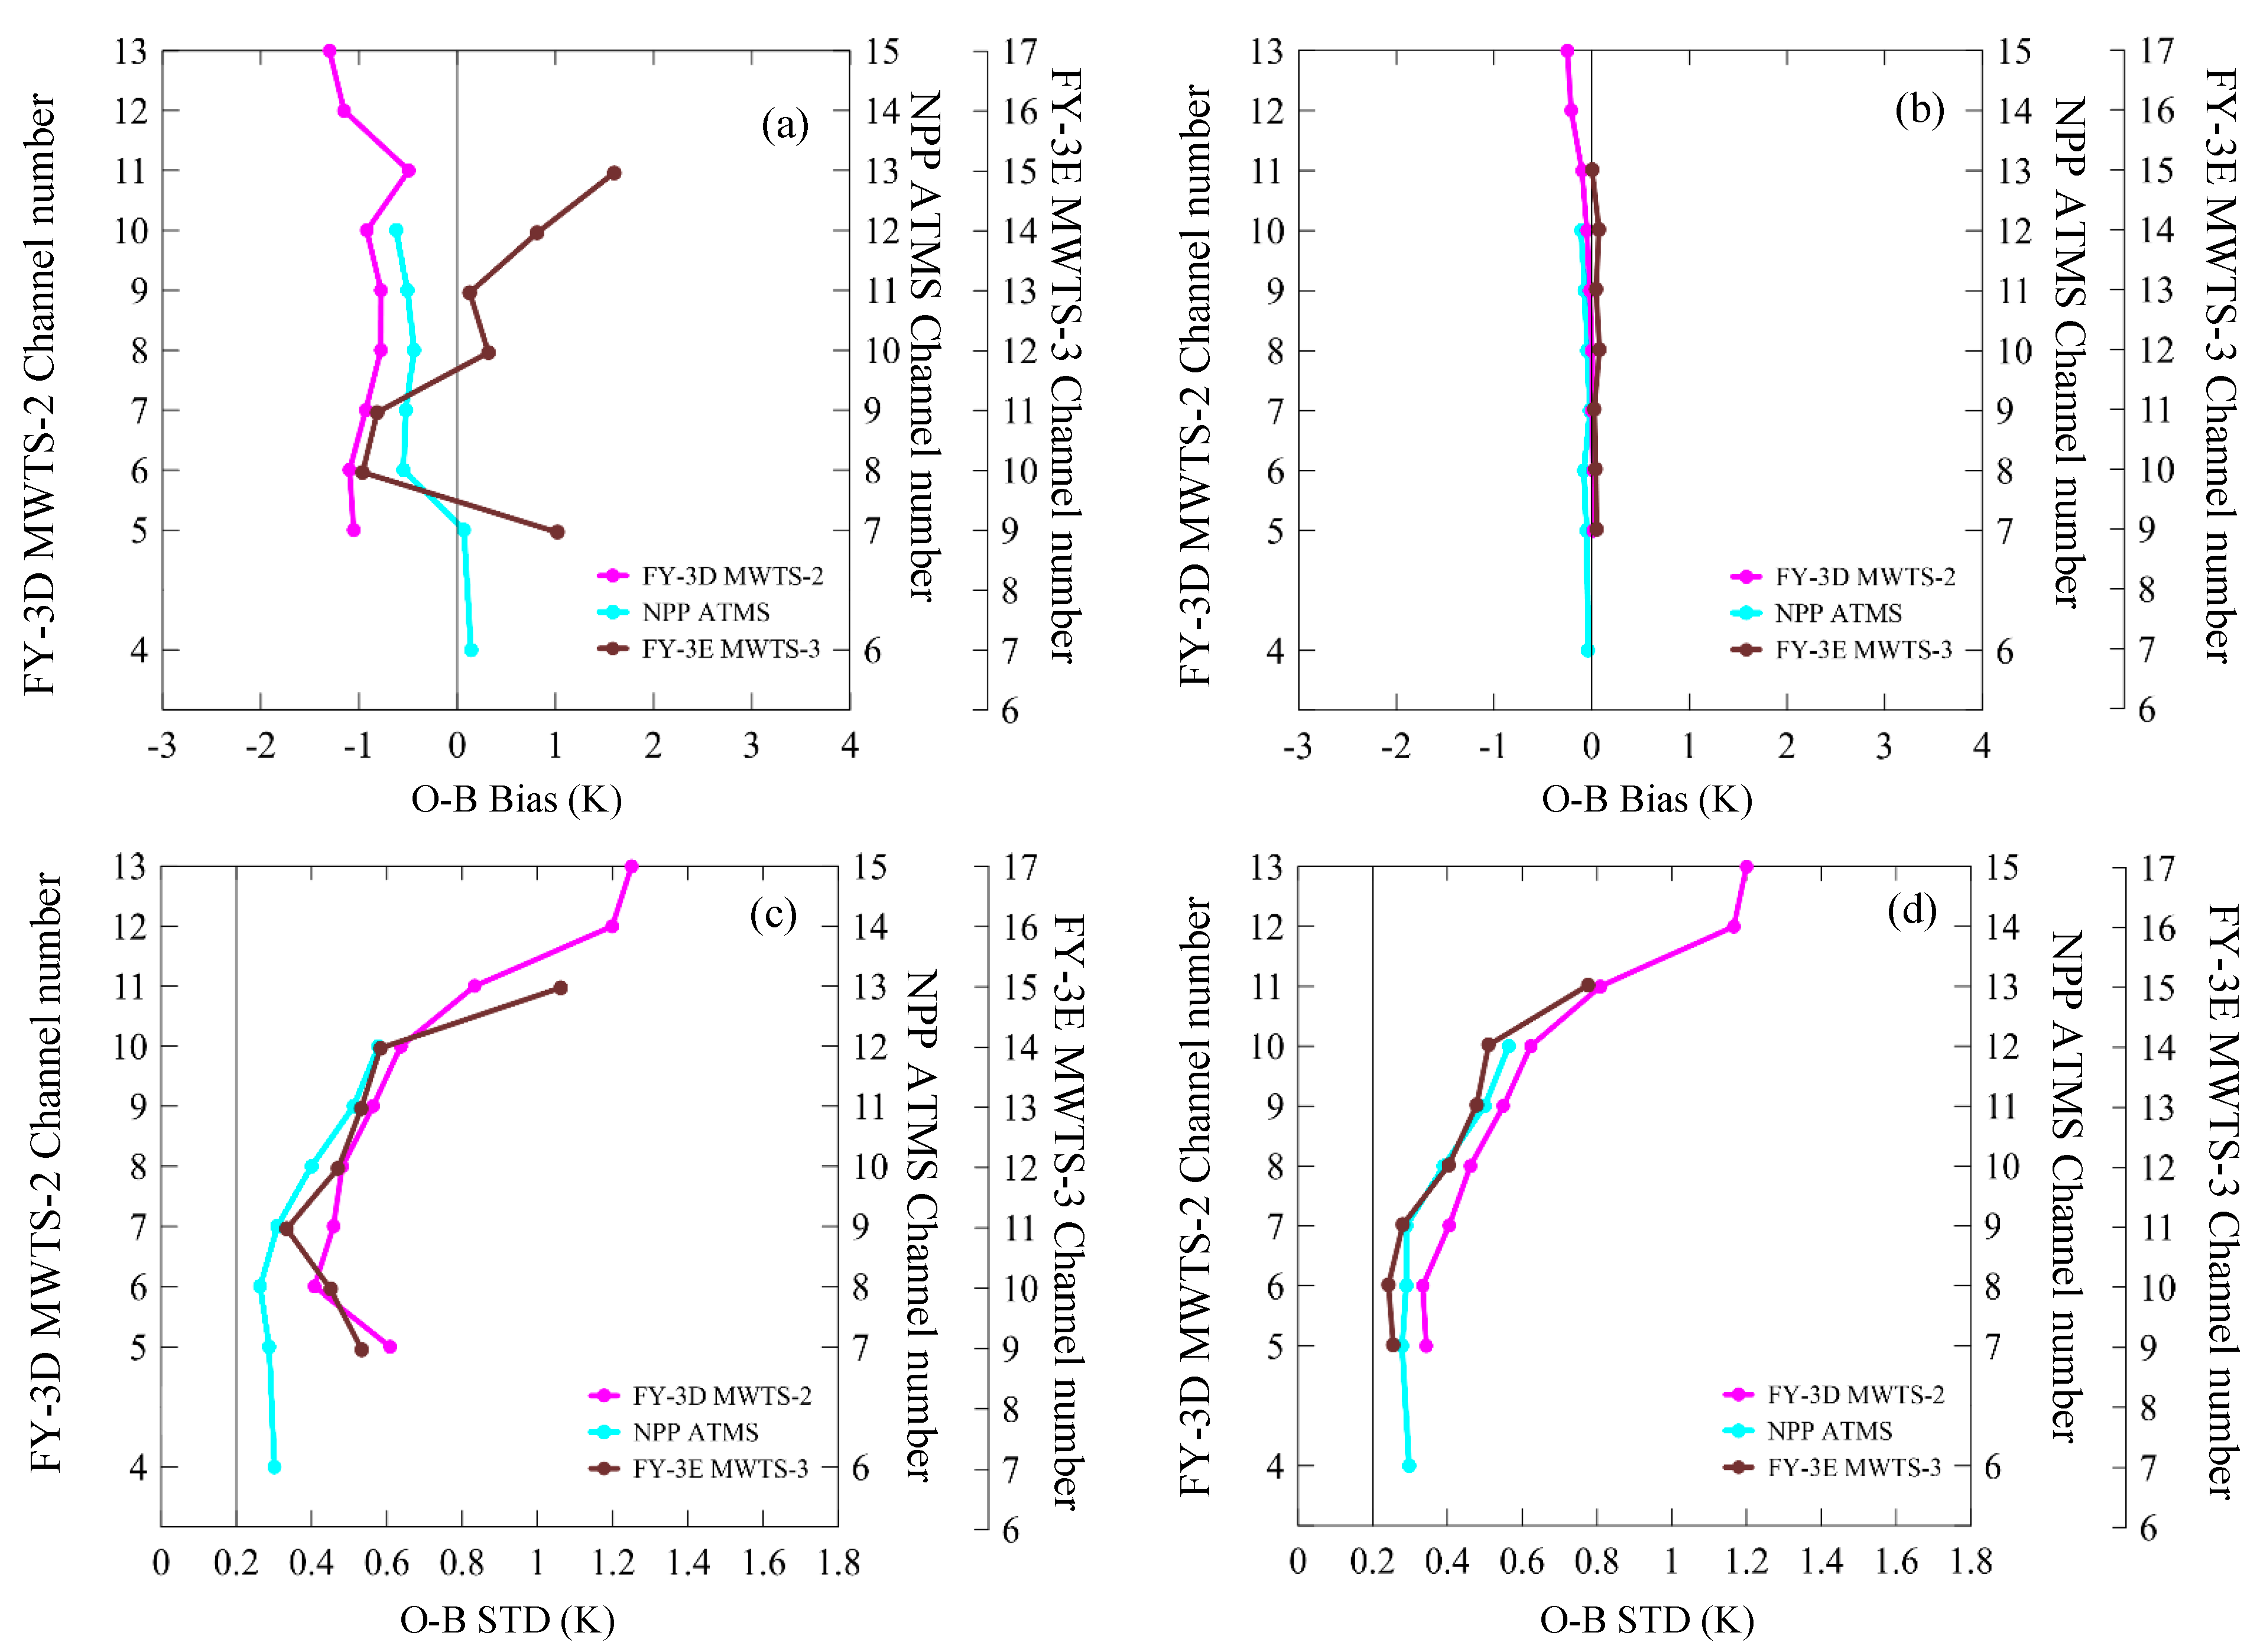
3.2.2. Comparisons of Observation Biases and Errors between MWTS-3 and Other Microwave Temperature Sounders

In order to further clarify the performance of MWTS-3, the bias and error characteristics of various microwave temperature-sounding data assimilated in TEST2 are given in this subsection, where the microwave temperature sounders include FY-3E MWTS-3, FY-3D MWTS-2, AMSU-A onboard NOAA-15/18/19, MetOp-A/B, and NPP ATMs. Figure 7 shows the biases and STDs of O-B from MWTS-3 and AMSU-A before and after bias correction in TEST2 during the period from 24 September to 25 October 2021. Among them, the frequencies of AMSU-A channels 5 and 6–14 are the same as those of MWTS-3 channels 7 and 9–17.
As shown in Figure 7, the overall bias of AMSU-A mid- and low-level channels is generally small before bias correction, where most channels show negative biases. Among them, the negative bias of AMSU-A onboard NOAA-18 is the most obvious. The bias of MWTS-3 is slightly larger than that of the same frequency channel of other instruments, where channel 9 shows a positive bias, while channel 6 of AMSU-A with the same frequency shows a slightly smaller negative bias. The biases of MWTS-3 channels 10–11 are twice those of the AMSU-A channels with the same frequency. Channels 12–17 (of MWTS-3) show positive biases that are opposite to those of AMSU-A. The upper-level channels of MWTS-3 and AMSU-A both exhibit large biases, which may be related to the large temperature errors in the upper-level of the background. Figure 7c shows that the O-B STD of MWTS-3 is also larger than that of AMSU-A before the bias correction, which may be related to the fact that the MWTS-3 has more pixels per scan line and a shorter sampling residence time. After the bias correction, the biases of all instruments are close to 0 (Figure 7b), indicating that the bias correction method for the CMA-GFS data assimilation system has a good correction effect. Besides, the STDs of all instruments also obviously decrease after the correction (Figure 7d).
Figure 8 shows the biases and STDs of FY-3D MWTS-2 and NPP ATMS for the same period. It can be found that, before bias correction, the bias of ATMS is also smaller than that of MWTS-3, which is comparable to that of AMSU-A, but the STD is larger than that of AMSU-A and is only slightly smaller than that of MWTS-3. The magnitudes of the bias and STD of MWTS-2 are comparable to those of MWTS-3. After the bias correction, the biases of all instruments are close to 0, and the STDs are also remarkably reduced. However, the STD of MWTS-3 is smaller than that of FY-3D MWTS-2 but is more similar to the STD features of the ATMS channels with the same frequency.
As indicated above, the comparisons among the observation errors of these microwave-sounding data before and after bias correction reveal that the error of AMSU-A is the smallest, followed by that of MWTS-3 and ATMS, and the observation error of MWTS-2 is the largest.

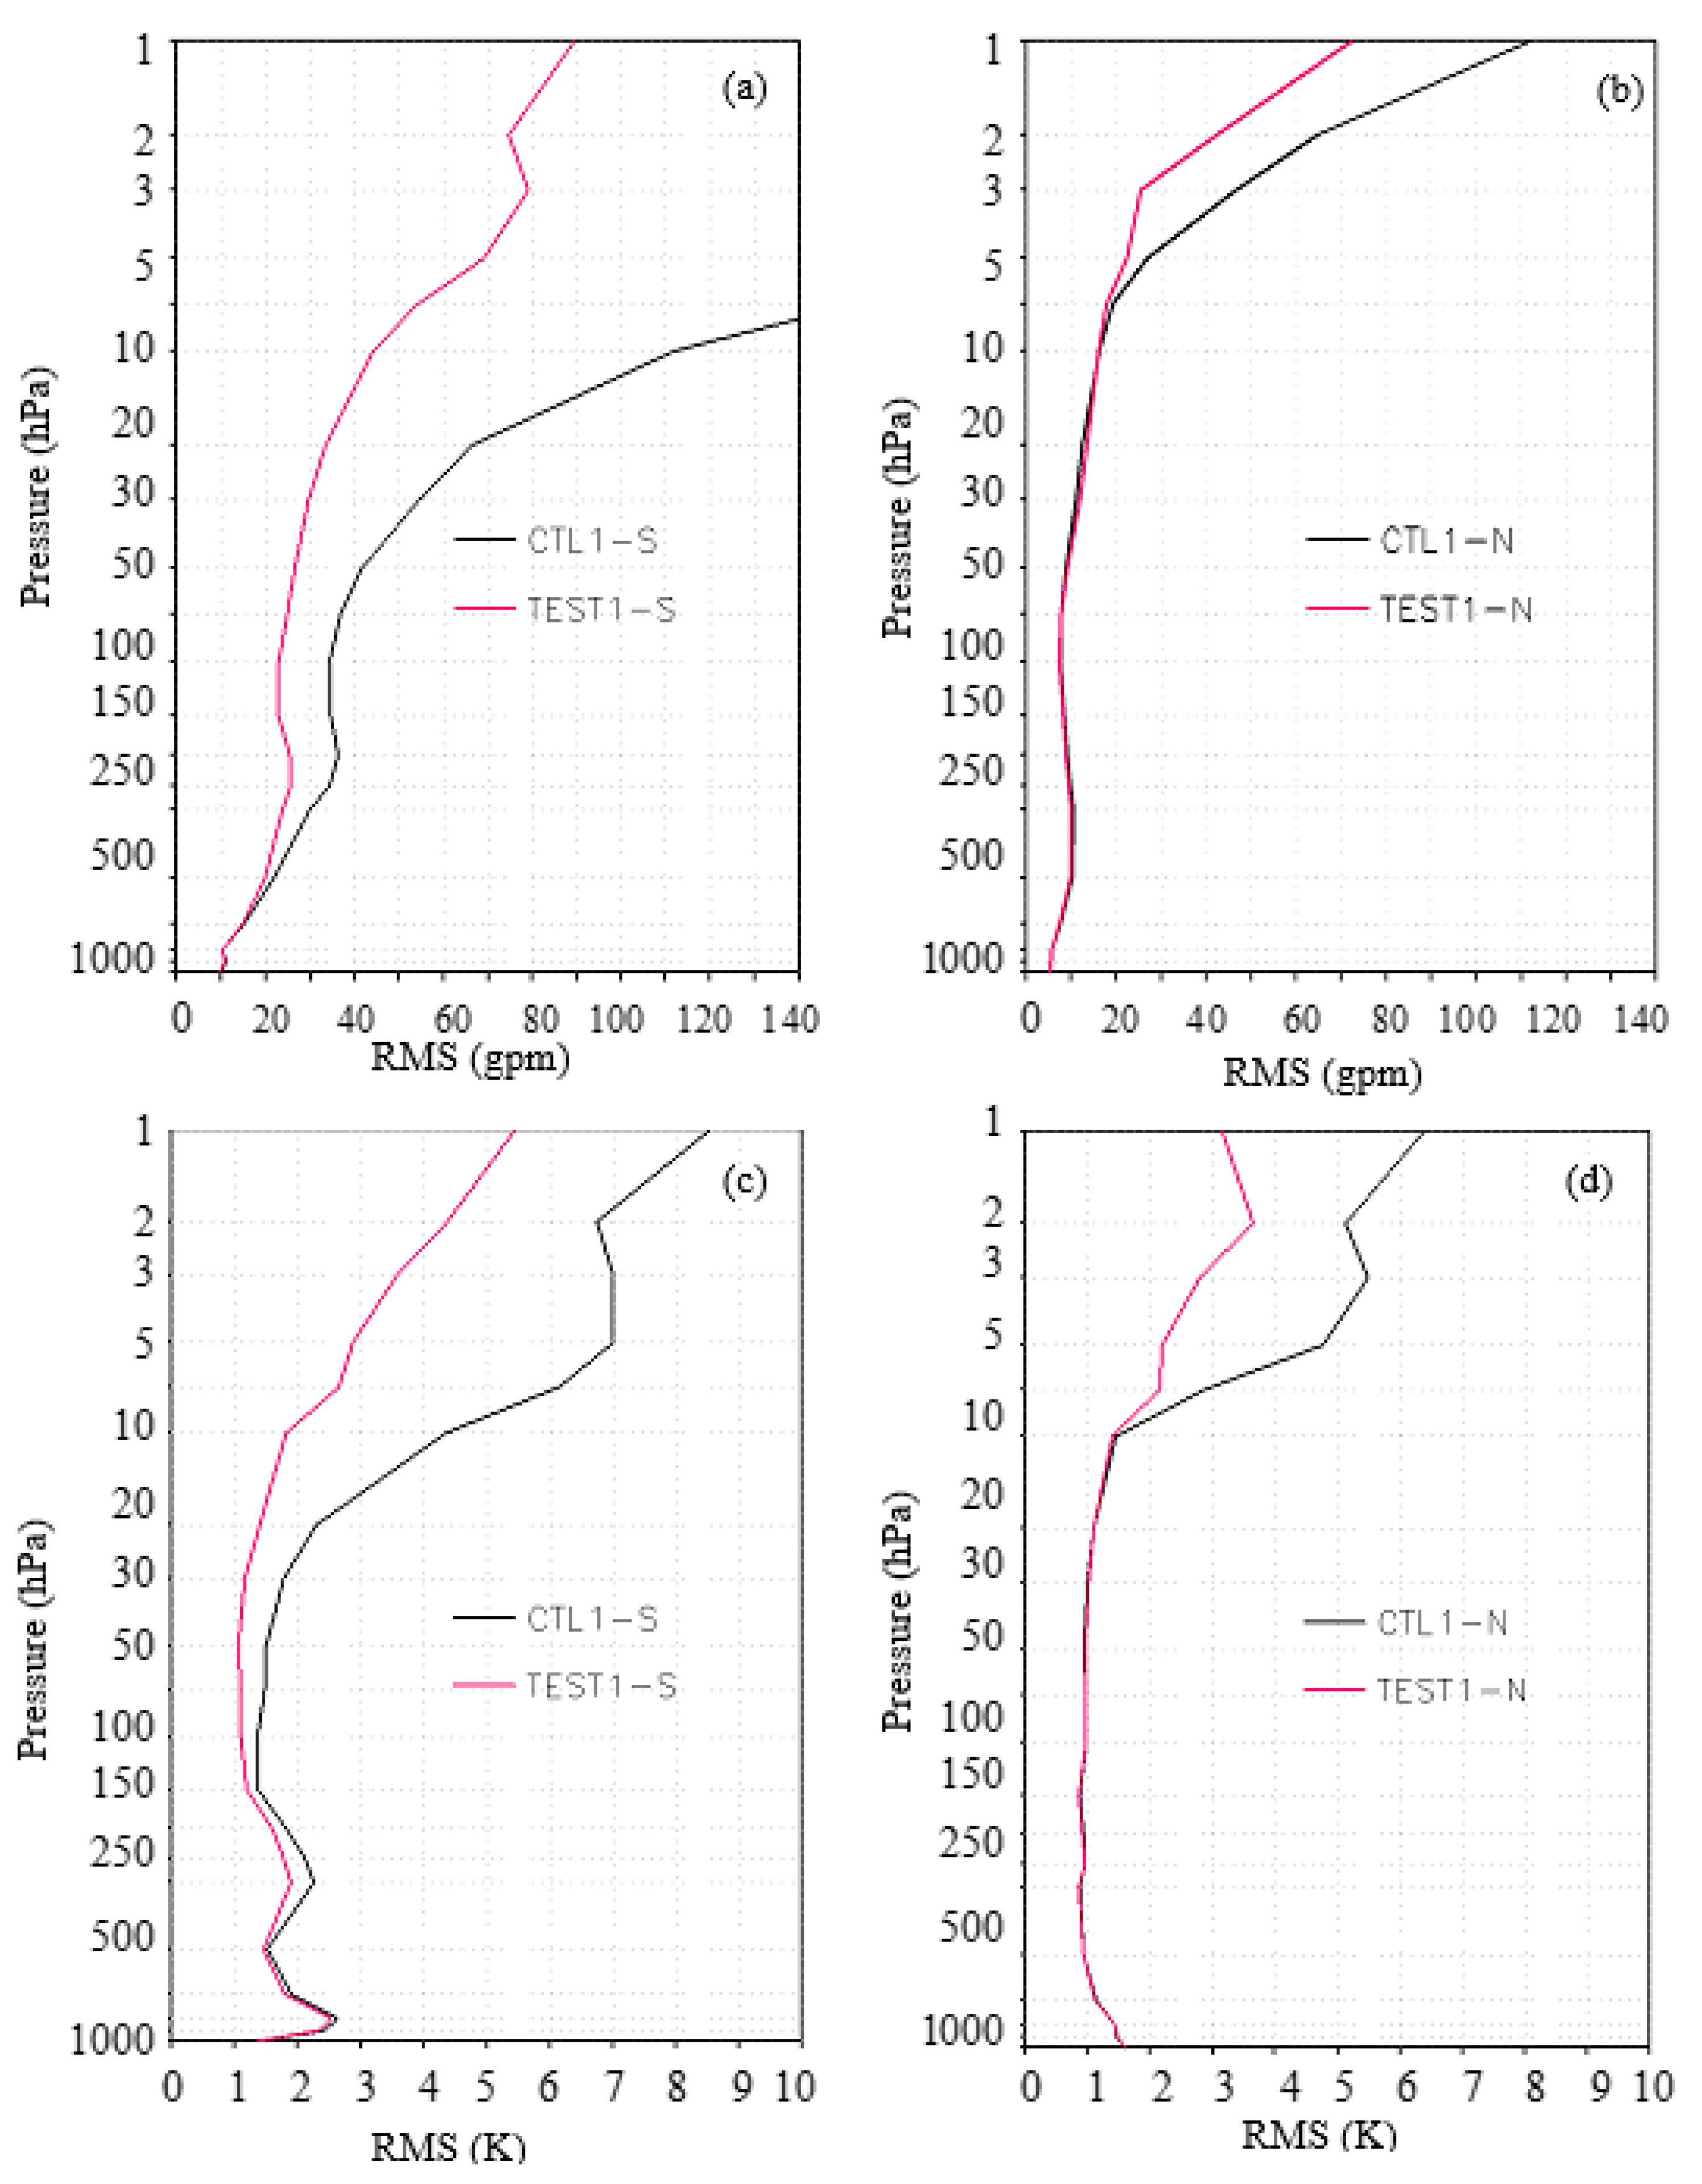
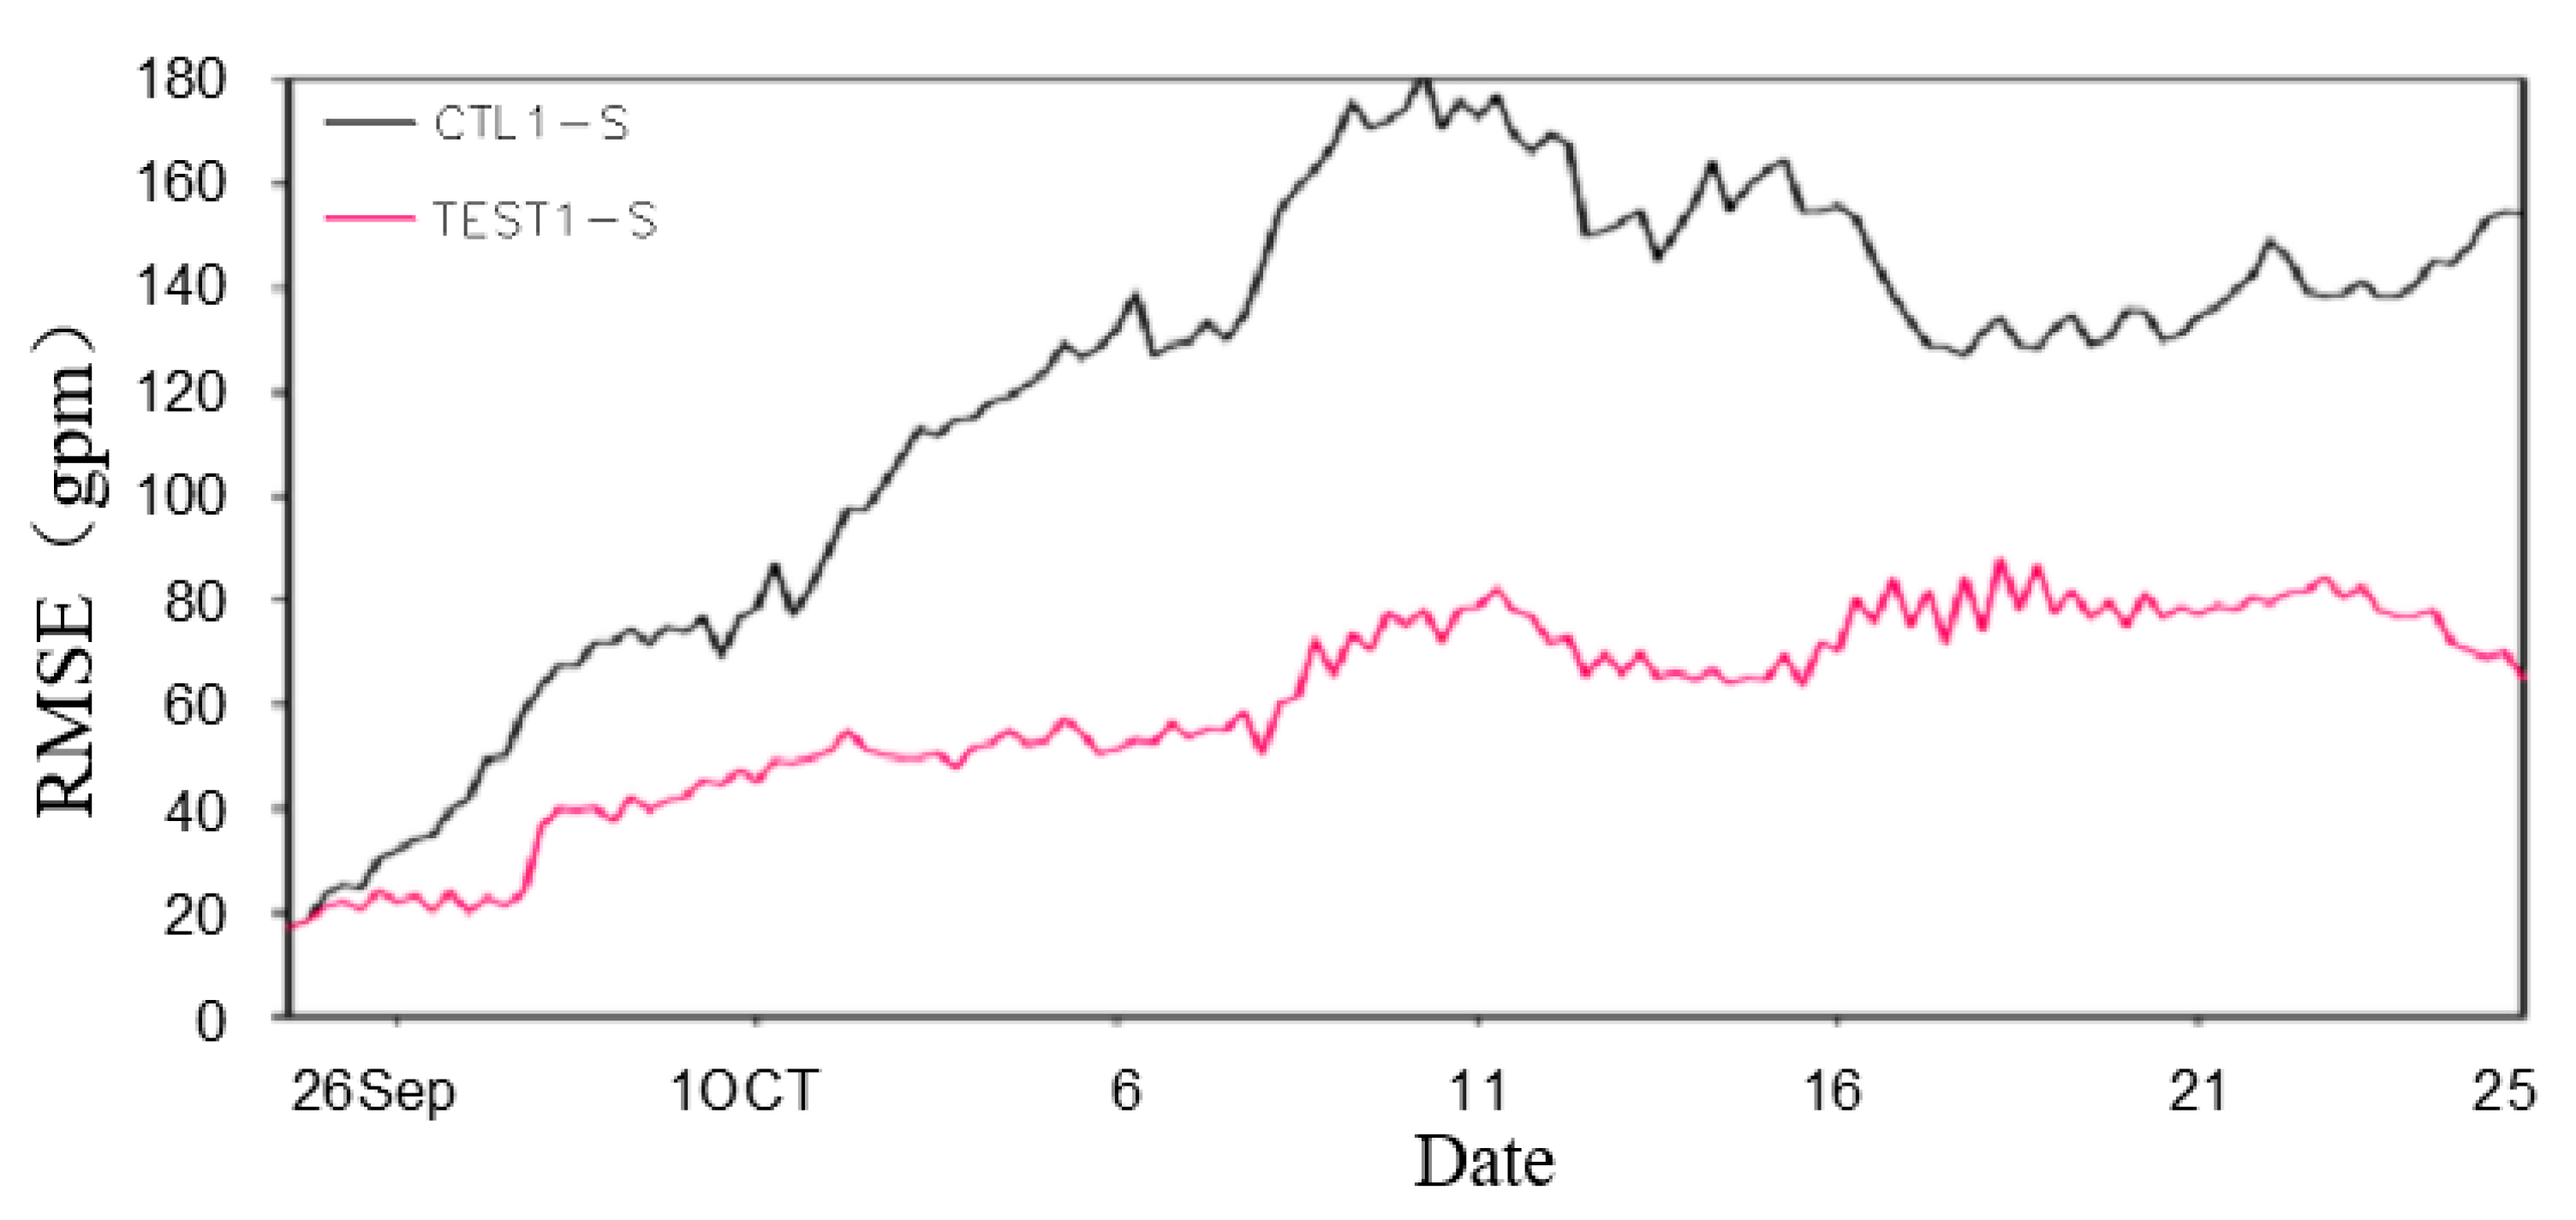
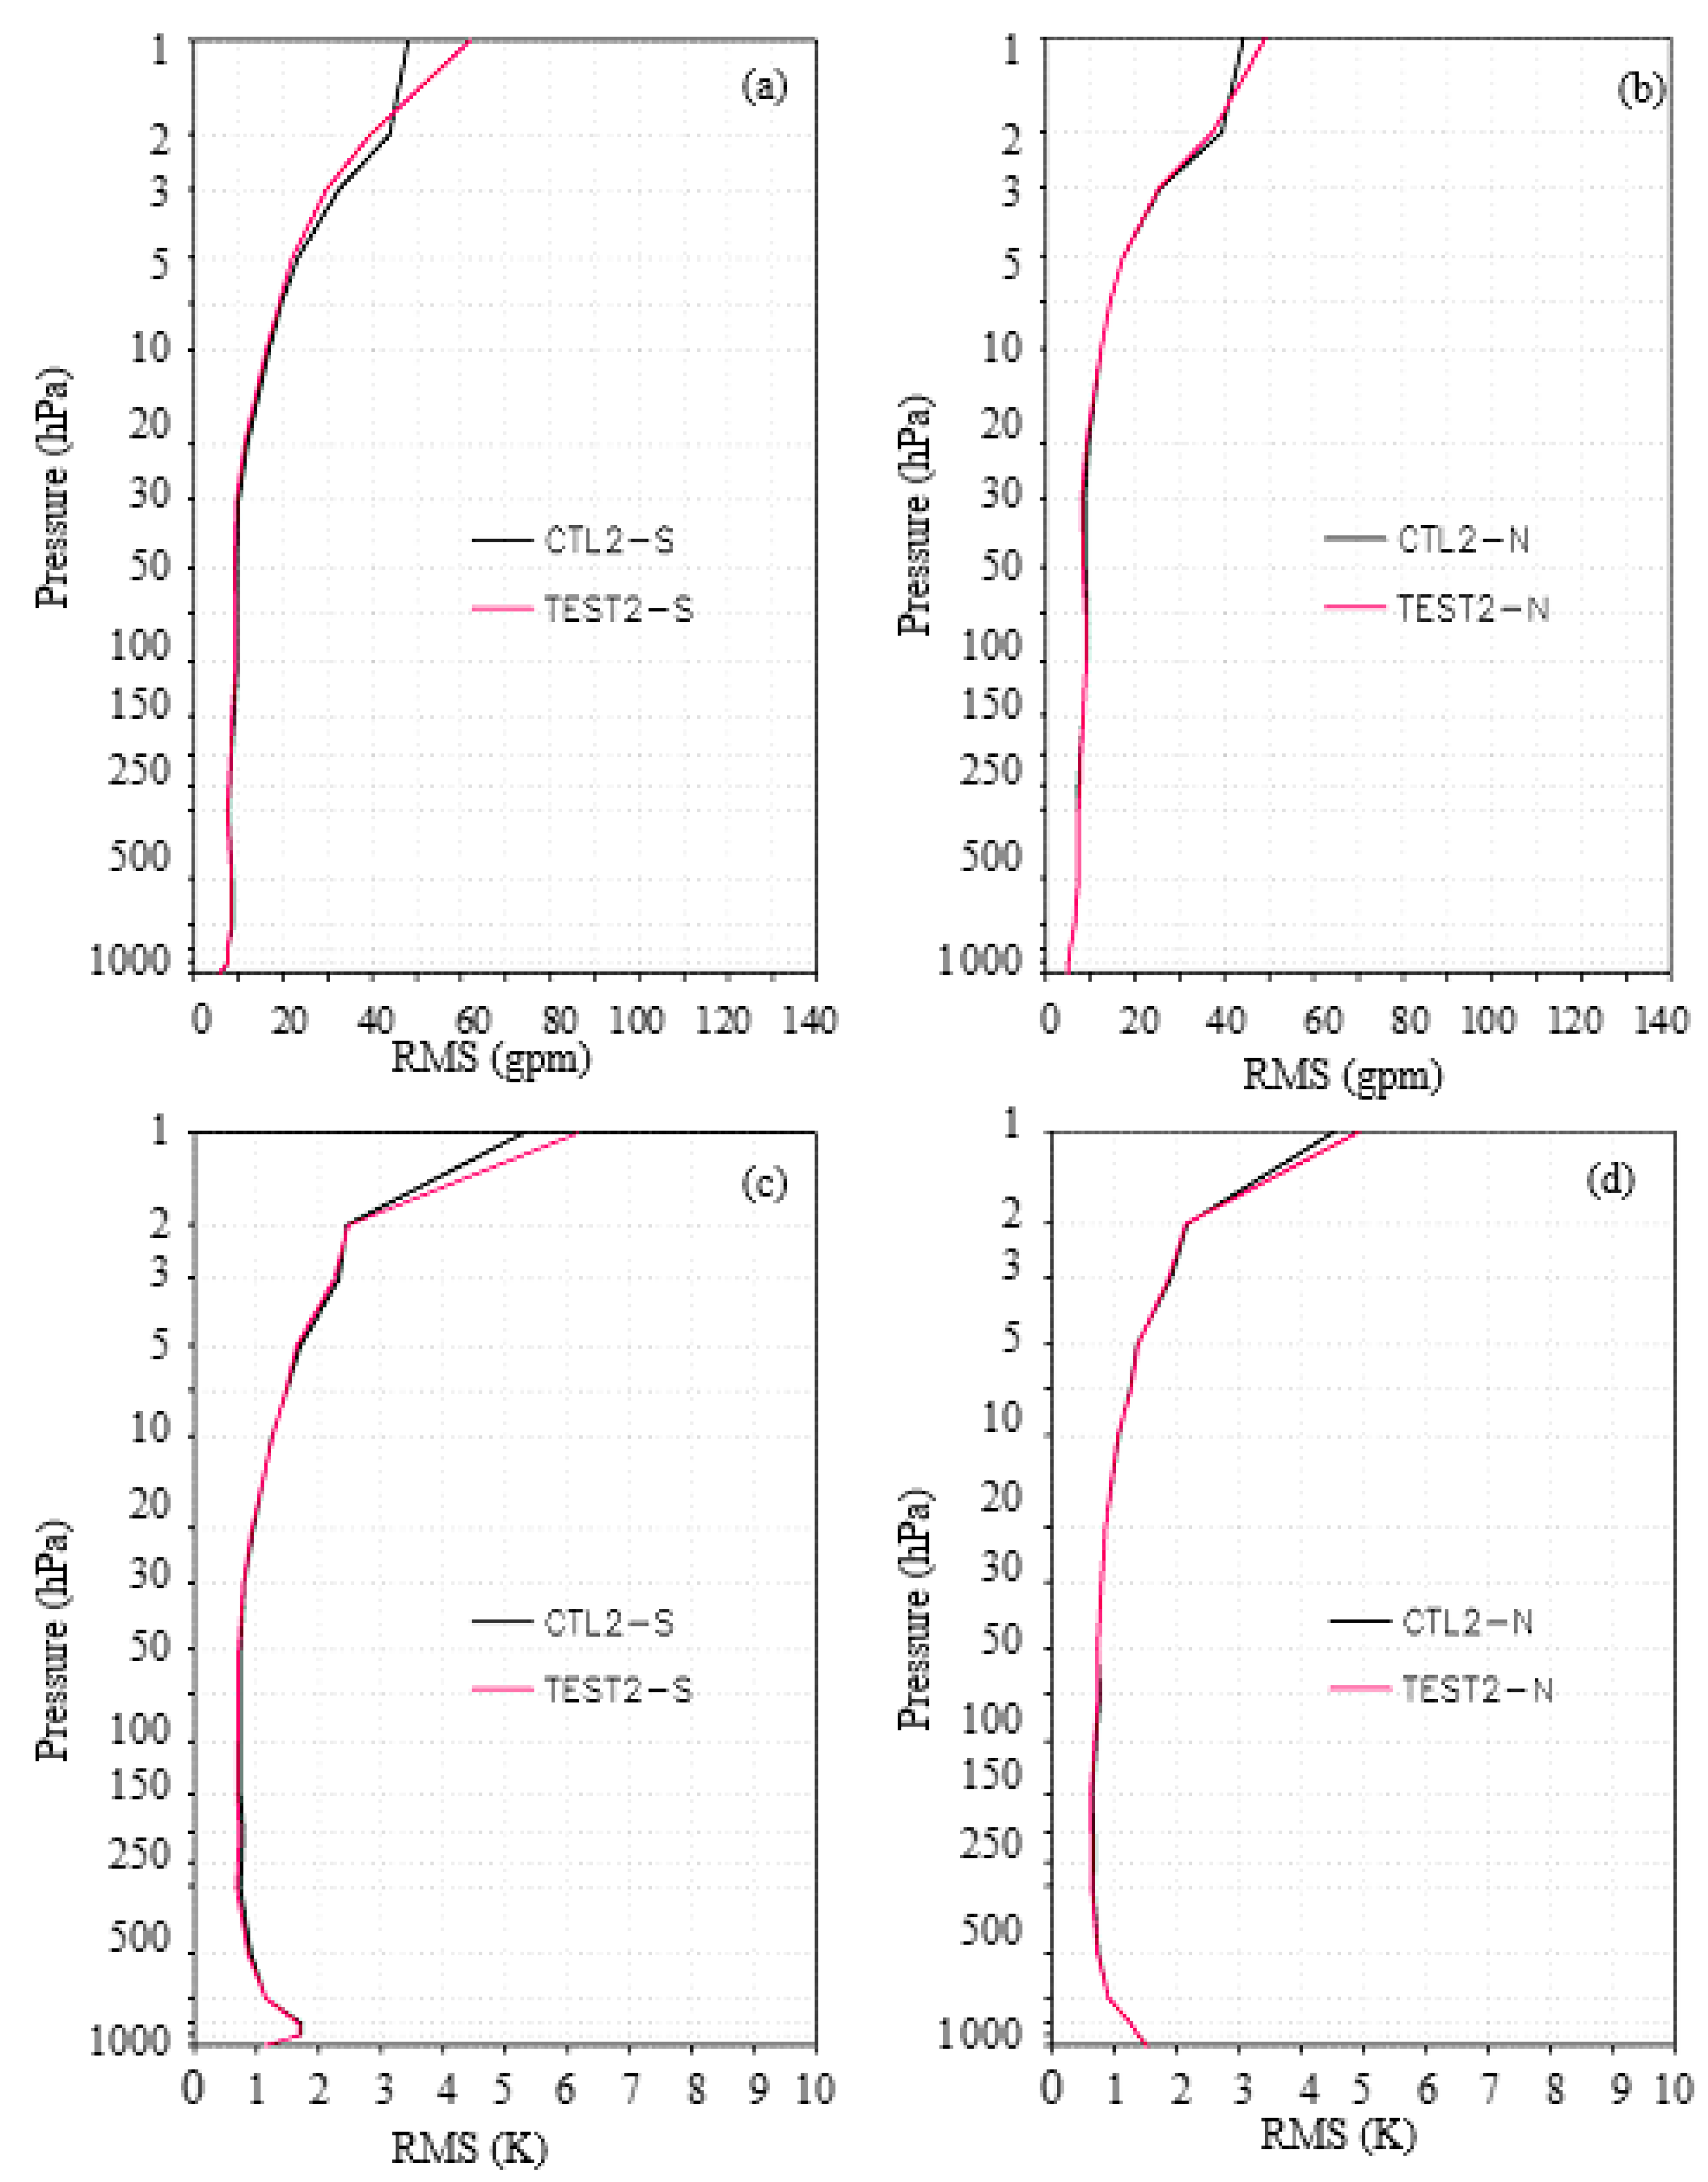
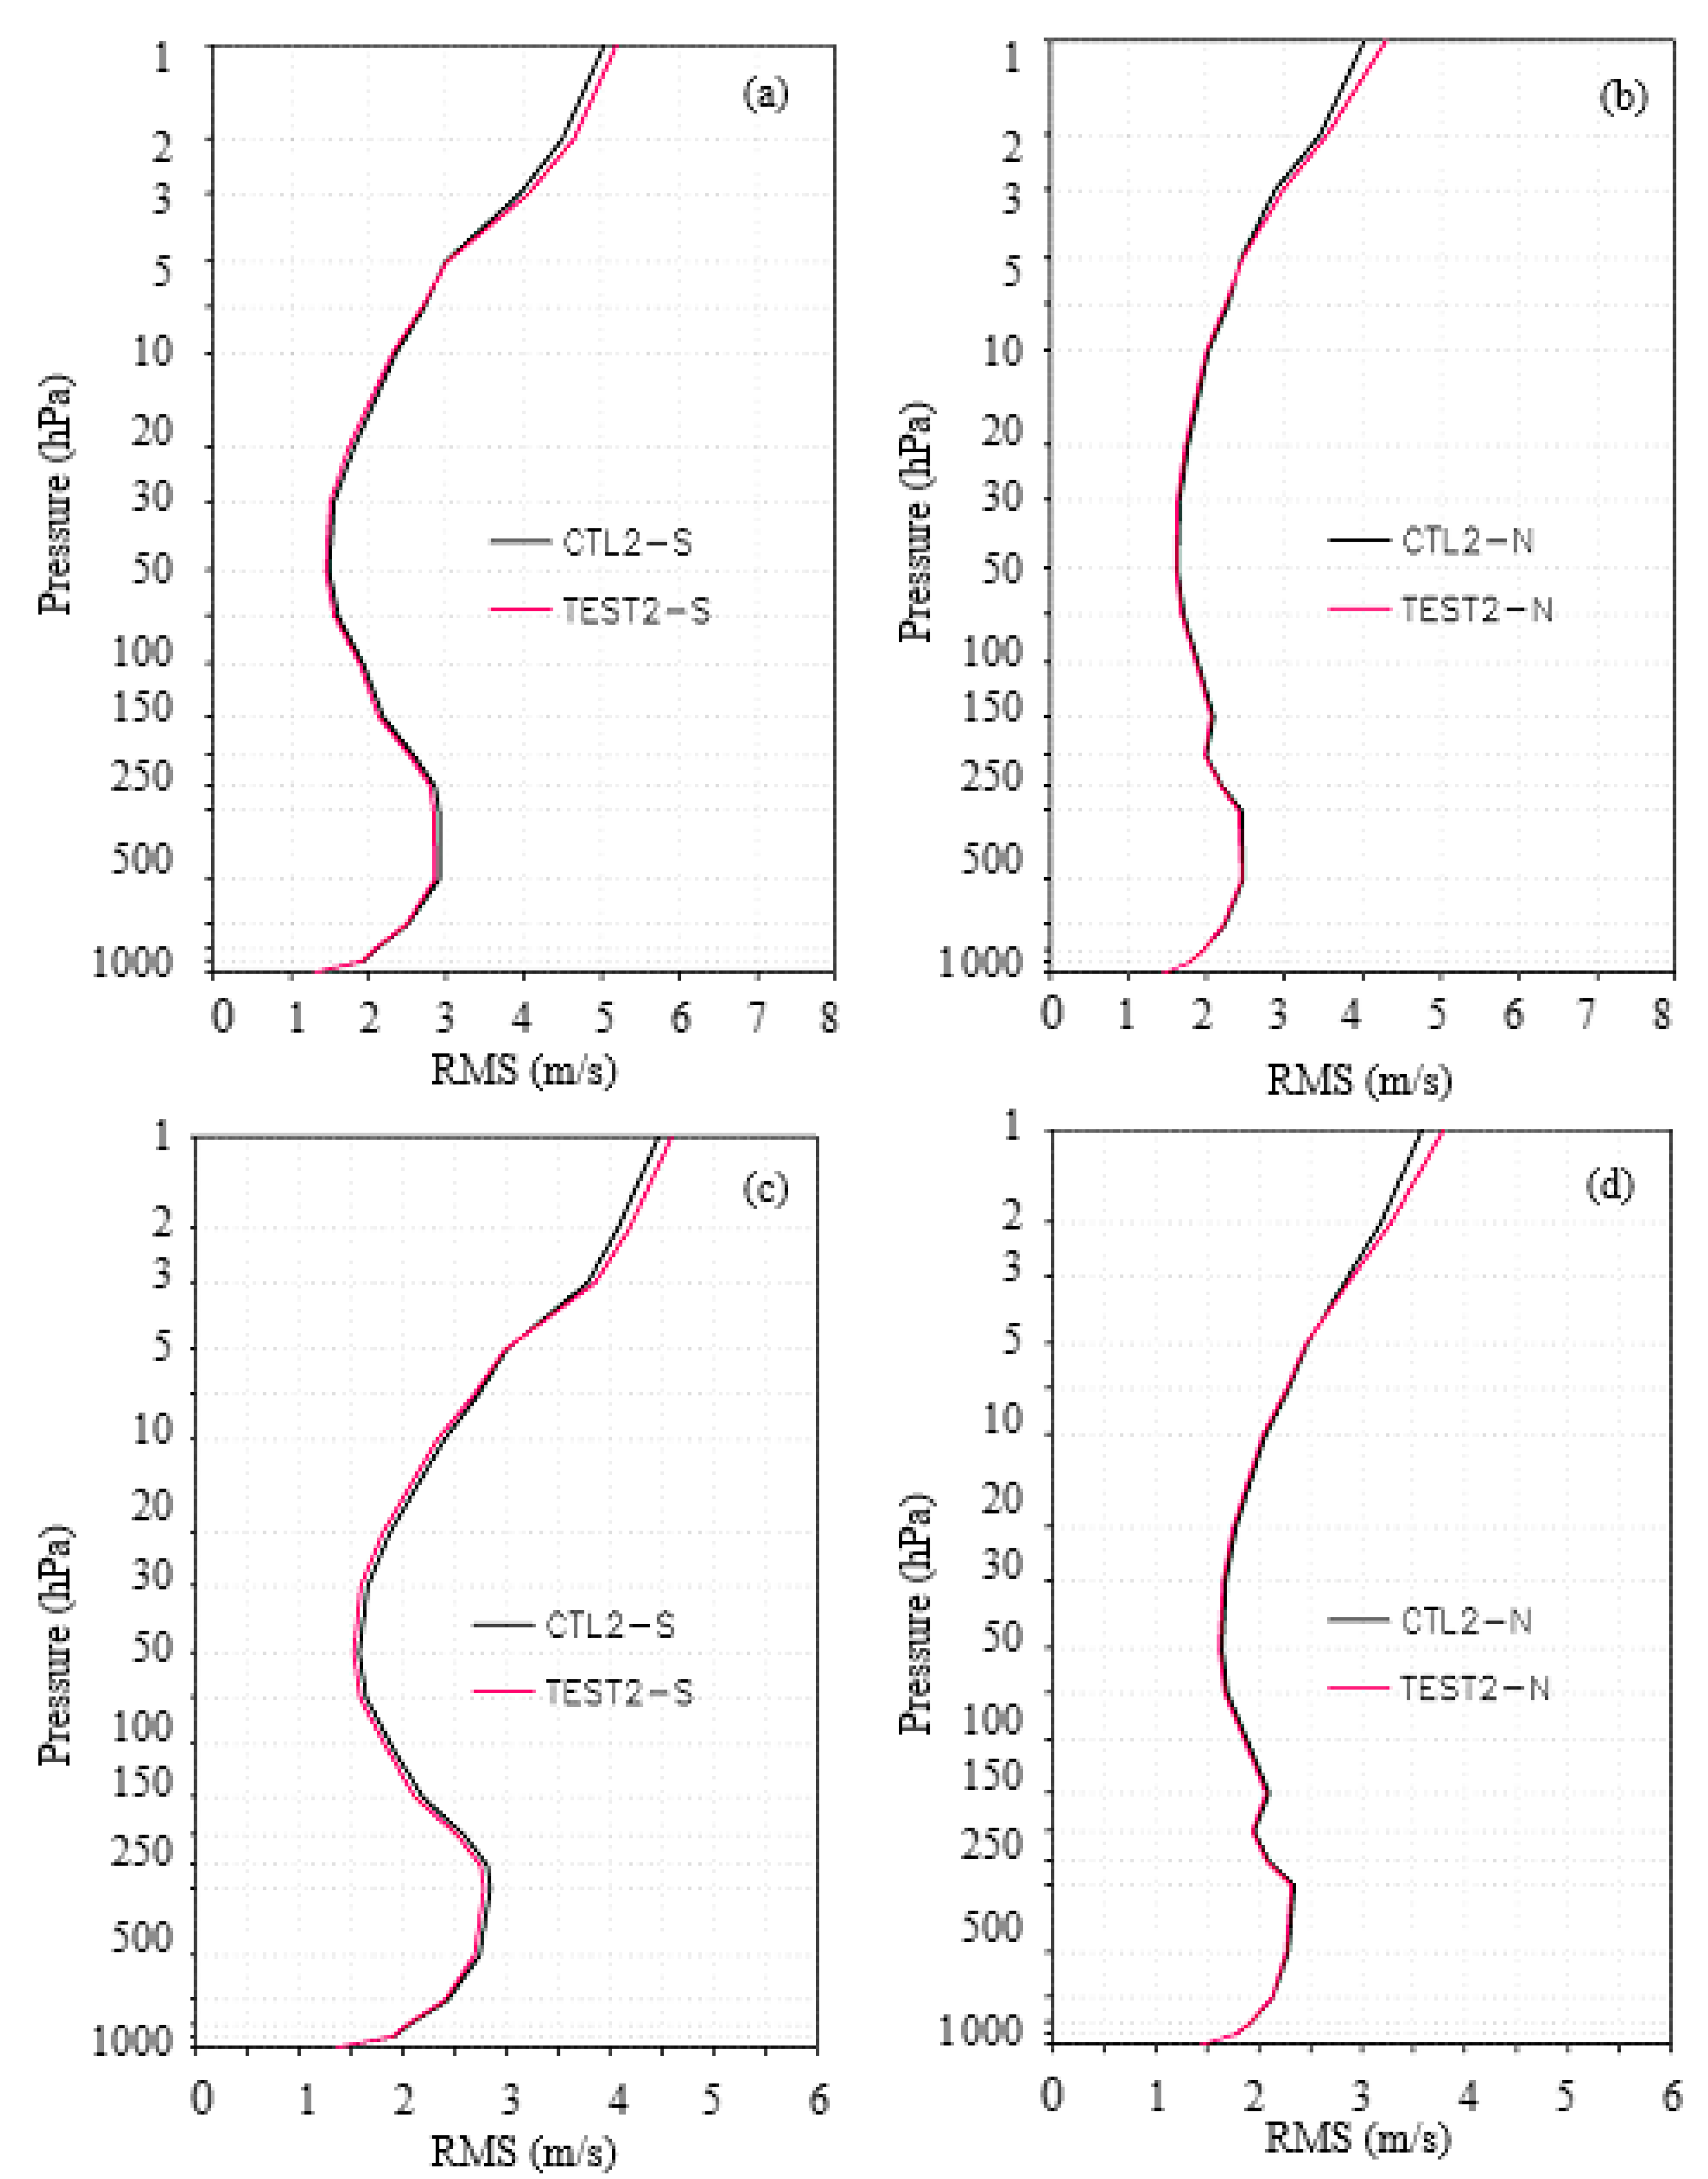
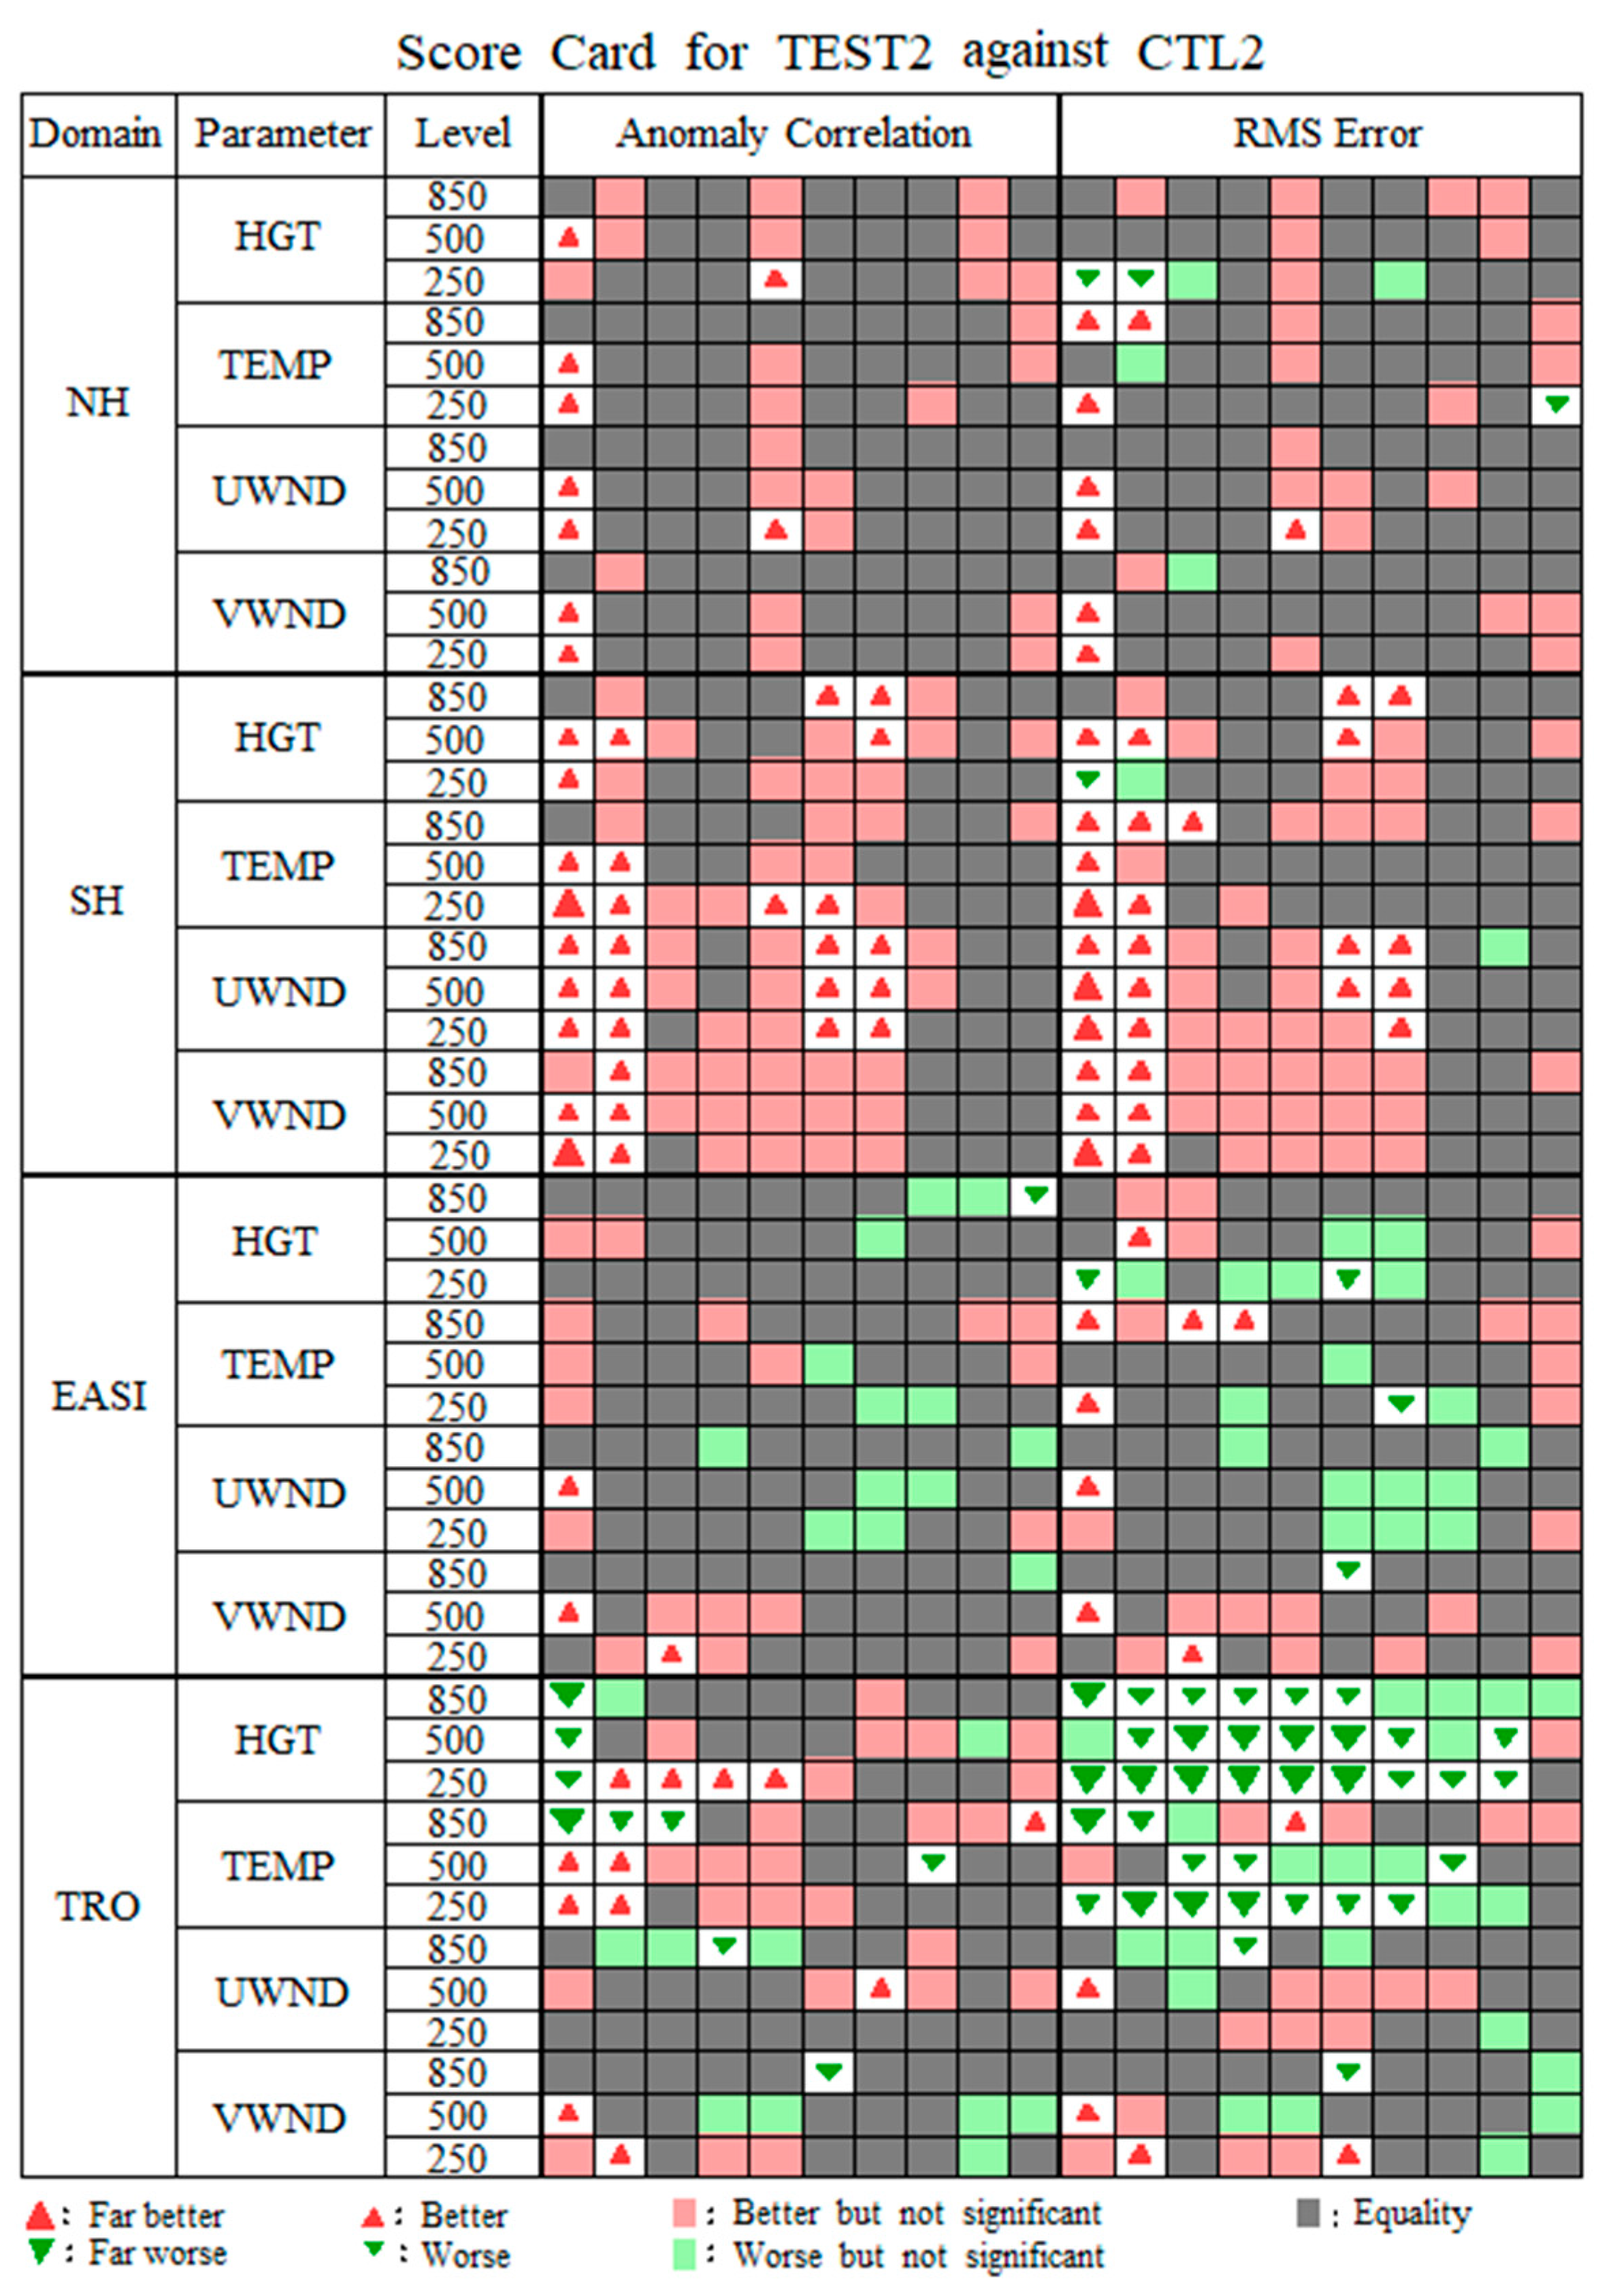
3.2.3. Analysis and Forecast

After investigating the characteristics of the MWTS-3 data, the assimilation effect of MWTS-3 data was further evaluated. The effect of adding the MWTS-3 data to the conventional data assimilation was explored first. Figure 9 shows that the RMSE of the geopotential height and the potential temperature differences between the analysis field and ERA-5 reanalysis data in the southern and Northern Hemispheres are reduced remarkably during the period from 24 September to 25 October 2021. Due to the lack of conventional observations in the Southern Hemisphere, the RMSE reduction in the Southern Hemisphere is most pronounced by adding the MWTS-3 data. Since only channels 9–15 of MWTS-3 are assimilated, and the peak heights of the weighting functions are located in the range of 10–400 hPa, the variables in the middle and high layers of the model are improved the most. Because there are a large number of conventional observations in the middle and lower layers of the Northern Hemisphere, the influence of MWTS-3 data assimilation over these regions is very small. However, as there are few conventional data above the height of 10 hPa, the improvement of adding MWTS-3 data on the geopotential height and potential temperature above 10 hPa is more obvious.
Figure 10 shows the daily RMSE of the geopotential height differences between the analysis results and the ERA-5 reanalysis data for CTRL1 and TEST1 in the Southern Hemisphere at 10 hPa during the period from 24 September to 25 October 2021. It can be seen that, in the CTRL1, due to the lack of observation data above the altitude of 10 hPa, the model error increases rapidly with time. On the other hand, although only the MWTS-3 data is added in TEST1, the growth of the model error above 10 hPa is obviously suppressed, and the RMSE is greatly reduced in the first 15 days and then stably maintained within 60 gpm.
For operational assimilation applications, the impact of assimilating the FY-3E MWTS-3 data on the operational NWP system using all observation data needs to be paid more attention. CTRL2 assimilates all observation data used in the operations, including conventional and various satellite data, while TEST2 assimilates the MWTS-3 data additionally. The comparison shows that, after adding the MWTS-3 data, the errors of geopotential height, potential temperature, the U and V wind exhibit little change compared with the CTRL2 results at almost all altitudes. As shown in Figure 11, below an altitude of 2 hPa, the errors of the TEST2 results are slightly lower than those of the CTRL2 results. However, near the model top of above 2 hPa, the analysis results are slightly worse. This may be related to the imperfection of the bias correction scheme for the upper-level satellite data. Figure 12 shows that the error of wind below 5 hPa is slightly reduced. Overall, the effects of MWTS-3 data assimilation are neutral or slightly positive.
Using the analysis results of CTRL2 and TEST2 (at 1200 UTC of each day) as the initial conditions, a 10-day prediction was achieved. The comprehensive scorecard for the evaluation of the forecast results shows the abnormal correlation coefficients (ACCs) and RMSEs of various variables at different levels and in different regions (Figure 13). It can be seen that the assimilation of MWTS-3 data has a positive contribution to the 10-day forecasts in the Northern and Southern Hemispheres, especially to the first two-day forecasts of the Southern Hemisphere. The overall impact in East Asia is neutral. In tropical areas, the impact on the ACCs is also generally neutral, but the RMSEs have increased, especially for the errors of geopotential height and potential temperature, which need to be further investigated in the future.

4. Discussion

This study demonstrates the impact of the FY-3E MWTS-3 radiances data assimilation for the first time. In the follow-up study, a further comparison of the impacts of data assimilation between MWTS-3 and MWTS-2 will be conducted to provide a reference for the improvement of the Fengyun satellite microwave temperature sounder. For the two newly added channels (6 (53.246 ± 0.08 GHz) and 8 (53.948 ± 0.081 GHz)) of MWTS-3, further assessment and application research for their assimilation is needed. In addition, as the new generation of early-morning orbiting satellites, the FY-3E, NOAA series, and the MetOp series polar-orbiting satellites have formed a complete three-orbit observation system. The supplementary effect of MWTS-3 is worth further exploration.

5. Conclusions

FY-3E is the fifth polar-orbiting satellite in the FY-3 series launched in July of 2021 in China, which carries the new-generation microwave temperature-sounding instruments. Compared with its predecessor satellites, two channels capable of retrieving the CLWP have been designed for the first time, which is of great help for cloud detection in data assimilation. In addition, two detection channels have been added with their peak weighting functions near 700 hPa and 500 hPa, and the ability to detect atmospheric temperature has been improved compared with the previous generation MWTS-2.
After the effective QC, bias correction, and accurate error specification of the MWTS-3 data, the direct assimilation of MWTS-3 radiance data has been realized in the CMA-GFS. The near one-month cycling experiments have indicated that the errors of analysis results can be remarkably reduced by adding the MWTS-3 data to the conventional data, especially for the variables on the upper layer of the model, where there is a lack of sufficient conventional observations. When all the observations in operation are included, the MWTS-3 data assimilation has a neutral contribution to the forecasts in the Northern Hemisphere and a slightly positive contribution in the Southern Hemisphere. However, in the tropics, the forecast errors of geopotential height and potential temperature have increased after adding the MWTS-3 data, which needs further investigation.

Author Contributions

Conceptualization, J.L.; methodology, J.L.; software, J.L., X.Q. and G.L.; validation, J.L., X.Q. and G.L.; formal analysis, J.L. and X.Q.; investigation, J.L. and G.L.; data curation, G.L.; writing—original draft preparation, J.L. and G.L.; writing—review and editing, J.L. and Z.Q. All authors have read and agreed to the published version of the manuscript.

Funding

This research was jointly funded by the Fengyun Application Pioneering Project (FY-APP-2021.0201) and FY-3 Meteorological Satellite Ground Application System Project (FY-3 (03)-AS-11.08).

Data Availability Statement

All data used in this paper are available from the authors upon request (lj@cma.gov.cn).

Acknowledgments

The authors would like to acknowledge the National Satellite Meteorological Centre of CMA for providing the satellite data.

Conflicts of Interest

The authors declare no conflict of interest.

References

  1. Andersson, E.; Pailleux, J.; Thepaut, J.N.; Eyre, J.R.; McNally, A.P.; Kelly, G.A.; Courtier, P. Use of cloud-cleared radiances in three-four-dimensional variational data assimilation. Q. J. R. Meteorol. Soc. 1994, 120, 627–653. [Google Scholar] [CrossRef]
  2. Courtier, P.; Andersson, E.; Heckley, W.; Vasiljevic, D.; Hamrud, M.; Hollingsworth, A.; Rabier, F.; Fisher, M.; Pailleux, J. The ECMWF implementation of three-dimensional variational assimilation (3D-Var). I. Formulation. Q. J. R. Meteorol. Soc. 1998, 124, 1783–1807. [Google Scholar] [CrossRef]
  3. Derber, J.C.; Wu, W.S. The use of TOVS cloud-cleared radiances in the NCEP SSI analysis system. Mon. Weather Rev. 1998, 126, 2287–2299. [Google Scholar] [CrossRef]
  4. McNally, A.P.; Derber, J.C.; Wu, W.; Katz, B.B. The use of TOVS level-1b radiances in the NCEP SSI analysis system. Q. J. R. Meteorol. Soc. 2000, 126, 689–724. [Google Scholar] [CrossRef]
  5. Okamoto, K.; Kazumori, M.; Owada, H. The assimilation of ATOVS radiances in the JMA global analysis system. J. Meteor. Soc. 2005, 83, 201–217. [Google Scholar] [CrossRef] [Green Version]
  6. Baker, N.L.; Daley, R. Observation and background adjoint sensitivity in the adaptive observation-targeting problem. Q. J. R. Meteorol. Soc. 2000, 126, 1431–1454. [Google Scholar] [CrossRef]
  7. Fourrié, N.; Doerenbecher, A.; Bergot, T.; Joly, A. Adjoint sensitivity of the forecast to TOVS observations. Q. J. R. Meteorol. Soc. 2002, 128, 2759–2777. [Google Scholar] [CrossRef] [Green Version]
  8. Langland, R.H.; Baker, A.L. Estimation of observation impact using the NRL atmospheric variational data assimilation adjoint system. Tellus A 2004, 56, 189–201. [Google Scholar] [CrossRef]
  9. Cardinali, C. Monitoring observation impact on short-range forecast. Q. J. R. Meteorol. Soc. 2009, 135, 239–250. [Google Scholar] [CrossRef]
  10. Gelaro, R.; Langland, R.H.; Pellerin, S.; Todling, R. The THORPEX observation impact intercomparison experiment. Mon. Weather Rev. 2010, 138, 4009–4025. [Google Scholar] [CrossRef]
  11. Dong, C.H.; Yang, J.; Yang, Z.D.; Lu, N.M.; Shi, J.M.; Zhang, P.; Liu, Y.J.; Cai, B.; Zhang, W. An overview of a new Chinese weather satellite FY-3A. Bull. Am. Meteorol. Soc. 2009, 90, 1531–1544. [Google Scholar] [CrossRef]
  12. Zhang, P.; Yang, J.; Dong, C.H.; Lu, N.M.; Yang, Z.D.; Shi, J.M. General introduction on payloads, ground segment and data application of Fengyun 3A. Front. Earth. Sci. 2009, 3, 367–373. [Google Scholar]
  13. You, R.; Gu, S.; Guo, Y.; Chen, W.; Yang, H. Long-term calibration and accuracy assessment of the FengYun-3 Microwave Temperature Sounder radiance measurements. IEEE Trans. Geosci. Remote Sens. 2012, 50, 4854–4859. [Google Scholar] [CrossRef]
  14. Zou, X.; Wang, X.; Weng, F.; Guan, L. Assessments of Chinese FengYun Microwave Temperature Sounder (MWTS) measurements for weather and climate applications. J. Atmos. Ocean. Technol. 2011, 28, 1206–1227. [Google Scholar] [CrossRef]
  15. Li, J.; Zou, X. A quality control procedure for FY-3A MWTS measurements with emphasis on cloud detection using VIRR cloud fraction. J. Atmos. Ocean. Technol. 2013, 30, 1704–1715. [Google Scholar] [CrossRef] [Green Version]
  16. Li, J.; Zou, X. Impact of FY-3A MWTS radiances on prediction in GRAPES with comparison of two quality control schemes. Front. Earth Sci. 2014, 8, 251–263. [Google Scholar] [CrossRef]
  17. Li, J.Z.Q.; Liu, G. A new generation of Chinese FY-3C microwave sounding measurements and the initial assessments of its observations. Int. J. Remote Sens. 2016, 37, 4035–4058. [Google Scholar] [CrossRef]
  18. Li, J.; Liu, G. Assimilation of Chinese FengYun 3B Microwave Temperature Sounder radiances into Global GRAPES system with an improved cloud detection threshold. Front. Earth Sci. 2016, 10, 145–158. [Google Scholar] [CrossRef]
  19. Lu, Q.; Bell, W.; Bauer, P.; Bormann, N.; Peubey, C. An Initial Evaluation of FY-3A Satellite Data; ECMWF Technical Memoranda Number 631; ECMWF: Reading, UK, 2010. [Google Scholar]
  20. Lu, Q.; Bell, W. Evaluation of FY-3B Data and an Assessment of Passband Shifts in AMSU-A and MSU during the Period 1978–2012; Interim Report of Visiting Scientist mission NWP_11_05, Document NWPSAF-EC-VS-023, Version 0.1, 28; Met. Office: Exeter, UK, 2012.
  21. Zhang, P.; Hu, X.Q.; Lu, Q.F.; Zhu, A.J.; Lin, M.Y.; Sun, L.; Chen, L.; Xu, N. FY-3E: The first operational meteorological satellite mission in an early morning orbit. Adv. Atmos. Sci. 2021, 39, 1–8. [Google Scholar] [CrossRef]
  22. Qian, X.; Qin, Z.; Li, J.; Han, Y.; Liu, G. Preliminary Evaluation of FY-3E Microwave Temperature Sounder Performance Based on Observation Minus Simulation. Remote Sens. 2022, 14, 2250. [Google Scholar] [CrossRef]
  23. Chen, D.H.; Xue, J.S.; Yang, X.S.; Zhang, H.L.; Shen, X.S.; Hu, J.L.; Wang, Y.; Ji, L.R.; Chen, J.B. New generation of multi-scale NWP system (GRAPES): General scientific design. Chin. Sci. Bull. 2008, 53, 3433–3445. [Google Scholar] [CrossRef]
  24. Xue, J.S.; Chen, D.H. Numerical Prediction System Design and Application of Science GRAPES; Science Press: Beijing, China, 2008. [Google Scholar]
  25. Xue, J.S.; Zhuang, S.Y.; Zhu, G.F.; Zhang, H.; Liu, Z.Q.; Liu, Y.; Zhuang, Z.R. Scientific design and preliminary results of three-dimensional variational data assimilation system of GRAPES. Chin. Sci. Bull. 2008, 53, 3446–3457. [Google Scholar] [CrossRef] [Green Version]
  26. Zhang, L.; Liu, Y.; Liu, Y.; Gong, J.; Lu, H.; Jin, Z.; Tian, W.; Liu, G.; Zhou, B.; Zhao, B. The operational global four-dimensional variational data assimilation system at the China Meteorological Administration. Q. J. R. Meteorol. Soc. 2019, 145, 1882–1896. [Google Scholar] [CrossRef] [Green Version]
  27. Navon, I.M.; Legler, D.M. Conjugate gradient methods for large scale minimization in meteorology. Mon. Weather Rev. 1987, 115, 1479–1502. [Google Scholar] [CrossRef]
  28. Saunders, R.W.; Matricardi, M.; Brunel, P. An Improved Fast Radiative Transfer Model for Assimilation of Satellite Radiance Observations. Q. J. R. Meteorol. Soc. 1999, 125, 1407–1425. [Google Scholar] [CrossRef]
  29. Weng, F.; Zhao, L.; Ferraro, R.R.; Poe, G.; Li, X.; Grody, N.C. Advanced microwave sounding unit cloud and precipitation algorithms. Radio Sci. 2003, 38, 8068. [Google Scholar] [CrossRef]
  30. Grody, N.; Zhao, J.; Ferraro, R.; Weng, F.; Boers, R. Determination of precipitable water and cloud liquid water over oceans from the NOAA 15 advanced microwave sounding unit. J. Geophys. Res. 2001, 106, 2943–2953. [Google Scholar] [CrossRef]
  31. Klaes, D.; Schraidt, R. The European ATOVS and AVHRR processing package (AAPP). In Proceedings of the 10th International TOVS Study Conference (ITSC X), Boulder, CO, USA, 27 January–2 February 1999. [Google Scholar]
  32. Errico, R.M.; Bauer, P.; Mahfouf, J.-F. Issues regarding the assimilation of cloud and precipitation data. J. Atmos. Sci. 2007, 64, 3785–3798. [Google Scholar] [CrossRef]
  33. Geer, A.J.; Bauer, P. Enhanced Use of All-Sky Microwave Observations Sensitive to Water Vapour, Cloud and Precipitation; ECMWF Technical Memoranda 620; ECMWF: Reading, UK, 2010. [Google Scholar]
  34. Geer, A.J.; Lonitz, K.; Weston, P.; Kazumori, M.; Okamoto, K.; Zhu, Y.; Liu, E.H.; Collard, A.; Bell, W.; Migliorini, S.; et al. All-sky satellite data assimilation at operational weather forecasting centres. Q. J. R. Meteor. Soc. 2018, 144, 1191–1217. [Google Scholar] [CrossRef]
  35. Lorenc, A.C. Analysis methods for numerical weather prediction. Q. J. R. Meteor. Soc. 1986, 112, 1177–1194. [Google Scholar] [CrossRef]
  36. Harris, B.A.; Kelly, G. A satellite radiance-bias correction scheme for data assimilation. Q. J. R. Meteorol. Soc. 2001, 127, 1453–1468. [Google Scholar] [CrossRef]
  37. Liu, Z.Q.; Zhang, F.Y.; Wu, X.B.; Xue, J. A regional atovs radiance-bias correction scheme for rediance assimilation. Acta Meteorol. Sin. 2007, 65, 113–123. [Google Scholar]
  38. Isaksen, L.; Vasiljevic, D.; Dee, D.P.; Healy, S. Bias Correction of Aircraft Data Implemented in November 2011; ECMWF Newsletter, No. 131; ECMWF: Reading, UK, 2012; pp. 6–7. [Google Scholar]
  39. Dee, D.P. Variational bias correction of radiance data in the ECMWF system. In Proceedings of the ECMWF Workshop on Assimilation of High Spectral Resolution Sounders in NWP, Reading, UK, 28 June–1 July 2004; pp. 97–112. [Google Scholar]
  40. Dee, D.P. Bias and data assimilation. Q. J. R. Meteorol. Soc. 2005, 131, 3323–3343. [Google Scholar] [CrossRef]
Figure 1. Weighting Functions of FY-3E MWTS-3 calculated by RTTOV based on US standard atmosphere profile.
Remotesensing 14 05943 g001
Figure 2. Spatial distribution of observed brightness temperature of FY-3E MWTS-3 channel 1 (a), channel 2 (b) and retrieved cloud LWP (c) for descending orbit data on 24 September 2021.
Remotesensing 14 05943 g002
Figure 3. Spatial distribution of retrieved cloud LWP from FY-3E MWTS-3 channel 1 and 2, and brightness temperature of MERSI channel 7 during 0300–1500 UTC 24 September 2021.
Remotesensing 14 05943 g003
Figure 4. Bias (a) and standard deviation (STD) (b) of the differences between the brightness temperature observations and ERA simulations for FY-3E MWTS-3 channels during 10–23 September 2021.
Remotesensing 14 05943 g004
Figure 5. Scatterplots of observed (y-axis) and simulated (x-axis) brightness temperature for MWTS-3 channels 11 (a) and 14 (b) before (black dots) and after (green dots) quality control during 24–30 September 2021.
Remotesensing 14 05943 g005
Figure 6. Frequency distributions of O-B differences for channels 11 (top) and 14 (bottom) before (hatched bars) and after (solid bars) bias correction for MWTS-3 channels 11 (upper panels) and 14 (down panels) during 24 September–3 October 2021.
Remotesensing 14 05943 g006
Figure 7. Bias (upper panels) and STD (lower panels) of the O-B for FY-3E MWTS-3, NOAA-15/18/19, and MetOp-A/B AMSU-A channels before (a,c) and after (b,d) bias correction calculated from the analysis results of the TEST2 experiment during 24 September–25 October 2021.
Remotesensing 14 05943 g007
Figure 8. Bias (upper panels) and STD (lower panels) of the O-B for FY-3E MWTS-3, FY-3D MWTS-2 and NPP ATMS channels before (a,c) and after (b,d) bias correction calculated from the analysis results of the TEST2 experiment during 24 September–25 October 2021.
Remotesensing 14 05943 g008
Figure 9. RMS of geopotential height from the analysis field difference between CTL1 and ERA (black) and TEST1 and ERA (red) in the (a) Southern Hemisphere and (b) Northern Hemisphere from 24 September–25 October 2021. (c,d) are similar to (a,b) but for the potential temperature.
Remotesensing 14 05943 g009
Figure 10. The daily RMS of geopotential height for the analysis field difference between CTL1 and ERA (black) and TEST1 and ERA (red) at 10 hPa in the Southern Hemisphere from 24 September–25 October 2021.
Remotesensing 14 05943 g010
Figure 11. RMS of geopotential height for the analysis field difference between CTL2 and ERA (black) and TEST2 and ERA (red) in the (a) Southern Hemisphere and (b) Northern Hemisphere from 24 September–25 October 2021. (c,d) are similar to (a,b) but for the potential temperature.
Remotesensing 14 05943 g011
Figure 12. RMS of U wind for the analysis field difference between CTL2 and ERA (black), TEST2 and ERA (red) in the (a,c) Southern Hemisphere and (b,d) Northern Hemisphere.
Remotesensing 14 05943 g012
Figure 13. The score card for TEST2 against CTL2.
Remotesensing 14 05943 g013
Table 1. Channel characteristics of FY-3E MWTS-3.
Channel NumberCenter Frequency (GHz)Bandwidth (MHz)PolarizationNEΔT (K)
123.8270QH0.3
231.4180QH0.35
350.3180QV0.35
451.76400QV0.3
552.8400QV0.3
653.246 ± 0.082 × 140QV0.35
753.596 ± 0.1152 × 170QV0.3
853.948 ± 0.0812 × 142QV0.35
954.40400QV0.3
1054.94400QV0.3
1155.50330QV0.3
1257.290330QV0.6
1357.290 ± 0.2172 × 78QV0.7
1457.290 ± 0.3222 ± 0.0484 × 36QV0.8
1557.290 ± 0.3222 ± 0.0224 × 16QV1.0
1657.290 ± 0.3222 ± 0.0104 × 8QV1.2
1757.290 ± 0.3222 ± 0.00454 × 3QV2.1
Table 2. Experiment design for the four cycle experiments.
EXPObservation Data
CTL1Conventional data
CTL2Conventional data+ NOAA-15/18/19 AMSU-A+ NOAA-18/19 MHS+ MetOp-A/B AMSU-A/MHS/IASI+ NPP ATMS + FY-3C/D MWHS-2/MWRI + FY-3D MWTS-2/HIRAS + FY-3C/D GNOS + COSMIC RO, etc
TEST1CTL1+FY-3E MWTS-3
TEST2CTL2+FY-3E MWTS-3
Notes: conventional data consists of radiosondes, SYNOP, ship, Airep, and AMVs.
Publisher’s Note: MDPI stays neutral with regard to jurisdictional claims in published maps and institutional affiliations.

