Article

Using the Geodetector Method to Characterize the Spatiotemporal Dynamics of Vegetation and Its Interaction with Environmental Factors in the Qinba Mountains, China

1
State Key Laboratory of Herbage Improvement and Grassland Agro-Ecosystems, College of Pastoral Agriculture Science and Technology, Lanzhou University, Lanzhou 730020, China
2
Key Laboratory of Ecosystem Network Observation and Modeling, Institute of Geographic and Nature Resources Research, Chinese Academy of Sciences, Beijing 100101, China
3
State Environmental Protection Key Laboratory of Quality Control in Environmental Monitoring, China National Environmental Monitoring Centre, Beijing 100012, China
4
Information Centre, Department of Natural Resources of Sichuan Province, Chengdu 610072, China
5
College of Geoscience and Surveying Engineering, China University of Mining and Technology, Beijing 100083, China
*
Author to whom correspondence should be addressed.
These authors contributed equally to this work.
Remote Sens. 2022, 14(22), 5794; https://doi.org/10.3390/rs14225794
Submission received: 24 October 2022 / Revised: 14 November 2022 / Accepted: 15 November 2022 / Published: 16 November 2022
(This article belongs to the Special Issue Remote Sensing of Ecosystems)

Abstract

:
Understanding the driving mechanisms of vegetation development is critical for maintaining terrestrial ecosystem function in mountain areas, especially under the background of climate change. The Qinba Mountains (QBM), a critical north–south transition zone in China, is an environmentally fragile area that is vulnerable to climate change. It is essential to characterize how its ecological environment has changed. Currently, such a characterization remains unclear in the spatiotemporal patterns of the nonlinear effects and interactions between environmental factors and vegetation changes in the QBM. Here, we utilized the Normalized Difference Vegetation Index (NDVI), obtained from Google Earth Engine (GEE) platform, as an indicator of terrestrial ecosystem conditions. Then, we measured the spatiotemporal heterogeneity for vegetation variation in the QBM from 2003 to 2018. Specifically, the Geodetector method, a new geographically statistical method without linear assumptions, was employed to detect the interaction between vegetation and environmental driving factors. The results indicated that there is a trend of a general increase in vegetation growth amplitude (the average NDVI increased from 0.810 to 0.858). The areas with an NDVI greater than 0.8 are mainly distributed in the Qinling Mountains and the Daba Mountains, which account for more than 76.39% of the QBM area. For the entire region, the global Moran’s index of the NDVI is greater than 0.95, indicating that vegetation is highly concentrated in the spatial domain. The Geodetector identified that landform type was the primary factor in controlling vegetation changes, contributing 24.19% to the total variation, while the explanatory powers of the aridity index and the wetness index for vegetation changes were 22.49% and 21.47%, respectively. Furthermore, the interaction effects between any two factors outperformed the influence of a single environmental variable. The interaction between air temperature and the aridity index was the most significant element, contributing to 47.10% of the vegetation variation. These findings can not only improve our understanding in the interactive effects of environmental forces on vegetation change, but also be a valuable reference for ecosystem management in the QBM area, such as ecological conservation planning and the assessment of ecosystem functions.

1. Introduction

Terrestrial vegetation, as a sensitive factor in global climate change, plays a key role in the material and energy cycles between biosphere and atmosphere. Its spatiotemporal variability can reveal the connections between environmental factors (e.g., precipitation, temperature, and elevation) and vegetation physiological activities (e.g., photosynthesis and respiration) [1,2]. Thus, it is urgent to explore the spatiotemporal patterns of vegetation changes and the related driving forces, from a global scale to a local scale, especially in climate-change-sensitive areas, such as a climatic transition zone or high-altitude regions. These works will widen our path in understanding global changes and the corresponding mechanisms. It is obvious that terrestrial vegetation is a complex ecosystem that evolves with multiple driving elements. Generally, previous studies that focused on vegetation change mainly employed a linear correlation approach to depict the relationship between natural variables and vegetation dynamics, which tended to overlook the intricate interactions between vegetation and the environment [3,4]. In this study, we apply a nonlinear and interactive algorithm to understand the complicated links between environmental factors and vegetation. This approach will be beneficial to enlarge our knowledge domain regarding the relationship between climate change and ecosystem change and provide scientific guidance for terrestrial ecosystem protection and planning [5,6].
The Normalized Difference Vegetation Index (NDVI) is a key proxy for the physiological characteristics of terrestrial vegetation [7]. It has been widely used in previous studies that focused on vegetation spatiotemporal changes [8,9,10,11]. In terms of methodology, linear correlation approaches, such as multivariate linear regression and non-parameter regression, have been commonly applied in exploring the links between environmental factors and NDVI changes [12,13,14]. Even though these methods have been validated in monitoring vegetation spatial change, there is still a deficiency in the application of geostatistical methods in quantifying the characteristics of spatial vegetation change. Spatial autocorrelation is the basis of spatial statistics construction, which indicates the correlation between specific observations within the same distribution area in geographic space [15]. Specifically, Moran’s index is a key indicator in the quantitative analysis of the spatial autocorrelation patterns of geographical elements [16]. It is frequently utilized in geosciences and ecological sciences because of its advantage in depicting the spatial characteristics of variables [17]. Actually, the global Moran’s index and the local Moran’s index indicate the degree of spatial element clustering and spatial variation, which can effectively reflect the aggregation or dispersion patterns among adjacent location attributes [18,19].
For a specific region, vegetation change is a comprehensive result under the interactive influence of various environmental factors. In recent years, researchers have uncovered a growing body of evidence suggesting that the interaction of multiple environmental factors (e.g., temperature, precipitation, and solar radiation) affects vegetation types and spatial distribution [20,21,22]. This interaction will have an impact on vegetation photosynthesis and respiration, leading to changes in the evolution of ecosystem structure and function. Correlation and regression analysis of various sorts are common approaches in analyzing the link between climatic conditions and vegetation changes [23,24]. In studies based on linear correlation approaches, such approaches are used to oversee the interplay between environmental factors and vegetation. Further, differences in topographic features and soil types may cause varied water and heat conditions, as well as variations in nutritional status [15,25]. It is unknown how these factors impact regional vegetation changes and their interactions.
Geodetector, a robust and straightforward emerging method, enables researchers to investigate the spatial heterogeneity of a specific geographical phenomenon, revealing the background drivers of change and the strength of their interactions [26]. The Geodetector method does not involve complex parameter-setting procedures and is not bound by the assumptions of classic linear statistical techniques (e.g., linear regression analysis). Therefore, it has been widely used in exploring the factors affecting the expansion of built-up land expansion, ecosystem health, and vegetation changes.
The Qinba Mountains (QBM) are located in the north–south transitional zone in China. That area has been established as an essential ecological security zone. It also serves as a treasure trove of natural resources and an important water recharge area [27,28]. As the QBM area is an ecologically fragile area that is extremely sensitive to climate change, it is crucial to examine ecosystem changes in the area [29,30]. However, previous research has mainly used classical linear methods to analyze the relationships between the vegetation and the environmental drivers in the QBM, which may ignore the complex interactions between such vegetation and drivers, as well as fail in quantitatively assessing the intensity of the effects of drivers [14,31]. Therefore, it is meaningful to carry out a comprehensive and quantitative evaluation of the complex interactions between vegetation and environmental drivers in the QBM.
In this study, we used Geodetector to characterize the spatiotemporal dynamics of vegetation and its interaction with environmental factors in the QBM. The workflow of our study was as follows: (1) we conducted a statistical analysis of the QBM’s vegetative cover’s spatial distribution; (2) we applied Geodetector to detect the influence that climate factors (mean annual temperature, mean annual precipitation, aridity index, wetness index, and total radiation), vegetation factors (vegetation types), the geomorphology factor (landform type), the soil factor (soil type), and topography factors (elevation, aspect, and slope) exert on NDVI; and (3) we determined the contribution of each environmental factor to plant growth.

2. Materials and Methods
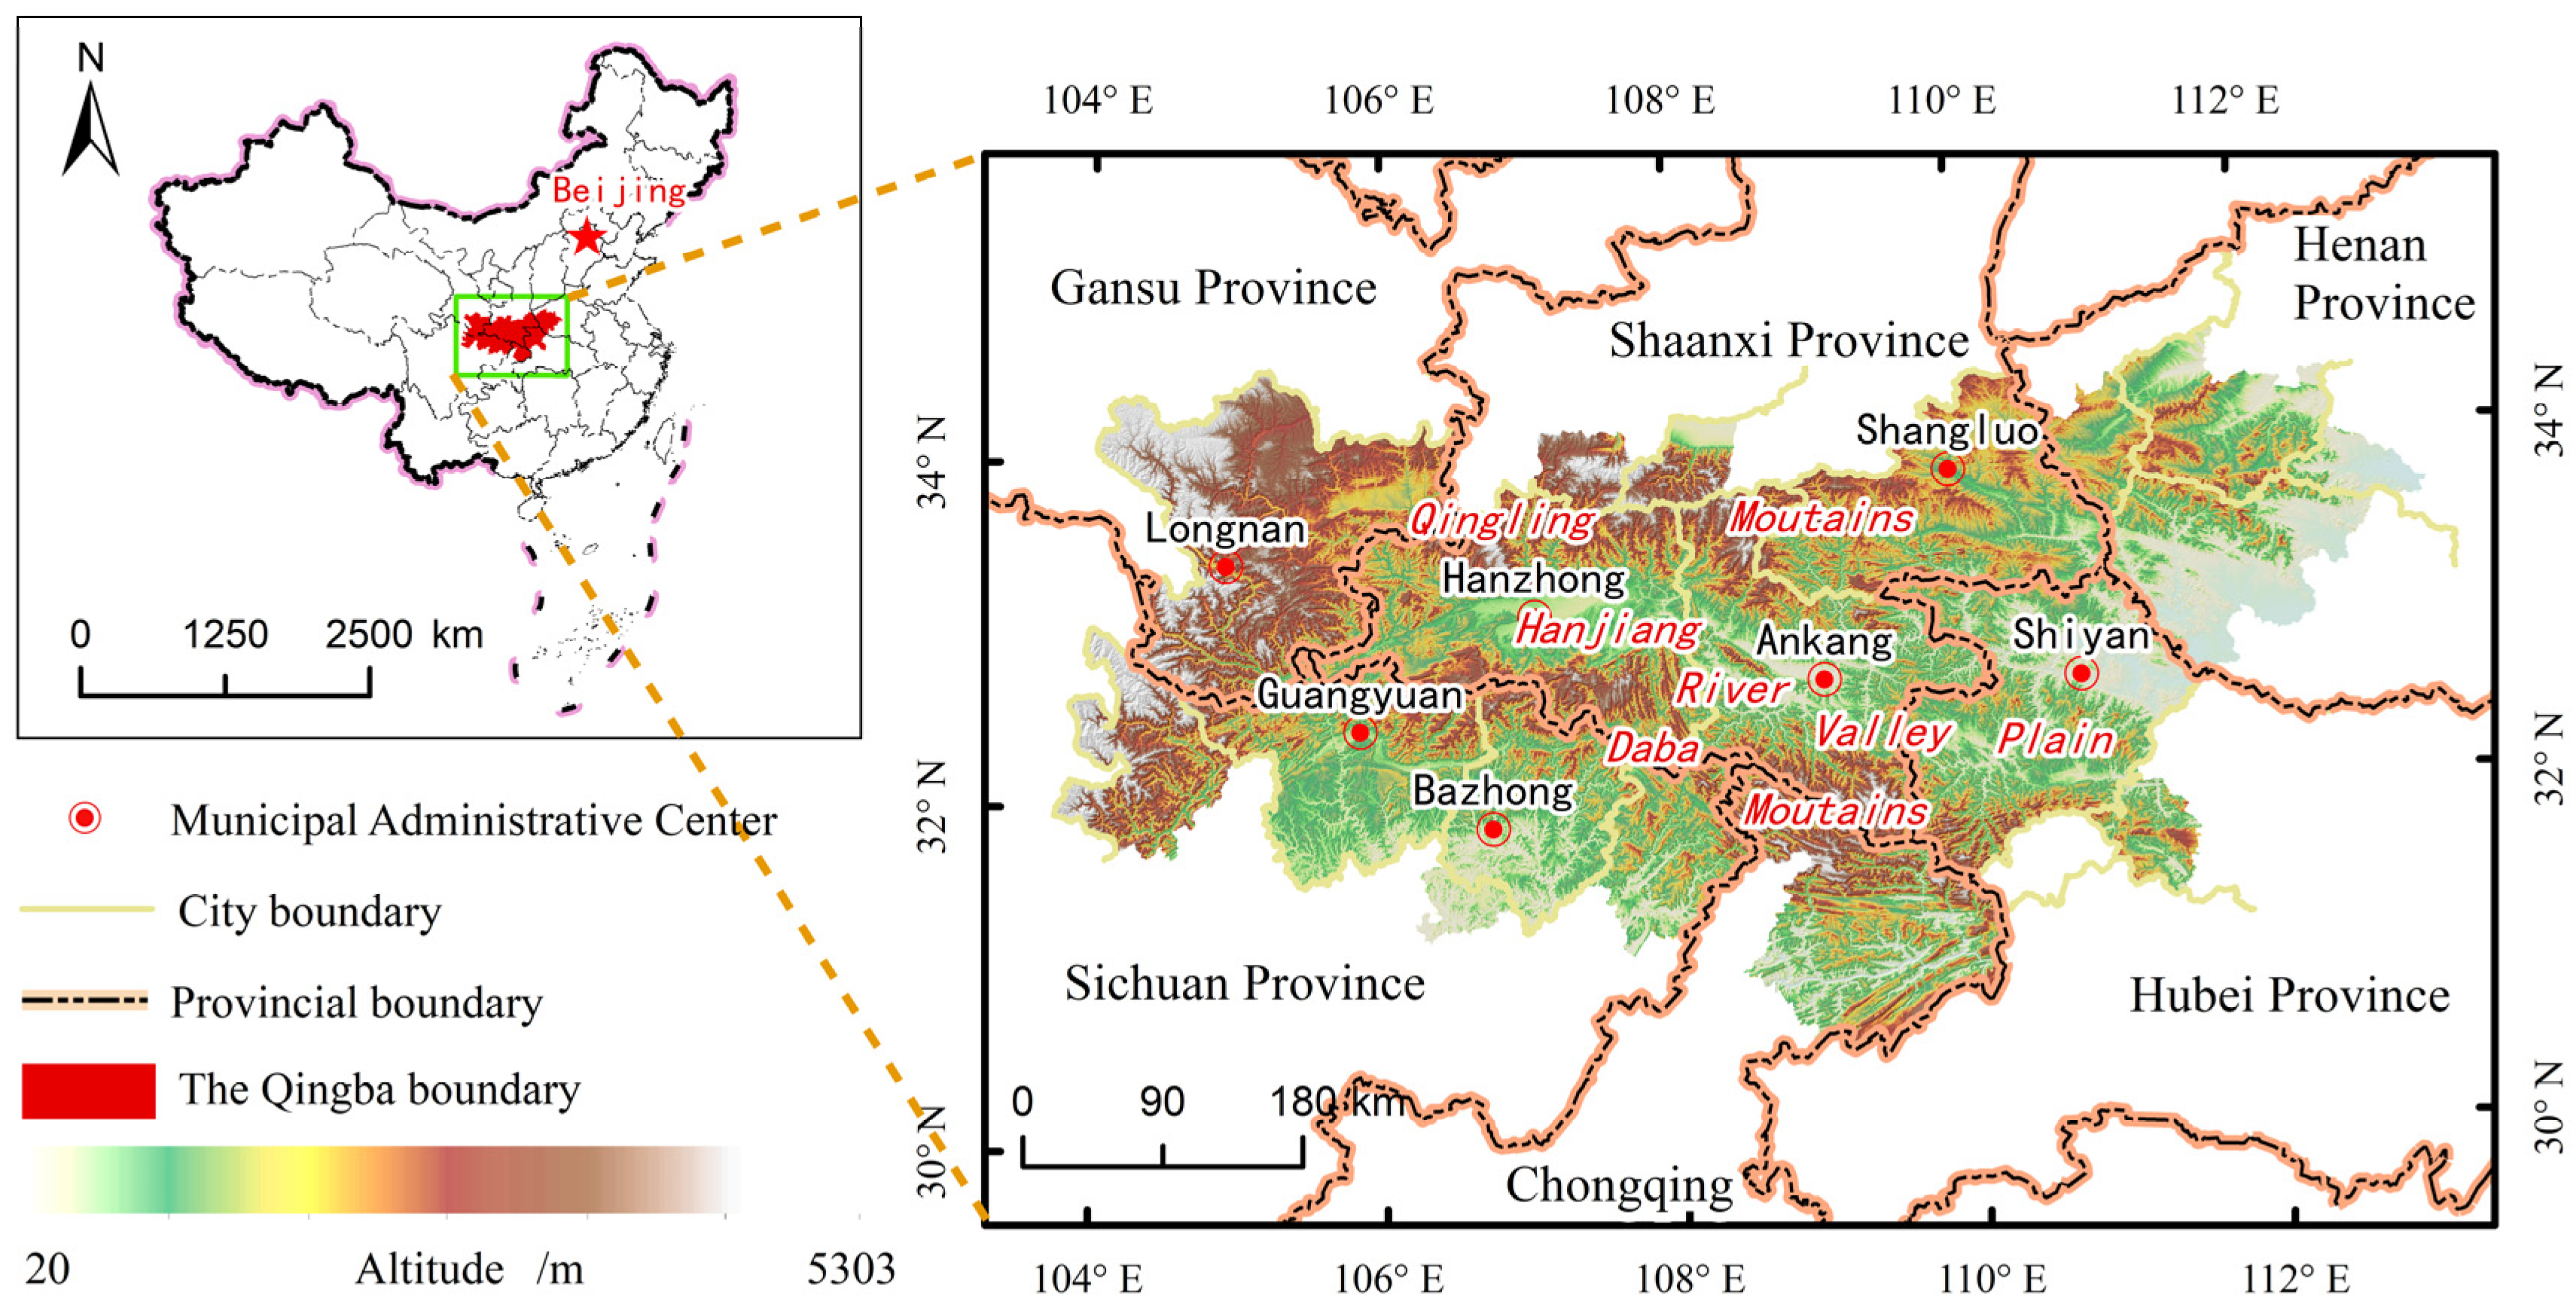
2.1. Study Area

The Qinba Mountains are distributed in the spatial range of 103°45′E~113°14′E, 30°30′N~34°37′N (almost the middle of China), with an area of 2.25 × 10⁵ km2 (Figure 1). The QBM area includes three geomorphic units, including the Qinling Mountains, the Hanjiang River Valley Basin, and the Daba Mountains. In the administrative area, it involves 81 counties (districts) in six provinces (cities), consist of Shaanxi, Gansu, Sichuan, Chongqing, Hubei, and HenanT the main parts of the administrative area are the three cities in southern Shaanxi (Hanzhong, Ankang, and Shangluo). The QBM area is located in the transition zone between the warm-temperate continental monsoon climatic zone and the subtropical humid monsoon climate zone, with an average annual temperature between 12 °C and 16 °C and average annual precipitation between 709 mm and 1500 mm [31,32]. The plant coverage of QBM is mainly composed of deciduous broad-leaved forest, together with some mixed deciduous broad-leaved forest in the northern part. The soil type is mainly leaching soil.

2.2. Data Sources and Preprocessing

2.2.1. MODIS NDVI

The Normalized Difference Vegetation Index (NDVI) is used here as a proxy for vegetation conditions. Here, we utilized the MODIS vegetation product (“MODIS/061/MOD13Q1”) obtained from the Google Earth Engine (GEE) cloud platform. This dataset has a spatial and temporal resolution of 250 m and 16 days, respectively. The selected MODIS data were further processed through reprojecting, resampling, and compositing of the maximum NDVI value.

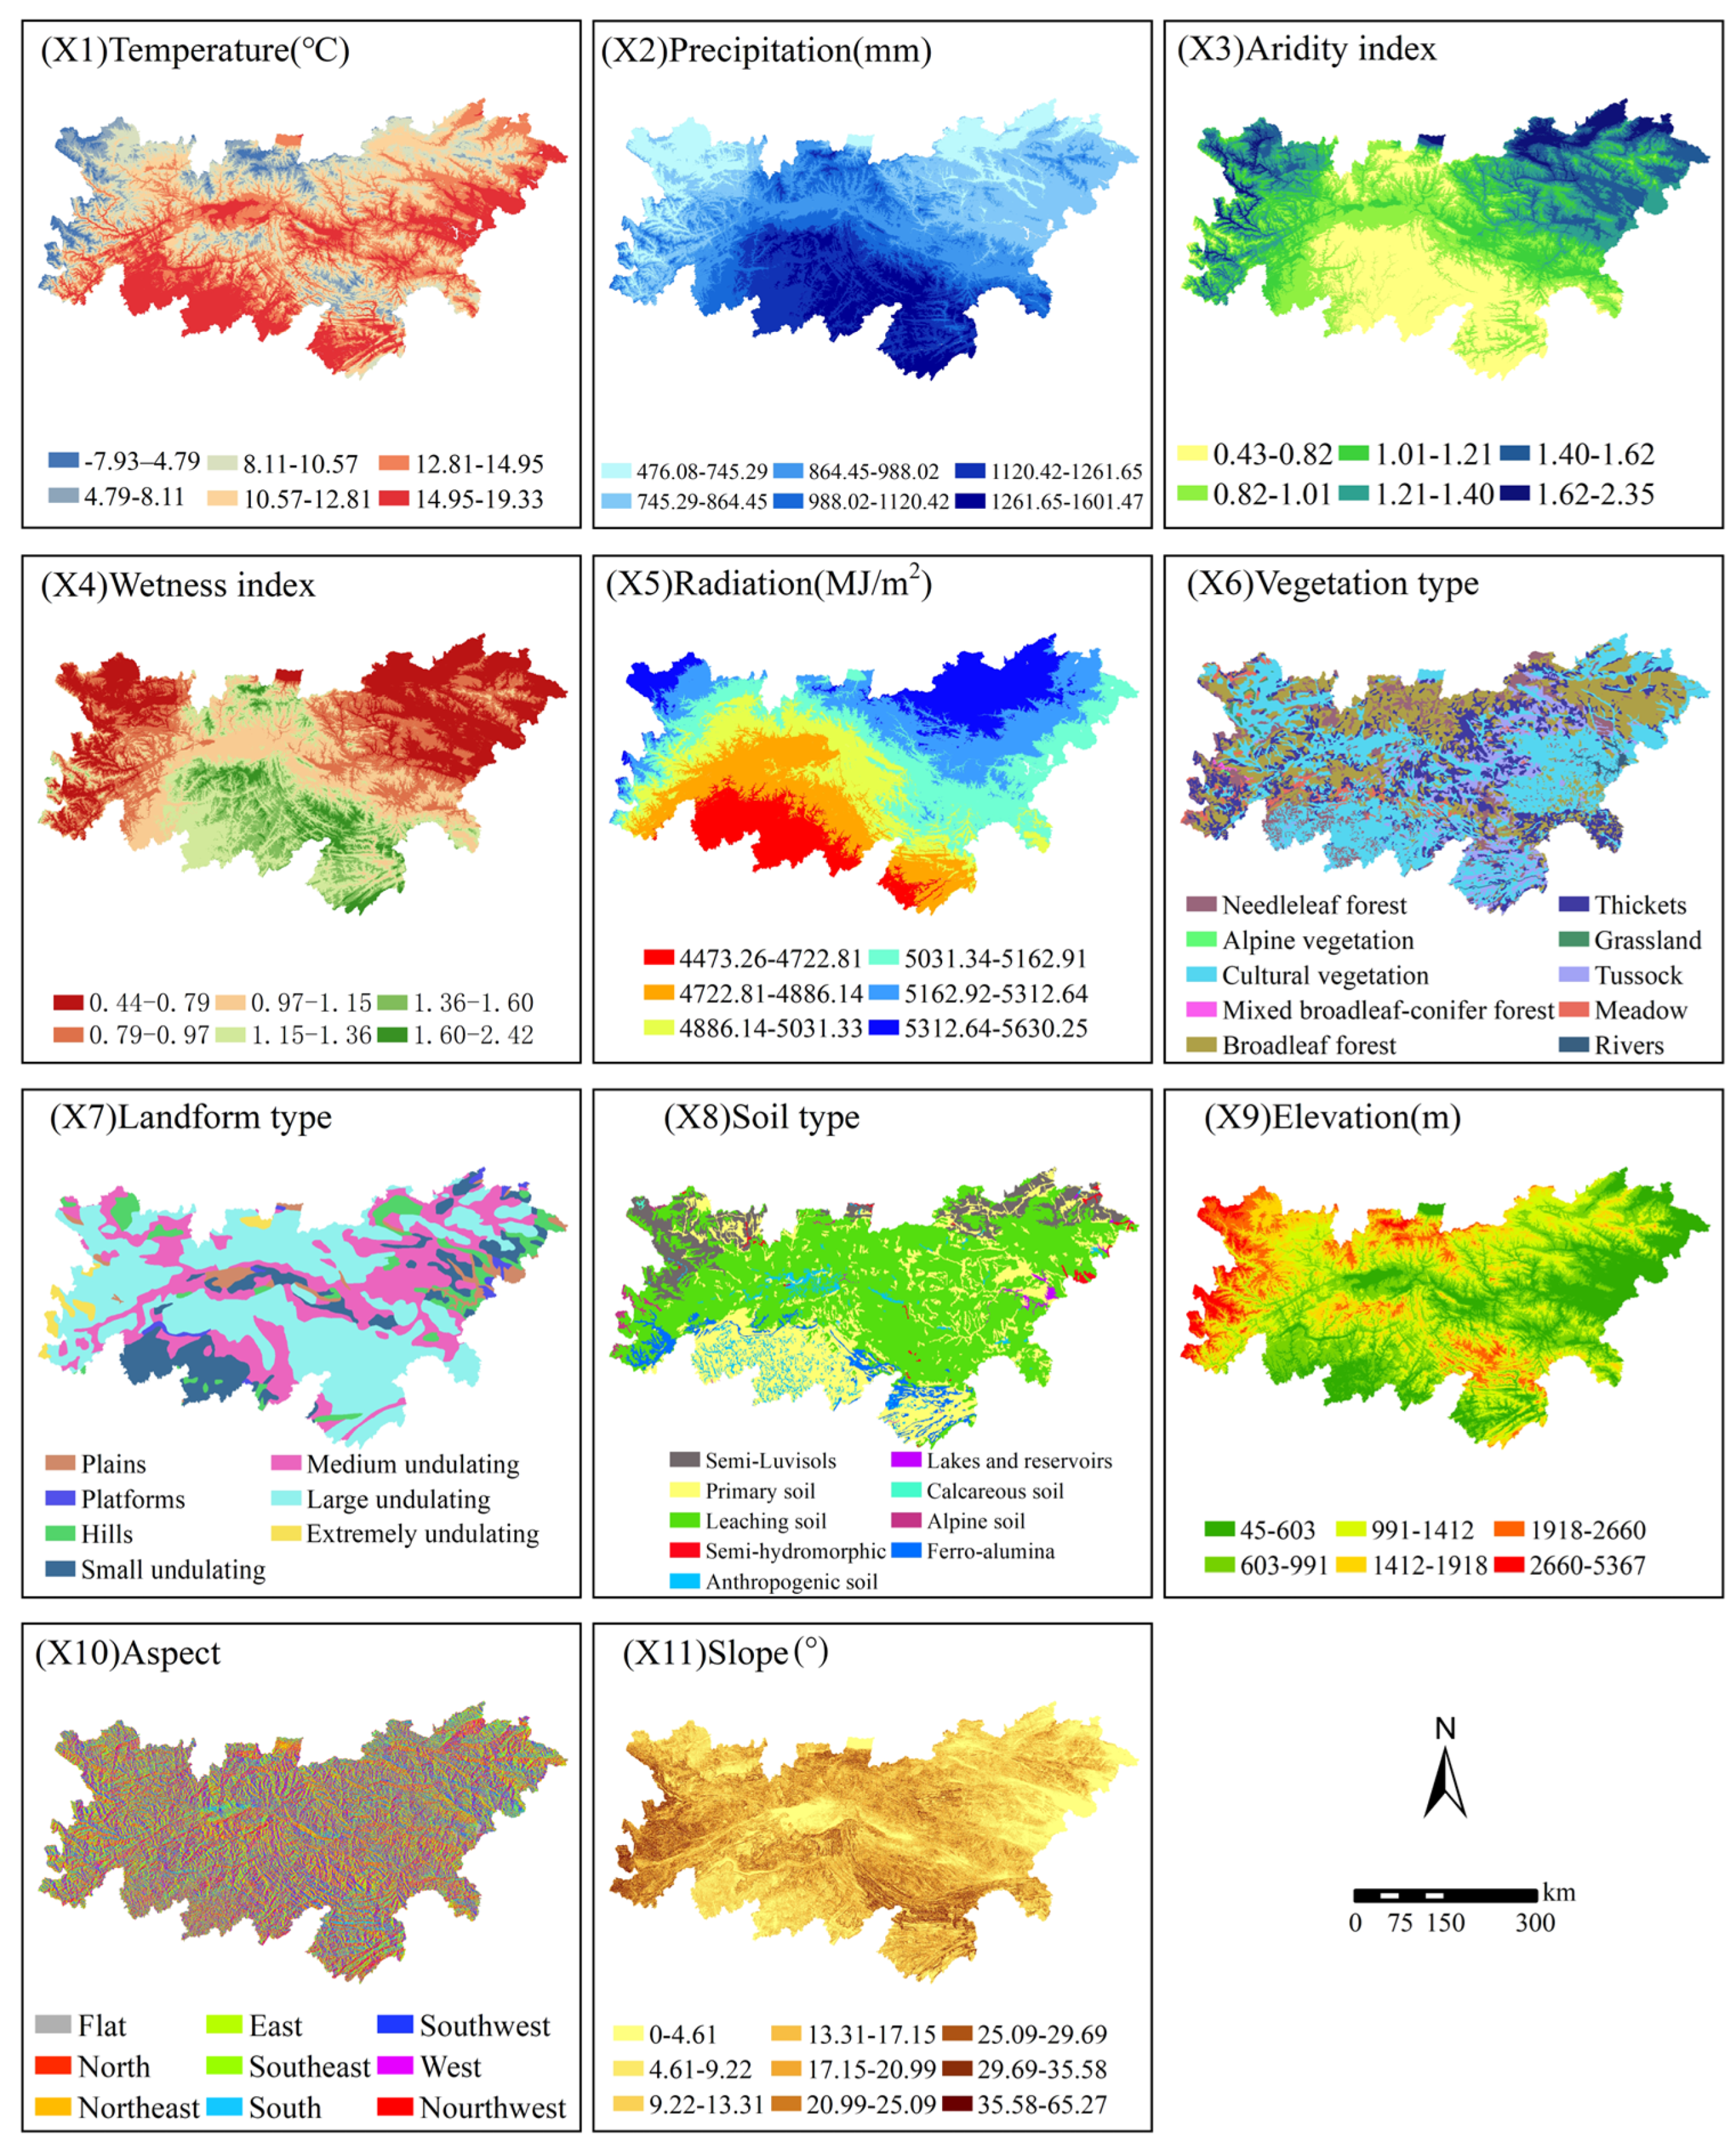
2.2.2. Driving Factors
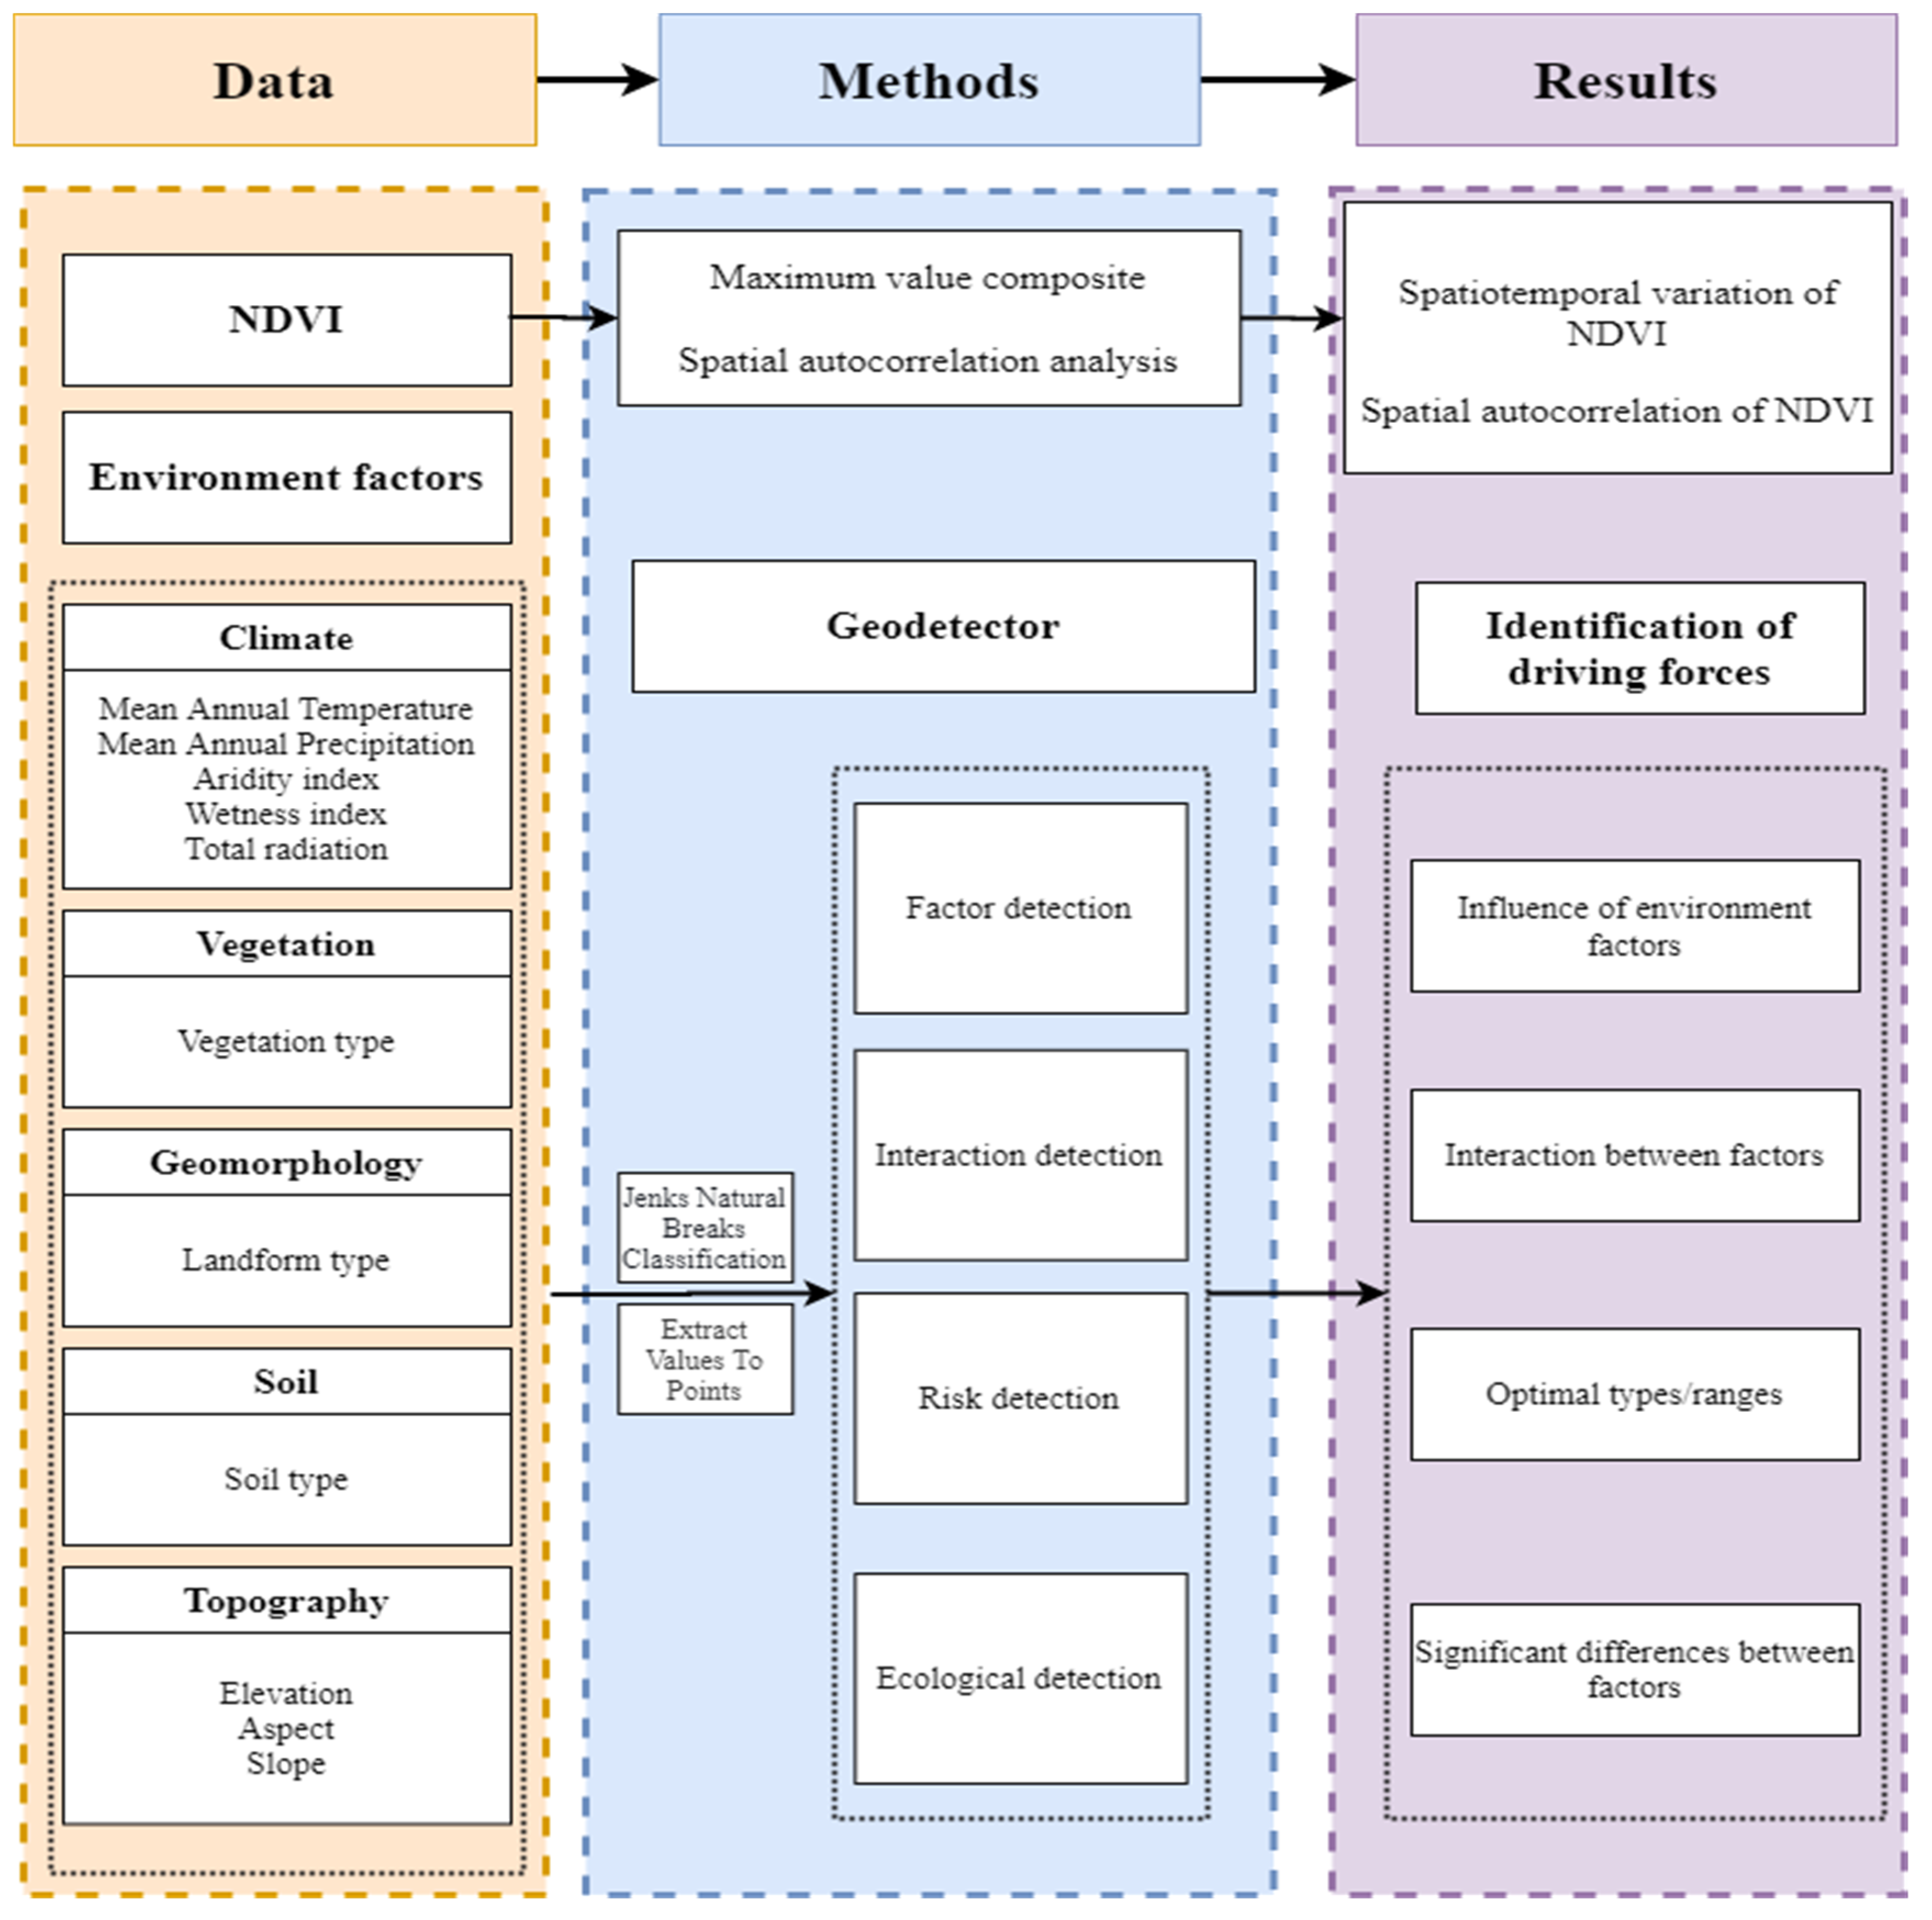
Environmental factors have five categories and eleven elements, including climate factors (mean annual temperature, mean annual precipitation, aridity index, wetness index, and total radiation), a vegetation factor (vegetation type), a geomorphology factor (landform type), a soil factor (soil type), and topography factors (elevation, aspect, and slope) (Table 1).
Meteorological station data were collected from the China Meteorological Data Network (http://data.cma.cn, accessed on 1 September 2021). Then, radiation (Rad) and potential evapotranspiration (ETo) were calculated by UNFAO CROPWAT8.0 software. Then, we used the ANUSPLIN software [33,34] to interpolate temperature, precipitation, total radiation, and potential evapotranspiration. The aridity index (AI) and the wetness index (W) [35] were calculated in ArcGIS 10.2 raster analysis toolbox. Finally, temperature, precipitation, total radiation, the aridity index, and the wetness index were reclassified into six categories. The annual averaged values were calculated for these environmental factors.
Vegetation type, soil type, and landform type data were gathered from the Resources and Environmental Science and Data Center of the Chinese Academy of Sciences (http://www.resdc.cn/, accessed on 1 September 2021). Vegetation-type data were reclassified into ten categories according to the major categories of vegetation. Soil-type data were classified into nine categories according to soil properties, and the landform-type data were reclassified into seven categories according to different landforms.
The DEM data with a spatial resolution of 90 m were obtained from the Geospatial Data Cloud (http://www.gscloud.cn/, accessed on 1 September 2021). Subsequently, slope, aspect, and elevation were derived from the DEM using ArcGIS 10.2. Slope and aspect were classified into nine categories and elevation was divided into six categories. The data of each category were uniformly resampled to 250 m and the projection coordinates were uniformly CGCS2000_CK_CM_105E. In the process of applying Geodetector, we first used the Jenks Nature Breaks category approach to classify environmental factors into various levels (Figure 2). Then, based on the data classification, 100,000 random points were generated in ArcGIS 10.2 according to the basic principle of the minimum distance of 1000 m between two points (98,932 points remaining after removing outliers). Finally, the NDVI data layer and each environmental factor classification layer were spatially overlaid. Then, the raster cell values were extracted with random points to generate the attribute table.

2.3. Methodology

First, we preprocessed MODIS NDVI with mosaic and crop tools in the GEE platform and obtained annual NDVI images based on the maximum value composites (MVC) for four periods (2003, 2008, 2013, and 2018). Second, statistical analysis and spatial autocorrelation analysis (global Moran’s index and local Moran’s index (I)) was utilized to investigate the vegetation’s spatiotemporal variation. In the end, Geodetector was applied to quantify the impacts of a variety of environmental factors on vegetation change. The factors included climate factors, a vegetation factor, a geomorphology factor, a soil factor and topography factors, as well as the interactions between these elements. The general workflow for this study is shown in Figure 3.

2.3.1. Spatial Autocorrelation Analysis

Spatial autocorrelation is a method of spatially distributing eigenvalues of spatial units through statistical analysis. The Global Moran’s I is calculated based on the following formula [36]:
Global   Moran s   I   = n i = 1 n i = 1 n w ij x i   x ¯ x j   x ¯ i = 1 n i = 1 n w ij x i   x ¯ 2
where w ij is the value of the spatial weight matrix coefficient in the i , j place, representing the relationship among the i , j area within the space; x i and x j represent the NDVI values in the i and j vicinity, respectively, in the study area; n is the whole variety of samples in this study; and   x ¯ is the mean value of the NDVI in the study area. The Moran’s I coefficient range is [–1, 1], and the specific explanation is that the spatial distribution of the NDVI is divided into clustered (I > 0), random (I = 0) and discrete (I < 0).
To investigate spatial dependencies or differences between spatial units in the QBM, we applied the local Moran’s index to indicate the local clustering characteristics of the NDVI. The local indicator of spatial association (LISA) was used to characterize local clustering and dispersion effects. The Local Moran’s I is calculated based on the following formula [37]:
Local   Moran s   I = x i   x ¯ 1 n i = 1 n x i   x ¯ j i w ij x i   x ¯
In Equation (2), the variable names and definitions are the same as in Equation (1). The NDVI values were divided into four distinct spatial clustering types, based on the clustering results, including “High–High” (HH), “Low–Low” (LL), “High–Low” (HL), and “Low–High” (LH) [38]. Both the global Moran’s index and the local Moran’s index were computed for the study area using GeoDa 1.18 (http://geodacenter.github.io, accessed on 1 September 2021).

2.3.2. Geodetector

Geodetector is a model used to detect and exploit geographic differences, enabling us to quantify driving forces, influencing factors, and multifactor interactions [26]. It has four distinct functions: factor detection, interaction detection, risk detection, and ecological detection. This study used the R package, the “GD”, to identify the elements that cause changes in vegetation [39].
(1) Factor detection. Factor detection can be uncovered by the heterogeneity in NDVI’s spatial distribution, which also investigates the extent of individual environmental factors effect on NDVI. Their explanatory power is characterized by the q-statistic (with the range of [0, 1]). The geographical heterogeneity of Y increases with the increasing q-statistic. If X is responsible for creating the stratification, then the greater the value of q , the greater the influence of X over Y , and vice versa. The formula for determining q is as follows:
q = 1 h = 1 L N h σ h 2 N σ 2
where q is the explanatory power of a single factor on Y (NDVI) variation; in other words, X (environmental factors) explains q × 100% of Y (NDVI); h is the strata of Y (NDVI) or X (environmental factors). N h and N are, respectively, the stratum and the number of cells in the QBM. σ h 2 and   σ 2 are the strata and the study area of Y (NDVI).
(2) Interaction detection: Interaction detection assesses the impact of interactions of different environmental factors on the NDVI. First, the q-values (q(X1) and q(X2)) between two environmental factors were calculated. Then, the q-values of the two environmental factors after interaction (q(X1 ∩ X2)) were compared with those of the individual environmental factors (q(X1) and q(X2)). Finally, the form of interplay among the two drivers was determined by using comparing the distinct results (Table 2).
(3) Risk detection. Risk detection is used to determine whether the mean values of attributes are significantly different between subregions of two environmental factors, which is determined by t test.
t   y ¯ h = 1   y ¯ h = 2 =   Y ¯ h = 1   Y ¯ h = 2 Var   Y ¯ h = 1 n h = 1 + Var   Y ¯ h = 2 n h = 2 1 / 2
(4) Ecological detection. Ecological detection determines whether there is a statistically significant difference between the influences of two factors ( X 1   and X 2 ) on the spatial distribution of an attribute ( Y ), using the F statistic as the measuring stick.
F = N X 1 N X 2 1 SSW X 1 N X 2 N X 1 1 SSW X 2
SSW X 1 = h = 1 L 1 N h σ h 2 , SSW X 2 = h = 1 L 2 N h σ h 2
where N X 1 and N X 2 represent the sample sizes of X 1   and X 2 . Sample sizes in the X 1   and X 2 layers are denoted by L 1 and L 2 , while the total variance within the X 1   and X 2 layers is denoted, respectively, by SSW X 1 and SSW X 2 .

3. Results

3.1. Spatiotemporal Variation of the NDVI in the QBM

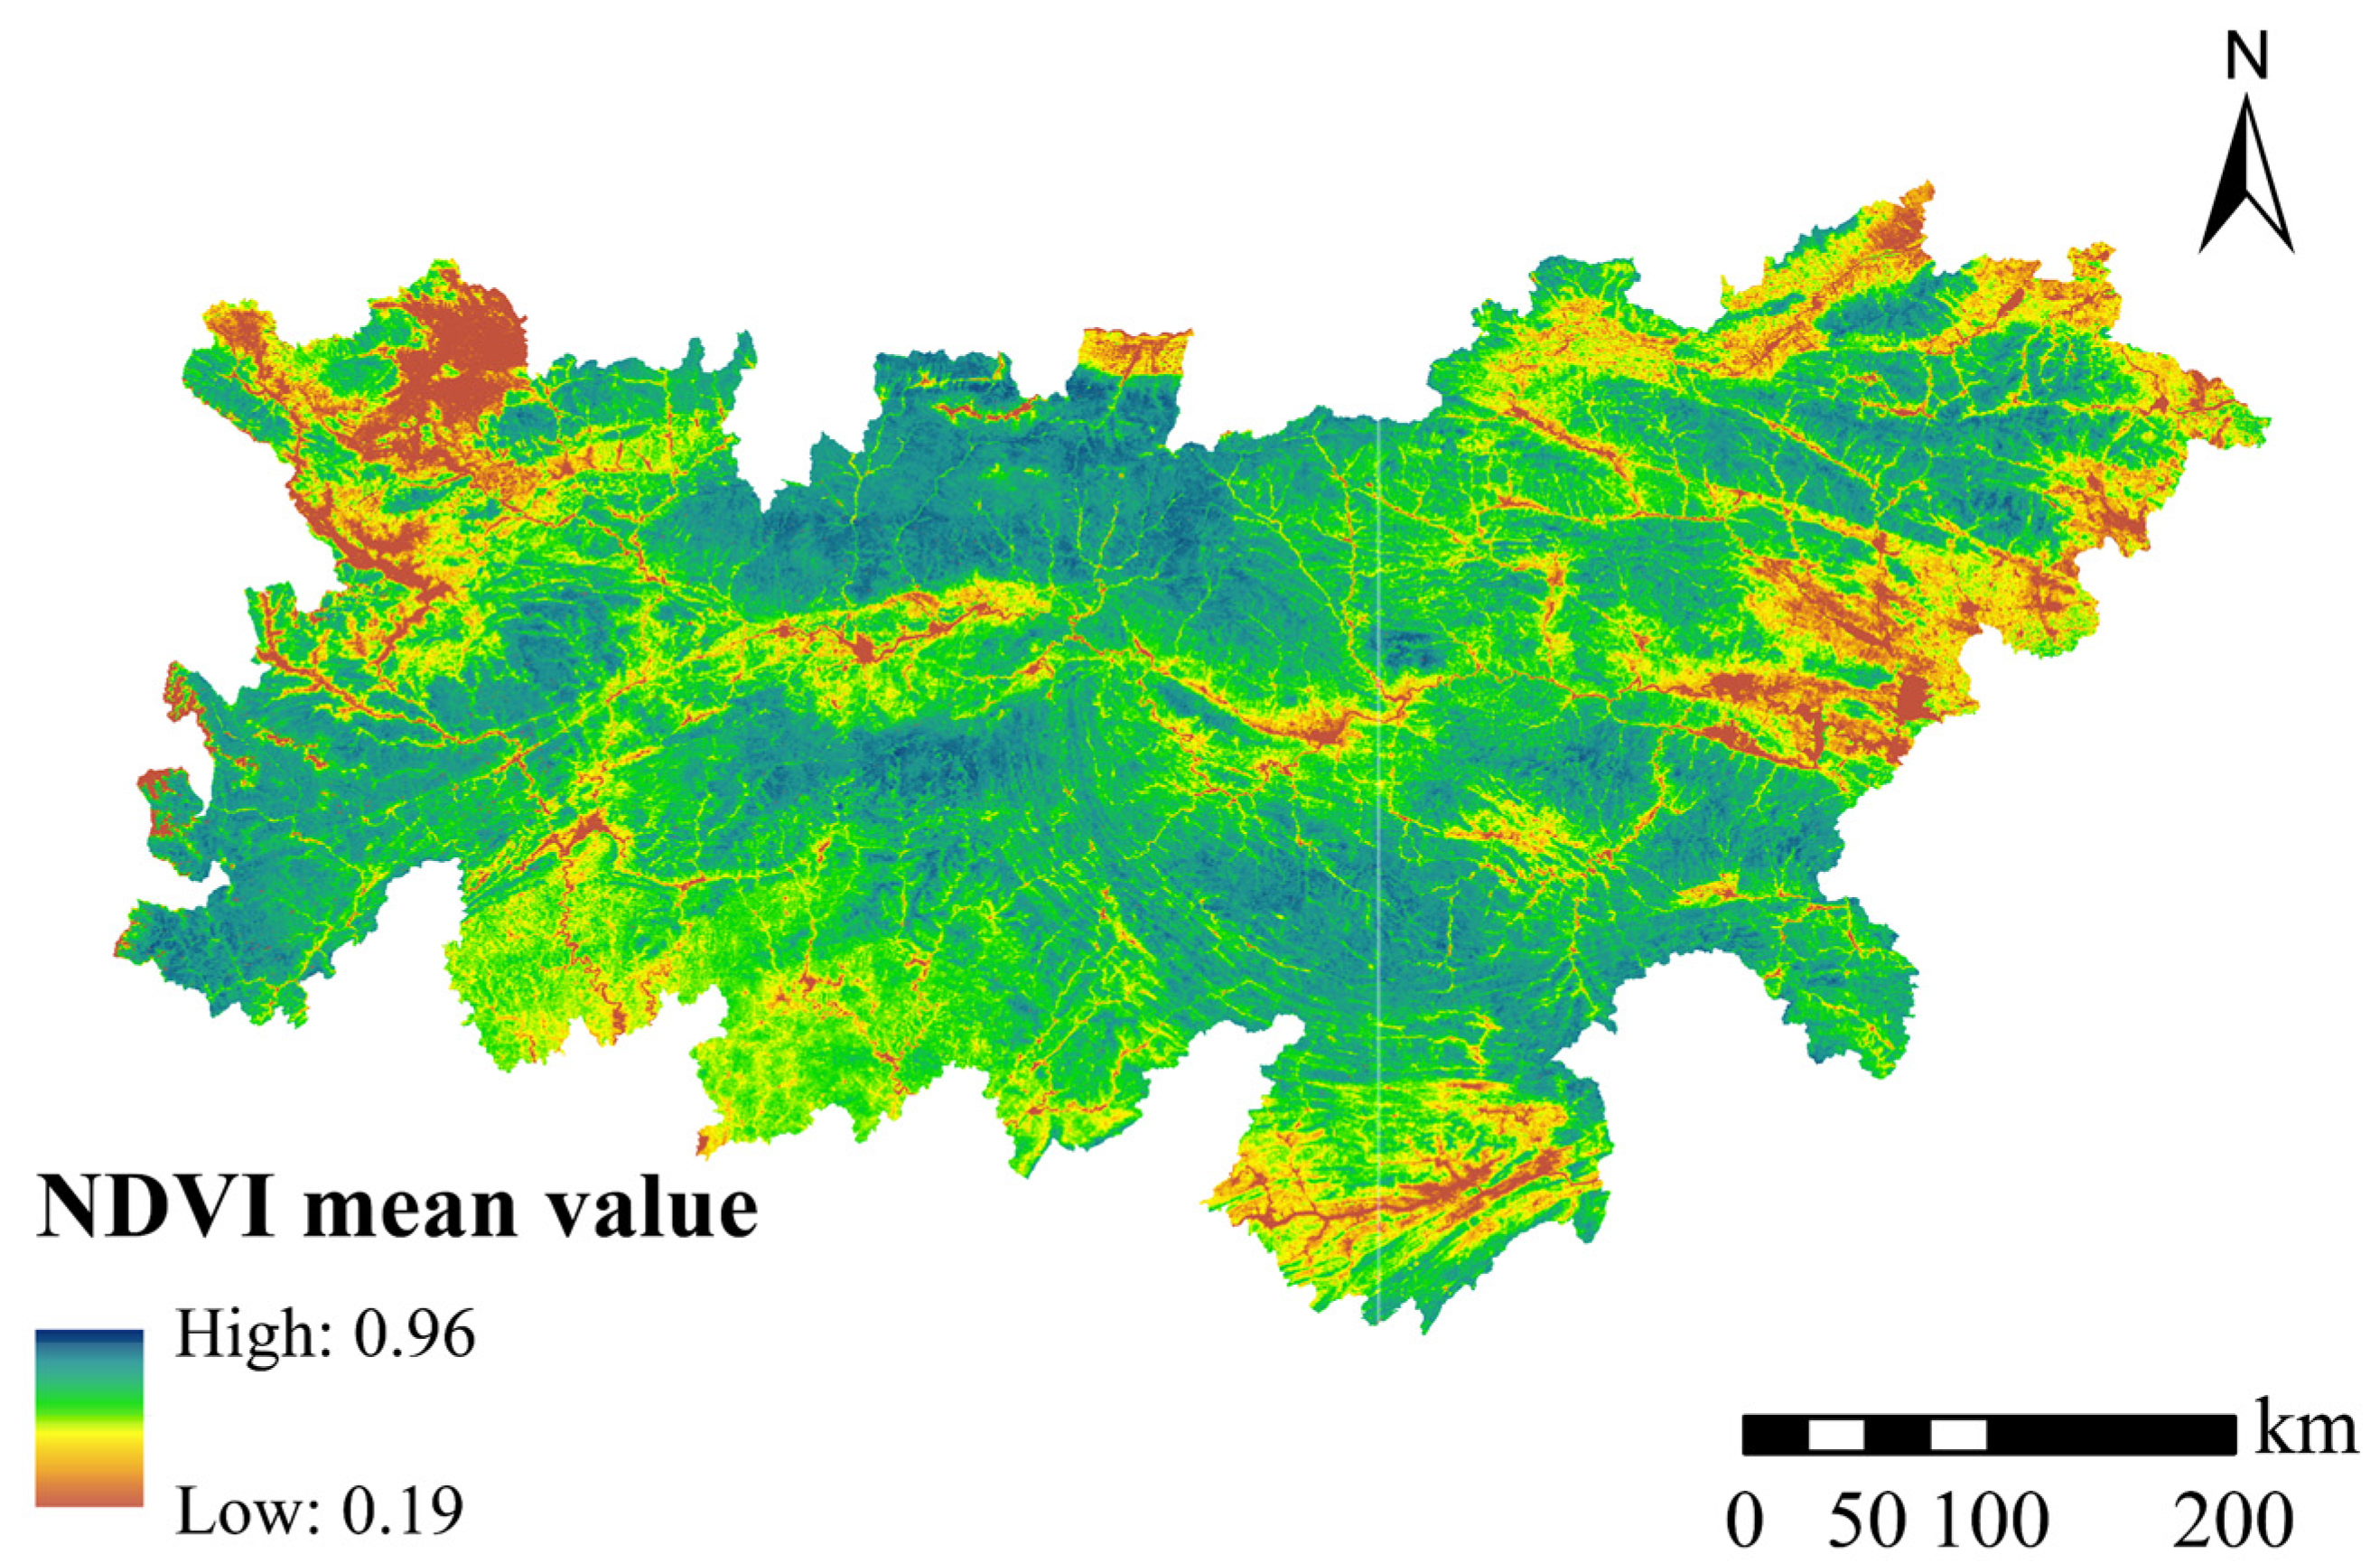
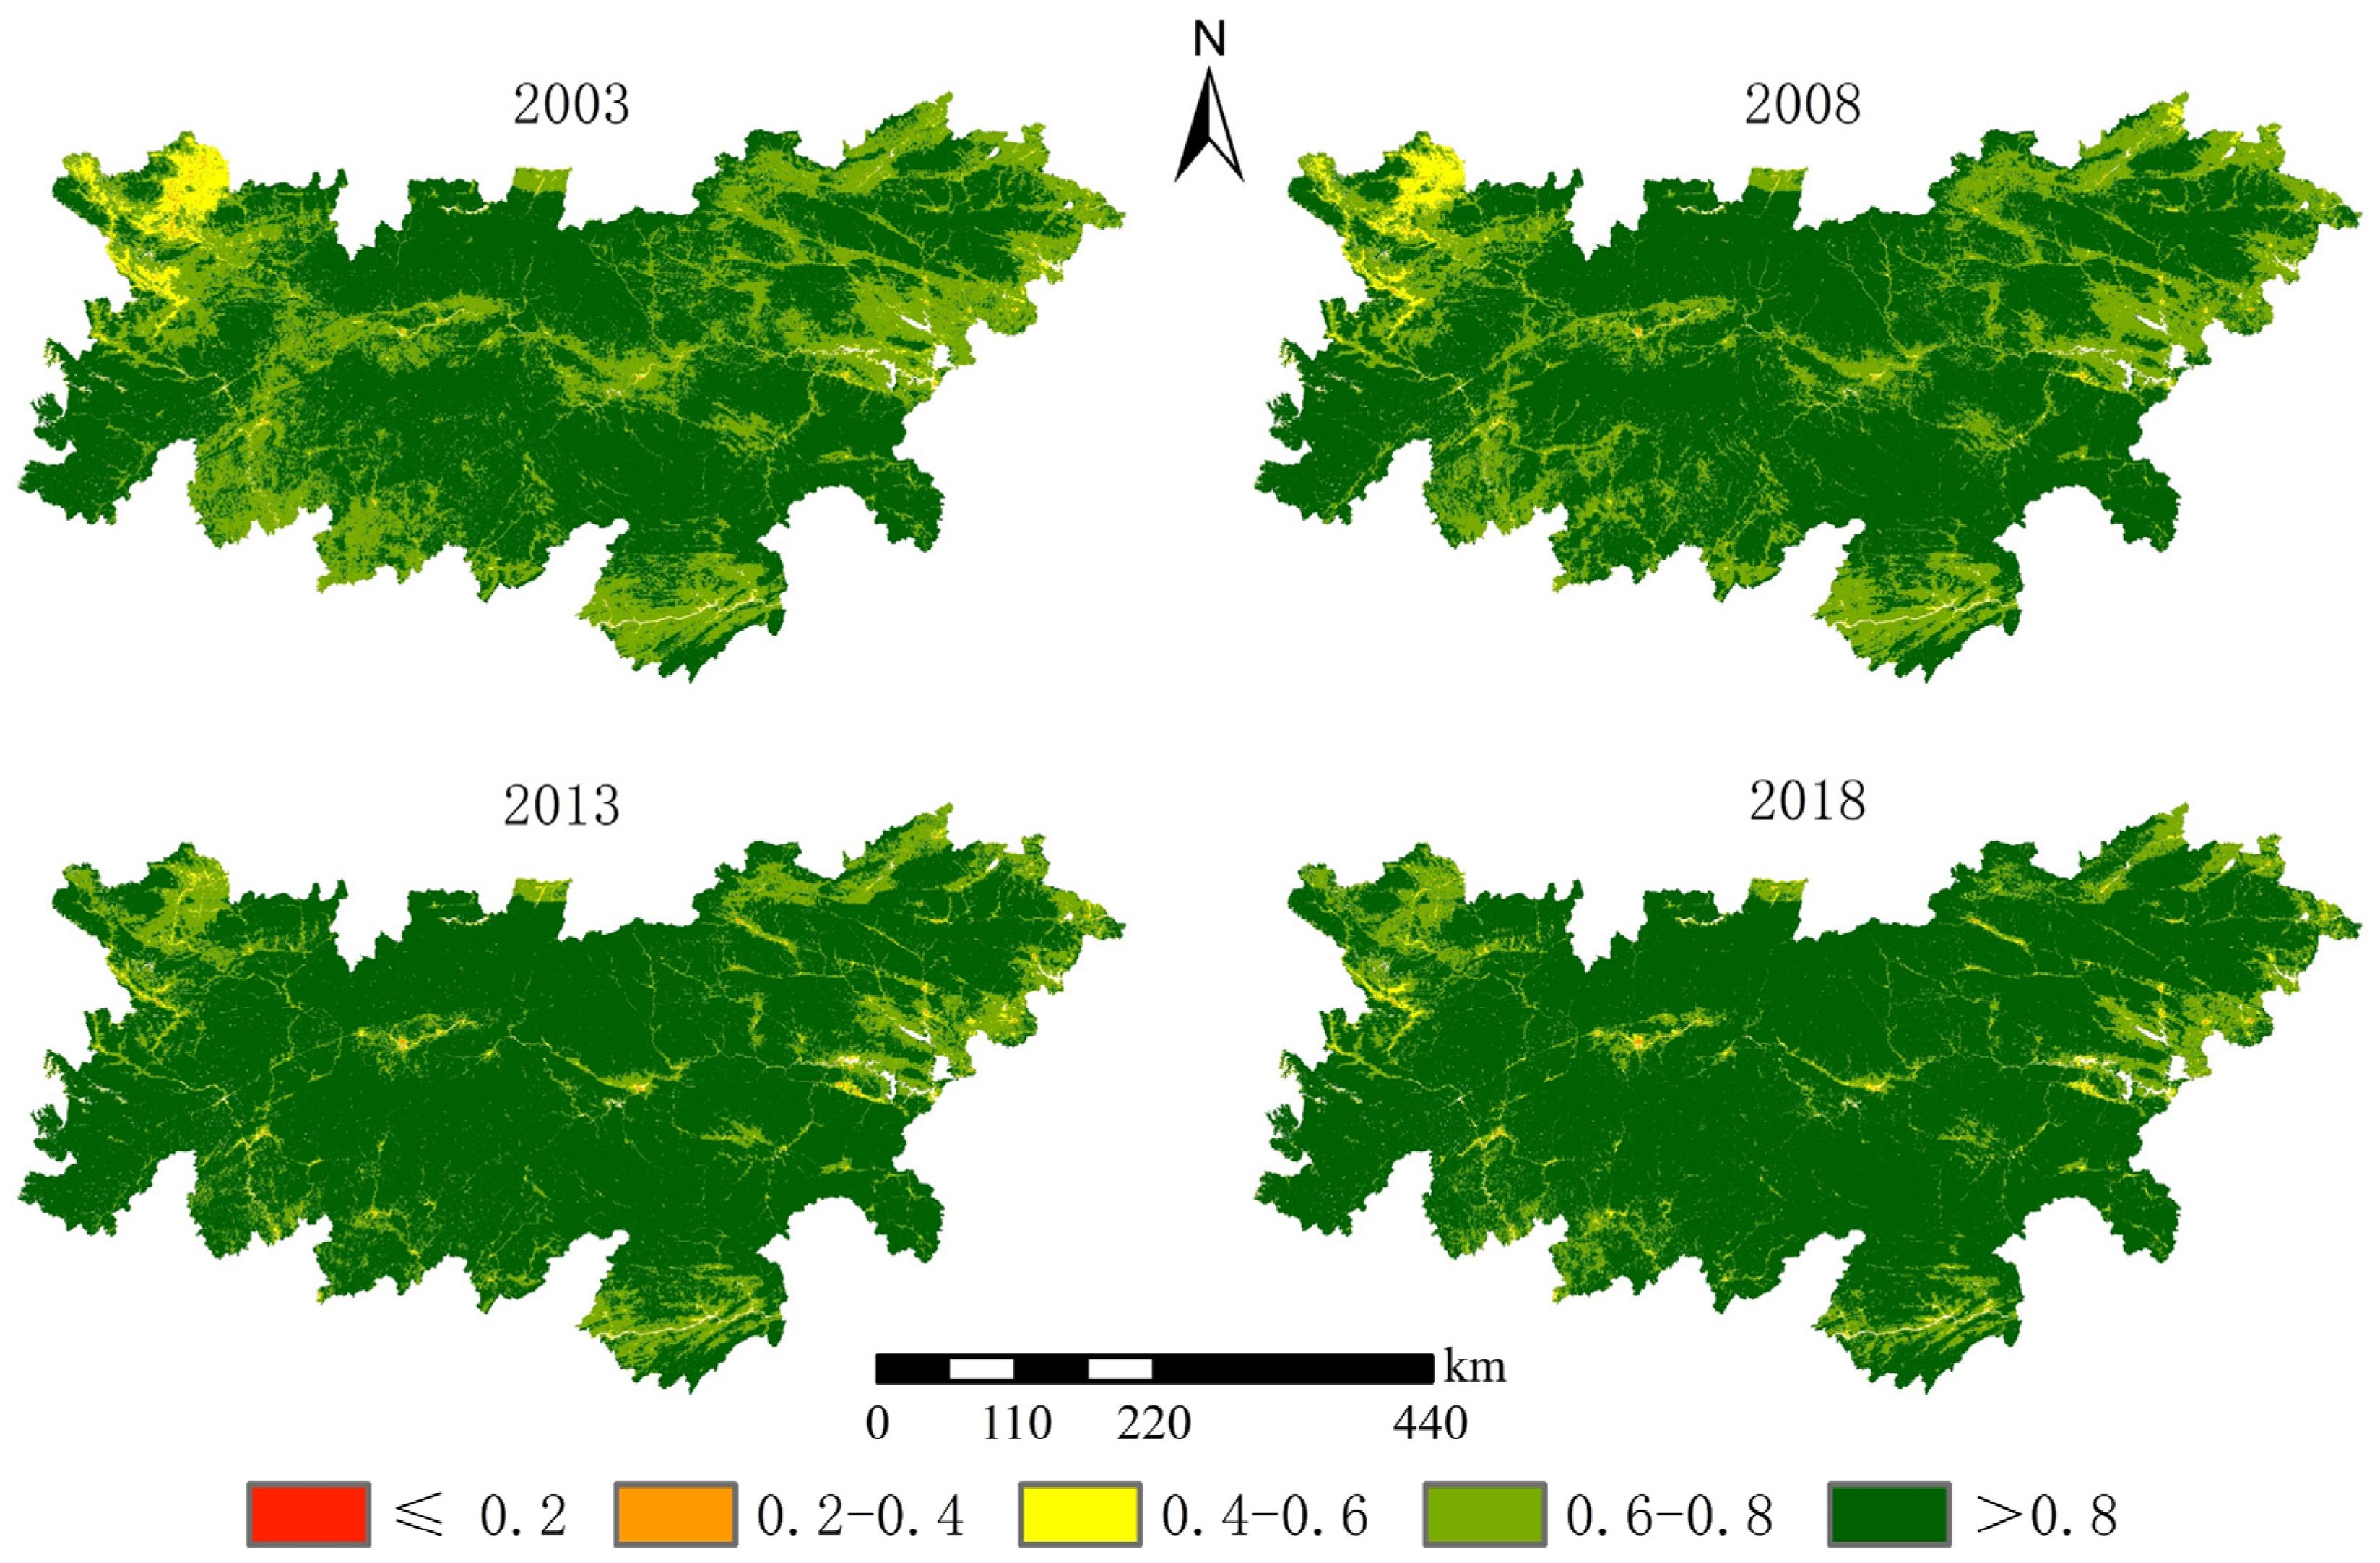
3.1.1. Spatial Pattern of the NDVI in the QBM

To more accurately portray the dynamics of the vegetation, the NDVI in the QBM was classified into five different levels by the Equal Interval method (Table 3). It shows the spatial pattern using mean NDVI values between 2003 and 2018 (Figure 4). In general, the overall pattern demonstrated the distribution characteristics of “high in the middle and low in the periphery”. More than 98.73% of the NDVI of the QBM’s vegetation consisted of medium-high and high levels of vegetation. In addition, the NDVI in low, medium-low, and medium classes accounted, totally, for less than 2% of the research area, which suggested that the QBM vegetation was in an overall favorable growth condition (Table 3).

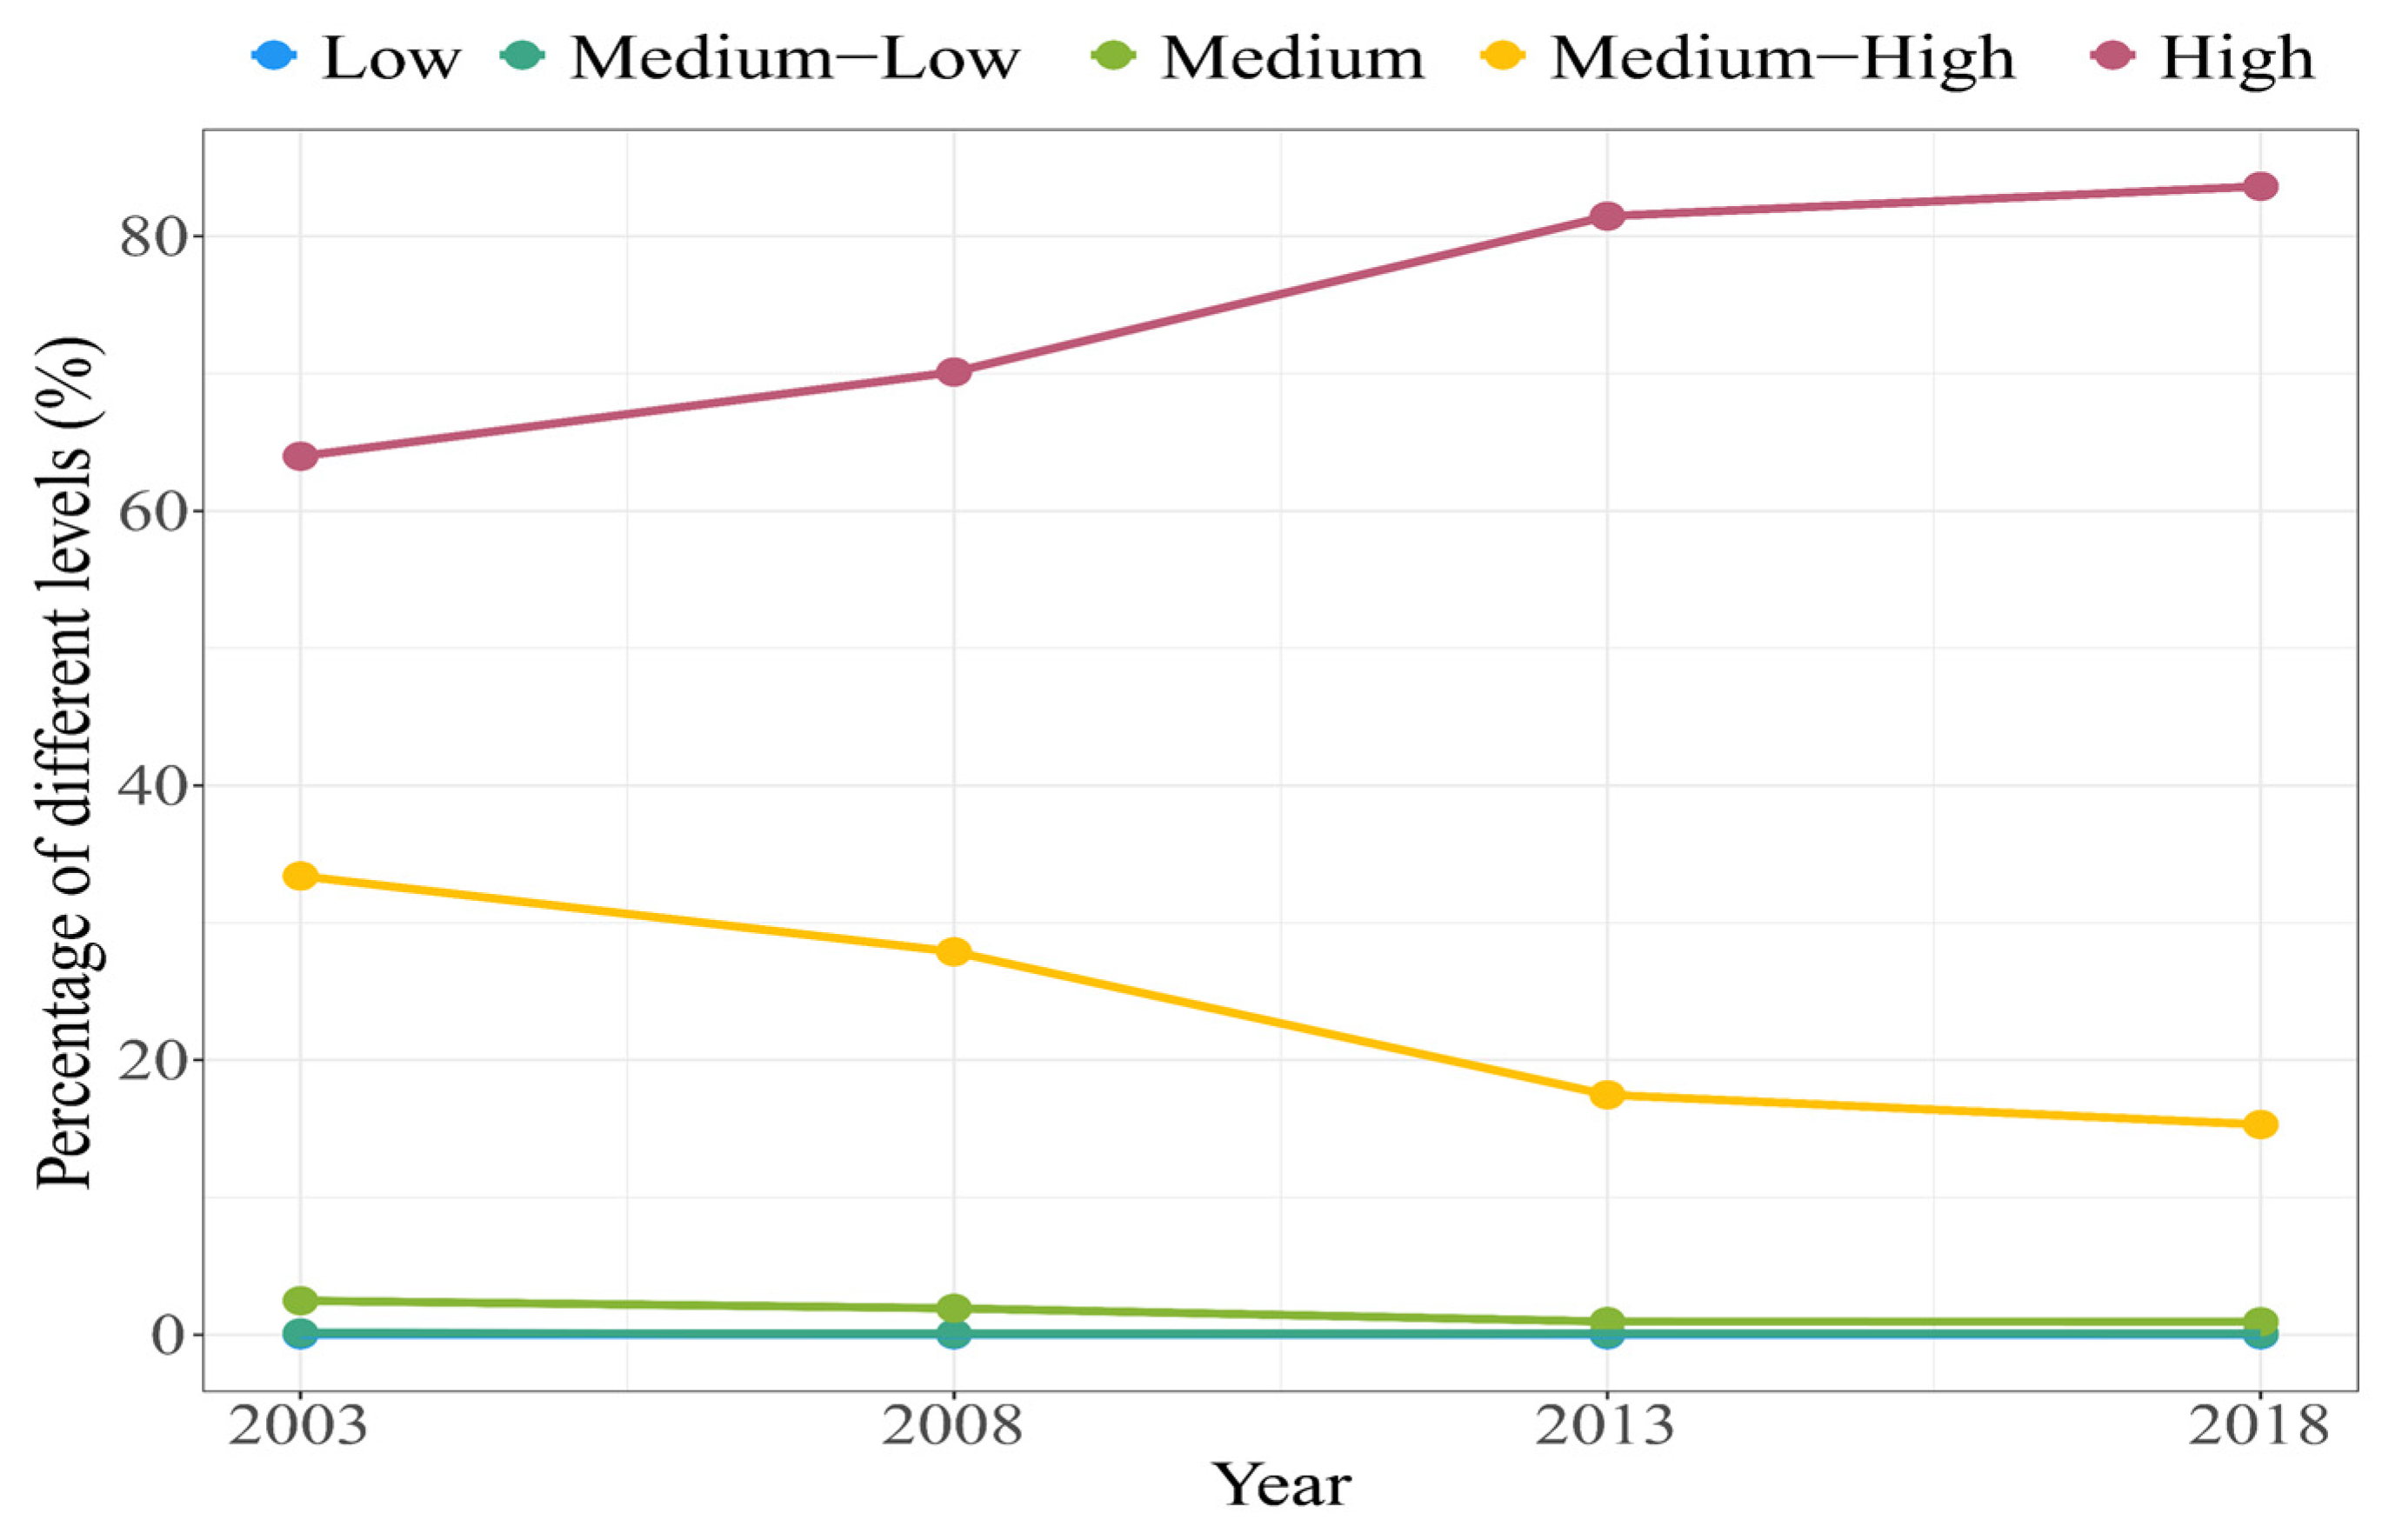
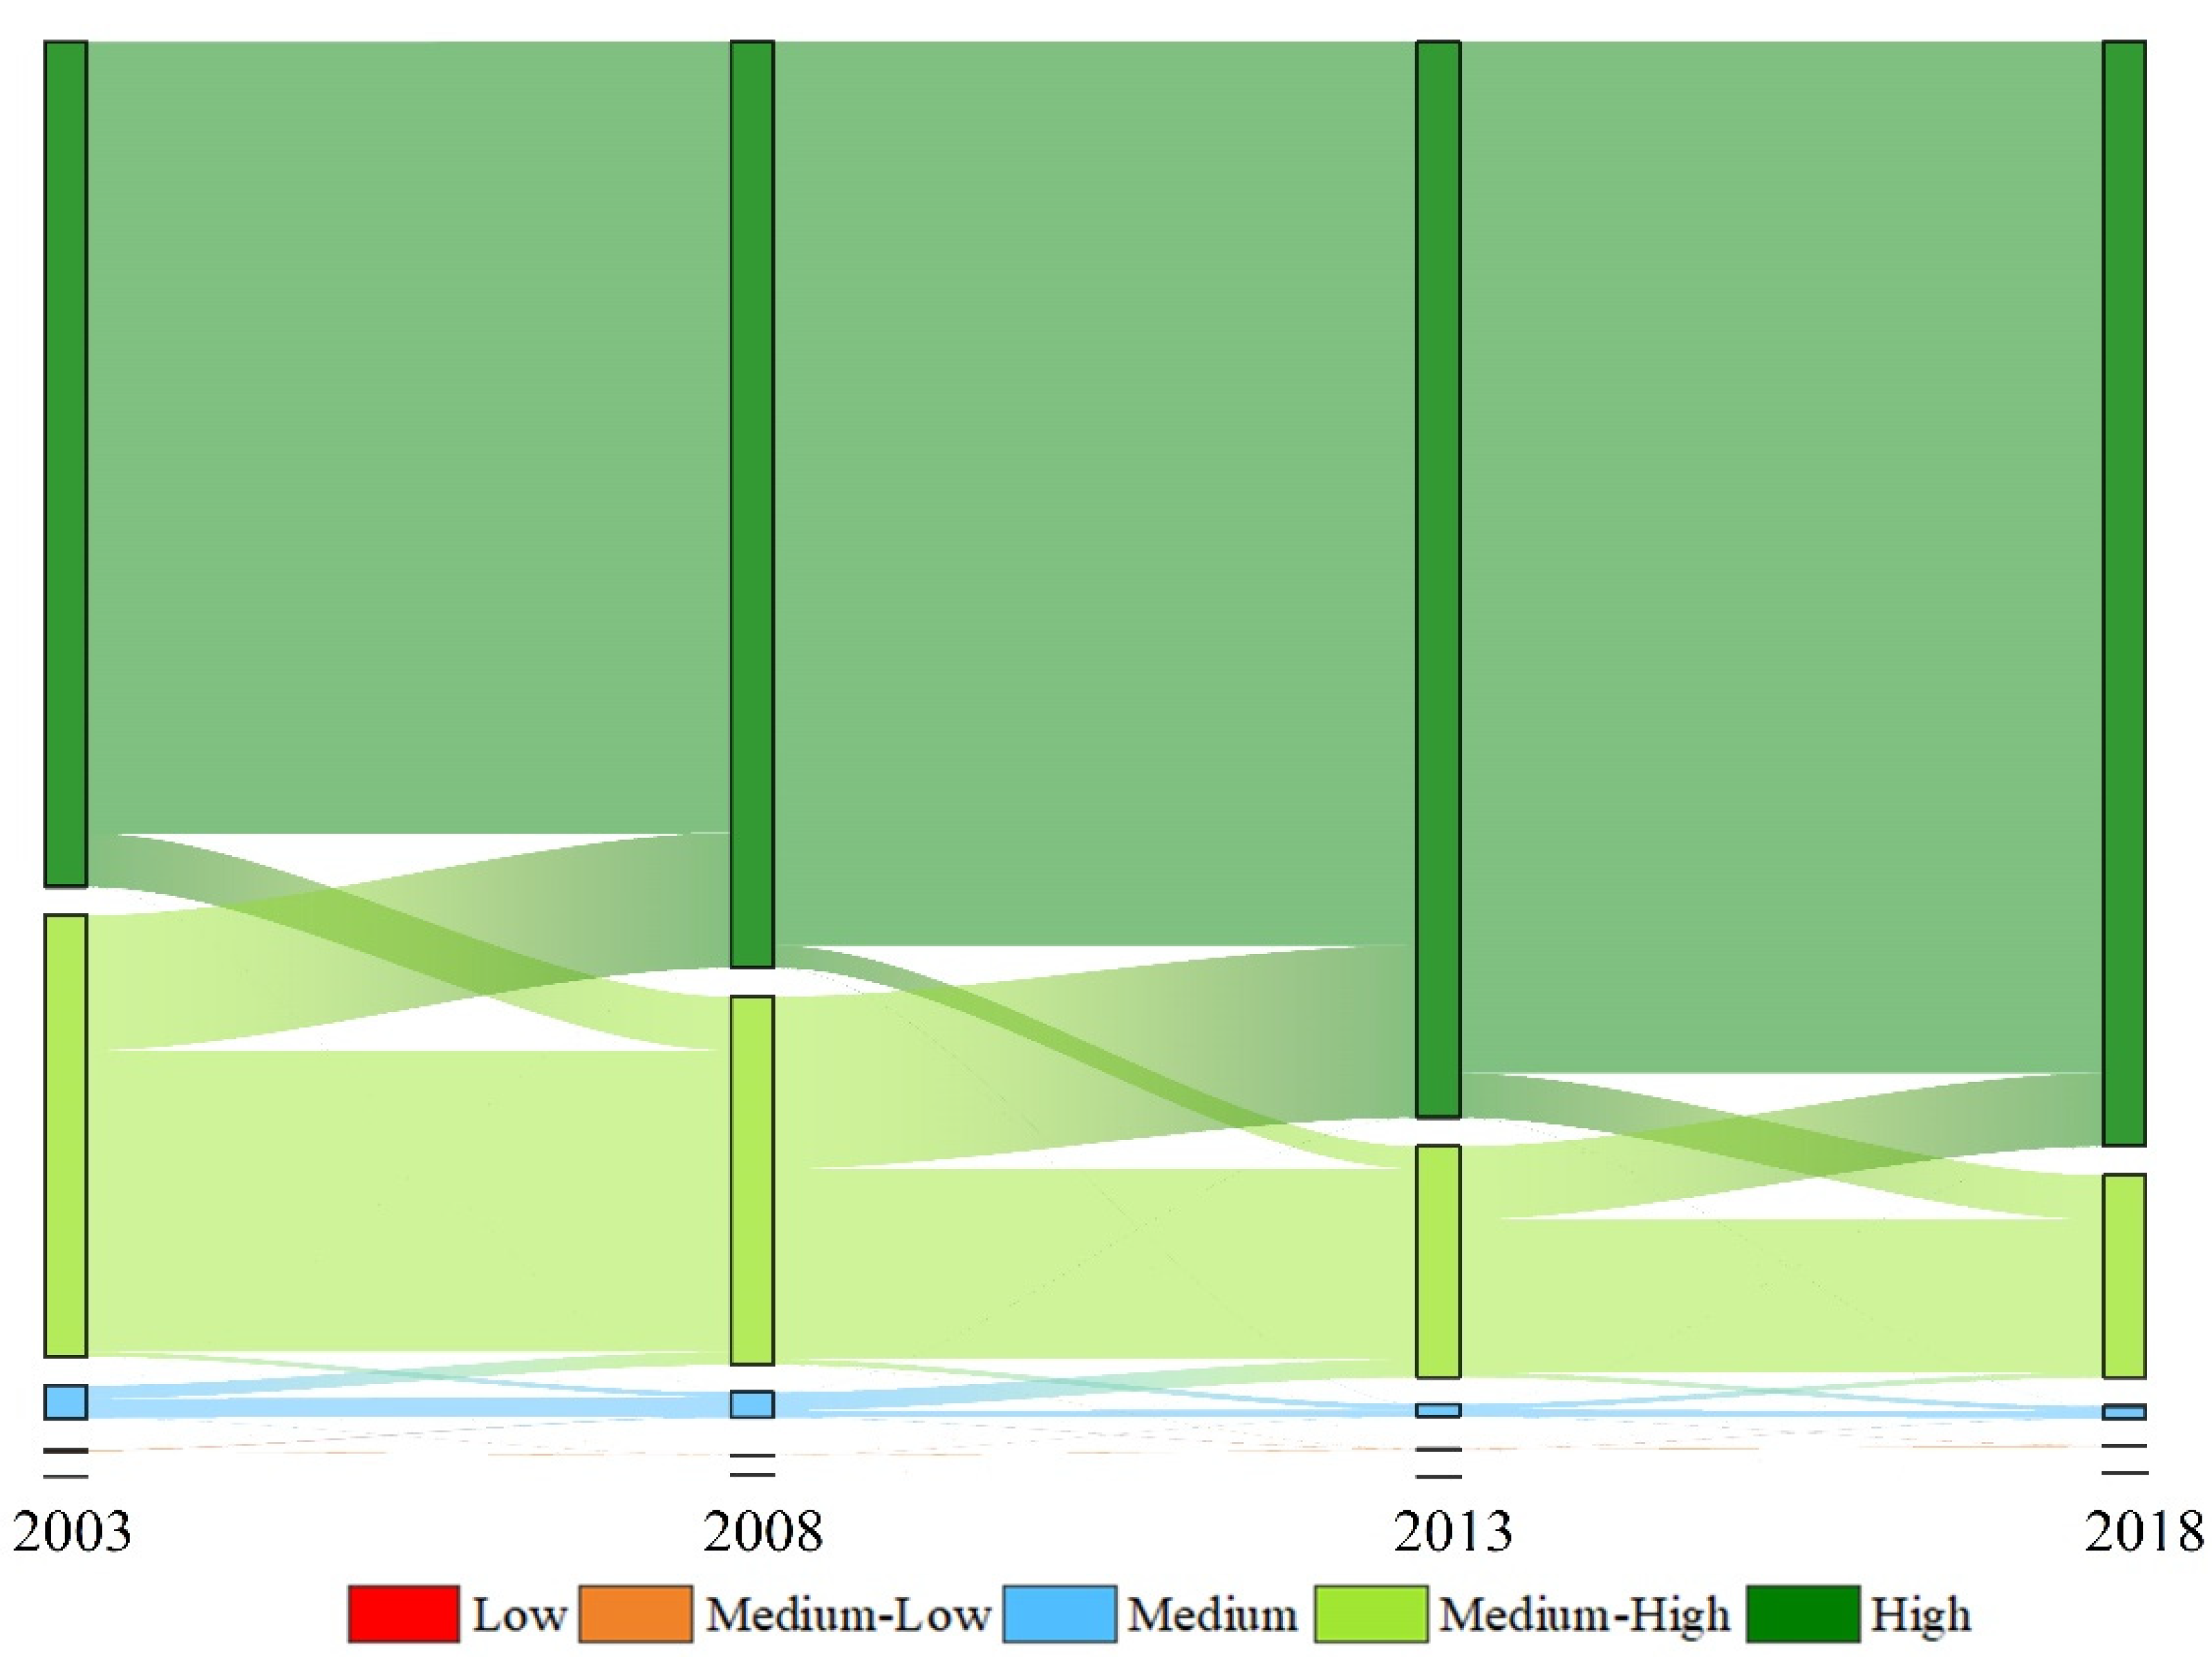
3.1.2. Temporal Dynamics of NDVI

The spatial distribution of mean NDVI during the period from 2003 to 2018 showed an obvious spatial heterogeneity (Figure 5). During the study period, the NDVI in the Longnan area increased significantly, mainly from medium level to medium-high level NDVI in the Hanjiang River Valley Basin. The southern foothills of the Daba Mountains and the eastern part of the Qinling Mountains also increased accordingly, mainly from medium-high to high level.
In terms of temporal changes, the NDVI was higher in 2018 than it was in 2003 (Figure 6), indicating that the vegetation growth in the study area gradually improved during these fifteen years. The proportion of the NDVI high-level areas steadily increased by 19.66% from 2003 to 2018, reaching 83.64%; the proportion of medium- to high-level area rapidly decreased to 15.31%; the medium- and medium-to-low-level area changed to 1.53% and 0.13%, and the low-level area was only 0.6875 km2, accounting for less than 0.01%. These changes in vegetation may be caused by the policy of returning farmland to forest in the QBM since 2000.
The flow direction between the vegetation classes in the QBM from 2003 to 2018 was relatively consistent (Figure 7). During the study period, the QBM vegetation condition improved gradually, with a tremendous increase in the high-vegetation area. The flow direction between different levels of the NDVI was mostly to an adjacent higher class. Among them, the flow was mainly between high, medium-high, and medium vegetation. For instance, most of the increase in the high-vegetation class came from the medium-high vegetation, and a large proportion of the medium-high vegetation flowed to the high vegetation in the transferred fraction, while a small fraction flowed to the medium vegetation and very little flowed to the medium-low and low vegetation.

3.2. Spatial Autocorrelation of NDVI in the QBM

3.2.1. Global Autocorrelation

Positive values for the global Moran’s I from 2003 to 2018 indicated a very concentrated distribution of the NDVI across the QBM (Figure 8). In addition, the spatial difference of the NDVI in the studied area also rose gradually, as demonstrated by the overall downward trend of the Moran’s I change.

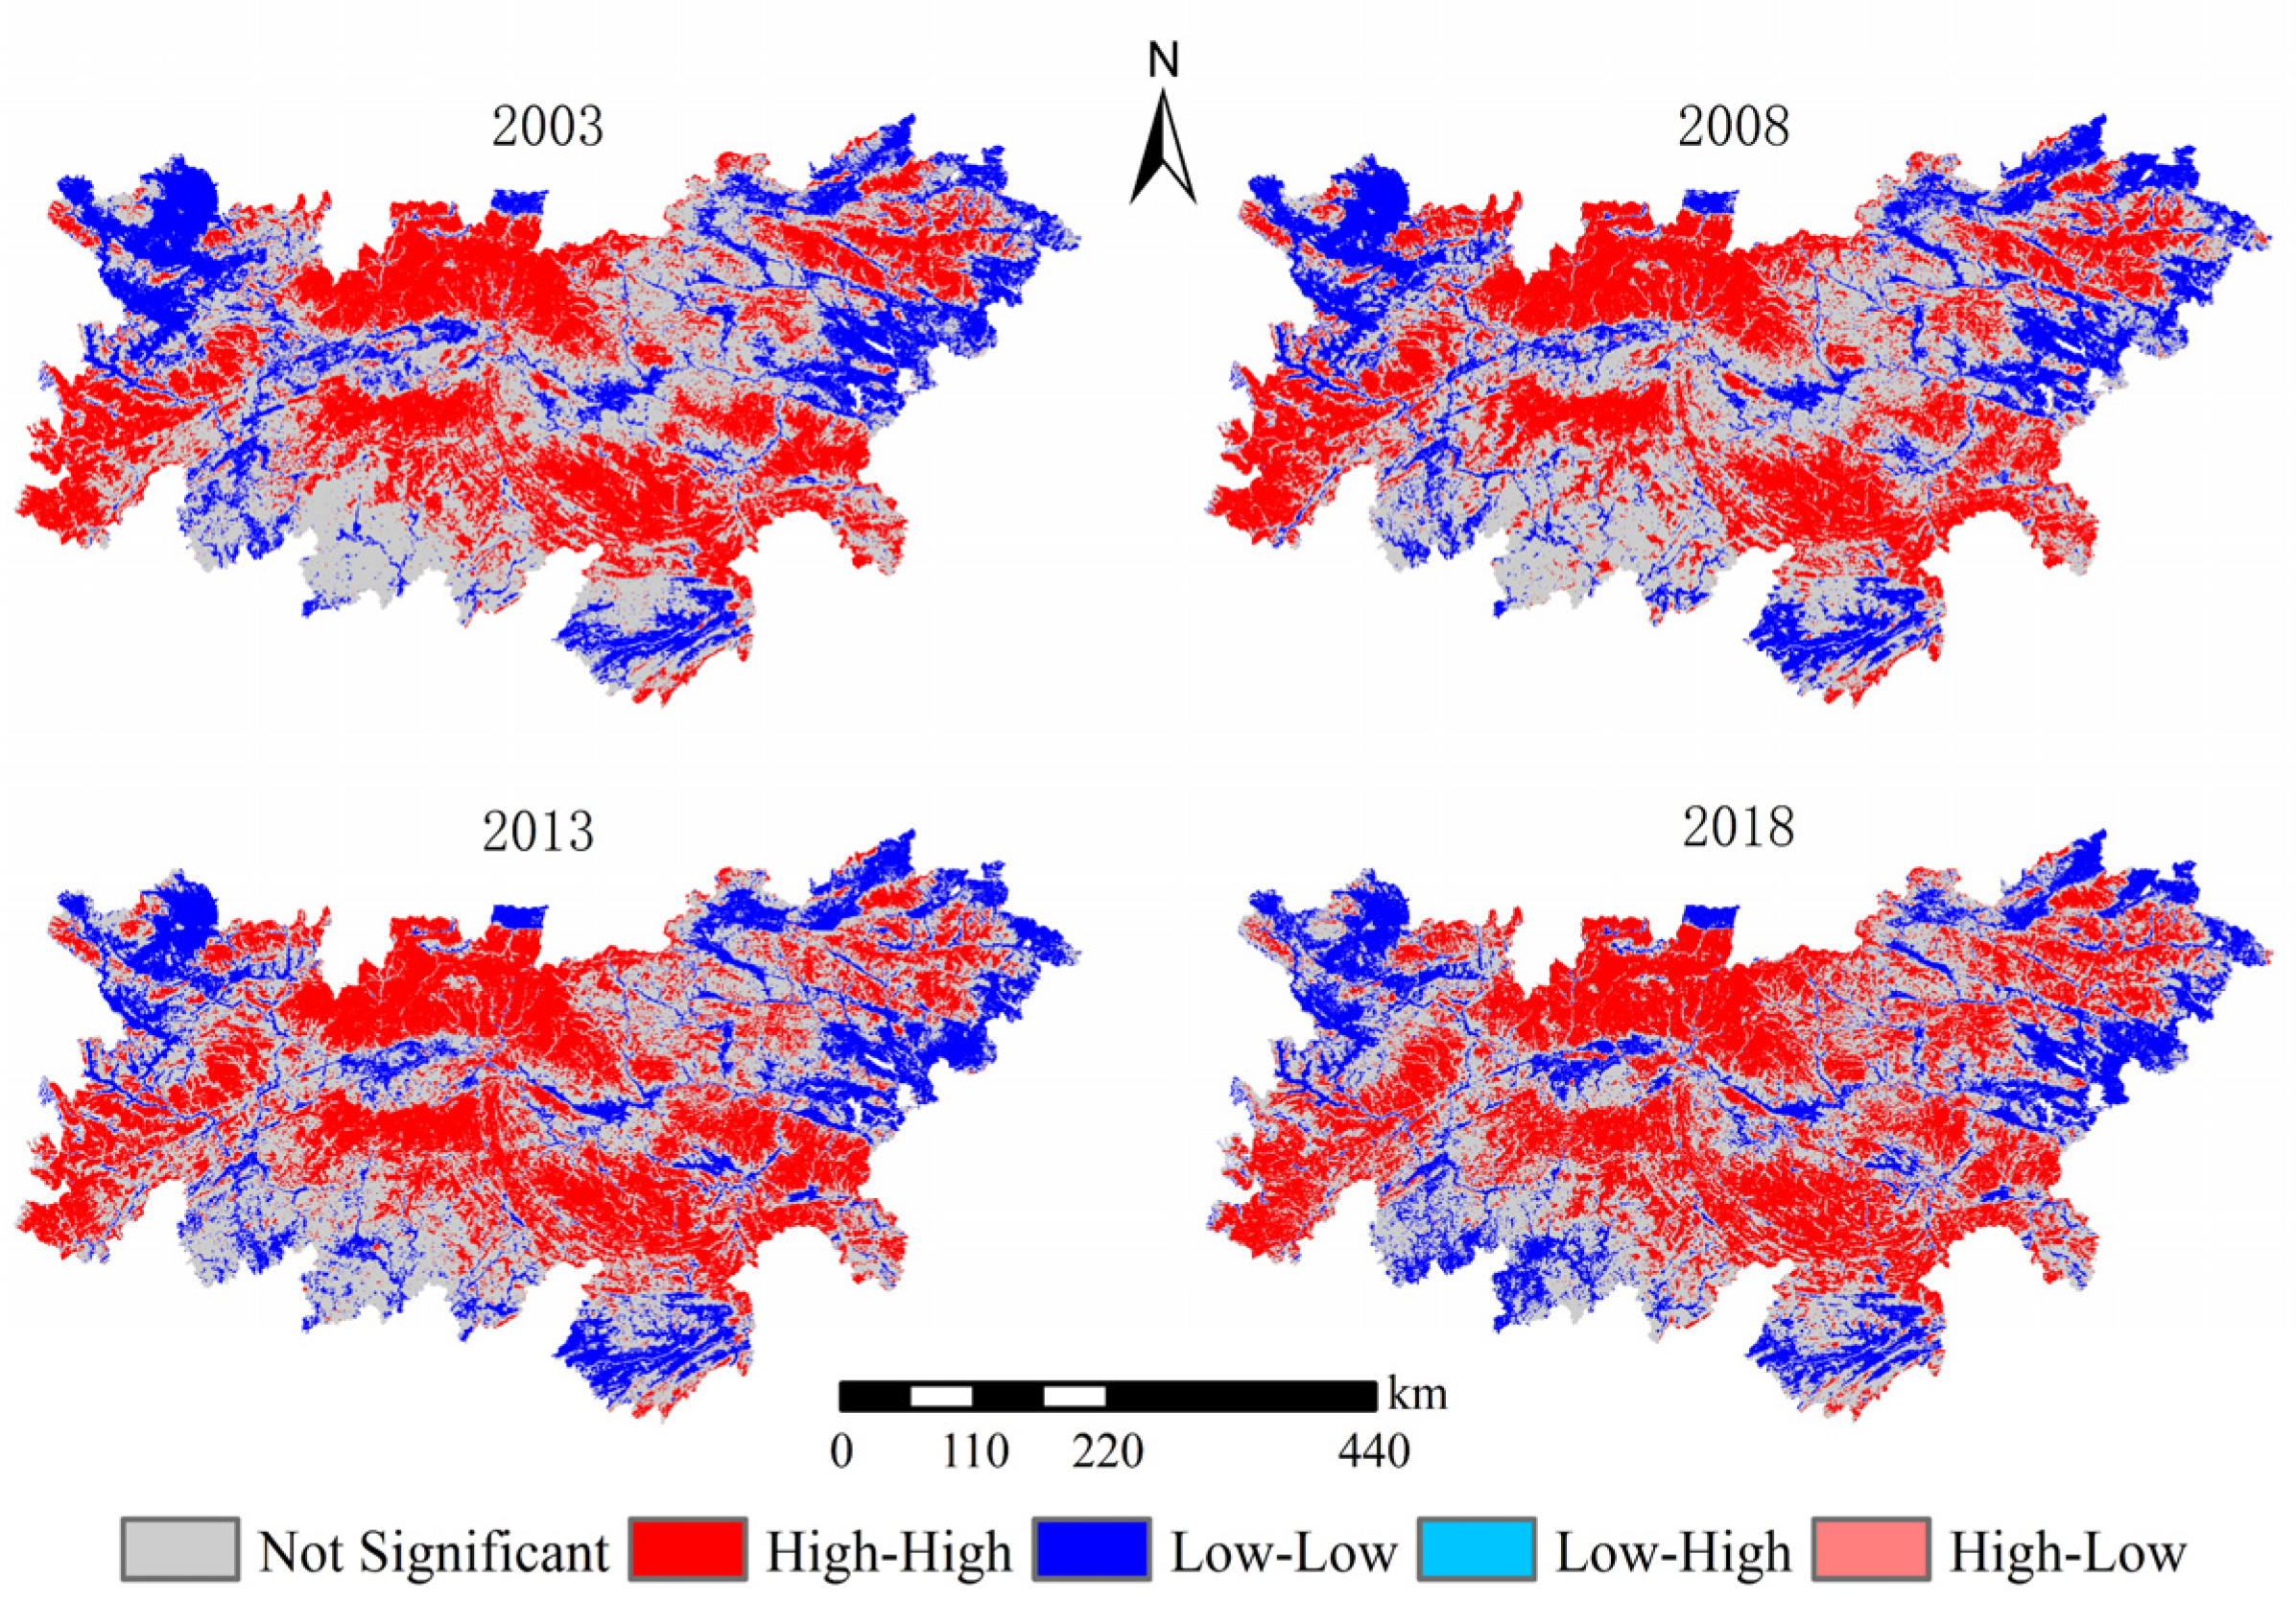
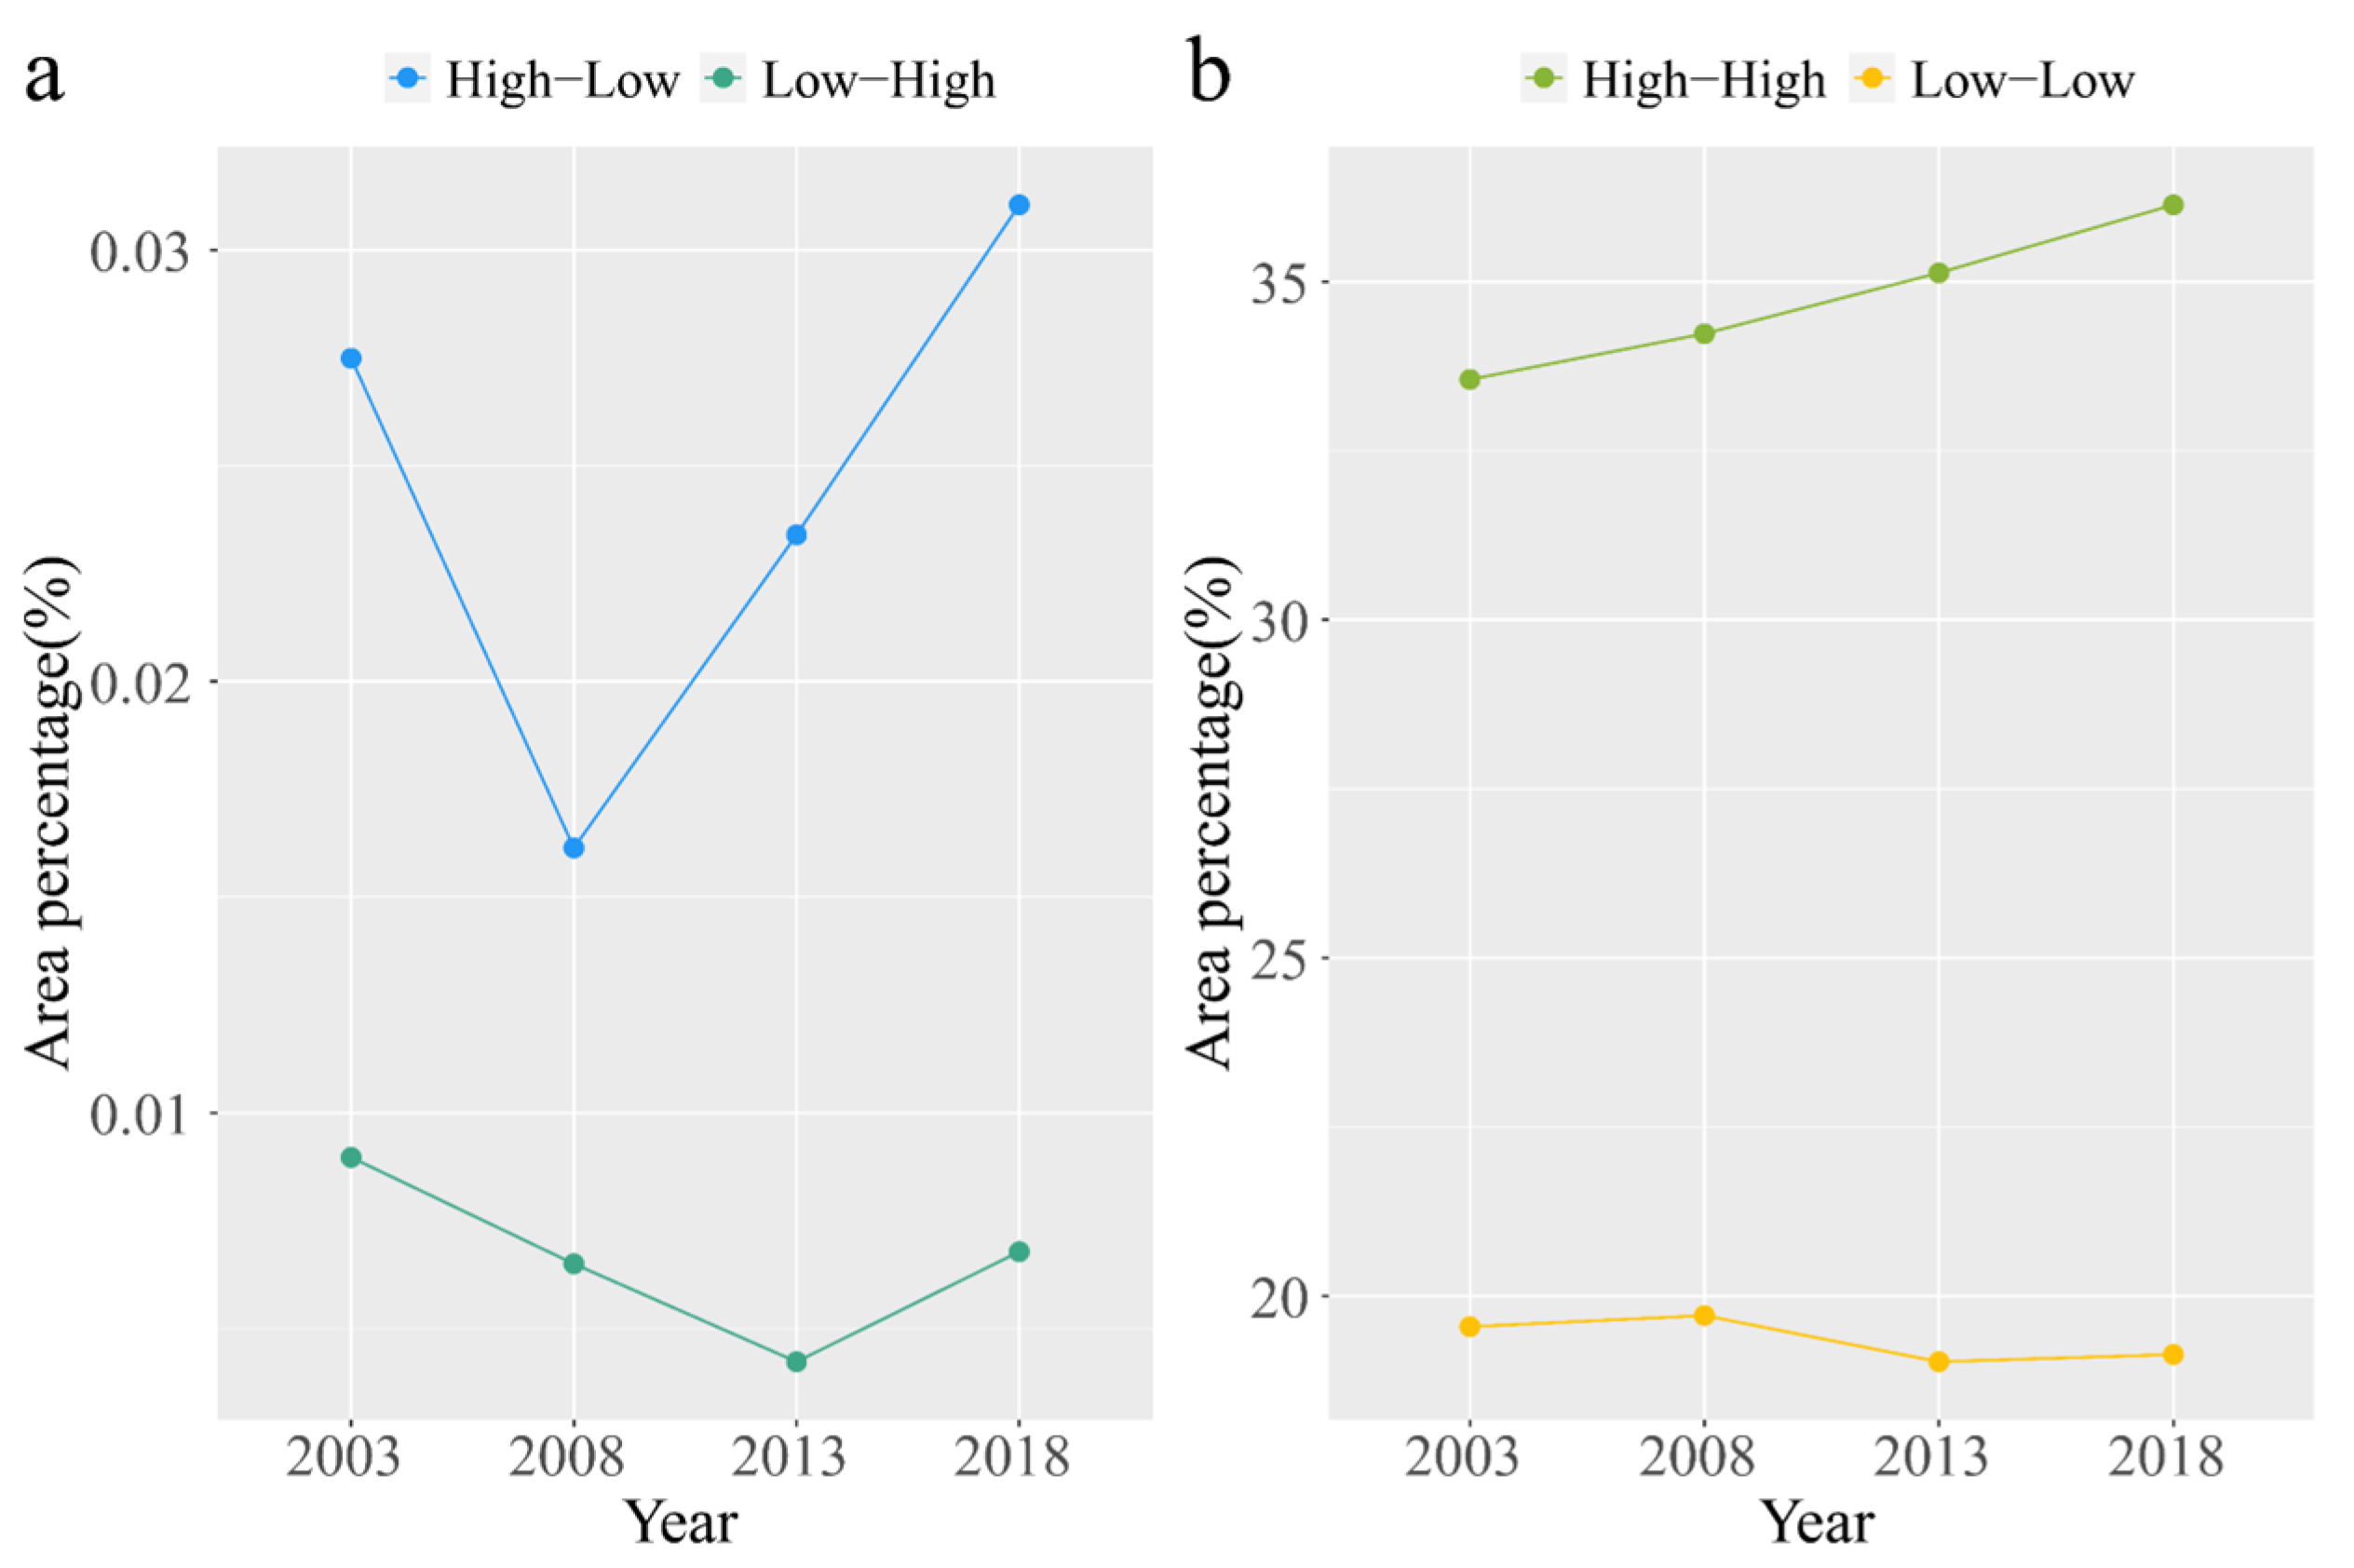
3.2.2. Local Autocorrelation

Using the LISA map, the current state of NDVI spatial distribution patterns in the QBM may be more clearly displayed (Figure 9). From 2003 to 2018, the spatial clustering characteristics of the NDVI were predominated by the high vegetation clusters. Both east and west of the Daba Mountains, the “High–High” (HH) type is prevalent in Mianyang, Hanzhong, and Chongqing. Grassland and forest make up the majority of the world’s plant life; hence, dense populations of plants correspond to very high levels of the NDVI. The “Low–Low” (LL) type is primarily found in the northwestern and northeastern parts of the QBM. The spatial autocorrelation of the NDVI in most areas of the QBM is of HH and LL types and only a few of them are of “Low–High” (LH) and “High–Low” (HL) types (Figure 9). The proportion of HH type areas increased from 33.55% to 36.14% during the study period. In addition, it showed a more obvious trend of expansion, and the overall area proportion reached more than 33.55% of the study area, which reflected the continuous improvement of vegetation cover in the study area. The percentage of the LL-type areas decreased by 0.42%, showing a decreasing trend. Both the LH and HL types showed a trend of sharp decline followed by rapid increase, with maximum area shares of 0.01% and 0.03%, respectively, neither of which exceeded 1% (Figure 10). Throughout the study period, the area changed to HH type, which was a general trend for the QBM NDVI.

3.3. Identification of Driving Forces

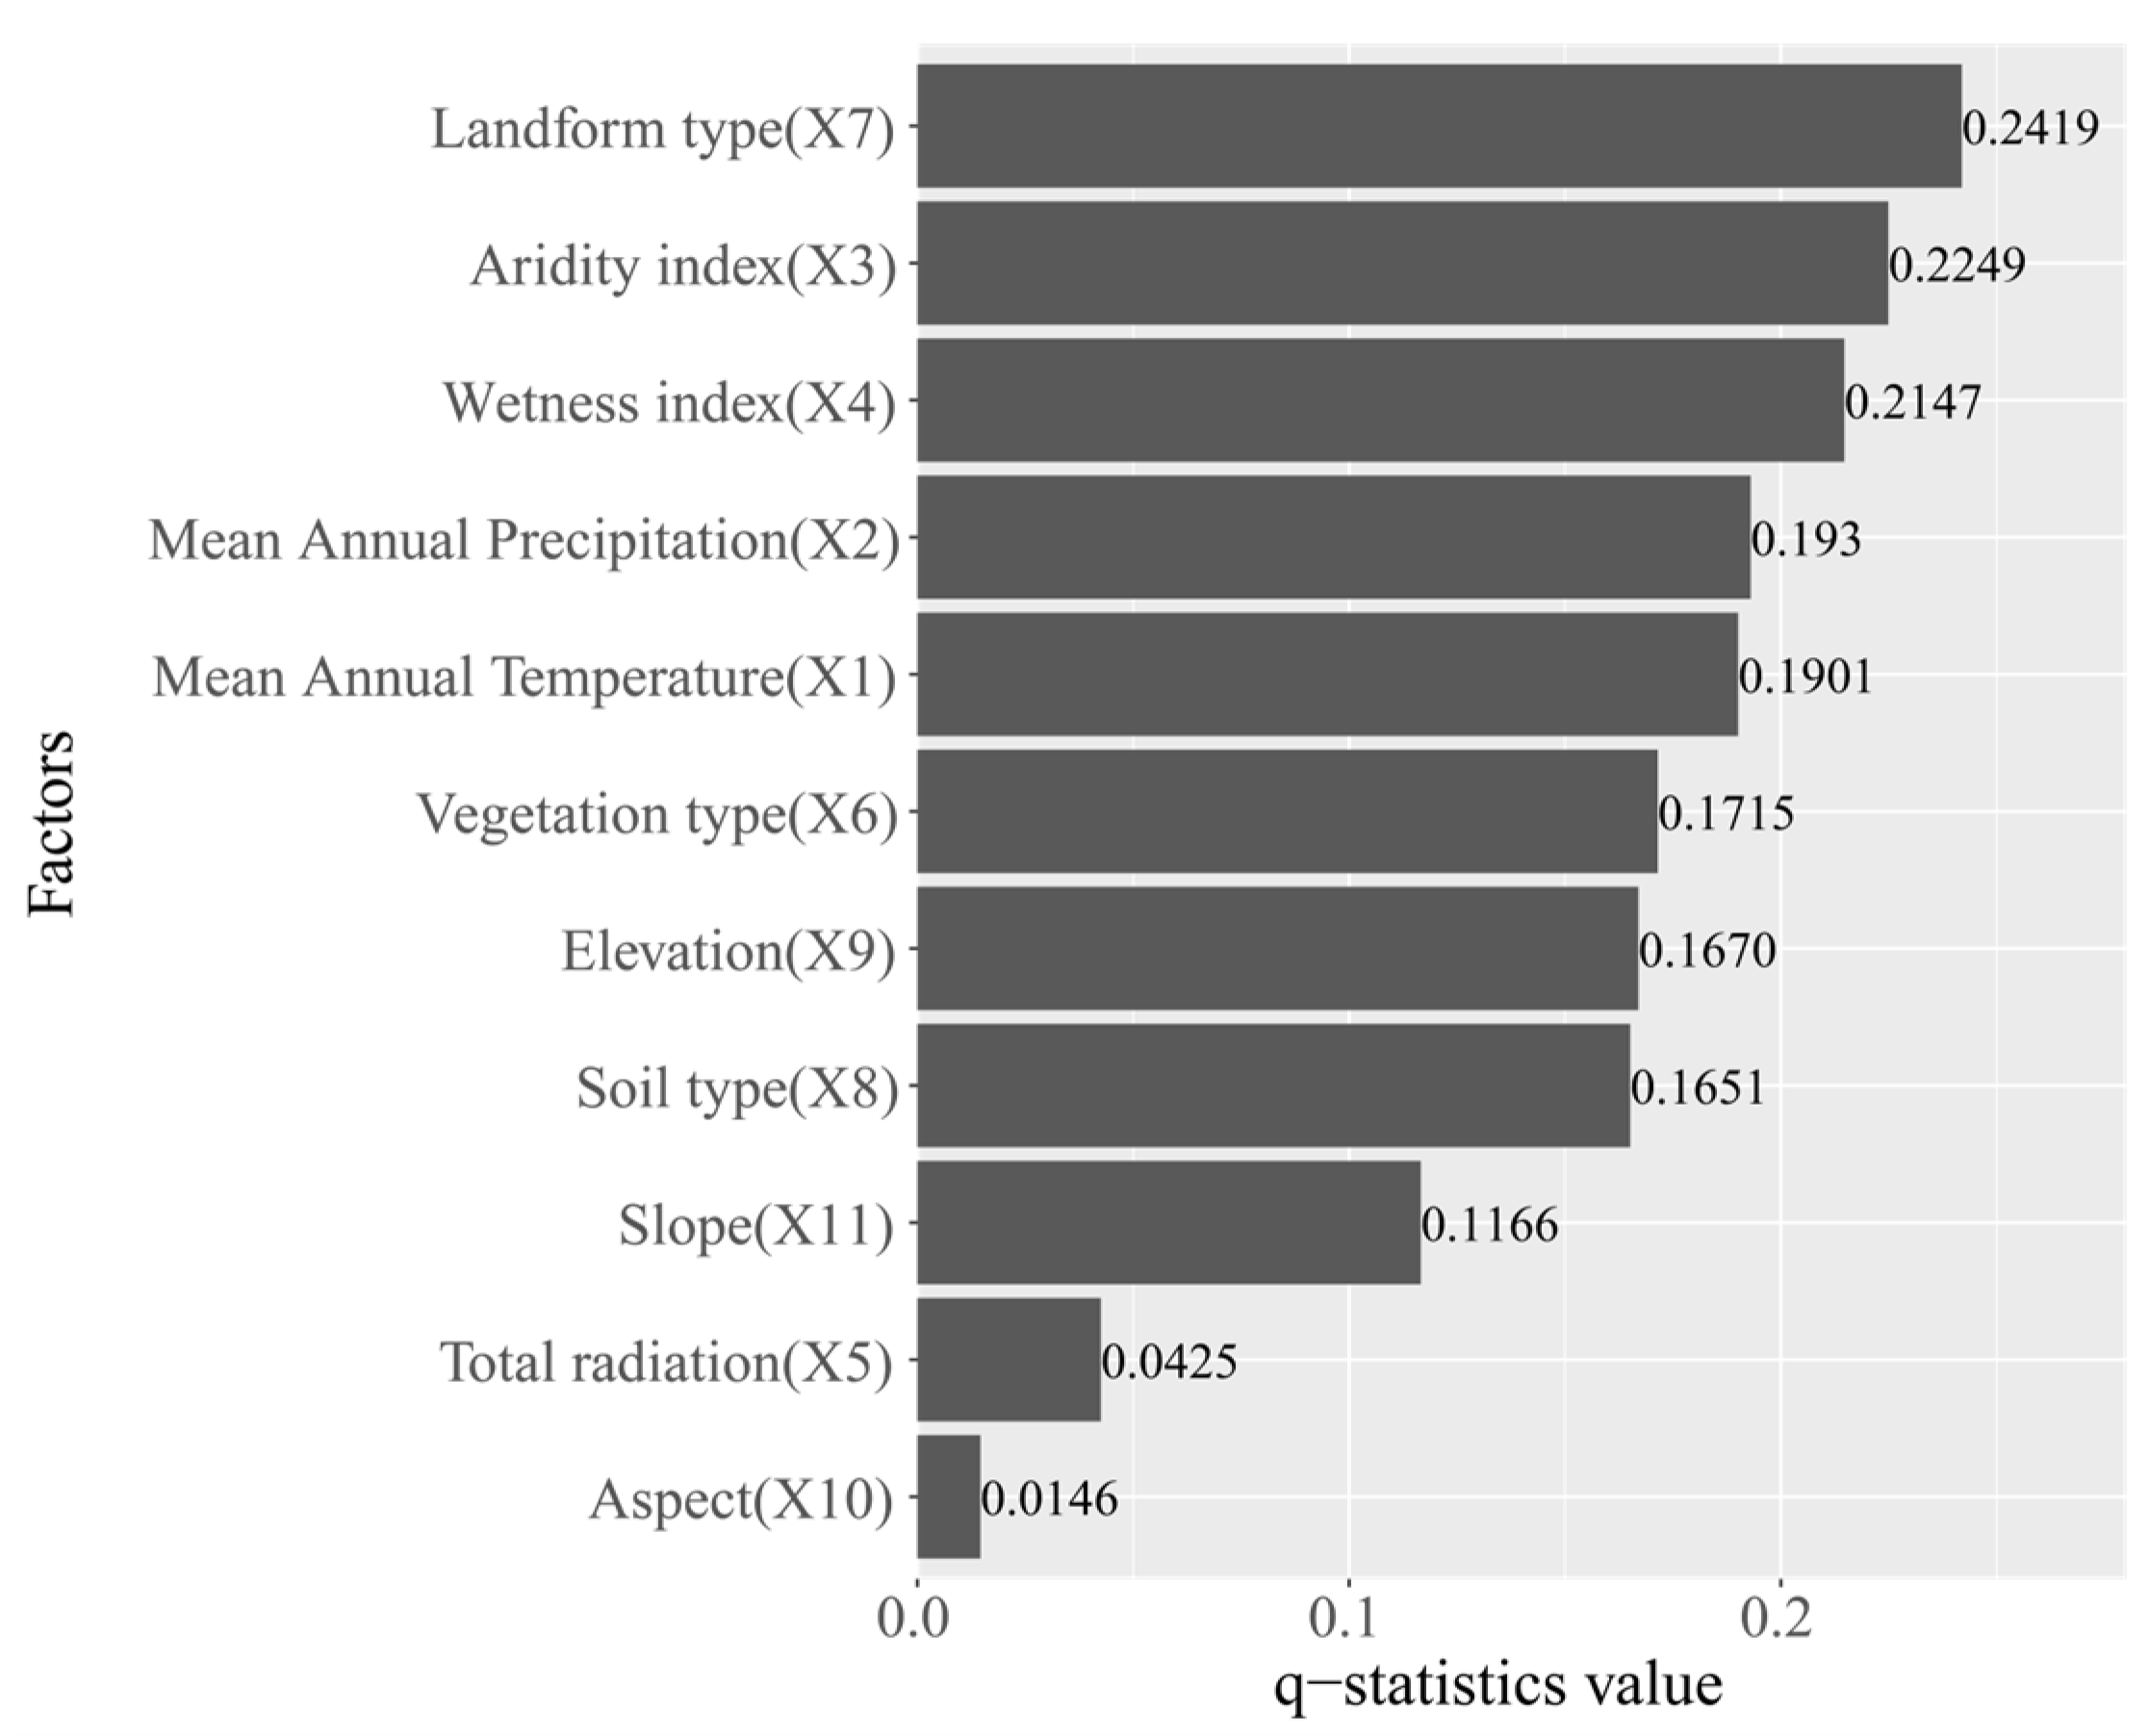
3.3.1. Influence of Environmental Factors

The factor-detection function is designed to investigate the relative impact of various environmental factors on the NDVI (Figure 11). The degree to which each environmental factor affected the NDVI was as follows: X7 (landform type) > X3 (aridity index) > X4 (wetness index) > X2 (mean annual precipitation) > X1 (mean annual temperature) > X6 (vegetation type) > X9 (elevation) > X8 (soil type) > X11 (slope) > X5 (total radiation) > X10 (slope direction). The NDVI was significantly affected by each of the factors (p < 0.05). The explanatory power of the landform type (X7), the aridity index (X3), and the wetness index (X4) for NDVI variation in the QBM was greater than 0.2; these were key driving forces. Second, precipitation (X2) and temperature (X1) were important driving forces, whose explanatory power was above 0.19. Vegetation type (X6), elevation (X9), soil type (X8), and slope (X11) had a slight impact on the NDVI, with an explanatory power of above 0.11. In addition, total radiation (X5) and aspect (X10) had the least impact, compared with other parameters, which may be related to the superior environment of the study location and the fact that the light factor is not the primary factor in restricting the growth of plants.

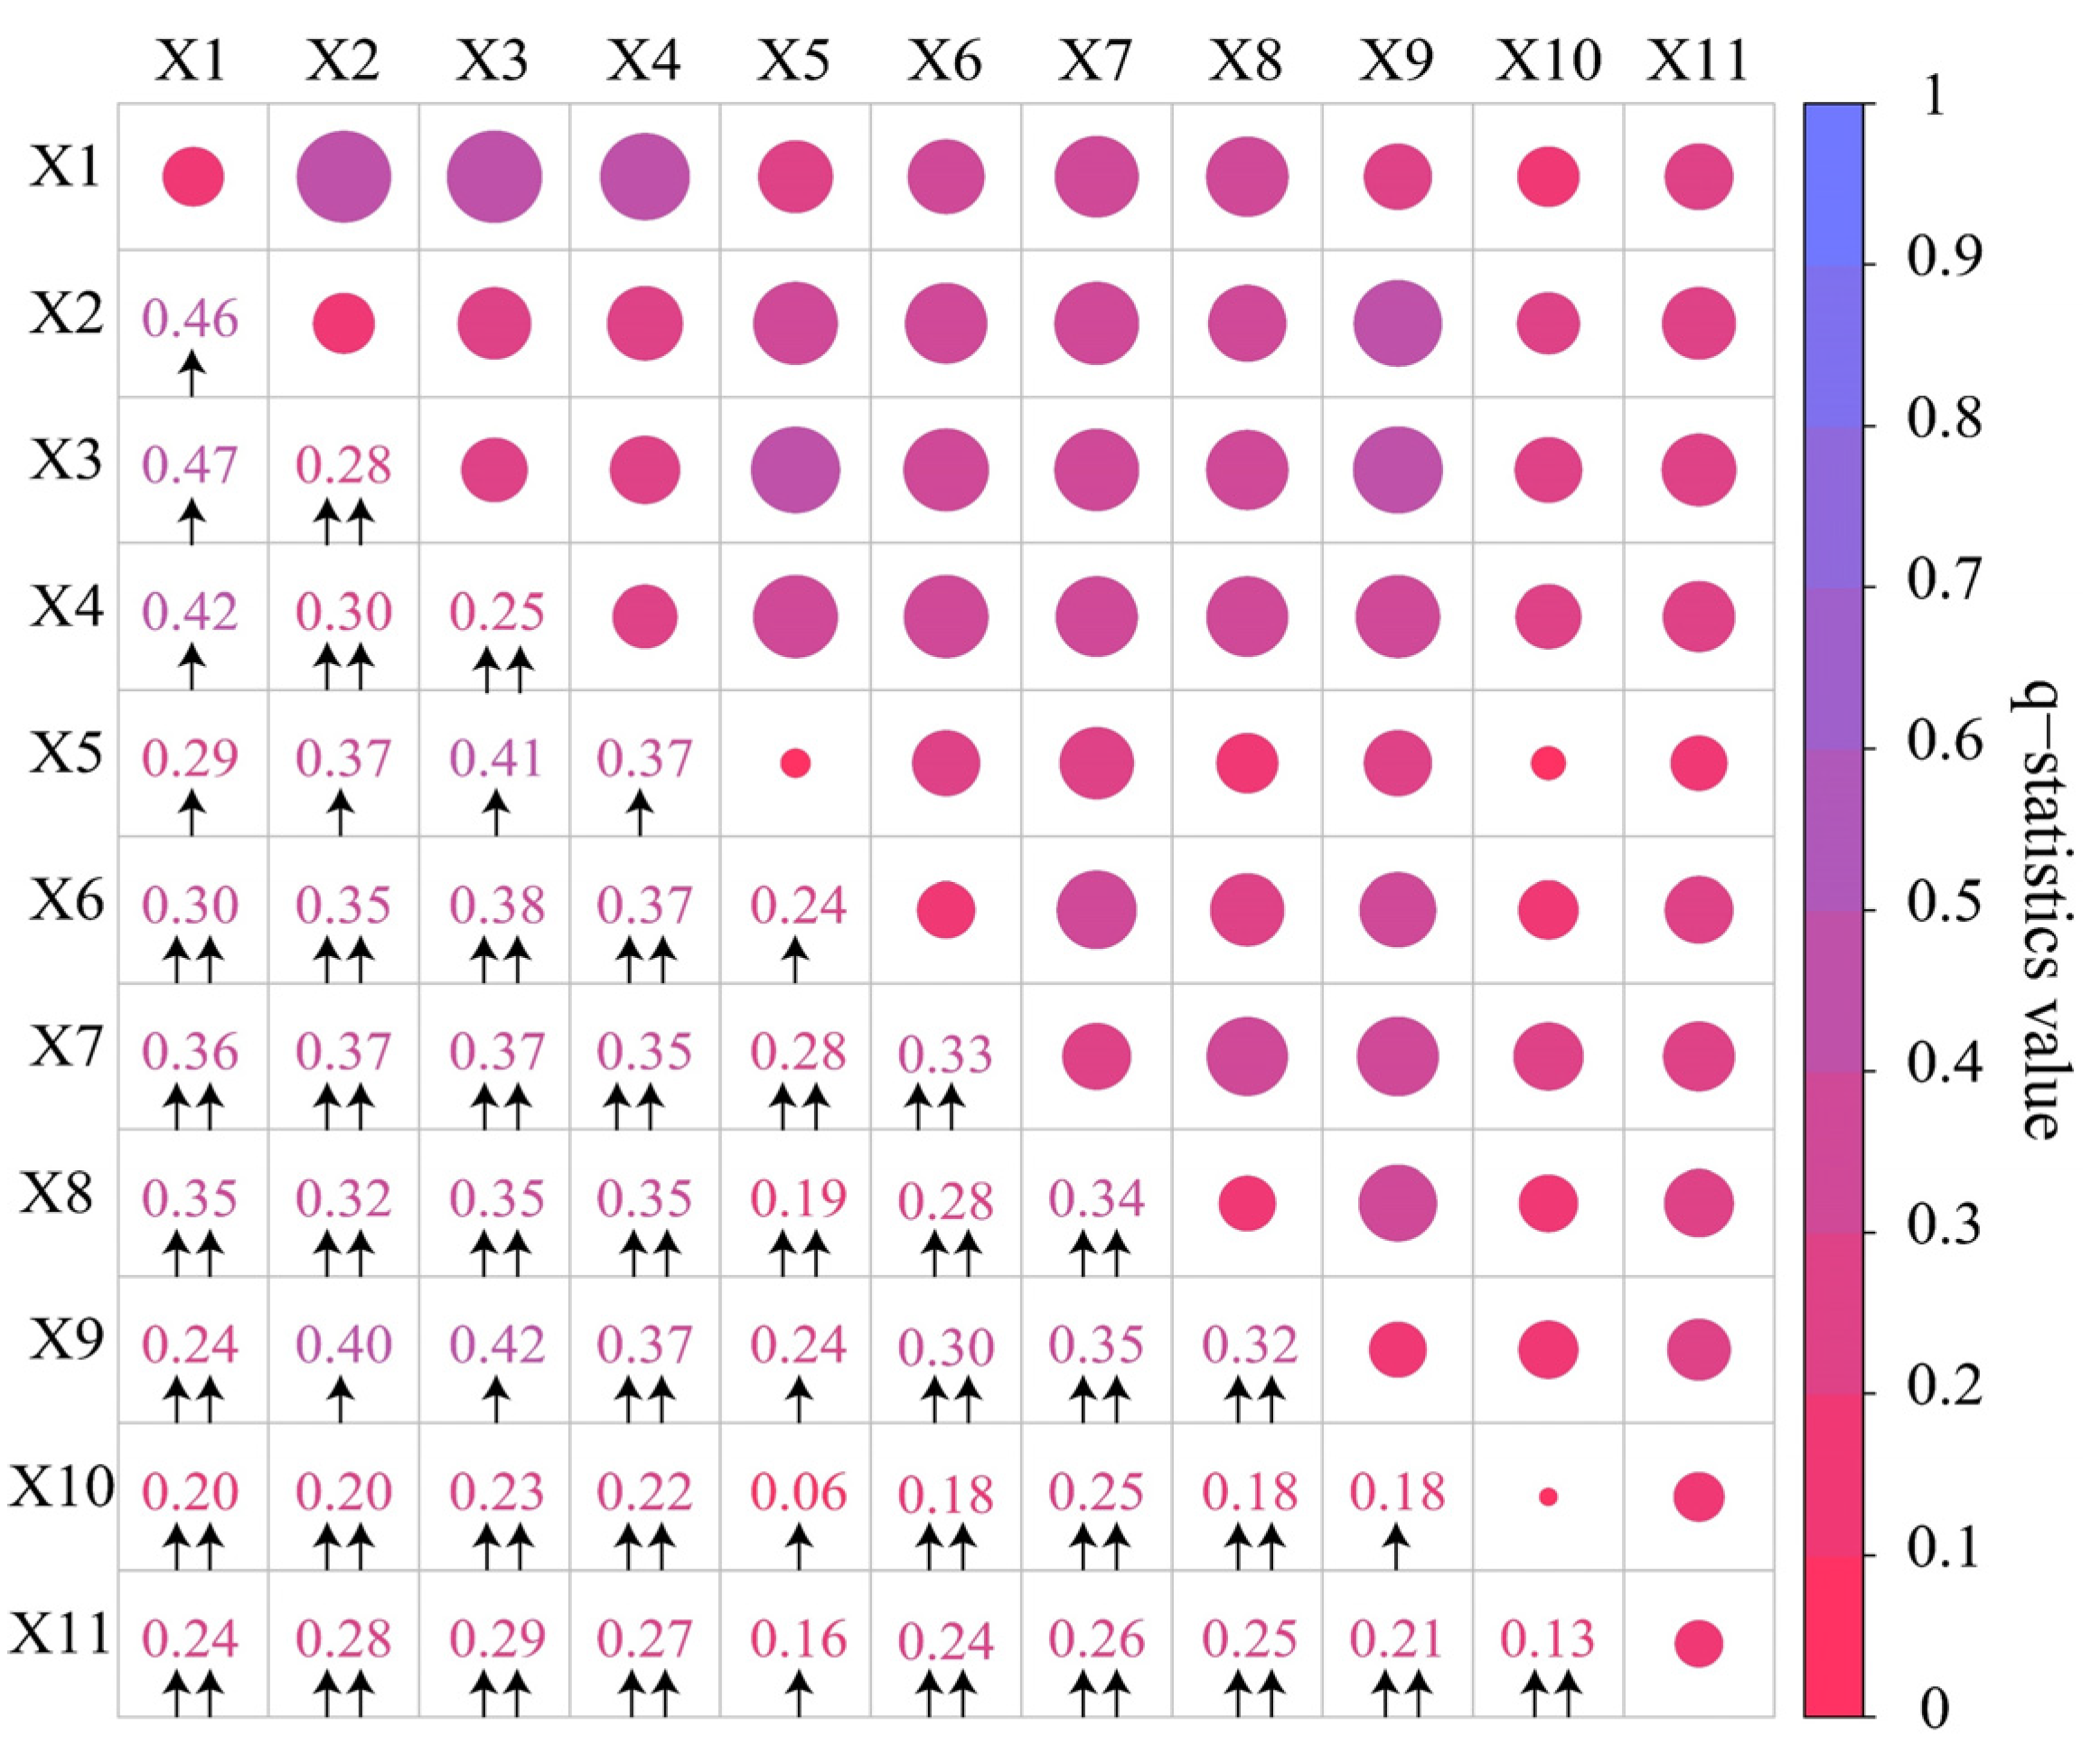
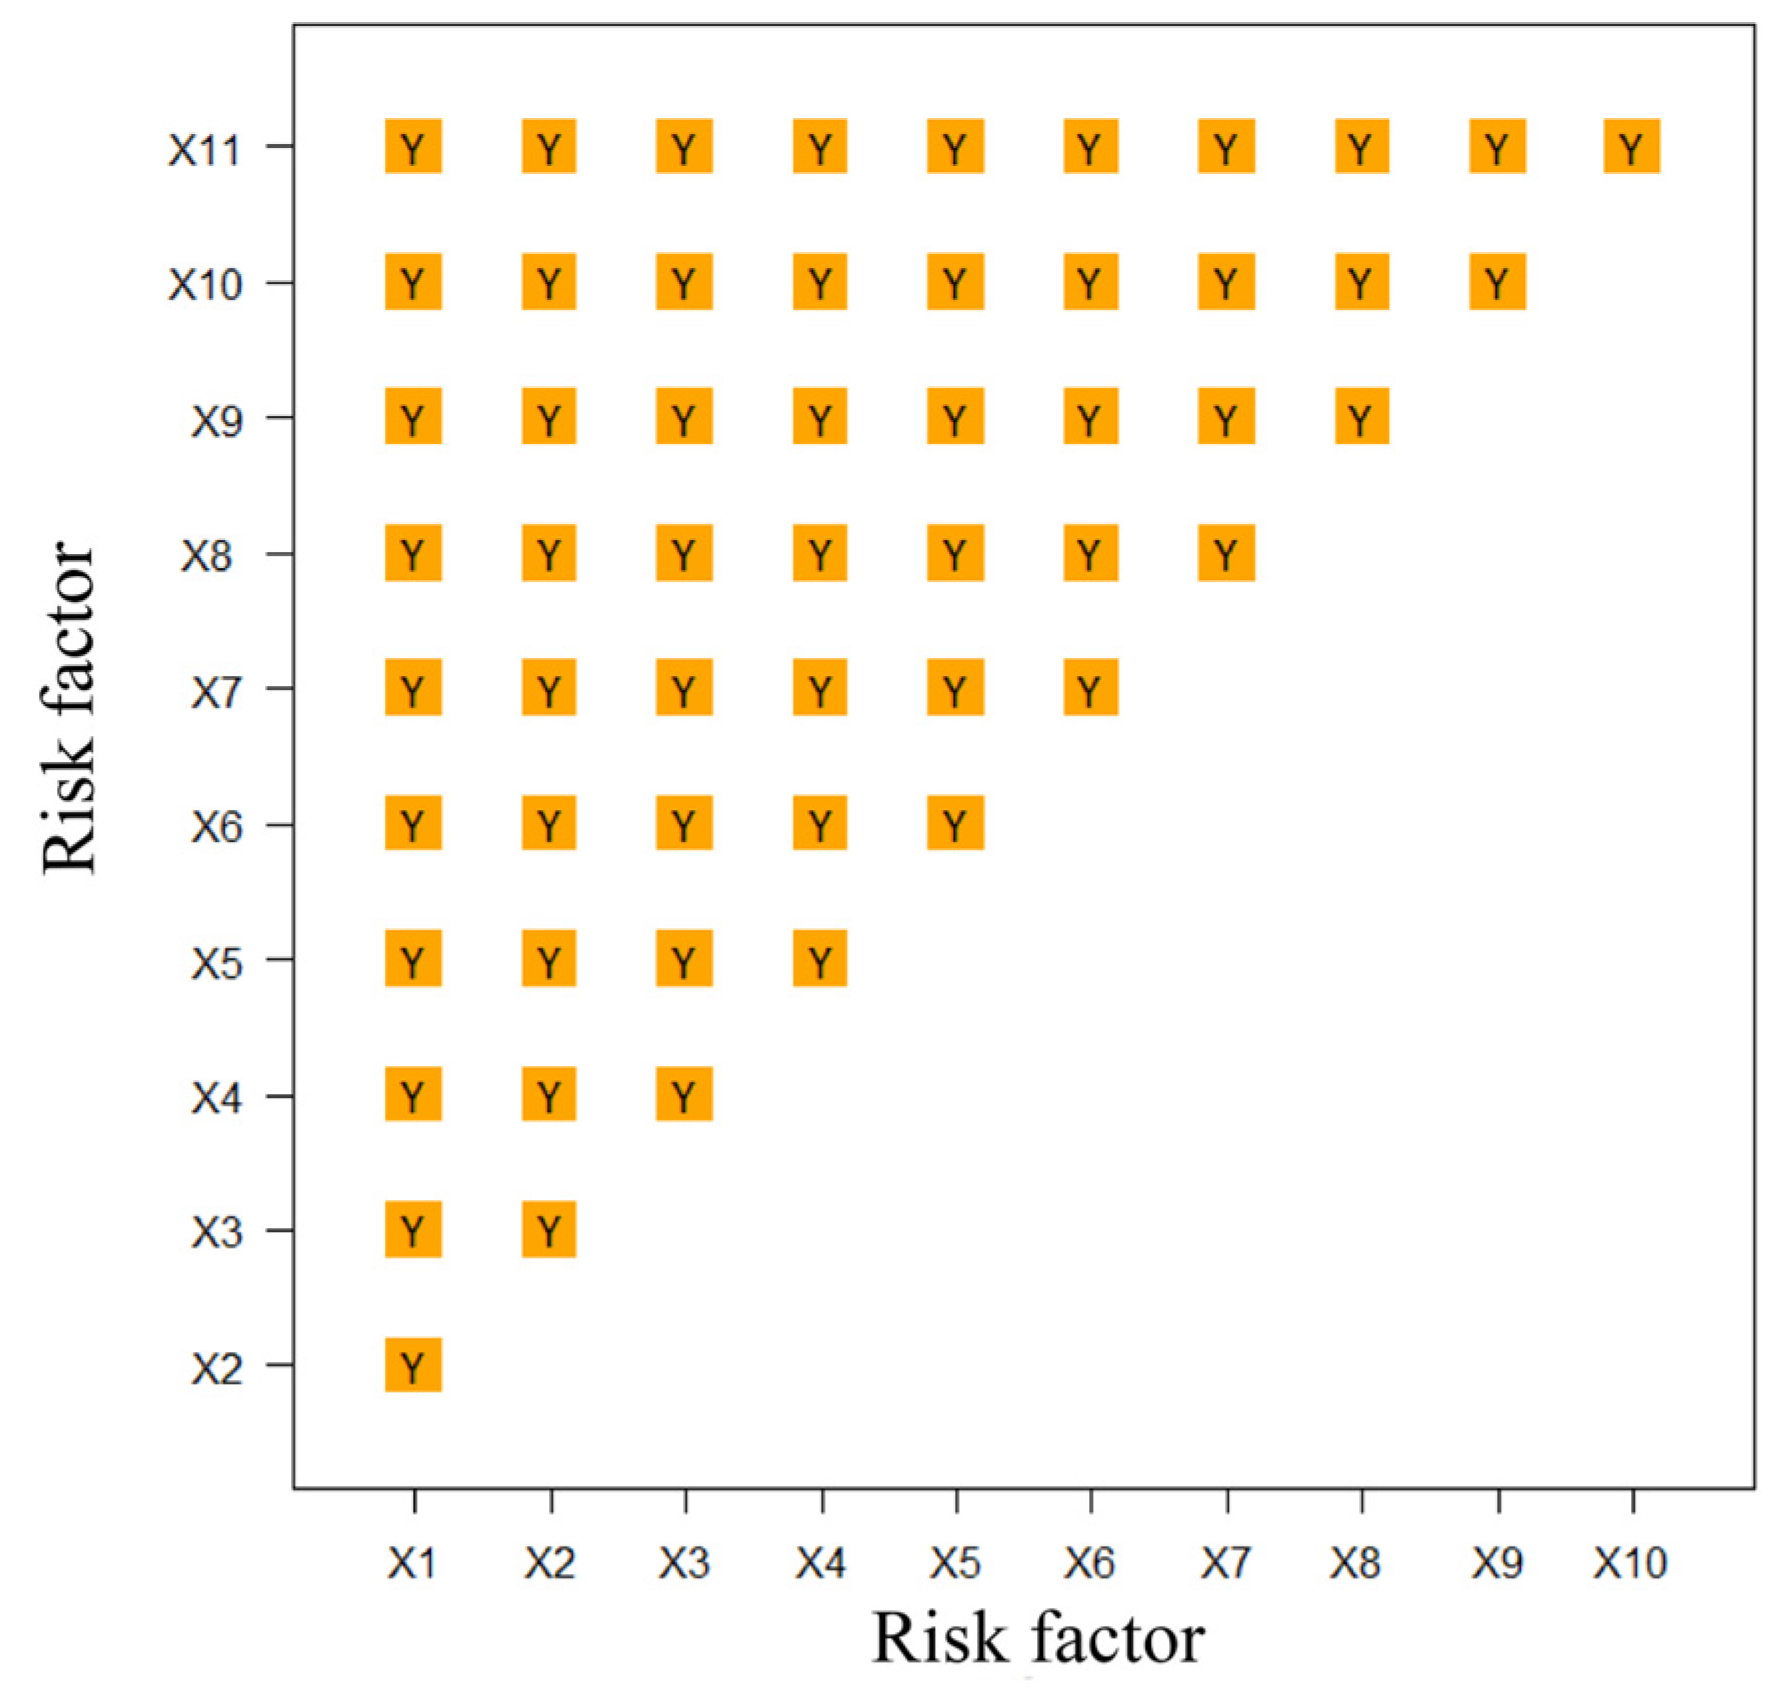
3.3.2. Interaction between Environmental Factors

The interaction effects between any two factors enhanced the influence of a single variable (Figure 12). The majority of interactions between environmental factors in this paper were bivariate-enhanced. Nonlinear enhancement was seen in the pairs X1 ∩ X2, X1 ∩ X3, X1 ∩ X4, X2 ∩ X9, X3 ∩ X9, X5 ∩ X1, X5 ∩ X2, X5 ∩ X3, X5 ∩ X4, X5 ∩ X6, X5 ∩ X9, X5 ∩ X10, X5 ∩ X11, and X9 ∩ X10. There was a bivariate enhancement due to the interaction of additional environmental factors. The strongest explanatory power of these interactions for the spatial distribution of the NDVI was found between X1 and X3 (q = 47.10%) and X1 and X2 (q = 46.40%), indicating that X1 (mean annual temperature), X3 (aridity index), and X2 (mean annual precipitation) were the driving factors of the NDVI in the QBM. In conclusion, the NDVI of vegetation was affected by a nonlinear or bivariate-enhanced manner, in which the driving factors interacted with one another rather than independently.

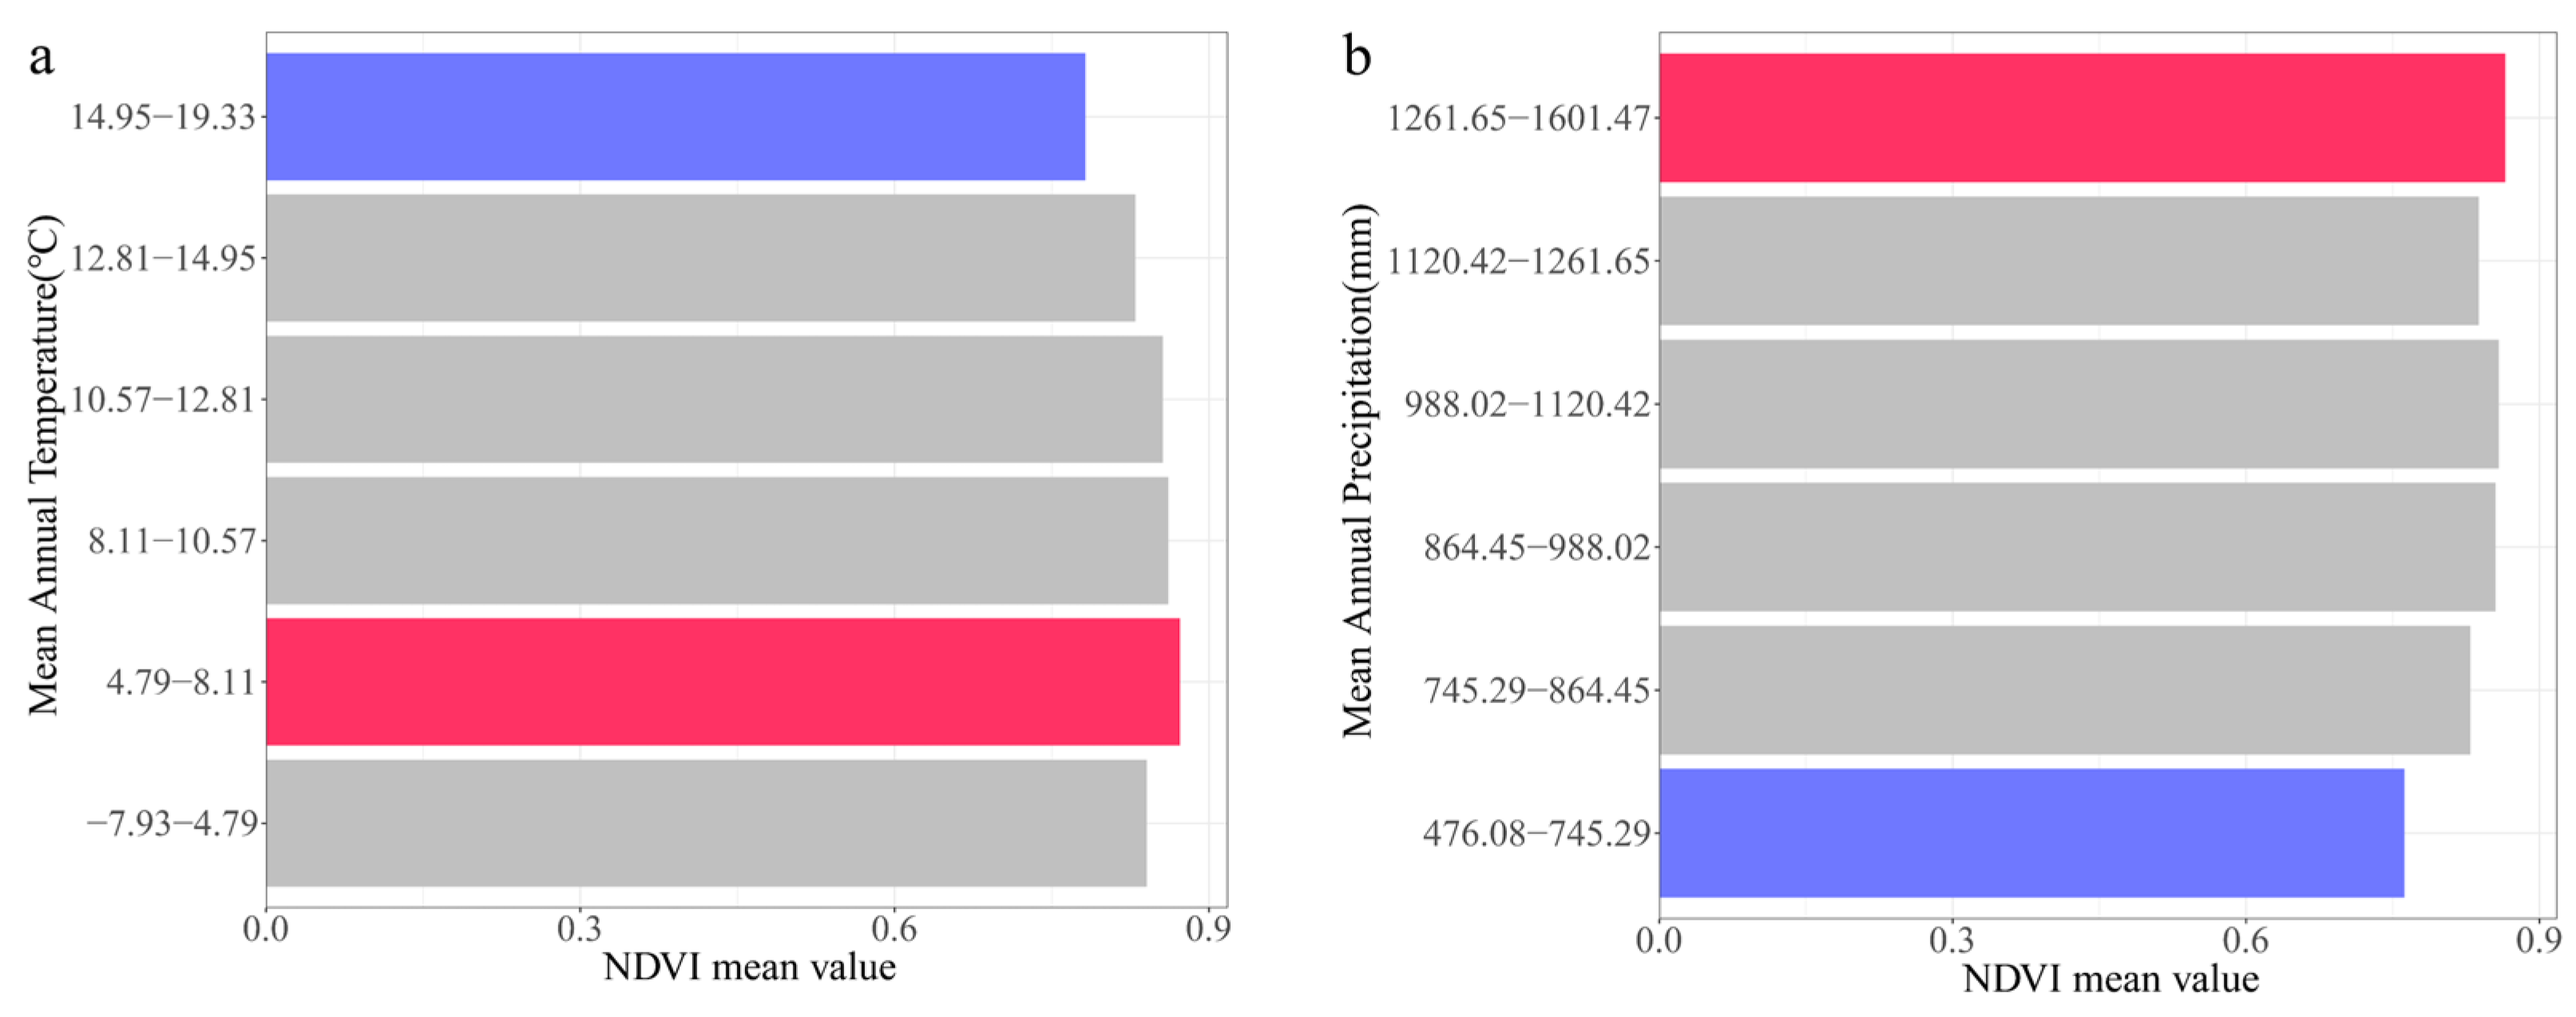
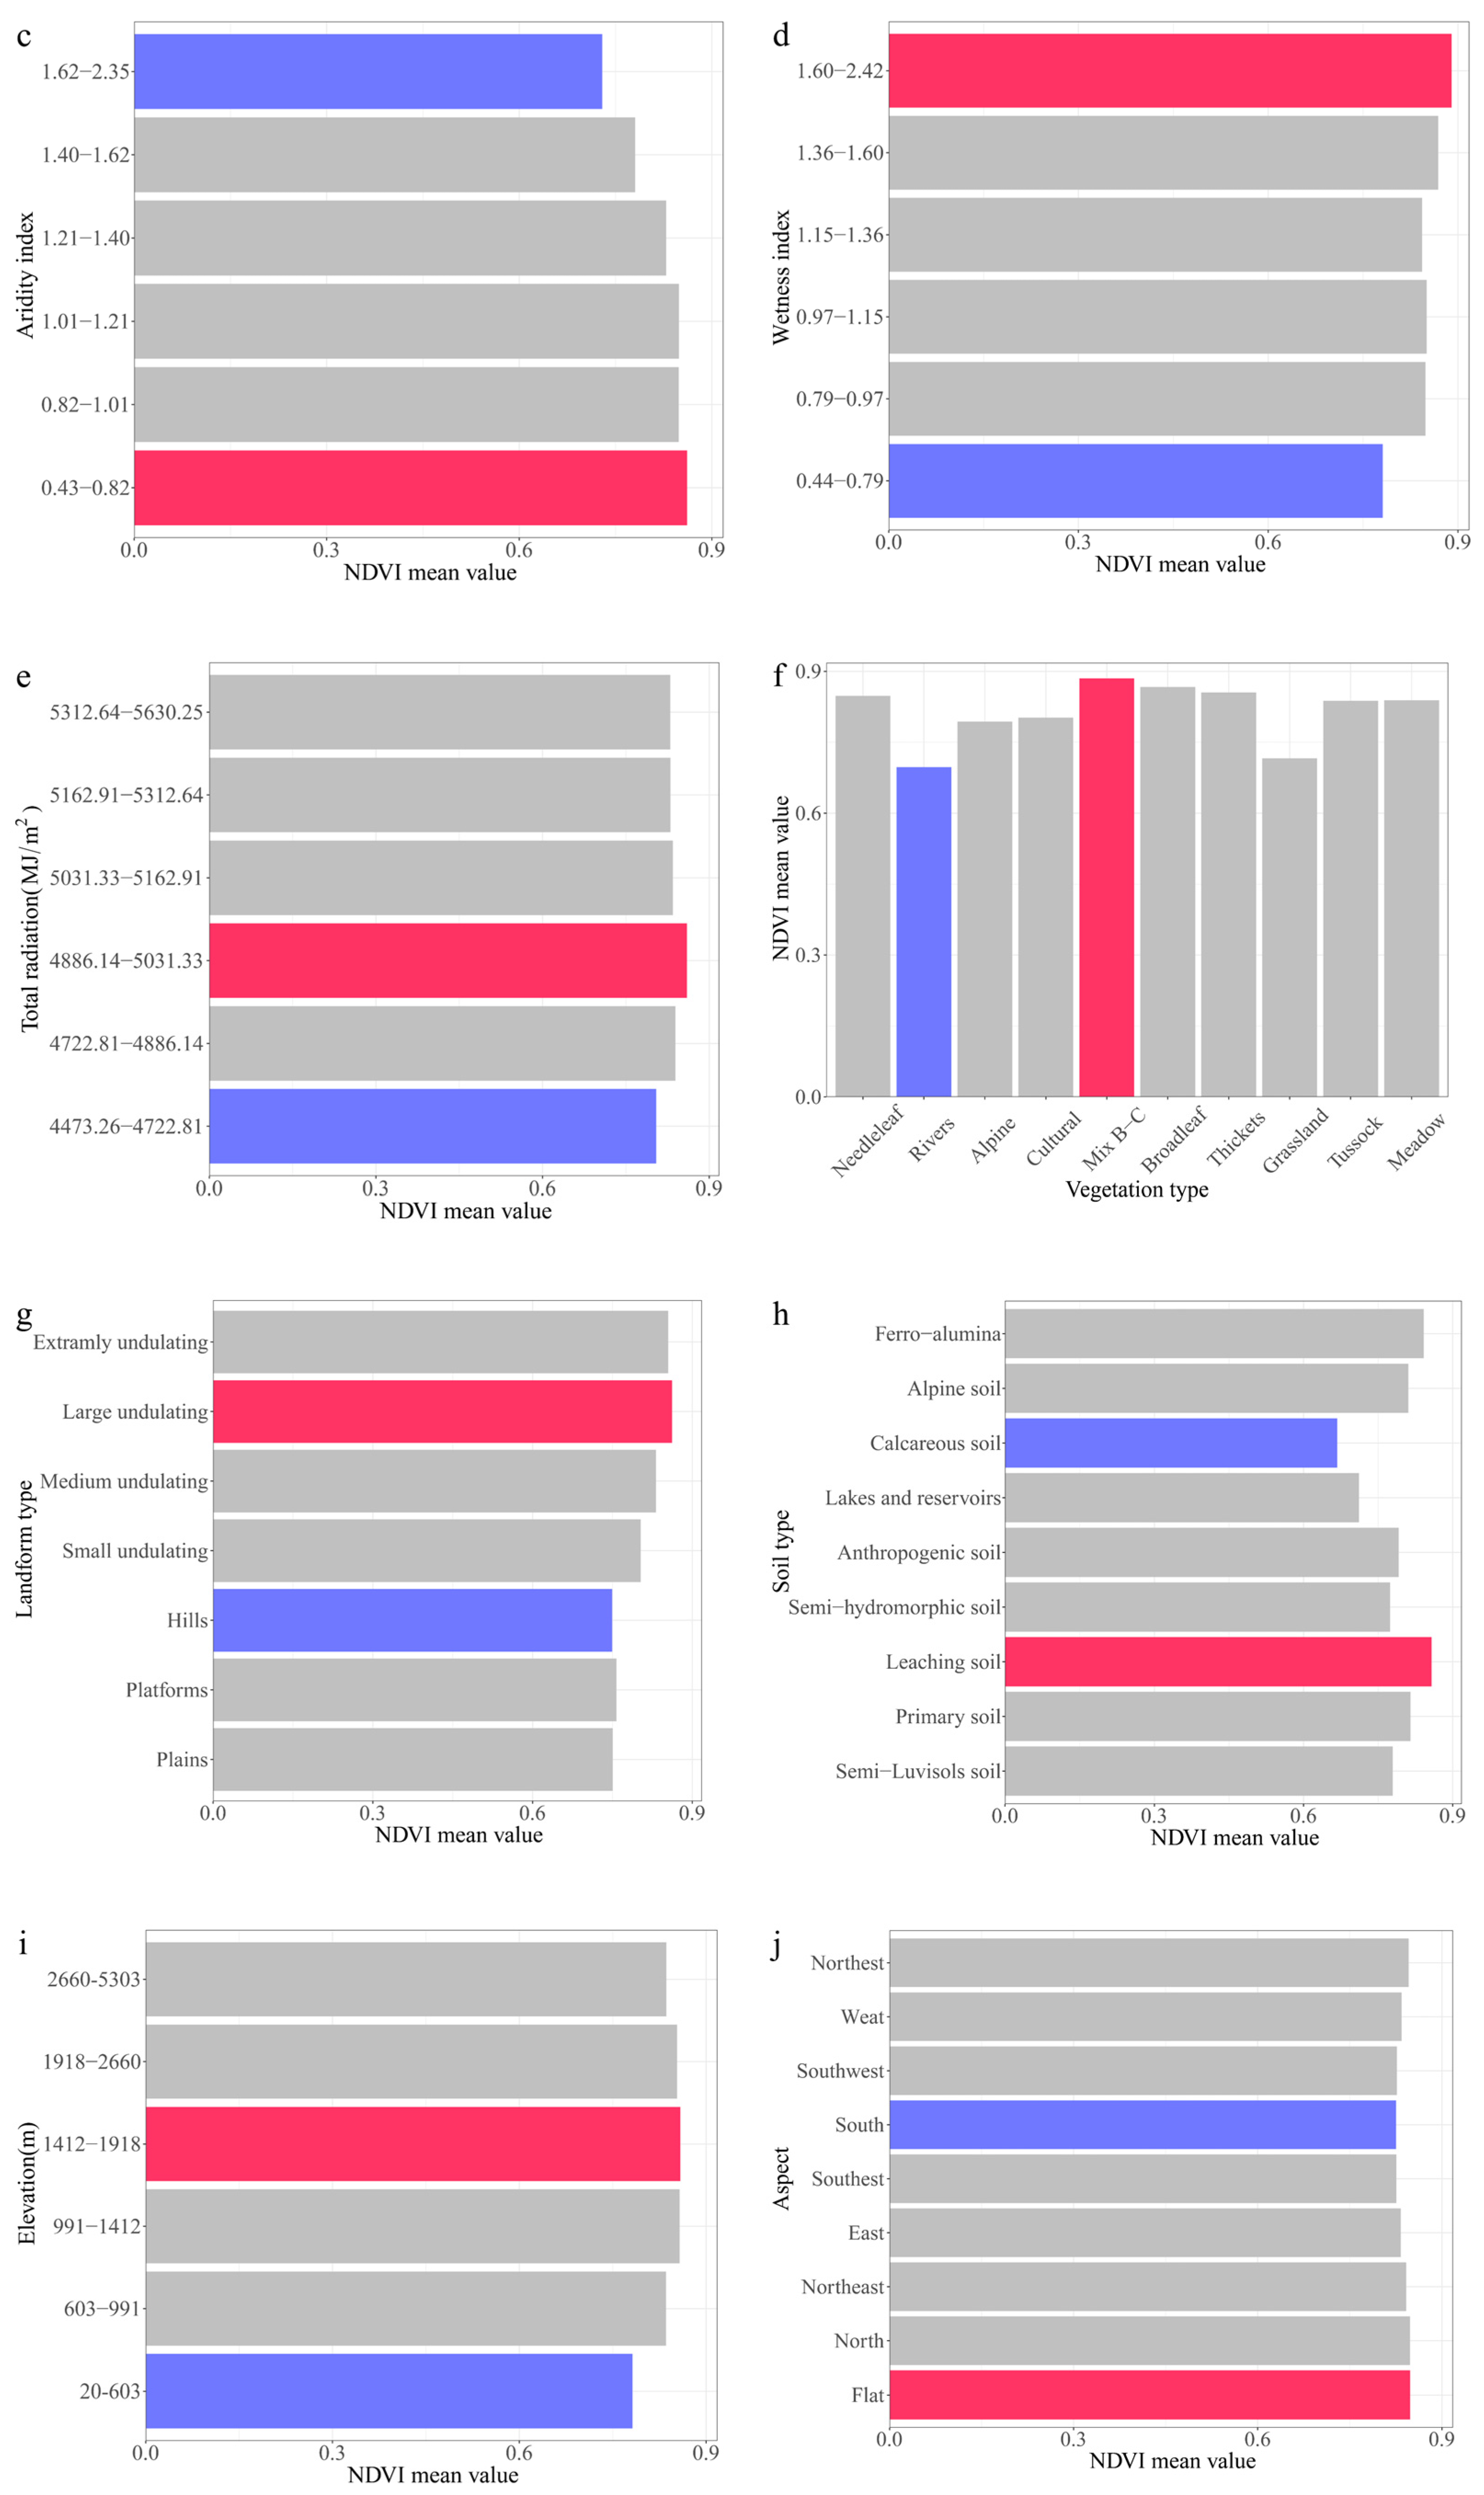
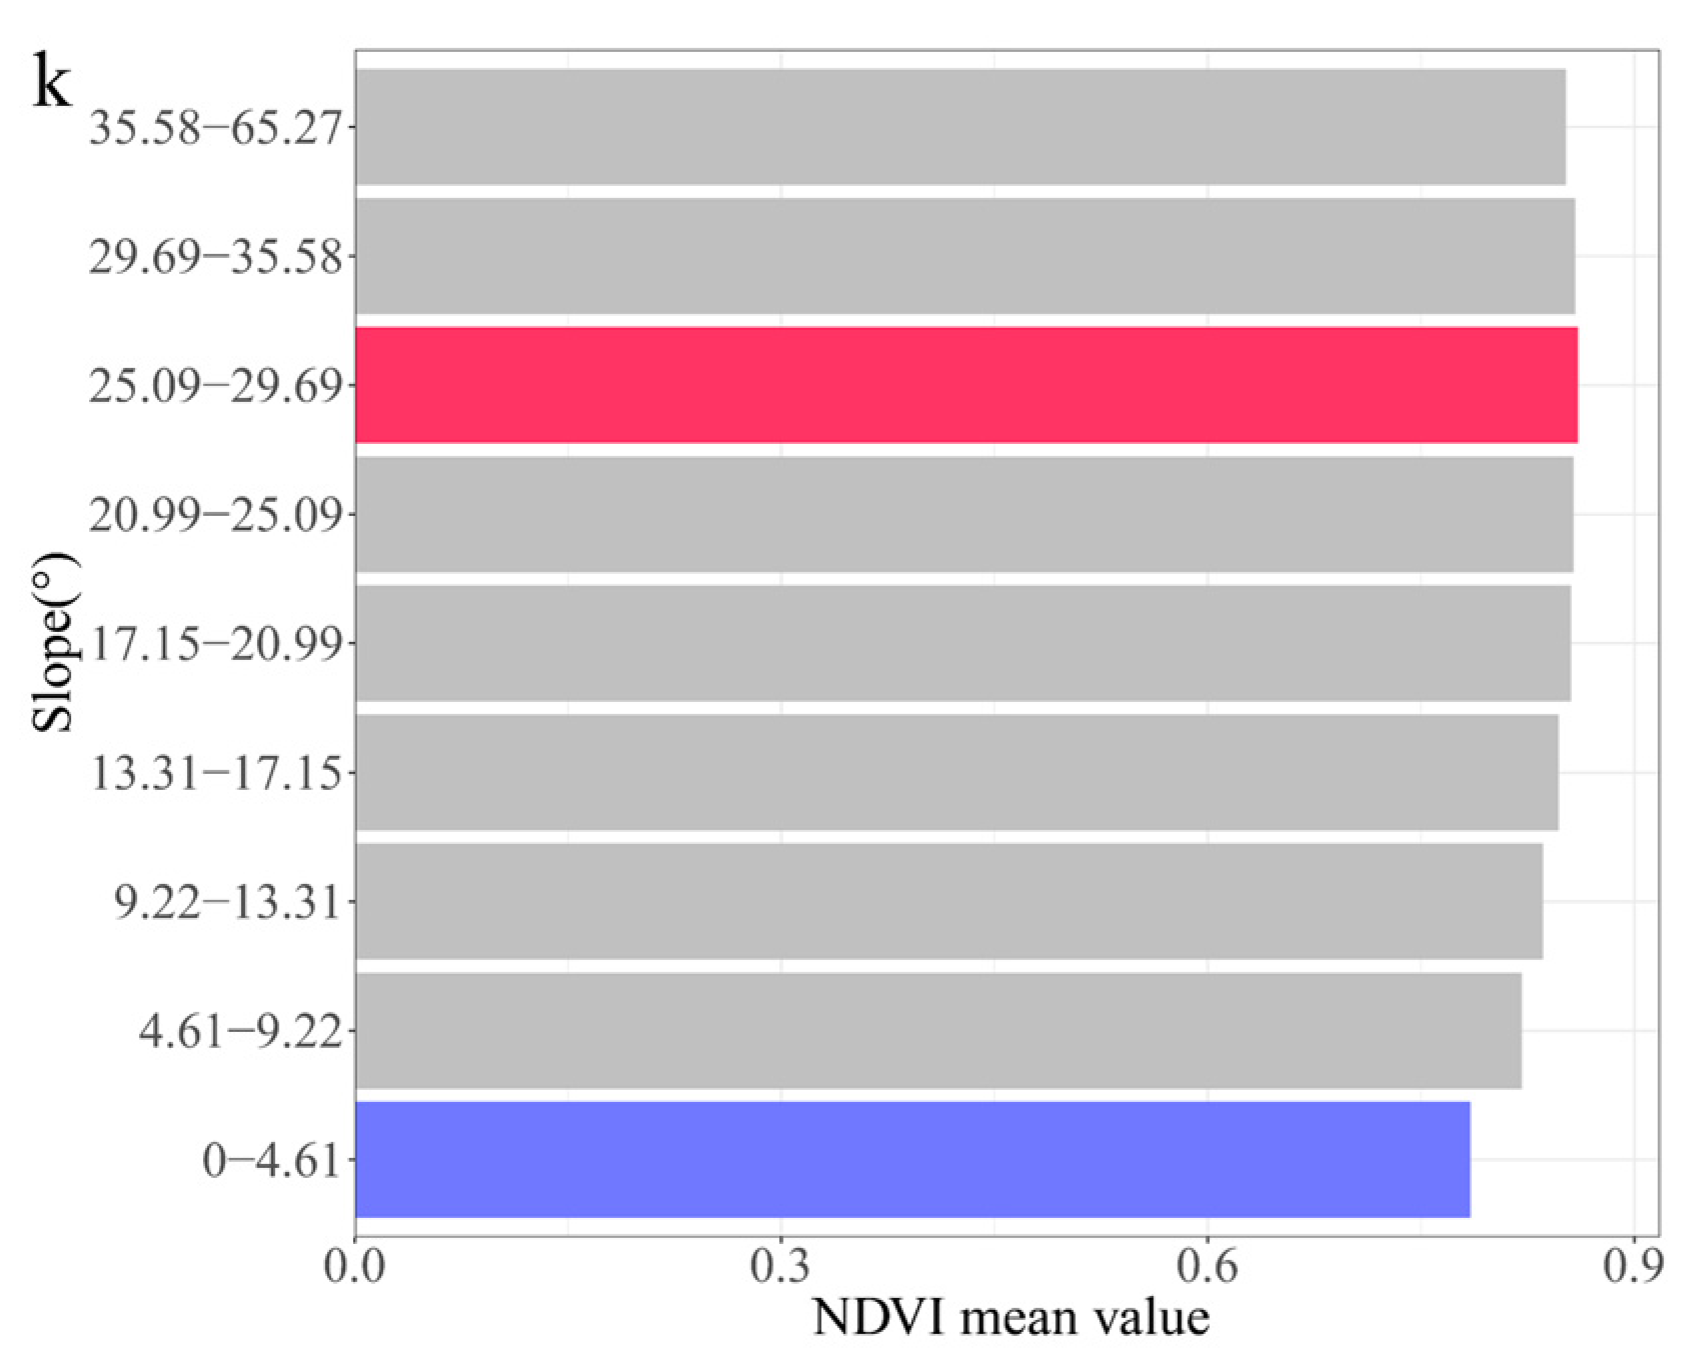
3.3.3. Optimal Types/Ranges

The risk detection in the Geodetector enabled us to derive environmental factors’ suitable range for the NDVI; in other words, it enabled us to detect the classification interval for the maximum NDVI mean value of each environmental factor (Table 4). At the same time, there were significant differences in the mean NDVI values for different influencing factors (Figure 13).
With the continuous increase in annual average precipitation and the wetness index, the NDVI mean value increased continuously and reached the maximum in the range of 1261.65 to 1601.47 mm, with a 1.60 to 2.42 interval for NDVI mean value and with NDVI mean values of 0.865 and 0.890, respectively. With the continuous decrease in the aridity index, the NDVI mean value increased gradually and slowly and reached the maximum (0.862) in the range of 0.43 to 0.82. With the increasing annual average precipitation and wetness index, the soil moisture content increased, which was conducive to the transportation of water and nutrients for vegetation growth, thus promoting vegetation growth. With an increasing aridity index, the soil moisture content kept decreasing, thereby limiting vegetation growth to some extent.
With the increasing annual mean temperature, elevation, total radiation, and slope, the mean NDVI values first increased and then decreased, and the mean NDVI values of the vegetation reached their maximums in the range of 4.79 to 8.11 °C, 1412 to 1918 m, 4886.15 to 5031.33 MJ/m2, and 25.09° to 29.69°, respectively, with mean NDVI values of 0.872, 0.858, 0.860, and 0.860, respectively. For aspect, the NDVI of the vegetation in the south was relatively small, with a mean NDVI value of 0.826, while the rest of the slope orientations (southeast, southwest, east, west, northeast, northwest, and north) had relatively large mean NDVI values (around 0.8), and the highest mean NDVI value of flat areas was 0.848. Within a certain range, the annual mean temperature and total radiation promoted the growth of vegetation and provided a suitable temperature environment and heat source for vegetation growth. When they increase beyond the suitable range for vegetation growth, they may increase the aridity index and, thus, have a suppressive effect on vegetation growth. The higher the elevation, the lower the temperature, the higher the precipitation, and the higher the total radiation. Therefore, the elevation range with the better configuration of water and heat conditions is suitable for vegetation growth. Vegetation growth in areas with low slopes and flats, are negatively affected by human activities. In addition, areas with high slopes are not conducive to vegetation growth, so vegetation growth is better in the moderate slope range.
For different vegetation types, the mean NDVI of vegetation in mixed broadleaf-conifer-mixed forest areas was relatively high at 0.885. For landscape types, the mean NDVI of vegetation in large rolling hills was relatively high at 0.862. For soil types, the mean NDVI of vegetation in leached soils was relatively high at 0.857. Various vegetation are adapted to their environment and to non-natural factors, so they exhibit different growth states. Landform types are formed by the internal and external forces of the earth, and different landform types have some influence on the configuration of hydrothermal conditions for vegetation growth, thereby acting on the growth status of vegetation. As an important link between material exchange and energy transfer in the process of vegetation growth, the soil’s ability to hold water and its physical and chemical properties determine, to a certain extent, the growth state of the vegetation growing on it.

3.3.4. Significant Differences between Environmental Factors

The ecological detection in the Geodetector, which aims to derive the difference in influence between the detected factors, was statistically significant for the NDVI (Figure 14). In general, there were significantly differences between the environmental factors.

4. Discussion

4.1. Vegetation Variation Characteristics in the QBM

Consistent with the findings of Liu et al., who found that vegetation changes in the QBM increased from 2000 to 2014, our analysis indicated that the proportion of the QBM covered by vegetation increased between 2003 and 2018. Vegetation coverage is rapidly regenerating in these areas since the Grain-to-Green Program was put into effect, which may account for this finding [40,41].
There is regional variation in the annual mean values of the NDVI, and the spatial distribution of the NDVI in the region shows high values in the center section and low values at the borders, which is consistent with what was shown in previous research [42]. Overall, the regions of the QBM in Shaanxi Province contained the highest mean values for the NDVI of the vegetation. These regions are covered with mature broadleaf forests, coniferous forests, and shrubs, which account for the high values. However, because of the presence of huge amounts of agricultural land in southern Gansu and the Hanjiang River Valley Basin, the mean NDVI values were lower in Lixian, Xihe, and Wudou in southern Gansu and in the surrounding areas of the Hanjiang River Valley Basin, such as the cities of Luoning, Xichuan, and Danjiangkou.
The vegetation change shows an obviously regional variability in the QBM. Spatial autocorrelation is a useful tool for pinpointing where specific types of plant life cluster. In the LISA maps, the spatiotemporal changes demonstrated that the “High–High” (HH) and “Low–Low” (LL) cluster distributions of the NDVI shifted in the 15-year study period. The “High–High” (HH) and “Low–Low” (LL) clusters of the NDVI were extensively spread and concentrated, as seen by the spatial and temporal changes in LISA clusters. Vegetation cover in the QBM exhibited spatial clustering features that were more typical of ecologically interspersed zones, compared with the scattering characteristics observed elsewhere in the study area. This finding can be explained by the more pronounced dissimilarities between the research area’s natural environment and the rest of the world. For instance, the research area’s northwest region and the counties and towns in the Hanjiang River Valley Basin are predominantly LL aggregations due to abundant arable land, and they show a decreasing tendency. In addition, the QBM region largely consists of HH clusters, the area of which showed a rising trend during the study period, while the area of other types gradually reduced, indicating a generally positive and positive trend in vegetation status. It is possible that the push for conservation policies in the area is responsible for this phenomenon.

4.2. Key Environmental Drivers of NDVI Change

Locating the primary drivers of the vegetation shift in the context of climate change can serve as a valuable scientific resource for ecological preservation efforts. Geodetector can prove to be invaluable in pinpointing the complex interplay of several environmental factors. We employed the Geodetector method to look at the non-linear influence link between NDVI measurements taken from vegetation and the environmental driving factors in the QBM. From these results, we concluded that landform type is the primary factor affecting the NDVI (q = 24.19%). Climatic factors were important factors influencing vegetation change, and their q-values were all above 19%. However, previous studies considered rainfall or elevation as the primary factors influencing the NDVI [31,43]. A possible explanation may be that, due to the different metrics chosen in different papers, this paper is more comprehensive in considering the effect of topographic relief, while previous scholars only considered the effect of topographic factors. The QBM is located at the north–south divide of China; the topography is complex, and the type of landscape has a greater influence on the NDVI. There are few areas with flat topography, where human activities have a negative impact on the condition of vegetation. Other areas are inaccessible, and the vegetation life activities are mainly influenced by the natural environment, such as the water and heat conditions. In the extremely undulating topography, due to the harsh natural conditions, frequent geological disasters, such as landslides, have a negative impact on vegetation growth. In the area of large undulating topography, because of the more comfortable natural environment, the water and heat conditions in the area can better promote the growth of vegetation, which is similar to the findings in Chen’s study [14]. Another possible explanation for this is that the data sources and the time of the study were not the same in this paper and the above studies. This paper used MODIS NDVI (2003–2018), while Zhang’s paper used GIMMS NDVI (1982–2015) and Chen’s paper used SPOT NDVI (2001–2018), which finally led to the differences. Therefore, it is necessary to establish a more complete index system and a unified spatial division standard in subsequent research.

4.3. Implications and Limitations

In recent years, studies of vegetation shifts have risen in prominence as an important aspect of the study of global change. As a result of using Geodetector, we were able to determine the most important factors influencing vegetation shifts in the QBM. When compared with other techniques, Geodetector is able to identify the effects of influencing elements and their interactions on vegetation shift.
Some limitations of this study cannot be denied. This study focused, first and foremost, on the effects that environmental factors have on vegetation, and it did not take into consideration the consequences of human activities on the change in vegetation. Second, the MODIS NDVI dataset used in this study had a spatial resolution of 250 m, which was insufficient for monitoring vegetation changes in small areas. In the future, there is a need to collect remote sensing data with higher spatial resolution to achieve more detailed monitoring studies on the vegetation status of the study area. Despite these shortcomings, this study provides a scientific foundation for ecological environmental protection in the QBM by introducing a spatial autocorrelation analysis to analyze vegetation change in the QBM and by selecting environmental factors from five different perspectives to consider the factors that influence vegetation change.

5. Conclusions

This research used spatial autocorrelation to investigate the spatial and temporal change of the NDVI in the QBM during the period from 2003 to 2018. The impacts of individual factors and their interactions on NDVI changes in vegetation were then quantified using Geodetector. Our substantial findings include the following: (1) The overall vegetation growth gradually improved during this period, and the vegetation cover in the Longnan region increased significantly; (2) Vegetation in the QBM showed a substantial global autocorrelation pattern, indicated by the global Moran’s index, which was higher than 0.93. The spatial clusters of High–High (HH) and Low–Low (LL) were more widely distributed. During the study period, the HH cluster type gradually increased, while the LL type reflected an opposite pattern, further indicating the improved vegetation condition in the QBM; (3) The landform type was the main factor in controlling vegetation change, with an explanatory power of 0.242; (4) The findings of interaction detection revealed that the relationship between the two environmental factors was primarily bivariate-enhanced, with the most significant interaction between temperature and the aridity index. These findings help us better understand the mechanisms that lead to NDVI change in the QBM and their impact. Further, this work might provide scholarly references and suggestions for vegetation conservation planning and ecosystem service assessment in the QBM.

Author Contributions

Conceptualization, Y.Z. and Y.Y.; formal analysis, S.Z., Y.Z. and Y.Y.; funding acquisition, Y.Z. and Y.Y.; methodology, S.Z., Y.Z. and Y.Y.; data curation, F.L., R.Z. and W.L.; writing—original draft preparation, Y.Z. and Y.Y.; writing—review and editing, Y.Y., S.Z. and Y.Z. All authors have read and agreed to the published version of the manuscript.

Funding

This research was funded by the National Key Research and Development Program (Grants No. 2021xjkk0303 and 2018YFB0505301).

Data Availability Statement

Not applicable.

Acknowledgments

We appreciate the assistance of the Google Earth Engine platform and its creators. We also acknowledge the journal editor and the anonymous reviewers for their insightful criticisms and outstanding work on this research.

Conflicts of Interest

The authors declare no conflict of interest.

References

  1. Ma, Y.; Guan, Q.; Sun, Y.; Zhang, J.; Yang, L.; Yang, E.; Li, H.; Du, Q. Three-dimensional dynamic characteristics of vegetation and its response to climatic factors in the Qilian Mountains. Catena 2022, 208, 105694. [Google Scholar] [CrossRef]
  2. Wang, W.; Ma, X.; Moazzam Nizami, S.; Tian, C.; Guo, F. Anthropogenic and Biophysical Factors Associated with Vegetation Restoration in Changting, China. Forests 2018, 9, 306. [Google Scholar] [CrossRef] [Green Version]
  3. Sun, Z.; Mao, Z.; Yang, L.; Liu, Z.; Han, J.; Wanag, H.; He, W. Impacts of climate change and afforestation on vegetation dynamic in the Mu Us Desert, China. Ecol. Indic. 2021, 129, 108020. [Google Scholar] [CrossRef]
  4. Kalisa, W.; Igbawua, T.; Henchiri, M.; Ali, S.; Zhang, S.; Bai, Y.; Zhang, J. Assessment of climate impact on vegetation dynamics over East Africa from 1982 to 2015. Sci. Rep. 2019, 9, 16865. [Google Scholar] [CrossRef] [PubMed] [Green Version]
  5. Alkama, R.; Cescatti, A. Biophysical climate impacts of recent changes in global forest cover. Science 2016, 351, 600–604. [Google Scholar] [CrossRef] [Green Version]
  6. Huang, S.; Zheng, X.; Ma, L.; Wang, H.; Huang, Q.; Leng, G.; Meng, E.; Guo, Y. Quantitative contribution of climate change and human activities to vegetation cover variations based on GA-SVM model. J. Hydrol. 2020, 584, 124687. [Google Scholar] [CrossRef]
  7. Jiang, L.; Bao, A.; Guo, H.; Ndayisaba, F. Vegetation dynamics and responses to climate change and human activities in Central Asia. Sci. Total Environ. 2017, 599, 967–980. [Google Scholar] [CrossRef]
  8. Liu, S.; Huang, S.; Xie, Y.; Wang, H.; Huang, Q.; Leng, G.; Li, P.; Wang, L. Spatial-temporal changes in vegetation cover in a typical semi-humid and semi-arid region in China: Changing patterns, causes and implications. Ecol. Indic. 2019, 98, 462–475. [Google Scholar] [CrossRef]
  9. Li, X.; Du, L.; Li, X.; Yao, P.; Luo, Z.; Wu, Z. Effects of Human Activities on Urban Vegetation: Explorative Analysis of Spatial Characteristics and Potential Impact Factors. Remote Sens. 2022, 14, 2999. [Google Scholar] [CrossRef]
  10. Wang, Z.; Bai, T.; Xu, D.; Kang, J.; Shi, J.; Fang, H.; Nie, C.; Zhang, Z.; Yan, P.; Wang, D. Temporal and Spatial Changes in Vegetation Ecological Quality and Driving Mechanism in Kökyar Project Area from 2000 to 2021. Sustainability 2022, 14, 7668. [Google Scholar] [CrossRef]
  11. Peng, W.; Wang, G.; Zhou, J.; Xu, X.; Luo, H.; Zhao, J.; Yang, C. Dynamic monitoring of fractional vegetation cover along Minjiang River from Wenchuan County to Dujiangyan City using multi-temporal landsat 5 and 8 images. Acta Ecol. Sin. 2016, 36, 1975–1988. [Google Scholar]
  12. Chu, H.; Venevsky, S.; Wu, C.; Wang, M. NDVI-based vegetation dynamics and its response to climate changes at Amur-Heilongjiang River Basin from 1982 to 2015. Sci. Total Environ. 2019, 650, 2051–2062. [Google Scholar] [CrossRef] [PubMed]
  13. Yang, C.; Fu, M.; Feng, D.; Sun, Y.; Zhai, G. Spatiotemporal changes in vegetation cover and its influencing factors in the loess Plateau of China based on the geographically weighted regression model. Forests 2021, 12, 673. [Google Scholar] [CrossRef]
  14. Chen, C.; Zhu, L.; Tian, L.; LI, X. Spatial-temporal changes in vegetation characteristics and climate in the Qinling-Daba Mountains. Acta Ecol. Sin. 2019, 39, 3257–3266. [Google Scholar]
  15. Liu, C.; Li, W.; Wang, W.; Zhou, H.; Liang, T.; Hou, F.; Xu, J.; Xue, P. Quantitative spatial analysis of vegetation dynamics and potential driving factors in a typical alpine region on the northeastern Tibetan Plateau using the Google Earth Engine. Catena 2021, 206, 105500. [Google Scholar] [CrossRef]
  16. Wang, J.; Ouyang, J.; Zhang, M. Spatial distribution characteristics of soil and vegetation in a reclaimed area in an opencast coalmine. Catena 2020, 195, 104773. [Google Scholar] [CrossRef]
  17. Fan, Z.; Deng, C.; Fan, Y.; Zhang, P.; Lu, H. Spatial-temporal pattern and evolution trend of the cultivated land use eco-efficiency in the National Pilot Zone for ecological conservation in China. Int. J. Environ. Res. Public Health 2021, 19, 111. [Google Scholar] [CrossRef]
  18. Song, L.; Li, M.; Xu, H.; Guo, Y.; Wang, Z.; Li, Y.; Wu, X.; Feng, L.; Chen, J.; Lu, X. Spatiotemporal variation and driving factors of vegetation net primary productivity in a typical karst area in China from 2000 to 2010. Ecol. Indic. 2021, 132, 108280. [Google Scholar] [CrossRef]
  19. Zhou, S.; Zhang, W.; Wang, S.; Zhang, B.; Xu, Q. Spatial–Temporal Vegetation Dynamics and Their Relationships with Climatic, Anthropogenic, and Hydrological Factors in the Amur River Basin. Remote Sens. 2021, 13, 684. [Google Scholar] [CrossRef]
  20. Zhao, A.; Zhang, A.; Lu, C.; Wang, D.; Wang, H.; Liu, H. Spatiotemporal variation of vegetation coverage before and after implementation of Grain for Green Program in Loess Plateau, China. Ecol. Eng. 2017, 104, 13–22. [Google Scholar] [CrossRef]
  21. Guan, Q.; Yang, L.; Guan, W.; Wang, F.; Liu, Z.; Xu, C. Assessing vegetation response to climatic variations and human activities: Spatiotemporal NDVI variations in the Hexi Corridor and surrounding areas from 2000 to 2010. Theor. Appl. Climatol. 2019, 135, 1179–1193. [Google Scholar] [CrossRef]
  22. Zhu, Z.; Piao, S.; Myneni, R.B.; Huang, M.; Zeng, Z.; Canadell, J.G.; Ciais, P.; Sitch, S.; Friedlingstein, P.; Arneth, A. Greening of the Earth and its drivers. Nat. Clim. Change 2016, 6, 791–795. [Google Scholar] [CrossRef]
  23. Pei, Z.; Fang, S.; Yang, W.; Wang, L.; Wu, M.; Zhang, Q.; Han, W.; Khoi, D.N. The relationship between NDVI and climate factors at different monthly time scales: A case study of grasslands in inner Mongolia, China (1982–2015). Sustainability 2019, 11, 7243. [Google Scholar] [CrossRef] [Green Version]
  24. Zhang, Y.; Xu, G.; Li, P.; Li, Z.; Wang, Y.; Wang, B.; Jia, L.; Cheng, Y.; Zhang, J.; Zhuang, S. Vegetation change and its relationship with climate factors and elevation on the Tibetan plateau. Int. J. Environ. Res. Public Health 2019, 16, 4709. [Google Scholar] [CrossRef] [PubMed] [Green Version]
  25. Nie, T.; Dong, G.; Jiang, X.; Lei, Y. Spatio-temporal changes and driving forces of vegetation coverage on the loess plateau of Northern Shaanxi. Remote Sens. 2021, 13, 613. [Google Scholar] [CrossRef]
  26. Wang, J.; Xu, C. Geodetector: Principle and prospective. Acta Geogr. Sin. 2017, 72, 116–134. [Google Scholar]
  27. Zhang, B. Ten major scientific issues concerning the study of China’s north-south transitional zone. Prog. Geogr. 2019, 38, 305–311. [Google Scholar]
  28. Li, X.; Ma, B.; Lu, C.; Yang, H.; Sun, M. Spatial Pattern and Development of Protected Areas in the North-south Transitional Zone of China. Chin. Geogr. Sci. 2021, 31, 149–166. [Google Scholar] [CrossRef]
  29. Sun, H.; Bai, H.; Zhang, Q.; Luo, X.; Zhang, S. SPOT VEGETATION-based analysis on vegetation change and its responses to temperature in the southern region of Qinling Mountains during the last decades. Acta Sci. Circumstantiae 2010, 30, 649–654. [Google Scholar]
  30. Cui, X.; Bai, H.; Shang, X. The vegetation dynamic in Qinling area based on MODIS NDVI. J. Northwest Univ. Nat. Sci. Ed. 2012, 42, 1021–1026. [Google Scholar]
  31. Zhang, Y.; He, Y.; Li, Y.; Jia, L. Spatiotemporal variation and driving forces of NDVI from 1982 to 2015 in the Qinba Mountains, China. Environ. Sci. Pollut. Res. 2022, 29, 52277–52288. [Google Scholar] [CrossRef] [PubMed]
  32. Wang, L.; Chen, S.; Zhu, W.; Ren, H.; Zhang, L.; Zhu, L. Spatiotemporal variations of extreme precipitation and its potential driving factors in China’s North-South Transition Zone during 1960–2017. Atmos. Res. 2021, 252, 105429. [Google Scholar] [CrossRef]
  33. Liu, Z.; Mcvicar, T.R.; Niel, V.T.G.; Yang, Q.; Li, R. Introduction of the professional interpolation software for meteorology data-ANUSPLIN. Meteor. Mon. 2008, 34, 92–100. [Google Scholar]
  34. Hong, Y. Modeling spatial distribution of climate in China using thin plate smoothing spline interpolation. Sci. Geogr. Sin. 2004, 24, 163–169. [Google Scholar]
  35. He, Y.; Fan, G.; Zhang, X.; Liu, M.; Gao, D. Variation of vegetation NDVI and its response to climate change in Zhejiang Province. Acta Ecol. Sin. 2012, 32, 4352–4362. [Google Scholar] [CrossRef]
  36. Moran, P.A.P. Notes on continuous stochastic phenomena. Biometrika 1950, 37, 17–23. [Google Scholar] [CrossRef]
  37. Anselin, L. Local indicator of spatial association-LISA. Geogr. Anal. 1995, 27, 91–115. [Google Scholar] [CrossRef]
  38. Matese, A.; Di Gennaro, S.F.; Santesteban, L.G. Methods to compare the spatial variability of UAV-based spectral and geometric information with ground autocorrelated data. A case of study for precision viticulture. Comput. Electron. Agric. 2019, 162, 931–940. [Google Scholar] [CrossRef]
  39. Song, Y.; Wang, J.; Ge, Y.; Xu, C. An optimal parameters-based geographical detector model enhances geographic characteristics of explanatory variables for spatial heterogeneity analysis: Cases with different types of spatial data. GIScience Remote Sens. 2020, 57, 593–610. [Google Scholar] [CrossRef]
  40. Zhou, H.; Van Rompaey, A. Detecting the impact of the “Grain for Green” program on the mean annual vegetation cover in the Shaanxi province, China using SPOT-VGT NDVI data. Land Use Policy 2009, 26, 954–960. [Google Scholar] [CrossRef]
  41. Qian, C.; Shao, L.; Hou, X.; Zhang, B.; Chen, W.; Xia, X. Detection and attribution of vegetation greening trend across distinct local landscapes under China’ s Grain to Green Program: A case study in Shaanxi Province. Catena 2019, 183, 104182. [Google Scholar] [CrossRef]
  42. Bai, Y. Analysis of vegetation dynamics in the Qinling-Daba Mountains region from MODIS time series data. Ecol. Indic. 2021, 129, 108029. [Google Scholar] [CrossRef]
  43. Chen, T.; Xia, J.; Zou, L.; Hong, S. Quantifying the influences of natural factors and human activities on NDVI changes in the Hanjiang River Basin, China. Remote Sens. 2020, 12, 3780. [Google Scholar] [CrossRef]
Figure 1. Map of the Qinba Mountains (QBM).
Remotesensing 14 05794 g001
Figure 2. Spatial distribution of factors influencing the NDVI in the QBM. Note: temperature, precipitation, aridity index, wetness index and total radiation are the multi-year averaged variables.
Remotesensing 14 05794 g002
Figure 3. Diagram of workflow in this study.
Remotesensing 14 05794 g003
Figure 4. Spatial pattern of multi-year annual mean NDVI in the QBM (2003–2018).
Remotesensing 14 05794 g004
Figure 5. Spatial pattern of NDVI in the QBM, 2003–2018.
Remotesensing 14 05794 g005
Figure 6. Percentage of different levels of NDVI in the QBM, 2003–2018.
Remotesensing 14 05794 g006
Figure 7. Sankey diagram of spatial variation of NDVI in the QBM, 2003–2018. Note: The width of color band is the percentage of different levels of NDVI.
Remotesensing 14 05794 g007
Figure 8. The global Moran’s I of NDVI in the QBM, 2003–2018.
Remotesensing 14 05794 g008
Figure 9. The LISA maps of NDVI in the QBM, 2003–2018.
Remotesensing 14 05794 g009
Figure 10. Temporal trends of (a) “High–Low” (HL), “Low–High” (LH) and (b) “High–High” (HH),“Low–Low” (LL) LISA index in the QBM, 2003–2018.
Remotesensing 14 05794 g010
Figure 11. Factor detection of environmental factors on NDVI change.
Remotesensing 14 05794 g011
Figure 12. The interaction effects among environmental factors (X1–X11) on NDVI change. Note: bivariate-enhanced (“↑↑”) and nonlinear-enhanced (“↑”) relationships, respectively, between the two factors.
Remotesensing 14 05794 g012
Figure 13. The statistical outcomes of NDVI at different levels for different environmental factors (ak). Note: “needleleaf”—“needleleaf forest”, “alpine”—“alpine vegetation”, “cultural”—“cultural vegetation”, “Mix B-C”—“mixed broadleaf-conifer mixed forest”, “Broadleaf”—“broadleaf forest”.
Remotesensing 14 05794 g013aRemotesensing 14 05794 g013bRemotesensing 14 05794 g013c
Figure 14. The result of ecological detection. Note: X1–X11 represents all environmental factors. Y represents the significant difference between the two environmental factors, while N indicates the insignificant difference (at the 95% confidence level).
Remotesensing 14 05794 g014
Table 1. Environmental data indicators and their units.
Data TypeCodeVariablesUnit
ClimateX1Mean annual temperature°C
X2Mean annual precipitationmm
X3Aridity index/
X4Wetness index/
X5Total radiationMJ/m2
VegetationX6Vegetation type/
GeomorphologyX7Landform type/
SoilX8Soil type/
TopographyX9Elevationm
X10Aspect°
X11Slope°
Table 2. Definitions of interaction types.
Interaction TypesTypes of InteractionsDescription
q(X1 ∩ X2) <
Min(q(X1), q(X2))
Nonlinear weakenThe interaction between two variables nonlinearly weakens the influence of a single variable.
Min(q(X1),q(X2)) <
q(X1 ∩ X2) < Max(q(X1), q(X2))
Univariate weakenThe interaction between two variables univariate weakens the influence of a single variable.
q(X1 ∩ X2) = q(X1) + q(X2)Bivariate enhancedThe interaction between two variables bivariate enhanced the influence of a single variable.
q(X1 ∩ X2) = q(X1) + q(X2)IndependentThe interaction between two variables is independent.
q(X1 ∩ X2) > q(X1) + q(X2)Nonlinear enhancedThe interaction between two variables nonlinear enhanced the influence of a single variable.
Table 3. Area and proportion of different levels of multi-year annual mean NDVI in the QBM (2003–2018).
NDVI LevelsNDVI ValueArea (km2)Percentage (%)
Low≤0.20.250.00
Medium-low0.2–0.4440.500.05
Medium0.4–0.610,876.251.22
Medium-high0.6–0.8199,352.0022.34
High>0.8681,497.5076.39
Table 4. Suitable range of environmental factors for NDVI. (Confidence level 95%).
Environmental FactorSuitable Range of NDVINDVI Mean Value
X1 (Mean annual temperature)4.79–8.11 °C0.872
X2 (Mean annual precipitation)1261.65–1601.47 mm0.865
X3 (Aridity index)0.43–0.820.862
X4 (Wetness index)1.60–2.420.890
X5 (Total radiation)4886.14–5031.33 MJ/m20.860
X6 (Vegetation type)Mixed broadleaf–conifer mixed forest0.885
X7 (Landform type)Large undulating0.862
X8 (Soil type)Leaching soil0.857
X9 (Elevation)1412–1918 m0.858
X10 (Aspect)Flat0.848
X11 (Slope)25.09–29.69°0.860
Publisher’s Note: MDPI stays neutral with regard to jurisdictional claims in published maps and institutional affiliations.

