Article

Superpixel and Supervoxel Segmentation Assessment of Landslides Using UAV-Derived Models

by
Ioannis Farmakis
1,*,
Efstratios Karantanellis
2,
D. Jean Hutchinson
1,
Nicholas Vlachopoulos
3 and
Vassilis Marinos
4
1
Department of Geological Sciences and Geological Engineering, Queen’s University, Kingston, ON K7L 3N6, Canada
2
Department of Earth Science and Environmental Sciences, University of Michigan, Ann Arbor, MI 48103, USA
3
Department of Civil Engineering, Royal Military College of Canada, Kingston, ON K7K 7B4, Canada
4
Department of Civil Engineering, National Technical University of Athens, 157 80 Athens, Greece
*
Author to whom correspondence should be addressed.
Remote Sens. 2022, 14(22), 5668; https://doi.org/10.3390/rs14225668
Submission received: 22 September 2022 / Revised: 4 November 2022 / Accepted: 7 November 2022 / Published: 10 November 2022

Abstract

:
Reality capture technologies such as Structure-from-Motion (SfM) photogrammetry have become a state-of-the-art practice within landslide research workflows in recent years. Such technology has been predominantly utilized to provide detailed digital products in landslide assessment where often, for thorough mapping, significant accessibility restrictions must be overcome. UAV photogrammetry produces a set of multi-dimensional digital models to support landslide management, including orthomosaic, digital surface model (DSM), and 3D point cloud. At the same time, the recognition of objects depicted in images has become increasingly possible with the development of various methodologies. Among those, Geographic Object-Based Image Analysis (GEOBIA) has been established as a new paradigm in the geospatial data domain and has also recently found applications in landslide research. However, most of the landslide-related GEOBIA applications focus on large scales based on satellite imagery. In this work, we examine the potential of different UAV photogrammetry product combinations to be used as inputs to image segmentation techniques for the automated extraction of landslide elements at site-specific scales. Image segmentation is the core process within GEOBIA workflows. The objective of this work is to investigate the incorporation of fully 3D data into GEOBIA workflows for the delineation of landslide elements that are often challenging to be identified within typical rasterized models due to the steepness of the terrain. Here, we apply a common unsupervised image segmentation pipeline to 3D grids based on the superpixel/supervoxel and graph cut algorithms. The products of UAV photogrammetry for two landslide cases in Greece are combined and used as 2D (orthomosaic), 2.5D (orthomosaic + DSM), and 3D (point cloud) terrain representations in this research. We provide a detailed quantitative comparative analysis of the different models based on expert-based annotations of the landscapes and conclude that using fully 3D terrain representations as inputs to segmentation algorithms provides consistently better landslide segments.

1. Introduction

Landslide disasters constitute a global issue that threatens the sustainability of infrastructure and the environment as well as human lives [1]. Sophisticated digital methods for accurate and efficient assessment based on cutting-edge technologies can enhance traditional protocols. Unmanned Aerial Vehicle (UAV) photogrammetry has become a state-of-the-art technique in landslide research in recent years. The ability to produce high-resolution digital models of inaccessible areas in a short time and with relatively low cost has made UAVs key assets in landslide assessment and they support decision making. Digital landslide models permit landslide assessment and support decision making to mitigate landslide risk. Consequently, there is a need to improve accuracy, efficiency, and automation in landslide modelling and minimize subjectivity and human error in visual interpretations. The products of UAV surveys vary from the 2D orthomosaic and 2.5D digital surface model (DSM) to high-resolution 3D point cloud. These products permit powerful visualizations, precise measurements, and detailed analysis tasks such as change detection to be carried out.
However, there is room to improve the capabilities of our models. To make the models more intelligent and leverage autonomy, strengthen inter-communication, and perform efficient queries to speed up current analysis frameworks, we primarily need to transfer formalized knowledge and inject semantics into the digital model. This mainly comprises a clustering problem. However, the identification of commonalities, in ultra-high-resolution geographic data, constitutes a challenge within several applications. It is also important to structure a large model in a way that it can be manipulated efficiently. This requires the development of semantic segmentation methodologies that are able to recognize different geologic/geomorphologic features within a digital model and efficiently accommodate multi-level conceptualizations [2].

1.1. Motivation and Objectives

The motivation for the work presented in this paper is to assess the effectiveness of UAV-derived terrain representations of varying dimensionality to support the extraction of meaningful landslide objects. In landslide scenes, segmentations have predominantly been applied to 2D or 2.5D images (pixel grids) (see Section 1.2 below). Landslide scenes are often steep terrains where critical elements such as the scarp zones and/or the flanks of a landslide may not be adequately modeled in top-view projections. In such cases, a fully 3D approach might be essential. Although powerful, fully 3D approaches are often constrained by the high computational resources demand, especially at regional scale analyses. However, at site-specific scales, the data load can still be handled by commercial hardware. In this study, the authors thoroughly compare site-specific scale landslide segmentations produced in all 2D, 2.5D, and 3D operational domains using UAV-derived terrain representations as inputs to GEOBIA workflows. The segmentation algorithm used for the assessment of the models was selected based on three criteria:
(a)
it is unsupervised (no requirement for large amounts of training data);
(b)
it is applicable in the 3D space as well (maintains consistency in the experiments); and
(c)
it is tested for the first time in a landslide environment (provides new data for the landslide community).
It is, however, worth mentioning that the definition of the optimum landslide segmentation algorithm for the task is beyond the scope of this research. Only the dimensionality of the landslide representation is assessed as the input, based on the algorithm that fulfills the above criteria, to maintain consistency between the different operational spaces. UAV deployment at site-specific scales enables the acquisition of detailed 3D models. In steep terrains such as landslides, moving from 2D image segmentation to fully 3D analyses may prove to be decisive in the extraction of confident geologic information.
In the research reported here, superpixels and supervoxels are generated under different resolutions and the final segmentation of each model is achieved using a data-driven approach. The supervoxel implementations are modified to operate directly on the voxel grid rather than on stacked pixel grids. The results of two geologically/geomorphologically different landslide cases are evaluated against expert annotated reference data, considering state-of-the-art performance metrics for the task. The methodology followed is illustrated in the flowchart in Figure 1 and aims to investigate the suitability of individual terrain representations of varying spatial dimensionality for automatic unsupervised segmentation towards object-oriented semantic injection in landslide models.

1.2. Segmentation Background

Image segmentation was initially implemented within Object-Based Image Analysis (OBIA) frameworks for medical imaging, but since then it has been applied to multiple domains such as indoor mapping, traffic detection, and range imaging [3]. It has revolutionized image analysis processes with a move from the traditional pixel-based model to an object-based contextual model that endeavours to emulate the way humans interpret images. Subsequently, the objective of segmentation has been changed from pixel labelling to object partitioning [4]. Since the early 2000s, the same shift has been taking place in remote sensing. The new paradigm named Geographic Object-Based Image Analysis (GEOBIA), promises to change the way geoscientists perceive, analyze, and use remote (or close-range) sensing data [5,6]. In remote sensing, the main objectives are to detect, identify, analyze, and monitor the dynamics of natural phenomena and several studies have highlighted the advantages of GEOBIA compared to the pixel-based paradigm [7,8]. However, there are specific challenges in using the object-oriented data model, such as the under-segmentation and over-segmentation error associated with the segmentation scale. This occurs when the object entities include more than one object, or the objects are unnecessarily broken apart in the segmentation process [9], respectively.
Image segmentation is a critical step in GEOBIA. There are various methods for semi-automatic or automatic object detection that are based on the application of various segmentation algorithms to Earth Observation (EO) data [10]. Many methods for object recognition and segmentation rely on the tessellation of an image into “superpixels”. A superpixel is an image patch which is better aligned with object boundaries than a rectangular patch. The objective is to group pixels into perceptually meaningful regions to replace the rigid structure of the raster [11]. Superpixels aim at balancing the conflicting goals of reducing image complexity and yielding new properties, while avoiding under-segmentation. The extensive state-of-the-art review on segmentation methods for GEOBIA conducted by [4] reveals that MRS [12] is the most cited segmentation algorithm and is often used as a reference for benchmarking. However, Ref.[13] demonstrates that similar or even better accuracy can be achieved using superpixels instead of MRS-derived segments as objects. The accuracy and precision of a segmentation technique refer to the degree by which the segmentation results agree with the reference data extent. Image segmentation literature is extensive, including different algorithms and approaches. Furthermore, Ref.[14] have demonstrated a detailed review of recent trends in object detection with the use of deep learning (e.g., [15]). Because segmentation is the initial phase in the data analysis, an accurate, precise, and efficient approach must be implemented to minimize inappropriate results.
The segmentation process defines the entities for object-oriented analysis which should aim to create meaningfully delineated real-world objects. Entities can be generated based on different attributes, such as size, texture, shape, spatial and spectral distribution. The precision and accuracy of object boundary delineation is significant due to its impact on the subsequent classification phase. Subsequently, the segmentation can be completed treating these newly formed entities, with their respective attributes, as the image unit within the desirable clustering approach. This is essentially the principle of object-oriented models which have proven to yield better performance compared to traditional pixel-based analyses of 2D and 2.5D images [16].
The same concepts apply to 3D space where the analogous to pixels, voxels (volumetric pixels) are grouped into supervoxels as discussed in [2]. The generation of the voxel grid requires the point cloud to be recursively subdivided into eight child voxels until the desired resolution is reached. The voxel colour and/or other layers are inherited from the point cloud and the points included within each voxel. In contrast to 2D image over-segmentation, little work has been carried out in supervoxel algorithms operating directly on 3D space (i.e., [17,18]). Despite the usefulness in digitizing the real world, 3D point clouds are tedious to work with and conventional point cloud tools are limited. The vast majority of the advances in computer vision and machine learning today deal with 2D images [19]. That is the reason why point clouds are often written off as the raw product with the focus being put on processed data formats such as rasters. Three-dimensional scenes are usually treated as a stack of slices along one of the dimensions, each processed as an individual image. We use point clouds as visualizations for virtual inspections and limit our work with them to measuring simple distances. However, given the ever-increasing availability of high-resolution point clouds, fully 3D object-oriented operations might add substantial value to object-based landslide semantic segmentation.
In the landslide domain, GEOBIA has become a popular method for semantic image analysis due to the integration of different data types in very high spatial resolutions. The automatic identification of specific landslide and geomorphologic features [20,21] have been studied in the literature and GEOBIA has already proven its strength (Martha et al., 2010). Many studies have used spectral information combined with Digital Elevation Model (DEM) derivatives to delineate landslide bodies within satellite images utilizing a non-seeded region growing segmentation algorithm in commercial software [22,23,24,25]. Furthermore, the study by [26] proposed a workflow for landslide mapping from satellite images using open-source tools with a mean shift segmentation. Earlier, Ref.[27] had successfully segmented glacier surfaces form Airborne Laser Scanning (ALS) data using a seeded region growing segmentation based on DEM derivatives and laser intensity. Other landform applications of GEOBIA include the mapping of drumlins [28] and gully-affected areas [29].
However, landslide segmentation for object-oriented analysis can be even more detailed, when utilizing UAV-derived data, to segment individual landslide elements. Recently, Ref.[30] utilized UAV photogrammetry to produce 2.5D representations of two landslide cases at a site-specific scale. The authors used GEOBIA to segment and classify distinct landslide features such as the scarp, depletion and accumulation zones as well as anthropogenic structures that constitute elements at risk within the landslide scene. The segmentation performed in a multi-dimensional feature space consisted of spectral, topographic, and geometric features using a non-seeded region growing algorithm. Their approach aimed to propose a framework for targeted landslide mapping and quantified characterization of specific semantic zones.
Given the advantages of GEOBIA and the ever-increasing availability of high-resolution 3D point clouds, a new approach to object-oriented analyses of landslide scenes, based on direct point cloud segmentation is proposed by [31]. The development of distinct 3D object entities represents an advantageous approach for analyzing natural scenes because points can be meaningfully partitioned into networked homogeneous entities that carry their full semantic information. Nonetheless, direct 3D data processing is more complicated than image processing and requires proficiency. To date, very few studies have used Object-Oriented Point cloud Analysis (OBPA) of landslide scenes. Preliminary efforts using LiDAR point clouds include: (a) segmentation of rotational landslides into individual geomorphologic zones and vegetation based on a seeded region growing algorithm using point-based geometric descriptors [32], and (b) segmentation of a multi-hazard railway rock slope including debris channels, steep rock outcrops, rock benches, and transportation infrastructure using voxel-based features and a non-seeded region growing segmentation in 3D [2].

2. Material and Methods

In this study, the derivatives of close-range UAV photogrammetry are employed to produce 2-, 2.5-, and 3-dimensional coloured terrain representations of landslide cases at different settings. Superpixel/supervoxel segmentation is applied to each model (depending on the dimensionality) examining different configurations of the algorithm used. The resulting over-segmentations are subsequently partitioned into homogenous segments utilizing an unsupervised colour-based clustering technique while different threshold values are considered. The whole segmentation pipeline is illustrated in Figure 2. Finally, all three dimensionality input models, accompanied by the varying algorithm configurations, are evaluated against expert annotated ground truth images of the sites.
This section is organized as follows: Section 2.1 includes a description of the examined sites aiming to provide the reader with a detailed overview of the geologic and geometric setting as well as the specificities associated with each landslide mechanism. Section 2.2 provides the technical details of the UAV survey and the techniques used for the generation of the multi-dimensional models, while in Section 2.3 and Section 2.4 the superpixel/supervoxel generation and unsupervised segmentation algorithms are explained, respectively, together with the examined parameter settings. Section 2.5 introduces the evaluation methodology.

2.1. Study Sites

Case 1 is located adjacent to the main road network from Karpenisi to Proussos Monastery in the Evritania region, Greece (Figure 3A). The slope has an average width of 10 m in the scarp zone and almost 70 m in the depositional zone crossed by the road. The relative elevation from the top to the toe is approximately 90 m while the hillslope is approximately 70° steep, facing north-east (NE) and located at a 780 m elevation. Geologically the test site is located in the flysch environment of the Pindos geotectonic unit, in the central part of Greece. Case 2 is located at the Red Beach of Santorini, Greece, a volcanic island in the Cyclades Archipelago, and it represents a coastal failure site (Figure 3B). The site of Red Beach constitutes part of Cape Mavrorachidi and is geologically situated in the Akrotiri Volcanic Complex [33]. The coastal erosion and the nature of the geomaterial created very steep volcanic slopes which dip up to 80° and are up to 45 m in height. The geomaterials examined here consist of medium to well-cemented scoria and compact lavas. Scoria formation is composed of alternating coarse-grained, medium cemented volcanic breccias and fine-grained, well-cemented volcanic breccias. The geotechnical properties of scoria are difficult to assess due to the friable character of rocks that contain air bubbles [34]. The brittle nature of the material in combination with the erosion processes due to enhanced wave energy and wind guts results in the area being susceptible to rockslides and rockfalls.

2.2. Digital Model Creation

For the creation of the multi-dimensional digital models, a set of UAV-derived photographs was collected for each study site. Case study research with a low-cost UAV platform was carried out at the two landslide sites. The photogrammetric procedure was performed in four distinct stages: (1) flight planning, (2) flight execution and imagery collection, (3) Structure-from-Motion processing, and (4) Orthomosaic and digital surface model creation (Figure 4) [35]. The initial stage includes the flight route planning, which must ensure the best coverage of the target area with an adequate image frontlap and sidelap, considering the camera footprint and flight altitude. The UAV platform was programmed to hover at a constant altitude along the landslide sites to assure optimal conditions for tie-point identification and bundle adjustment [36].
At the Proussos case site, field investigations and UAV photogrammetric surveys were performed on 24 September 2020. In total, 114 photos were collected during the flight surveys with a commercial UAV platform (DJI Phantom 4 Pro) with a median of 5243 keypoints per image. Regarding the Red Beach case, 104 images were collected during field investigations during May 2020, with a median of 1485 keypoints per image. All the images were processed to the orthophoto and the DSM with 0.5 m resolution by using Pix4D photogrammetric software with WGS84 as the coordinate reference system for the data. Information on the specific photogrammetric surveys can be found in Table 1.
The orthomosaic of each site was chosen to represent the 2D geographic model which includes a Red-Green-Blue (RGB) description for each pixel in the rasterized format. Fusion of the orthomosaic with the digital surface model (DSM) adds the elevation as a fourth dimension to the pixel description, thereby creating a 2.5D model. The point cloud which retains direct 3D information of a given area was used to create the 3D model. However, due to the nature and the inherent lack of structure in the point cloud’s specific data type, a voxelization process was first implemented to assign structure in a grid-like format (for further information regarding voxelization please refer to [2]). The product of the voxelization process is a voxel grid, which is technically the 3D analogue to the pixel grid. Each voxel (volumetric pixel) represents a cube assigned the mean RBG value of the points it encloses. Similar to the pixel grid, the resolution of a voxel grid is defined as the length of the edge of the voxel. The software for the raster operations was developed in Python 3.8 programming language making use of the Python Image Library (PIL) and Rasterio, while the point cloud and voxel grid manipulation is based on Open3D [37], networkx [38], and Numerical Python (NumPy) [39] modules.

2.3. Superpixel/Supervoxel Generation

Having each study site represented by both 2-, 2.5-, and 3-dimensional coloured geographic models (Figure 4) in grid-like formats enables their tessellation into superpixels or supervoxels, depending on the grid dimensionality. The Simple Linear Iterative Clustering (SLIC) algorithm is used for this task. SLIC is a state-of-the-art superpixel generation algorithm discussed in detail by [11]. SLIC includes a local implementation of the k-means clustering algorithm to the image, thereby offering the following two advantages:
(a)
The search area is limited to a specified extent around each cluster centre rather than searching the whole image. This simplifies the complexity and makes the execution time linear in the number of pixels and independent of the value of k.
(b)
It introduces a distance measure which accounts for colour and spatial similarity simultaneously and controls the size and compactness of the superpixels.
The process starts with the initialization of the cluster centres, with spatial location controlled by the step parameter(s). Step controls the arrangement of the superpixels along a regular grid with a resolution s times coarser than the original model resolution. The pixel gradient in each cluster is then calculated within a 3 × 3 window and the cluster centre is moved to the lowest gradient position. The gradient is defined as the normalized sum of distances in feature space from all the neighbours and computed as:
G ( i ) = j = 1 k a d j | k ( i ) k ( j ) | N a d j ,
where, k is the notation for a pixel (or voxel in the 3D), i is the index of each processed element, j is the index of each element adjacent to the processed element within the defined window, and N is the total number of adjacent elements.
In SLIC, it is usually recommended to transform the RGB image into the non-linear L*a*b* colour space (L* for lightness, and a* and b* for the position between red-green and blue-yellow, respectively) where a given numerical change corresponds to a similar perceived change in colour. To keep the methodology consistent between the different models and to not introduce bias into the comparison, the authors applied this transformation to all the applications. In the case of the 2D model where the pixel is characterized by only the colour values, each cluster centre is initialized as Ci = [Li ai bi xi yi]T while in the 2.5D model case, the elevation dimension (E) is added to the clustering space as Ci = [Li ai bi Ei xi yi]T. The elevation range across the whole model is standardized in the range [0:100] which is the exact same range the parameter L (luminosity) fluctuates within.
For the adaptation of the above process in the 3D space and the generation of supervoxels, the authors developed an extension of the algorithm for application on voxel grids based on the Voxel Cloud Connectivity Segmentation (VCCS) proposed by Papon et al. (2013). Since the bounding box of a point cloud is almost never entirely occupied by points, there are several cluster seeds within the initial supervoxel grid that remain empty of points. The step parameter is still linked to the seed grid resolution and affects the supervoxel segmentation result. In this case, the centre of each non-empty supervoxel is moved to the nearest voxel while the rest are rejected. Each cluster centre is then moved to the lower gradient position calculated within a 3 × 3 × 3 window, like in the previous two cases, using Equation (1).
The colour is again defined in the CIELAB space and the cluster centres initialized as Ci = [Li ai bi xi yi zi]T with the third dimension being directly integrated in the spatial component of the distance measure which is calculated as:
D = d f 2 + ( d s s ) 2 c 2
where, df and ds denote the distance in feature space and spatial distance, respectively, s defines the step parameter, and c weights the relative importance between feature space similarity (colour or colour + elevation) and spatial proximity. The larger the value of c, the more important the spatial proximity is and so the resulting superpixels/supervoxels are more compact in shape. In contrast, lower c values lead to superpixels/supervoxels more flexible in shape. As such, c stands for compactness which is mathematically expressed as the area to perimeter ratio. In general, in CIELAB space operation, the compactness can be in the range [1:40] [11]. The c values were defined after an exploratory trial-and-error analysis for each site in a way that allows enough flexibility during the formation of superpixels/supervoxels (between 20 and 30).

2.4. Graph-Based Segmentation

Once the homogenization of the scene and the complexity reduction have been achieved, the superpixels and supervoxels represent the image unit for further processing within an object-based conceptualization. For the organization of them into meaningful objects, the authors employ a graph cut approach to assess the implementation of an unsupervised data-driven segmentation that does not require empirical knowledge.
Graph cut describes a set of edges whose removal makes the different graphs disconnected. The set of models, in their corresponding feature space, are represented by a weighted undirected graph structure G = ( V , E ) , where the nodes of the graph are associated with the superpixel or supervoxels and the edges connect adjacent nodes. Each edge ( v i ,   v j ) E is weighted by the dissimilarity between nodes v i and v j . In this implementation, colour dissimilarity is used as the edge weight w ( v i , v j ) [40,41]. This stage of the methodology aims at providing an initial estimate of the representativity of the final segments and their potential within unsupervised object-based semantic segmentation workflows from UAV models.
The normalized cut (Ncut) function is used to avoid min cut bias. This approach was developed to solve the perceptual grouping problem in vision by normalizing for the size of each segment. The normalized cut criterion accounts for both the total dissimilarity between different clusters and the total similarity within the clusters (Jianbo Shi and Malik, 2000). In this way, the methodology extracts the global impression of a scene rather than only assessing local information and its consistency in the model. The formulation of the normalized cut criterion is given in Equation (3).
N c u t ( A , B ) = c u t ( A , B ) u A , t V   w ( u , t ) + c u t ( A , B ) u B , t V   w ( u , t )
where, u A , t V   w ( u , t ) is the total weight from edges connecting the nodes in A to all the nodes in the graph, and u B , t V   w ( u , t ) is for all the nodes in B.

2.5. Multi-Dimensional Assessments

The landslide sites described in Section 3.1 are both used in the evaluation phase as they introduce diversity in slope geometry, failure mechanism, and rock types. The evaluation of the multi-dimensional UAV-derived terrain representations for each case is carried out in both stages of the segmentation pipeline presented in Figure 2. Expert-based annotations were prepared for the sites to be used as references for the comparisons. These annotations include geologic/geomorphologic landslide features such as the scarp, depletion zone, accumulation zone, coastline, and rockfalls as well as anthropogenic features such as roads threatened by the landslide activity. The authors project the 3D segment boundaries to the top-view plane for the comparisons with the raster-based segmentations using the methodology by [17].
Initially, the superpixels or supervoxels generated by the SLIC algorithm are evaluated for different resolutions ranging from 5 to 20 m. This aims to assess the suitability of the models as inputs to over-segmentation methods for properly generating meaningful image objects, while simultaneously reducing the complexity of a scene. Subsequently, the result of the unsupervised graph cut segmentation, considering all the different SLIC outputs, is evaluated separately. The results of different cut cost values are examined representing three orders of magnitude (0.01, 0.1, and 1) to assess the sensitivity of the outputs in complex natural terrains such as these active landslide slopes.

3. Results

This section details the segmentation results of the experimental analyses conducted in the two different landslide scenes introduced in 3.1. Each of the two steps of the segmentation pipeline (Figure 2) is thoroughly analyzed using the multi-dimensional UAV-derived models (Figure 4) as inputs, respectively, and expert-labeled ground-truth segmentations as reference. The authors first provide insights on the generated superpixels/supervoxels under different resolutions of the SLIC algorithm. Afterwards, each of the superpixel/supervoxel assemblies is used to derive the final segmentations through normalized cut analysis.

3.1. Evaluation Metrics

The most important property of a segmentation algorithm is the ability to generate segments able to adhere to, and not cross, real object boundaries. To assess the results quantitatively, two standard metrics called boundary recall [42] and under-segmentation error [43] are widely used in the literature [11,17,18].
However, these metrics will always provide the best scores for scenes segmented into many small segments, which is undesirable [18]. The objective of any segmentation technique is to provide the best scores with the least possible number of segments, and it is commonly preferred for the metric to be plotted against the number of segments. However, due to the fact that the number of segments increases exponentially by adding the third dimension of elevation and to keep the comparison unbiased, the authors plot the scores against the over-segmentation resolution which is directly related to the number of formed segments. The lower the resolution, the fewer the SLIC segments and the higher the cut cost, the fewer the final segments.

3.1.1. Boundary Recall

Boundary recall (BR) measures what fraction of the ground truth edges fall within at least two pixels of a segment boundary (Equation (4)). High boundary recall indicates that the segments properly follow the edges of objects defined in the ground truth labeling.
B R = T r u e   P o s i t i v e s T r u e   P o s i t i v e s + F a l s e   N e g a t i v e s

3.1.2. Under-Segmentation Error

Under-segmentation error (UE) estimates the area that corresponds to erroneous overlaps. If A is a ground truth segment and B is a generated segment that intersects A, Bin and Bout refer to the portions of B that do and do not overlap with A, respectively. Thus, the UE is calculated as follows:
U E = 1 N [ A ( B A m i n ( | B i n | , | B o u t | ) ) ]
where N defines the total number of pixels in the reference model.

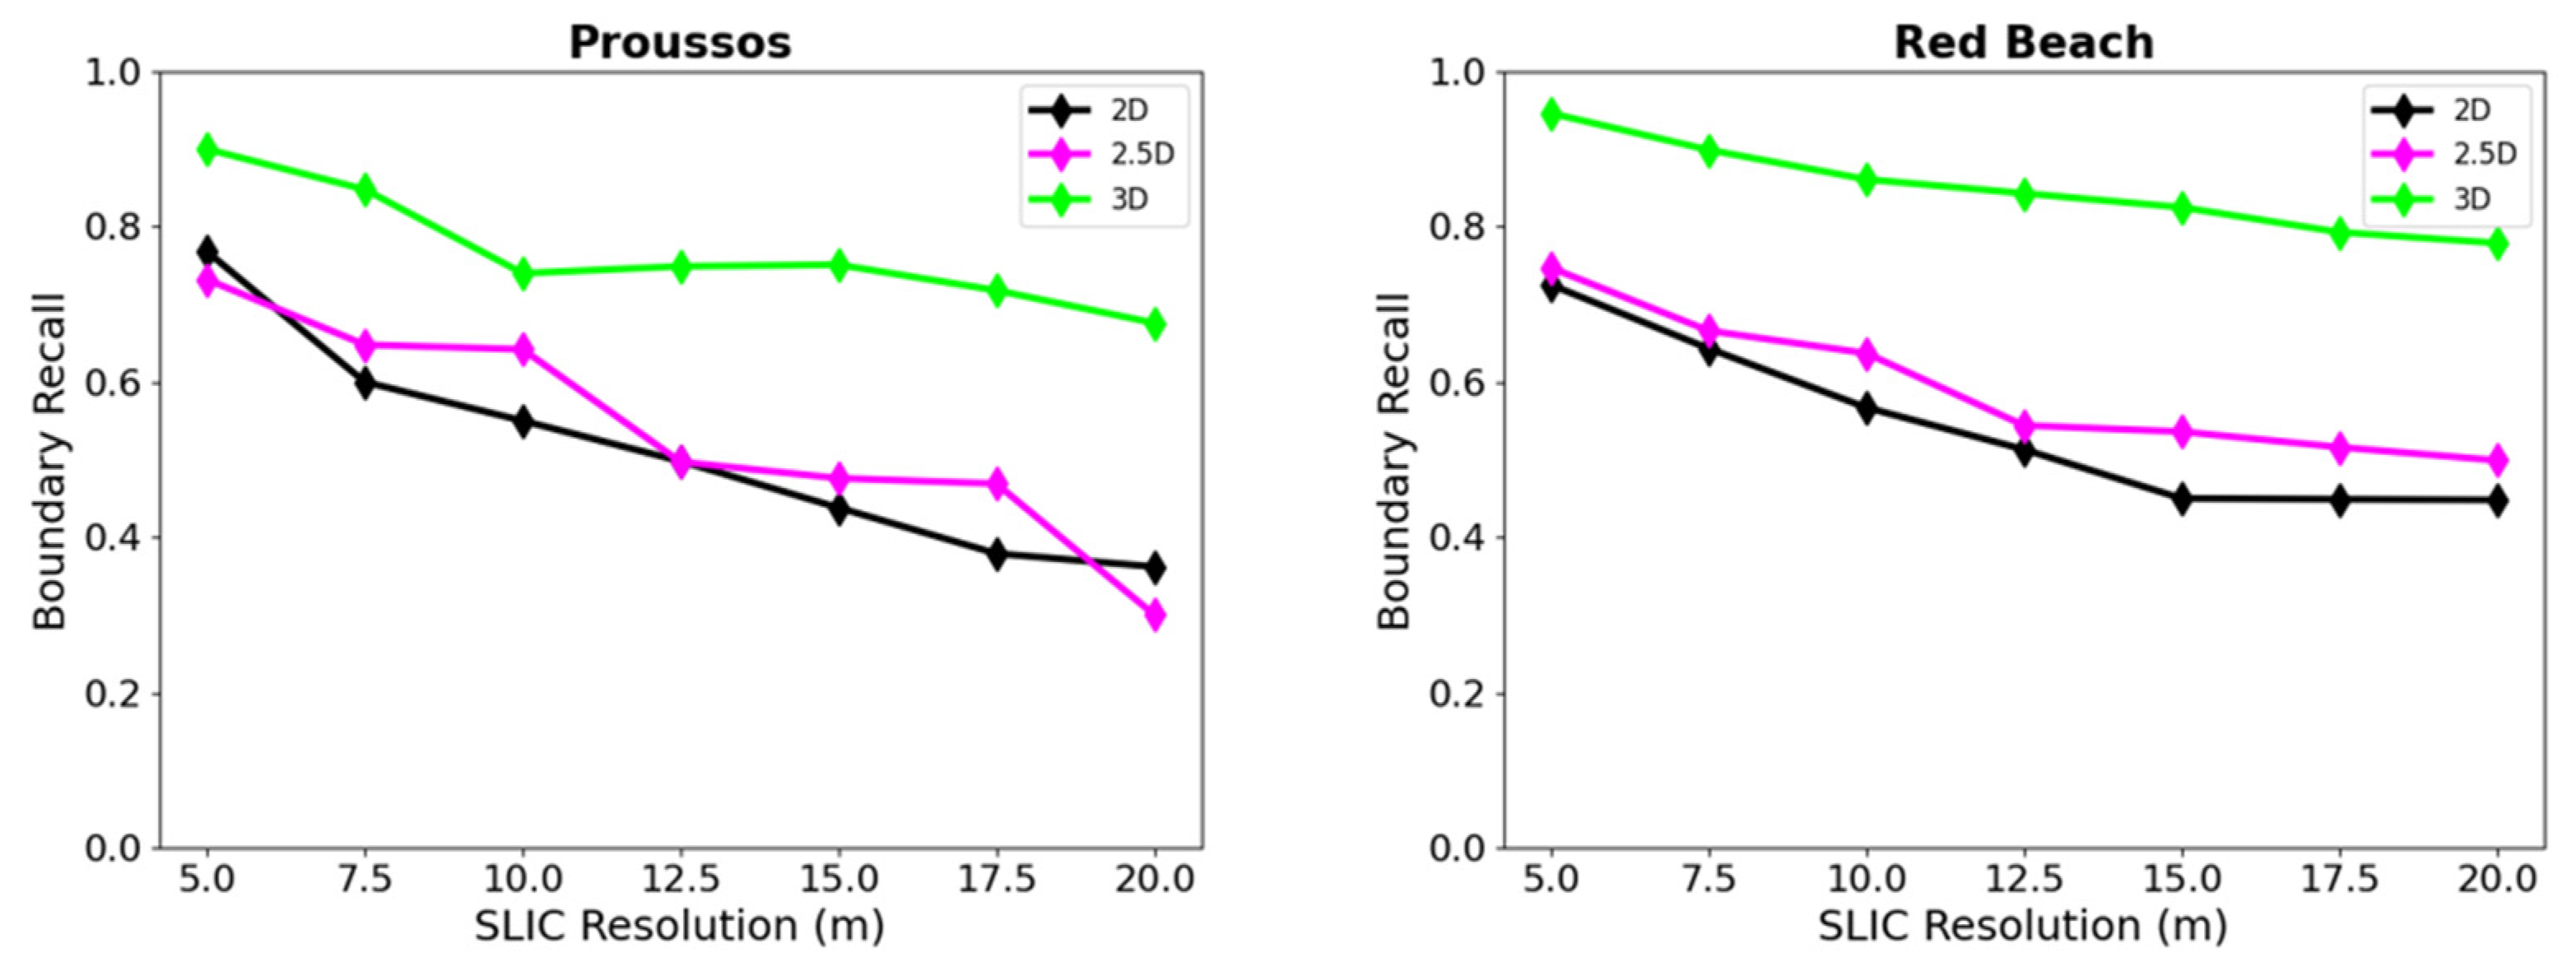
3.2. Superpixel/Supervoxel Evaluation

The SLIC algorithm was applied to the three different terrain representations (2D, 2.5D, and 3D) for each case site. Due to the fact that appropriate segmentations depend on the suitable scale of analysis, and the goal is to achieve the best boundary adherence with the least possible number of segments, a range of different superpixel/supervoxel resolutions was examined (5 to 20 m, with an interval of 2.5 m). The authors investigated the superpixel/supervoxel generation for landslide models using the multi-dimensional processing methods discussed in 3.3. Figure 5 illustrates over-segmentation results of the 2D, 2.5D, and 3D processing methods, respectively, with both a fine and coarse resolution for each. It is note-worthy that the 3D results, especially for the Red Beach case, depict a few intersected segment boundaries. This is due to three factors: (a) the noise introduced to the point cloud through the SfM process due to the sea waves which is reflected when projected to the top-down view, (b) shadowed or occluded areas that interrupt the continuity of the voxel grid and lead the supervoxel seeds to small, disconnected clusters, and (c) areas of negative slope where segments that are at different elevations intersect with each other when projected.
It was found that the 3D supervoxel algorithm generates over-segmentations with over 80% boundary recall (Figure 6) and below 20% under-segmentation error (Figure 7) for almost all the examined SLIC resolutions for both study sites. In particular, for the finer resolutions, the boundary recall exceeds 90% while the under-segmentation errors do not exceed 12%. In contrast, the boundary recall for the respective 2D and 2.5D superpixel algorithms does not exceed 80%, while it fluctuates between 30–60% for the coarser settings. The same trend is observed for the under-segmentation error too. Two-dimensional and 2.5D models produce consistently higher under-segmentation error scores than the 3D applications.

3.3. Final Segmentation Evaluation

The seven superpixel/supervoxel assemblies of each model generated in the previous step were subsequently clustered into larger segments based on the normalized graph cut segmentation (Figure 8).
To obtain a better estimate of the different models, the authors performed the segmentation with three different orders of homogeneity magnitude (i.e., 0.01, 0.1, and 1). The same trend of the superpixel/supervoxel evaluation is propagated to the output of the final segmentation. In both case studies, it was found that the 3D segmentation algorithm produces better segments for almost all the resolutions. It turns out that the incorporation of the third dimension into the 2.5D model by means of a spectral feature provides subtle improvement in the segmentation output. An example is illustrated in Figure 9 where even sub-elements such as the flanks and the crest of the landslide are separated with the 3D operations, compared to the other two models with the same configuration, maintaining a comparable number of total segments. To achieve a similar decomposition of the landslide into segments that adhere well to the sub-elements’ boundaries using either the 2D or 2.5D model, a lower resolution would be required resulting in an exponentially higher number of segments, which is undesirable.
The best segmentation scores are observed for all the models at the higher cut cost (1), which is expected since it does not allow merges to happen easily. However, great boundary recall and low under-segmentation error values are recorded for Ncut = 0.1 (Figure 10 and Figure 11). This is found in the Red Beach case especially, where the boundary recall scores fluctuate between 70–80% for all the configurations. In Figure 11, it can be observed that direct 3D operations for the segmentation of both the landslide sites decreases under-segmentation error for the Ncut = 0.1 model, which seems to be the most effective order of magnitude for these specific cases.

4. Discussion

UAVs constitute a valuable, low-cost tool for data collection in landslide research. Their ability to produce high-resolution imagery of even inaccessible areas along rock slopes in a short time places them among the most essential tools in landslide risk assessment. SfM techniques are able to generate detailed 3D terrain representations from the acquired set of images, the so-called 3D point clouds, which provide supplementary geometric and topographic information. However, point cloud processing is often tedious and conventional tools are limited. Due to this reason, processed data formats such as rasters are commonly used as 2.5D DSMs to augment the image information. With this rich information in hand, efforts towards the utilization of semi-automated or automated image analysis methods of landslide scenes have been initiated. Image analysis tasks such as segmentation have been successfully implemented within GEOBIA workflows for landslide mapping from satellite images and DEM derivatives. However, although the great advances in image segmentation have been adopted by the geoscience community for landslide mapping at the regional scale, little work has been carried out in image segmentation of landslide scenes at the site-specific scale.
In this transition from a regional to site-specific scale, the use of UAVs supports the acquisition of 3D terrain representations. This increases the amount of available information and the complexity of the scene while raising the question regarding the adequacy of simplified 2.5D models compared to fully 3D terrain representations. This study provides insights about the potential of integrating advanced 3D point cloud segmentation methods for geographic OBPA of landslide scenes. A 3D modification of a state-of-the-art image segmentation pipeline was implemented by the authors and compared to the image segmentations by both 2D and 2.5D models. It incorporates the concept of voxelization, which generates a 3D grid that can facilitate neighbourhood and metric operations, thereby maintaining the 3D character of the data throughout the segmentation process. It highlights the advantages of direct 3D point cloud processing for landslide scene segmentation in two complex cases where different site-specific elements exist.
The supervoxels formed by the point cloud-based 3D modification of the SLIC algorithm are shown to segment the two landslide scenes more appropriately than the superpixels generated with either the 2D or 2.5D model as the input raster. In contrast, no significant difference was observed between the 2D and 2.5D superpixels for any of the examined resolutions. Subsequently, the graph-based segmentation performed at the superpixel/supervoxel level was proven quite effective for fully unsupervised landslide scene segmentation with Ncut values of 0.1 (Figure 10 and Figure 11). Supervoxel-based segmentations of almost 80% boundary recall (Figure 6) and below 15% under-segmentation error were achieved (Figure 7). However, the future investigation of image segmentation algorithms applied directly on 3D space will provide a more confident estimate regarding the suitability of multi-dimensional UAV-derived models for landslide scene segmentation.
Although the complexity and lack of specialized tools may demotivate landslide experts to work with 3D point clouds directly, the results of this study encourage familiarization with advanced point cloud processing. The integration of the great advances in point cloud processing into landslide research can provide strong support to object-oriented landslide assessment at the site-specific scale. The segmentation results are proven to better agree with the expert annotations and the resulting point cloud segments can provide further information for the subsequent classification phase. For instance, areas of negative slope and overhangs become “visible”. The authors believe that object-oriented analysis using supervoxels has the potential to support intelligent landslide modelling.

5. Conclusions

UAV-derived models can be used effectively for object-oriented landslide scene analysis at site-specific scales. The detail of the obtained information coupled with advanced processing methods supports semi-automated or automated identification of landslide elements within digital models to efficiently support enhanced landslide risk management.
The experimental analysis conducted in this study shows that performing landslide scene segmentation directly on UAV-derived 3D point clouds is more effective than leveraging 2D or 2.5D images by means of the orthomosaic and DSM. Modelling the landslide scene by adding the elevation information as a fourth image band does not add much value to the segmentation compared to using only spectral information. In contrast, the ability to directly segment the 3D point cloud seems to provide a promising opening to 3D GEOBIA or GEOBPA (Geographic Object-Based Point cloud Analysis) in landslide research.
In steep terrains, such as rock slopes prone to landslides, rasterized projections of the terrain may not always capture the landscape adequately. The analysis has revealed that this type of 2.5D representation could limit the effectiveness of the segmentations of the steep boundary features of a landslide. Typical examples of such elements include the scarp and the flanks of a landslide which have proven to be more precisely segmented by directly utilizing fully 3D terrain representations and operations. The ability to operate in the 3D space may provide an opportunity to unlock the full potential of UAV surveys in site-specific object-oriented analysis of landslide scenes.
The improvement imposed to landslide scene segmentations by utilizing fully 3D modelling and processing can enhance landslide mapping and assessment procedures that employ UAVs in emergency response situations. Furthermore, future research is encouraged to build upon the findings of this study and orient their efforts towards the integration of advanced 3D segmentation methods.

Author Contributions

Conceptualization, I.F.; methodology, I.F. and E.K.; software, I.F.; formal analysis, I.F. and E.K.; investigation, I.F. and E.K.; resources, N.V., D.J.H. and V.M.; data curation, I.F. and E.K.; writing—original draft preparation, I.F.; writing—review and editing, E.K., D.J.H. and N.V.; visualization, I.F.; supervision, D.J.H., N.V. and V.M. All authors have read and agreed to the published version of the manuscript.

Funding

This research was funded by Natural Sciences and Engineering Research Council (NSERC) of Canada.

Data Availability Statement

The data presented in this study are available on request from the corresponding author.

Acknowledgments

The authors acknowledge the RMC Green Team and the Canadian Department of National Defense as well as the State Scholarships Foundation of Greece for supporting this research.

Conflicts of Interest

The authors declare no conflict of interest. The funders had no role in the design of the study; in the collection, analyses, or interpretation of data; in the writing of the manuscript; or in the decision to publish the results.

References

  1. Froude, M.J.; Petley, D.N. Global Fatal Landslide Occurrence from 2004 to 2016. Nat. Hazards Earth Syst. Sci. 2018, 18, 2161–2181. [Google Scholar] [CrossRef] [Green Version]
  2. Farmakis, I.; Bonneau, D.; Hutchinson, D.J.; Vlachopoulos, N. Targeted Rock Slope Assessment Using Voxels and Object-Oriented Classification. Remote Sens. 2021, 13, 1354. [Google Scholar] [CrossRef]
  3. Pham, T.D. Computing with Words in Formal Methods. Int. J. Intell. Syst. 2000, 15, 801–810. [Google Scholar] [CrossRef]
  4. Hossain, M.D.; Chen, D. Segmentation for Object-Based Image Analysis (OBIA): A Review of Algorithms and Challenges from Remote Sensing Perspective. ISPRS J. Photogramm. Remote Sens. 2019, 150, 115–134. [Google Scholar] [CrossRef]
  5. Blaschke, T.; Hay, G.J.; Kelly, M.; Lang, S.; Hofmann, P.; Addink, E.; Queiroz Feitosa, R.; van der Meer, F.; van der Werff, H.; van Coillie, F.; et al. Geographic Object-Based Image Analysis—Towards a New Paradigm. ISPRS J. Photogramm. Remote Sens. 2014, 87, 180–191. [Google Scholar] [CrossRef] [Green Version]
  6. Hay, G.J.; Castilla, G. Geographic Object-Based Image Analysis (GEOBIA): A New Name for a New Discipline. In Lecture Notes in Geoinformation and Cartography; Springer: Berlin/Heidelberg, Germany, 2008; pp. 75–89. [Google Scholar] [CrossRef]
  7. Radoux, J.; Bogaert, P. Good Practices for Object-Based Accuracy Assessment. Remote Sens. 2017, 9, 646. [Google Scholar] [CrossRef] [Green Version]
  8. Ye, S.; Pontius, R.G.; Rakshit, R. A Review of Accuracy Assessment for Object-Based Image Analysis: From per-Pixel to per-Polygon Approaches. ISPRS J. Photogramm. Remote Sens. 2018, 141, 137–147. [Google Scholar] [CrossRef]
  9. Kohntopp, D.; Lehmann, B.; Kraus, D.; Birk, A. Segmentation and Classification Using Active Contours Based Superellipse Fitting on Side Scan Sonar Images for Marine Demining. In Proceedings of the 2015 IEEE International Conference on Robotics and Automation (ICRA), Seattle, WA, USA, 26–30 May 2015; pp. 3380–3387. [Google Scholar] [CrossRef]
  10. Mueller, N.; Lewis, A.; Roberts, D.; Ring, S.; Melrose, R.; Sixsmith, J.; Lymburner, L.; McIntyre, A.; Tan, P.; Curnow, S.; et al. Water Observations from Space: Mapping Surface Water from 25 years of Landsat Imagery across Australia. Remote Sens. Environ. 2016, 174, 341–352. [Google Scholar] [CrossRef]
  11. Achanta, R.; Shaji, A.; Smith, K.; Lucchi, A.; Fua, P.; Süsstrunk, S. SLIC Superpixels Compared to State-of-the-Art Superpixel Methods. IEEE Trans. Pattern Anal. Mach. Intell. 2012, 34, 2274–2282. [Google Scholar] [CrossRef] [Green Version]
  12. Baatz, M.; Schape, A. Multiresolution Segmentation: An Optimization Approach for High Quality Multi-Scale Image Segmentation. In Angewandte Geographische Informations—Verabreitung XII; Strobl, T., Blaschke, T., Griesebner, G., Eds.; Wichmann Verlag: Karlsruhe, Germany, 2000; pp. 12–23. [Google Scholar]
  13. Csillik, O. Fast Segmentation and Classification of Very High Resolution Remote Sensing Data Using SLIC Superpixels. Remote Sens. 2017, 9, 243. [Google Scholar] [CrossRef] [Green Version]
  14. Hoeser, T.; Bachofer, F.; Kuenzer, C. Object Detection and Image Segmentation with Deep Learning on Earth Observation Data: A Review-Part II: Applications. Remote Sens. 2020, 12, 53. [Google Scholar] [CrossRef]
  15. Liu, S.; Chen, P.; Woźniak, M. Image Enhancement-Based Detection with Small Infrared Targets. Remote Sens. 2022, 14, 3232. [Google Scholar] [CrossRef]
  16. Keyport, R.N.; Oommen, T.; Martha, T.R.; Sajinkumar, K.S.; Gierke, J.S. A Comparative Analysis of Pixel- and Object-Based Detection of Landslides from Very High-Resolution Images. Int. J. Appl. Earth Obs. Geoinf. 2018, 64, 1–11. [Google Scholar] [CrossRef]
  17. Papon, J.; Abramov, A.; Schoeler, M.; Worgotter, F. Voxel Cloud Connectivity Segmentation—Supervoxels for Point Clouds. In Proceedings of the IEEE Computer Society Conference on Computer Vision and Pattern Recognition, Portland, OR, USA, 23–28 June 2013; pp. 2027–2034. [Google Scholar] [CrossRef] [Green Version]
  18. Ben-Shabat, Y.; Avraham, T.; Lindenbaum, M.; Fischer, A. Graph Based Over-Segmentation Methods for 3D Point Clouds. Comput. Vis. Image Underst. 2018, 174, 12–23. [Google Scholar] [CrossRef] [Green Version]
  19. Guo, Y.; Wang, H.; Hu, Q.; Liu, H.; Liu, L.; Bennamoun, M. Deep Learning for 3D Point Clouds: A Survey. IEEE Trans. Pattern Anal. Mach. Intell. 2020, 43, 4338–4364. [Google Scholar] [CrossRef]
  20. Hölbling, D.; Friedl, B.; Eisank, C. An Object-Based Approach for Semi-Automated Landslide Change Detection and Attribution of Changes to Landslide Classes in Northern Taiwan. Earth Sci. Inform. 2015, 8, 327–335. [Google Scholar] [CrossRef] [Green Version]
  21. Yang, Y.; Song, S.; Yue, F.; He, W.; Shao, W.; Zhao, K.; Nie, W. Superpixel-Based Automatic Image Recognition for Landslide Deformation Areas. Eng. Geol. 2019, 259, 105166. [Google Scholar] [CrossRef]
  22. Feizizadeh, B.; Blaschke, T. A Semi-Automated Object Based Image Analysis Approach for Landslide Delineation. In Proceedings of the 2013 European Space Agency Living Planet Symposium, Edinburgh, UK, 9–13 September 2013; pp. 9–13. [Google Scholar] [CrossRef]
  23. Hölbling, D.; Abad, L.; Dabiri, Z.; Prasicek, G.; Tsai, T.T.; Argentin, A.L. Mapping and Analyzing the Evolution of the Butangbunasi Landslide Using Landsat Time Series with Respect to Heavy Rainfall Events during Typhoons. Appl. Sci. 2020, 10, 630. [Google Scholar] [CrossRef] [Green Version]
  24. Hölbling, D.; Füreder, P.; Antolini, F.; Cigna, F.; Casagli, N.; Lang, S. A Semi-Automated Object-Based Approach for Landslide Detection Validated by Persistent Scatterer Interferometry Measures and Landslide Inventories. Remote Sens. 2012, 4, 1310–1336. [Google Scholar] [CrossRef] [Green Version]
  25. Lahousse, T.; Chang, K.T.; Lin, Y.H. Landslide Mapping with Multi-Scale Object-Based Image Analysis—A Case Study in the Baichi Watershed, Taiwan. Nat. Hazards Earth Syst. Sci. 2011, 11, 2715–2726. [Google Scholar] [CrossRef]
  26. Amatya, P.; Kirschbaum, D.; Stanley, T.; Tanyas, H. Landslide Mapping Using Object-Based Image Analysis and Open Source Tools. Eng. Geol. 2021, 282, 106000. [Google Scholar] [CrossRef]
  27. Höfle, B.; Geist, T.; Rutzinger, M.; Pfeifer, N. Glacier Surface Segmentation Using Airborne Laser Scanning Point Cloud and Intensity Data. ISPRS Workshop Laser Scanning 2007, XXXVI, 195–200. [Google Scholar]
  28. Eisank, C.; Smith, M.; Hillier, J. Assessment of Multiresolution Segmentation for Delimiting Drumlins in Digital Elevation Models. Geomorphology 2014, 214, 452–464. [Google Scholar] [CrossRef] [PubMed] [Green Version]
  29. d’Oleire-Oltmanns, S.; Marzolff, I.; Tiede, D.; Blaschke, T. Detection of Gully-Affected Areas by Applying Object-Based Image Analysis (OBIA) in the Region of Taroudannt, Morocco. Remote Sens. 2014, 6, 8287–8309. [Google Scholar] [CrossRef] [Green Version]
  30. Karantanellis, E.; Marinos, V.; Vassilakis, E.; Christaras, B. Object-Based Analysis Using Unmanned Aerial Vehicles (UAVs) for Site-Specific Landslide Assessment. Remote Sens. 2020, 12, 1711. [Google Scholar] [CrossRef]
  31. Farmakis, I.; Bonneau, D.; Hutchinson, D.J.; Vlachopoulos, N. Supervoxel-Based Multi-Scale Point Cloud Segmentation Using Fnea for Object-Oriented Rock Slope Classification Using Tls. ISPRS—Int. Arch.Photogramm. Remote Sens. Spat. Inf. Sci. 2020, XLIII-B2-2, 1049–1056. [Google Scholar] [CrossRef]
  32. Mayr, A.; Rutzinger, M.; Bremer, M.; Oude Elberink, S.; Stumpf, F.; Geitner, C. Object-Based Classification of Terrestrial Laser Scanning Point Clouds for Landslide Monitoring. Photogramm. Rec. 2017, 32, 377–397. [Google Scholar] [CrossRef]
  33. Druitt, T.H.; Edwards, L.; Mellors, R.M.; Pyle, D.M.; Sparks, R.S.J.; Lanphere, M.; Davies, M.; Barreirio, B. Santorini Volcano; Geological Society of London: London, UK, 1999; Volume 19. [Google Scholar]
  34. Marinos, V.; Prountzopoulos, G.; Asteriou, P.; Papathanassiou, G.; Kaklis, T.; Pantazis, G.; Lambrou, E.; Grendas, N.; Karantanellis, E.; Pavlides, S. Beyond the Boundaries of Feasible Engineering Geological Solutions: Stability Considerations of the Spectacular Red Beach Cliffs on Santorini Island, Greece. Environ. Earth Sci. 2017, 76, 513. [Google Scholar] [CrossRef]
  35. Westoby, M.J.; Brasington, J.; Glasser, N.F.; Hambrey, M.J.; Reynolds, J.M. “Structure-from-Motion” Photogrammetry: A Low-Cost, Effective Tool for Geoscience Applications. Geomorphology 2012, 179, 300–314. [Google Scholar] [CrossRef] [Green Version]
  36. Triggs, B.; McLauchlan, P.F.; Hartley, R.I.; Fitzgibbon, A.W. Bundle Adjustment—A Modern Synthesis. In Vision Algorithms: Theory and Practice. IWVA 1999. Lecture Notes in Computer Science; Triggs, B., Zisserman, A., Szeliski, R., Eds.; Springer: Berlin/Heidelberg, Germany, 2000; pp. 298–372. [Google Scholar]
  37. Zhou, Q.-Y.; Park, J.; Koltun, V. Open3D: A Modern Library for 3D Data Processing. arXiv 2018, arXiv:1801.09847. [Google Scholar]
  38. Hagberg, A.A.; Schult, D.A.; Swart, P.J. Exploring Network Structure, Dynamics, and Function Using NetworkX. In Proceedings of the 7th Python in Science Conference (SciPy 2008), Pasadena, CA, USA, 19–24 August 2008; pp. 11–15. [Google Scholar]
  39. Harris, C.R.; Millman, K.J.; van der Walt, S.J.; Gommers, R.; Virtanen, P.; Cournapeau, D.; Wieser, E.; Taylor, J.; Berg, S.; Smith, N.J.; et al. Array Programming with NumPy. Nature 2020, 585, 357–362. [Google Scholar] [CrossRef] [PubMed]
  40. Felzenszwalb, P.F.; Huttenlocher, D.P. Efficient Graph-Based Image Segmentation. Int. J. Comput. Vis. 2004, 59, 167–181. [Google Scholar] [CrossRef]
  41. Shi, J.; Malik, J. Normalized Cuts and Image Segmentation. IEEE Trans. Pattern Anal. Mach. Intell. 2000, 22, 888–905. [Google Scholar] [CrossRef]
  42. Martin, D.; Fowlkes, C.; Tal, D.; Malik, J. A Database of Human Segmented Natural Images and Its Application to Evaluating Segmentation Algorithms and Measuring Ecological Statistics. In Proceedings of the Eighth IEEE International Conference on Computer Vision. ICCV 2001, Vancouver, BC, Canada, 7–14 July 2001; Voume 2, pp. 416–423. [Google Scholar]
  43. Silberman, N.; Hoiem, D.; Kohli, P.; Fergus, R. Indoor Segmentation and Support Inference from RGBD Images. In Proceedings of the European Conference on Conputer Vision, Florence, Italy, 7–13 October 2012; Springer: Berlin/Heidelberg, Germany, 2012; pp. 746–760. [Google Scholar]
Figure 1. The methodology of the analysis followed for each landslide study site in the current study from raw data capture to segmentation and multi-dimensional assessment of UAV-derived models based on expert-based reference annotations. Each process is coloured by the software/technique used for the implementation while their products are mentioned in white frames.
Remotesensing 14 05668 g001
Figure 2. Step-by-step illustration of the segmentation pipeline developed for the segmentation of the multi-dimensional UAV-derived models.
Remotesensing 14 05668 g002
Figure 3. Overview of the landslide sites examined in the current comparative study for automatic segmentation via multi-dimensional UAV-derived digital models. (A): Proussos landslide and (B): the active Red Beach cliffs.
Remotesensing 14 05668 g003
Figure 4. The digital models (upper: Proussos case, lower: Red Beach case) generated by SfM photogrammetry and used as inputs to the developed segmentation pipeline. From left to right, the columns depict: the orthomosaic, the DSM showing lower elevation in cooler colours and higher elevation in warmer colours, and 3D point cloud.
Remotesensing 14 05668 g004
Figure 5. Examples of superpixel/supervoxel output. From left to right: the ground truth annotation, 2D, 2.5D, and 3D input model. Each is shown with two different superpixel/supervoxel resolutions. In the Proussos case, above, elements such as the scarp (red), depletion zone (yellow), accumulation zone (blue), road (purple), and non-affected area (green) are delineated, while in the Red Beach case, below, the annotated elements include landslide areas (green), rockfall deposits (purple), the beach (yellow), waterbody (blue), and the non-affected area (brown).
Remotesensing 14 05668 g005
Figure 6. Quantitative over-segmentation performance evaluation based on the boundary recall using SLIC for each dimensionality of the UAV-derived input digital models.
Remotesensing 14 05668 g006
Figure 7. Quantitative over-segmentation performance evaluation based on the under-segmentation error using SLIC for each dimensionality of the UAV-derived input digital models.
Remotesensing 14 05668 g007
Figure 8. Examples of superpixel/supervoxel-based normalized cut segmentation outputs. From left to right: the ground truth annotation, 2D, 2.5D, and 3D input model. In the Proussos case, above, elements such as the scarp (red), depletion zone (yellow), accumulation zone (blue), road (purple), and non-affected area (green) are delineated, while in the Red Beach case, below, the annotated elements include landslide areas (green), rockfall deposits (purple), the beach (yellow), waterbody (blue), and the non-affected area (brown).
Remotesensing 14 05668 g008
Figure 9. A characteristic example of the different outputs produced by 2D, 2.5D, and 3D segmentations for the delineation of steep sub-elements such as the flanks of a landslide. The white ellipse delineates the flank and part of the scarp, and the increasing level of important detail defined as the dimensions of the analysis increase.
Remotesensing 14 05668 g009
Figure 10. The boundary recall of the superpixel/supervoxel-based graph-based segmentation for each dimensionality of the UAV-derived input digital models.
Remotesensing 14 05668 g010
Figure 11. The under-segmentation error of the superpixel/supervoxel-based graph-based segmentation for each dimensionality of the UAV-derived input digital models.
Remotesensing 14 05668 g011
Table 1. Technical details of the UAV missions for the acquisition of each dataset.
Case 1Case 2
Number of images114104
Average flying altitude (m)5070
Image overlap (sidelap–frontlap) (%)7070
Ground resolution (m/pixel)0.0340.024
Area extent (m2)16,0003000
Point density (points/m2)348.85213.99
Point cloud points3,164,84816,888,932
Orthomosaic resolution (m/pixel)0.50.5
DSM resolution (m/pixel)0.50.5
Overall error X, Y (m)0.020.06
Overall error Z (m)0.070.09
Publisher’s Note: MDPI stays neutral with regard to jurisdictional claims in published maps and institutional affiliations.

