Article

Sliding Window Detection and Analysis Method of Night-Time Light Remote Sensing Time Series—A Case Study of the Torch Festival in Yunnan Province, China

1
School of Earth Sciences, Yunnan University, Kunming 650500, China
2
Information Center, Yunnan Tobacco Company Zhaotong Company, Zhaotong 657000, China
3
Institute of International Rivers and Eco-Security, Yunnan University, Kunming 650500, China
4
School of Resources and Environmental Science, Wuhan University, Wuhan 430079, China
*
Author to whom correspondence should be addressed.
Remote Sens. 2022, 14(20), 5267; https://doi.org/10.3390/rs14205267
Submission received: 5 September 2022 / Revised: 16 October 2022 / Accepted: 18 October 2022 / Published: 21 October 2022

Abstract

:
The spatial distribution of night-time lights (NTL) provides a new perspective for studying the range and influence of human activities. However, most studies employing NTL time series are based on monthly or annual composite data, and time series studies incorporating sliding windows are currently lacking. Therefore, using National Polar-Orbiting Partnership’s visible infrared imaging radiometer suite (NPP-VIIRS) night-time light remote sensing (NTLRS) data, VNP46A2, toponym, and Yunnan census statistical data, this study proposes a sliding-window-based NTLRS time series detection and analysis method. We extracted ethnic minority areas on the PyCharm platform using ethnic minority population proportion data and toponym and excluding data representing interference from urban areas. We used a sliding window approach to analyze NTLRS time series data of each ethnic group and calculated the cosine similarity between the NTL brightness curve of original data and the sliding window analysis result. The cosine similarity was greater than 0.96 from 2018 to 2020; we also conducted a field trip to the 2019 Torch Festival to demonstrate the applicability of the employed method. Finally, the temporal and spatial pattern of the Torch Festival was analyzed using the festival in Yunnan Province as an example. Results showed that the Torch Festival, mostly celebrated by the Yi ethnic group, was usually held on the 24th (and ranged from the 22nd to 26th) day in the sixth month of the lunar calendar (LC) every year. We found that during the Torch Festival, the greater the increase in the percentage of NTL brightness reduction in the main urban area of Kunming, the greater the percentage of ethnic minorities’ NTL brightness. The width of the sliding window can be adjusted appropriately according to the research objective, with these results showing good continuity. Our study presents a new application of the sliding window approach in the field of remote sensing, suitable for research into festivals related to night lights and fire all over the world.

Graphical Abstract

1. Introduction

The spatial distribution of night-time lights (NTL) can provide a new perspective for studying the range and influence of human activities, including their carbon footprint [1,2,3,4,5]. Night-time light remote sensing (NTLRS) is a popular research topic in the field of the National Polar-Orbiting Partnership’s visible infrared imaging radiometer suite (NPP-VIIRS), including both single NTLRS images and multiple time series images. For example, a single NTLRS image may be used to extract urban built-up areas [6] and construct a population distribution raster map [7]. Multiple NTLRS time series images can be used to detect energy service demand patterns from different religious and cultural practices [8]. A time series of NTLRS images can be employed to study social and economic development [9]. Data change information can also be analyzed; for instance, the trend information in the time series can be used to study urbanization processes and economic development [10]. Moreover, abnormal fluctuations in the time series can be used to study how rapid response situations (such as climatic disasters and wars) affect cities and people [11,12]. We can also extract regular information (periodic sub-sequence in the sequence) from data in the time series of NTLRS images to analyze the relationship between NTL and festival activities. We often ignore the floodlit facades of churches or other cultural objects, even though these neglected lights can be observed on NPP-VIIRS/day–night band (DNB) images [13]. Illuminating a building mainly serves to highlight its importance, with lights usually turned on during the celebration of large-scale events (such as traditional festivals) or at certain times of the night [14]. The use of NTLRS time series to study the mechanism and strategy of the global spread of festivals of lights is a potential application that remains unexplored. Compared to functional lighting (e.g., parking lot and street lighting), lighting used for cultural festivals or celebrations produces particularly bright emission signals [15]. However, a limitation exists in the processing of NTL data: inconsistent temporal patterns can lead to variability in NTL datasets [16]. Moreover, the period information in NTL time-series data is currently in the exploratory stage; our understanding of the humanistic and social perspectives and knowledge reflected by the lights is relatively lacking [17]. Only a few studies have been conducted on the differences in light use for cultural and festival customs, their specific influencing factors, and the resulting impacts. Furthermore, most studies employing NTL time series are based on monthly or annual composite data. For example, Stathakis et al. [18] used composite data of VIIRS for 2014, 2015, and 2016 to calculate the sum of lights in a one-year cycle and then analyzed the seasonal fluctuations in the population. However, little information exists on time series studies incorporating sliding windows.
Due to the influence of cloud cover, lunar radiation, stray light [19], seasonal effects [20,21] (changes in NTL brightness caused by snow cover in mountains, vegetation, climate, etc.), and atmospheric scattering [22], at present, most NTLRS research is based on composite NTL products. However, the complexity of the research problem has increased the demand for high-frequency observational data. Studying the daily radiance changes in NTLRS and radiance changes during festivals requires accurate time series detection. The VNP46A2 product is a further refinement of the VNP46A1 product and provides greater advantages in terms of time resolution and data quality. The VNP46A2 product uses the Black Marble algorithm [23,24] to correct data for cloud, snow, moon illumination, and stray light effects and has enhanced sensitivity to weak light structures (which is useful for detecting light changes due to festivals and holidays). It can minimize the impact of external factors (such as atmosphere and lunar irradiance) on subsequent analysis, which is of great significance for time series analysis and high-frequency observation research.
To analyze time series data, it is necessary to reduce computational complexity and effectively maintain the amount of information of the original time series. Time windows can be used in time series analysis with longer periods. There are two types of time windows: the rolling window, in which the window time is fixed; and the sliding window, in which the window width and each window’s sliding size needs to be defined. Sliding window technology processes data in segments, which can improve the efficiency of data calculation. Keogh [25] combined sliding windows with bottom-up algorithms to improve the efficiency of online segmentation algorithms. Sliding windows are widely used and are often employed in data anomaly detection and predictive analysis. When using a sliding window to detect anomalies in time series engineering data, the recall and precision of this method are both greater than 84% [26]. Yu et al. [27] used sliding windows to sub-sequence the segmentation of time series, effectively mine outliers in hydrological time series, and increase the sensitivity in anomaly detection to over 80% and the specificity to over 98%. Yan et al. [28] used a sliding window and clustering algorithm to detect transformer state abnormalities, which has high practical value in online data monitoring. Zhang et al. [29] combined the sliding window with the backpropagation (BP) neural network model to predict water quality using time series characteristics; the correlation coefficient reached 0.867 and the prediction accuracy was high. Tang et al. [30] combined the traditional long-term memory neural network and sliding window methods; updated input parameters with a 7-day cycle; and analyzed ground temperature data of Chengdu, Sichuan Province over the past 50 years, establishing a ground temperature prediction method. The absolute error was 0.6546 °C and the prediction effect was better than that of traditional the long-short-term memory (LSTM) neural network and BP neural network models. Liu et al. [31] predicted PM2.5 in Beijing based on a LSTM network model and sliding window technique. Compared to Lasso regression, support vector regression, and the XGBoost model, this method has the best prediction effect.
In studies related to light, it is necessary to accurately detect the point of sudden increase in the brightness of lights at night. This “sudden rise point” is very similar to the “abnormal point” in engineering data, so the sliding window method can be borrowed for use in the study of festivals. In data prediction, if you want to predict the accuracy of the outcome, the method used must be consistent with the real data (minimizing errors), which is the case for the sliding window method. Sliding windows have been widely used in hydrological and meteorological research but are underutilized in the field of remote sensing. Therefore, it is necessary to use a sliding window to study the time series of holidays.
The Torch Festival is a relatively large festival of the Yi, Bai, Naxi, Jino, Lahu, and other ethnic minorities in southwest China. Different ethnic groups have different origins and legends about the Torch Festival. The legend of the origin of the Torch Festival can be classified into stages of conquest, resistance, sacrifice, celebration, and commemoration [32,33,34]. The Torch Festival is regarded as the “Carnival of the East.” During this period, a torch is lit in front of every household of the ethnic minorities, such as the Yi and Bai, to celebrate [35]. Different ethnic minorities celebrate the Torch Festival on different dates. Most ethnic minorities hold the Torch Festival on the 24th day in the sixth month of the LC every year, the festival lasting for approximately three days. With the migration and differentiation of ethnic groups and the economic and cultural exchanges between ethnic groups, traditional festivals are not exclusive to a single ethnic group but have become the common festivals of multiple ethnic groups [36,37]. However, due to excessive commercialization, the culture of the Torch Festival has been misinterpreted and weakened [38,39,40,41]; even its function in the village has weakened, such that it faces the possibility of disappearance [42].
Taking the Torch Festival in Yunnan Province as an example, this study proposes a time series detection and analysis method for NTL based on a sliding window approach. It provides a new perspective for NTLRS detection and analysis methods, which is beneficial to the inheritance of national culture.

2. Materials and Methods

2.1. Materials

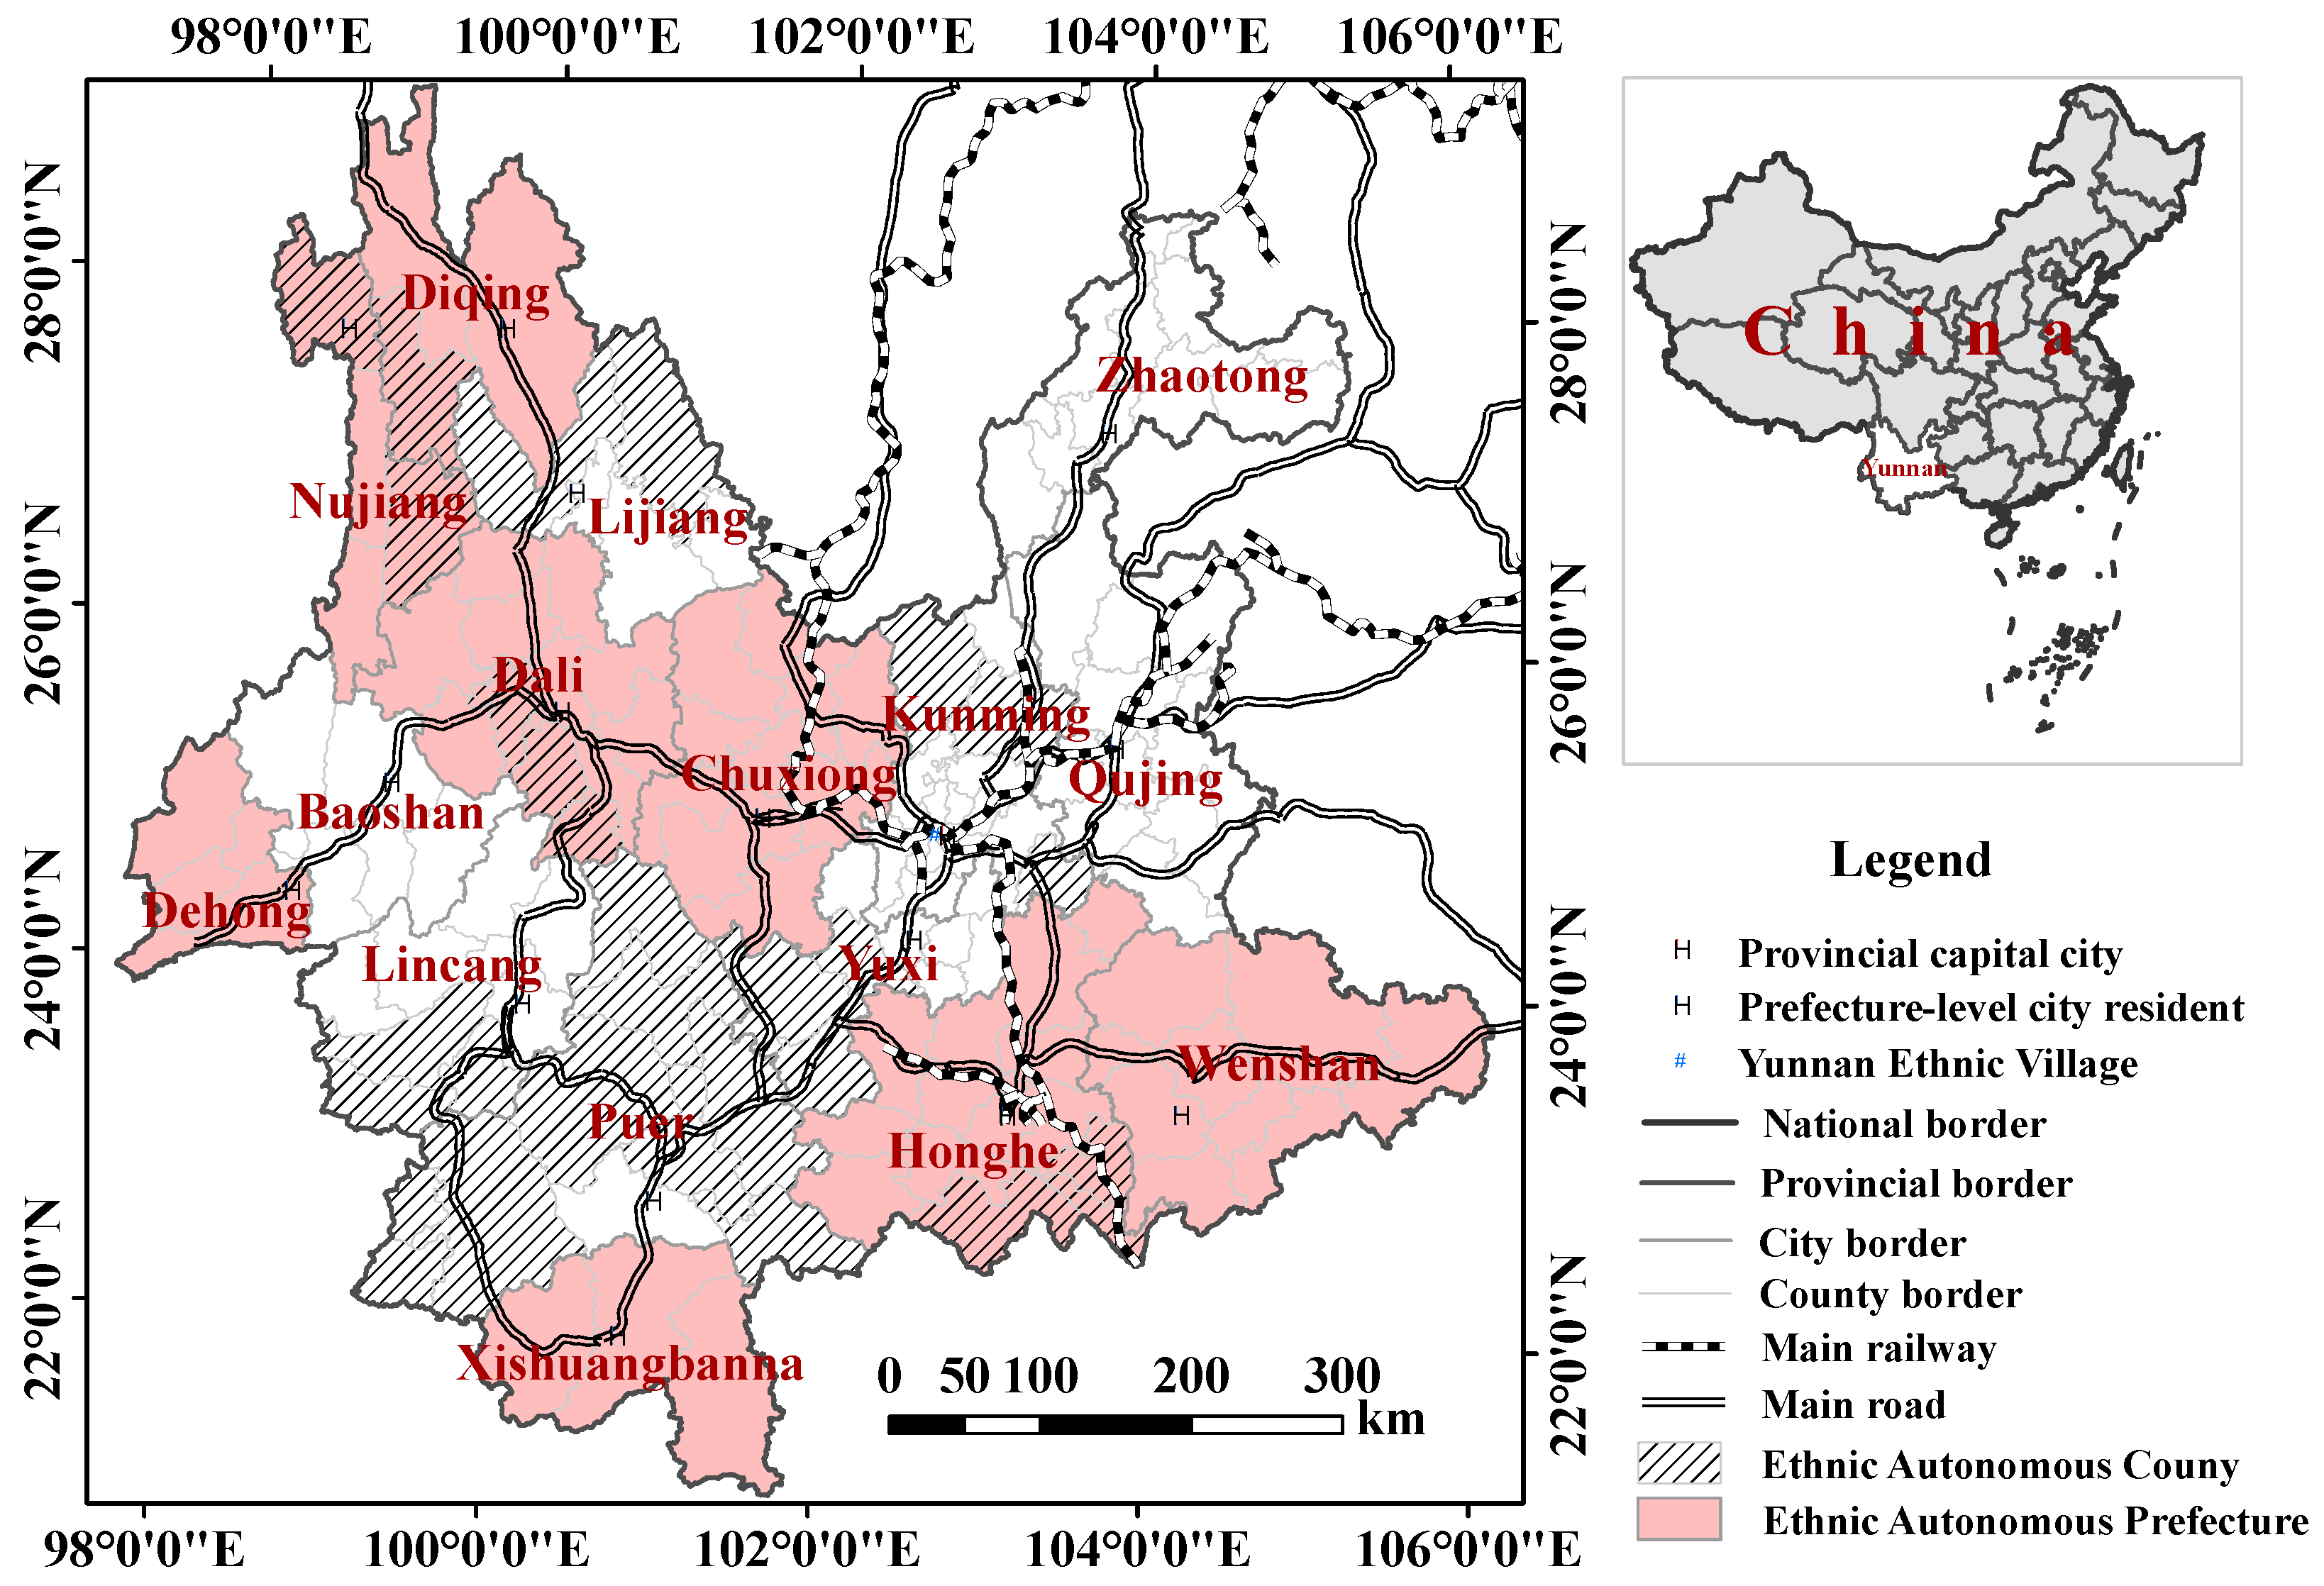
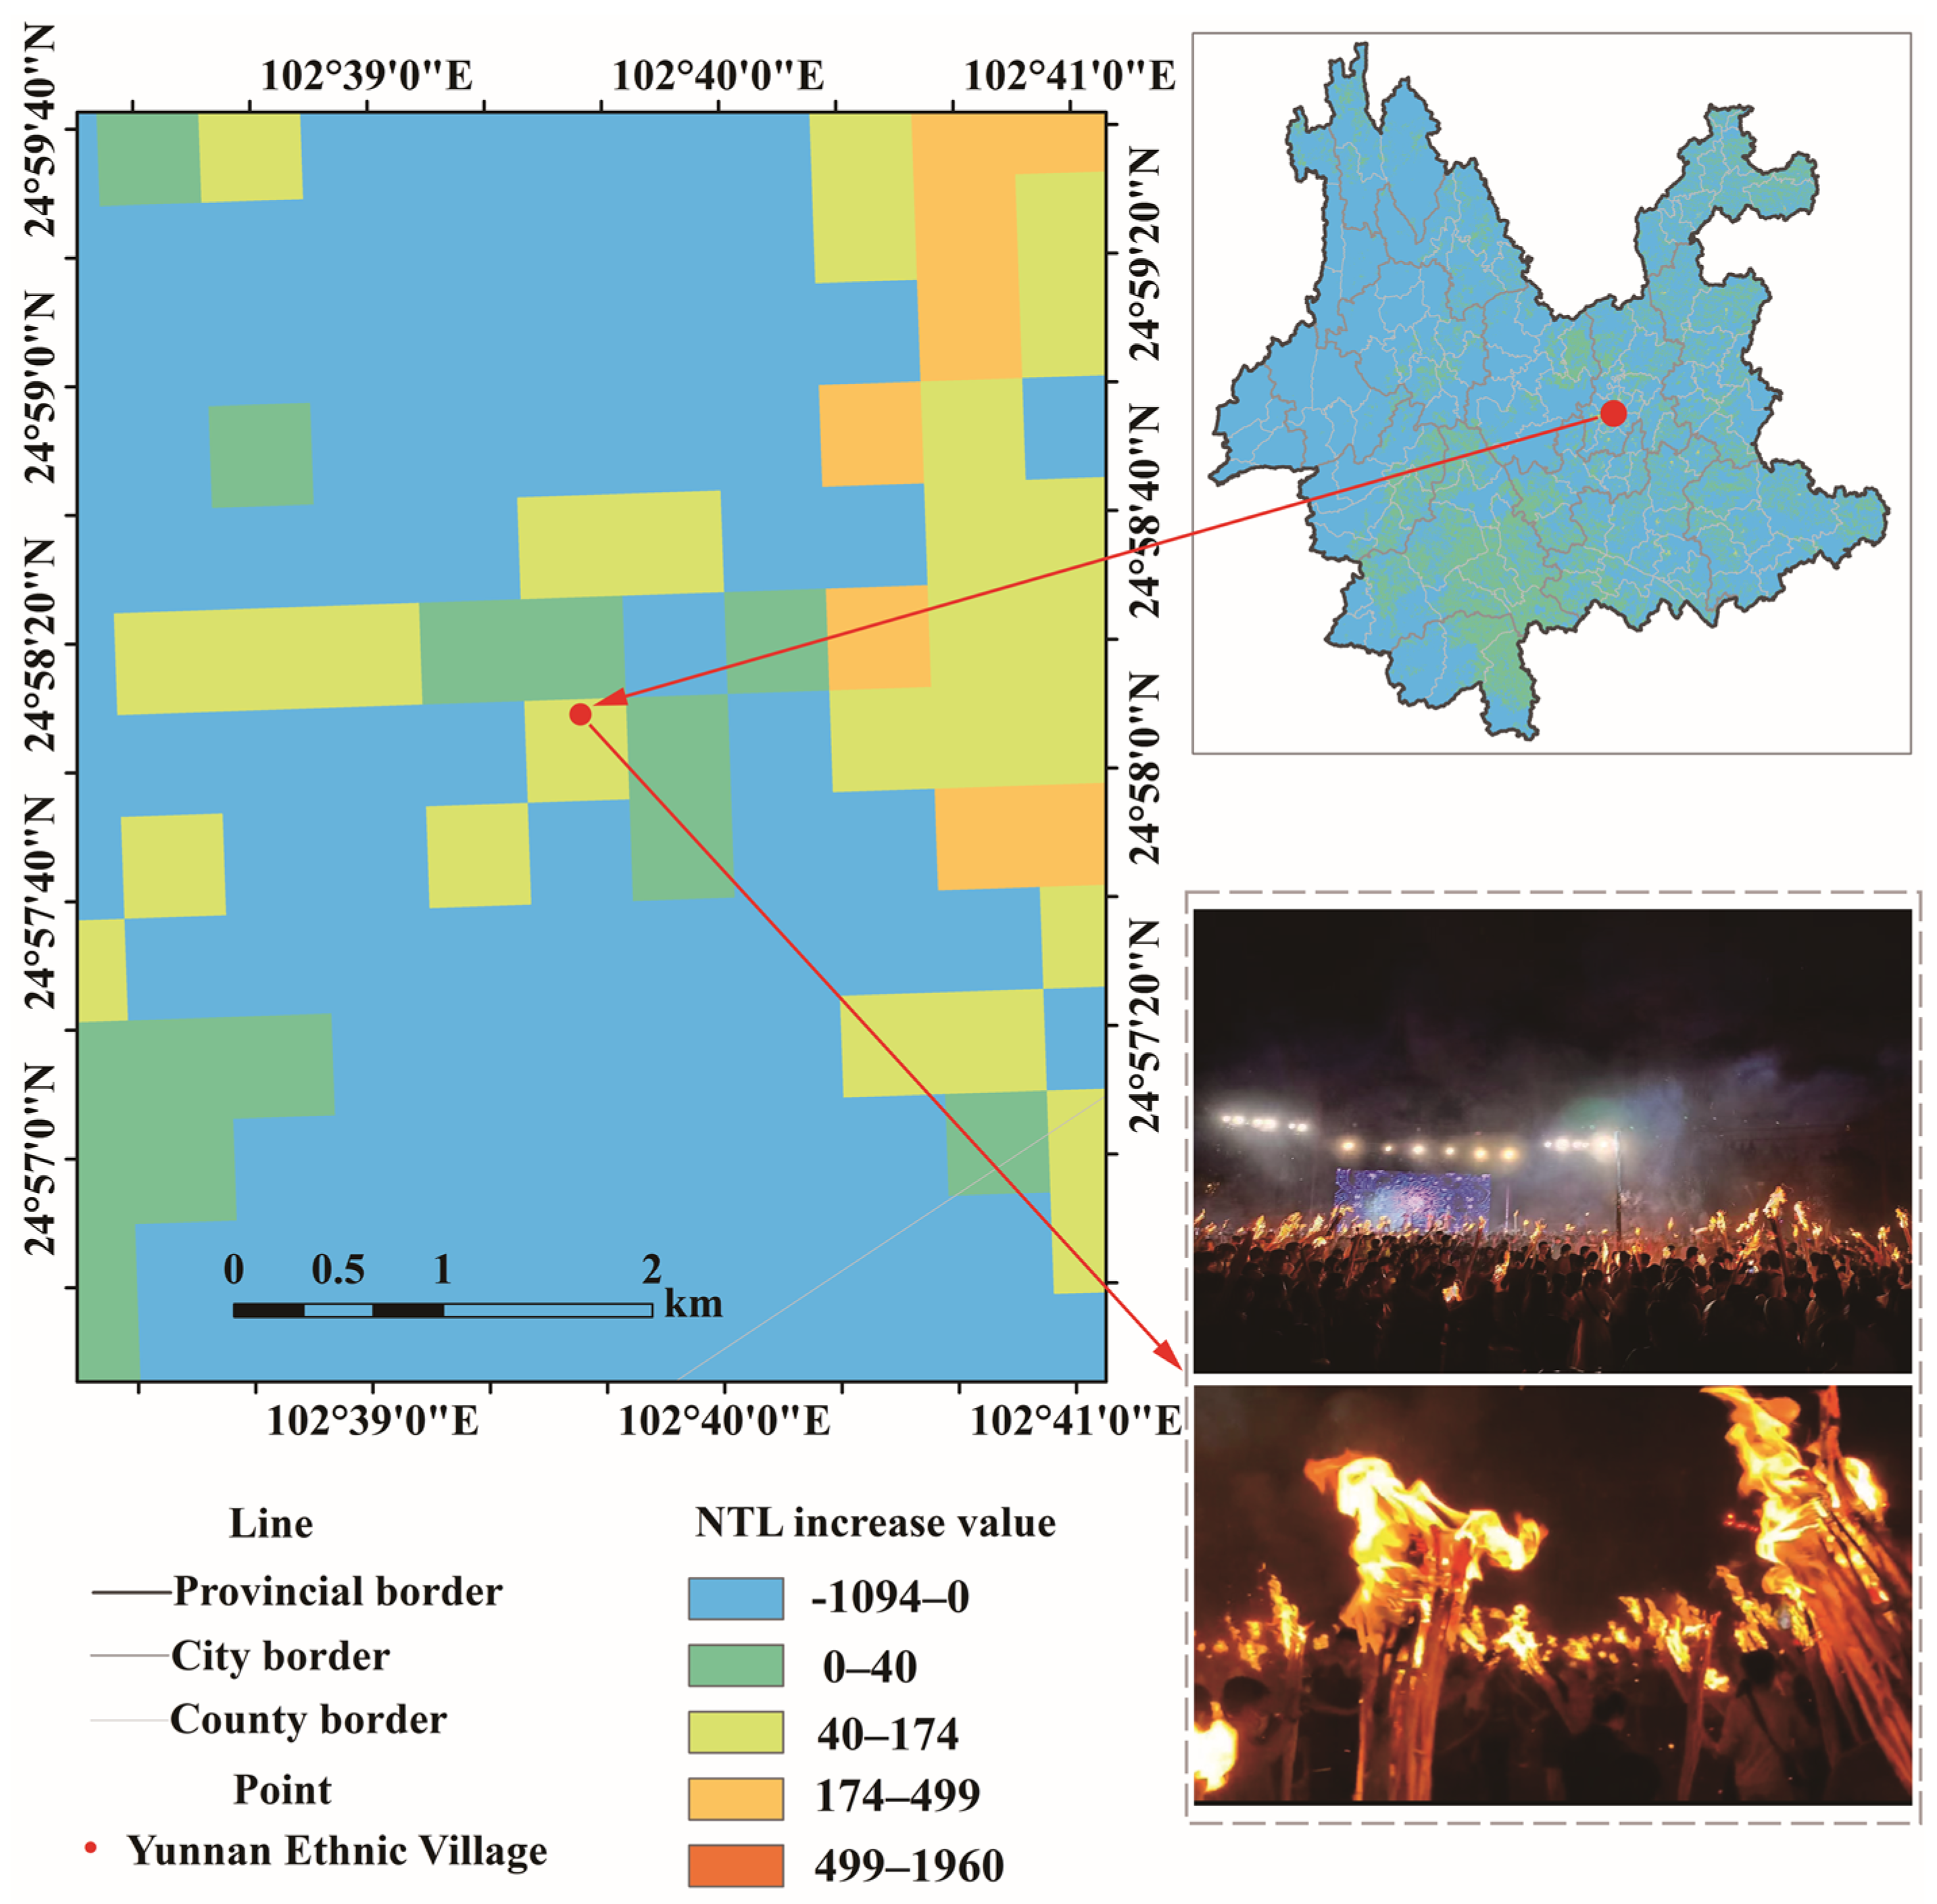
2.1.1. Research Area

Yunnan is located in southwestern China (97°31′–106°11′E, 21°8′–29°15′N). Yunnan Province, with 25 ethnic minorities, is the province with the largest number of ethnic minorities in China. Among them, 15 ethnic minorities, including Bai, Hani, Lisu, and Dulong, are unique. Moreover, the population of unique ethnic minorities in Yunnan accounts for over 80% of the total number of this ethnic minority countrywide [43]. According to the seventh national census, although the ethnic minority population has increased overall, the population for some ethnic minorities, including the Wa, Lahu, Naxi, Zhuang, and Yao, has decreased [44]. Due to the different natural environment and living customs of each ethnic group, different cultures have developed. Various traditional cultural festivals such as the Water Splashing Festival, Torch Festival, and March Street constitute unique cultural expressions in Yunnan Province.
The location of Yunnan Province in China and its administrative division are shown in Figure 1 (16 prefecture-level and 129 county-level administrative regions).

2.1.2. Data Sources

Data used in this study are as follows (information on data including their sources are shown in Table 1): (1) NPP-VIIRS NTLRS, (2) daily lunar bidirectional reflectance distribution function adjusted NTL product VNP46A2, (3) toponym, (4) Yunnan census, (5) county-level administrative division boundaries in Yunnan Province, (6) active fire data.
The NPP-VIIRS NTLRS data in this research adopts the monthly average data in the global cloud-free DNB composite data from 2018 to 2020 and synthesized data using the mean method.
We used the VNP46A2 product that is provided in the Hierarchical Data Format for the format of the Earth Observing System (HDF-EOS5). This product provides daily data from 19 January 2012 to the present. The VNP46A2 product has passed the Earth Observation Organization’s (GEO) Human Planet Program Night Product Verification (NPV) and is on file at the National Aeronautics and Space Administration’s (NASA’s) Level-1 and Atmosphere Archive & Distribution System Distributed Active Archive Center (LAADS DAAC). We downloaded data for 31 days before and after the 24th day in the sixth month of the LC from 2018 to 2020, a total of 63 days of data per year. The data downloaded for 2018, 2019, and 2020 included days 186–248, 176–238, and 195–257, respectively. All dates in this study are LC.
The census data of Yunnan Province used in the study were from the sixth national census, which has detailed information on the ethnic minority population in Yunnan Province.
The county-level administrative divisions of Yunnan Province used for the study used the 1:4 million prefecture-level administrative boundaries, which were provided by the National Basic Geographic Information Center. To unify the study projection coordinates for the convenience of subsequent use, Lambert Conformal Conic Projection was used for all research data. The parameters were set as follows: central longitude, 102°; first standard latitude, 22°; and second standard latitude, 28.3°.
Toponymic data adopts data of the second national toponym census. Toponymic data contains rich information to explain the names of specific geographical areas including the toponym, ethnic types, feature types, spatial information, and historical sources.
Active fire data uses VIIRS I-Band 375 m Active Fire Data with higher spatial resolution than moderate resolution imaging spectroradiometer because the 375 m data complement Moderate Resolution Imaging Spectroradiometer (MODIS) fire detection. The 375 m data have good consistency in hot spot detection, so it provides a greater response to fires in relatively small areas. Moreover, they also perform better at night as they can detect fires in small areas.

2.2. Methods

In this study, the detection and analysis of the NTLRS time series was conducted based on the sliding window. The research method was mainly divided into three parts. First, the NTLRS data was preprocessed to obtain the processed daily data of NTL for 2018–2020 and the annual composite data of NPP-VIIRS for 2018–2020. Second, data of ethnic minority areas were extracted. Based on the PyCharm platform, toponymic data in Yunnan Province were processed and ethnic minority toponymic data were extracted to obtain the ethnic minority toponymic dataset. Then, data of ethnic minority regions were extracted from the minority toponymic dataset and ethnic minority population data. We used annual composite data from 2018 to 2020, we cut out the urban areas from 2018 to 2020 to obtain the ethnic minority areas without urban areas in 2018 to 2020. Third, a sliding window was used to analyze the time series of NTL radiance from 2018 to 2020. The width of the sliding window was determined first; then the average of the data within the sliding window width was used as the data value for the sliding window and the cosine similarity was used to verify the sliding window method. Then, the spatiotemporal analysis of the Torch Festival in Yunnan Province from 2018 to 2020 was conducted. The technical roadmap of this study is shown in Figure 2. Technological details will be explained in the next section.

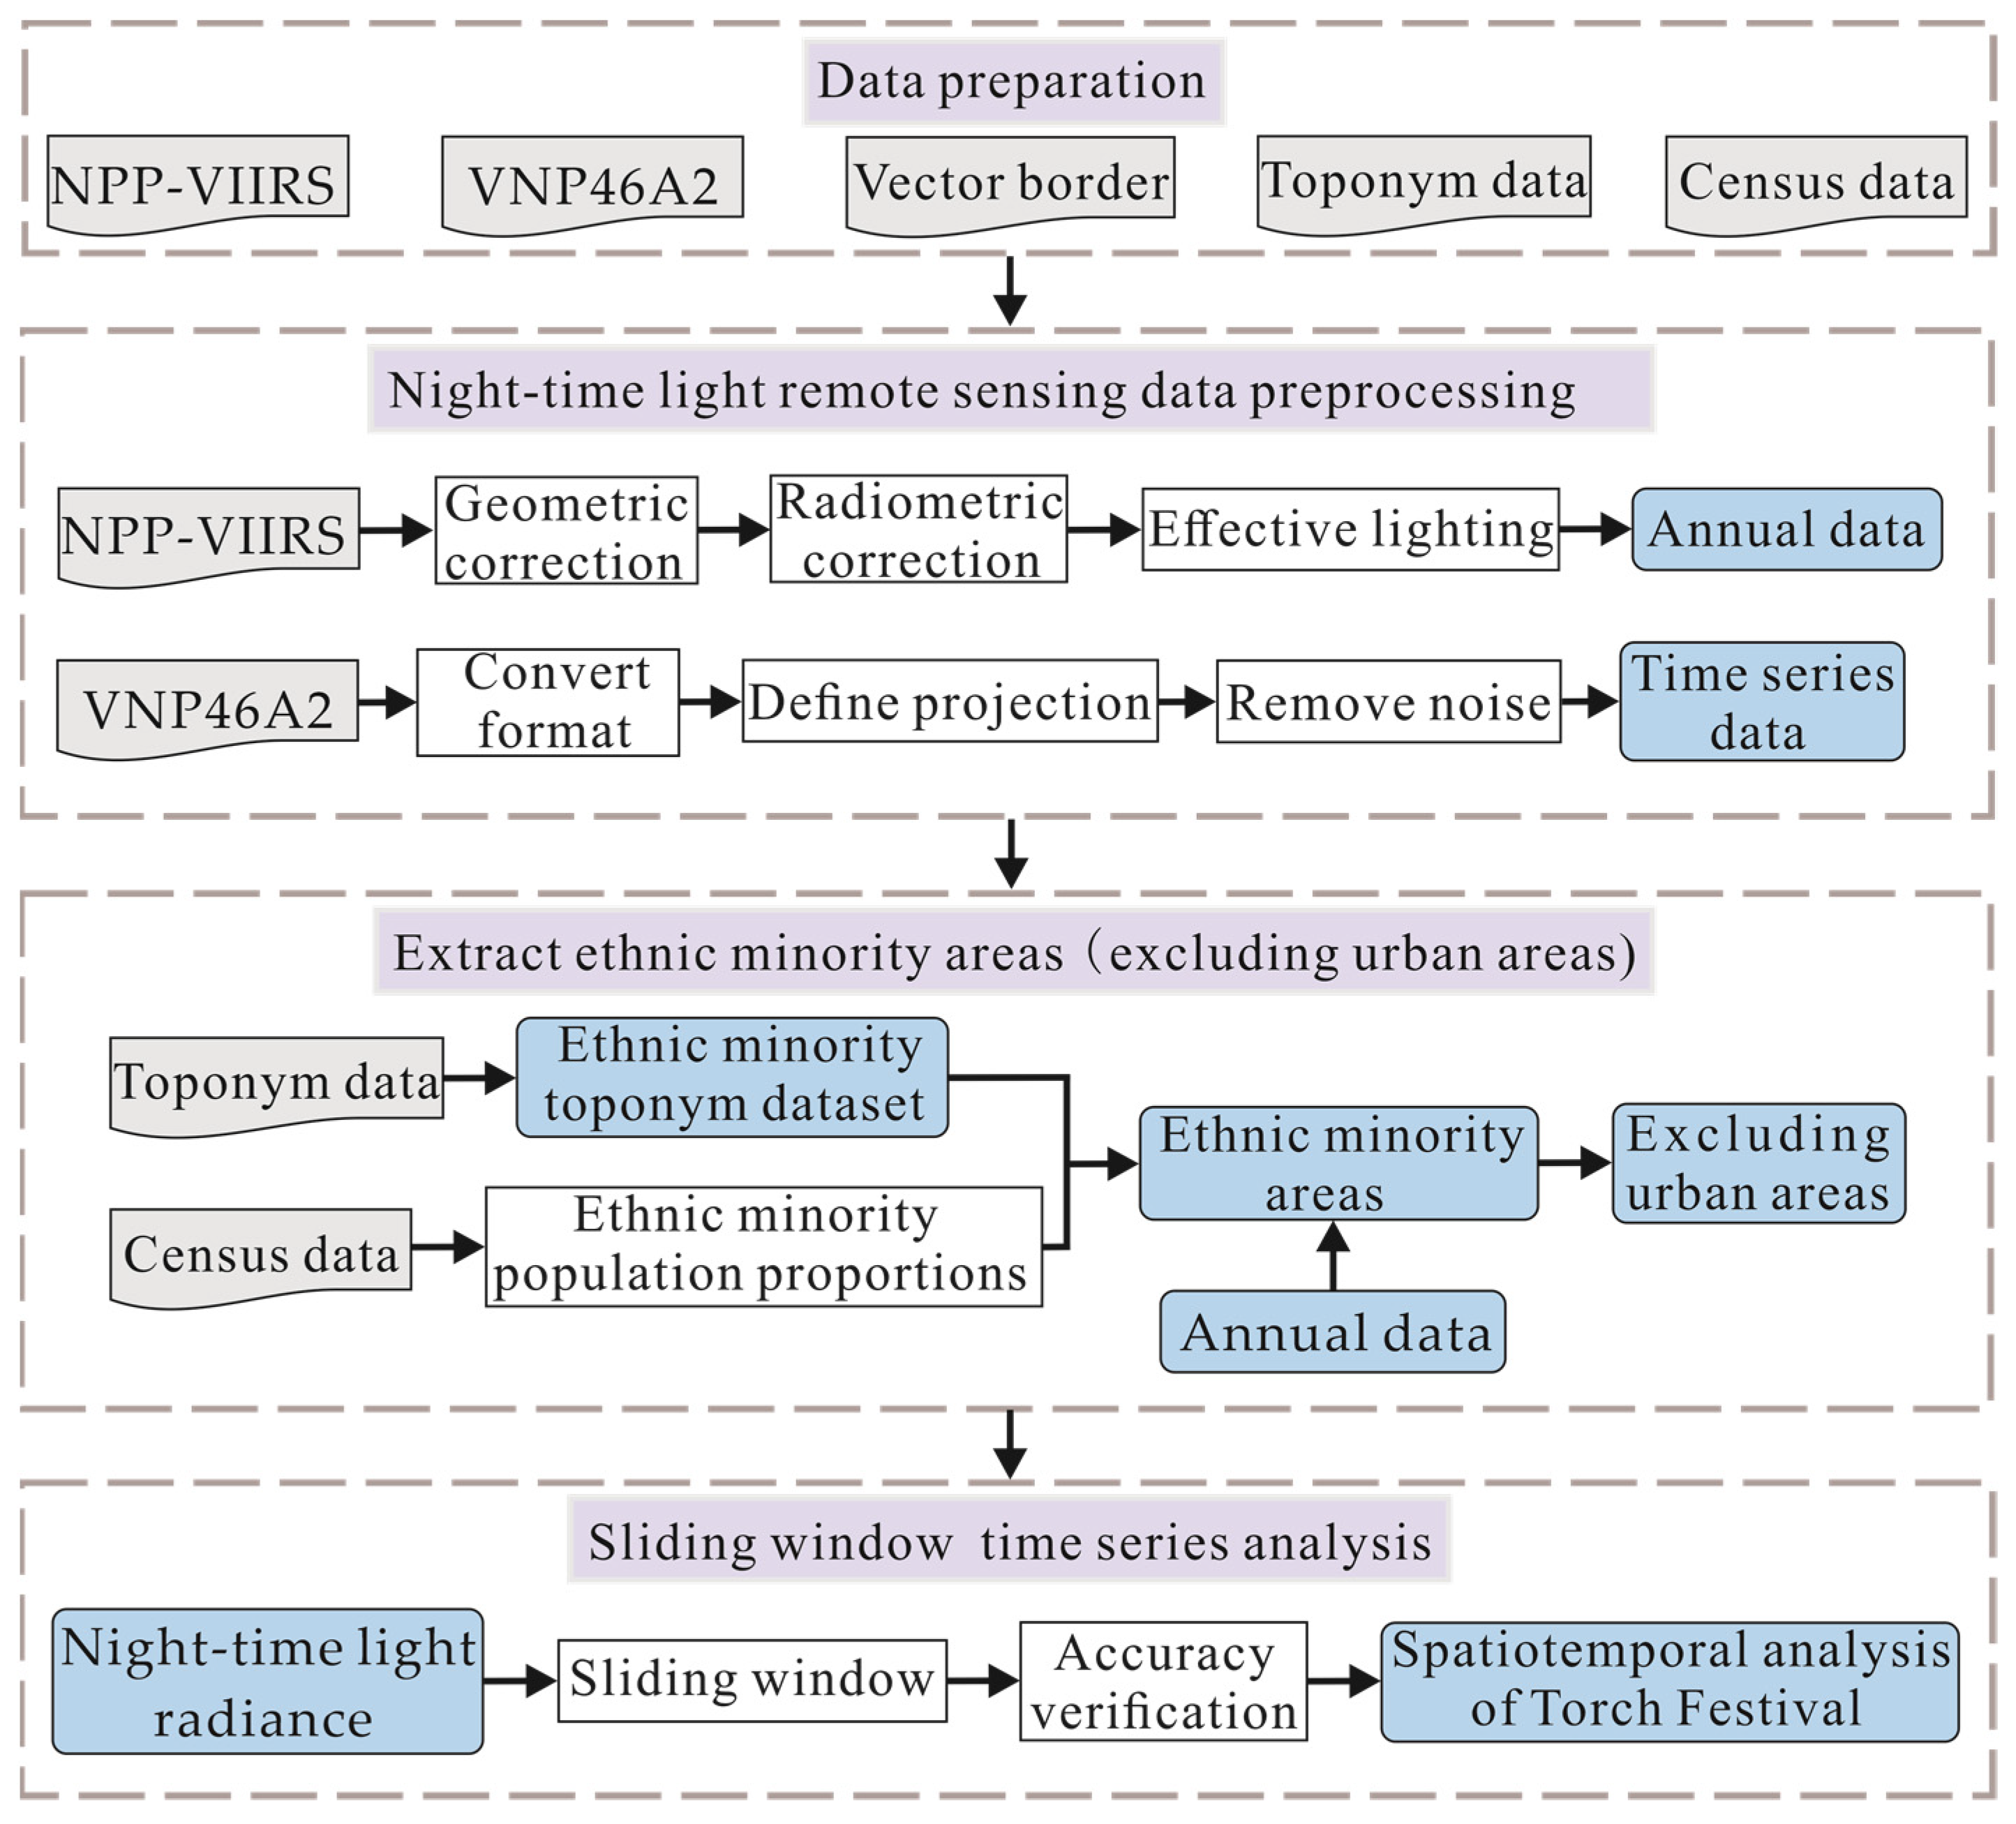
2.2.1. NTLRS Data Processing

  • VNP46A2 data processing
We downloaded VNP46A2 product in the H5 format. To perform subsequent processing, H5 must first be converted to TIFF. The downloaded data have no projection information; therefore, GCS_WGS_1984 was used as the geographic coordinate system for the data, then the image was stitched and cropped. These steps were carried out using the PyCharm platform. To eliminate residual background noise, we masked the pixel area in data where brightness was <0.5 nW/cm2/sr [45]. Image grid size was set to 500 m × 500 m for the convenience of subsequent analyses.
2.
NPP-VIIRS data processing
NPP-VIIRS cloud-free DNB composite monthly mean data for 2018–2020 were geometrically corrected using ENVI 5.3, and the image size was resampled to 500 m × 500 m. To remove the effects of background noise in the image, data were radiometrically corrected using the “RPC Orthorectification Using Reference Image” in ENVI 5.3 [46]. First, we selected the average radiance value of the cloud in the low reflectivity region of the sea surface as the calibration value for removing scattered light and subtracted the calibration value from the entire image to remove the cloud scattering. Secondly, using the adjacent aberration method, we set a threshold to obtain a stable surface area, which is used as a mask, and the radiance value of the mask area is statistically analyzed. Finally, three times the radiance value of the statistical analysis was taken as the confidence interval to remove surface scattered light. The mean method was used to synthesize data.

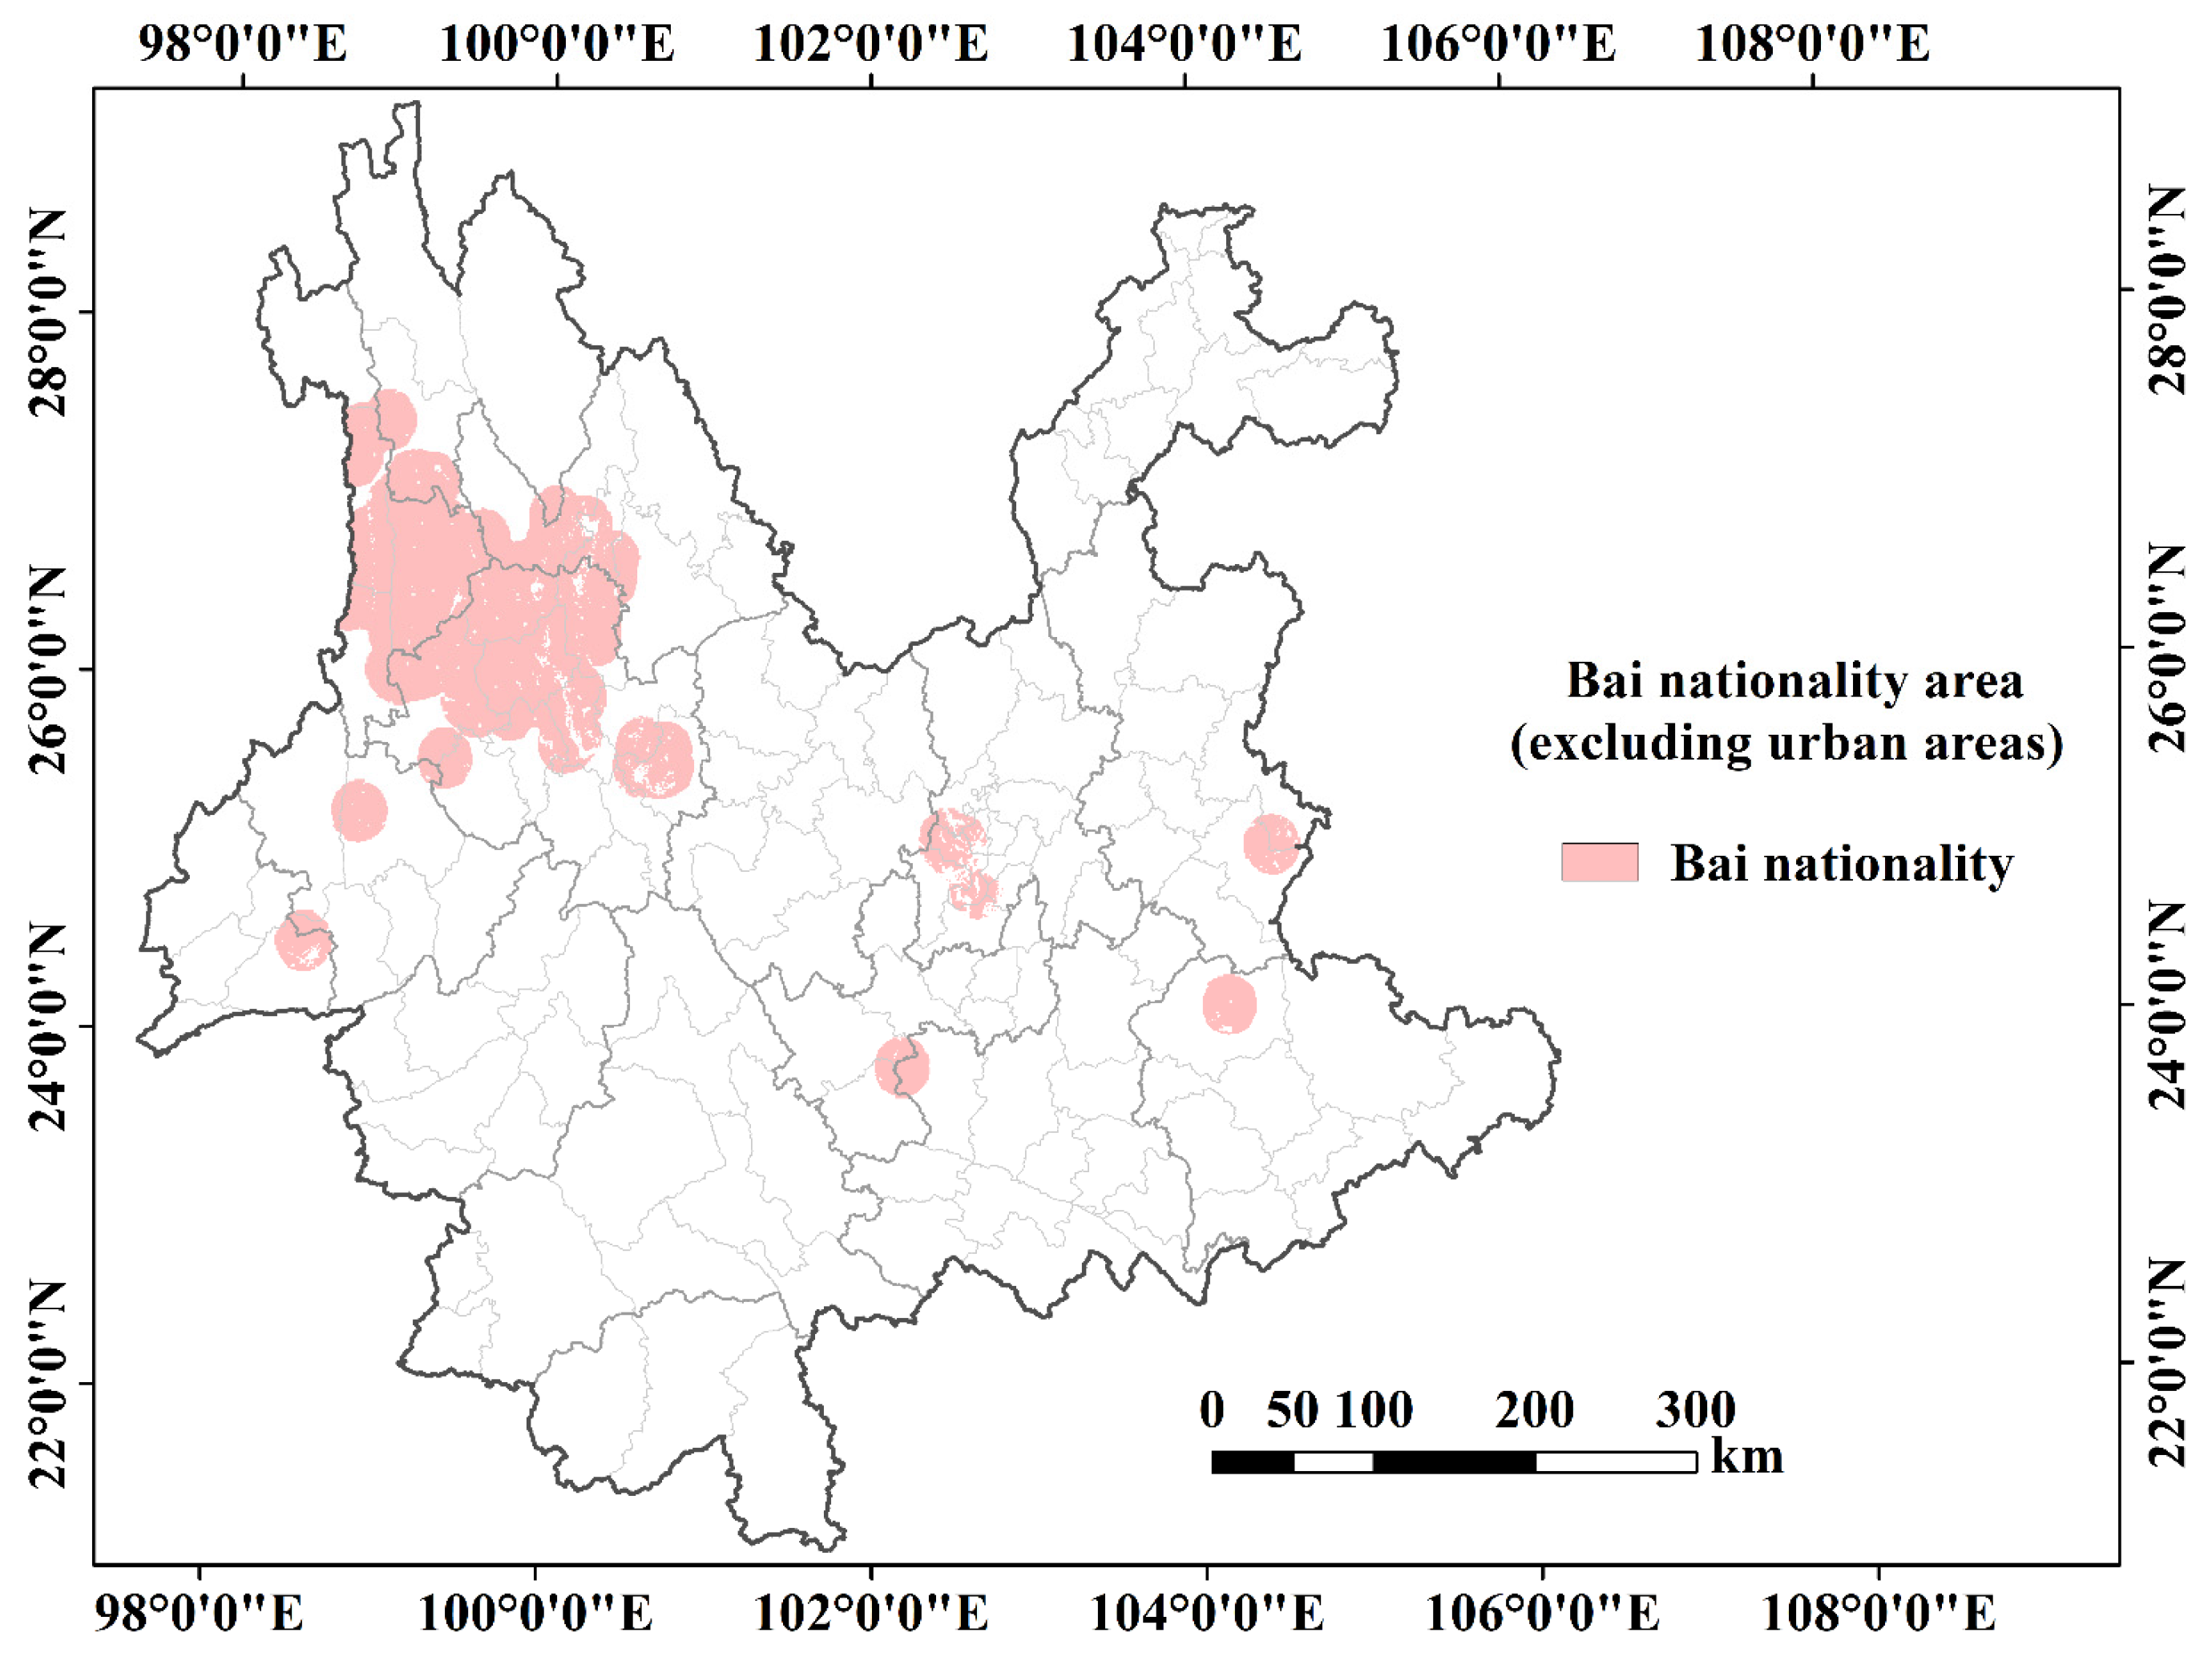
2.2.2. Extraction from Minority Areas

A place’s ethnic history can be mined from toponyms [47]. A toponym contains rich ethnic and geographic location information; toponymic data can reflect information such as ethnic characteristics, ethnic religion, ethnic culture, and other information of a region [48]. For example, through toponyms, people can identify and find target features, analyze the spatial distribution of a certain nation, and analyze the cultural landscape of a region.
Kernel density estimation is a spatial analysis method. The common kernel density estimation methods are point and line density analyses. The spatial aggregation of discrete data can be obtained by kernel density estimation. Toponyms, especially ethnic minority toponyms, are relatively scattered and the obtained toponymic data is formed of discrete observations. Therefore, kernel density estimation can be used to process ethnic minority toponyms to obtain their distribution in a continuous area as follows (Equation (1)):
f ( x ) = 1 nh i = 1 n K ( x     x i h )
where f ( x ) is the kernel density function, K ( x     x i h ) is the kernel function (integral is 1, non-negative, mean 0), h > 0 (smoothing parameter, bandwidth), x1, …, xn are n samples from independent distributions, and x − xi is the distance from the data point x to the sample known point xi.
Using the PyCharm platform, this study extracted ethnic minority toponymic data using traversal and obtained the ethnic minority toponymic dataset and preliminary living range of the ethnic minorities. Considering that there are ethnic minority toponyms in some places with no minority population living there, this study follows Zhao et al. [49], who combined the kernel density estimation results of ethnic minority toponymic data with ethnic minority population data to calculate a composite index of the two, where the final search radius in kernel density estimation is 1000 m. The formula for the comprehensive index of ethnic minority regions is shown in Equation (2):
E M i = P R i × K D E i
where EMi represents the comprehensive index of ethnic minority i, PRi represents the result of population proportion of ethnic minority i, and KDEi represents the estimation value of the toponymic kernel density of ethnic minority i.
The detected daily changes in NTL in urban areas are larger than those in other landscape features (woodlands, bare land, etc.) and rural areas [50]. In order to exclude the influence of daily night light changes in urban areas in the study, and considering that few urban areas hold torch festivals, all urban areas were excluded from this study. According to the literature [51], combined with the composite NPP-VIIRS annual average data, we calculated the comprehensive index of the NPP-VIIRS data and the value of the kernel density estimation of toponyms in Yunnan Province. The final search radius in the kernel density estimation was 1000 m; the calculation formula is shown as follows (Equation (3)):
NK i = KDEA i × NTL i
where NKi refers to the comprehensive index of the NPP-VIIRS of data point i and the kernel density estimation value of toponyms, NTLi refers to the NTL radiance results of data point i, and KDEAi refers to the kernel density estimation result of data point i.
By comparison, the NK composite index was divided into four parts using the natural break method: natural features (the lowest class on the NK index), rural areas (the third largest class on the NK index), suburban areas (the second largest class on the NK index), and urban centers (the class with the highest NK index). The third and fourth categories were merged into just urban areas by reclassification [52]. Finally, the NTL brightness value of the urban area was assigned as 0 and the areas other than the city were extracted.
To extract data of ethnic minority areas excluding cities it is necessary to reclassify the EM composite index, assigning a value of 1 to the area with a value in the composite index and assigning a value of 0 to the rest. Combined with the previously extracted areas that exclude the cities, we can obtain the ethnic minority areas that exclude urban areas. The results of the Bai nationality analysis for 2018 are shown as an example in Figure 3.

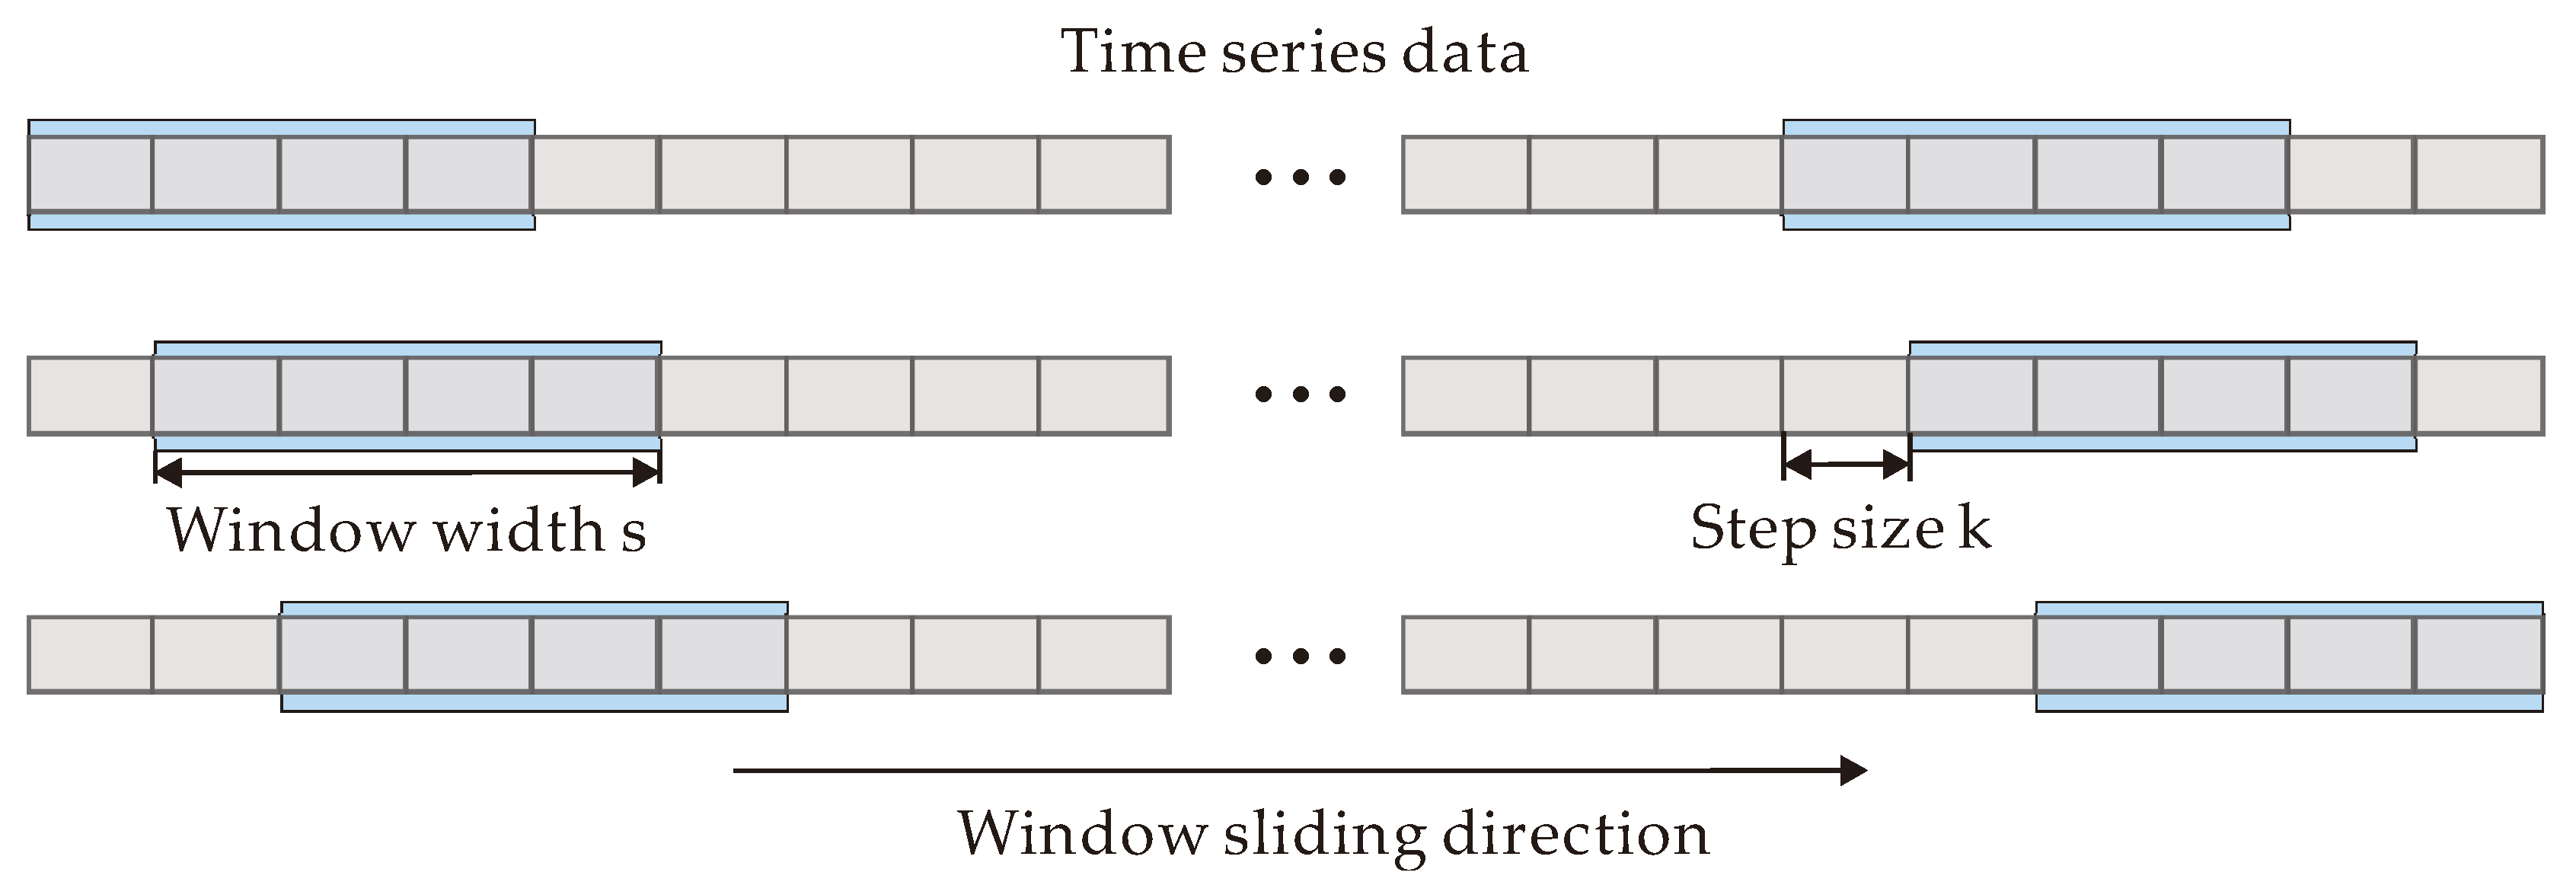
2.2.3. Sliding Window Principle and Width Determination

Generally, time series variables and the time series data of NTLRS images are non-stationary [53]. Thus, the time series variables can no longer fluctuate randomly near a constant and the range of fluctuations is unbounded. The sliding window can be used specifically for the study of such non-stationary sequences. This method first divides the time series data into several sub-sequences while reducing the computational complexity; after division, the sub-sequences can reflect the information of the original data to the greatest extent. After determining the width of the sliding window, we used the average of the data within the sliding window width as the data value of the sliding window to obtain the mutation information and inflection point information from the original data.
A time series with time length m is represented as follows (Equation (4)):
Y = ( y ( t 1 ) , y ( t 2 ) , , y ( t m ) )
where y(ti) are data obtained at time ti and the acquisition time ti is strictly increased.
In the sub-sequence segmentation process, a sliding window of length s (s << m) is used to segment the time series of equal length, then, a step size k (usually k = 1) is moved to the right, continuously sliding ( m s ) / k . Further, the [ ( m s ) / k ] + 1 sub-sequence forms equal-length fragments [20]. The working principle of the sliding window is shown in Figure 4.
The size of the sliding window width will affect the precision of the research results. The optimal sliding window width is often determined by analyzing the characteristics, changes, and experience of the time series data to reduce the dimensionality of original data. Time series analysis is generally based on similarity analysis. In this study, the principle of similarity analysis was used to analyze the NTLRS time series data. Thus, if original data are similar to the results of the sliding window analysis they are no longer needed and are replaced. This can also be seen as transforming original data into a similarity space for analysis. Algorithms such as discrete wavelet transform [54], discrete Fourier transform [55], and dynamic time warping [56] use a similar sliding window concept.
In this study, the optimal sliding window width was determined by increasing the sliding window k from 2 using the code in Li and Xiao [57], combined with the characteristics of the NTLRS daily data and the duration of the Torch Festival.

3. Results

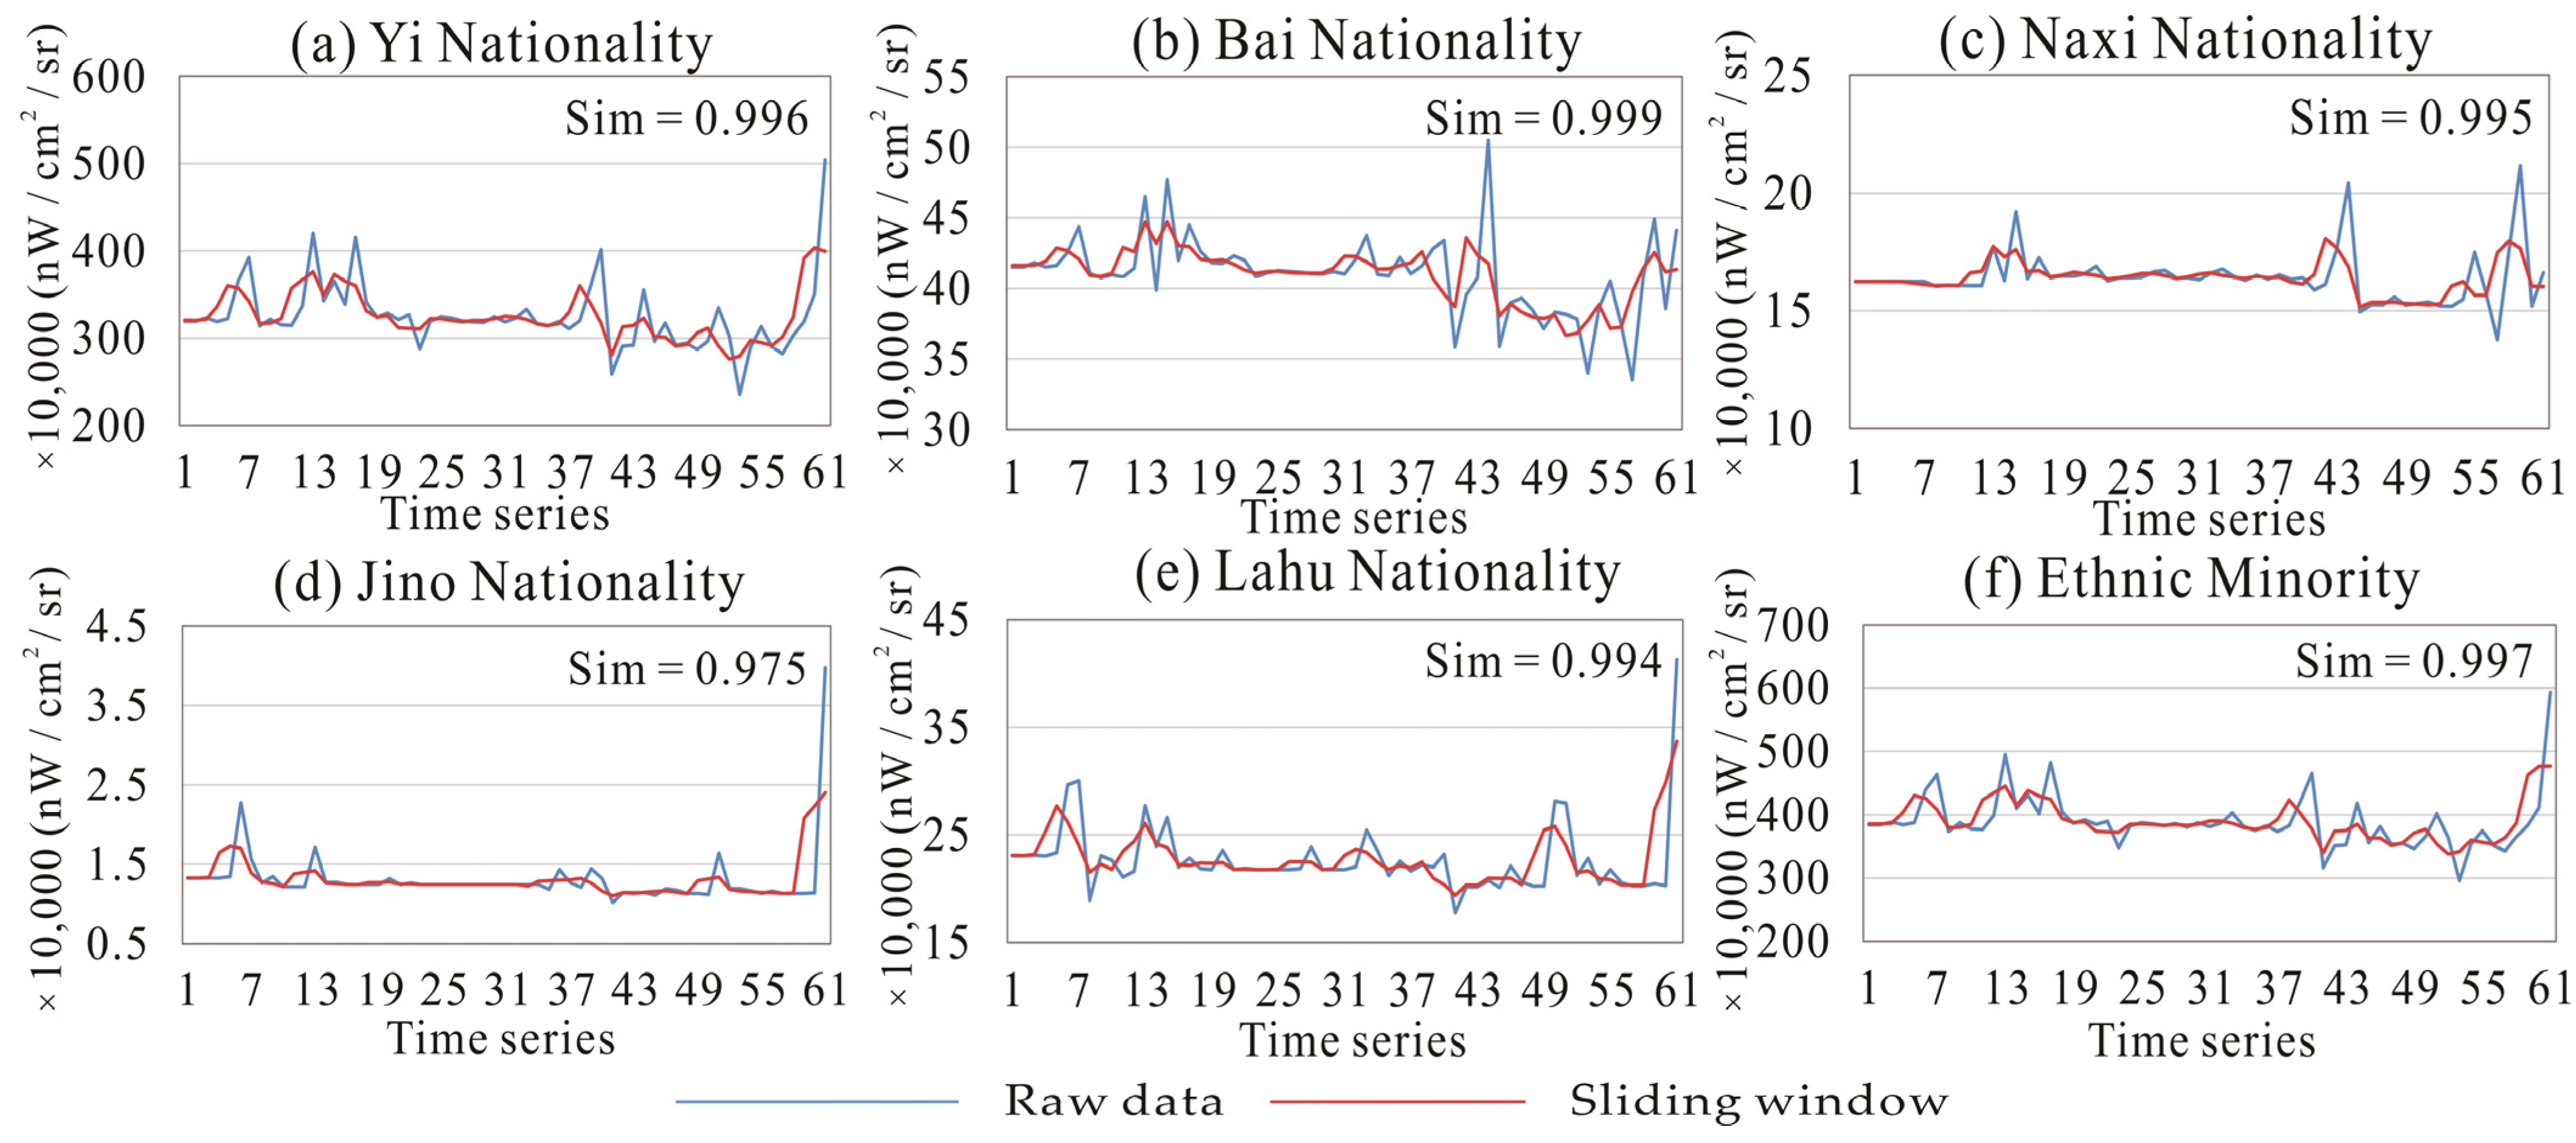
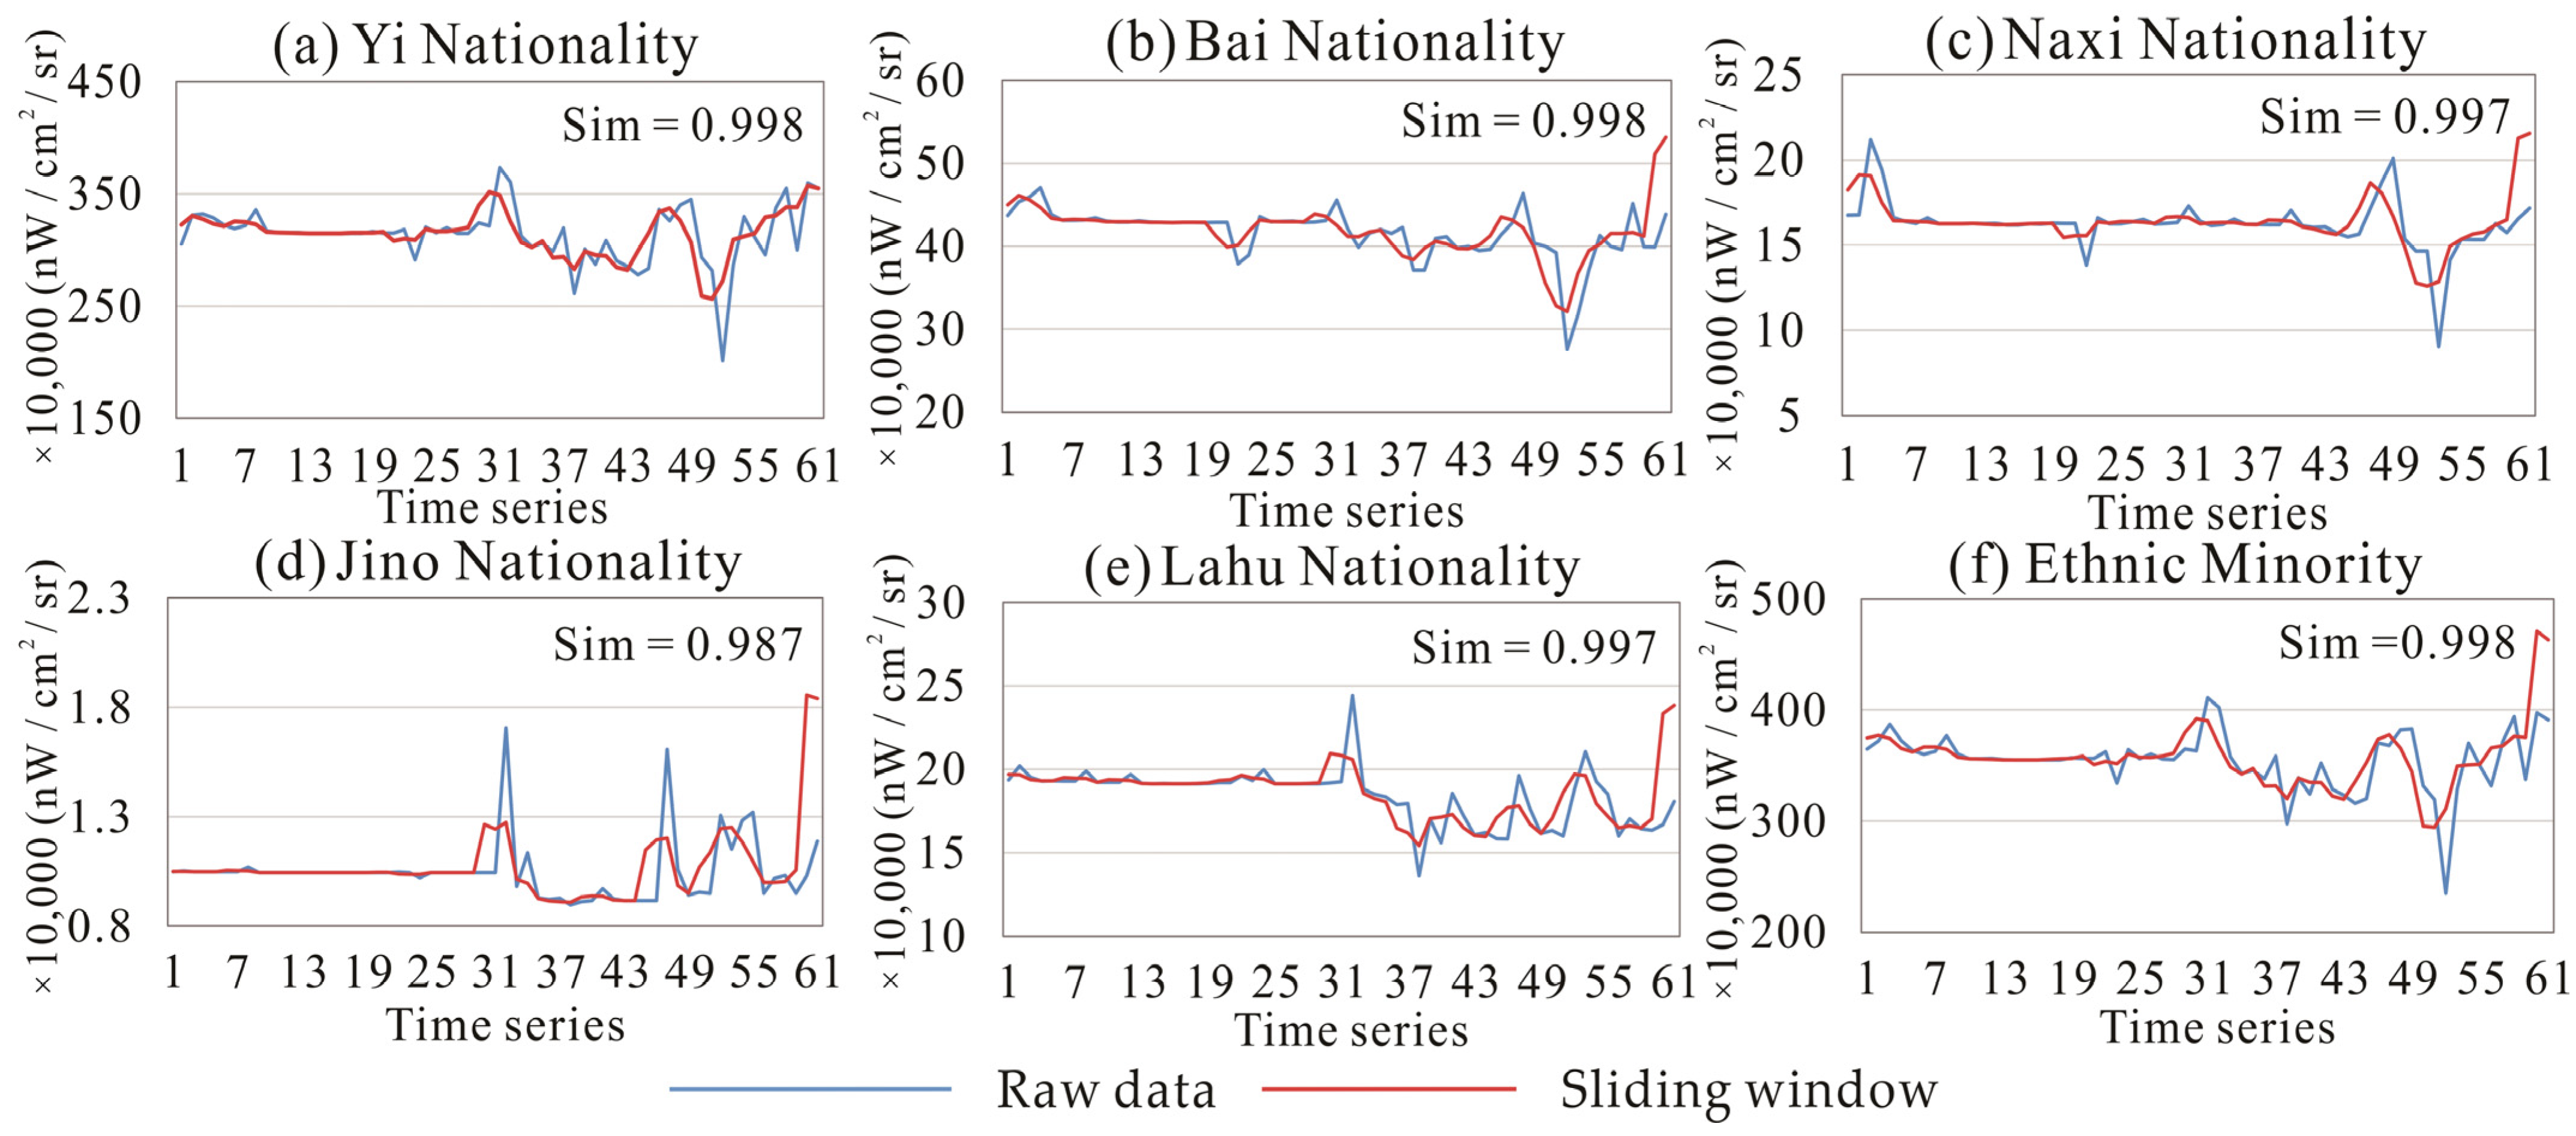
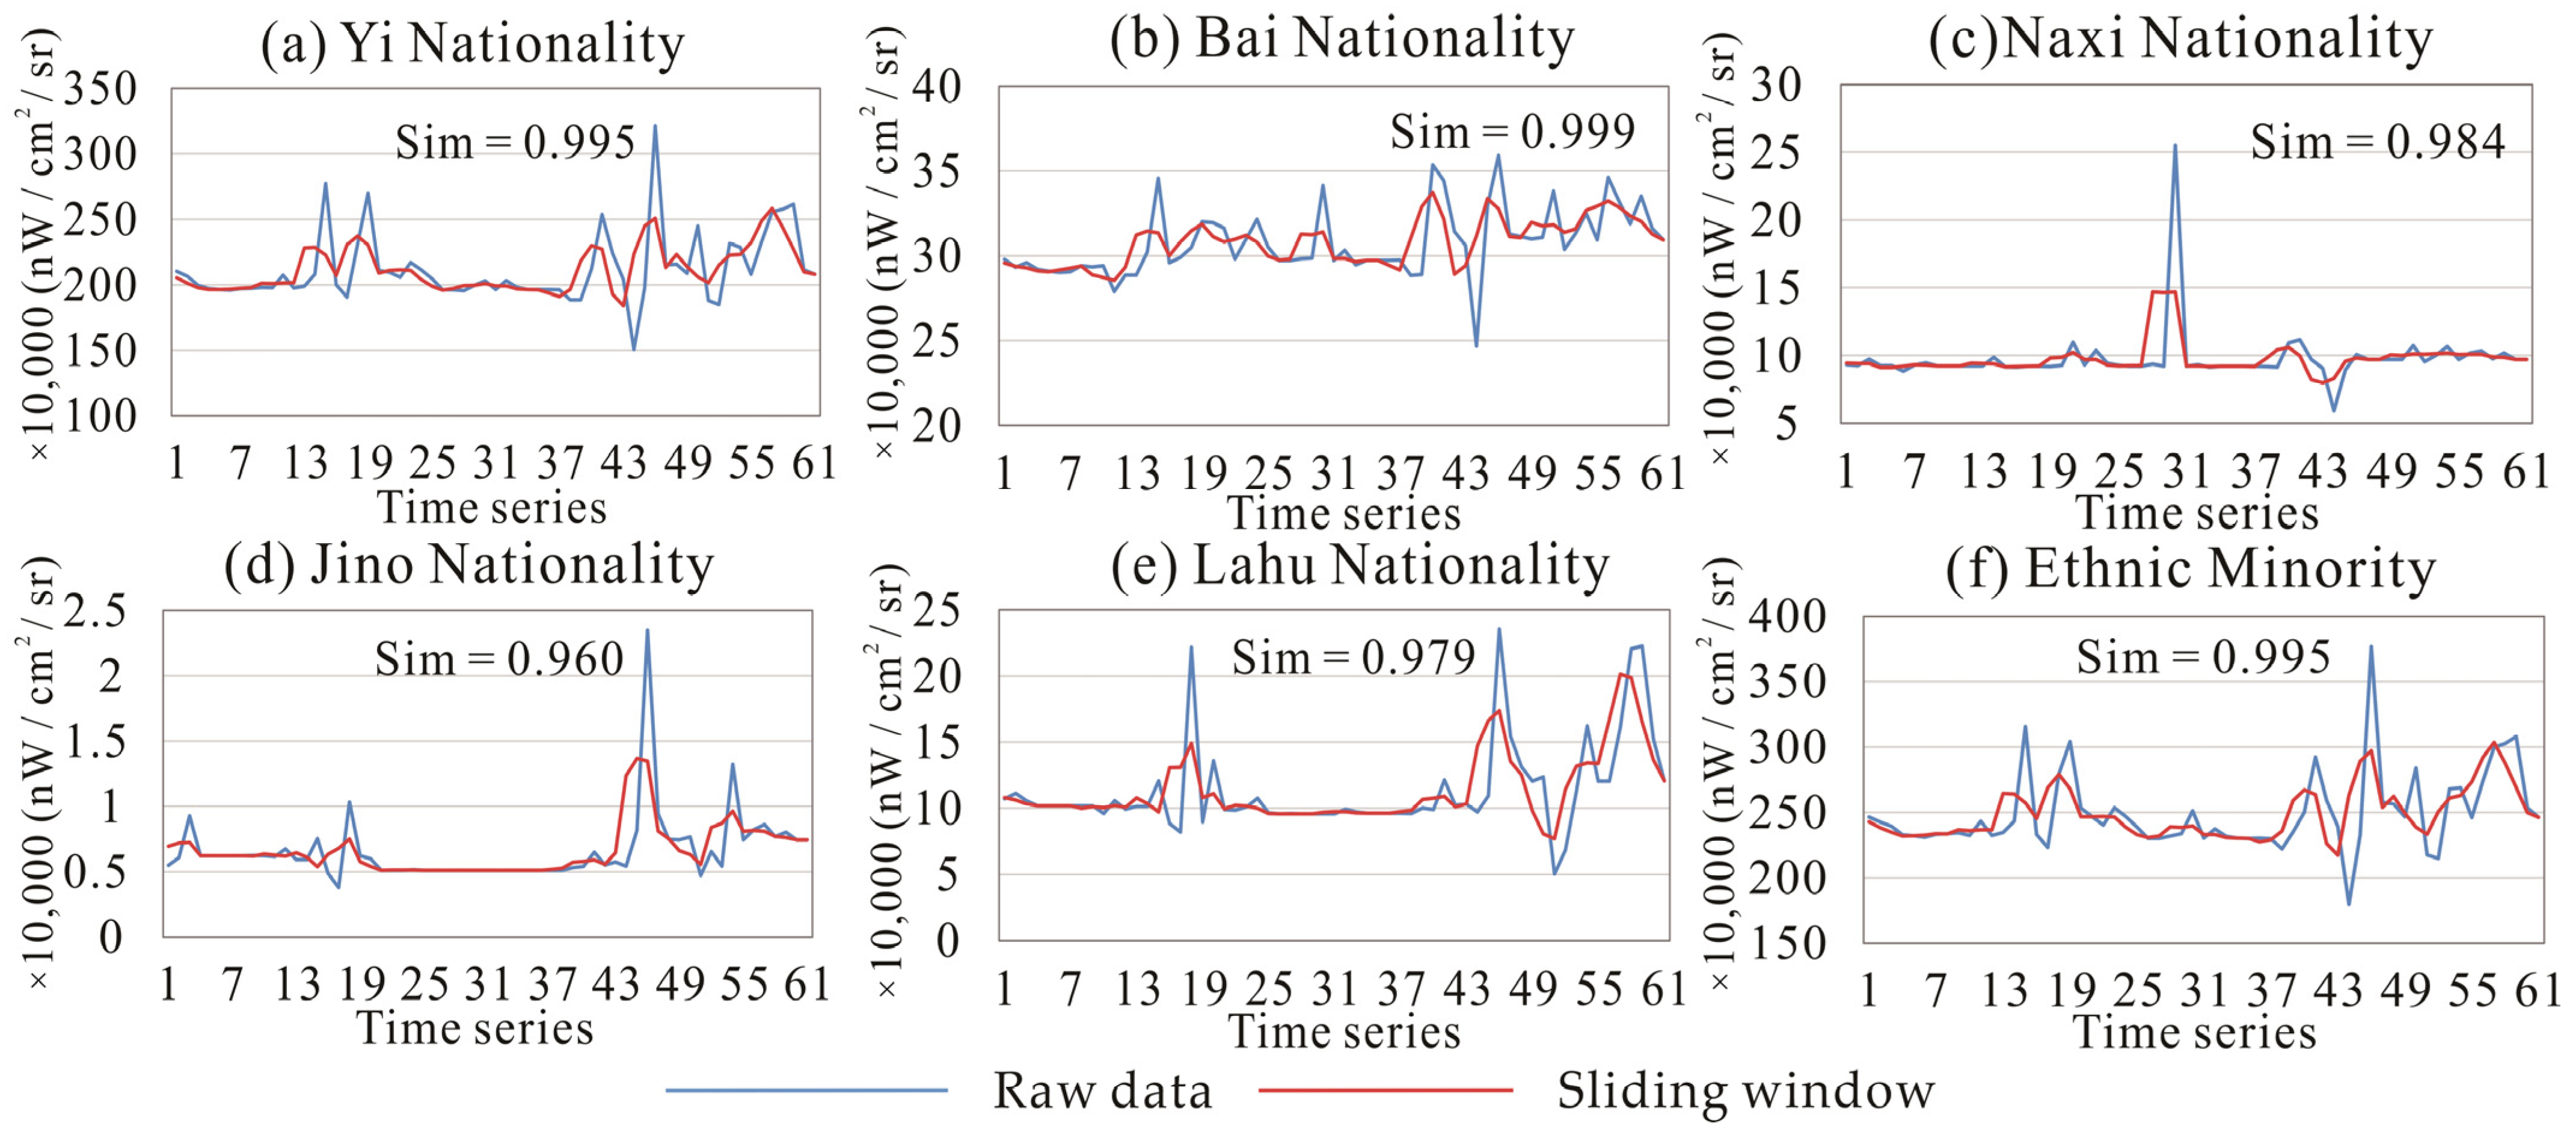
3.1. Accuracy Verification

Using the method of determining the sliding window width described in Section 2.2.3, the NTL radiances of the Yi, Bai, Naxi, Jino, Lahu, and all ethnic minority areas excluding urban areas in Yunnan Province from 2018 to 2020 were analyzed. When the sliding window k was 3 and the sliding step was 1, the resulting line graph was most similar to that original data and could be used to replace original time series data.
The cosine similarity was used to calculate the similarity between the line graph of NTL radiance of the Yi, Bai, Naxi, Jino, Lahu, and all ethnic minority areas excluding urban areas for 2018–2020 and what was obtained by the sliding window analysis. The length of data analyzed by the sliding window was 61 due to the width and step size of the sliding window (3 and 1, respectively). In order to maintain the length of original data used for verification consistent with the length of data analyzed by the sliding window, this study removed the last two data series from the original data for accuracy verification (the original time series of 32 corresponds to the 24th day in the sixth month of the LC, the sliding window time series of 32 corresponds to the sliding window results from the 24th to 26th in the sixth month of the LC of the current year, and so on). The verification result is shown in Figure 5, Figure 6 and Figure 7.
Figure 5, Figure 6 and Figure 7 show that the cosine similarity from 2018 to 2020 is greater than 0.96. The cosine similarity of Yi, Bai, and all ethnic minorities exceeds 0.99, indicating that original data are similar to those data obtained after the sliding window analysis. Therefore, the sliding window analysis method in this study is robust and its data can serve as an alternative to original data.
To further verify that the sudden increase in the brightness of the lights at night during the Torch Festival in Figure 5, Figure 6 and Figure 7 is caused by the torches, we selected the results of the 2019 Torch Festival field trip on the 24th day in the sixth month of the LC in Yunnan Ethnic Village, Kunming City, for use as verification data. We used the NTL map of the 24th day in the sixth month of the LC in 2019 to compare with the NTL map of the 23rd day in the sixth month of the LC, obtained the difference plot, and divided the results into 5 classes. Since this study does not analyze areas where the NTL brightness decreases, results less than 0 in the difference plot are directly divided into one class; results greater than 0 in the difference plot are divided into 4 classes using the natural break method. From the results, it can be seen that the place where the Torch Festival is held in Yunnan Ethnic Village does have a sudden increase in the brightness of the lights at night, indicating the accuracy of our study. The result is shown in Figure 8.

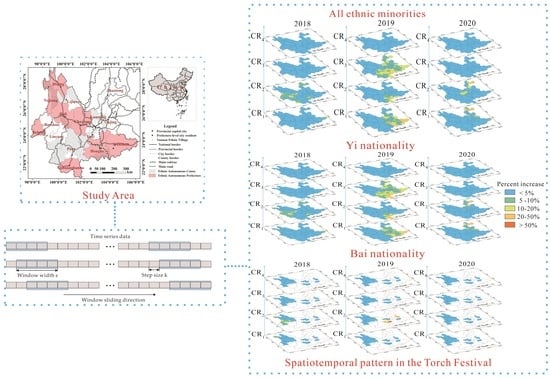
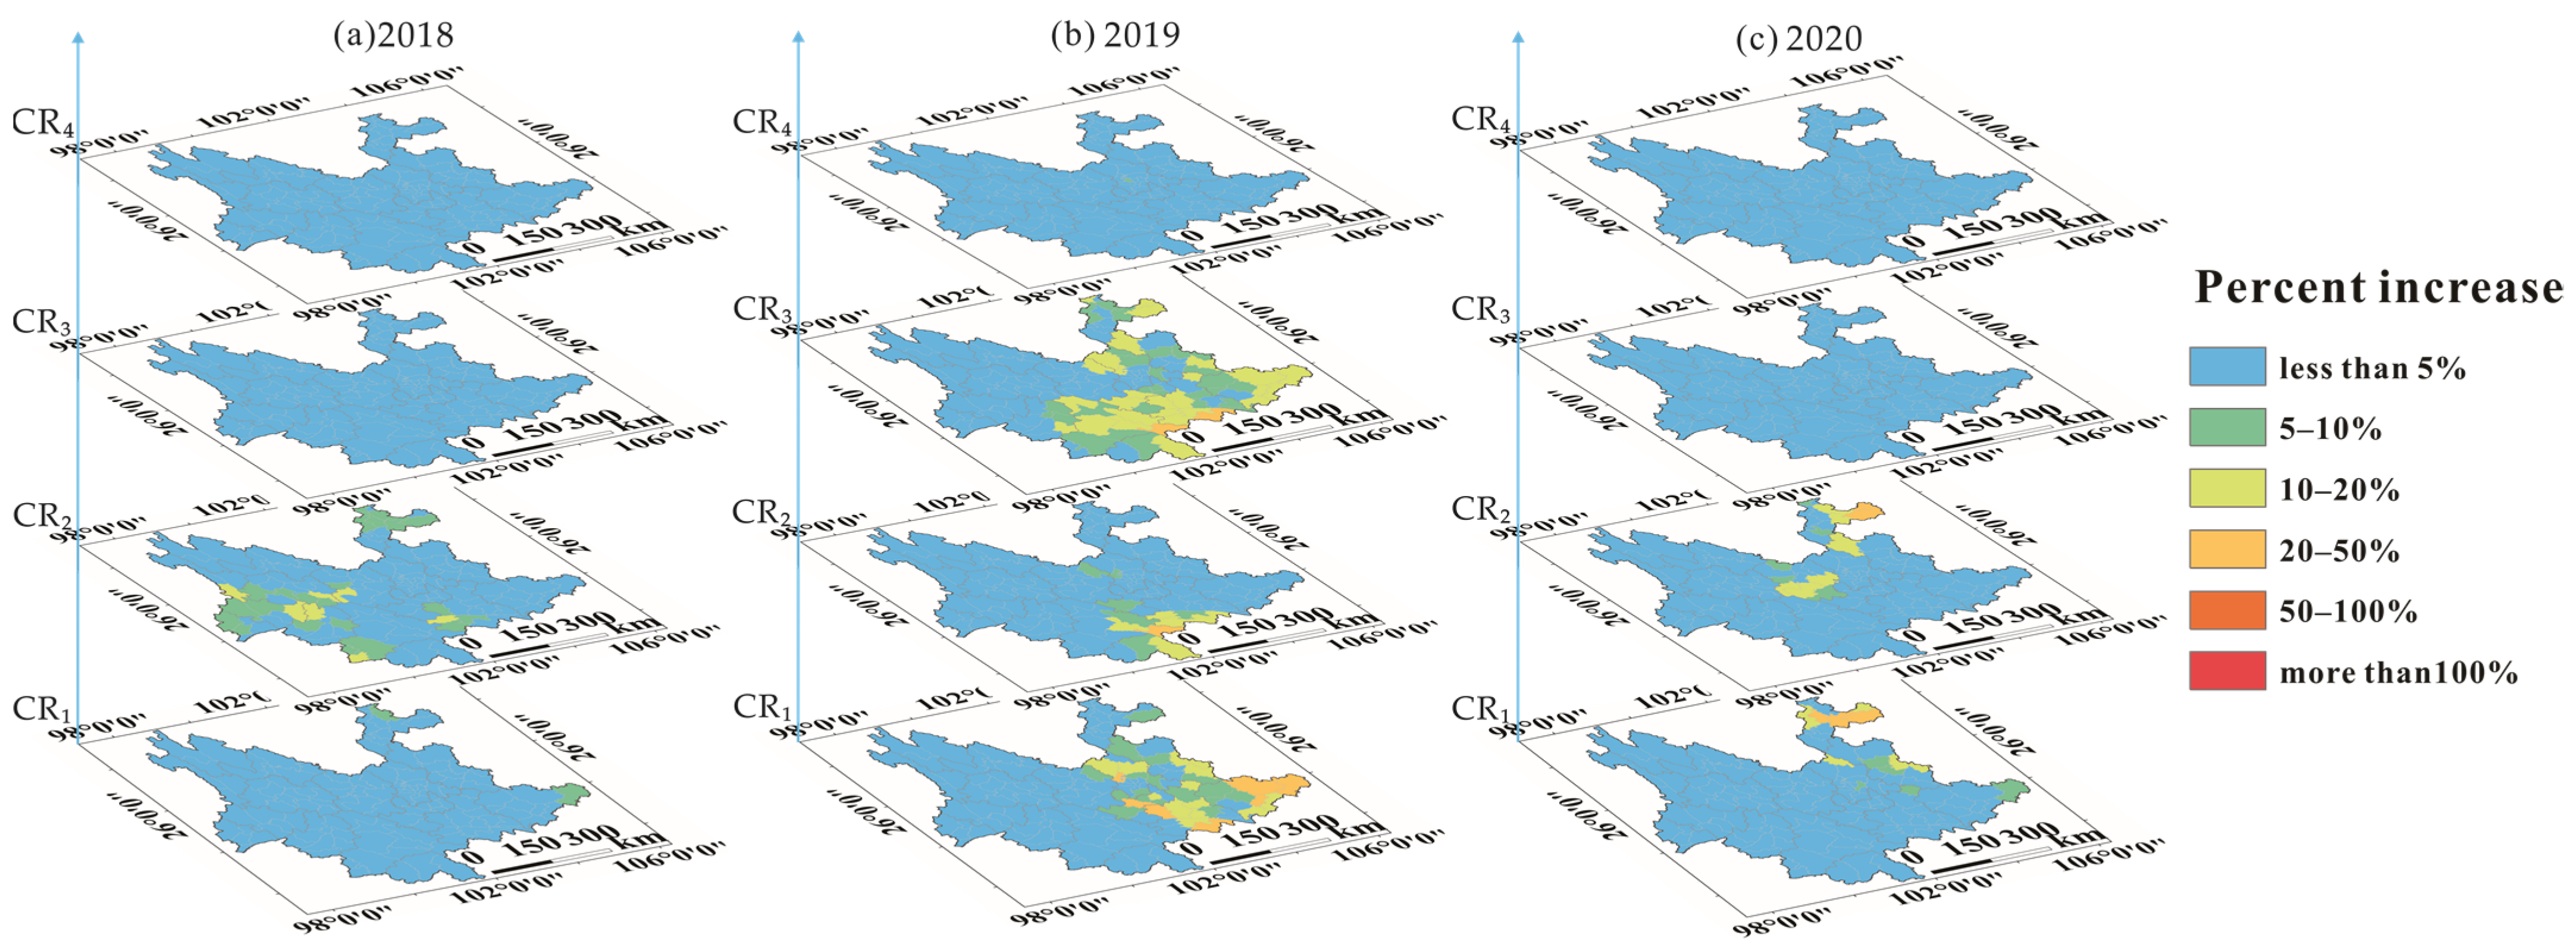
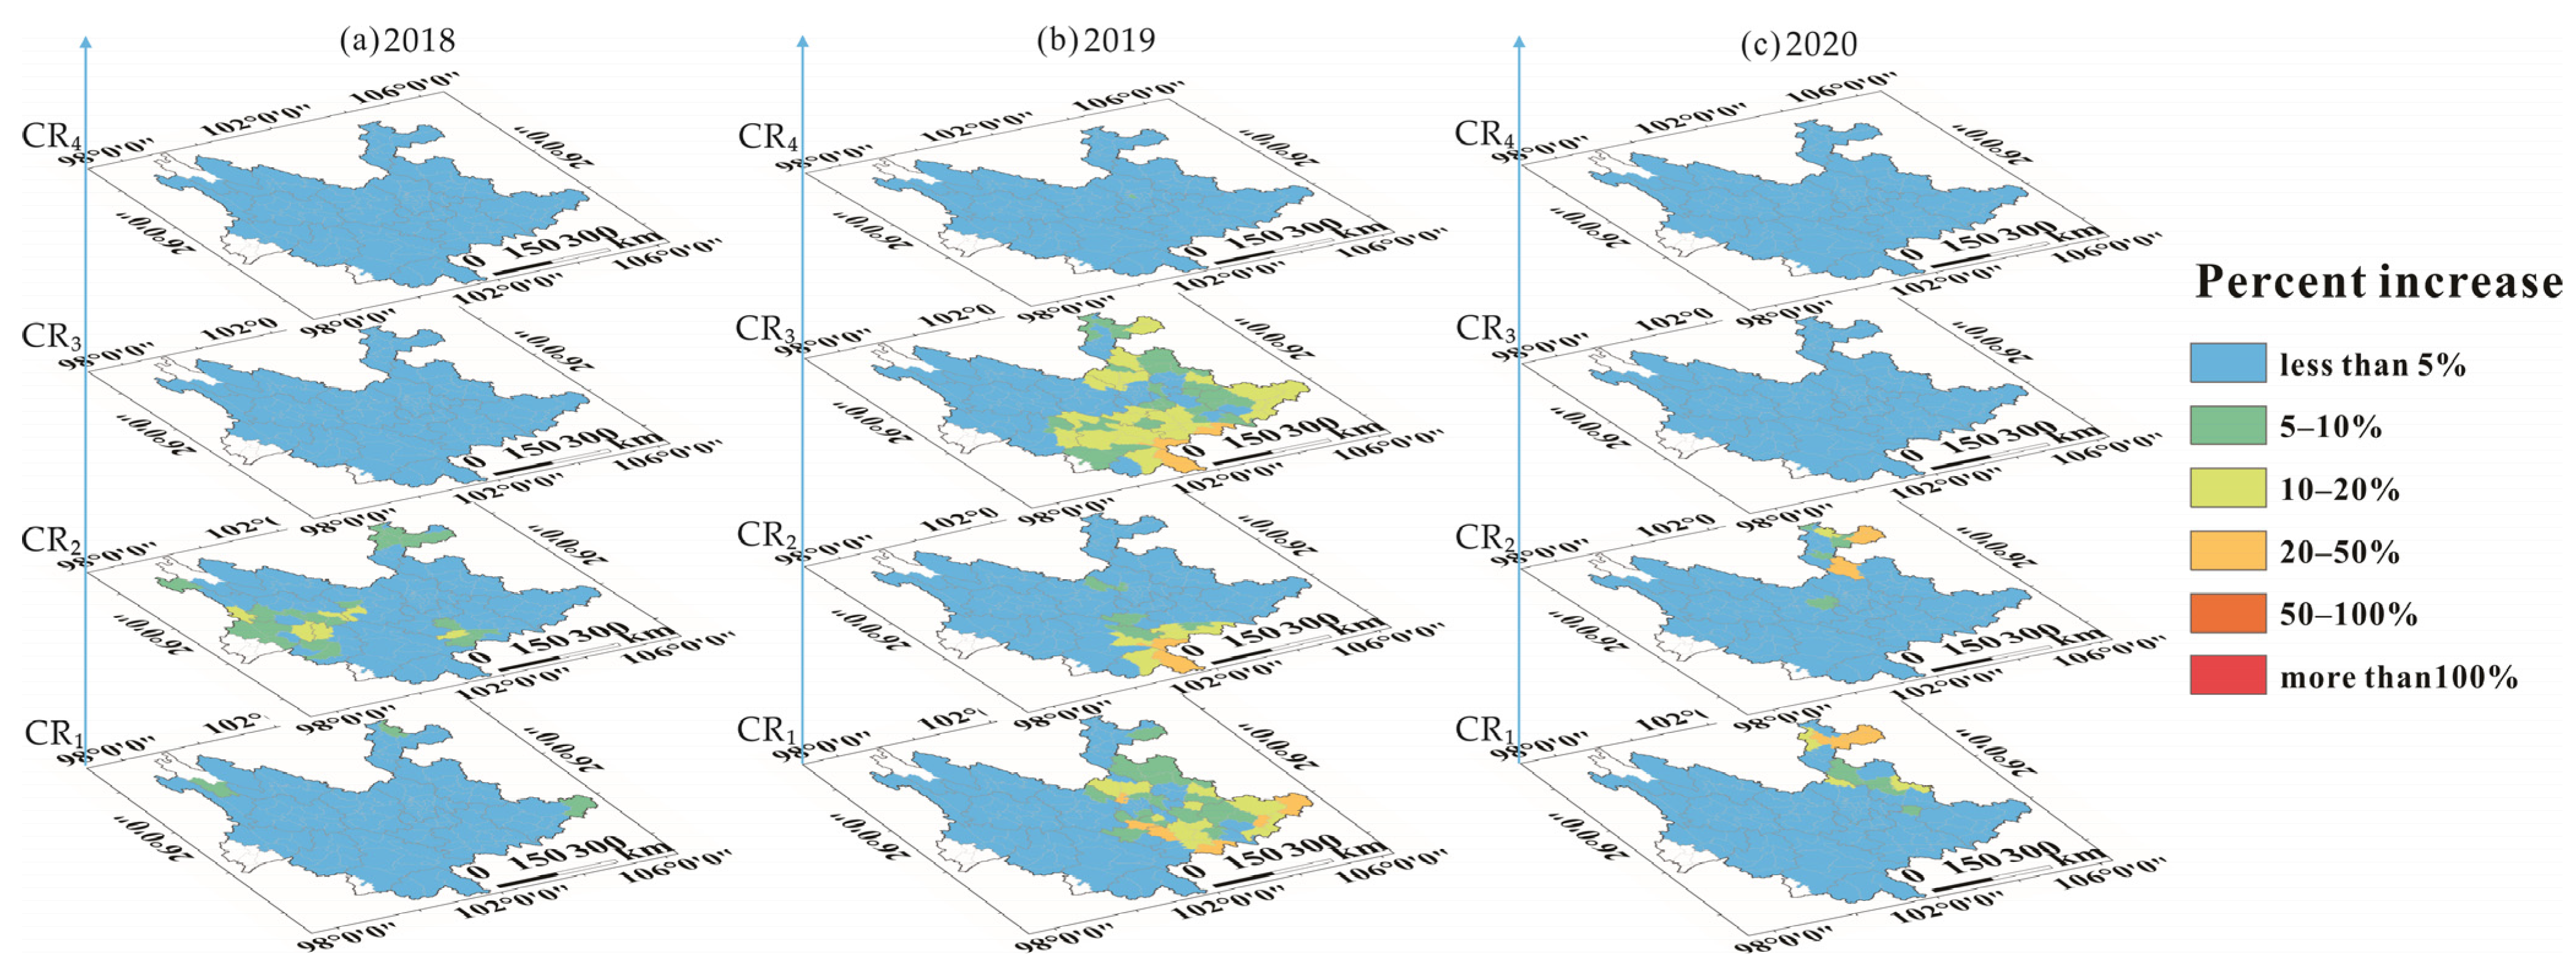
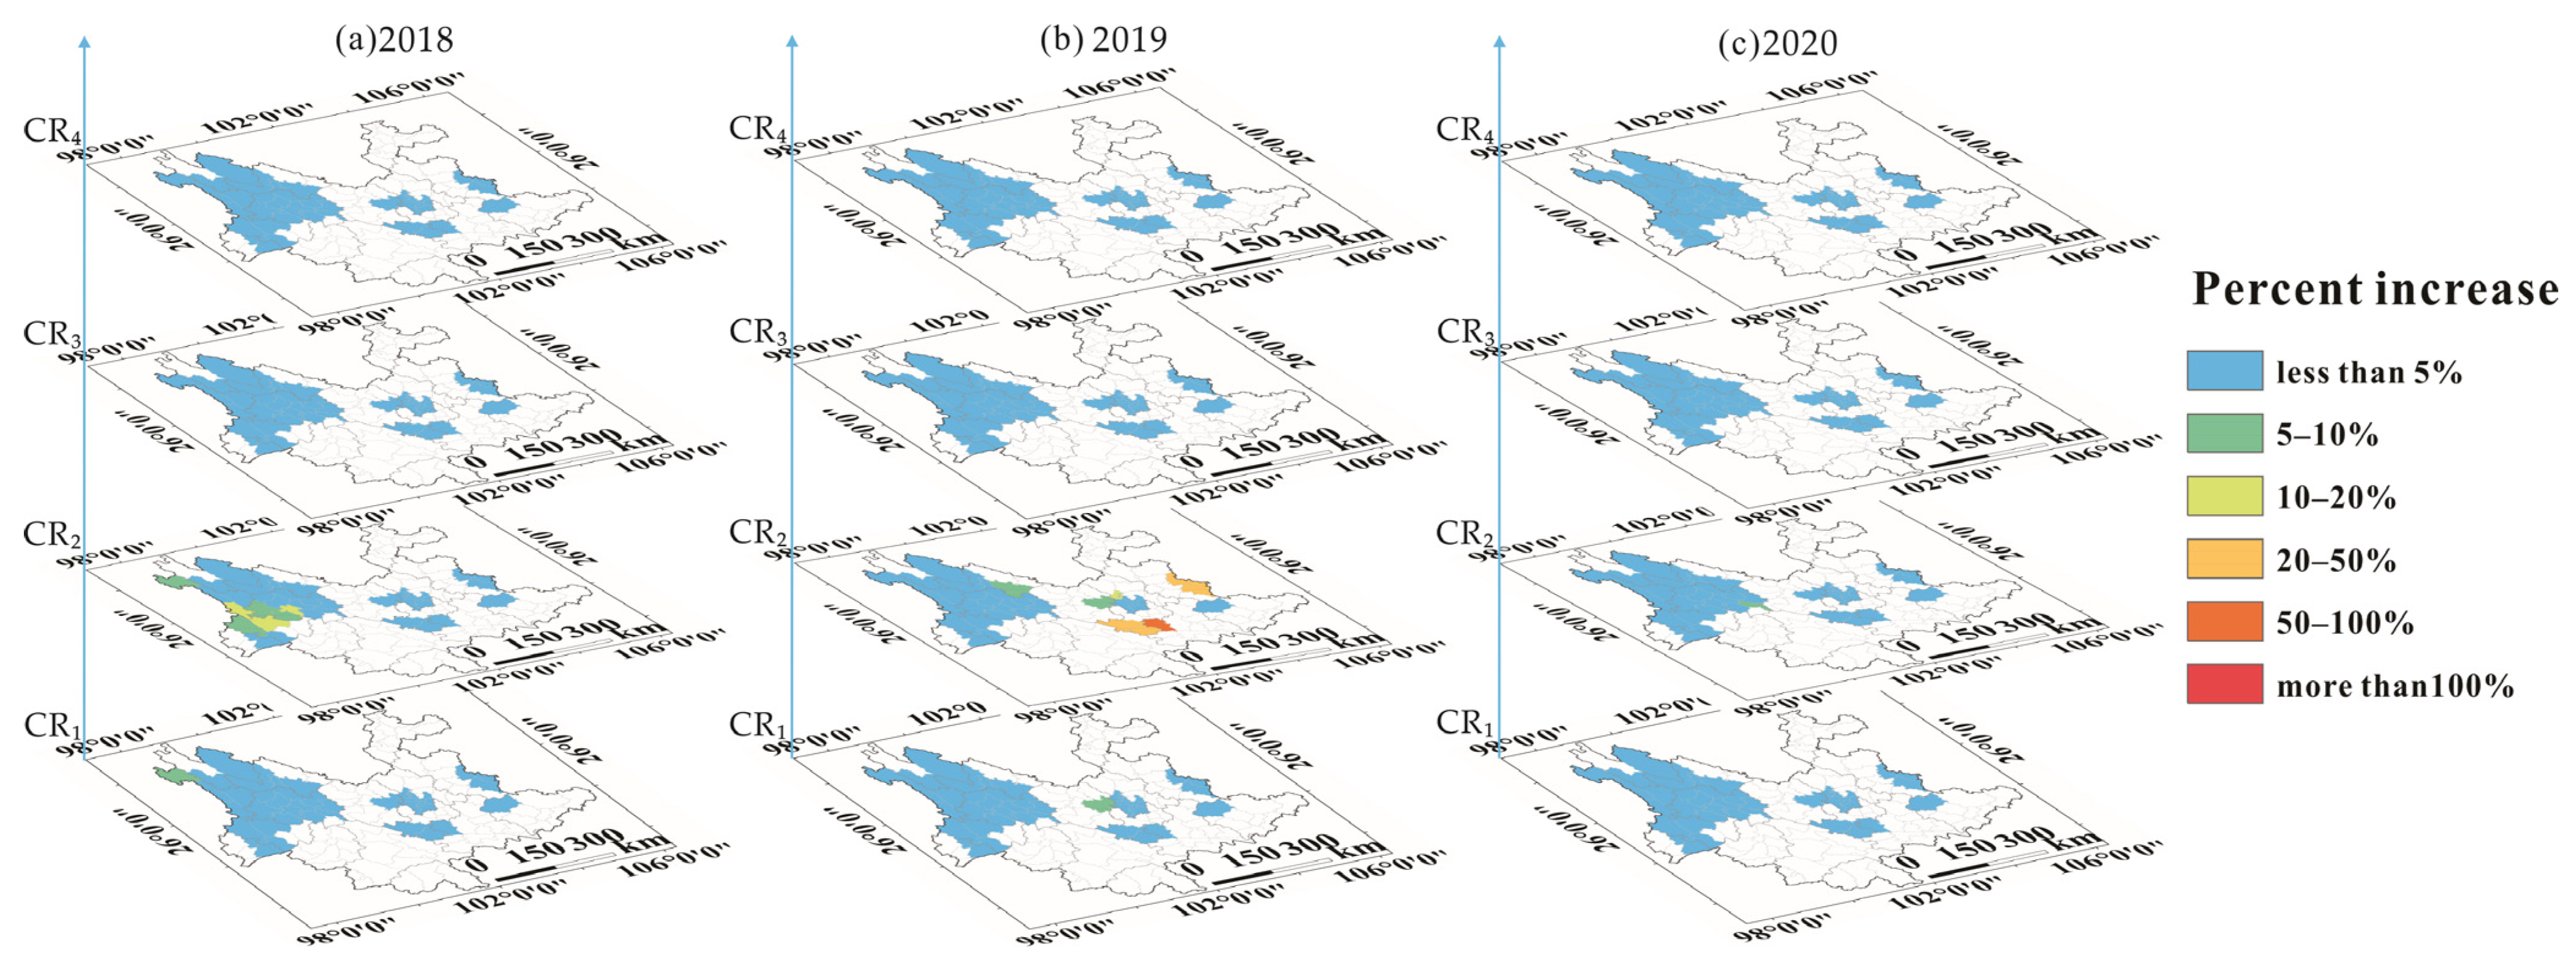
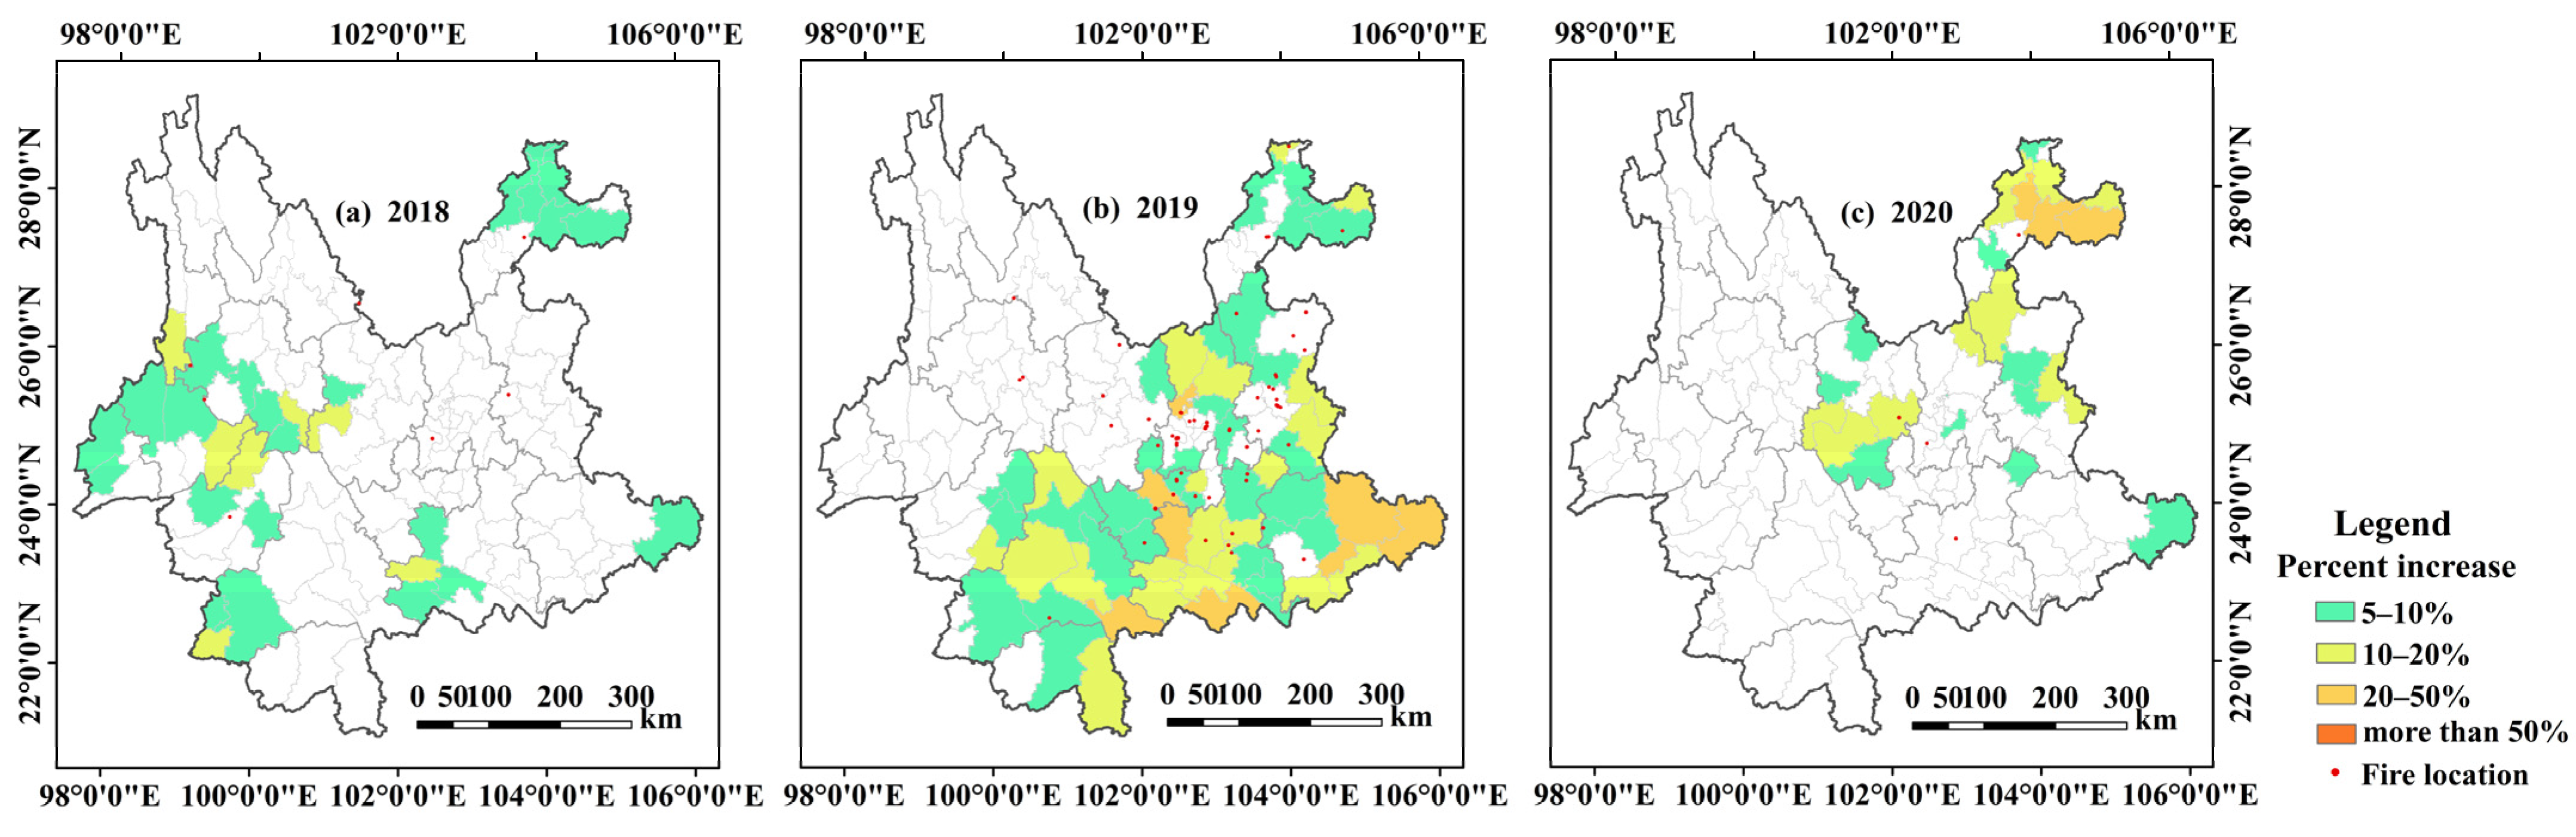
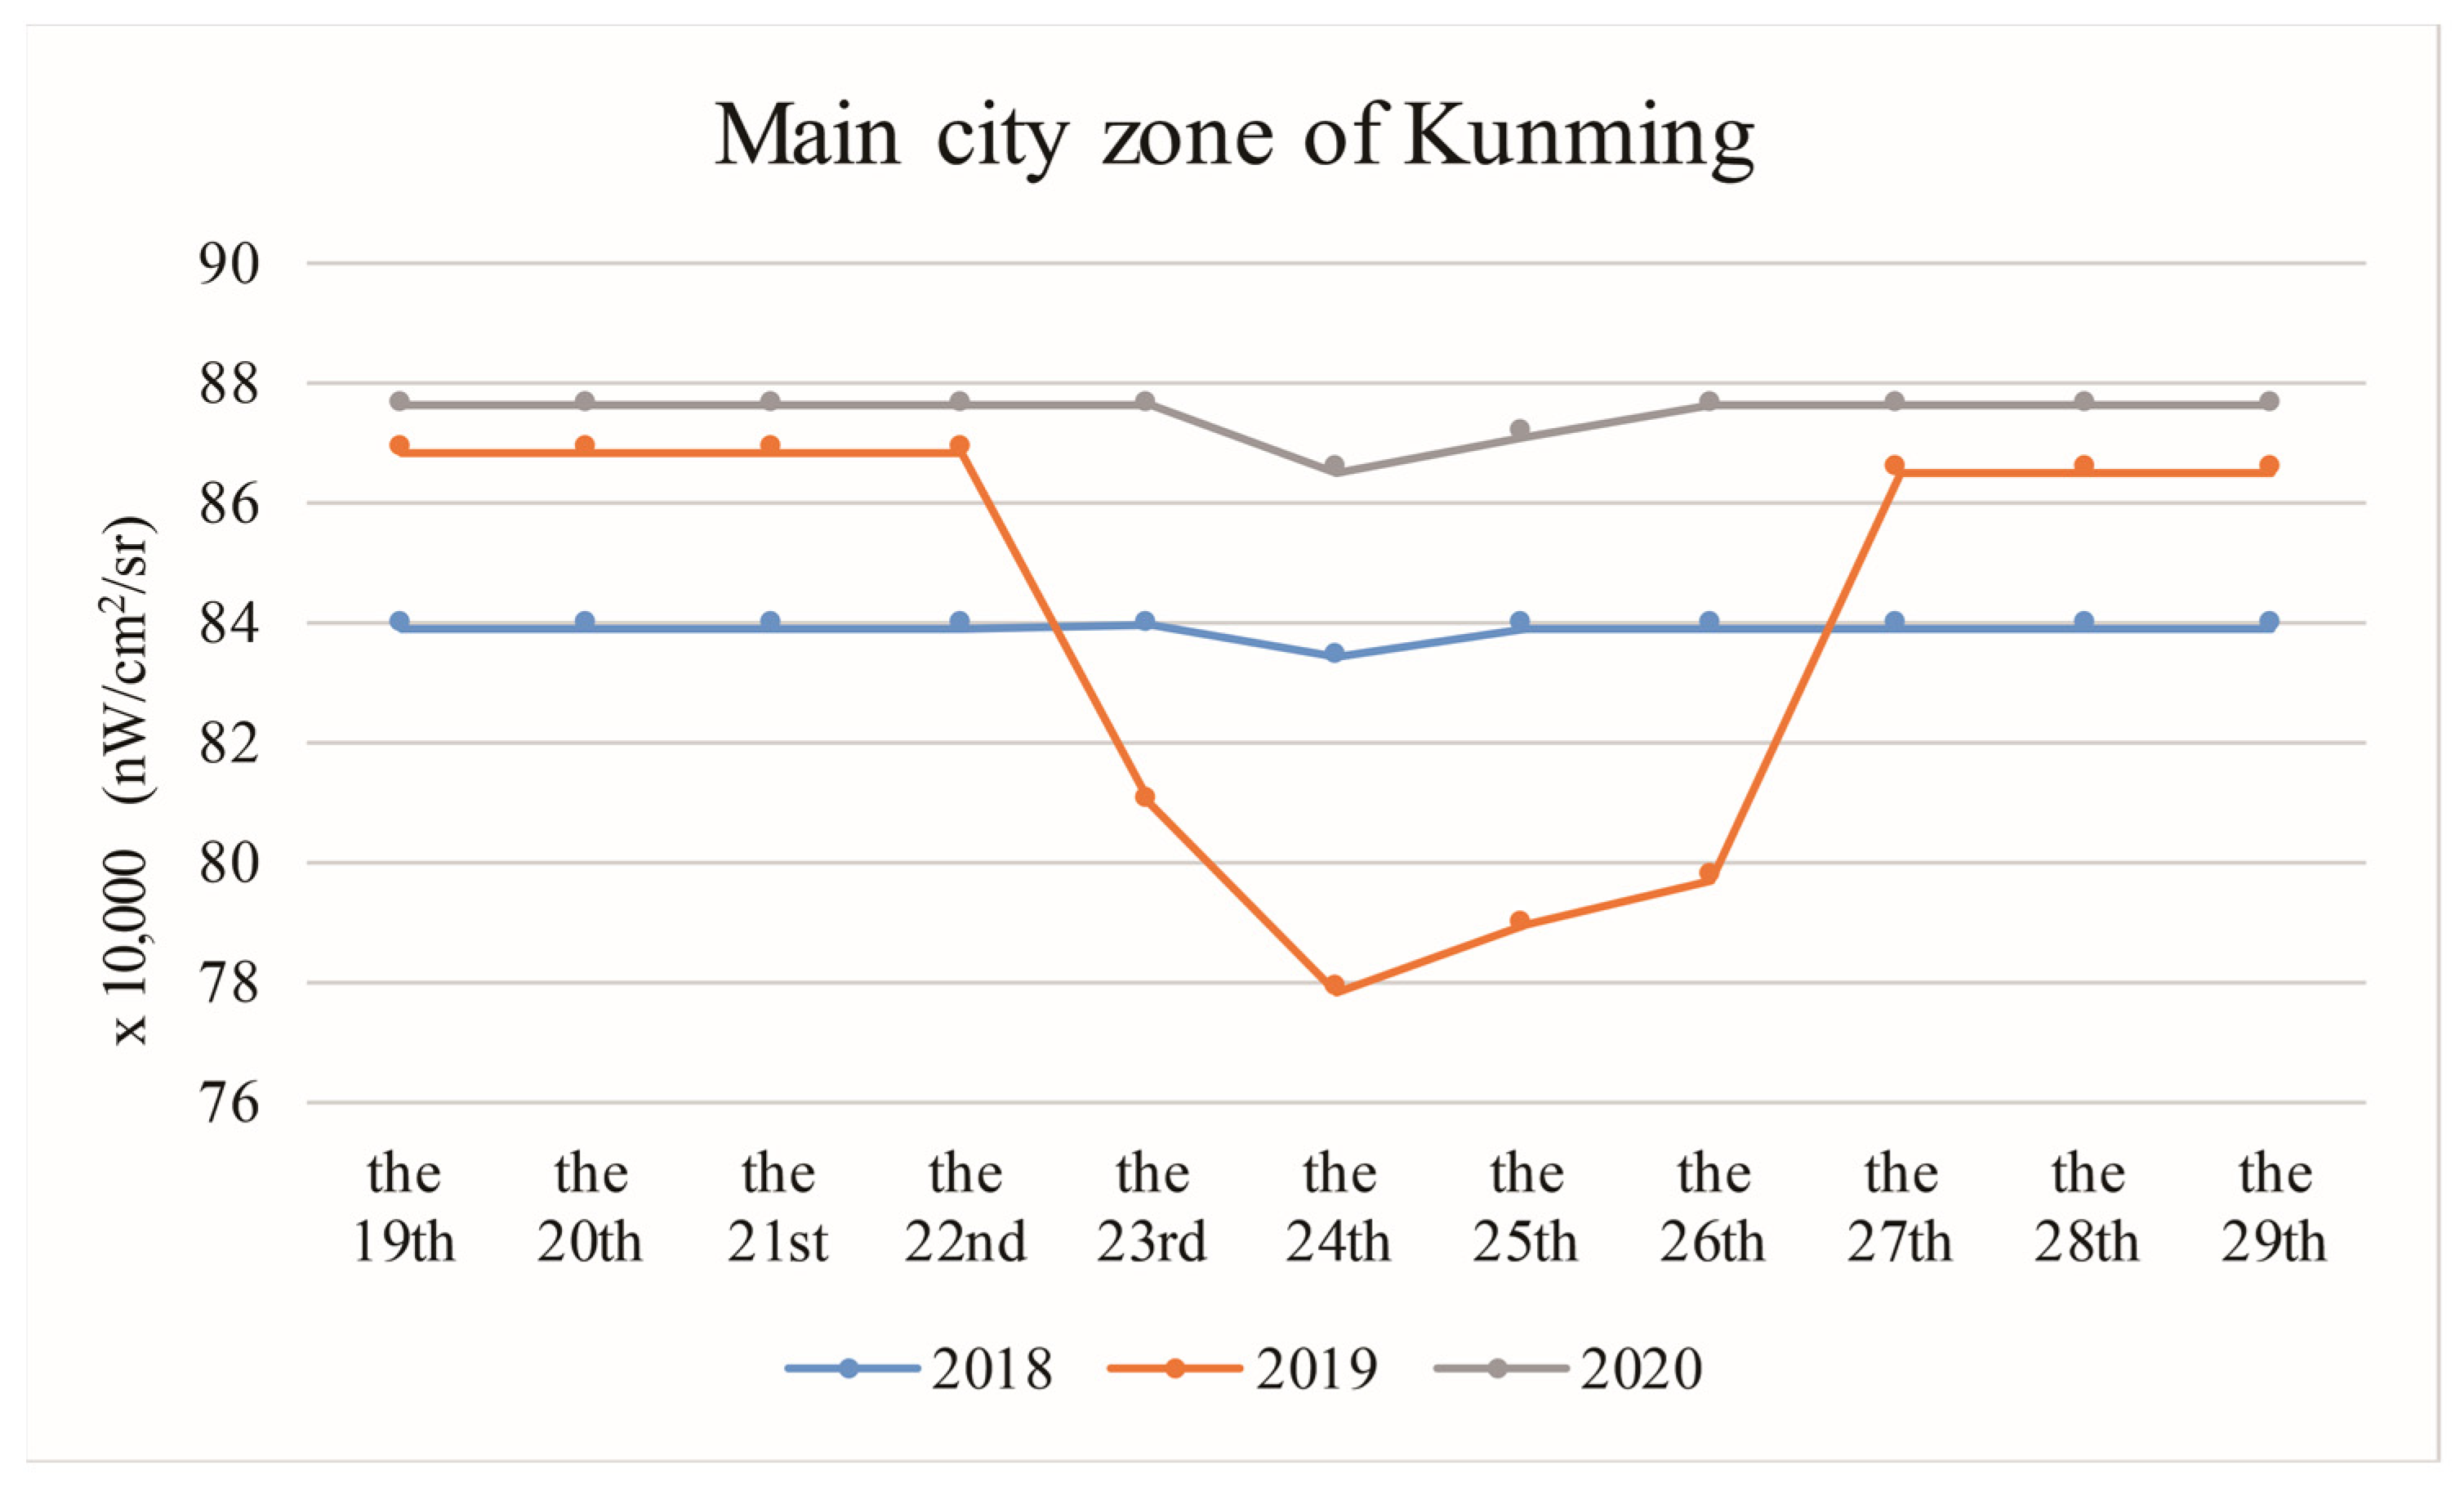
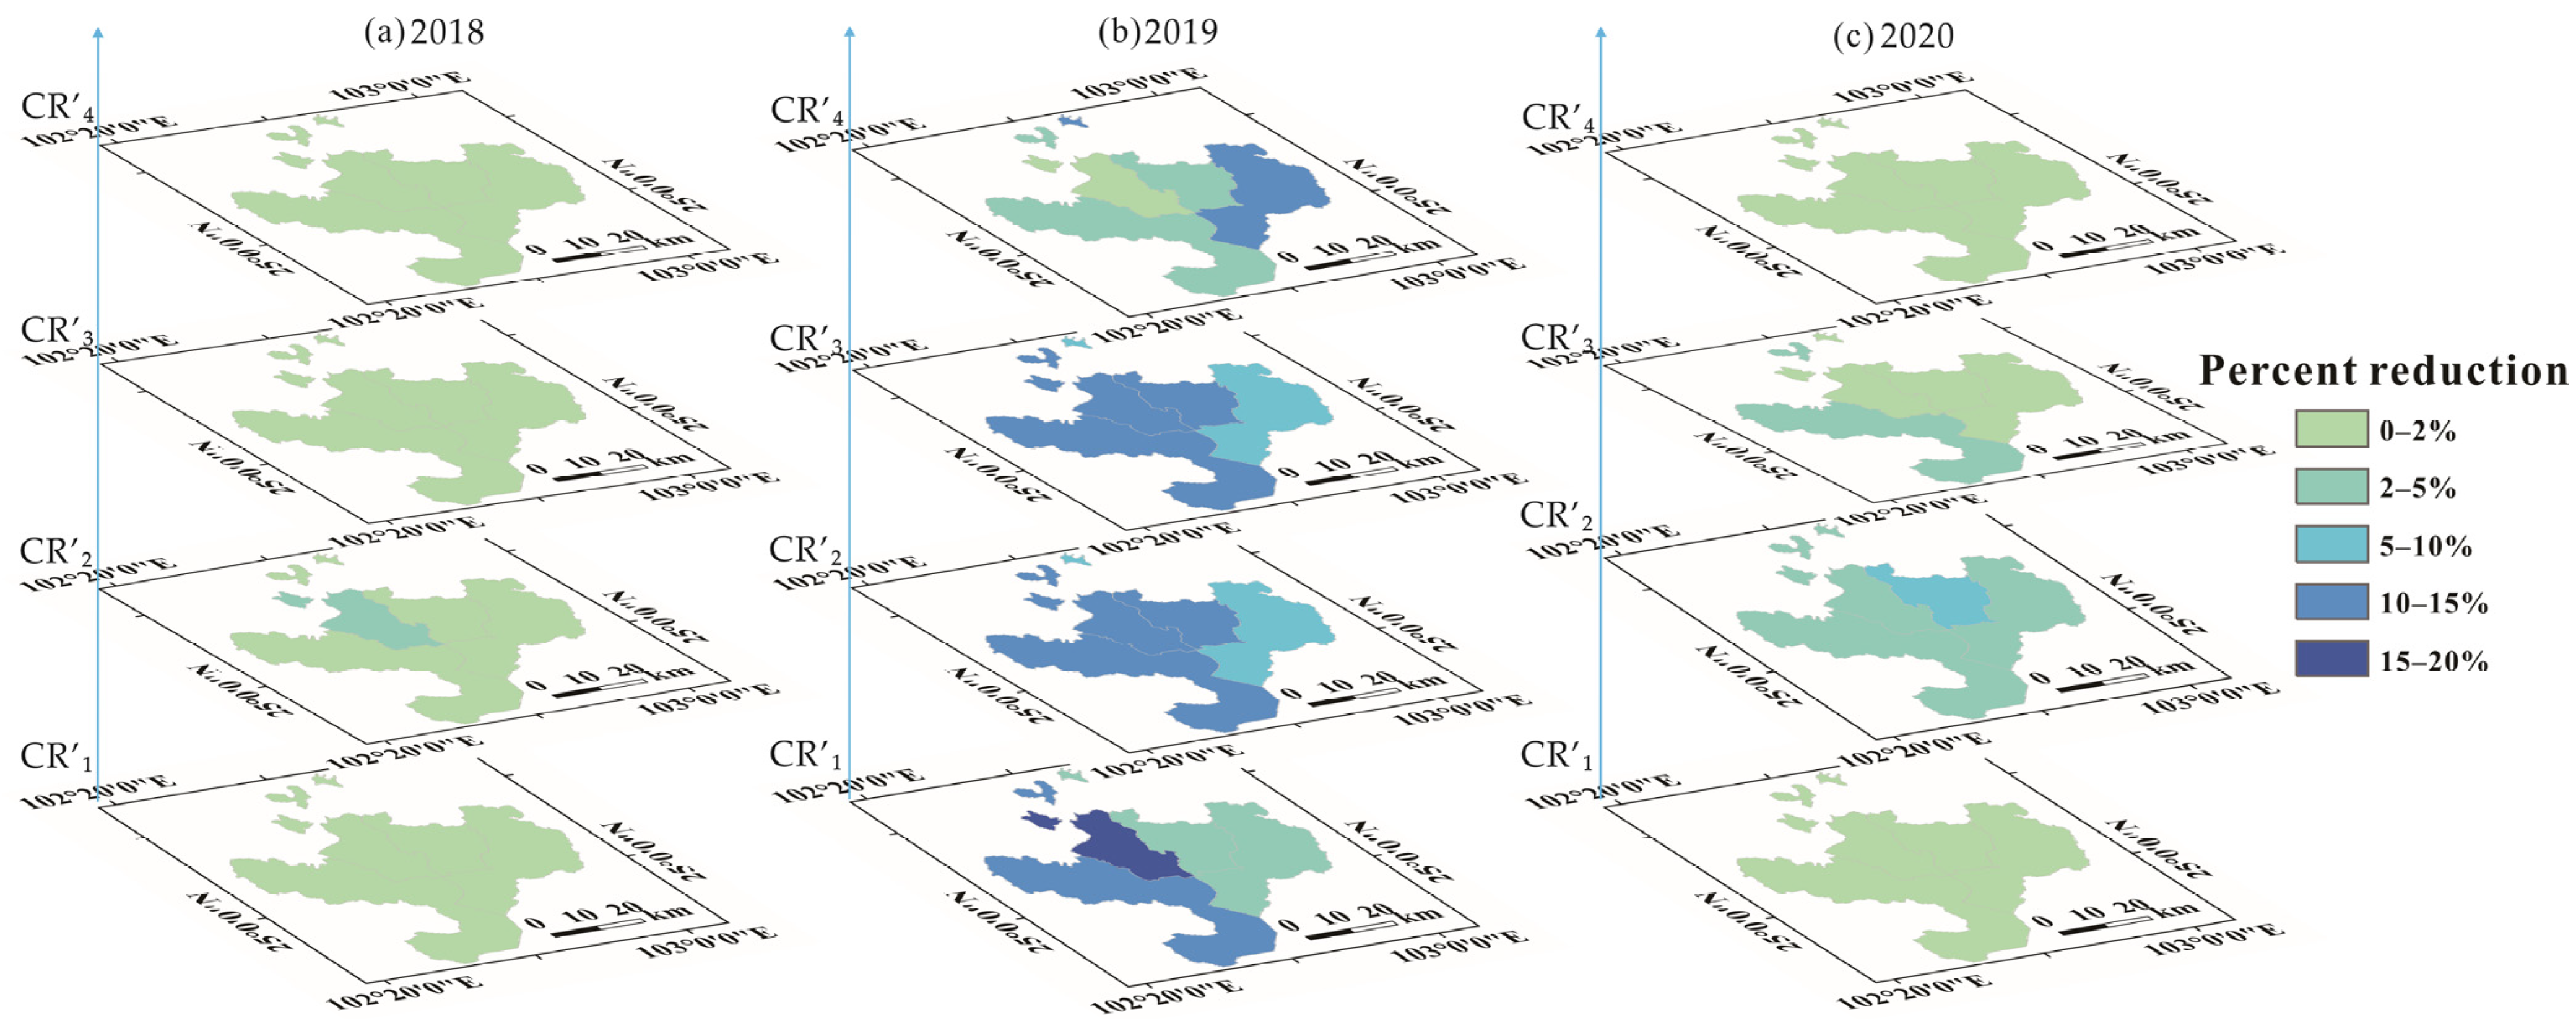
3.2. Analysis of the Temporal and Spatial Pattern of the Torch Festival

Using the analysis results of the sliding window, we can observe the change in radiant brightness of the lights at night. Generally, locations with larger increases in NTL brightness may be attributed to fires, while locations with smaller increases in NTL brightness may be attributed to festivals, holidays, or other events. The width of the sliding window in this study was 3, indicating that the Torch Festival period for ethnic minorities in Yunnan Province was approximately 3 days.
Judging from the sliding window results in Figure 5, Figure 6 and Figure 7, the Torch Festival celebration timing is slightly different for different ethnic minorities and will also vary across years for the same ethnic minority. (1) The 2018, 2019, and 2020 torch festivals of ethnic minorities in Yunnan Province were celebrated from the 23rd to 25th, the 22nd to 25th, and the 22nd to 24th day in the sixth month of the LC, respectively. (2) The Yi nationality celebrated the festival from the 23rd to 25th, the 22nd to 25th, and the 22nd to 24th day in the sixth month of the LC in 2018, 2019, and 2020, respectively; however, compared to other years, in 2020, the increase in light brightness was not evident. (3) The Bai nationality celebrated the festival from the 23rd to 26th, the 21st to 24th, and the 22nd to 24th day in the sixth month of the LC in 2018, 2019, and 2020, respectively. (4) The Jino nationality did not hold the Torch Festival in 2018 or 2020 and celebrated it from the 24th to 26th day in the sixth month of the LC in 2019. (5) The 2018 and 2019 torch festivals of the Lahu nationality were celebrated from the 24th to 26th and the 22nd to 24th day in the sixth month of the LC, respectively; however, the festival was not held in 2020. (6) Similarly, the Naxi nationality celebrated the Torch Festival from the 24th to 26th and the 22nd to 24th day in the sixth month of the LC in 2018 and 2019, respectively, but did not hold the festival in 2020.
Judging from the celebration of the Torch Festival, most ethnic minorities in Yunnan Province cancelled the Torch Festival celebration in 2020 due to the impact of the COVID-19 pandemic. However, in some areas, especially remote areas, the notice to cancel the festival was not strictly enforced. Therefore, while the COVID-19 pandemic affected most regions. This explains why there were still torch festivals held in 2020; though despite this, as compared to 2019, the 2020 Torch Festival was not very grand.
The Yi, Bai, and all ethnic minorities were used to analyze the temporal and spatial pattern during the Torch Festival in Yunnan Province. It is impossible to discern the spatiotemporal pattern of NTL brightness during the Torch Festival from the change trend alone, and the change rate must also be considered to capture those areas with a greater degree of change. Therefore, this study observes the temporal and spatial distribution pattern of the Torch Festival by calculating the change rate of the total light brightness at night during the Torch Festival. Taking the sliding window of the Torch Festival held by the Yi, Bai, and all ethnic minorities as the criterion, two sliding windows were moved forward and backward (a total of five sliding windows) to calculate the brightness change rate of the lights at night, which is described by the following formula (Equation (5)):
CR i = { T i   T i 1 T i 1 , T i 1 > 0 Null , T i 1 = 0
where CRi is the change rate of the total NTL brightness of i sliding windows from the starting sliding window, Ti is the total NTL brightness of i sliding windows from the starting sliding window (when i = 1, it indicates the second sliding window, and so on), and Ti−1 is the total NTL brightness of the first sliding window.
The results of the rate of change are divided into five categories: less than 5%, (no change in the NTL), 5–10% (no visible change), 10–20% (moderate change), 20–50% (relatively visible change), and more than 50% (visible change). Figure 9, Figure 10 and Figure 11 show the temporal and spatial distribution pattern of the light brightness change rate at night during the Torch Festival for all ethnic minorities, and Yi and Bai nationalities.
NTL data were analyzed for three years (2018–2020). Compared with the torch festivals in 2018 and 2020, the rate of change in NTL brightness was the largest, the NTL brightness increased the most, and the Torch Festival lasted the longest in 2019. The 2018 Torch Festival lasted for a sliding window of 3 days. In 2019, the Torch Festival of all ethnic minorities lasted for 5 days (3 sliding windows), which also showed that the festival duration for different ethnic minorities in Yunnan was not the same, with a time difference of about 2 days. Similarly, the Torch Festival of the Bai nationality in 2020 lasted for one sliding window, whereas for the Yi nationality and all other ethnic minorities it lasted for two sliding windows. The change rate of NTL brightness during the Bai Torch Festival in 2020 was remarkably lower than that in 2018 and 2019. The number of areas where the Yi and all ethnic minorities celebrated the Torch Festival was evidently less in 2020 than that in 2019, although there were a few areas, including Zhenxiong County, Zhaotong City; Yiliang County, Zhaotong City; and Huize County, Qujing City, where the NTL brightness change rate exceeded 20%. In general, the celebration of the Torch Festival is becoming increasingly “organized,” which is reflected in the locations of Torch Festival celebrations that have changed from fewer and more scattered to more concentrated.
Through the temporal and spatial pattern of the total brightness change rate of the Torch Festival in 2018 and 2019, the Torch Festival location was observed to shift from the west and southwest to the east, south, and central Yunnan. Specifically, the celebration sites moved from Lvning County of Baoshan City, Fengqing County of Lincang City, Lushui County of Nujiang Lisu Autonomous Prefecture, Midu County of Dali Bai Autonomous Prefecture, Nanhua County of Chuxiong Yi Autonomous Prefecture in 2018 to Wenshan Zhuang and Miao Autonomous Prefecture, Honghe Hani and Yi Autonomous Prefecture, Pu’er City, and Xishuangbanna Dai Autonomous Prefecture in 2019. The Bai Torch Festival was moved from Baoshan City; Yangbi Yi Autonomous County in Dali Bai Autonomous Prefecture; and Lushui County in Nujiang Lisu Autonomous Prefecture in 2018 to Fuyuan County and Luoping County in Qujing City; Xinping Yi and Dai Autonomous County in Yuxi City; and Yuanjiang Hani Yi Dai Autonomous County, Shiping County, Honghe Hani, and Yi Autonomous Prefecture in 2019. Torch festivals were mainly held in Yi Autonomous Prefectures or Autonomous Counties, such as Yangbi Yi Autonomous County, Honghe Hani and Dai Autonomous Prefecture, and Chuxiong Yi Autonomous Prefecture. The Torch Festival venues were generally not located in the city center but were distributed across the suburbs or county-level districts. For example, neither the city center of Kunming in Figure 9 and Figure 10 nor Wenshan City in Wenshan Zhuang and Miao Autonomous Prefecture were Torch Festival venues. Specifically, the pattern radiated from the center of Kunming City and Wenshan City in Wenshan Zhuang and Miao Autonomous Prefecture to the surrounding minority Autonomous Counties. The temporal and spatial pattern of the light brightness change rate during the annual Yi Torch Festival was the same as that of all ethnic minorities. In other words, the temporal and spatial pattern of the Torch Festival celebrations of all ethnic minorities was determined by the Torch Festival celebrations of the Yi nationality. This is likely because the Yi are distributed throughout Yunnan Province and account for the largest minority proportion in Yunnan Province.
There is no apparent pattern among the minority groups except that the primary places of celebration shifted from the west and southwest in 2018 to the east and south in 2019. However, the celebration localities remained relatively concentrated, mainly based on Autonomous Prefectures or Autonomous Counties that hold torch festivals as units. Compared with the Yi festivals, the Bai festivals were held in fewer places and were not as concentrated, and most were within the Yi ethnic Autonomous Counties, for example Weishan Yi and Hui Autonomous County in Dali Bai Autonomous Prefecture, Xinping Yi and Dai Autonomous County in Yuxi City, and Yuanjiang Hani and Yi and Dai Autonomous County. In 2019, the Bai people celebrated the Torch Festival in Fuyuan County and Luoping County in Qujing City; Xinping Yi and Dai Autonomous County in Yuxi City; and Yuanjiang Hani, Yi and Dai Autonomous County, and Shiping County in Honghe Hani and Yi Autonomous Prefecture. Among these locations, Shiping County had the largest change rate of light brightness at night. To a certain extent, among the places where the Bai celebrated the Torch Festival in 2019, the Torch Festival in Shiping County was the liveliest. The Torch Festival venues of the Yi nationality were relatively concentrated. Taking 2019 and 2020 as examples, the venues for the Yi Torch Festival were mainly concentrated in Zhenxiong County in Zhaotong City; Funing County and Guangnan County in Wenshan Zhuang and Miao Autonomous Prefecture; Yuanjiang Hani, Yi, and Dai Autonomous County; and Xinping Yi and Dai Autonomous County in Yuxi City. Compared with the Torch Festival venues in 2018 and 2019, the venues for the Yi nationality in 2020 were scattered and reduced (basically only Huize County of Qujing City, Weixin County, and Zhenxiong County of Zhaotong City hosted torch festivals), the duration of the Torch Festival being shorter than in 2019.

4. Discussion

4.1. Comparison of Common Time Series Methods and Sliding Window Method

There are many methods for remote sensing time series analysis. For example, Seasonal-Trend decomposition based on Loess (STL) [58], seasonal autoregressive integrated moving average (SARIMA) [59], Dynamic Harmonic Regression (DHR) [60], and the Autoregressive Integrated Moving Average Model (ARIMA) [61,62]. Although each method has advantages and applicable scope, compared with these methods, the method in this study shows better applicability in the analysis of short-period non-stationary time series. Remote sensing time series analysis based on sliding window can accurately detect the changes of remote sensing data values in a short period to facilitate the analysis of the sudden increase or decrease points in remote sensing data. The method in our study has obvious advantages in the analysis of high frequency observation data, especially remote sensing daily data. The comparison between the sliding window method and common remote sensing time series analysis methods is shown in Table 2. It can be seen from Table 2 that the sliding window method has obvious advantages for festival research based on NTLRS daily data.

4.2. Influencing Factors of the Temporal and Spatial Pattern of the Torch Festival

In this study, the sliding window was used to analyze NTLRS time series data. The determination of the sliding window width is very important as it not only affects the accuracy of the results but is also affected by the social event studied. Different social events have different sliding window widths. For example, the research on the Torch Festival in this study needs to consider the festival duration; the final sliding window width is determined in relation to the festival period. However, while studying other social events (such as the Spring Festival and holidays), the sliding window width may differ according to the duration of the specific festival. The longer the time series of NTLRS, the higher the accuracy of the sliding window and the better the effect of data simplification.
To exclude the impact of fires on NTL, data of county-level areas with an NTL brightness increase rate over 5% among all ethnic minorities CR1–CR2 during 2018–2020 were screened out and combined with the fire data from the 22nd to 26th day in the sixth month of the LC during 2018–2020. The results are shown in Figure 12.
The light increase and fire results during the Torch Festival in Yunnan Province in 2018–2020 show that the areas with a high rate of increase in NTL brightness are mostly far from the fire occurrences in 2018 and 2020 and are also not in the 2019 fire zone. Such areas include Guangnan County and Funing County in Wenshan Zhuang and Miao Autonomous Prefecture, Shiping County and Jinping Miao, Yao and Dai Autonomous County in Honghe Hani and Yi Autonomous Prefecture, and Jiangcheng Hani and Yi Autonomous County in Pu’er City. The remaining areas (Mengla County in Xishuangbanna Dai Autonomous Prefecture, Jingdong Yi Autonomous County, Jinggu Dai and Yi Autonomous County, Ning’er Hani and Yi Autonomous County in Pu’er City, Fuyuan County and Luoping County in Qujing City, Luquan Yi and Miao Autonomous County, and Xundian Hui and Yi Autonomous County in Kunming City) with a high increase in NTL brightness are not located close to fire spots, and, overall, there are few areas with fire spots. In follow-up research, it is imperative to further explore whether NTL changes in these areas are caused by fire; for example, Fumin County in Kunming City, Eshan Yi Autonomous County in Yuxi City, Jianshui County, Kaiyuan City and Gejiu City in Honghe Hani and Yi Autonomous Prefecture, and Suijiang County in Zhaotong City. Therefore, the change in light brightness at night during the Torch Festival can be explained as resulting from the festival itself rather than from unrelated fires.
As a traditional cultural festival celebrated by ethnic minorities such as the Yi and Bai, the Torch Festival is supported by the local government and provides a good reason for other ethnic groups to travel. Ethnic minority Autonomous Prefectures that celebrate the Torch Festival, such as Yi and Bai, typically have 5–7 days off during the Torch Festival. However, except for ethnic minority Autonomous Prefectures such as Dali Bai Autonomous Prefecture, Chuxiong Yi Autonomous Prefecture, Honghe Hani, and Yi Autonomous Prefecture, other regions do not have a holiday for the Torch Festival and can only participate in the Torch Festival on weekends. Therefore, if the Torch Festival falls on the weekend in a particular year, the people in the main urban areas are likely to visit the ethnic minority areas where the Torch Festival is held, strengthening the atmosphere of the Torch Festival. Table 3 summarizes the corresponding weeks during the Torch Festival from 2018 to 2020.
Combining Figure 9, Figure 10 and Figure 11 and Table 3, we can see that whether the Torch Festival is on a weekend or not hardly affects the timing of the festival. If the Torch Festival is on a weekend, it will be livelier (there will be an increase in the total brightness change rate of the Torch Festival at night). If the 24th day in the sixth month of the LC falls on a Friday, the Torch Festival is expected to last longer (e.g., the Torch Festival in 2019). Barring external environmental circumstances (e.g., COVID-19), the Torch Festival generally lasts until Sunday.
This study excludes urban areas when studying Torch Festival to eliminate the influence of NTL daily data in urban areas and because urban areas mostly do not hold torch festivals. However, although there are fewer torch festivals in urban areas, urban residents will travel to the place where the Torch Festival is held to celebrate, reducing the night light brightness of the main city during that time. The total brightness of night lights in the main urban areas (Guandu District, Xishan District, Wuhua District, and Panlong District) of the provincial capital city (Kunming City) of Yunnan Province on the day of the Torch Festival and five days before and after the Torch Festival was calculated to obtain the change trend of night light brightness in the main urban areas of Kunming City during the Torch Festival, as shown in Figure 13.
Figure 13 shows that during the Torch Festival, the trend of night-time lighting brightness in the main urban area of Kunming City is opposite to that during the ethnic minorities’ Torch Festival, with the change curve showing a “V” trend. From the overall trend, we can determine that on the 24th day in the sixth month of the LC every year, the total brightness of NTL in the main urban area of Kunming City reaches the lowest value compared to the five days before and after; following which, the brightness rises back to the baseline value, indicating that most people in the main urban area of Kunming participate in the Torch Festival celebration on the 24th day in the sixth month of the LC every year. Furthermore, the Yi Torch Festival is not only attended by ethnic minorities such as the Yi and Bai nationalities, but also by other ethnic groups from the main urban area of Kunming. Additionally, the Torch Festival in 2019 spanned the entire weekend; therefore, it lasted the longest out of all the years studied (ending the 26th day in the sixth month of the LC). The change rate of light brightness at night from the 22nd to 26th day in the sixth month of the LC in the main urban area of Kunming City is analyzed by the following formula (Equation (6)):
CR i = T i T 0 T 0
where CR′i represents the NTL brightness change rate of Ti in the main urban area of Kunming, T0 represents the starting time, and Ti represents the NTL brightness i days from the starting time.
The approximate travel situation during the Torch Festival in the main urban area of Kunming from 2018 to 2020 can be obtained and is shown in Figure 14.
Figure 14 shows that the travel time in the main urban area of Kunming during the Torch Festival corresponds to the time when the lighting brightness of the ethnic Torch Festival increases at night, and the greater the percentage of NTL brightness reduction during the Torch Festival in the main urban area of Kunming City, the greater the percentage increase in the total amount of night-time lighting during the Torch Festival for ethnic minorities in that year. Furthermore, from the tourism situation of the main city of Kunming City in 2018 and 2019, Wuhua District accounted for the largest proportion of tourists. During the Torch Festival in 2019, most people in Xishan District and Wuhua District of Kunming City began to travel on the 23rd day in the sixth month of the LC. However, most people in Panlong District and Guandu District started to travel on the 24th day in the sixth month of the LC, and Panlong District, Kunming City accounted for the largest proportion of tourists during the Torch Festival in 2020.
Although this study extracts the regional scope data of each ethnic group and distinguishes each ethnic group, the NTL brightness of each ethnic group cannot be distinguished from the NTLRS image; the ethnic minorities in Yunnan Province are “numerous ethnically mixed.” Therefore, in areas where ethnic minorities are mixed, it is not strictly possible to distinguish which ethnic group is celebrating the Torch Festival. New methods should be found in follow-up research to solve this problem.

4.3. Significance for the Inheritance and Protection of Ethnic Minority Traditional Cultural Festivals

Traditional cultural festivals are an important manifestation of national culture [63]. Under the trend of cultural changes, traditional cultural festivals of ethnic minorities are gradually being diluted and are facing enormous challenges [64]. In this study, the sliding window is used to analyze the time series of lights at night through remote sensing and the temporal and spatial pattern of the torch festivals in ethnic minority traditional cultural festivals is studied. This is conducive to a timely understanding of the development status of ethnic minority torch festivals and can rapidly determine their “dilution,” which provides a reference for the government to formulate corresponding policies to counteract or otherwise alleviate the problem. The research method of this study is not only applicable to the Torch Festival but also to other traditional cultural festivals that can be assessed by night-time brightness. The sliding window of this study can be adjusted flexibly, allowing better detection of festivals with relatively short time periods, such as the Torch Festival. Secondly, unlike other studies that detect festivals based on night light monthly data and quarterly data (which are unable to detect festivals with short timescales and only intermittently study festivals across quarters or months), this study uses NTLRS daily data to study traditional festivals with good continuity. This method is applicable to festivals related to lights and fire worldwide. Thirdly, from the perspective of ethnicity, this study analyzed the differences in how different ethnic groups hold the same traditional festival. For example, we can use this methodology to analyze the celebration of Ramadan festivals and carnivals by people of different nationalities around the world.
Nevertheless, the use of the sliding window method and NTLRS to study traditional cultural festivals has certain limitations as they are not suitable for festivals conducted over extremely short periods of time. For example, this method cannot be used for festivals lasting only one day, which are celebrated by only a few groups, or without evident changes in NTL. Moreover, if an unusual event occurs to disrupt the festival, such as a large power outage, the accuracy of research results (including the NTL brightness value) will be affected, ultimately affecting the overall research results.

4.4. Significance of Sliding Windows to the Research of NTLRS

Sliding windows are often used for anomaly detection, hydrology, and meteorology but they are not generally used for NTLRS. This research opens up new ideas for NTLRS time series analysis and is of relevance for the entire field of remote sensing. Research using long-term series data frequently requires extensive work; the sliding window approach can simplify and reduce the dimension of data and computational complexity. Using the sliding window of the study period allows greater flexibility than afforded by long research periods of weeks, months, or years and can allow us to better investigate the periodic regularity of social phenomena. Nevertheless, there may be a loss of some details of the original data if the width of the sliding window is too large.

5. Conclusions

This study proposes a time series detection and analysis method for NTL based on sliding windows and considers the Torch Festival in Yunnan Province as an example to conduct analyses for the Yi, Bai, Naxi, Jino, Lahu, and all other ethnic minorities in 2018–2020. We performed analyses of the festival and the spatiotemporal pattern of the Torch Festival of the Yi, Bai, and all ethnic minorities from 2018 to 2020. Results showed that the Torch Festival is usually celebrated on the 24th day in the sixth month of the LC, mostly by the Yi nationality. The 2019 Torch Festival celebration was grander than those in 2018 and 2020, with the 2020 festival affected by the new COVID-19 epidemic. Despite this, some districts (particularly in remote mountainous areas) continued to celebrate the Torch Festival in 2020 due to a lack of strict implementation of government advice. Analyses showed that travel in the main urban area of Kunming City contributed greatly to the lighting of the Torch Festival (the total brightness of the lights at night on the 23rd day in the sixth month of the LC in the Wuhua District, Kunming City in 2019 decreased by nearly 20%). When the Torch Festival falls on a weekend, it continues throughout the weekend.
Overall, this study proposes a time series detection and analysis method for NTLRS based on a sliding window approach. The sliding window width can be flexibly adjusted and is also good for detecting relatively short festivals such as the Torch Festival. This method is suitable for festivals related to lights and “fire” all over the world and is also a new application of sliding windows in the field of remote sensing, which is not only conducive to the inheritance and development of minority cultures, but also for the study of ethnic cultures.
It is worth mentioning that the width of the sliding window in this study was determined according to the research object. If the research period of a social event is short, the dimensionality reduction effect on data will not be apparent. In addition, if the time series used in the study has a large span (for example, the time series is one year), the width of the sliding window will not be well-defined because many social events occur within a year and their timings are not identical; the width of the sliding window is not unique. In this case, the dynamism sliding window needs consideration as it is not fixed and this aspect should be analyzed in depth in future research.

Author Contributions

Conceptualization, L.S.; methodology, L.S., J.W. and F.Z.; validation, L.S., J.W. and Y.Z.; formal analysis, L.S., J.W. and Y.Z.; data curation, L.S., J.W., Y.Z. and F.Z.; writing—original draft preparation, L.S.; writing—review and editing, L.S., J.W., F.Z., Y.Z., S.Z., L.J., Q.D. and Y.L.; visualization, L.S.; supervision, L.S.; funding acquisition, F.Z. and X.Z. All authors have read and agreed to the published version of the manuscript.

Funding

This work was supported by the National Natural Science Foundation of China [Grant No. 41961064]; Yunnan Fundamental Research Projects [Grant No. 202001BB050030], Construction Project of Graduate Tutor Team in Yunnan Province [Grant No. C176230200].

Acknowledgments

The authors would like to thank Earth Observation Group, NASA LAADS DAAC Earth Data Center, BigeMap Downloader, China National Geographic Information Center, China Social Big Data Research Platform, and NASA Earth Observation Data for providing us with NPP-VIIRS images, VNP46A2 data, toponym, vector data, population data, and active fire data.

Conflicts of Interest

The authors declare no conflict of interest.

References

  1. Li, X.L.D. An Overview on Data Mining of Nighttime Light Remote Sensing. Acta Geod. Et Cartogr. Sin. 2015, 44, 591–601. [Google Scholar]
  2. Elvidge, C.D.; Davis, E.R.; Baugh, K.E.; Kihn, E.A. Mapping city lights with night-time data from the DMSP Operational linescan system. Photogramm. Eng. Remote Sens. 1996, 63, 727–734. [Google Scholar]
  3. Elvidge, C.D.; Baugh, K.E.; Kihn, E.A.; Kroehl, H.W.; Davis, E.R.; Davis, C.W. Relation between satellite observed visible-near infrared emissions, population, economic activity and electric power consumption. Int. J. Remote Sens. 1997, 18, 1373–1379. [Google Scholar] [CrossRef]
  4. Elvidge, C.D.; Baugh, K.E.; Dietz, J.B.; Bland, T.; Sutton, P.C.; Kroehl, H.W. Radiance Calibration of DMSP-OLS Low-Light Imaging Data of Human Settlements. Remote Sens. Environ. 1999, 68, 77–88. [Google Scholar] [CrossRef]
  5. Levin, N.; Kyba, C.C.M.; Zhang, Q.; Sánchez de Miguel, A.; Román, M.O.; Li, X.; Portnov, B.A.; Molthan, A.L.; Jechow, A.; Miller, S.D.; et al. Remote sensing of night lights: A review and an outlook for the future. Remote Sens. Environ. 2020, 237, 111443. [Google Scholar] [CrossRef]
  6. Ma, X.; Tong, X.; Liu, S.; Luo, X.; Xie, H.; Li, C. Optimized Sample Selection in SVM Classification by Combining with DMSP-OLS, Landsat NDVI and GlobeLand30 Products for Extracting Urban Built-Up Areas. Remote Sens. 2017, 9, 236. [Google Scholar] [CrossRef] [Green Version]
  7. Zhuo, L.; Ichinose, T.; Zheng, J.; Chen, J.; Shi, P.J.; Li, X. Modelling the population density of China at the pixel level based on DMSP/OLS non-radiance-calibrated night-time light images. Int. J. Remote Sens. 2009, 30, 1003–1018. [Google Scholar] [CrossRef]
  8. Roman, M.O.; Stokes, E.C. Holidays in lights: Tracking cultural patterns in demand for energy services. Earths Future 2015, 3, 182–205. [Google Scholar] [CrossRef]
  9. Li, D.; Li, X. Applications of Night-time Light Remote Sensing in Evaluating of Socioeconomic Development. J. Macro-Qual. Res. 2015, 3, 1–8. [Google Scholar] [CrossRef]
  10. Cheng, Y.; Zhao, L.; Wan, W.; Li, L.; Yu, T.; Gu, X. Extracting urban areas in China using DMSP/OLS nighttime light data integrated with biophysical composition information. J. Geogr. Sci. 2016, 26, 325–338. [Google Scholar] [CrossRef] [Green Version]
  11. Witmer, F.D.W.; O’Loughlin, J. Detecting the Effects of Wars in the Caucasus Regions of Russia and Georgia Using Radiometrically Normalized DMSP-OLS Nighttime Lights Imagery. GISci. Remote Sens. 2011, 48, 478–500. [Google Scholar] [CrossRef]
  12. Li, X.; Li, D. Can night-time light images play a role in evaluating the Syrian Crisis? Int. J. Remote Sens. 2014, 35, 6648–6661. [Google Scholar] [CrossRef]
  13. Kyba, C.; Mohar, A.; Pintar, G.; Stare, J. A shining example of sustainable church lighting using the EcoSky LED: 96% reduction in energy consumption, and dramatic reduction of light pollution. Int. J. Sustain. Lighting 2018, 19, 132. [Google Scholar] [CrossRef] [Green Version]
  14. Meier, J.M. Temporal Profiles of Urban Lighting: Proposal for a research design and first results from three sites in Berlin. Int. J. Sustain. Lighting 2018, 20, 11–28. [Google Scholar] [CrossRef] [Green Version]
  15. Giordano, E.; Ong, C.-E. Light festivals, policy mobilities and urban tourism. Tour. Geogr. 2017, 19, 699–716. [Google Scholar] [CrossRef]
  16. Coesfeld, J.; Anderson, S.J.; Baugh, K.; Elvidge, C.D.; Schernthanner, H.; Kyba, C.C.M. Variation of Individual Location Radiance in VIIRS DNB Monthly Composite Images. Remote Sens. 2018, 10, 1964. [Google Scholar] [CrossRef] [Green Version]
  17. Zhao, M.; Zhou, Y.; Li, X.; Cao, W.; He, C.; Yu, B.; Li, X.; Elvidge, C.D.; Cheng, W.; Zhou, C. Applications of Satellite Remote Sensing of Nighttime Light Observations: Advances, Challenges, and Perspectives. Remote Sens. 2019, 11, 1971. [Google Scholar] [CrossRef] [Green Version]
  18. Stathakis, D.; Baltas, P. Seasonal population estimates based on night-time lights. Comput. Environ. Urban Syst. 2018, 68, 133–141. [Google Scholar] [CrossRef]
  19. Miller, S.D.; Turner, R.E. A Dynamic Lunar Spectral Irradiance Data Set for NPOESS/VIIRS Day/Night Band Nighttime Environmental Applications. IEEE Trans. Geosci. Remote Sens. 2009, 47, 2316–2329. [Google Scholar] [CrossRef]
  20. Levin, N. The impact of seasonal changes on observed nighttime brightness from 2014 to 2015 monthly VIIRS DNB composites. Remote Sens. Environ. 2017, 193, 150–164. [Google Scholar] [CrossRef]
  21. Zheng, Q. Nighttime Light Data Processing Methodologies and Polycentric City Monitoring. Ph.D. Thesis, Zhejiang University, Hangzhou, China, 2020. [Google Scholar]
  22. Elvidge, C.D.; Baugh, K.; Zhizhin, M.; Hsu, F.C.; Ghosh, T. VIIRS night-time lights. Int. J. Remote Sens. 2017, 38, 5860–5879. [Google Scholar] [CrossRef] [Green Version]
  23. Román, M.O.; Wang, Z.; Sun, Q.; Kalb, V.; Miller, S.D.; Molthan, A.; Schultz, L.; Bell, J.; Stokes, E.C.; Pandey, B.; et al. NASA’s Black Marble nighttime lights product suite. Remote Sens. Environ. 2018, 210, 113–143. [Google Scholar] [CrossRef]
  24. Wang, Z.; Román, M.O.; Kalb, V.L.; Miller, S.D.; Zhang, J.; Shrestha, R.M. Quantifying uncertainties in nighttime light retrievals from Suomi-NPP and NOAA-20 VIIRS Day/Night Band data. Remote Sens. Environ. 2021, 263, 112557. [Google Scholar] [CrossRef]
  25. Keogh, E.; Chu, S.; Hart, D.; Pazzani, M. An online algorithm for segmenting time series. In Proceedings of the 2001 IEEE International Conference on Data Mining, San Jose, CA, USA, 29 November–2 December 2001; pp. 289–296. [Google Scholar]
  26. Teng, T.; Maolin, S.; Xueguan, S.; Yue, M.; Xiangyu, F. Anomaly Detecting Method for Time Series Based on Sliding Windows. Instrum. Tech. Sens. 2021, 12, 112–116. [Google Scholar]
  27. Yu, Y.; Zhu, Y.; Li, S.; Wan, D. Time Series Outlier Detection Based on Sliding Window Prediction. Math. Probl. Eng. 2014, 2014, 879736. [Google Scholar] [CrossRef] [Green Version]
  28. Yan, Y.; Sheng, G.; Liu, Y.; Du, X.; Wang, H.; Jiang, X. Anomalous State Detection of Power Transformer Based on Algorithm Sliding Windows and Clustering. High Volt. Eng. 2016, 42, 4020–4025. [Google Scholar] [CrossRef]
  29. Zhang, M.; Xu, Q.; Liu, Z.; Ma, C.; Gao, P. Prediction of water quality time series based on the dynamic sliding window BP neural network model. J. Environ. Eng. Technol. 2022, 12, 809–815. [Google Scholar] [CrossRef]
  30. Tang, W.; Ma, S.; Li, C. LSTM ground temperature prediction method based on sliding window. J. Chengdu Univ. Technol. (Sci. Technol. Ed.) 2021, 48, 377–384. [Google Scholar]
  31. Liu, J.; Zhang, Z.; Qi, Y. PM2.5 concentration prediction model based on sliding window and LSTM. J. Qiqihar Univ. (Nat. Sci. Ed.) 2022, 38, 87–94. [Google Scholar]
  32. Wang, X. Origins of Torch Festival and the Problem of Higher Culture in Chinese Ethnology. J. Tsinghua Univ. (Philos. Soc. Sci.) 2012, 27, 5–16+158. [Google Scholar] [CrossRef]
  33. Xuelan, X.; Yapin, C. On Torch Festival of Yunnan Minorities from Perspective of Folk Culture. J. Honghe Univ. 2020, 18, 51–53. [Google Scholar] [CrossRef]
  34. Seiji, I.; Sun, H. Legends and Social Customs—A Study on the Story of Torch Festival. Jpn. Stud. 1993, 1993, 51–58. [Google Scholar]
  35. Li, J. A Brief Discussion on the Festival Customs and Cultural Connotation of the Torch Festival of the Yi Nationality in Chuxiong, Yunnan. Sci. Technol. Vis. 2012, 31, 158. [Google Scholar] [CrossRef]
  36. Yang, S. Torch Festival and Formation of J. Cultural Circle of Torch Festival. Soc. Sci. Yunnan 2003, 3, 75–79. [Google Scholar]
  37. Yue, X. Research on the J. Exchange J. Phenomenon of Southern Minority Festivals. J. Southwest Minzu Univ. (Humanit. Soc. Sci.) 2019, 40, 14–19. [Google Scholar]
  38. Huimin, A. Dilemma and Solution for Contemporary Inheritance of Yi People’s Torch Festival in Yunnan Province. J. South-Cent. Minzu Univ. (Humanit. Soc. Sci.) 2019, 39, 34–38. [Google Scholar]
  39. Li, C.; Peng, Z. The Ritual Nature of Yi Nationality’s J. DuzeJ.(Torch Festival) and Tourism Development. Tour. Trib. 2009, 24, 79–84. [Google Scholar]
  40. Yang, L.; Ma, P. Intangible cultural heritage protection from festival tourism, from the perspective of Yi Torch Festival. J. Hubei Minzu Univ. (Philos. Soc. Sci.) 2011, 29, 56–59. [Google Scholar] [CrossRef]
  41. Xu, X. Authenticity Protection and Tourism Development of Intangible Cultural Heritage—Taking the Torch Festival of Yi Nationality in Liangshan as an Example. J. Chin. Cult. 2015, 5, 187–190. [Google Scholar]
  42. Xiao, J.; Weng, X. A Historical Study of the Social Fuctions of the Torch Festival—A Case Study of the Torch Festival in Qiubei County. J. Yunnan Minzu Univ. (Philos. Soc. Sci. Ed.) 2008, 4, 47–49. [Google Scholar]
  43. Government, L.P.S. Basic Situation of Ethnic Minorities in Yunnan Province. Available online: http//www.dhlh.gov.cn/gtj/Web/_F0_0_046KCIXI8D3CLJKRV437RP5RSF.htm (accessed on 27 April 2022).
  44. Xu, S. New Developments of the Ethnic Minority Population in China. Popul. Res. 2021, 45, 82–87. [Google Scholar]
  45. Wang, Z.; Shrestha, R.; Rom’an, M.O. NASA’s black marble nighttime lights product suite algorithm theoretical basis document (ATBD). Remote Sens. Environ. 2021, 210, 113–143. [Google Scholar]
  46. Elvidge, C.D.; Zhizhin, M.; Baugh, K.; Hsu, F.-C. Automatic Boat Identification System for VIIRS Low Light Imaging Data. Remote Sens. 2015, 7, 3020–3036. [Google Scholar] [CrossRef] [Green Version]
  47. Jett, S.C. Place-Naming, Environment, and Perception among the Canyon de Chelly Navajo of Arizona. Prof. Geogr. 1997, 49, 481–493. [Google Scholar] [CrossRef]
  48. Everett-Heath, J. Place Names of the World—Europe; Palgrave Macmillan: London, UK, 2000; pp. XXII, 413. [Google Scholar]
  49. Zhao, F.; Song, L.; Peng, Z.; Yang, J.; Luan, G.; Chu, C.; Ding, J.; Feng, S.; Jing, Y.; Xie, Z. Night-Time Light Remote Sensing Mapping: Construction and Analysis of Ethnic Minority Development Index. Remote Sens. 2021, 13, 2129. [Google Scholar] [CrossRef]
  50. Zheng, Q.; Weng, Q.; Zhou, Y.; Dong, B. Impact of temporal compositing on nighttime light data and its applications. Remote Sens. Environ. 2022, 274, 113016. [Google Scholar] [CrossRef]
  51. Li, F.; Yan, Q.; Zou, Y.; Liu, B. Extraction Accuracy of Urban Built-up Area Based on Nighttime Light Data and POI: A Case Study of Luojia 1-01 and NPP/VIIRS Nighttime Light Images. Geomat. Inf. Sci. Wuhan Univ. 2021, 46, 825–835. [Google Scholar] [CrossRef]
  52. Zhao, F.; Ding, J.; Zhang, S.; Luan, G.; Song, L.; Peng, Z.; Du, Q.; Xie, Z. Estimating Rural Electric Power Consumption Using NPP-VIIRS Night-Time Light, Toponym and POI Data in Ethnic Minority Areas of China. Remote Sens. 2020, 12, 2836. [Google Scholar] [CrossRef]
  53. Liu, S. Study on Seasonal Changes of VIIRS Nighttime Light Based on Time-Series Analysis. Master’s Thesis, Wuhan University, Wuhan, China, 2020. [Google Scholar]
  54. Chakrabarti, K.; Ortega-binderberger, M.; Porkaew, K.; Zuo, P.; Mehrotra, S. Similar Shape Retrieval In Mars. IEEE Int. Conf. Multi-Media Expo 2000, 2, 709–712. [Google Scholar] [CrossRef]
  55. Agrawal, R.; Faloutsos, C.; Swami, A. Efficient similarity search in sequence databases. In Foundations of Data Organization and Algorithms, Proceedings of the 4th International Conference, FODO ′93, Chicago, IL, USA, 13–15 October 1993; Springer: Berlin/Heidelberg, Germany, 1993; pp. 69–84. [Google Scholar]
  56. Ratanamahatana, C.A.; Keogh, E. Three Myths about Dynamic Time Warping Data Mining. In Proceedings of the 2005 SIAM International Conference on Data Mining (SDM), Newport Beach, CA, USA, 21–23 April 2005; pp. 506–510. [Google Scholar]
  57. Li, F.; Xiao, J. How to Get Effective Slide-window Size in Time Series Similarity Search. J. Front. Comput. Sci. Technol. 2009, 3, 105–112. [Google Scholar]
  58. Cleveland, R.B.; Cleveland, W.S.; Mcrae, J.E.; Terpenning, I. STL: A Seasonal-Trend Decomposition Procedure Based on Loess. J. Off. Stat. 1990, 6, 3–73. [Google Scholar]
  59. Egrioglu, E.; Aladag, C.H.; Yolcu, U.; Basaran, M.A.; Uslu, V.R. A new hybrid approach based on SARIMA and partial high order bivariate fuzzy time series forecasting model. Expert Syst. Appl. 2009, 36, 7424–7434. [Google Scholar] [CrossRef]
  60. Young, P.C. Data-based mechanistic modelling, generalised sensitivity and dominant mode analysis. Comput. Phys. 1999, 117, 113–129. [Google Scholar] [CrossRef]
  61. Box, G.E.P.; Jenkins, G.M. Time Series Analysis Forecasting and Control; Holden-Day: San Francisco, CA, USA, 1976. [Google Scholar]
  62. Ediger, V.S.; Akar, S. ARIMA forecasting of primary energy demand by fuel in Turkey. Energy Policy 2007, 35, 1701–1708. [Google Scholar] [CrossRef]
  63. Huang, Z. Southwest Ethnic Festival Culture; Yunnan University Press: Kunming, China, 2012; p. 265. [Google Scholar]
  64. Chi, Y. The current situation and predicament of the protection and development of traditional festival culture of ethnic minorities in Yunnan. J. Yunnan Arts Univ. 2008, 3, 90–94. [Google Scholar] [CrossRef]
Figure 1. Overview map of Yunnan Province.
Remotesensing 14 05267 g001
Figure 2. Schematic technical workflow.
Remotesensing 14 05267 g002
Figure 3. Bai nationality area in 2018 (excluding urban areas).
Remotesensing 14 05267 g003
Figure 4. Working principle of the sliding window.
Remotesensing 14 05267 g004
Figure 5. Cosine similarity verification results for 2018: (a) Yi Nationality. (b) Bai Nationality. (c) Naxi Nationality. (d) Jino Nationality. (e) Lahu Nationality. (f) Ethnic Minority.
Remotesensing 14 05267 g005
Figure 6. Cosine similarity verification results for 2019: (a) Yi Nationality. (b) Bai Nationality. (c) Naxi Nationality. (d) Jino Nationality. (e) Lahu Nationality. (f) Ethnic Minority.
Remotesensing 14 05267 g006
Figure 7. Cosine similarity verification results for 2020: (a) Yi Nationality. (b) Bai Nationality. (c) Naxi Nationality. (d) Jino Nationality. (e) Lahu Nationality. (f) Ethnic Minority.
Remotesensing 14 05267 g007
Figure 8. 2019 Torch Festival field verification results.
Remotesensing 14 05267 g008
Figure 9. Spatiotemporal pattern of the light brightness change rate at night in the Torch Festival of all ethnic minorities: (a) 2018. (b) 2019. (c) 2020.
Remotesensing 14 05267 g009
Figure 10. Spatiotemporal pattern of the light brightness change rate at night in the Torch Festival of the Yi nationality: (a) 2018. (b) 2019. (c) 2020.
Remotesensing 14 05267 g010
Figure 11. Spatiotemporal pattern of the light brightness change rate at night in the Torch Festival of the Bai nationality: (a) 2018. (b) 2019. (c) 2020.
Remotesensing 14 05267 g011
Figure 12. NTL brightness increase associated with fire and the Torch Festival in Yunnan Province from 2018 to 2020: (a) 2018, (b) 2019, (c) 2020.
Remotesensing 14 05267 g012
Figure 13. Total brightness of lights at night for Torch Festival in the main urban area of Kunming.
Remotesensing 14 05267 g013
Figure 14. Change in total brightness of lights at night during the Torch Festival in the main urban area of Kunming: (a) 2018. (b) 2019. (c) 2020.
Remotesensing 14 05267 g014
Table 1. Data information and data sources.
NameDetailsSpatial
Resolution
TimeData Sources
NPP-VIIRS NTLRS DataNPP-VIIRS Cloudless DNB Composite Monthly Average Data500 m2018–2020Earth Observation Group (EOG) (https://eogdata.mines.edu/products/vnl/, access on 23 March 2022)
VNP46A2 DataBased on the second daily night light and atmospheric corrected night light (NTL) product in the VIIRS DNB dataset500 m2018 (days 186–248)
2019 (days 176–238)
2020 (days 195–257)
NASA LAADS DAAC Earth Data Center (https://ladsweb.modaps.eosdis.nasa.gov/missions-and-measurements/products/VNP46A2/, access on 26 January 2022)
Toponymic DataThe data of the second national toponym census\2019National Platform for Common Geospatial Information Service (https://www.tianditu.gov.cn/)
Census StatisticsThe sixth census data\2010China Economic and Social Big Data Research Platform (http://data.cnki.net/)
Administrative Division BoundariesVector data in Yunnan Province\2017National Geomatics Center of China (http://www.ngcc.cn/ngcc/)
Active Fire DataVIIRS I-Band 375 m Active Fire Data375 m2018–2020NASA Earth Observation Data (https://www.earthdata.nasa.gov/)
Table 2. Comparison of remote sensing time series analysis methods.
MethodAdvantagesDisadvantages
STLSuitable for the seasonally obvious time series data with missing values and outliers(1) Not conducive to detect sequence change information
(2) Not conducive to detect the change of data in short cycle time series
SARIMASuitable for time series analysis with missing values and obvious seasonalityThe non-stationary series need to be converted to stationary series before fitting
DHR(1) Suitable for time series analysis with obvious seasonal and periodic changesNot suitable for short period time series analysis
(2) The time series with missing values can be analyzed directly
ARIMASuitable for short-term forecasting of time seriesNot suitable for non-stationary time series analysis
Sliding Window(1) Can accurately detect the change of remote sensing data value in a short periodSuitable for the study of the change trend of remote sensing time series data but the accurate value of data cannot be obtained
(2) Has obvious advantages in the analysis of high frequency observation data, especially remote sensing daily data
(3) The sliding window width can be flexibly adjusted according to the research object
Table 3. Corresponding weeks during the Torch Festival from 2018 to 2020 (days in the sixth month of the LC).
Weekthe 19ththe 20ththe 21stthe 22ndthe 23rdthe 24ththe 25ththe 26ththe 27ththe 28ththe 29th
Year
2018MondayTuesdayWednesdayThursdayFridaySaturdaySundayMondayTuesdayWednesdayThursday
2019SundayMondayTuesdayWednesdayThursdayFridaySaturdaySundayMondayTuesdayWednesday
2020SaturdaySundayMondayTuesdayWednesdayThursdayFridaySaturdaySundayMondayTuesday
Publisher’s Note: MDPI stays neutral with regard to jurisdictional claims in published maps and institutional affiliations.

